Sedimentology Particle Counter Sediment Analysis
25
Mikada, H., Moore, G.F., Taira, A., Becker, K., Moore, J.C., and Klaus, A. (Eds.) Proceedings of the Ocean Drilling Program, Scientific Results Volume 190/196 8. DATA REPORT: THE RELATION BETWEEN PHYSICAL PROPERTIES AND GRAIN-SIZE V ARIATIONS IN HEMIPELAGIC SEDIMENTS FROM NANKAI T ROUGH 1 Joan F. Steurer 2 and Michael B. Underwood 2 ABSTRACT We present the results of grain-size analysis performed on hemipe- lagic sediment from Sites 1173, 1174, 1175, and 1177 at the Nankai Trough. Analyses of the <63-μm fraction were performed with a laser particle counter, and results were converted to equivalent settling diam- eters by means of an empirical regression with data from pipette analy- sis. The relations among grain size, porosity, bulk density, void ratio, and moisture content are influenced by the increasing compaction of sediment with depth as well as facies changes. Thus, departures of bulk density and porosity from normal compaction trends cannot be attrib- uted to grain size on the basis of our laboratory results. INTRODUCTION Grain-size analysis is useful for characterizing a wide variety of phys- ical properties of marine sediment. Grain size and sorting affect poros- ity and permeability (e.g., Boggs, 1995; Fetter, 2001), and they are also related to the geotechnical properties of sediment. For instance, the re- lation between void ratio and applied effective stress can be strongly in- fluenced by grain size, as are physiochemical and mechanical factors during consolidation. Clays, especially highly colloidal ones, experi- ence greater reduction in void ratio under a given increase in effective stress than do silty clays or silts (Mitchell, 1993). The presence of abun- 1 Steurer, J.F., and Underwood, M.B., 2003. Data report: The relation between physical properties and grain- size variations in hemipelagic sediments from Nankai Trough. In Mikada, H., Moore, G.F., Taira, A., Becker, K., Moore, J.C., and Klaus, A. (Eds.), Proc. ODP, Sci. Results, 190/196, 1–25 [Online]. Available from World Wide Web: <http:// www-odp.tamu.edu/publications/ 190196SR/VOLUME/CHAPTERS/ 210.PDF>. [Cited YYYY-MM-DD] 2 101 Geological Sciences, University of Missouri, Columbia MO 65211, USA. Correspondence author: [email protected] Initial receipt: 18 November 2002 Acceptance: 18 June 2003 Web publication: 11 November 2003 Ms 190SR-210
Transcript of Sedimentology Particle Counter Sediment Analysis

Mikada, H., Moore, G.F., Taira, A., Becker, K., Moore, J.C., and Klaus, A. (Eds.)Proceedings of the Ocean Drilling Program, Scientific Results Volume 190/196
8. DATA REPORT: THE RELATION BETWEEN PHYSICAL PROPERTIES AND GRAIN-SIZE VARIATIONS IN HEMIPELAGIC SEDIMENTS FROM NANKAI TROUGH1
Joan F. Steurer2 and Michael B. Underwood2
ABSTRACT
We present the results of grain-size analysis performed on hemipe-lagic sediment from Sites 1173, 1174, 1175, and 1177 at the NankaiTrough. Analyses of the <63-µm fraction were performed with a laserparticle counter, and results were converted to equivalent settling diam-eters by means of an empirical regression with data from pipette analy-sis. The relations among grain size, porosity, bulk density, void ratio,and moisture content are influenced by the increasing compaction ofsediment with depth as well as facies changes. Thus, departures of bulkdensity and porosity from normal compaction trends cannot be attrib-uted to grain size on the basis of our laboratory results.
INTRODUCTION
Grain-size analysis is useful for characterizing a wide variety of phys-ical properties of marine sediment. Grain size and sorting affect poros-ity and permeability (e.g., Boggs, 1995; Fetter, 2001), and they are alsorelated to the geotechnical properties of sediment. For instance, the re-lation between void ratio and applied effective stress can be strongly in-fluenced by grain size, as are physiochemical and mechanical factorsduring consolidation. Clays, especially highly colloidal ones, experi-ence greater reduction in void ratio under a given increase in effectivestress than do silty clays or silts (Mitchell, 1993). The presence of abun-
1Steurer, J.F., and Underwood, M.B., 2003. Data report: The relation between physical properties and grain-size variations in hemipelagic sediments from Nankai Trough. In Mikada, H., Moore, G.F., Taira, A., Becker, K., Moore, J.C., and Klaus, A. (Eds.), Proc. ODP, Sci. Results, 190/196, 1–25 [Online]. Available from World Wide Web: <http://www-odp.tamu.edu/publications/190196SR/VOLUME/CHAPTERS/210.PDF>. [Cited YYYY-MM-DD]2101 Geological Sciences, University of Missouri, Columbia MO 65211, USA. Correspondence author: [email protected]
Initial receipt: 18 November 2002Acceptance: 18 June 2003Web publication: 11 November 2003Ms 190SR-210

J.F. STEURER AND M.B. UNDERWOODDATA REPORT: PHYSICAL PROPERTIES AND GRAIN-SIZE VARIATIONS 2
dant clay can also inhibit crushing of diatoms and calcareous tests dur-ing consolidation, which contributes to the maintenance of porosity(Hein, 1991). Grain size also affects Atterberg limits, bulk density, shearstrength, permeability, and pore pressure transients in response to cy-clic loading (Hein, 1991).
Leg 190 of the Ocean Drilling Program (ODP) targeted the Nankaiconvergent margin, southwest Japan, for the purpose of understandingthe complex relations among deformation, diagenesis, and fluid flow.To this end, we clustered samples for studies of mineralogy next tothose for geotechnical and geochemical analyses. The first objective ofthis report is to summarize the grain-size data for the sample clusters sothat the results of geotechnical tests can be interpreted more effectively.A second objective is to document a method for using a laser particlecounter for performing grain-size analysis with fine-grained sediment.
GEOLOGIC CONTEXT
The Nankai Trough is an active clastic-dominated convergent marginwhere the Philippine Sea plate is being subducted beneath the Eurasianplate. Drilling during Leg 190 targeted two transects (Fig. F1). TheMuroto Transect included a reference site (Site 1173) that penetratedthe prism’s toe (Site 1174) and three sites on the landward slope (in-cluding Site 1175). Site 1177 was drilled as the reference site for theAshizuri Transect.
At Sites 1173 and 1174, we cored five major lithostratigraphic units(Figs. F2, F3) (Shipboard Scientific Party, 2001b, 2001c). The trench-wedge facies consists mainly of thick sand and silt turbidites with inter-spersed hemipelagic mud. The upper Shikoku Basin facies consistsmainly of hemipelagic mudstone and volcanic ash. The lower ShikokuBasin facies consists of hemipelagic mudstone with scattered carbonate-cemented nodules and siliceous mudstone. A volcaniclastic unit of var-iegated mudstone lies atop pillow basalt (Shipboard Scientific Party,2001b, 2001c).
We cored three units at Site 1175 (Fig. F4). The upper slope-basinfacies consists of hemipelagic mud rich in nannofossils, thin silty andsandy turbidites, and volcanic ash. The middle slope-basin facies con-sists of muddy sand, thin silty and sandy turbidites, hemipelagic mud,and volcanic ash. The strata below 300 meters below seafloor (mbsf)contain carbonate-poor hemipelagic mud, sandy and silty turbidites,and gravelly mudstone (Shipboard Scientific Party, 2001d).
The uppermost 300 m was not cored at Site 1177, and the topmostunit encountered is the upper Shikoku Basin facies. Beneath that faciesare the lower Shikoku Basin hemipelagic facies and the lower ShikokuBasin turbidite facies, where sand, silty sand, and hemipelagic mud-stone are interspersed with scattered gravel, mudstone-clast conglomer-ate, and siliceous and carbonate-cemented claystone. The lowermostsedimentary unit is the volcaniclastic-rich facies, which consists of siltyclaystone, vitric mudstone, and sandy and silty beds (Shipboard Scien-tific Party, 2001e).
32
33
34 N
1000
1000
1000
1000
1000
2000
2000
2000
2000
3000
3000
3000
3000
4000
4000
4000
4000
4000
Shikoku Island
CapeAshizuri
CapeMuroto
AshizuriTransect
ir
MurotoTransect
KinanSeamounts
11731174
808
1177
1178
11761175
582583
132°E 133° 134° 135° 136°
32°
33°
34° N
1000
1000
1000
1000
1000
2000
2000
2000
2000
3000
3000
3000
3000
4000
4000
4000
4000
4000
Shikoku Island
CapeAshizuri
CapeMuroto
AshizuriTransect
Muroto Transect
KinanSeamounts
Site 1173Site 1174808
Site 1177
Site 1178
Site 1176
Site 582Site 583
Site 1175
F1. Nankai Trough study area, p. 14.
Dep
th (
mbs
f)
Lithology
Silt Clay
Sand
0 20 40 60 80 1.6 2.0 2.4 2.8 3.2 1.4 1.8 2.2 2.6 3.00 20 40 60 80
Trench-wedgefacies
UpperShikokuBasinfacies
LowerShikokuBasinfacies
BasaltVolcaniclastic
Qua
tern
ary
Plio
cene
mid
dle
Mio
cene
late
Mio
cene
0
100
200
300
400
500
600
700
Clay(wt%)
Mean grainsize (µm)
Standard deviation(µm)
Proportions ofsand, silt, and
clay (%)
F2. Sand, silt, and clay and grain size, Site 1173, p. 15.
Qua
tern
ary
Plio
cene
m. M
ioce
nela
te M
ioce
ne
Lithology
Dep
th (
mbs
f)
Sand
Clay(wt%)
Mean grainsize (µm)
Standard deviation(µm)
Proportions ofsand, silt, and
clay (%)
0 20 40 60 80 1.6 2.0 2.4 2.8 3.2 1.4 1.8 2.2 2.6 3.00 20 40 60 80
Slope apron facies
Trench-wedgefacies
Upper ShikokuBasin facies
Lower ShikokuBasin facies
Volcaniclasticfacies
0
100
200
300
400
500
600
700
800
900
1000
1100
Silt Clay
F3. Sand, silt, and clay and grain size, Site 1174, p. 16.
Dep
th (
mbs
f)
ClaySilt
Sand
0 20 40 60 80 1.6 2.0 2.4 2.8 3.2 1.4 1.8 2.2 2.6 3.00 20 40 60 80
Clay(wt%)
Mean grainsize (µm)
Standard deviation(µm)
Lithology
Proportions ofsand, silt, and
clay (%)
Volcani-clastic-
rich facies
Lower ShikokuBasin
turbiditefacies
Upper ShikokuBasin facies
Lower ShikokuBasin
hemipelagicfacies
Basalt
late
Mio
cene
mid
dle
Mio
cene
early
Mio
cene
Plio
cene
300
400
500
600
700
800
F4. Sand, silt, and clay and grain size, Site 1175, p. 17.

J.F. STEURER AND M.B. UNDERWOODDATA REPORT: PHYSICAL PROPERTIES AND GRAIN-SIZE VARIATIONS 3
METHODS
Sample Preparation
Because the whole-round samples for geotechnical tests were takenfrom hemipelagic sediments and the muddy intervals of the turbidite-rich facies, the grain-size samples are exclusively fine grained. Sampleswere freeze-dried and weighed. They were then placed in a beaker andtreated with 3% H2O2 for a minimum of 24 hr until digestion of organicmatter had ceased. Samples were then dispersed with 250 mL of 4 g/Lsodium hexametaphosphate (Calgon) for a minimum of 24 hr and fur-ther dispersed via 10 min of exposure in an ultrasonic bath. Highly in-durated mudstones were exposed to gentle crushing and longertreatment periods with frequent stirring.
We separated the <63-µm fraction by wet sieving. Fluid volume ofthe silt and clay suspension was then brought to 500 mL with deion-ized, distilled water and vigorously agitated. For 45 of the samples, a 20-mL aliquot was extracted from a depth of 20 cm. We corrected for thepresence of Calgon in each aliquot by subtracting 0.04 g, and the resultwas multiplied by 25 in order to obtain a weight for the fine-grainedfraction without organic matter.
We then reagitated and removed a few milliliters of sediment suspen-sion with a disposable pipette. This suspension was further diluted indeionized water, and a few drops of the diluted suspension were placedin a clear glass bottle of filtered deionized water, taking care to ensurethorough mixing of the suspension throughout the process. This dilutesuspension was scanned with the laser particle counter as described be-low in order to distinguish between the abundances of clay- and silt-sized particles.
Spectrex Laser Particle Counter
Operation and Output
In order to estimate the percent clay vs. percent silt in the <63-µmfraction, we used a Spectrex PC-2000 laser particle counter (LPC). TheLPC measures the cross-sectional dimension of particles by light scatter-ing. A laser diode rotates at a constant rate, illuminating a volume ofwater in which sediment is suspended. As the beam strikes a particle,the light is scattered, and the scattered light is collected by a photo-detector. This causes an electrical pulse in the connected preamplifer,and the amplitude and width of the pulse is a function of the grain size(Spectrex Corporation, 1998). The LPC is rapid; it is possible to measurethe grain-size distribution in 30 s.
Typical output from the LPC may be seen in Table T1. The output in-cludes the number of counts per cubic centimeter that fall into eachsize bin. Sixteen bins, plus a <1- and a >17-µm bin, are included, al-though other binning options are available for analysis of coarser-grained sediment. The >17-µm bin is designated as the “overflow bin”and labeled “9999” (Table T1). Bins are 1 µm in width, and the numberin the “Size” column refers to the lower limit of the range. The Super-count software (version 6.7; Spectrex Corporation, 1998) that accompa-nies the device also automatically computes the percentages of the totalcounts, the cross-sectional area, and mass as well as the parts per mil-lion in each bin, but these calculations are based on assumptions of
T1. Supercount software output, p. 21.
J.F. STEURER AND M.B. UNDERWOODDATA REPORT: PHYSICAL PROPERTIES AND GRAIN-SIZE VARIATIONS 4
concentration, dilution, and particle density as well as shape, which theuser must input.
Supercount also calculates the mean grain size and the standard devi-ation of grain-size distribution. This calculation includes two importantassumptions. First, the lower limit of a given bin is taken as the size ofall particles in that bin. Using the midpoint of the bin is more represen-tative of the entire bin width than the lower limit (e.g., McBride, 1971).Second, the <1-µm bin is not considered in the calculations. Since thebins are 1 µm in width, these approximations may not significantly af-fect the accuracy of statistics for coarser-grained distributions. Because alarge proportion of the particles fall into the <1-µm bin, eliminatingthis bin would introduce large errors.
We calculated mean size as
where
= mean grain size,Ci = counts per cubic centimeter in the ith bin,mi = midpoint size of the ith bin,N = number of bins, andCt = total counts per cubic centimeter of sized grains.
We used only the sized grains in calculating CT because the grains inthe overflow bin (9999) are undifferentiated by size. These grains may beany size over 17 µm, which made choosing a midpoint size for this binimpossible. In practice, however, the average counts per cubic centime-ter in the overflow bin were <1%, so the associated error is small.
The standard deviation of the grain-size distribution is typically usedas a measure of sorting (e.g., Boggs, 1995). We calculated standard devi-ation, σ, by
.
We used 0.75 µm as the midpoint of the 0- to 1-µm bin because of theinability of the laser particle counter to detect particles <0.5 µm.
Development of Scanning Protocol
We developed a system for running the LPC measurements with fine-grained materials based on repeated testing of standards included withthe laser particle counter and natural samples that had been separatedby centrifuge. The procedure differs from that recommended by theSpectrex Corporation’s instruction manual (Spectrex Corporation,1998). These choices are summarized in Table T2 and briefly explainedbelow.
The method of agitation is to gently invert the bottle for 30 s at a rateof ~1 cycle every 2 s then allow 15 s of rest prior to scanning in order toeliminate air bubbles. More vigorous agitation introduces excessive air,and less vigorous agitation or a longer rest period allows the larger par-ticles to settle to the bottom prior to scanning. We found this method
xCimi
i 1=
N
∑Ct
---------------------=
x
σ = Ci mi x–( )2
i 1=
N
∑Ct
-------------------------------------
T2. Settings for the Spectrex LPC, p. 22.

J.F. STEURER AND M.B. UNDERWOODDATA REPORT: PHYSICAL PROPERTIES AND GRAIN-SIZE VARIATIONS 5
of agitation preferable to using the magnetic stirrer with which the LPCis equipped. Introducing the stirring magnet into the bottle resulted ina larger number of background counts, especially in the finer size bins.Furthermore, the particles counted are too small to settle to the bottomof the water column during the scan time of 30 s, so the use of the stir-ring device is unnecessary.
The instrument’s threshold controls the smallest particle size to becounted. The wavelength of the light (670.8 nm) limits the smallest re-solvable particle to 0.5 µm, so we placed the threshold at this level(threshold = 7). Lower thresholds result in rapid counting in the ab-sence of any particles because of the effects of light scattering (SpectrexCorporation, 1998). To avoid the effects of light interference at thisthreshold, it is necessary to shield the exposed upper half of the bottleduring scanning. The LPC is equipped with a light shield because ambi-ent light causes interference, but light filtering through the bottle topstill causes rapid counting in the <1-µm bin if a secondary shield is notin place. This problem is eliminated by inverting a cardboard box andplacing it over the bottle.
The most troublesome parameter is sediment concentration. Whenparticles interact or drift too close to one another, the LPC measuresthem as a single large particle. If the concentration is too great, thenumber of counts in the smaller size bins drops to zero and the result-ing grain-size distribution is too coarse. Furthermore, the count rate ap-pears to limit the ability of the instrument to a maximum of ~1000particles/cm3. Using a restricted range of counts per cubic centimeter istherefore critical. We compared distribution by weight yielded by pi-pette analysis to counts yielded by LPC scan and found that concentra-tions near 800 counts/cm3 had the greatest similarity. We also used acentrifuge to make three size splits, <2, 2–4, and >4–8 µm. Using thesefractions of equivalent spherical size, we scanned various concentra-tions with the LPC and calculated the percentage of counts in the ex-pected ranges. The percentage of particles being counted in theexpected range sharply decreased with concentration >750 counts/cm3
for the <2-µm fraction but sharply increased with concentration >800counts/cm3 for the 4- to 8-µm fraction. In order to balance these effects,we chose a concentration of 750–800 counts/cm3 based on similaritiesbetween LPC and both pipette and centrifuge results. With concentra-tions >900 counts/cm3, the percentage of particles <4 µm in diameterdropped to zero. We interpret this effect to be due to physical interac-tions between particles. These higher concentrations, though withinthe range recommended by the manufacturer, can therefore cause theLPC to grossly underrecord the percentage by counts of clay-sized parti-cles.
In order to evaluate the precision of the entire procedure, we ran-domly selected 24 samples for duplicate runs, wherein the agitation, ul-trasonic vibration, dilution, and scanning were repeated. Correlationbetween repeat runs is 0.84. An F-test reveals that the variances of thetwo groups of runs are the same, and a Student’s t-test demonstratesthat the means of the two groups are equal above the 95% probabilitylevel (Fig. F5). Twelve runs of the same suspension show that the stan-dard deviation of percentage of counts per cubic centimeter <4 µm =1.5% ± 2.5%.
P = -344 + 4.70 L
Per
cent
age
<4
µm (
wt%
) by
pip
ette
75 80 85 90 95
r = 0.84n = 24
Per
cent
age
<4
µm (
coun
ts/c
m3 )
, Run
2
r = 0.67n = 19
A B
70
75
80
85
90
95
75 80 85 90 95 70
Percentage <4 µm (counts/cm3) by LPC Percentage <4 µm (counts/cm3), Run 1
0
20
40
60
80
100
Regression between particle-sizing techniques
Comparison of duplicate subsamples and LPC runs
F5. LPC, p. 18.
J.F. STEURER AND M.B. UNDERWOODDATA REPORT: PHYSICAL PROPERTIES AND GRAIN-SIZE VARIATIONS 6
Correlation with Pipette Analysis
In order to standardize the Spectrex laser method to weight percentby settling methods, we correlated the LPC results with the results of pi-pette analysis. The goal of this analysis is to determine the percent byweight of clay- vs. silt-sized particles in the <63-µm fraction, with theclay-sized fraction defined as the Stokes’ spherical settling equivalent ofall particles <4 µm in diameter.
For constructing the correlation function, the <4-µm fractions of 20samples were extracted with the pipette method (e.g., Galehouse,1971). The same samples were analyzed with the LPC prior to pipetting.Linear regression between the two data sets yields an empirical functionfor converting the LPC counts to equivalent Stokes’ settling diameter(Fig. F5). The correlation coefficient for the two data sets is 0.67, whichis significant at the 95% confidence interval. The function is
P = –344 + 4.70L,
where
P = weight percent of <4-µm particles by the pipette method andL = percent of total counts per cubic centimeter of particles <4 µm
by the LPC method.
Our comparison shows that the fraction of counts per cubic centime-ter by LPC using our method overestimates the weight fraction of clay ascompared to spherical settling equivalents.
A second comparison focused on the <2-µm Stokes’ size fraction forthe purpose of estimating the absolute abundance of various clays ex-amined by X-ray diffraction analysis. However, regression between thepercent of particles <2 µm by counts and the weight percent of particles<2 µm by the pipette method was insignificant at the 95% confidenceinterval (r = 0.44). The lower correlation coefficient is most likely due tothe inability of the LPC to resolve particles <0.5 µm in diameter. Fur-thermore, very small particles are affected by Brownian movement ofmolecules in the fluid, so Stokes’ Law becomes invalid for particles <0.5µm in size (Galehouse, 1971). Particles in the size range below the reso-lution of the LPC may constitute a significant portion of the sediment;pipette analysis on two randomly selected samples suggests that the<0.5-µm fraction may be ~20% by weight of the fine fraction and 65%of the <2-µm fraction for some samples.
Previous Tests of Laser Counters
Previous studies have demonstrated that when compared to othermethods, laser diffraction size analysis is generally accurate, especiallywhen compared to methods based on the measurement of size ratherthan Stokes’ settling. For example, Hall (1988) found no significant dif-ferences between results from the Spectrex LPC and the Coultercounter. Similarly, in comparing laser particle counters manufacturedby Coulter and Malvern to the Coulter counter TA1, Loizeau et al.(1994) found that results from the laser devices are in good agreementwith those of the Coulter counter. However, laser counter results areless similar to settling methods, especially when substantial amounts ofclay-sized particles are present. Hall (1988) found that grain-size distri-bution results by the Spectrex LPC showed a shift toward coarser grains

J.F. STEURER AND M.B. UNDERWOODDATA REPORT: PHYSICAL PROPERTIES AND GRAIN-SIZE VARIATIONS 7
relative to pipette results. Damm (1990) similarly demonstrated a shiftof particle size distributions toward coarser grains using the Malvern la-ser counter relative to results from pipette and Sedigraph techniques,both of which are settling methods.
The agreement between laser particle counter results and those ofsettling methods decreases when substantial amounts of clay-sized par-ticles are present (Loizeau et al., 1994; Singer, 1988). One reason for dif-ferences in the results is a fundamental difference in the dimensionmeasured by laser particle counters and that measured by settling anal-ysis. Whereas the laser particle counter measures the cross-sectional sur-face of the particles, settling methods measure the weight percent ofspherical settling equivalent sizes. Both methods are affected in differ-ent ways by particle shape. With a platy particle, the orientation of theparticle at the time of measurement affects the LPC results. Nonspheric-ity as well as particle density also affects settling rates during pipette orsimilar analyses. Damm (1990) concluded that since platy particles donot conform to ideal spherical settling behavior, the laser particle re-sults are more representative of the true grain-size distribution whenplaty particles are present.
A second reason for decreased agreement between laser particle siz-ing and settling velocity methods is the lower limit of size resolution ofthe laser counter (Loizeau et al., 1994; Singer et al., 1988). The laser de-vice simply does not detect particles below the resolution limit. The pi-pette technique is also unreliable for measuring the weight percent ofparticles <0.5 µm in diameter, but rather than eliminating the particlesfrom analysis as does the laser particle analyzer, the unresolvable frac-tion is incorporated into the smallest fraction extracted (Galehouse,1971).
Konert and Vandenberghe (1997) compared the laser particle sizingtechnique to the pipette technique and showed that the <2-µm grainsize as defined by the pipette method corresponds most closely to thefraction of particles <8 µm in dimension by counts as defined by the la-ser sizing technique. Using this larger fraction as the clay fractionwould allow comparisons between the two techniques. Their scanningelectron microscopy examination of <2-µm equivalent settling diame-ter particles revealed that these particles are up to 10 µm in the long di-mension for platy clay mineral grains but with a thickness of <1 µm.They demonstrated mathematically that grains of these dimensionswere the volume equivalent of <2-µm spheres, and their empirical re-sults are in good agreement with this theory.
Singer et al. (1988) cited physical interactions between clay particlesas a reason for underreporting of the abundance of <4-µm particles bythe Malvern laser counter relative to particle-settling techniques. Whentwo particles drift too near one another, the laser particle counterrecords them as a single large particle, leading to the underreporting ofthe percentage of counts of finer particles and overreporting of coarserparticles. Our technique for fine-grained materials, in contrast to someprevious studies, overpredicts the proportion of clay-sized particles rela-tive to pipette analysis. Our strict control on the number of counts percubic centimeter, in order to avoid physical particle interactions as de-scribed previously, is likely the cause of this contrast.
Moisture and Density
Shipboard data include porosity measurements by the moisture anddensity techniques (Blum, 1997). Most of the samples for grain-size

J.F. STEURER AND M.B. UNDERWOODDATA REPORT: PHYSICAL PROPERTIES AND GRAIN-SIZE VARIATIONS 8
analysis are within 20 cm of physical property samples. We used the po-rosity, bulk density, void ratio, and water content of the nearest sampleto explore the relation between those properties and grain size.
RESULTS
Grain Size
Table T3 shows the percentage of sand-, silt-, and clay-sized particlesby weight (equivalent setting diameter) for the four sites studied.Where measured, the percentage of organic matter by weight is alsoshown. Typical total losses through digestion by H2O2 were ~2% byweight, although this amount also includes any small losses during thesieving process. In cases in which the loss through digestion was notmeasured, the nonsand portion of the sediment is assumed to be 100%minus the percent by weight of sand. Table T3 also shows the percent-age of counts per cubic centimeter <4 µm, as measured by the LPC, aswell as the mean particle size and standard deviation of distribution cal-culated from the LPC results. Figures F2, F3, and F4 show the variationsof grain-size classes with depth for Sites 1173, 1174, and 1177, respec-tively.
Figures F2, F3, and F4 also show the percentage of clay by weight asdetermined by the empirical correlation of LPC measurements to pi-pette analysis and mean grain size and sorting. We correlated each ofthese parameters to moisture and density properties for each site, andrepresentative plots of these regressions may be seen in Figure F6. Be-cause of the low weight percentages of sand and organic matter, thepercentage of silt is approximately equal to 100% minus the percentageof clay and is therefore not displayed in the illustrations.
Site 1173
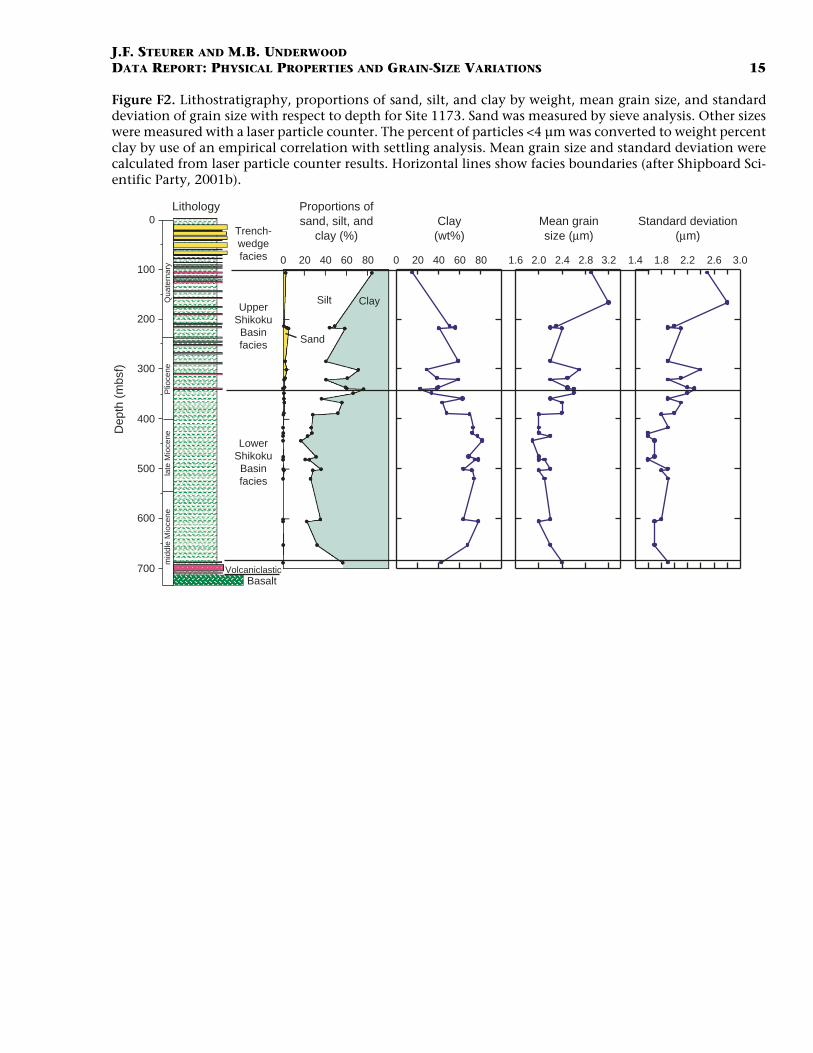
Grain-size data were collected from the upper and lower Shikoku Ba-sin facies at this site, with a single datum for the volcaniclastic facies. Asexpected for hemipelagic sediments, the proportion of sand is low, aver-aging 2% by weight in the upper Shikoku Basin facies and <1% in thelower Shikoku Basin facies. Mudstones from the lower Shikoku Basin fa-cies contain more clay-sized particles than mud from the upper ShikokuBasin facies, ranging from 30% to 80% by weight. Except for two verylow values, the average percentage of clay by weight for the upperShikoku Basin facies is 41%, and for the lower Shikoku Basin facies it is64%. This increase in the abundance of clay-sized particles coincideswith an increase in total clay minerals at the boundary between the up-per and lower Shikoku Basin facies (Shipboard Scientific Party, 2001b).
The average mean particle size as calculated from LPC for samplesfrom the upper Shikoku Basin facies is 2.6 µm and 2.2 µm for samplesfrom the lower Shikoku Basin facies. The average standard deviation ofparticle size for samples from the upper Shikoku Basin facies is 2.2 µmand 1.8 µm for the lower Shikoku Basin facies.
Site 1174
Grain-size data were collected from the hemipelagic sediments of thetrench-wedge, upper, and lower Shikoku Basin facies at Site 1174. Therelative proportion of sand is low. The trench-wedge samples have an
T3. Grain size results, p. 23.
R = 0.58 R = 0.15
R = 0.55
R = 0.16
R = 0.48
R = 0.29
R = 0.58
R = 0.56
R = 0.55
R = 0.54R = 0.22
R = 0.57
0 20 40 60 80 100 0 20 40 60 80 1000 20 40 60 80 100
Clay (wt%) Clay (wt%)Clay (wt%)
12
16
20
24
28
32
36
40
44
0.4
0.8
1.2
1.6
2.0
30
40
50
60
70
1.5
1.6
1.7
1.8
2.1
2.2
2.3
1.9
2.0
Bul
k de
nsity
(g/
cm3 )
Por
osity
(%
)V
oid
ratio
Wat
er c
onte
nt (
wt%
)
Site 1174 Site 1177Site 1173
F6. Bulk density, porosity, void ra-tio, and water content, p. 19.

J.F. STEURER AND M.B. UNDERWOODDATA REPORT: PHYSICAL PROPERTIES AND GRAIN-SIZE VARIATIONS 9
average of 1% of sand by weight, the upper Shikoku Basin facies showsan average of 2%, and the lower Shikoku Basin facies contains an aver-age of 1%. The increase of clay-sized particles with depth is more subtleat Site 1174 than at Site 1173 but nonetheless present. Clay increasesfrom ~50% at the top of the trench-wedge facies to ~65%–70% at 850mbsf. Below this depth, the percent clay remains at ~60% to the base ofthe unit. This increase in clay-sized particles coincides with an increaseof total clay minerals (Shipboard Scientific Party, 2001c). The averagepercent clay by weight for the trench-wedge facies is 44%, for the upperShikoku Basin facies it is 56%, and for the lower Shikoku Basin facies itis 65%.
The average mean particle size is 2.4 µm for the trench-wedge facies,2.3 µm for the upper Shikoku Basin facies, and 2.2 µm for the lowerShikoku Basin facies. The average standard deviation is equal to 2.1 µmfor samples from the trench wedge, 2.0 µm for samples from the upperShikoku Basin facies, and 1.7 µm for samples from the lower ShikokuBasin facies.
Site 1175
The four samples of sediment from Site 1175 are generally richer insand than those from the other sites, ranging from 2% to 8%. Siltranges from 32% to 55%, and clay ranges from 38% to 64%. The meansize of the <63-µm fraction is 2.3 µm, and the average standard devia-tion for these samples is 2.0 µm.
Site 1177
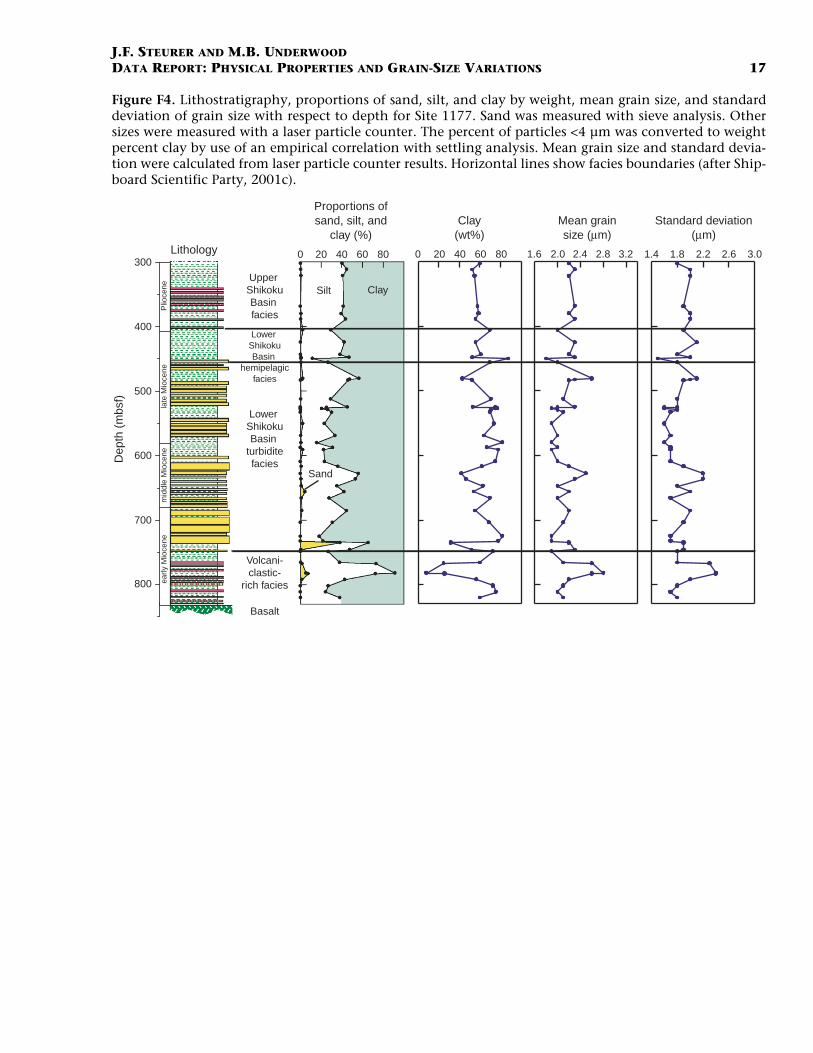
We collected grain-size data from the hemipelagic sediments of allunits at this site. The upper Shikoku Basin facies has average propor-tions of <1%, 42%, and 57% for sand, silt, and clay-sized particles byweight, respectively. The lower Shikoku Basin hemipelagic facies con-tains averages of 1% sand-, 39% silt-, and 59% clay-sized particles, al-though only four samples from this unit were analyzed. Mud from thelower Shikoku Basin turbidite facies contains an average of 1% sand,34% silt, and 63% clay, exclusive of one anomalously sandy samplethat came from a turbidite. The volcaniclastic-rich facies contains aver-ages of 2% sand-, 47% silt-, and 51% clay-sized particles, although thedata are scattered with the percent clay ranging from 10% to 75%.
The average mean grain size for the upper Shikoku Basin facies is 2.3µm, 2.2 µm for the lower Shikoku Basin hemipelagic facies, 2.1 µm forthe lower Shikoku Basin turbidite facies, and 2.3 µm for thevolcaniclastic-rich facies. The average standard deviations are 1.9 µmfor the upper Shikoku Basin facies, 2.0 µm for the lower Shikoku Basinhemipelagic facies, 1.8 µm for the lower Shikoku Basin turbidite facies,and 2.0 µm for the volcaniclastic-rich facies.
Moisture and Density
As may be seen in Figure F6, bulk density seems to increase withweight percent clay. Porosity, void ratio, and water content decreasewith weight percent clay. Nearly identical trends are also seen withmean grain size and standard deviation. The correlations between phys-ical properties and grain-size distribution are stronger for samples fromSites 1173 and 1174 than for those from Site 1177. For Site 1173, corre-lation coefficients between weight percent clay, mean grain size, or

J.F. STEURER AND M.B. UNDERWOODDATA REPORT: PHYSICAL PROPERTIES AND GRAIN-SIZE VARIATIONS 10
standard deviation and porosity, bulk density, void ratio, or water con-tent range from 0.53 to 0.58. For Site 1174, correlation coefficientsrange from 0.48 to 0.58. For Site 1177, correlation coefficients rangefrom 0.15 to 0.36.
Results from analyses of variance demonstrate that all correlationsbetween all three grain-size measures and properties for Sites 1173 and1174 are statistically significant above the 95% confidence interval. ForSite 1177, only correlations between average grain size and standard de-viation with the properties of bulk density and water content, as well aspercent clay with bulk density, were significant at the 95% confidenceinterval.
DISCUSSION
Our results for grain sizes and clay abundances are comparable tothose of other workers studying hemipelagic sediment. Diemer and For-sythe (1995), using both the Spectrex laser particle counter and a rapidsediment analyzer, found that silty clays from the inner trench slope ofthe Chile margin have an average size of ~2.0–2.4 µm. Cavin et al.(2000), using a Sedigraph, found that hemipelagic mud from the Casca-dia Basin typically contains 60%–85% clay and the mean size rangesfrom 1 to 4 µm.
Grain-size variations in sediment from the Muroto Transect showsubtle trends with depth, and these trends are at in part a function ofthe original depositional environment. The lower Shikoku Basin faciescontains no turbidites, so grain sizes tend to be smaller and bettersorted. Precipitation of authigenic clay may also contribute to the de-creased particle sizes with depth because of the dissolution of dissemi-nated volcanic ash as it alters to clay. At Site 1177, the relations of meangrain size and sorting with lithologic unit are less clear. The upperShikoku Basin samples from this site show a higher average mean grainsize than either the lower Shikoku Basin hemipelagic or turbidite facies,and the sorting in terms of standard deviation is similar in both the up-per and lower units. For samples from Site 1177, the weight percentageof clay only shows a slight difference between the upper and lowerShikoku Basin units, with the upper Shikoku Basin facies samples con-taining only 5% less clay by weight than the lower Shikoku Basin units.It is difficult to resolve any differences between the lower Shikoku Basinhemipelagic and turbidite facies because of the small number of sam-ples analyzed.
Changes in moisture content and bulk density also show depth-related trends. At the Muroto Transect, sediment follows a complicatedcompaction trend with depth. The upper Shikoku Basin facies, for ex-ample, shows nearly constant porosity with depth. This anomalousporosity-depth relation is also seen in the upper Shikoku Basin facies atSite 1177 (Shipboard Scientific Party, 2001a, 2001b, 2001c). The com-paction trend with depth is also irregular at Site 1177, but porosity gen-erally decreases with depth (Shipboard Scientific Party, 2001c). Relatedtrends are also noted in bulk density, which generally increases withdepth (Shipboard Scientific Party, 2001b, 2001c, 2001e).
Figure F7 shows the relation of weight percent clay with porosity forSites 1173, 1174, and 1177, and the lithologic units are highlighted ineach plot. It is clear that the decrease in porosity coincides with increas-ing depth. A similar depth dependency occurs for bulk density, void ra-tio, and water content. The correlations between grain size and physical
Trench wedge (0-483 mbsf)Upper Shikoku Basin (483-661 mbsf)Lower Shikoku Basin (661-1102 mbsf)
Upper Shikoku Basin (102-344 mbsf)Lower Shikoku Basin (344-688 mbsf)
0 20 40 60 80 100
Site 1177
Clay (wt%)
Upper Shikoku Basin (300-402 mbsf)Lower Shikoku Basin hemipelagic (402-449 mbsf)Lower Shikoku Basin turbidite(449-748 mbsf)
20
30
40
50
60
70
0 20 40 60 8020
30
40
50
60
70
0 20 40 60 80 100100
Clay (wt%) Clay (wt%)
Site 1173 Site 1174
Por
osity
(%
)
20
30
40
50
60
70
Por
osity
(%
)P
oros
ity (
%)
F7. Porosity vs. clay, p. 20.

J.F. STEURER AND M.B. UNDERWOODDATA REPORT: PHYSICAL PROPERTIES AND GRAIN-SIZE VARIATIONS 11
properties (Fig. F6), therefore, are largely the result of the combined ef-fects of downward-fining stratigraphy and increasing sediment compac-tion with depth.
SUMMARY
This report presents a summary of grain-size data for samples ofhemipelagic sediment from Sites 1173, 1174, 1175, and 1177. Thesedata consist of the weight percents of sand, silt, and clay, mean grainsize, and standard. We also show the values of porosity, bulk density,void ratio, and water content as measured shipboard for nearby sampleintervals. These data provide useful information for physical propertiesand geotechnical experiments, especially those which will attempt toexamine the lithologic controls on the mechanical properties or fluid-sediment interactions.
At Sites 1173 and 1174, bulk density appears to increase with weightpercent clay, whereas porosity, void ratio, and water content appear todecrease with weight percent clay. These relations, however, arestrongly influenced by a combination of facies changes and increasingcompaction with depth. Thus, the true effect of grain size as a primarycontrol on physical properties has been masked by spatial and temporalvariations in compaction. Correlations between grain-size parametersand index properties are even weaker at Site 1177. This may be due todifferences in compaction within the heterogeneous lithologies of thelower Shikoku Basin turbidite facies.
New laboratory procedures have been developed for using the Spec-trex laser particle counter with fine-grained sediment. We used an em-pirical correlation with pipette analysis to convert laser particle counterresults to weight percent of spherical equivalent settling.
ACKNOWLEDGMENTS
We thank Captain Tom Ribbens, the crew, technicians, and fellowscientists aboard JOIDES Resolution for their dedicated assistance duringODP Leg 190. We also thank an anonymous reviewer for his helpfulsuggestions. Ron Sammons and Eric Grabowski assisted in the labora-tory. This research used samples provided by the Ocean Drilling Pro-gram, which is sponsored by the U.S. National Science Foundation andparticipating countries under management of Joint Oceanographic In-stitutions, Inc. Funding was provided by a Schlanger Ocean Drilling Fel-lowship to J. Steurer and the U.S. Science Support Program (grantF001281 to M. Underwood).

J.F. STEURER AND M.B. UNDERWOODDATA REPORT: PHYSICAL PROPERTIES AND GRAIN-SIZE VARIATIONS 12
REFERENCES
Blum, P., 1997. Physical properties handbook: a guide to the shipboard measurementof physical properties of deep-sea cores. ODP Tech. Note, 26 [Online]. Availablefrom World Wide Web: <http://www-odp.tamu.edu/publications/tnotes/tn26/INDEX.HTM>. [Cited 2002-05-15]
Boggs, S., 1995. Principles of Sedimentology and Stratigraphy (2nd ed.): Upper SaddleRiver, NJ (Prentice-Hall, Inc.).
Cavin, A. Underwood, M.B., Fisher, A.T., and Johnston, K.A., 2000. Relations betweentextural characteristics and physical properties of sediments in northwestern Cas-cadia Basin. In Fisher, A.T., Davis, E.E., and Escutia, C. (Eds.), Proc. ODP, Sci. Results,168: College Station, TX (Ocean Drilling Program), 67–84.
Damm, E., 1990. Laser diffraction: a new method for grain size analysis of sediments.Z. Geol. Wiss., 18:249–253.
Diemer, J.A., and Forsythe, R., 1995. Grain-size variations within slope junction faciesrecovered from the Chile margin triple junction. In Lewis, S.D., Behrmann, J.H.,Musgrave, R.J., and Cande, S.C. (Eds.), Proc. ODP, Sci. Results, 141: College Station,TX (Ocean Drilling Program), 79–94.
Fetter, C.W., 2001. Applied Hydrogeology (4th ed.): Upper Saddle River, NJ (Prentice-Hall, Inc.).
Galehouse, J.S., 1971. Sedimentation analysis. In Carver, R.E. (Ed.), Procedures in Sedi-mentary Petrology: New York (Wiley), 69–94.
Hall, M.J., 1988. Comparison of Spectrex laser particle counter with Coulter counterand pipette sizing methods. Geol. Soc. Am. Bull., 20:24. (Abstract)
Hamilton, E.L., 1976. Variations of density and porosity with depth in deep-sea sedi-ments. J. Sediment. Petrol., 46:280–300.
Hein, F.J., 1991. The need for grain size analyses in marine geotechnical studies. InSyvitski, J.P.M. (Ed.), Principles, Methods, and Application of Particle Size Analysis:New York (Cambridge Univ. Press), 346–362.
Konert, M., and Vandenberghe, J., 1997. Comparison of laser grain size analysis withpipette and sieve analysis: a solution for the underestimation of the clay fraction.Sedimentology, 44:523–535.
Loizeau, J.L., Arbouille, D., Santiago, S., and Vernet, J.P., 1994. Evaluation of widerange laser diffraction grain size analyser for use with sediments. Sedimentology,41:353–361.
McBride, E.F., 1971. Mathematical treatment of size distribution data. In Carver, R.E.(Ed.), Procedures in Sedimentary Petrology: New York (Wiley).
Mitchell, J.K., 1993. Fundamentals of Soil Behavior (2nd ed.): New York (Wiley).Shipboard Scientific Party, 2001a. Leg 190 summary. In Moore, G.F., Taira, A., Klaus,
A., et al., Proc. ODP, Init. Repts., 190: College Station TX (Ocean Drilling Program),1–87.
————, 2001b. Site 1173. In Moore, G.F., Taira, A., Klaus, A., et al., Proc. ODP, Init.Repts., 190, 1–147 [CD-ROM]. Available from: Ocean Drilling Program, Texas A&MUniversity, College Station TX 77845-9547, USA.
————, 2001c. Site 1174. In Moore, G., Taira, A., Klaus, A., et al., Proc. ODP, Init.Repts., 190, 1–149 [CD-ROM]. Available from: Ocean Drilling Program, Texas A&MUniversity, College Station TX 77845-9547, USA.
————, 2001d. Site 1175. In Moore, G.F., Taira, A., Klaus, A., et al., Proc. ODP, Init.Repts., 190, 1–92 [CD-ROM]. Available from: Ocean Drilling Program, Texas A&MUniversity, College Station TX 77845-9547, USA.
————, 2001e. Site 1177. In Moore, G.F., Taira, A., Klaus, A., et al., Proc. ODP, Init.Repts., 190, 1–91 [CD-ROM]. Available from: Ocean Drilling Program, Texas A&MUniversity, College Station TX 77845-9547, USA.

J.F. STEURER AND M.B. UNDERWOODDATA REPORT: PHYSICAL PROPERTIES AND GRAIN-SIZE VARIATIONS 13
Singer, J.K., Anderson, J.B., Ledbetter, M.T., McCave, I.N., Jones, K.P.N., and Wright,R., 1988. An assessment of analytical techniques for the size analysis of fine-grained sediments. J. Sediment. Petrol., 58:534–543
Spectrex Corporation, 1998. Instruction Manual for Spectrex Laser Particle Counter ModelPC-2000. Available from: Spectrex Corporation, 3580 Haven Avenue, RedwoodCity CA 94063, USA.
J.F. STEURER AND M.B. UNDERWOODDATA REPORT: PHYSICAL PROPERTIES AND GRAIN-SIZE VARIATIONS 14
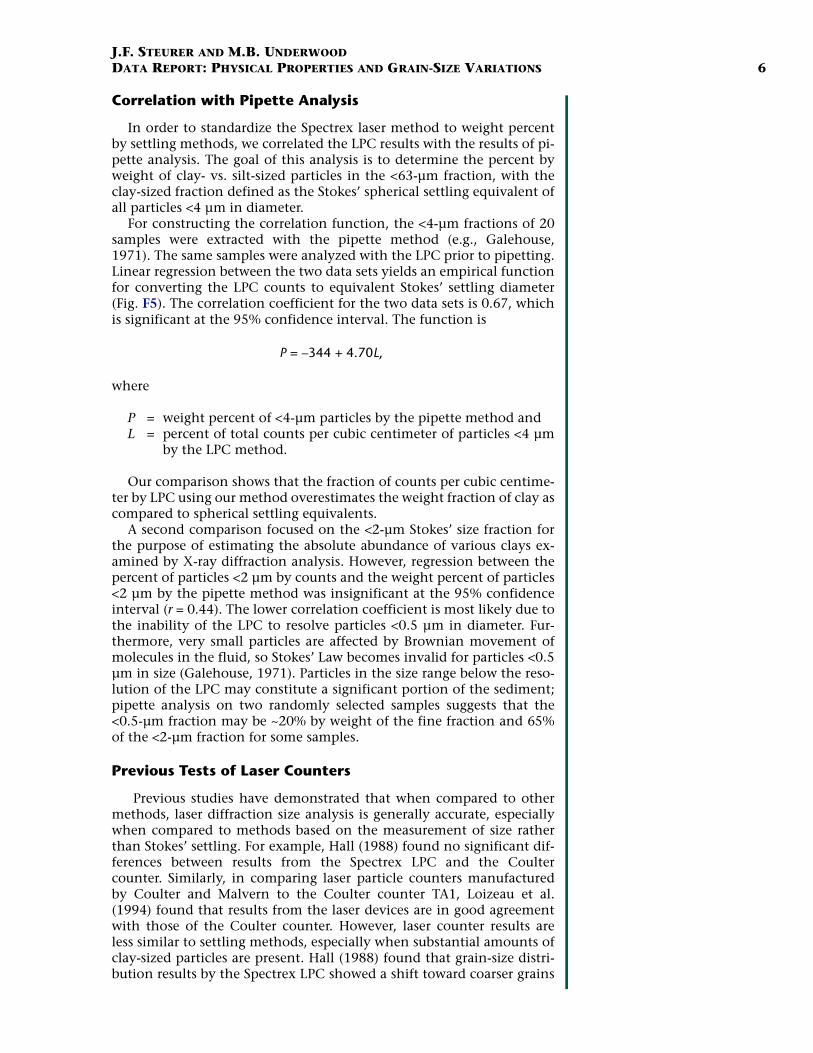
Figure F1. Map of Nankai Trough study area showing ODP and DSDP sites. Grain-size data are for Sites1173, 1174, and 1175 on the Muroto Transect and Site 1177 on the Ashizuri Transect (after Shipboard Sci-entific Party, 2001a).
32
33
34 N
1000
1000
1000
1000
1000
2000
2000
2000
2000
3000
3000
3000
3000
4000
4000
4000
4000
4000
Shikoku Island
CapeAshizuri
CapeMuroto
AshizuriTransect
ir
MurotoTransect
KinanSeamounts
11731174
808
1177
1178
11761175
582583
132°E 133° 134° 135° 136°
32°
33°
34° N
1000
1000
1000
1000
1000
2000
2000
2000
2000
3000
3000
3000
3000
4000
4000
4000
4000
4000
Shikoku Island
CapeAshizuri
CapeMuroto
AshizuriTransect
Muroto Transect
KinanSeamounts
Site 1173Site 1174808
Site 1177
Site 1178
Site 1176
Site 582Site 583
Site 1175
J.F. STEURER AND M.B. UNDERWOODDATA REPORT: PHYSICAL PROPERTIES AND GRAIN-SIZE VARIATIONS 15
Figure F2. Lithostratigraphy, proportions of sand, silt, and clay by weight, mean grain size, and standarddeviation of grain size with respect to depth for Site 1173. Sand was measured by sieve analysis. Other sizeswere measured with a laser particle counter. The percent of particles <4 µm was converted to weight percentclay by use of an empirical correlation with settling analysis. Mean grain size and standard deviation werecalculated from laser particle counter results. Horizontal lines show facies boundaries (after Shipboard Sci-entific Party, 2001b).
Dep
th (
mbs
f)
Lithology
Silt Clay
Sand
0 20 40 60 80 1.6 2.0 2.4 2.8 3.2 1.4 1.8 2.2 2.6 3.00 20 40 60 80
Trench-wedgefacies
UpperShikokuBasinfacies
LowerShikokuBasinfacies
BasaltVolcaniclastic
Qua
tern
ary
Plio
cene
mid
dle
Mio
cene
late
Mio
cene
0
100
200
300
400
500
600
700
Clay(wt%)
Mean grainsize (µm)
Standard deviation(µm)
Proportions ofsand, silt, and
clay (%)

J.F. STEURER AND M.B. UNDERWOODDATA REPORT: PHYSICAL PROPERTIES AND GRAIN-SIZE VARIATIONS 16
Figure F3. Lithostratigraphy, proportions of sand, silt, and clay by weight, mean grain size, and standarddeviation of grain size with respect to depth for Site 1174. Sand was measured by sieve analysis. Other sizeswere measured with a laser particle counter. The percent of particles <4 µm was converted to weight percentclay by use of an empirical correlation with settling analysis. Mean grain size and standard deviation werecalculated from laser particle counter results. Horizontal lines show facies boundaries (after Shipboard Sci-entific Party, 2001c).
Qua
tern
ary
Plio
cene
m. M
ioce
nela
te M
ioce
ne
Lithology
Dep
th (
mbs
f)
Sand
Clay(wt%)
Mean grainsize (µm)
Standard deviation(µm)
Proportions ofsand, silt, and
clay (%)
0 20 40 60 80 1.6 2.0 2.4 2.8 3.2 1.4 1.8 2.2 2.6 3.00 20 40 60 80
Slope apron facies
Trench-wedgefacies
Upper ShikokuBasin facies
Lower ShikokuBasin facies
Volcaniclasticfacies
0
100
200
300
400
500
600
700
800
900
1000
1100
Silt Clay
J.F. STEURER AND M.B. UNDERWOODDATA REPORT: PHYSICAL PROPERTIES AND GRAIN-SIZE VARIATIONS 17
Figure F4. Lithostratigraphy, proportions of sand, silt, and clay by weight, mean grain size, and standarddeviation of grain size with respect to depth for Site 1177. Sand was measured with sieve analysis. Othersizes were measured with a laser particle counter. The percent of particles <4 µm was converted to weightpercent clay by use of an empirical correlation with settling analysis. Mean grain size and standard devia-tion were calculated from laser particle counter results. Horizontal lines show facies boundaries (after Ship-board Scientific Party, 2001c).
Dep
th (
mbs
f)
ClaySilt
Sand
0 20 40 60 80 1.6 2.0 2.4 2.8 3.2 1.4 1.8 2.2 2.6 3.00 20 40 60 80
Clay(wt%)
Mean grainsize (µm)
Standard deviation(µm)
Lithology
Proportions ofsand, silt, and
clay (%)
Volcani-clastic-
rich facies
Lower ShikokuBasin
turbiditefacies
Upper ShikokuBasin facies
Lower ShikokuBasin
hemipelagicfacies
Basalt
late
Mio
cene
mid
dle
Mio
cene
early
Mio
cene
Plio
cene
300
400
500
600
700
800

J.F. STEURER AND M.B. UNDERWOODDATA REPORT: PHYSICAL PROPERTIES AND GRAIN-SIZE VARIATIONS 18
Figure F5. A. Linear regression between percent clay-sized particles as measured by laser particle counter(LPC) and weight percent clay-sized particles as measured by the pipette technique. B. Comparison of re-peated runs with the LPC on duplicate subsamples.
P = -344 + 4.70 L
Per
cent
age
<4
µm (
wt%
) by
pip
ette
75 80 85 90 95
r = 0.84n = 24
Per
cent
age
<4
µm (
coun
ts/c
m3 )
, Run
2
r = 0.67n = 19
A B
70
75
80
85
90
95
75 80 85 90 95 70
Percentage <4 µm (counts/cm3) by LPC Percentage <4 µm (counts/cm3), Run 1
0
20
40
60
80
100
Regression between particle-sizing techniques
Comparison of duplicate subsamples and LPC runs

J.F. STEURER AND M.B. UNDERWOODDATA REPORT: PHYSICAL PROPERTIES AND GRAIN-SIZE VARIATIONS 19
Figure F6. Linear regression of bulk density, porosity, void ratio, and water content with weight percentclay for Sites 1173, 1174, and 1177. The vertical scale is the same across each row, and the horizontal scaleis the same for each plot.
R = 0.58 R = 0.15
R = 0.55
R = 0.16
R = 0.48
R = 0.29
R = 0.58
R = 0.56
R = 0.55
R = 0.54R = 0.22
R = 0.57
0 20 40 60 80 100 0 20 40 60 80 1000 20 40 60 80 100
Clay (wt%) Clay (wt%)Clay (wt%)
12
16
20
24
28
32
36
40
44
0.4
0.8
1.2
1.6
2.0
30
40
50
60
70
1.5
1.6
1.7
1.8
2.1
2.2
2.3
1.9
2.0
Bul
k de
nsity
(g/
cm3 )
Por
osity
(%
)V
oid
ratio
Wat
er c
onte
nt (
wt%
)
Site 1174 Site 1177Site 1173

J.F. STEURER AND M.B. UNDERWOODDATA REPORT: PHYSICAL PROPERTIES AND GRAIN-SIZE VARIATIONS 20
Figure F7. Porosity vs. weight percent clay for Sites 1173, 1174, and 1177. Circles = upper Shikoku Basinfacies, squares = lower Shikoku Basin facies. Other facies associations are as shown.
Trench wedge (0-483 mbsf)Upper Shikoku Basin (483-661 mbsf)Lower Shikoku Basin (661-1102 mbsf)
Upper Shikoku Basin (102-344 mbsf)Lower Shikoku Basin (344-688 mbsf)
0 20 40 60 80 100
Site 1177
Clay (wt%)
Upper Shikoku Basin (300-402 mbsf)Lower Shikoku Basin hemipelagic (402-449 mbsf)Lower Shikoku Basin turbidite(449-748 mbsf)
20
30
40
50
60
70
0 20 40 60 8020
30
40
50
60
70
0 20 40 60 80 100100
Clay (wt%) Clay (wt%)
Site 1173 Site 1174
Por
osity
(%
)
20
30
40
50
60
70
Por
osity
(%
)P
oros
ity (
%)

J.F. STEURER AND M.B. UNDERWOODDATA REPORT: PHYSICAL PROPERTIES AND GRAIN-SIZE VARIATIONS 21
Table T1. Typical output from the Spectrex laserparticle counter Supercount software.
Notes: The size is the lower limit of each size class. Counts reports ofparticles <1 µm. The overflow bin (9999) contains counts of par-ticles >17 µm. Parts per million and percent sample, area, andmass are calculated from user-input assumptions.
BinSize (µm) Counts
Sample (%)
Area (%)
Mass (%) ppm
0 274.5 34.6 0.0 0.00 0.00001 1 148.1 18.7 2.6 0.48 0.00022 2 125.3 15.8 8.7 3.23 0.00143 3 105.7 13.3 16.5 9.21 0.00394 4 59.4 7.5 16.5 12.26 0.00525 5 42.5 5.4 18.5 17.14 0.00726 6 18.5 2.3 11.6 12.91 0.00547 7 7.1 0.9 6.0 7.84 0.00338 8 4.4 0.5 4.8 7.20 0.00309 9 2.7 0.3 3.8 6.41 0.0027
10 10 1.6 0.2 2.8 5.27 0.002211 11 2.2 0.3 4.6 9.36 0.003912 12 0.0 0.0 0.0 0.00 0.000013 13 0.5 0.1 1.6 3.86 0.001614 14 0.5 0.1 1.9 4.82 0.002015 15 0.0 0.0 0.0 0.00 0.000016 16 0.0 0.0 0.0 0.00 0.0000
9999 0.0 0.0 0.0 0.00 0.0000
Total counts: 793Total ppm: 0.0422
Mean: 2.8Standard deviation: 1.8
Dilution: 1

J.F. STEURER AND M.B. UNDERWOODDATA REPORT: PHYSICAL PROPERTIES AND GRAIN-SIZE VARIATIONS 22
Table T2. Summary of procedures and settings for using the Spectrex laser particlecounter with fine-grained sediment.
Procedure Setting or technique
Threshold <0.5 µm (setting 7)Background <20 counts/cm3
Agitation Invert bottle every 2 s for 30 s, taking care to avoid introducing air bubbles. Rest 15 s before beginning scan.Scan time 30 sScan type NormalFilter <1 µm to >16 µmConcentration 700–800 counts/cm3

J.F. STEURER AND M.B. UNDERWOODDATA REPORT: PHYSICAL PROPERTIES AND GRAIN-SIZE VARIATIONS 23
Table T3. Summary of grain size results. (See table notes. Continued on next two pages.)
Core, section, interval (cm)
Depth (mbsf)
Shipboard measurements‡
Size classes (wt%)* Grain-size parameters†
Porosity (%)
Bulk density (g/cm3)
Void ratio
Water content (wt%)
Sand (>63 µm)
Silt (64–4 µm)
Clay (<4 µm) Organics
<4 µm (%)
Mean (µm)
SD(µm)
190-1173A-Unit II12H-4, 48 107.12 3 89 8 — 75 3.0 2.7 59.4 1.66 1.47 36.612H-4, 48 107.12 3 74 23 — 78 2.7 2.3 59.4 1.66 1.47 36.618H-6, 16 166.80 1 99 0 — 3.2 2.8 67.8 1.56 2.11 42.323H-5, 131 213.95 1 48 51 — 84 2.3 2.0 66.6 1.60 1.99 42.524H-1, 123 217.37 4 41 56 — 86 2.2 1.9 64.7 1.58 1.83 41.824H-2, 128 218.92 5 53 41 — 83 2.4 2.1 66.7 1.59 2.01 43.331X-1, 131 284.55 2 39 59 — 86 2.2 1.9 66.1 1.61 1.95 42.032X-6, 130 301.74 3 68 29 — 80 2.7 2.4 67.0 1.59 2.03 43.234X-5, 54 318.48 2 53 45 — 83 2.5 2.1 65.7 1.61 1.92 41.934X-5, 54 318.48 2 65 33 — 80 2.5 2.2 65.7 1.61 1.92 41.934X-CC, 16 321.54 1 40 59 — 86 2.2 1.9 62.1 1.66 1.64 38.236X-4, 93 336.57 2 57 40 2 82 2.5 2.2 58.8 1.73 1.43 34.836X-6, 33 338.97 0 60 39 — 82 2.5 2.3 62.6 1.65 1.67 38.836X-CC, 21 340.16 0 73 23 4 78 2.6 2.3 62.6 1.65 1.67 38.8
190-1173A-Unit III37X-6, 35 348.59 1 62 37 — 81 2.6 2.2 52.9 1.85 1.12 29.337X-6, 35 348.59 1 70 29 — 79 2.6 2.2 52.9 1.85 1.12 29.337X-6, 35 348.59 1 65 35 — 81 2.6 2.3 52.9 1.85 1.12 29.338X-CC, 21 360.00 1 36 63 — 87 2.2 1.9 50.3 1.88 1.01 27.439X-5, 133 367.27 1 55 44 — 83 2.4 2.1 49.0 1.91 0.96 26.341X-7, 26 388.50 1 51 48 — 84 2.4 2.0 48.7 1.92 0.95 26.042X-2, 118 391.52 0 27 70 2 89 2.0 1.8 50.8 1.95 1.03 26.644X-CC, 27 417.79 0 27 73 — 89 2.0 1.9 48.3 1.93 0.93 25.746X-1, 132 428.56 0 31 69 — 88 2.0 1.8 48.2 1.93 0.93 25.546X-1, 132 428.56 0 23 76 — 90 2.0 1.5 48.2 1.93 0.93 25.546X-5, 121 434.45 0 23 77 — 90 2.2 1.6 50.7 1.90 1.03 27.347X-5, 130 443.74 0 17 82 1 91 1.9 1.7 48.5 1.91 0.94 26.051X-2, 39 476.23 0 31 69 — 88 2.0 1.7 43.9 1.98 0.78 22.751X-5, 118 481.52 0 21 78 1 90 2.0 1.6 49.4 1.92 0.98 26.351X-6, 60 482.44 0 25 75 — 89 2.1 1.6 44.7 2.00 0.81 22.953X-5, 128 501.02 0 36 64 — 87 2.2 1.9 41.9 2.03 0.72 21.253X-CC, 26 503.46 1 27 72 — 89 2.0 1.8 41.0 2.05 0.70 20.555X-5, 131 520.35 0 26 74 — 89 2.1 1.9 43.5 2.01 0.77 22.164X-2, 99 602.03 0 36 64 — 87 2.2 1.8 38.3 2.09 0.62 18.864X-5, 56 606.10 0 22 78 — 90 2.0 1.7 38.5 2.07 0.63 19.169X-4, 89 653.13 0 32 68 — 88 2.2 1.7 56.8 1.76 1.31 33.0
190-1173A-Unit IV73X-2, 86 688.70 0 56 43 1 82 2.4 1.9 37.8 2.15 0.61 18.0
190-1174B-Unit II10R-CC, 16 229.48 2 42 56 — 85 2.3 2.0 44.7 1.95 0.81 23.510R-CC, 16 229.48 2 51 47 — 83 2.4 2.1 44.7 1.95 0.81 23.518R-2, 63 306.43 1 56 44 — 83 2.5 2.0 47.9 1.86 0.92 26.321R-CC, 5 335.77 0 34 66 — 87 2.1 1.9 44.8 1.94 0.81 23.727R-3, 113 394.63 0 41 59 — 86 2.2 1.9 42.8 1.96 0.75 22.429R-CC, 20 414.65 0 73 27 — 81 2.4 2.0 44.6 1.93 0.80 23.729R-CC, 20 414.65 0 61 39 — 79 2.6 2.4 44.6 1.93 0.80 23.731R-3, 47 432.47 0 42 55 3 85 2.2 2.0 37.9 2.07 0.61 18.735R-2, 94 469.54 5 66 29 — 81 2.5 2.1 45.8 2.01 0.85 23.435R-2, 94 469.54 5 86 9 — 80 2.7 2.3 45.8 2.01 0.85 23.435R-2, 94 469.54 5 60 35 — 75 2.9 2.5 45.8 2.01 0.85 23.436R-2, 130 479.30 1 34 65 — 87 2.2 1.8 39.5 2.02 0.65 20.0
190-1174B-Unit III37R-3, 133 490.03 1 48 51 — 84 2.3 2.1 44.6 1.96 0.81 23.938R-6, 60 503.40 9 27 64 — 88 2.1 1.8 38.7 2.01 0.63 19.739R-1, 127 506.17 1 48 51 — 85 2.3 1.8 37.9 2.11 0.60 18.239R-1, 127 506.17 1 47 52 — 84 2.3 1.9 37.5 2.11 0.60 18.242R-3, 127 538.17 1 44 56 — 84 2.4 1.9 37.5 2.11 0.60 18.243R-5, 123 550.83 1 38 62 — 86 2.3 2.1 37.4 2.09 0.60 18.343R-6, 127 552.37 1 37 62 — 87 2.2 2.1 37.7 2.09 0.62 18.3

J.F. STEURER AND M.B. UNDERWOODDATA REPORT: PHYSICAL PROPERTIES AND GRAIN-SIZE VARIATIONS 24
45R-3, 111 566.71 1 54 44 1 83 2.3 2.0 41.4 2.05 0.71 20.749R-3, 97 605.17 1 52 48 — 89 2.1 1.8 40.5 2.03 0.68 20.549R-3, 97 605.17 1 27 72 — 83 2.4 2.0 40.5 2.03 0.68 20.553R-3, 124 644.04 1 47 52 — 84 2.4 2.1 42.4 2.01 0.74 21.655R-1, 129 660.29 3 40 58 — 87 2.2 1.9 37.3 2.03 0.60 18.855R-1, 129 660.29 3 35 62 — 86 2.3 1.8 37.3 2.03 0.60 18.8
190-1174B-Unit IV57R-6, 135 687.15 2 31 68 — 88 2.0 1.7 38.1 2.14 0.57 17.459R-5, 133 704.93 1 32 68 — 88 2.1 1.8 34.9 2.15 0.54 16.662R-3, 92 730.42 1 52 46 1 83 2.4 2.2 34.2 2.16 0.52 16.266R-5, 104 771.64 0 37 62 1 87 2.1 1.8 35.6 2.14 0.55 17.067R-2, 96 775.40 0 23 77 — 90 2.1 1.6 34.8 2.19 0.53 16.367R-3, 126 777.20 — 32 68 — 88 2.0 1.7 34.7 2.25 0.53 15.868R-2, 134 786.74 0 29 71 — 88 2.0 1.7 32.5 2.22 0.48 15.068R-2, 134 786.74 0 30 70 — 88 2.1 1.8 32.5 2.22 0.48 15.069R-2, 127 795.14 1 37 62 — 87 2.2 1.8 32.9 2.18 0.49 15.470R-2, 94 805.74 1 35 62 2 87 2.1 2.0 34.3 2.17 0.52 16.271R-2, 1 812.89 0 30 69 — 88 2.1 1.9 32.1 2.20 0.47 14.971R-2, 94 813.82 0 26 72 1 89 2.0 1.6 35.1 2.20 0.54 16.372R-1, 117 823.37 1 33 66 — 87 2.1 1.7 32.2 2.21 0.47 14.972R-1, 117 823.37 1 32 68 — 88 2.2 1.8 32.2 2.21 0.47 14.973R-1, 80 832.60 0 63 36 1 81 2.5 2.2 33.4 2.21 0.50 15.573R-7, 51 841.31 4 23 73 — 89 2.1 1.7 35.8 2.12 0.56 17.373R-7, 51 841.31 4 29 68 — 88 2.1 1.8 35.8 2.12 0.56 17.374R-1, 130 842.70 0 26 74 — 89 2.0 1.7 34.1 2.17 0.52 17.474R-2, 58 843.48 0 29 71 — 91 1.9 1.4 35.2 2.19 0.54 16.474R-2, 58 843.48 0 15 85 — 88 2.0 1.8 35.2 2.19 0.54 16.474R-2, 125 844.15 0 43 55 2 85 2.2 1.8 38.1 2.10 0.62 18.674R-CC, 14 845.11 0 13 87 — 92 1.9 1.5 35.8 2.16 0.56 17.078R-2, 128 882.78 2 27 70 — 88 2.1 1.6 37.4 2.13 0.60 18.078R-2, 128 882.78 2 29 69 — 89 2.1 1.9 37.4 2.13 0.60 18.078R-2, 128 882.78 2 34 64 — 87 2.2 2.0 37.4 2.13 0.60 18.083R-7, 46 937.36 0 33 67 — 87 2.1 1.7 36.9 2.12 0.58 17.884R-3, 132 941.82 1 49 50 — 84 2.4 1.8 35.7 2.12 0.56 17.285R-1, 117 948.27 0 54 46 — 83 2.5 1.7 35.8 2.16 0.56 16.987R-1, 127 967.77 0 27 72 1 89 2.1 1.6 34.6 2.17 0.53 16.389R-6, 31 993.11 0 40 60 — 86 2.3 1.8 33.1 2.19 0.50 15.594R-3, 131 1037.81 1 35 64 — 87 2.1 1.7 29.6 2.29 0.42 13.296R-3, 17 1055.77 5 44 51 — 85 2.3 1.7 33.5 2.22 0.50 15.497R-1, 63 1062.93 0 42 58 — 86 2.3 1.8 32.8 2.22 0.49 15.198R-1, 28 1072.18 0 42 58 — 86 2.2 1.9 31.3 2.22 0.46 14.498R-1, 28 1072.18 0 46 54 — 85 2.3 2.0 31.3 2.22 0.46 14.4
190-1175A-7H-2, 135 57.49 2 40 56 2 86 2.3 2.026X-3, 125 238.55 2 55 41 3 82 2.4 2.131X-4, 117 288.07 2 32 64 2 87 2.1 1.843X-2, 67 399.77 8 53 38 — 82 2.3 2.2
190-1177A-Unit I1R-2, 82 302.52 0 40 60 — 86 2.2 1.8 63.1 1.64 1.71 39.52R-2, 111 311.81 0 44 53 2 85 2.3 2.0 61.9 1.63 1.63 38.93R-2, 124 321.64 1 40 55 4 85 2.2 2.0 62.0 1.67 1.63 38.18R-2, 53 369.03 — 42 58 — 86 2.3 1.9 62.3 1.66 1.65 38.59R-3, 108 380.68 1 39 59 2 86 2.2 2.0 61.6 1.68 1.60 37.610R-2, 148 389.08 0 51 49 — 84 2.4 2.0 64.4 1.64 1.81 37.710R-2, 148 389.08 0 31 68 — 84 2.3 2.1 64.4 1.64 1.81 37.710R-2, 148 389.08 0 48 52 — 88 2.1 1.8 64.4 1.64 1.81 37.7
190-1177A-Unit II12R-1, 44 405.74 2 27 70 1 89 2.0 1.9 66.2 1.60 1.96 42.513R-CC, 27 424.77 0 42 56 2 85 2.3 2.1 53.1 1.83 1.13 29.715R-CC, 8 443.88 0 38 61 — 86 2.2 1.8 51.5 1.85 1.06 28.516R-3, 119 448.09 1 46 53 0 85 2.3 2.0 50.3 1.87 1.01 27.6
Core, section, interval (cm)
Depth (mbsf)
Shipboard measurements‡
Size classes (wt%)* Grain-size parameters†
Porosity (%)
Bulk density (g/cm3)
Void ratio
Water content (wt%)
Sand (>63 µm)
Silt (64–4 µm)
Clay (<4 µm) Organics
<4 µm (%)
Mean (µm)
SD(µm)
Table T3 (continued).

J.F. STEURER AND M.B. UNDERWOODDATA REPORT: PHYSICAL PROPERTIES AND GRAIN-SIZE VARIATIONS 25
Notes: Sand was determined by sieve analysis, organic matter was determined by loss due to digestion by H2O2. * = equiva-lent settling diameters correlated by pipette analysis. † = output from laser particle analyzer. ‡ = data from Shipboard
190-1177A-Unit III16R-4, 144 449.84 1 11 88 — 92 1.8 1.5 49.0 1.89 0.98 26.817R-2, 99 455.99 1 26 70 3 89 2.0 1.8 44.7 1.96 0.81 23.319R-6, 42 480.72 2 55 43 — 83 2.6 2.1 49.4 1.90 0.98 26.619R-7, 36 482.16 2 51 47 — 83 2.4 2.2 40.8 2.01 0.69 20.819R-7, 36 482.16 2 40 58 — 86 2.3 1.9 40.8 2.01 0.69 20.820R-1, 104 483.44 0 46 53 1 85 2.2 1.9 39.8 2.03 0.66 20.023R-2, 42 512.95 0 29 71 — 88 2.1 1.8 46.5 1.96 0.87 24.224R-4, 3 525.23 0 39 60 1 83 2.4 1.8 45.5 1.95 0.83 23.924R-4, 3 525.23 0 52 47 1 86 2.2 1.7 45.5 1.95 0.83 23.924R-4, 56 525.76 0 25 75 — 89 2.0 1.6 45.5 1.95 0.83 23.924R-5, 128 527.68 0 21 77 2 90 1.9 1.6 46.4 1.94 0.87 24.524R-6, 127 529.17 0 26 71 2 89 2.0 1.8 46.0 1.92 0.85 24.625R-2, 130 533.20 0 30 70 — 88 2.1 1.7 46.6 1.92 0.87 24.927R-1, 97 550.67 2 21 74 3 90 1.9 1.6 49.2 1.90 0.97 26.629R-1, 34 569.24 0 33 64 3 87 2.0 1.7 38.9 2.05 0.64 19.430R-2, 30 580.30 1 15 82 2 91 1.9 1.6 51.0 1.95 0.81 23.530R-7, 29 587.79 0 31 67 2 88 2.0 1.7 45.0 1.94 0.82 23.831R-CC, 8 591.10 2 20 78 — 90 1.9 1.7 47.9 1.93 0.92 25.433R-2, 72 609.72 0 23 75 2 89 2.0 1.7 45.4 1.96 0.83 23.734R-CC, 13 617.23 1 35 62 2 87 2.2 1.9 42.9 1.97 0.75 22.335R-3, 13 628.33 0 56 42 2 82 2.5 2.2 48.4 1.91 0.94 26.036R-1, 24 636.54 1 53 47 — 83 2.3 2.2 43.5 1.98 0.77 26.037R-2, 82 647.22 1 35 63 2 87 2.0 1.8 43.2 1.99 0.76 22.338R-CC, 22 656.39 4 38 54 4 86 2.2 2.0 41.4 2.02 0.71 21.039R-1, 96 666.16 1 27 70 2 89 2.0 1.7 44.6 1.96 0.81 23.341R-1, 129 685.69 1 42 56 — 85 2.2 2.0 42.4 2.04 0.74 21.341R-1, 129 685.69 1 44 55 — 85 2.2 2.0 42.4 2.04 0.74 21.343R-1, 3 703.73 0 31 69 — 88 2.1 1.9 41.2 2.02 0.70 20.945R-2, 87 725.27 0 18 82 — 91 1.9 1.7 43.1 2.05 0.76 21.546R-1, 18 732.68 0 22 78 — 90 1.9 1.7 43.2 2.02 0.76 22.046R-2, 122 735.22 38 27 32 2 85 2.2 1.9 40.8 2.03 0.69 20.647R-3, 101 746.11 1 47 52 1 84 2.3 1.9 42.6 2.00 0.74 21.8
190-1177A-Unit IV47R-5, 97 749.07 0 27 73 — 89 1.9 1.8 41.2 2.03 0.70 20.749R-4, 20 766.00 1 37 60 2 86 2.1 1.8 48.2 1.91 0.93 25.949R-5, 72 768.02 2 71 25 2 79 2.6 2.3 56.8 1.72 1.32 33.951R-2, 23 782.33 5 86 8 — 75 2.8 2.4 51.3 1.75 1.05 30.051R-2, 109 783.19 7 65 26 2 79 2.6 2.4 51.3 1.75 1.05 30.052R-2, 56 792.36 2 41 57 — 86 2.2 2.0 59.9 1.95 0.80 23.253R-2, 57 801.97 0 27 73 — 89 2.1 1.8 39.8 2.10 0.66 19.454R-2, 48 811.48 0 24 76 — 89 2.0 1.7 46.8 2.00 0.88 24.055R-1, 116 820.36 0 38 60 2 86 2.1 1.8 43.2 2.02 0.76 21.9
Core, section, interval (cm)
Depth (mbsf)
Shipboard measurements‡
Size classes (wt%)* Grain-size parameters†
Porosity (%)
Bulk density (g/cm3)
Void ratio
Water content (wt%)
Sand (>63 µm)
Silt (64–4 µm)
Clay (<4 µm) Organics
<4 µm (%)
Mean (µm)
SD(µm)
Table T3 (continued).
Scientific Party (2001). SD = standard deviation.