Sediment Oxygen Demand and Pore Water Phosphate Flux ... · PDF fileThis report discusses my...
41
Sediment Oxygen Demand and Pore Water Phosphate Flux: Measurement, Characterization, and Monitoring in Deer Creek Reservoir Derek Lounsbury A project submitted to the faculty of Brigham Young University in partial fulfillment of the requirements for the degree of Master of Science Gustavious P. Williams, Chair E. James Nelson Brett M. Borup Department of Civil and Environmental Engineering Brigham Young University April 2011 Copyright © 2011 Derek Lounsbury All Rights Reserved
Transcript of Sediment Oxygen Demand and Pore Water Phosphate Flux ... · PDF fileThis report discusses my...

Sediment Oxygen Demand and Pore Water Phosphate Flux: Measurement,
Characterization, and Monitoring in Deer Creek Reservoir
Derek Lounsbury
A project submitted to the faculty of
Brigham Young University
in partial fulfillment of the requirements for the degree of
Master of Science
Gustavious P. Williams, Chair
E. James Nelson
Brett M. Borup
Department of Civil and Environmental Engineering
Brigham Young University
April 2011
Copyright © 2011 Derek Lounsbury
All Rights Reserved

GRADUATE COMMITTEE APPROVAL
of a project submitted by
Derek Lounsbury
The Project of Derek Lounsbury is acceptable in its final form including (1) its format, citations, and
bibliographical style are consistent and acceptable and fulfill department style requirements; (2) its
illustrative materials including figures, tables, and charts are in place; and (3) the final manuscript is
satisfactory and ready for submission.
This project has been read by each member of the following graduate committee and by majority
vote has been found to be satisfactory.
______________________________ ________________________________________
Date (Gustavious P. Williams), Chair
______________________________ ________________________________________
Date (E. James Nelson)
______________________________ ________________________________________
Date (Brett M. Borup)
Accepted for the Department of Civil and Environmental Engineering
______________________________ ________________________________________
Date E. James Nelson
Graduate Coordinator

ABSTRACT
Sediment Oxygen Demand and Pore Water Phosphate Flux: Measurement,
Characterization, and Monitoring in Deer Creek Reservoir
Derek Lounsbury
Department of Civil and Environmental Engineering, BYU
Master of Science
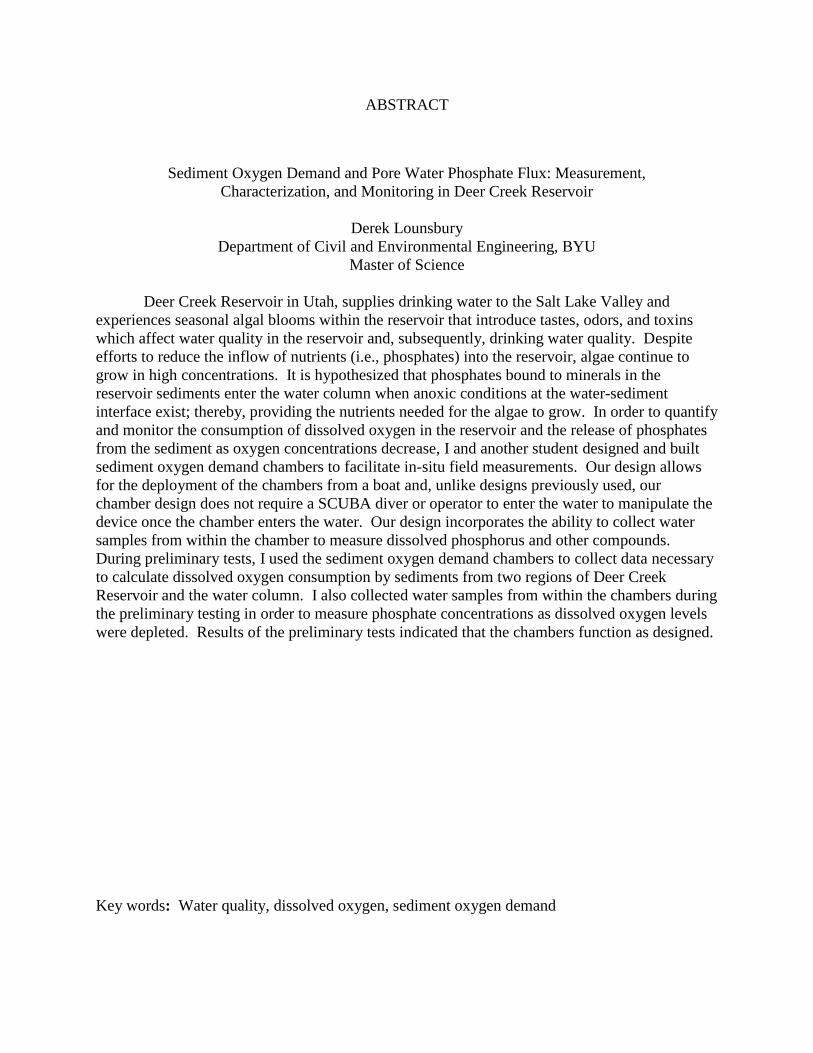
Deer Creek Reservoir in Utah, supplies drinking water to the Salt Lake Valley and
experiences seasonal algal blooms within the reservoir that introduce tastes, odors, and toxins
which affect water quality in the reservoir and, subsequently, drinking water quality. Despite
efforts to reduce the inflow of nutrients (i.e., phosphates) into the reservoir, algae continue to
grow in high concentrations. It is hypothesized that phosphates bound to minerals in the
reservoir sediments enter the water column when anoxic conditions at the water-sediment
interface exist; thereby, providing the nutrients needed for the algae to grow. In order to quantify
and monitor the consumption of dissolved oxygen in the reservoir and the release of phosphates
from the sediment as oxygen concentrations decrease, I and another student designed and built
sediment oxygen demand chambers to facilitate in-situ field measurements. Our design allows
for the deployment of the chambers from a boat and, unlike designs previously used, our
chamber design does not require a SCUBA diver or operator to enter the water to manipulate the
device once the chamber enters the water. Our design incorporates the ability to collect water
samples from within the chamber to measure dissolved phosphorus and other compounds.
During preliminary tests, I used the sediment oxygen demand chambers to collect data necessary
to calculate dissolved oxygen consumption by sediments from two regions of Deer Creek
Reservoir and the water column. I also collected water samples from within the chambers during
the preliminary testing in order to measure phosphate concentrations as dissolved oxygen levels
were depleted. Results of the preliminary tests indicated that the chambers function as designed.
Key words: Water quality, dissolved oxygen, sediment oxygen demand


ACKNOWLEDGMENTS
I wish to thank the US Bureau of Reclamation for their support and sponsorship for this
project. I also acknowledge Dr. Gus Williams and other committee members for their continued
professional support and mentorship; Rolando Velasquez who helped design, build, and test the
sediment oxygen demand chambers; and my wife who continually supports me in my pursuits.

v
TABLE OF CONTENTS
LIST OF TABLES ...................................................................................................................... vii
LIST OF FIGURES ................................................................................................................... ixx
LIST OF EQUATIONS ............................................................................................................... xi
1 Introduction ........................................................................................................................... 1
2 Background ........................................................................................................................... 3
2.1 Sediment Oxygen Demand ............................................................................................. 3
2.2 Sediments: A Nutrient Source ........................................................................................ 4
3 SOD Chambers ...................................................................................................................... 7
3.1 SOD Measurement .......................................................................................................... 7
3.2 Design Considerations .................................................................................................... 8
3.3 BYU SOD Chamber Design ........................................................................................... 9
4 Preliminary Tests ................................................................................................................ 13
4.1 Mechanical Function Test ............................................................................................. 13
4.2 SOD Test ....................................................................................................................... 14
4.3 Phosphate Flux Test ...................................................................................................... 16
5 Results and Discussion ........................................................................................................ 17
5.1 Mechanical Function Test Results ................................................................................ 17
5.2 SOD Test Results .......................................................................................................... 17
5.3 Phosphate Flux Test Results ......................................................................................... 22
6 Conclusions .......................................................................................................................... 23
REFERENCES ............................................................................................................................ 25

vi
vii
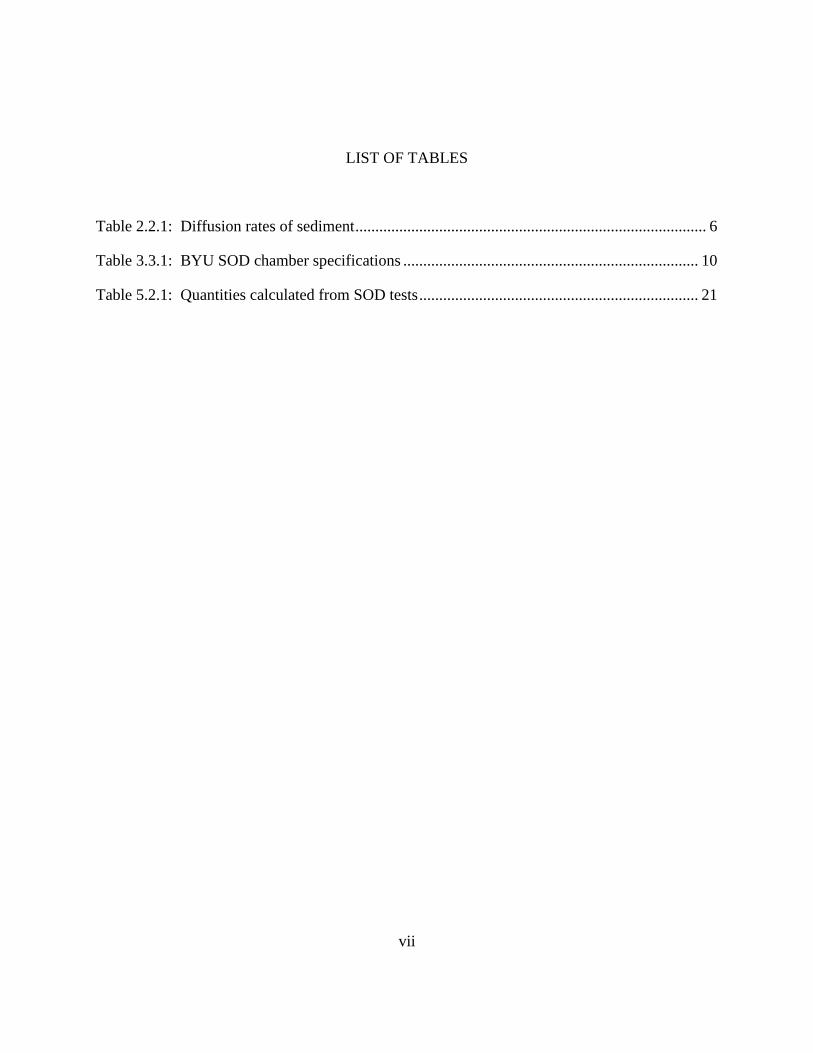
LIST OF TABLES
Table 2.2.1: Diffusion rates of sediment ........................................................................................ 6
Table 3.3.1: BYU SOD chamber specifications .......................................................................... 10
Table 5.2.1: Quantities calculated from SOD tests ...................................................................... 21

viii
ix
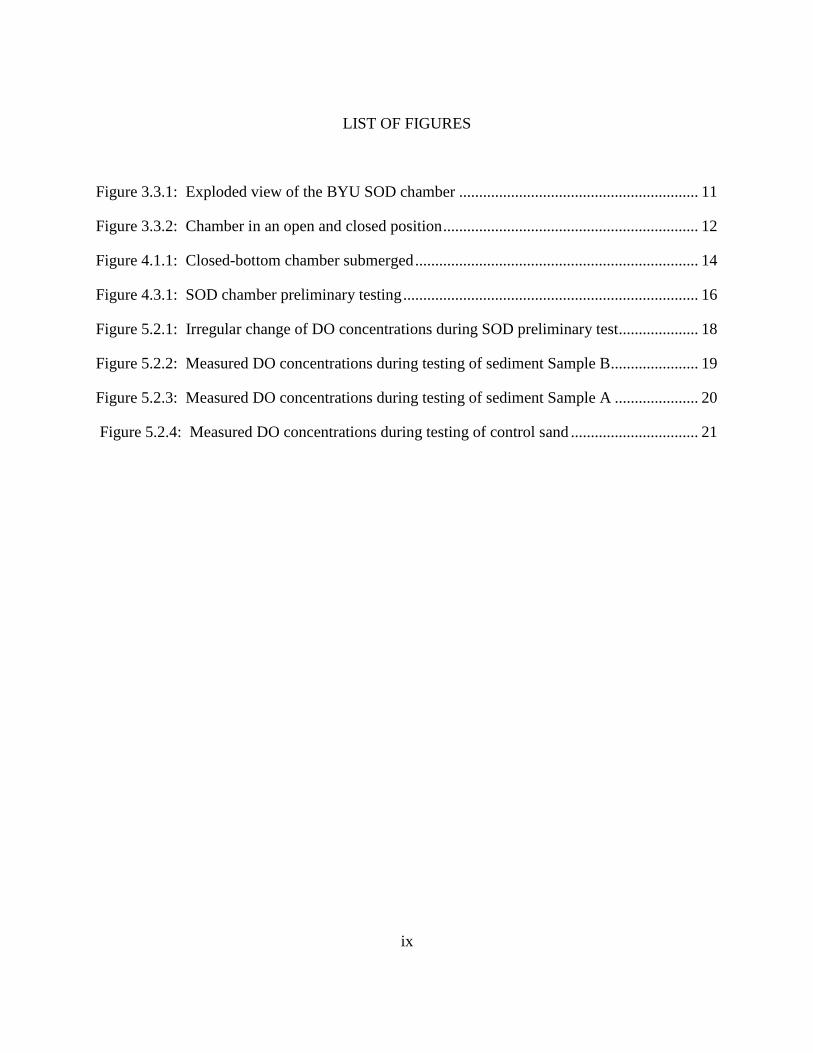
LIST OF FIGURES
Figure 3.3.1: Exploded view of the BYU SOD chamber ............................................................ 11
Figure 3.3.2: Chamber in an open and closed position ................................................................ 12
Figure 4.1.1: Closed-bottom chamber submerged ....................................................................... 14
Figure 4.3.1: SOD chamber preliminary testing .......................................................................... 16
Figure 5.2.1: Irregular change of DO concentrations during SOD preliminary test.................... 18
Figure 5.2.2: Measured DO concentrations during testing of sediment Sample B...................... 19
Figure 5.2.3: Measured DO concentrations during testing of sediment Sample A ..................... 20
Figure 5.2.4: Measured DO concentrations during testing of control sand ................................ 21

x
xi
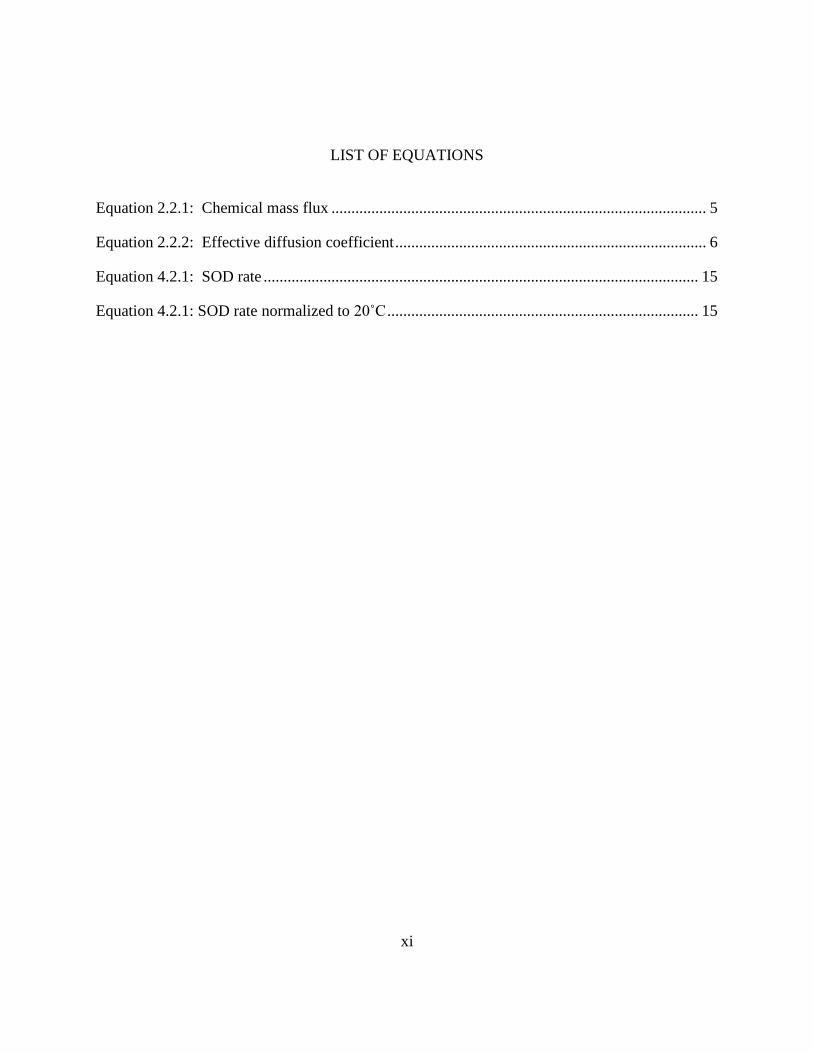
LIST OF EQUATIONS
Equation 2.2.1: Chemical mass flux .............................................................................................. 5
Equation 2.2.2: Effective diffusion coefficient .............................................................................. 6
Equation 4.2.1: SOD rate ............................................................................................................. 15
Equation 4.2.1: SOD rate normalized to 20˚C .............................................................................. 15

xii

1
1 INTRODUCTION
The dissolved oxygen (DO) concentration of reservoirs, or any body of water, is not only
indicative of, but also contributes to the overall water quality and health of an aquatic
environment. In water bodies, dead algae and other organisms settle to the bottom of water
column and aerobically decay (PSOMAS 2002). The decomposition of this organic matter in the
water column and near-surface sediments can significantly reduce the DO concentration;
especially, under eutrophic conditions in which available dead plant material is abundant (Doyle
and Rounds 2003). When low DO concentrations in the hypolimnion exist, it is possible through
chemical processes for nutrients in the sediments to dissolve and enter the water column;
thereby, providing nutrients for further algae and other plant growth. Low DO is a result of both
biological oxygen demand (BOD) from materials in the water column, and sediment oxygen
demand (SOD) from materials in the sediments and at the water-sediment interface.
Quantitatively determining the amount of oxygen consumption due to the decomposition
of organic matter is necessary in order to develop a DO budget and to understand the internal
processes occurring and affecting the water quality in Deer Creek Reservoir. SOD chambers
have been used by other researchers to monitor DO consumption at the water-sediment interface
in various rivers and lakes. This report discusses my efforts to design SOD chambers suitable
for research in Deer Creek Reservoir (DCR) and the preliminary testing of the chambers prior to
their use in DCR. These chambers should be able to monitor and establish rates of SOD, and
establish correlations between DO consumption and phosphate release. My work is part of a

2
collective effort to understand and model factors affecting the water quality in DCR; specifically,
factors contributing to algal blooms and the trophic state of the reservoir.
3
2 BACKGROUND
Construction of Deer Creek Reservoir, located in Utah’s Wasatch County, was completed
in 1941 by the Bureau of Reclamation. The reservoir supplies the drinking water to six water
districts in four counties. Despite efforts to abate algal growth by reducing nutrient inflow from
external sources over the past 25 years, algal blooms still occur, increasing the reservoir
eutrophication. Research indicates that sediment deltas are possible sources of nutrients which
can re-suspend into the water column through mechanical and geochemical processes, thereby
providing the nutrients needed for algal blooms (PSOMAS 2002). Another potential source is
geochemical dissolution of nutrients bound to bottom sediments (Casbeer 2009).
2.1 Sediment Oxygen Demand
Sediment oxygen demand (SOD) is the consumption rate of dissolved oxygen (DO)
through chemical and biological reactions which occur in near-surface sediments. The
decomposition of organic matter is a large contributor to the SOD rate in many water bodies.
The type and quantity of organic material found in sediments affect the rate of oxygen uptake.
Quantifying the SOD rate in an aquatic environment is necessary to determine a DO
budget and the water quality (as it relates to DO). In some water bodies, SOD is the single
greatest deoxygenizing process present in the aquatic system. It is possible for the DO
consumption in an aquatic system to exceed the introduction of oxygen (e.g. mixing and the
photosynthetic production of oxygen by aquatic plants) to the water column (Doyle and Rounds
2003) (Mackenthun and Stefan 1998). In such a scenario, the amount of DO can decrease to a
4
concentration detrimental to the health of varying aquatic organisms (Doyle and Rounds 2003).
In addition, many metals and nutrients are significantly more soluble at low DO levels,
potentially releasing nutrients to the environment by dissolving the minerals to which they are
bound or dissolving the mineral phase of the nutrient itself (Casbeer 2009).
In order to better understand the potential depletion of dissolved oxygen in DCR, I
designed and built a set of SOD chambers. With these chambers, I can quantify the amount of
oxygen consumed in different areas of the reservoir by the sediments and water column, and
thereby establish a DO budget for the reservoir.
2.2 Sediments: A Nutrient Source
Sediments in many water bodies contain a concentrated source of nutrients. Nutrients in
a water body become stored in the sediment through various avenues. Nutrients in organic form
(i.e. as plants or organisms) settle as they die. Some inorganic forms of nutrients occur as part of
the indigenous rocks and minerals which are present or washed into the body of water. Other
soluble forms of nutrients become sediments as geochemical reactions cause them adsorb to
sediment minerals or coprecipitate out of the water column. These nutrients can be released back
into the water column through mechanical and geochemical processes. For a more detailed
description of nutrients, specifically phosphates, trapped in sediments in DCR, refer to Casbeer
(2009).
While sediments might contain these various forms (organic or inorganic) of nutrients,
most of these forms are not “bioavailable” for uptake by algae (Casbeer 2009). For the purposes
of my research, I was solely interested in phosphates bound to minerals containing Fe (III) from
which orthophosphates (bioavailable form of phosphates) are released in anoxic conditions.
5
Studies have demonstrated an increased flux of phosphates and metals from sediments into the
water column as the oxygen concentration drops below 0.5 mg/L (Ruban and Demare 1998).
Sediments with high SOD rates could create the anoxic conditions conducive to nutrient
suspension/re-suspension. I theorized that SOD chambers can be used to determine the release
rates of phosphorus and other nutrients from sediments into overlying waters. By collecting
water samples from within a chamber, and testing the samples for phosphates, one could
compare and correlate phosphorus flux to oxygen concentrations.
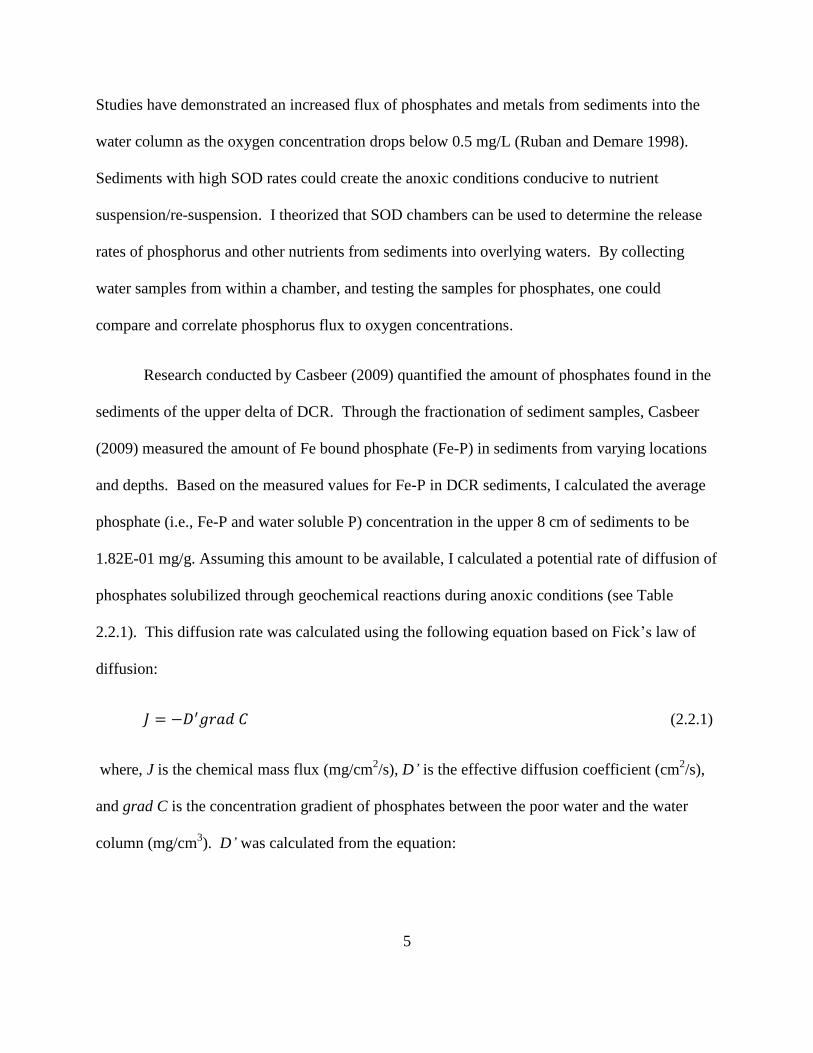
Research conducted by Casbeer (2009) quantified the amount of phosphates found in the
sediments of the upper delta of DCR. Through the fractionation of sediment samples, Casbeer
(2009) measured the amount of Fe bound phosphate (Fe-P) in sediments from varying locations
and depths. Based on the measured values for Fe-P in DCR sediments, I calculated the average
phosphate (i.e., Fe-P and water soluble P) concentration in the upper 8 cm of sediments to be
1.82E-01 mg/g. Assuming this amount to be available, I calculated a potential rate of diffusion of
phosphates solubilized through geochemical reactions during anoxic conditions (see Table
2.2.1). This diffusion rate was calculated using the following equation based on Fick’s law of
diffusion:
(2.2.1)
where, J is the chemical mass flux (mg/cm2/s), D’ is the effective diffusion coefficient (cm
2/s),
and grad C is the concentration gradient of phosphates between the poor water and the water
column (mg/cm3). D’ was calculated from the equation:

6
(2.2.2)
where, D’ is the effective diffusion coefficient (cm2/s), n is the assumed porosity of 0.3, and D is
the diffusion coefficient of 1E-05(cm2/s) (Domenico 1997).
Table 2.2.1: Diffusion rates of sediment
Sediment depth Diffusion rate
cm mg/cm2/s
1 1.45E-06
2 1.43E-06
3 1.41E-06
4 1.39E-06
5 1.37E-06
6 1.35E-06
7 1.33E-06
8 1.32E-06

7
3 SOD CHAMBERS
3.1 SOD Measurement
Two general methods exist for measuring SOD, each having arguable advantages and
disadvantages (Mackenthun and Stefan 1998) (Murphy and Hicks 1986). The laboratory method
requires the collection of a sediment sample (e.g. a core sample), which is brought to a
laboratory for analysis. This method facilitates testing in a replicable environment in which
factors such as water temperature and velocity can be controlled. However, disturbance of
sediments due to the sample collection process can affect the accuracy of SOD measurements
(Doyle and Rounds 2003). An alternative to laboratory testing is in-situ measurements. While
in-situ testing conditions are difficult to replicate due to uncontrollable environmental factors,
standardized methods for use of equipment and measurement of SOD have been established by
groups, such as the Environmental Protection Agency (EPA) and the U.S. Geological Survey
(USGS), in order to minimize perturbations to the sediment during testing and to increase the
reproducibility of measured data sets (Doyle and Rounds 2003) (Parsons 2007). In-situ testing
also offers the advantage of real-time data analysis prior to leaving the test site (Murphy and
Hicks 1986).
In-situ testing requires the use of both a SOD chamber and a control chamber. These
chambers isolate a predetermined volume of water over a given area of sediment. By monitoring
the changing concentration of dissolved oxygen contained within an SOD chamber over a
predetermined period of time, one can calculate the rate of oxygen uptake. Control chambers
8
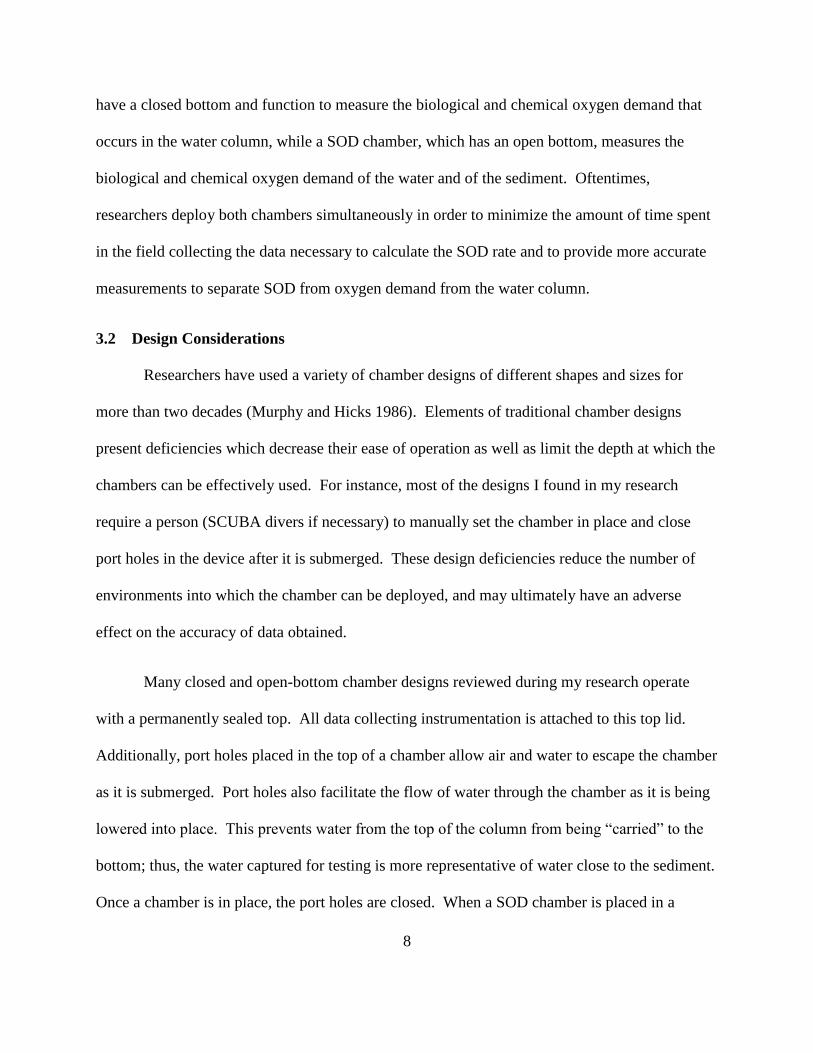
have a closed bottom and function to measure the biological and chemical oxygen demand that
occurs in the water column, while a SOD chamber, which has an open bottom, measures the
biological and chemical oxygen demand of the water and of the sediment. Oftentimes,
researchers deploy both chambers simultaneously in order to minimize the amount of time spent
in the field collecting the data necessary to calculate the SOD rate and to provide more accurate
measurements to separate SOD from oxygen demand from the water column.
3.2 Design Considerations
Researchers have used a variety of chamber designs of different shapes and sizes for
more than two decades (Murphy and Hicks 1986). Elements of traditional chamber designs
present deficiencies which decrease their ease of operation as well as limit the depth at which the
chambers can be effectively used. For instance, most of the designs I found in my research
require a person (SCUBA divers if necessary) to manually set the chamber in place and close
port holes in the device after it is submerged. These design deficiencies reduce the number of
environments into which the chamber can be deployed, and may ultimately have an adverse
effect on the accuracy of data obtained.
Many closed and open-bottom chamber designs reviewed during my research operate
with a permanently sealed top. All data collecting instrumentation is attached to this top lid.
Additionally, port holes placed in the top of a chamber allow air and water to escape the chamber
as it is submerged. Port holes also facilitate the flow of water through the chamber as it is being
lowered into place. This prevents water from the top of the column from being “carried” to the
bottom; thus, the water captured for testing is more representative of water close to the sediment.
Once a chamber is in place, the port holes are closed. When a SOD chamber is placed in a
9
shallow body of water, the closure of a port presents few challenges to the operator and can
result in sediment disturbance near the chamber, potentially affecting the water in the chamber.
At greater depths, closing a port hole can be a more difficult task and may require the use of
SCUBA equipment. Eliminating the need for human interaction with a chamber once it is
submerged could reduce training needed to operate the SOD chamber, increase the depths and
environment to which it can be deployed, and minimize the potential for sediment disturbance to
affect the measurements.
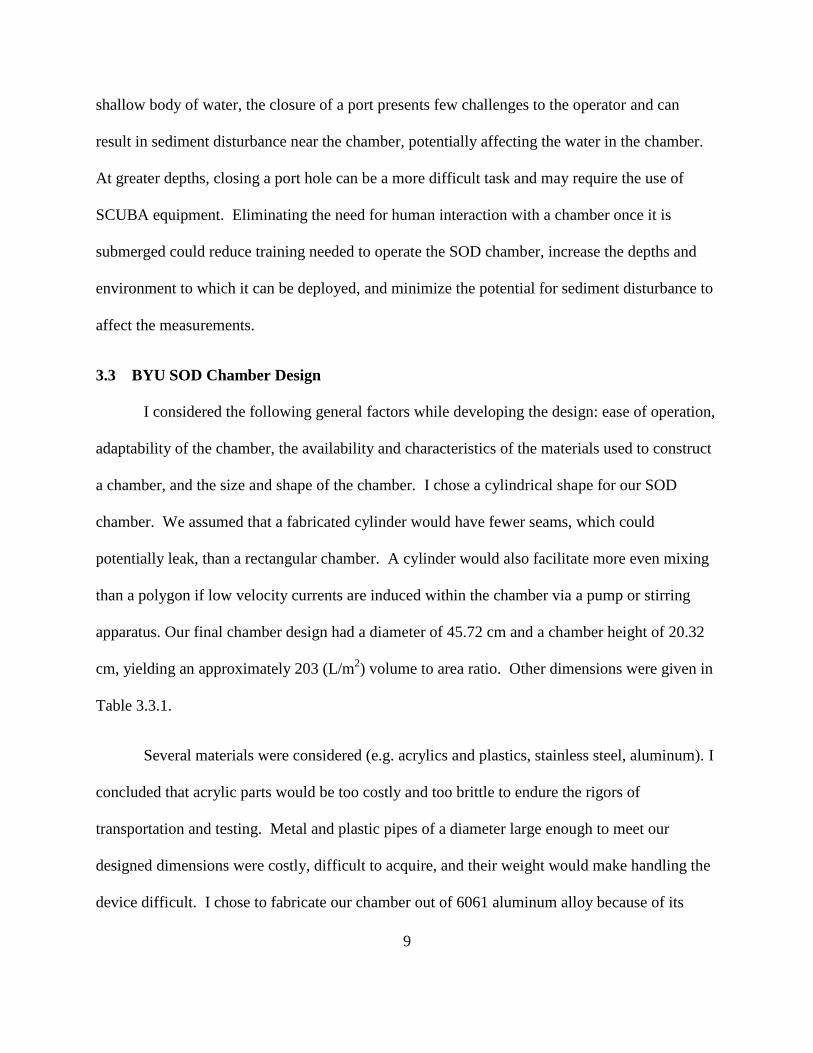
3.3 BYU SOD Chamber Design
I considered the following general factors while developing the design: ease of operation,
adaptability of the chamber, the availability and characteristics of the materials used to construct
a chamber, and the size and shape of the chamber. I chose a cylindrical shape for our SOD
chamber. We assumed that a fabricated cylinder would have fewer seams, which could
potentially leak, than a rectangular chamber. A cylinder would also facilitate more even mixing
than a polygon if low velocity currents are induced within the chamber via a pump or stirring
apparatus. Our final chamber design had a diameter of 45.72 cm and a chamber height of 20.32
cm, yielding an approximately 203 (L/m2) volume to area ratio. Other dimensions were given in
Table 3.3.1.
Several materials were considered (e.g. acrylics and plastics, stainless steel, aluminum). I
concluded that acrylic parts would be too costly and too brittle to endure the rigors of
transportation and testing. Metal and plastic pipes of a diameter large enough to meet our
designed dimensions were costly, difficult to acquire, and their weight would make handling the
device difficult. I chose to fabricate our chamber out of 6061 aluminum alloy because of its
10
availability and physical characteristics such as workability, durability, weight, and resistance to
corrosion. I had the individual pieces of the chamber cut out of sheets of aluminum using a
water jet cutter. Fabricators constructed the main section of the body by rolling and welding a
sheet of aluminum into a cylindrical shape. Figure 3.3.1 shows a schematic of the chamber with
its multiple parts.
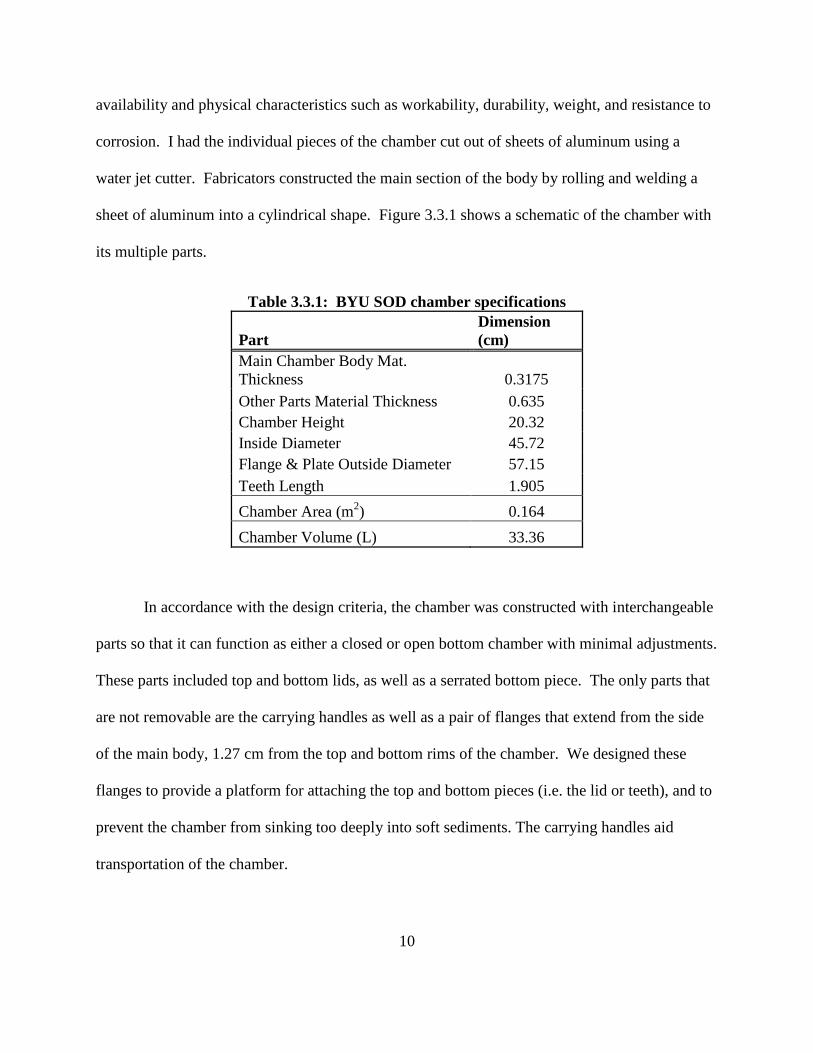
Table 3.3.1: BYU SOD chamber specifications
Part
Dimension
(cm)
Main Chamber Body Mat.
Thickness 0.3175
Other Parts Material Thickness 0.635
Chamber Height 20.32
Inside Diameter 45.72
Flange & Plate Outside Diameter 57.15
Teeth Length 1.905
Chamber Area (m2) 0.164
Chamber Volume (L) 33.36
In accordance with the design criteria, the chamber was constructed with interchangeable
parts so that it can function as either a closed or open bottom chamber with minimal adjustments.
These parts included top and bottom lids, as well as a serrated bottom piece. The only parts that
are not removable are the carrying handles as well as a pair of flanges that extend from the side
of the main body, 1.27 cm from the top and bottom rims of the chamber. We designed these
flanges to provide a platform for attaching the top and bottom pieces (i.e. the lid or teeth), and to
prevent the chamber from sinking too deeply into soft sediments. The carrying handles aid
transportation of the chamber.
11
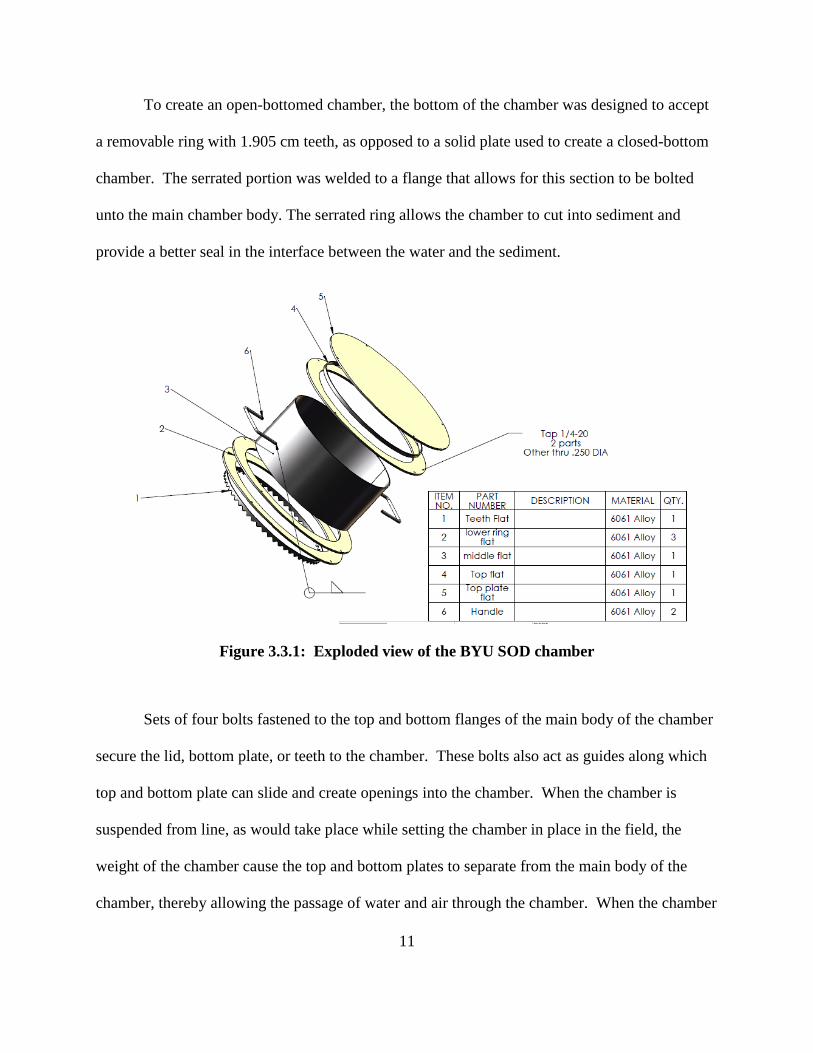
To create an open-bottomed chamber, the bottom of the chamber was designed to accept
a removable ring with 1.905 cm teeth, as opposed to a solid plate used to create a closed-bottom
chamber. The serrated portion was welded to a flange that allows for this section to be bolted
unto the main chamber body. The serrated ring allows the chamber to cut into sediment and
provide a better seal in the interface between the water and the sediment.
Figure 3.3.1: Exploded view of the BYU SOD chamber
Sets of four bolts fastened to the top and bottom flanges of the main body of the chamber
secure the lid, bottom plate, or teeth to the chamber. These bolts also act as guides along which
top and bottom plate can slide and create openings into the chamber. When the chamber is
suspended from line, as would take place while setting the chamber in place in the field, the
weight of the chamber cause the top and bottom plates to separate from the main body of the
chamber, thereby allowing the passage of water and air through the chamber. When the chamber
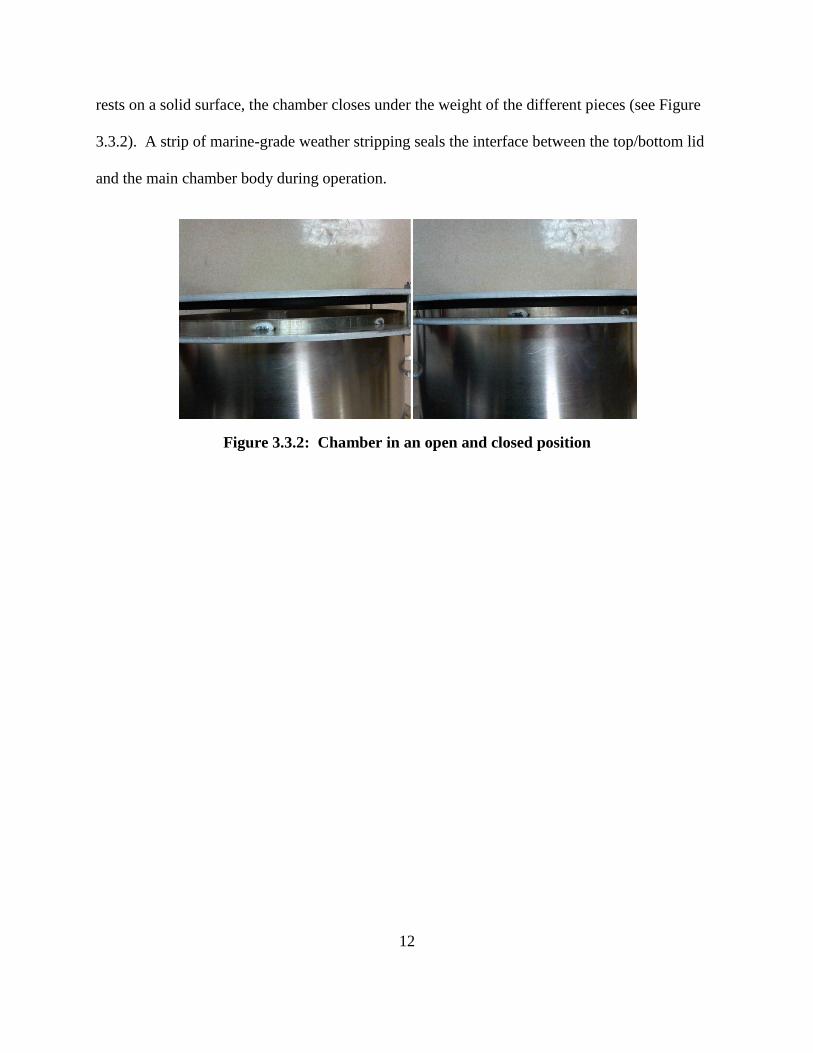
12
rests on a solid surface, the chamber closes under the weight of the different pieces (see Figure
3.3.2). A strip of marine-grade weather stripping seals the interface between the top/bottom lid
and the main chamber body during operation.
Figure 3.3.2: Chamber in an open and closed position
13
4 PRELIMINARY TESTS
In order to test the functionality and integrity of the SOD chamber prior to use in the
field, I conducted a series of laboratory tests. These tests were conducted in a laboratory in order
to reduce the affects of changing environmental conditions. The first test involved submerging
the SOD chambers in water in order to test the mechanical functionality of the chamber.
The second test was conducted to determine whether sediment oxygen demand can be
measured with the chambers. Water and sediment samples from Deer Creek Reservoir were
collected and used for this second set of tests. These samples were placed in a basin and the
uptake of oxygen by the sediment was monitored using the chambers. I also collected water
samples from within the chambers while conducting the SOD tests, from which I measured
phosphate concentrations of the water isolated by the chambers.
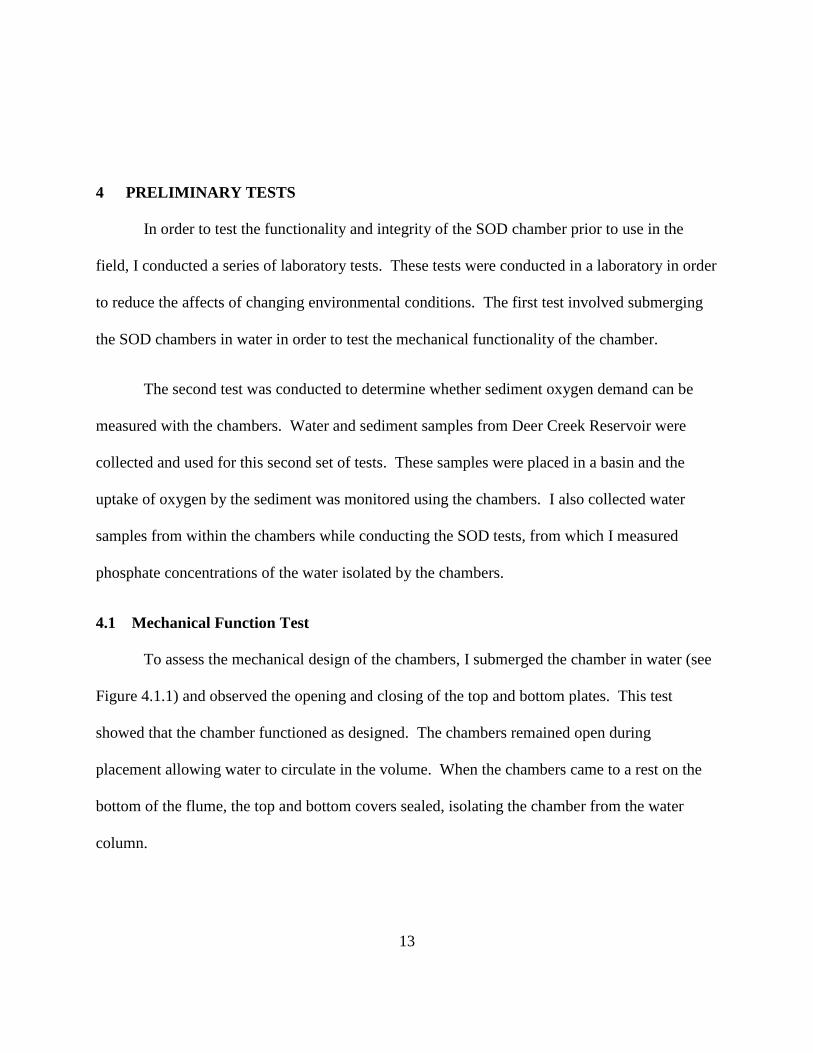
4.1 Mechanical Function Test
To assess the mechanical design of the chambers, I submerged the chamber in water (see
Figure 4.1.1) and observed the opening and closing of the top and bottom plates. This test
showed that the chamber functioned as designed. The chambers remained open during
placement allowing water to circulate in the volume. When the chambers came to a rest on the
bottom of the flume, the top and bottom covers sealed, isolating the chamber from the water
column.

14
Figure 4.1.1: Closed-bottom chamber submerged
4.2 SOD Test
I collected sediment exposed during a low water level time of the year (Oct.) from the
following coordinates: Sample A--40˚ 28’ 24.30” N 111˚ 28’ 27.38” W; Sample B--40˚ 27’
21.76” N 111˚ 28’ 20.92” W. Only the top three centimeters of exposed sediment were
collected. Through loss on ignition tests of the sediment samples, I determined that the organic
content for Sample A and Sample B was 10.1% and 0.5% dry weight, respectively. I also
collected water directly from the reservoir for use during testing. In a lab, I placed the water and
sediment in a basin, creating a layer of sediment approximately 3 cm thick, with 15.25 cm of
overlying water. I used sand (free of organic material) as a control sediment. Sediments from
each sample site and the control sand were kept separated within the basin in order to facilitate
three separate SOD tests.
I equipped the chambers with Hach LDO101 (optical) probes to measure DO. Galvanic
or membrane style DO probes were considered for use, but earlier uses of such DO probes
indicated that galvanic probes produce inconsistent measurements in environments were stirring
15
is not constant. After placing the chambers on top of the sediment layer, I measured the DO
concentrations inside the open and closed-bottom chambers simultaneously on five minute
intervals for periods of at least five hours. No stirring occurred inside the chamber during
testing. This test was performed twice on each sample and the control within a 48 hour period.
Figure 4.2.1 depicts the chambers during the SOD tests. (Note: due to size limitations of the
basin used, the SOD chambers were not fully submerged during these tests)
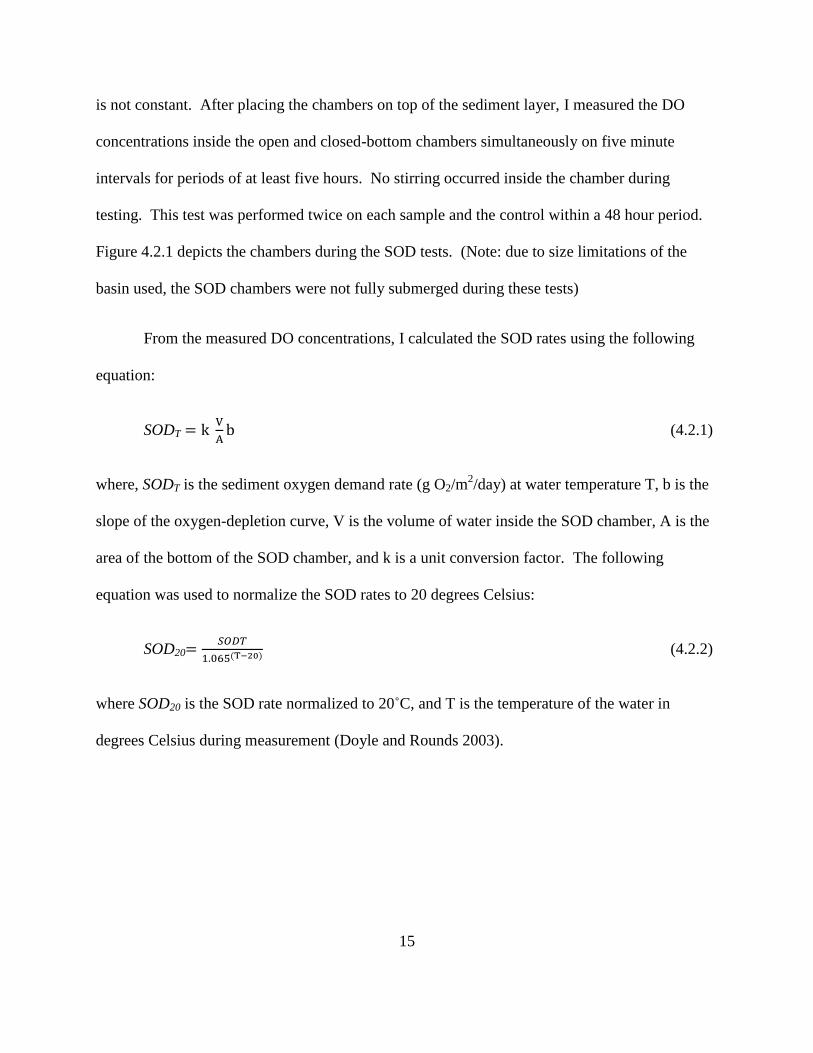
From the measured DO concentrations, I calculated the SOD rates using the following
equation:
SODT
(4.2.1)
where, SODT is the sediment oxygen demand rate (g O2/m2/day) at water temperature T, b is the
slope of the oxygen-depletion curve, V is the volume of water inside the SOD chamber, A is the
area of the bottom of the SOD chamber, and k is a unit conversion factor. The following
equation was used to normalize the SOD rates to 20 degrees Celsius:
SOD20
(4.2.2)
where SOD20 is the SOD rate normalized to 20˚C, and T is the temperature of the water in
degrees Celsius during measurement (Doyle and Rounds 2003).
16
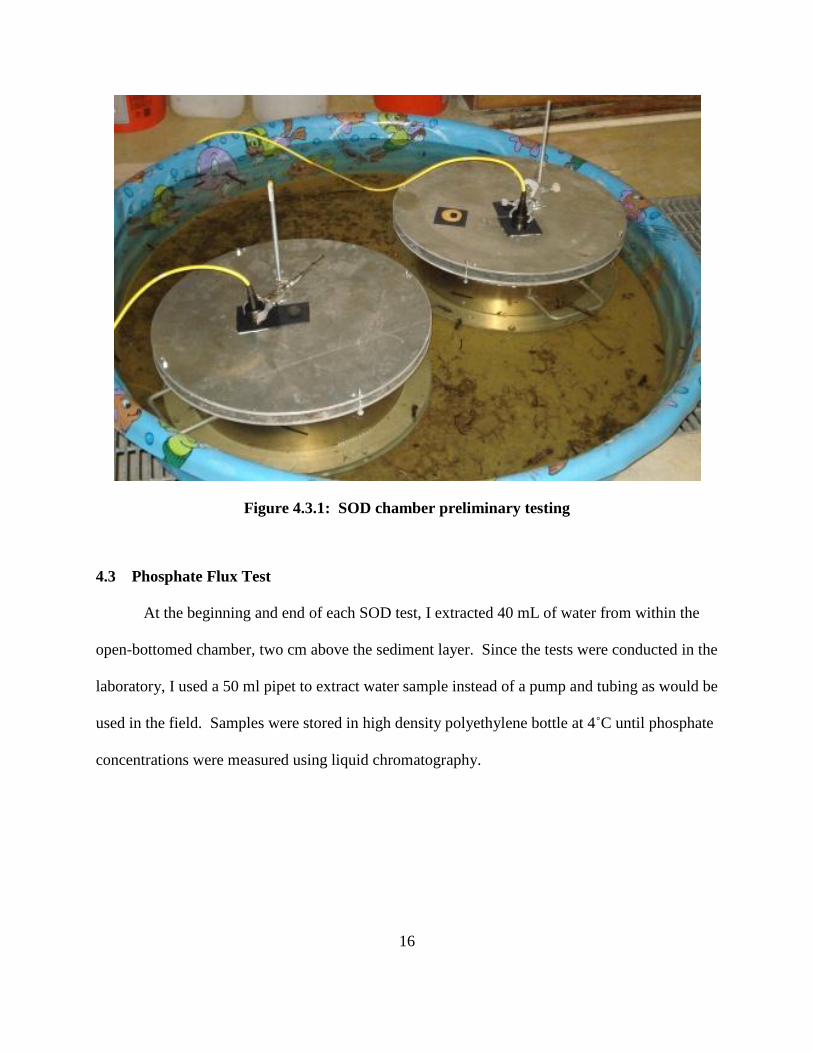
Figure 4.3.1: SOD chamber preliminary testing
4.3 Phosphate Flux Test
At the beginning and end of each SOD test, I extracted 40 mL of water from within the
open-bottomed chamber, two cm above the sediment layer. Since the tests were conducted in the
laboratory, I used a 50 ml pipet to extract water sample instead of a pump and tubing as would be
used in the field. Samples were stored in high density polyethylene bottle at 4˚C until phosphate
concentrations were measured using liquid chromatography.

17
5 RESULTS AND DISCUSSION
The results of the tests conducted gave us insight as to how our SOD chambers function
and how to adjust our methods for field tests. I could not infer that the laboratory measurements
of DCR sediments accurately represent actual rates of sediment oxygen demand and phosphate
flux in the reservoir because the tests did not accurately replicate conditions found at Deer Creek
Reservoir.
5.1 Mechanical Function Test Results
During the submersion of the chambers, I observed that the chambers performed as
designed. While lowering the chambers, the top or bottom plates remained open under their own
weight. This allowed water to flow through and air to be purged from the chamber. Upon
settling on the bottom, the weight of the chamber (or plate itself) caused the chamber to close.
Top (and bottom) plates remained properly aligned with the body of the chamber and formed a
seal. We did observe the bottom plate of the closed-bottom chamber partially closed when
submerged at a rate greater than approximately 8 cm/sec.
5.2 SOD Test Results
I observed patterns in the data collected from the SOD tests. One such pattern was the
irregular increase or decrease in DO during the first 45 minutes of testing (see Figure 5.2.1).
Such fluctuations were more pronounced in the testing of sediment Sample A. Some researchers
have suggested that a greater rate of DO consumption at the beginning of a test is the result of
the re-suspension of oxygen demanding material during the placement of testing devices

18
(Murphy and Hicks 1986). An increase followed by a steep decrease in the DO concentration
could also be the result of temporarily elevated DO concentration caused by stirring during the
placement of chamber into the water followed by the DO concentration returning to equilibrium.
Because such irregularities occurred during our SOD tests, the first 45 minutes of data for each
test was omitted from the calculated values presented in Table 5.2.1.
Figure 5.2.1: Irregular change of DO concentrations during SOD preliminary test
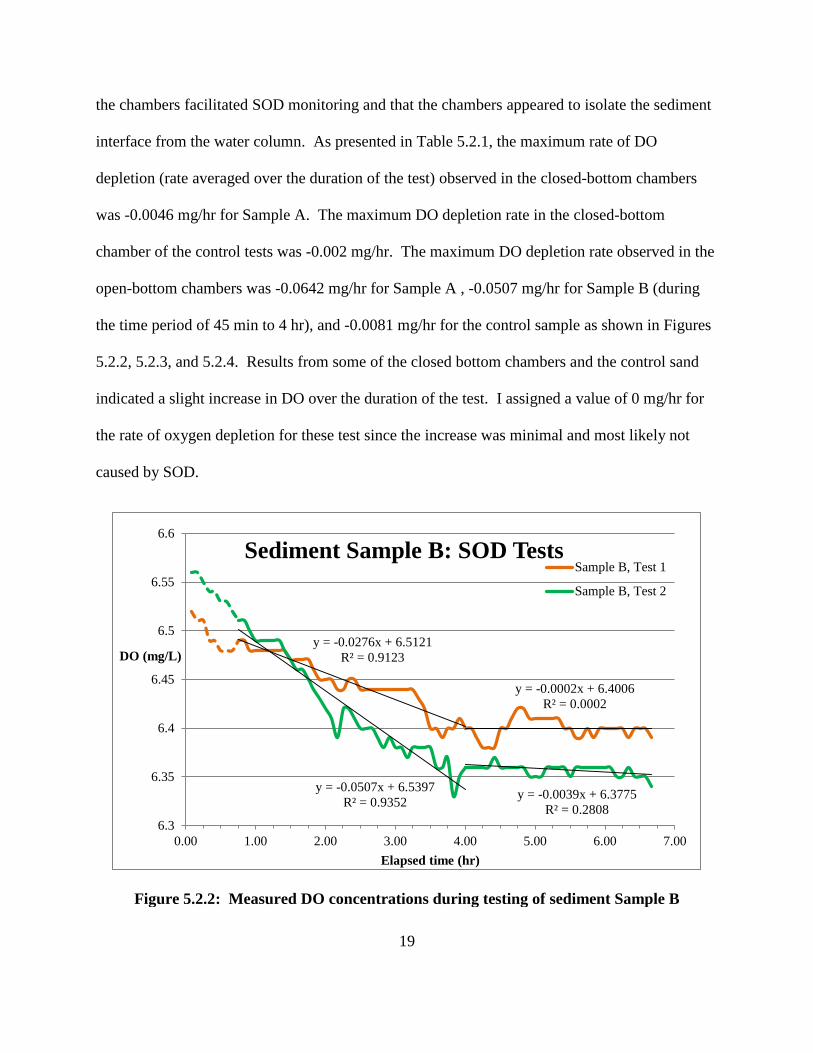
I also observed during both tests of Sample B, near the four hour mark, the rate of DO
depletion decreased from -0.0276 to -0.0002 mg/hr, and from -0.0507 to -0.0039 mg/hr (see Fig.
5.2.2 and Table 5.2.1). This rate change near the four hour mark could have resulted from the
supply of reducible material at the water-sediment interface being depleted and one source of
SOD being removed from the system.
Each SOD test showed that more oxygen was consumed in the open-bottom SOD
chamber than in the closed-bottom chamber (see Figure 5.2.1). This indicated that the design of
y = -0.0642x + 6.6987
R² = 0.9432
6.3
6.4
6.5
6.6
6.7
6.8
6.9
7
0.00 1.00 2.00 3.00 4.00 5.00 6.00
DO (mg/L)
Elapsed Time (hr)
Sample A: SOD Test 1
Open-bottom chamber
Closed-bottom chamber
19
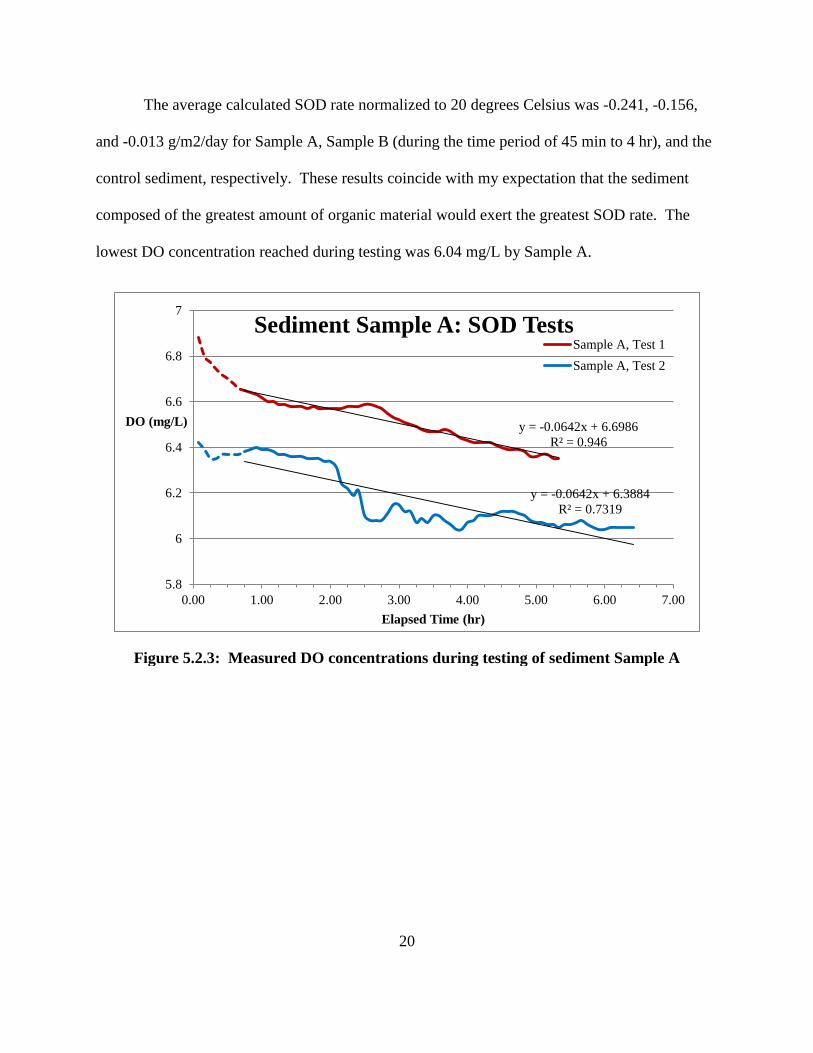
the chambers facilitated SOD monitoring and that the chambers appeared to isolate the sediment
interface from the water column. As presented in Table 5.2.1, the maximum rate of DO
depletion (rate averaged over the duration of the test) observed in the closed-bottom chambers
was -0.0046 mg/hr for Sample A. The maximum DO depletion rate in the closed-bottom
chamber of the control tests was -0.002 mg/hr. The maximum DO depletion rate observed in the
open-bottom chambers was -0.0642 mg/hr for Sample A , -0.0507 mg/hr for Sample B (during
the time period of 45 min to 4 hr), and -0.0081 mg/hr for the control sample as shown in Figures
5.2.2, 5.2.3, and 5.2.4. Results from some of the closed bottom chambers and the control sand
indicated a slight increase in DO over the duration of the test. I assigned a value of 0 mg/hr for
the rate of oxygen depletion for these test since the increase was minimal and most likely not
caused by SOD.
Figure 5.2.2: Measured DO concentrations during testing of sediment Sample B
y = -0.0276x + 6.5121
R² = 0.9123
y = -0.0002x + 6.4006
R² = 0.0002
y = -0.0507x + 6.5397
R² = 0.9352 y = -0.0039x + 6.3775
R² = 0.2808
6.3
6.35
6.4
6.45
6.5
6.55
6.6
0.00 1.00 2.00 3.00 4.00 5.00 6.00 7.00
DO (mg/L)
Elapsed time (hr)
Sediment Sample B: SOD Tests Sample B, Test 1
Sample B, Test 2
20
The average calculated SOD rate normalized to 20 degrees Celsius was -0.241, -0.156,
and -0.013 g/m2/day for Sample A, Sample B (during the time period of 45 min to 4 hr), and the
control sediment, respectively. These results coincide with my expectation that the sediment
composed of the greatest amount of organic material would exert the greatest SOD rate. The
lowest DO concentration reached during testing was 6.04 mg/L by Sample A.
Figure 5.2.3: Measured DO concentrations during testing of sediment Sample A
y = -0.0642x + 6.6986
R² = 0.946
y = -0.0642x + 6.3884
R² = 0.7319
5.8
6
6.2
6.4
6.6
6.8
7
0.00 1.00 2.00 3.00 4.00 5.00 6.00 7.00
DO (mg/L)
Elapsed Time (hr)
Sediment Sample A: SOD Tests Sample A, Test 1
Sample A, Test 2

21
Figure 5.2.4: Measured DO concentrations during testing of control sand
Table 5.2.1: Quantities calculated from SOD tests
Sample and
Test
Closed-bottom DO
depletion rate
(mg/hr)
Open-bottom DO
depletion rate
(mg/hr) SOD20 (g/m2/day)
Control-1 0 0 0
Control-2 -0.002 -0.0081 0.025
A-1 -0.0046 -0.0642 0.230
A-2 -0.0044 -0.0642 0.252
B-1.1 -0.0007 -0.0276 0.110
B-2.1 0 -0.0507 0.205
B-1.2 -0.0007 -0.0002 0.001
B-2.2 0 -0.0039 0.016
y = 0.0023x + 6.4923
R² = 0.0267
y = -0.0081x + 6.3256
R² = 0.8349
6.2
6.25
6.3
6.35
6.4
6.45
6.5
6.55
6.6
6.65
0.00 1.00 2.00 3.00 4.00 5.00 6.00 7.00 8.00 9.00
DO (mg/L)
Elapsed Time (hr)
Control Sand: SOD Tests Control, Test 1
Control, Test 2

22
5.3 Phosphate Flux Test Results
The phosphate concentrations in all water samples tested were below the detectable limit
(~ 0.03mg/L) of the liquid chromatograph method that I used for analysis. A minimum of 0.75
mg of phosphates would have had to diffuse into the chamber water in order for concentration of
the entire volume of water (25.02 L) isolated by the chamber to increase to detectable levels.
Based off of the rates of diffusion from Table 2.2.1, it would have taken approximately 2.22
hours after the phosphate dissolved for 0.75 mg of phosphate to diffuse into the water column.
As shown by the figures, anoxic conditions had not been reached by the end of the tests. If the
tests had been extended, I expect I would have measured phosphates at some period after anoxic
DO levels were reached. However, because the observed oxygen concentrations were
approximately one order of magnitude higher than concentrations at which Ruban observed
nutrient and metal fluxes (0.5 mg/L), it is likely that phosphate did not become soluble during the
preliminary tests (Ruban and Demare 1998).

23
6 CONCLUSIONS
The mechanical functionality test and the SOD tests conducted indicated that the SOD
chamber we constructed are functional and can be used to quantify the rate of oxygen
consumption by sediments. Tests demonstrated the chambers ability to open and close properly
once submerged without direct contact from an operator. This suggested that the chambers
could be deployed from a boat or in depths of water without a SCUBA diver present to start the
monitoring. However, the closed-bottom chamber should be lowered into the water at a rate
slower than approximately 8 cm/s to prevent the bottom plate of the chamber from closing.
The observable different rates of DO consumption for different sediment types measured
during the preliminary SOD tests indicated that the SOD chambers can be used to monitor SOD.
Patterns of DO depletion rate change at the beginning of SOD monitoring suggest that further
SOD tests should run at least 45 minutes to account for disturbances to the sediment made while
setting the chamber in place. Additionally, sediments with similar characteristic to Sample B
might not require testing for more than four hours to quantify the maximum SOD rate. While I
did not observe phosphorus flux during the SOD tests, the chamber provided a good platform for
conducting the tests. Future testing of phosphate flux should account for the time necessary for
the diffusion of phosphate and the time necessary for SOD to deplete the DO concentration to
approximately 0.5 mg/L.

24
25
REFERENCES
Casbeer, W.C. Phosphorus fractionation and distribution across delta of Deer Creek Reservoir.
Master's Thesis, Brigham Young University, Provo: Brigham Young University, 2009.
Domenico, P.A., Schwartz, F.W. Physical and Chemical Hydrogeology. New York, NY: John
Wiley & Sons, Inc., 1997.
Doyle, M.C., and S.A. Rounds. "The effect of chamber mixing velocity on bias in measurement
of sediment oxygen demand rates in the Tualatin River Basin." U.S. Geological Survey
Water-Resources Investigations Report 03-4097, 2003.
Mackenthun, A.A., and H.G. Stefan. "Effect of flow velocity on sediment oxygen demand:
Experiments." 1998, 222-231.
Murphy, P.J., and D.B. Hicks. "In-situ method for measuring sediment oxygen demand." In
Sediment oxygen demand--Processes, modeling, and measurement, by K.J. Hatcher, 307-
322. Athens, GA: Institute of Natural Resources, Unversity of Georgia, 1986.
Parsons, M. Sediment oxygen demand operating prodecures. U.S. EPA, 2007, 1-12.
PSOMAS. Deer Creek Reservoir Drainage TMDL Study. Salt Lake City: PSOMAS, 2002.
Ruban, V., and D. Demare. Sediiment phosphorus and internal phosphate flux in the
hydroelectric reservoir of Bort-les-Orgues, France. Springer Netherlands, 1998, 349-359.