Sediment modeling workshop - Home Page | … modeling workshop ... CA. February 25, 2016. “Erosion...
29
Sediment modeling workshop Napoleon Gudino Elizondo Dr. Thomas Kretzschmar Dr. Trent Biggs Committee members: Dr. Rogelio Vazquez, Dr. Douglas Stow, and Dr. Mathias Hinderer. Imperial beach, CA. February 25, 2016. “Erosion and sedimentation processes in the Tijuana River Watershed” Case study: Los Laureles Canyon Doctoral Thesis in Environmental Geosciences
Transcript of Sediment modeling workshop - Home Page | … modeling workshop ... CA. February 25, 2016. “Erosion...

Sediment modeling workshop
Napoleon Gudino Elizondo
Dr. Thomas Kretzschmar Dr. Trent Biggs
Committee members: Dr. Rogelio Vazquez, Dr. Douglas Stow, and Dr. Mathias Hinderer.
Imperial beach, CA. February 25, 2016.
“Erosion and sedimentation processes in the Tijuana River Watershed” Case study: Los Laureles Canyon
Doctoral Thesis in Environmental Geosciences

Motivation
Management
• Infrastructure hazards control at LLC.
• Sedimentation at the Tijuana Estuary.
• Difficult to estimate sediment budgets on a complex watershed.
Scientific
• Very little known of urban sediment budget in developing countries.
• Contribution of channel and gully erosion to sediment budget in LLC.
• The role of geology, soil characteristics and land use.
In a trans border watershed…
How to quantify and model?
Objectives
1. Assess the contribution of hillslope and gully erosion to total sediment loads under current conditions.
2. Quantify impacts of future land managements/BMP’s on runoff and sediment production.
3. Rapid mapping of ultrafine gully initiation topography using 3D Photo reconstruction.

Tijuana River Watershed
MEX-USA BORDER
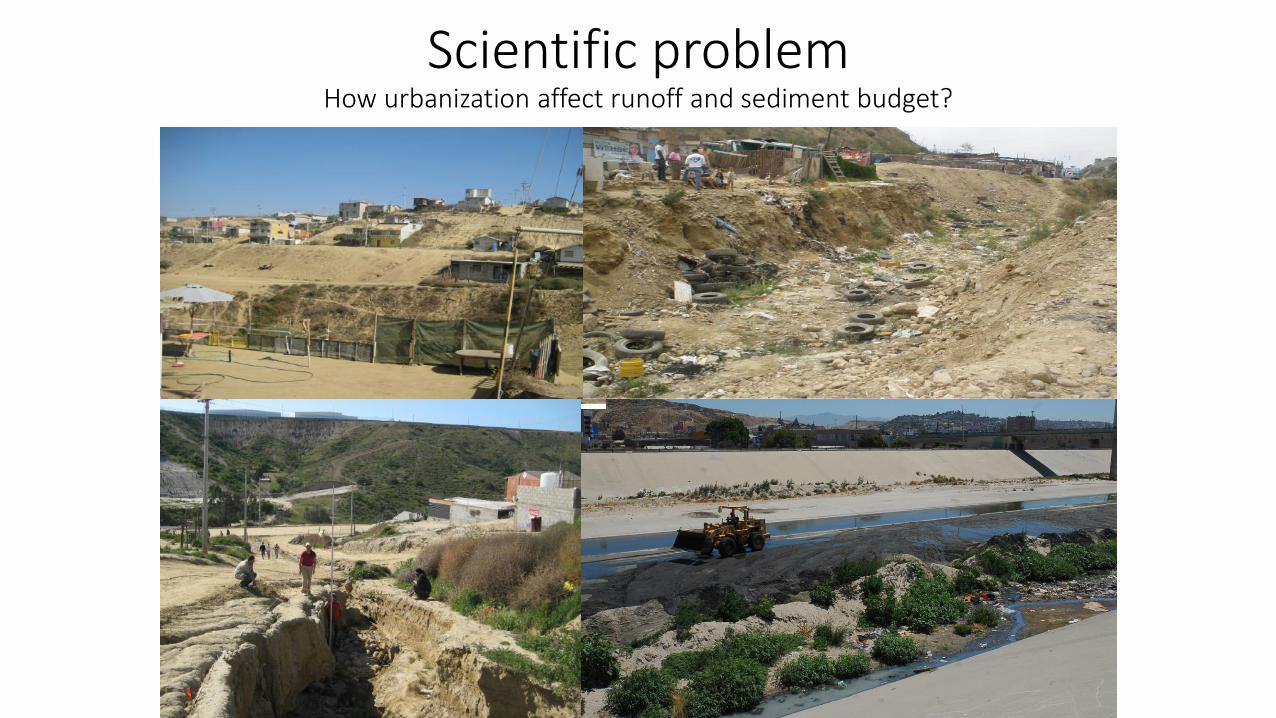
Scientific problem How urbanization affect runoff and sediment budget?
1. Assess the contribution of hillslope and gully erosion to total sediment loads under current conditions.
Method: AnnAGNPS Model
+ Field measurements

Los Laureles Canyon Watershed
1147Cells; 462 Reaches. Simulated Gully Locations on Unpaved Roads
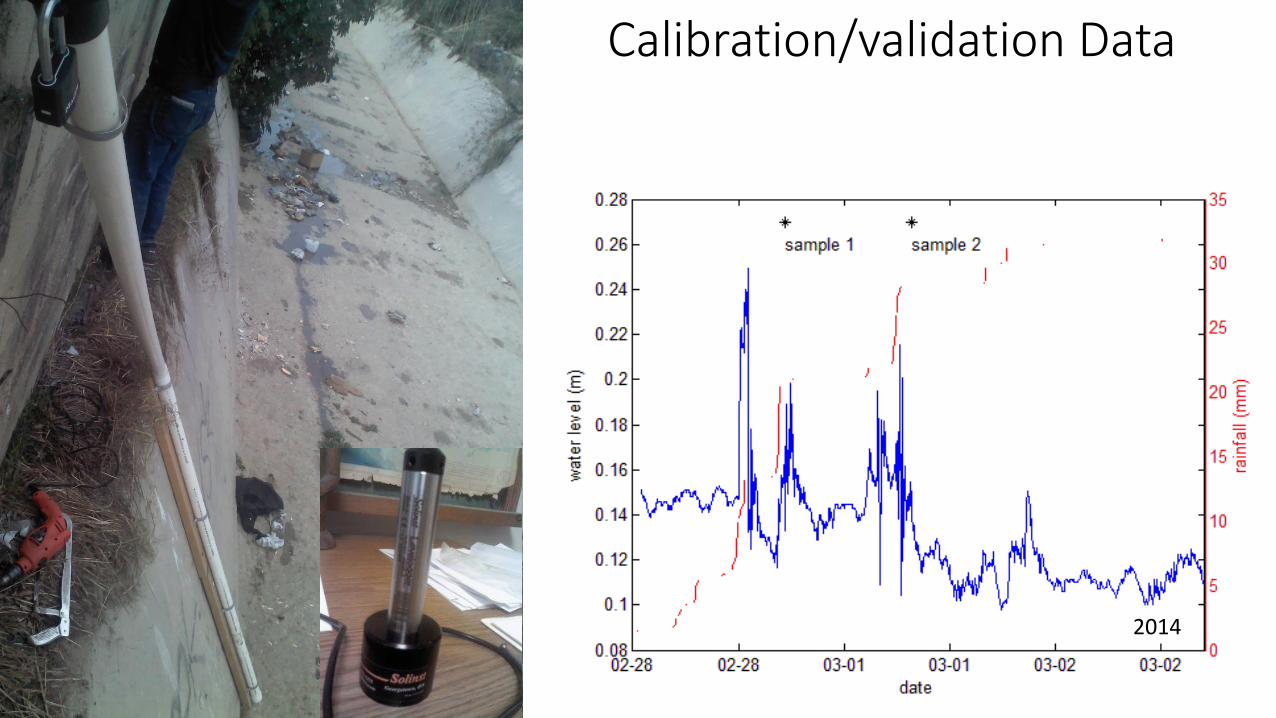
Calibration/validation Data
0
2
4
6
8
10
12
14
16
18
0 0.05 0.1 0.15 0.2 0.25 0.3 0.35
Dis
char
ge (
m3
/s)
Stage (m)
Curva de gastos en la salida de la cuenca
2014

Discharge (cameras)

Suspended sediment samples • Taken around the PT station:
Sample # Date Time Concentration (g/l)
Discharge (m3/seg)
Sediment Load (kg/s)
1 03-01-2015 7:19am 15.2 6.7 101.5
2 03-01-2015 12:39pm 19.4 3.8 74.2
3 03-01-2015 17:46pm 13.7 3.7 51.2
4 03-02-2015 8:40am 3.2 4.2 13.6
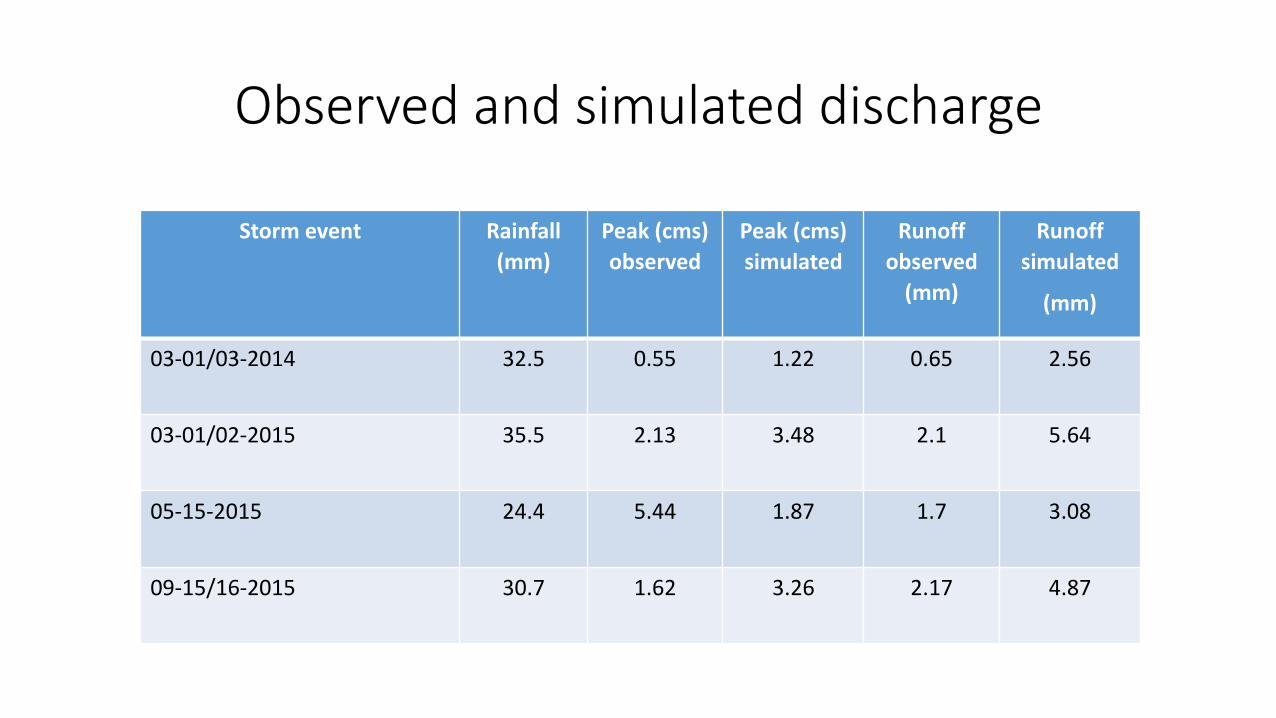
Observed and simulated discharge
Storm event Rainfall
(mm)
Peak (cms)
observed
Peak (cms)
simulated
Runoff
observed
(mm)
Runoff
simulated
(mm)
03-01/03-2014 32.5 0.55 1.22 0.65 2.56
03-01/02-2015 35.5 2.13 3.48 2.1 5.64
05-15-2015 24.4 5.44 1.87 1.7 3.08
09-15/16-2015 30.7 1.62 3.26 2.17 4.87

Validation (Sed traps at the outlet)
Table 2. Observed and modelled annual sediment yield at the outlet of Los
Laureles Canyon from AnnAGNPS, under current conditions.
All values in tons per water year (Oct2005-Sept2010)
Water year AnnAGNPS, sum
of input to
channels
Observed in trap at
outlet (US side)
Relative error (%)
2006 7193 31920 23
2007 37337 31920 116
2008 21313 51072 42
2009 120178 76608 156
2010 57173 70224 82 USA
MEX

Runoff (mm)
Peak Discharge (cms)
Total Sediment (t/ha)
Sheet & Rill Sediment (t/ha)
Gully Sediment (t/ha)
Channel erosion (t/ha)
Current Conditions
26.5 2.4 7.48 3.90 2.16 1.42
All Paved Roads
31 2.7 5.84 4.14 0.0 1.70
Loads to the Outlet by Source & Scenario
0
10
20
30
40
50
60
70
80
90
100
0 10 20 30 40 50 60 70 80 90 100
Co
ntr
ibu
ted
Lo
ad (
%)
Contributing Drainage Area (%)
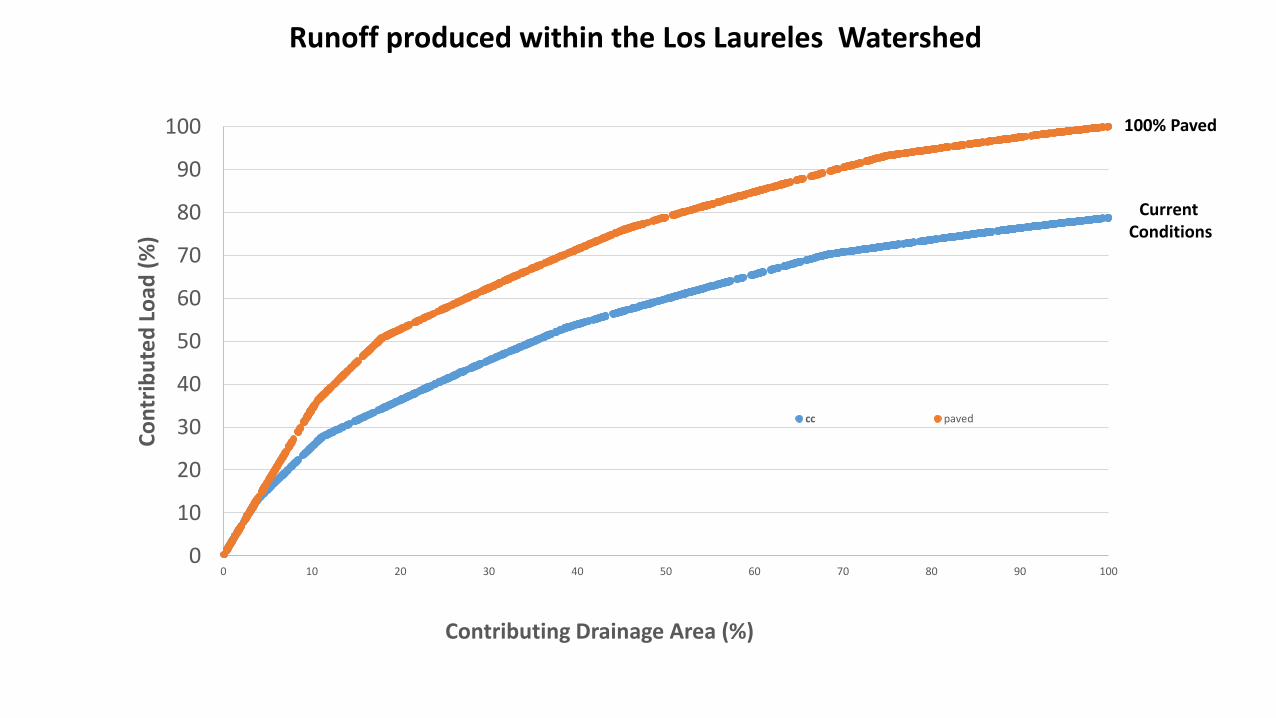
Runoff produced within the Los Laureles Watershed
cc paved
100% Paved
Current Conditions

0
10
20
30
40
50
60
70
80
90
100
0 10 20 30 40 50 60 70 80 90 100
Co
ntr
ibu
ted
Lo
ad (
%)
Contributing Drainage Area (%)
Total Sediment Production within the Los Laureles Watershed
cc paved
100% Paved
Current Conditions
16%
16% of the watershed produces 50% of the Current Conditions
sediment load
Paving all current unpaved roads reduces sediment load by 42%

Total Sediment Load – LL Watershed Current Conditions
Total Sediment Load – LL Watershed All Paved Roads
N
sedcc_spa
Cell_Load_by_Mass_Mg_per_yr
0 - 2
2 - 6
6 - 13
13 - 30
30 - 60

Total Sediment Load – LL Watershed Current Conditions
Areas Simulated Producing 50% of the Total Sediment Load
N
sedcc_spa
Cell_Load_by_Mass_Mg_per_yr
0 - 2
2 - 6
6 - 13
13 - 30
30 - 60

Total Sediment Load LL Watershed
Current Conditions
Total Sediment Load Reduction % Difference Between Current Conditions & All Paved Roads
Total Sediment Load LL Watershed
All Paved Roads
100% 0% N

Gully monitoring

Gully distribution along LLCW
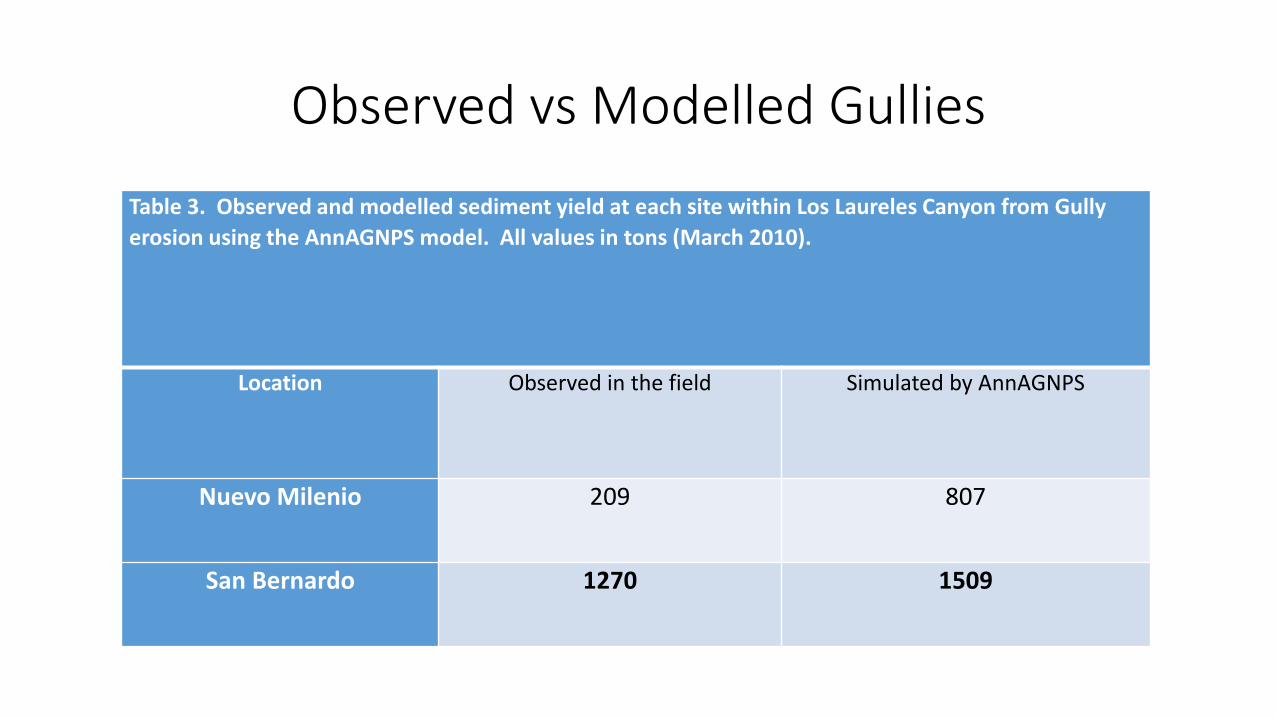
Observed vs Modelled Gullies
Table 3. Observed and modelled sediment yield at each site within Los Laureles Canyon from Gully
erosion using the AnnAGNPS model. All values in tons (March 2010).
Location Observed in the field Simulated by AnnAGNPS
Nuevo Milenio 209 807
San Bernardo 1270 1509

Chapter 2:
• Rapid mapping of ultrafine gully initiation topography using 3DPR on a developing watershed in Tijuana Mexico.
Objectives:
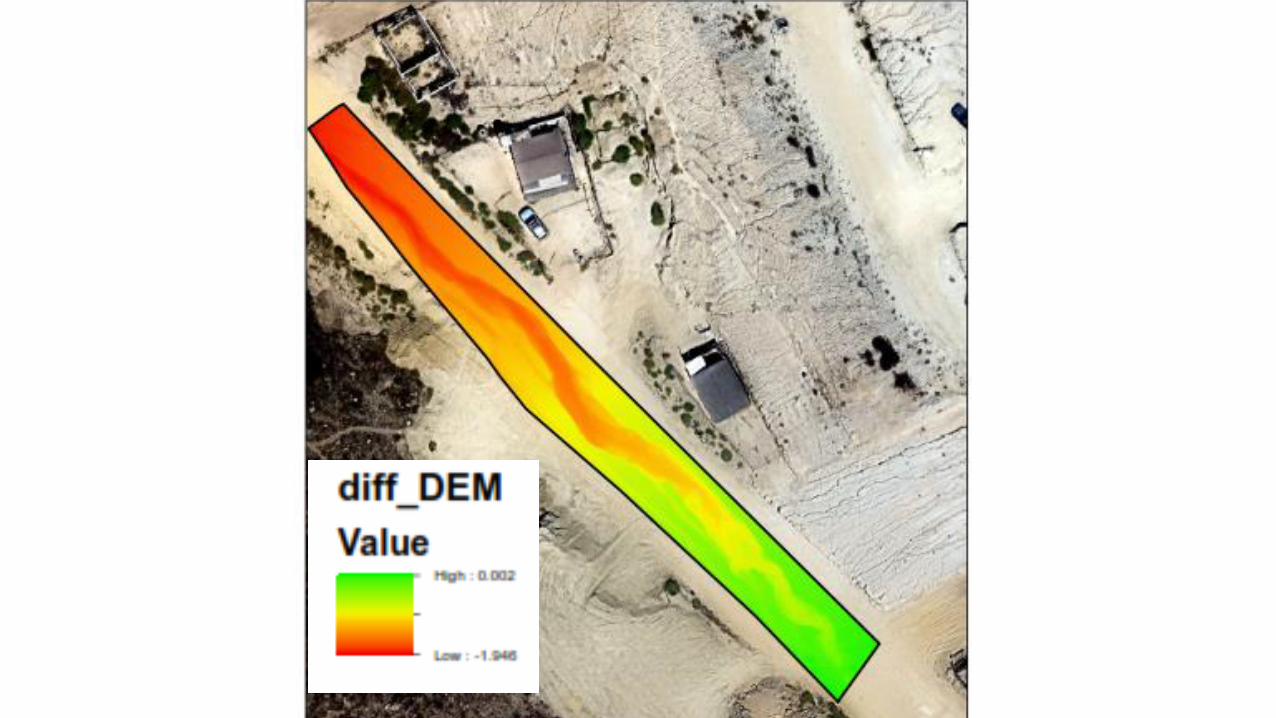
3D Photo-reconstruction and quantitative measurement of soil erosion from UAV data during a single storm at LLC Watershed.
Spatial distribution of gully initiation within the LLC Watershed.

3D Photo-reconstruction (structure from motion)
Ground Control Points dGPS
Point cloud (AGIsoft)
Drone (DJI phantom2)
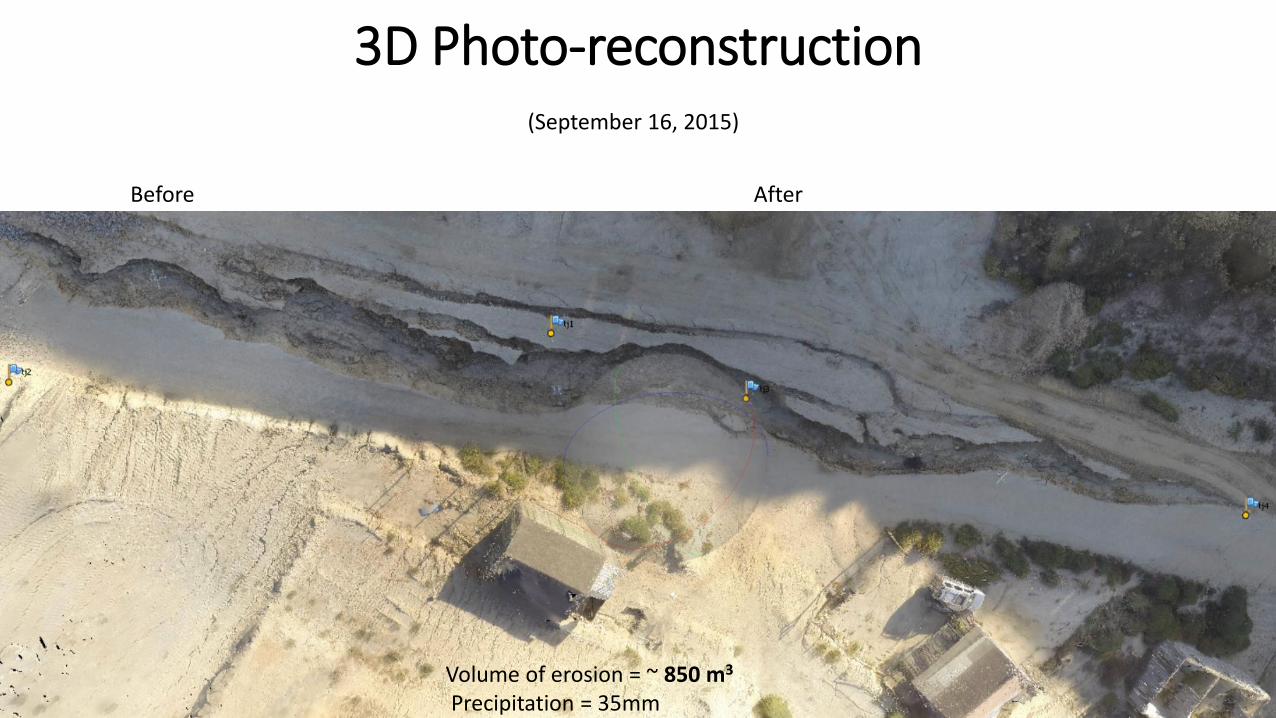
3D Photo-reconstruction
Before After
Volume of erosion = ~ 850 m3 Precipitation = 35mm
(September 16, 2015)
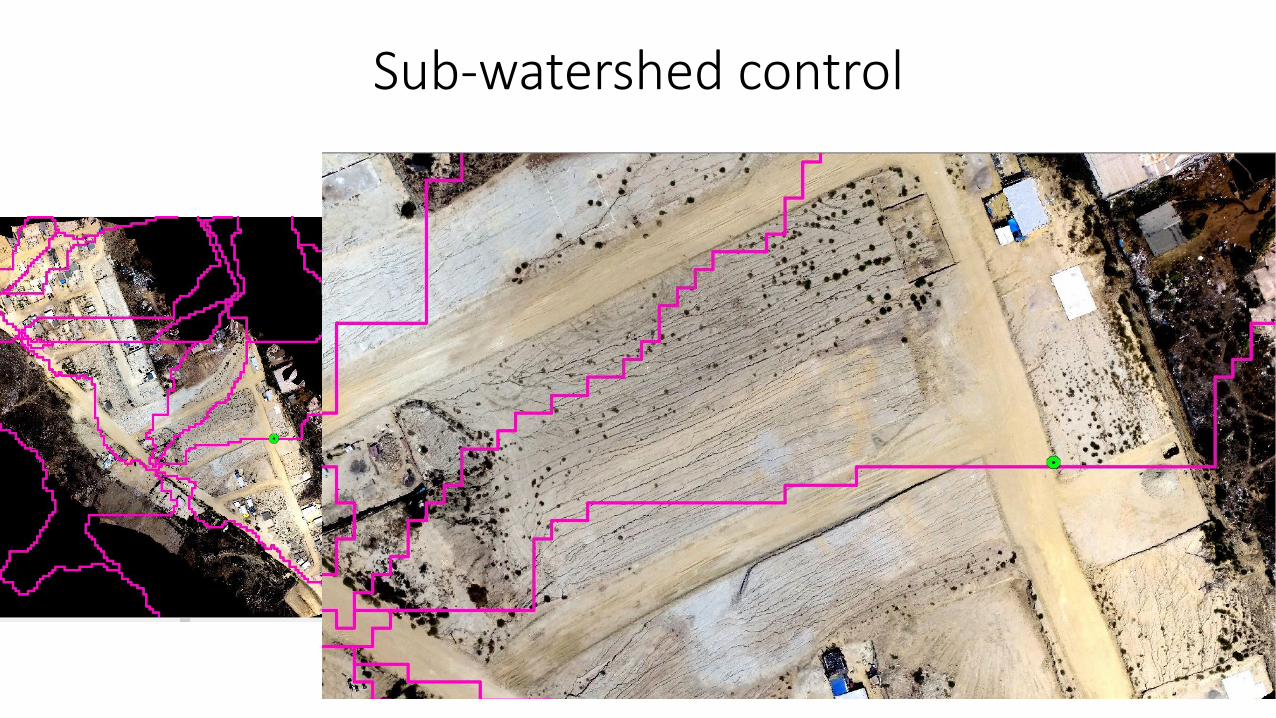
Sub-watershed control

Gully inventory based on drone surveys
San Bernardo

Next steps
• Monitoring more runoff events
• Better calibrate the model
• Additional scenarios for BMP’s evaluations • Pervious pavement
• Revegetation of hillslopes

Muchas gracias