Security of Supply Risk of Energy Availability
121
Security of Supply & Risk of Energy Availability Based on the proceedings of the 1 st International Conference (1 st IC) of the FP7 project: “Risk of Energy Availability: Common Corridors for Europe Supply Security” (REACCESS)”, held in Turin, Italy on the 29 h of February 2008 Athens, June 2008
Transcript of Security of Supply Risk of Energy Availability
Security of Supply &
Risk of Energy Availability
Based on the proceedings of the
1st International Conference (1st IC) of the FP7 project:
“Risk of Energy Availability: Common Corridors for Europe Supply
Security” (REACCESS)”,
held in Turin, Italy on the 29h of February 2008
Athens, June 2008
Security of Supply & Risk of Energy Availability
Editors: Haris Doukas, Alexandros Flamos & John Psarras Page 2
The content of the book is based on the proceedings of the 1st International Conference (1st IC) of the FP7 project: “Risk of Energy Availability: Common Corridors for Europe Supply Security” (acronym: REACCESS) that was held in Turin, Italy on the 29h of February 2008. The REACCESS project aims to build tools suitable for EU27+ energy import scenario analyses, able to take into account at the same time the technical, economic and environmental aspects of the main energy corridors, for all energy commodities and infrastructures. The consortium partners of the FP7 project REACCESS are the following: • Politecnico di Torino, POLITO, Italy • Applied Systems Analyses, Technology and Research, Energy Models, ASATREM, Italy • Climate Change Coordination Center, CCCC, Kazakhstan • Centro de Investigaciones Energeticas, Medioambientales y Tecnologicas, CIEMAT, Spain • Deutsches Zentrum für Luft und Raumfahrt, German Aerospace Center, DLR, Germany • Kanlo Consultants, KANLO, France • Institute for the Economy in Transition, IET, Russia • Institute of Energy Technology, IFE, Norway • National Technical University of Athens, NTUA – EPU, Greece • Austrian Research Centres – Research Studios Austria, ARC, Austria • Fundacion General de la Universidad Nacional de Educaciòn a Distancia, F-UNED, Spain • Valtion Teknillinen Tutkimuskeskus , Technical Research Centre of Finland, VTT, Finland • University of Stuttgart, USTUTT, Germany • Institute of Methodologies For Environmental Analysis, CNR–IMAA, Italy
The editors would like to thank the project coordinator, Professor Evasio Lavagno and all members of the POLITO team for their excellent work in the organization and successful implementation of the 1st IC; the project officer Mr. Mathieu GRISEL for his fruitful participation and comments; The speakers for their keynote presentations and all the participants for their observations that facilitated the fruitful dialogue. Finally the editors would like to thank Mr. Kourlimpinis for designing the book cover. The editors would like to acknowledge the support from the European Commission (EC) who is financing the FP7 project REACCESS – Grant agreement no. 212011 and the project 05AKMΩΝ95 of Institute of Communication & Computer Systems (ICCS) for financing the publishing costs. 05AKMΩΝ95 is co funded by the European Union - ERDF (70%) and the Greek National Resources (30%) within the framework of Measure 4.2 of the Operation Programme "Competitiveness" of the 3rd CSF. The content of this book is the sole responsibility of its authors and editors and does not necessarily reflect the views of the EC. The authors of the chapters and the editors reserve the copyright of their work. No part of this publication or the information contained herein may be reproduced, stored in a retrieval system, or transmitted in any form or by any means, electronic, mechanical, by photocopying, recording or otherwise, without written prior permission from the authors. Published by: Bookstars-Gioggaras Elaion 34, 14564 N.Kifissia www.bookstars.gr Tel: +302108072643 ISBN: 978-960-6815-04-1

FOREWORD Demand for energy never ceases. There are no doubts that the European Union will continue to remain strongly dependent on imports and that will be more and more dependent in the future. Apart from the European strong dependence issue, another relevant issue involves the reliability of the infrastructures (for extraction, primary processing and transport to EU), as far as likely accidents and terrorist attacks are concerned. In addition to the import of primary sources, also the import of electricity will be relevant as many new interconnections are at several stages (identification, planning, development, implementation, etc.). Moreover, the concern related to the availability and the reliability of these supplies is associated with the burdens and the environmental impacts that such large and complex infrastructures have on the territories involved, outside as well as inside Europe. The Paper on “International relations and security of energy supply: risks to continuity and geopolitical risks” recently published by the Policy Department of the Directorate General External Policies of the Union states that “if Europe is to pursue a single, coordinated and efficient energy policy, a comprehensive policy framework will have to be designed as a tool for the energy sector to take up the challenges of employment generating economic growth, minimize dependence on external supplies and – at the same time – meet environmental targets, e.g. under the Kyoto Protocol”. In order to ensure, to the extent that is possible, a secure energy market, makes essential to adopt and understand that International co-operation on energy security is a win-win outcome for all countries involved. To achieve this means moving away from the traditional perception that energy is a national security issue – it is a European security issue. Energy security may, also, have a price – political and economic. But one must be sure that the cost of energy security will be small compared with the alternatives – economic instability and geopolitical tension. This book contains the proceedings of the 1st International Conference on the “Risk of Energy Availability: Common Corridors for Europe Supply Security – REACCESS” project, held in Turin, Italy on the 29th of February 2008. As a project co-ordinator of this project I do hope that this book will contribute to realizing the necessity of further investigation of all the parameters affecting the smooth and uninterrupted energy supply to Europe, as well as, to identifying the alternative practices & policies, striving towards a more sustainable energy future.
Professor Evasio Lavagno
Politechnico di Torino (POLITO), Turin, Italy 19 May 2008
Security of Supply & Risk of Energy Availability
Editors: Haris Doukas, Alexandros Flamos & John Psarras Page 4
EDITORIAL
On 29th February 2008, the Politecnico di Torino organized the 1st International Conference on the “Risk of Energy Availability: Common Corridors for Europe Supply Security” in Turin. The main purpose of the Conference was to stimulate a free exchange of thought among academics, practitioners and policy makers on the key issue of security of supply and risk of energy availability. In this book, seven selected articles presented during the Conference plus one article giving an exploratory analysis of energy availability risks are brought together. Each illuminates one or more of the critical issues in security of supply policy and research. The first chapter is written by Paul Isbell & Federico Steinberg from the Elcano Royal Institute for International and Strategic Studies. They analyse main strategic dilemmas in relation with energy security faced by the EU import-dependent member countries. The new dimensions of energy security are explored and they are providing some suggestions for increasing security of supply and for fostering stability in the international energy system. In their conclusion, they highlight the risks for the world economic development as a result of competition in the energy sector. The second chapter is by Maria Flouri, Charikleia Karakosta, Haris Doukas & Alexandros Flamos from the laboratory of Management & Decision Support Systems of the National Technical University of Athens. They present and exploratory analysis of risks correlated to energy supply. The emphasis is given on the supply of oil and natural gas. Following the presentation of main energy disruptions, the most important risks identified are categorised according to their probability and expected impact. This analysis is a first step toward the assessment of risks affecting the smooth energy import to the EU. The third chapter is by Stefano Verde of RIE Ricerche Industriali ed Energetiche – Bologna. Taking into account the main objectives and targets of the EU energy policy, he focuses on the latest measures proposed by the EU institutions to promote renewable energies and energy efficiency and is trying to identify the main effects of these measures on the European energy security. A preliminary conclusion is made that the “EU 20-20-20 targets”, are able to positively contribute to the achievement of the security of supply objectives set by the EU. Nonetheless, attention has to be paid as this “positive correlation” is not straightforward and an optimal and balanced amount of new investments is required.
The fourth chapter is by GianCarlo Tosato, IEA/ETSAP – ASATREM Srl, Italy. He is presenting energy security from a system analysis point of view. Starting from the statement that “energy services security” extends the security of supply to the energy system as a whole he stresses the need that analyses should encompass all energy systems technologies and commodities. The risk aspects of the single points of the chains can be combined to form a “system risk”. Another important result is that the same system and analytical tool has to be used for analysing the effects of undesired events and remedial policies on all the three main objectives of energy policies: energy security, economic development and environment sustainability at the same time. His concluding remark is that attributing the responsibility of energy security to groups that will have to bare the main costs of less security would trigger the transition towards sustainability. The fifth chapter is by Franz Trieb from DLR – German Aerospace Center. He describes the perspective of a sustainable supply of electricity for Europe (EU), the Middle East (ME) and North Africa (NA) up to the year 2050. His study shows that a transition to competitive, secure and compatible supply is possible using renewable energy sources and efficiency gains, and fossil fuels as backup for balancing power. Of course, close cooperation between EU and MENA for market introduction of renewable energy and interconnection of electricity grids by high-voltage direct-current transmission are keys for the viability of such a plan and the necessary measures will take decades to be-come effective. Therefore, adequate policy, regulatory and economic frameworks for their realization have to be introduced immediately. The sixth chapter is by Kostis G. Perrakis from RAE – Regulatory Authority for Energy, Athens, Greece. He is providing an analysis on security of energy supply from the regulators side and highlights the priority to address the issue of security of electricity supply in a coherent and systematic way, from the regulatory perspective and taking into account all relevant impacts and dependencies. The chapter is concluding with the need to develop suitable indexes-signals for each category of actors involved (regulators, TSOs, generators, consumers, etc) for the continuous monitoring and forecasting of the energy security of supply. In following chapter, George Giannakidis from CRES – Centre for Renewable Energy Sources, Greece, is analysing the need for continuous monitoring and evaluation of the RES directives implementation in the EU27 and their impacts to the security of energy supply. In this framework, an overview of the FP7 RES2020 project is provided and its main aims are analysed. Finally, the need to define future options for policies and measures by calculating concrete targets for the RES contribution that can be achieved by the implementation of these options and the examination of all the implications of the achievement of these targets to the European Economy is highlighted.

Security of Supply & Risk of Energy Availability
Editors: Haris Doukas, Alexandros Flamos & John Psarras Page 6
In the last chapter, Antonio Lopez de Sebastian from UNESA – Asociacion Espanola de la Industria Electrica, Spain, is providing an exploratory analysis reagrding the place of cross-border interconnections in the European Energy Strategy and in particular, its connection with the most relevant concerns on the European energy policy: the fight against the climate change and the security of energy supply. In addition, he examines the specific singularity of the interconnectors as a weak element in Transmission Networks, the important role that the reinforcement of networks and interconnectors plays in security of supply and in markets development and expansion. Finally, particular emphasis is laid in the cases of the Medring and the Iberian Market. It is hoped that this special issue aligning latest practices, innovation and case studies with academic frameworks and theories provides you with information on critical parameters of the complex issue of security of energy supply and trigger regarding the need to develop tools for EU27+ energy import scenario analysis.
The Editors, Professor John Psarras, Dr. Alexandros Flamos & Haris Doukas
Management & Decision Support Systems Laboratory
National Technical University of Athens (NTUA), Greece 22 May 2008
Security of Supply & Risk of Energy Availability
Editors: Haris Doukas, Alexandros Flamos & John Psarras Page 7
TABLE OF CONTENTS
INTRODUCTION ............................................................................ 10 Chapter 1 ENERGY GEOPOLITICS AND ENERGY SECURITY.................... 14 1.1. ENERGY SECURITY: AN OVERVIEW................................................................ 15
1.2. ENERGY SECURITY AND THE ENERGY SUPPLY CHAIN............................... 17
1.3. DIVERSITY IS THE KEY...................................................................................... 21
Chapter 2 RISKS ON ENERGY SECURITY OF SUPPLY: AN EXPLORATORY ANALYSIS FOR THE RESEARCHER ........................................... 25 2.1. METHODOLOGICAL NOTES .............................................................................. 29
2.2. IDENTIFIED RELATED INCIDENTS.................................................................... 30
2.3. RISKS QUALITATIVE ASSESSMENT................................................................. 40
Chapter 3
SECURITY OF SUPPLY AND THE NEW EUROPEAN ENERGY POLICY .......................................................................................... 45 3.1. DEFINING AND ASSESSING ENERGY SECURITY .......................................... 47
3.2. EFFECTS OF A NEW ENERGY POLICY ON SUPPLY SECURITY ................... 50
Chapter 4 ENERGY SECURITY FROM A SYSTEMS ANALYSIS POINT OF VIEW: INTRODUCTORY REMARKS............................................. 56 4.1. AN EXTENDED CONCEPT OF ENERGY SECURITY........................................ 57
4.2. IDENTIFICATION OF THE EVENT SPACE......................................................... 58
4.3. THE PROBLEM OF QUANTIFYING THE RISK .................................................. 59
4.4. QUANTIFICATION OF THE DAMAGES.............................................................. 59
Security of Supply & Risk of Energy Availability
Editors: Haris Doukas, Alexandros Flamos & John Psarras Page 8
4.5. WHAT MAKES THE DAMAGE OF UNDESIRED EVENTS SO HIGH?............... 60
4.6. TRADITIONAL OPTIONS TO REDUCE THE RISK AND THE DAMAGE ........... 61
4.7. TECHNICAL OPTIONS AND THEIR IMPACT EVALUATED THROUGH TECHNICAL ECONOMIC MODELS .................................................................... 62
Chapter 5 SUSTAINABLE ELECTRICITY FOR EUROPE, MIDDLE EAST AND NORTH AFRICA ............................................................................ 70 5.1. INCREASING PRESSURE ON POWER SOURCES........................................72
5.2. PORTFOLIO OF SOURCES AND TECHNOLOGIES .......................................72
5.3. CONCENTRATING SOLAR POWER AS PART OF THE ENERGY MIX ............ 75
5.4. SUSTAINABLE ELECTRICITY MIX FOR EUMENA............................................ 76
5.5. LEAST COST RENEWABLE ELECTRICITY ....................................................... 82
5.6. AN ALTERNATIVE CLIMATE CHANGE AND NUCLEAR PROLIFERATION ..... 84
Chapter 6 SECURITY OF ELECTRICITY SUPPLY: ISSUES OF REGULATORY IMPORTANCE...................................................... 89 6.1. TAXONOMY SCHEME FOR ELECTRICITY SECURITY OF SUPPLY ............... 92
6.2. ENERGY ONLY MARKETS ................................................................................. 92
6.3. MECHANISMS ON GENERATION SIDE ENSURE ADEQUATE CAPACITY..... 93
6.4. MONITORING THE ELECTRICITY SECURITY OF SUPPLY ............................. 94
Chapter 7 MONITORING AND EVALUATION OF THE RES DIRECTIVES IMPLEMENTATION IN EU27 AND POLICY RECOMMENDATIONS FOR 2020-RES2020....................................................................... 97 7.1. OBJECTIVES ....................................................................................................... 98
7.2. MODELLING OF DISTRIBUTED GENERATION ................................................ 99
Security of Supply & Risk of Energy Availability
Editors: Haris Doukas, Alexandros Flamos & John Psarras Page 9
7.3. MODELLING OF THE BIOENERGY SUPPLY CHAIN ...................................... 102
7.4. DEFINITION OF SCENARIOS........................................................................... 103
Chapter 8 CROSS BORDER INTERCONNECTIONS: A DRIVING FORCE IN SECURITY SUPPLY AND MARKETS DEVELOPMENT ............. 108 8.1. SECURITY OF SUPPLY AND MARKETS DEVELOPMENT IN THE EUROPEAN
ENERGY STRATEGY........................................................................................ 109
8.2. CROSS-BORDER INTER CONNECTORS: A WEAK POINT IN THE EUROPEAN TRANSMISSION NETWORKS .......................................................................... 110
8.3. SCARCITY MANAGEMENT AND REINFORCEMENT OF THE NETWORK.... 112
8.4. TRANSMISSION NETWORK ADEQUACY: SECURITY OF SUPPLY AND MARKET DEVELOPMENT ................................................................................ 113
8.5. TWO CASES: THE IBERIAN MARKET AND THE MEDITERRANEAN RING .. 115
8.6. MEDRING........................................................................................................... 117
Security of Supply & Risk of Energy Availability
Editors: Haris Doukas, Alexandros Flamos & John Psarras Page 10
INTRODUCTION Pedro Miras, Director of Oil of the National Energy Commission, Member of the Board of Directors of the Strategic Reserves Corporation A secure energy supply is one of governments' and administrations' main concerns. This is nothing new, since it appeared at almost the same time as the first societies organised themselves around a fire and started to settle as soon as they could obtain and use fire safely. The European Union recognises this concern, and in the Commission’s communication to the Council of Europe and the European Parliament, “An Energy Policy for Europe”, a secure supply was included as one of the three attributes that the community energy policy should have. According to the document, Europe must generate sustainable, competitive and secure energy so that it results in the wellbeing of all its citizens. Supply security in energy markets is based on the following two policies. The first being long-term policies. Long-term policies are those that allow for an improvement in the supply at times when markets are operating normally and which are not valid in acute and occasional crises. Included in this group are energy saving and efficiency measures, the diversification of sources and understanding between producing and consuming areas. The second therefore being short-term measures. Short-term measures, however, respond to critical episodes lasting a short time and they are based on emergency actions and stock management. Lastly, the existence of interconnections between the energy networks in the different regions is a measure that has both a long- and short-term effect. These aspects will be discussed in this article.

Introduction
Pedro Miras Page 11
The European Union is in a highly vulnerable position when oil supply is concerned. To be precise, in 2007 over 81,7% of total consumption came from outside the Union’s borders. If we take into account the European energy matrix’s high degree of dependence on hydrocarbons, it is easy to understand the importance of assuring the supply of this energy source. This is even more critical if we consider that virtually half of the sources are geographical areas that are relatively unstable politically. Nonetheless, since their beginnings, oil markets have established short- and long-term supply assurance measures. If we take into account that the international oil trade was almost 63% of total consumption (83.1 MBbl/d) in 2006, and that this value is far higher than the ratios shown by other energies (26% for the natural gas business and only 11% for the European electricity business), it is easy to understand the importance of measures within this sector. Long-term assurance of oil supplies is based on the diversification of supply. This diversification needs to take into account the geographical imbalance between supply (producing countries) and demand (consuming countries). Therefore, if estimated reserves1 are borne in mind, 62% of the 1,208 thousand million barrels counted come from the Middle East area, which, on the other hand, only accounts for 7% of worldwide consumption. On the contrary, the countries in the OECD, responsible for 58% of consumption, only account for 7% of the oil reserves. The only long-term solution for this imbalance is to foster international dialogue. This dialogue would be aimed at making access possible for the majority of the reserves by means of fair and balanced trade that benefits both consuming and producing countries. However, the occurrences of occasional crises that can lead to restrictions in the supply (due to natural disasters, such as hurricane Katrina in August 2005) must be tackled with fast response measures. The most appropriate example is the International Energy Agency’s action protocols, which oblige its member countries to hold strategic reserves for a minimum of ninety days with counting and availability standards in the event of a crisis that, are known and accepted by all its members. These mechanisms need to be improved to perfect oil supply assurance systems, as well as the possibility of extending them to other types of energy. The natural gas market is also affected by similar aspects to oil’s, although its particular characteristics require additional approximations. Specifically, and besides the oil market’s characteristics, the supply of natural gas must respond to aspects such as those derived from technical faults,
1 BP Statistical Review 2007.
Security of Supply & Risk of Energy Availability
Editors: Haris Doukas, Alexandros Flamos & John Psarras Page 12
meteorological conditions that may affect them, few LNG loading and unloading ports, or the difficulties derived from an asymmetrical regulation in gas transit between different markets. Aware of this situation, the European Union has published two directives that try to address these problems in particular. Specifically, Directive 2003/55/EC and the one on security in the natural gas supply 2004/67/EC propose rules for improvement, such as the promotion of gas storage facilities, the development of common operating rules among the operators in the national systems, promotion of cross-border capacities or the study of measures on the demand-side in the event of interruptions. All these actions aim to improve supply assurance systems in line with what has been done in the past with oil. However, in a market such as natural gas, which is constantly changing, the rules need to be subject to ongoing review. As a result, declarations such as those made recently by the Ministry of Energy and Mines in Algeria2 stating that the natural gas markets have changed from being a buyer’s to a seller’s market, and suggesting that this change has not simultaneously brought about the corresponding premium in the security of the supply, should force us to be constantly reviewing the supply assurance measures of this type of energy. In view of all the above, the answer for the natural gas market is to promote interconnections. This does not only mean physical interconnections, such as pipelines and gas storage facilities, or, more recently, the construction of LNG terminals, but also what could be termed “regulatory” interconnections. Therefore, as the directives state, we need to work towards common rules that reflect shared operation standards for all the operators of regional networks as a measure to ensure supplies at all times. In turn, work needs to be done on coordinated response measures, in the style of what has already been well developed by the IEA in the oil sector. As far as the electricity sector is concerned, expected growth in consumption will also require a constant consideration of supply assurance measures. Average growth in recent years, around 4%, of the member countries of the UCTE3 and the forecasts of worldwide consumption virtually doubling by 2030 made by the OECD make this task very necessary. The diversification of sources of generation seems to be the most important measure in all cases. The potential of generating renewable energies and
2 (PIW, Vol XLVII, N 7, February 18, 2008). 3 Union for the Co-ordination of Transmission of Electricity (UCTE).

Introduction
Pedro Miras Page 13
the role that nuclear power has to play in the future is essential for the implementation of a secure energy policy. Nevertheless, for this type of energy, a key factor is the development of transmission networks. If we take into account that according to UCTE data, the electric power business among its member countries was only 13% of what was generated, and that, in some cases, such as Iberia, the figure dropped to 4%, it is easy to understand that there is a long way to go in this field. The so-called “energy islands” can clearly be detected in the European environment, and the Iberian Peninsula is an example of one, although not the only one, as there is also the British Isles (in this case geographical islands as well) and Scandinavia. Consequently, in this case, and with even more necessity than in the natural gas markets, interconnection is the answer. Yet again, as a measure to secure the supply, there is a need to foster harmonised regulation that accompanies the development of physical interconnection networks in energy corridors. All without forgetting that emergency systems that are as flexible as possible also need to be promoted. As a result of all the above, and bearing in mind the importance of energy in the development of society and the need to ensure the energy supply, we need to answer to some questions that arise in the European market. Specifically, they are: Do we have a common energy market?. Are we considering that markets are changing (gas)?. Is dialogue enough to face geopolitical risks?. Is there enough diversification to face the problem?. Are we planning physical interconnections as required?. Are we aware of the requirements for “regulatory interconnections”?. Is it possible to translate any oil So-s ST measures to grid energies?. Are Regulatory Authorities, TSO, Governments and Companies involved enough in the SoS task? The project “Risk of Energy Availability: Common Corridors for Energy Supply Security” must tackle all of them and propose suitable solutions.

Security of Supply & Risk of Energy Availability
Editors: Haris Doukas, Alexandros Flamos & John Psarras Page 14
Chapter 1: ENERGY GEOPOLITICS AND ENERGY SECURITY Paul Isbell, Director, Energy Programme, Elcano Royal Institute for International and Strategic Studies Federico Steinberg, Energy Programme, Elcano Royal Institute for International and Strategic Studies Rising energy demand from emerging economies, higher energy prices, new energy nationalism both by consumer and producer countries, and obstacles to international economic cooperation have radically transformed the global energy scenario in recent years. Therefore import-dependent countries in the European Union face important strategic dilemmas in relation with energy security. This chapter explores the new dimensions of energy security and presents some suggestions for increasing security of supply and for fostering stability in the international energy system.

Chapter 1: Energy Geopolitics and Energy Security
P. Isbell and F. Steinberg Page 15
INTRODUCTION
If the energy issue came to the forefront of world attention with the outbreak of the Iraq crisis in the autumn of 2002 –after more than a decade of absence from the international community’s strategic concerns– over the past years it has emerged as the global strategic issue par excellence. It is not just that energy now exerts an enormous influence on the dynamism of the international economy, the stability of world geopolitics and the future of our environment on a planetary scale; it also appears that the energy issue will not recede into the strategic background again for several decades. Within this context the concept of energy security has become crucial, particularly in most European countries that depend heavily on energy imports. Moreover, the European Union (EU) faces a difficult dilemma. On the one hand, it appears as the main global actor capable of fostering a market and rules-based system that would promote stability and security in international energy markets and, at the same time, erode the ability and the will of other actors to use energy as a geopolitical weapon. However, on the other hand, the EU faces internal difficulties to consolidate a common energy policy, which would be key to act as a global leader and provide multilateral governance in global energy issues. This chapter provides a brief discussion of these issues. First, it focuses on the concept and facets of energy security. Second, it explores the geopolitical implications of the new energy scenario and provides some suggestions for enhancing energy security in the European Union and worldwide. 1.1. ENERGY SECURITY: AN OVERVIEW The standard, and overused, definition claims that energy security is a state of affairs that provides for secure – or reasonably guaranteed – flows of energy to consumers at reasonable prices. Unfortunately, this definition is as vague and incomplete as to be basically useless in any serious discussion of energy economics or geopolitics. Perhaps the only positive thing that could be said of this definition is that while it is almost always mentioned at the beginning of such discussions, it is almost always quickly abandoned – right about at this point in the analysis. The energy terrain must be profoundly dissected if anything useful is to come of a discussion of energy security. First, there is the dichotomy between energy security for consumers (“security of supply”) and energy security for producers (“security of demand”). For consumers this issue (with
Security of Supply & Risk of Energy Availability
Editors: Haris Doukas, Alexandros Flamos & John Psarras Page 16
only few exceptions) basically boils down to price and the perception that price will not experience increases which are economically painful. For producers, the issue boils down to income, and the perceived need for revenues to be maintained at sufficient levels to pursue serious, long-term economic development. For better or for worse, these two perspectives are linked. Excessively low prices stimulate consumption and growth in consumer economies, but they undermine the potential for revenue-driven economic development in producer economies. Furthermore, low prices also limit the incentive for investment in future output in producer countries, setting the stage for much higher prices in the future – unless low prices become the door through which international private oil companies (IOCs) gain cheap access to the vast reserves of producer countries. However, such a development has often created a perception on the part of producer countries that their economic and political sovereignty is being compromised, provoking various manifestations of energy nationalism which often augur higher prices in the future (Isbell 2007). Higher prices, on the other hand, tend to have harmful effects on both perceptions and real economic activity in consumer countries, boding dangerously for producer country revenues if demand collapses as a result. Furthermore, high prices can stimulate investment in future output, with moderating effects on prices in the middle run, but they often provide the incentive for the resurgence of energy nationalism which, more often than not, limits the rate of investment in new output over the long run. Finally, high prices can also stimulate the development of non-fossil fuels alternatives which ultimately might dislodge hydrocarbons from their central role in the world’s economy and in producer state finances. A large part of the energy security debate revolves around fossil fuels. This is as it should be, given that fossil fuels provide for about 80% of the world’s primary energy mix. Therefore, energy security is inextricably bound up with the production and consumption of fossil fuels, particularly oil and gas which are the main internationally traded energy sources and which make up over half of the world energy mix (coal tends to be consumed in the country of production). Nevertheless, the generation, transmission and distribution of electricity (which accounts for nearly half of the world’s final energy consumption and can also be generated by non-fossil fuel energy sources), along with the security and efficient functioning of electricity systems, are also key elements of any discussion of energy security. One could argue that electricity issues are even more relevant than a merely hydrocarbon-centred discussion of the issue, given that electricity is much more important to the foundation of the economy; that is to say, in homes and in government and business office buildings around the world. While transportation to work and movement of merchandise are important, if the power goes off, it does not really matter

Chapter 1: Energy Geopolitics and Energy Security
P. Isbell and F. Steinberg Page 17
whether we are able to leave the house or get to work. Furthermore, electricity is certainly the most important energy security concern of the 1.5 billion people around the world who do not even have access to it. However, there is at least one other relevant angle in the energy security story – the insecurity that may well come if the world fails to displace fossil fuels from their dominant role in the energy economy. Even if the standard energy security concerns surrounding fossil fuels and electricity can be effectively dealt with, such success would paradoxically create a situation in which the world burns more fossil fuels more quickly and reduces carbon dioxide emissions more slowly, setting the stage for higher temperatures and even more difficult instabilities in the world’s economic and political systems. 1.2. ENERGY SECURITY AND THE ENERGY SUPPLY CHAIN Any complete discussion of energy security must address all of these angles. To facilitate such an analysis, it would be useful to address the energy security terrain through the prism of the energy supply chain, including the upstream, midstream and downstream. In the upstream of both oil and gas production – at the geographic source of reserves and production -- there are a number of concerns. The first is the debate over so-called “peak oil” – or the possibility, looming or not, that world oil production will one day peak, before falling off rapidly, or merely flat lining into a long plateau before declining. The well-known radical point of view sees the peak approaching fast, with record high prices one of the tell-tale signs. Most moderate perspectives are more sanguine about a “hard” peak; that is, a situation in which prices skyrocket to choke off demand because supply is no longer capable of rising. This point of view claims that peak theories factor in only conventional oil, ignore the economic viability of unconventional or more difficult and expensive oil in offshore regions or the Arctic zones as prices rise, and simply deny the capacity of technology to increase recovery rates of oil fields which traditionally have been only 30%. Most expert opinion sees the likelihood of a “hard” peak as very low for another 30 or 40 years, at least. Nevertheless, a few maverick voices from the oil industry, like the CEOs of Italy’s ENI or France’s Total, feel the idea that the world will ever produce 115mbd (the IEA’s projected demand level for 2030) is still a pipe dream. The idea that oil might “run out” soon – which when expressed intelligently simply means that oil might reach a peak capacity in its production level – may seem, intuitively, to be an important concern. Nevertheless, the debate over peak oil, as it is typically framed, is probably irrelevant, however counterintuitive such a conclusion might sound. It is not just that some oil will inevitably be left in the ground, whatever happens, because it will never

Security of Supply & Risk of Energy Availability
Editors: Haris Doukas, Alexandros Flamos & John Psarras Page 18
likely be economically or technically feasible to extract. More to the point: demand for oil itself is likely to peak long before any hard geological limitations impose a technical peak on production. Such a “soft” peak in oil production, brought on by moderating demand, is in fact what we seem to be hoping for, if not expecting, in our efforts to curb the rise in carbon emissions and stave off the worse aspects of global warming. If the threat of fossil-fuel induced climate change is real, then a geologically provoked “hard” peak is either irrelevant to us (if it is indeed only a possibility many decades in the future) or a kind of counterintuitive solution, as economically painful and disruptive as it might be (and the more useful the quicker it would come) given that the attendant supply shortages and prohibitive prices would act as an emergency break on carbon emissions, while the international crisis such a “hard” peak would produce might jolt the world into creating a carbon-free economy much faster than we might otherwise would have done with plentiful supplies and more moderate prices to enjoy in the short run. Nevertheless, if the peak oil debate is irrelevant, the possibility that hydrocarbon supplies in the upstream might not keep pace with demand -- for other “above the ground” reasons -- is a very real threat to energy security and to economic and political stability. Most of the world’s hydrocarbon reserves – conventional or not – are concentrated in a small number of countries, almost all of which are underdeveloped economically, unstable politically, lack robust democratic institutions, or feel threatened or left out by globalization. Nearly 75% of all conventional hydrocarbon reserves are found in the “Great Crescent”, running from the Arabian Peninsula and the Persian Gulf through Central Asia all the way to Eastern Siberia and Russia’s Sakhalin Island. To date, this geographic arc is one of the black holes of liberal market democracy and a major stumbling block for globalization. Most of the world’s unconventional oil is also highly concentrated in geographical terms. Nearly half is trapped in the tar sands beneath the forests and topsoils of Calgary in Canada, while nearly another half is bulked in the ultra-heavy oils of Venezuela’s Orinoco Belt. While Canada may be a model of stability and democracy, development of its tar sands would emit five times more carbon dioxide that conventional oils pumped from the traditional zones of the Middle East. Venezuela, on the other hand, is a metaphorical powder keg, at least for the moment. The concentration of hydrocarbon reserves in problematic zones beyond the OECD presents a number of challenges to what is traditionally understood as energy security. As perceptions of globalization have soured in many parts of the non-Asian, non-OECD world, and as prices have skyrocketed in recent years, energy nationalism is on the rise again for the first time since

Chapter 1: Energy Geopolitics and Energy Security
P. Isbell and F. Steinberg Page 19
the 1970s and has taken root in new areas. While the epicentre of energy nationalism was once the Arab and Islamic world (where it remains rooted), the most dramatic new examples of energy nationalism today are Russia and Venezuela, and both have spawned other examples among neighbours under their influence (Kazakhstan, Bolivia and Ecuador). The most significant challenge that such phenomena pose for the energy security of major consuming economies – and indeed for the collective energy security of the world – is the potentially damaging impact that the energy policies of such producer countries could have on the rate of future investment in exploration, extraction and maintenance of oil and gas production. Perhaps this “internal” aspect of energy nationalism would not be so worrying from the standpoint of the world’s future oil and gas supplies if it were not for the fact that estimated investment requirements for future demand to be met are daunting: the IEA (Isbell 2007) estimates that some US$22 billion in energy investment will be needed globally by 2030. Furthermore, while there are some exceptions (like Saudi Aramco and Petrobras), the general rule is that producer states and their NOCs are less than efficient when it comes to channelling revenues in ways which optimize future investment and output levels. Such doubts are particularly acute concerning Russia and Venezuela, whose governments and NOCs appear to have a number of competing interests and priorities which do not coincide with the interests of consumers to see future output maximized. As a result, a scenario is taking shape on the horizon in which hydrocarbons supplies in the middle run (by 2015-2020) will be insufficient to meet world demand, with the arbitrating influence ultimately being significantly higher prices. The difference between the implications of this scenario and that of the “hard” peak would be miniscule to the naked eye, only the root cause would not be geological limits but rather the influence of politics “above the ground” on investment. Exacerbating such a scenario would be a continuation of the recent trend of rising costs for inputs of all types (raw materials, equipment and human capital) all along the hydrocarbon supply chain. Despite the fact that this is one of the most important real threats to global energy security, the media’s attention and the public’s imagination remain captivated by another “external” sideline feature of energy nationalism: the potential use of energy supply cuts conceived of consciously by producer countries as a geopolitical weapon. Recent Russian gas and oil cut-offs to the Ukraine and Belorussia, along with Venezuela threats to halt the export of petroleum to the US have rekindled the worst kind of fears that Europe and the US might experience an energy crisis more catastrophic than the Arab Oil Embargo and the first oil shock. Citizens across the West are convinced that these energy producers have the will and the means to turn off their energy taps, generating a reactionary and protectionist attitude towards these countries and their business firms.
Security of Supply & Risk of Energy Availability
Editors: Haris Doukas, Alexandros Flamos & John Psarras Page 20
Intuitively, such fears would seem reasonable, but they are probably ill-founded (Mabro 2007). First, the oil market is global. Oil export disruptions will either push up price for all consumers globally, or their diversion into other parts of the global market will provoke a readjustment of flows that will mute any effect on global oil prices. Gas cut-offs represent a greater threat to importing countries highly dependent on pipelined gas from a single hostile source, but even in such cases (Russian gas to Eastern and Northern Europe, Algerian gas to Southern Europe) the risks are overblown. On the one hand, neither Russia nor Algeria is inclined to be as hostile to Europe as many believe. On the other hand, such governments are too highly dependent on their revenues from gas exports to Europe to contemplate killing off the goose that lays their golden eggs. They are as smart and as rational and as humane as any of us in the so-called “West”. Global interdependence has gone too far to allow for such actions to yield anything more than pyrrhic victories. A Russian gas cut off of any significant impact is limited by similar considerations that checked the useful deployment of the old Soviet Union’s nuclear arsenal. The consequences would be too dire to contemplate. There are, nevertheless, a number of factors – other than producer state use of the energy weapon – which do provoke supply disruptions. Some of them -- like weather events (hurricanes in the Gulf of Mexico) and local instabilities (social unrest in the Niger Delta) -- are found in the upstream. Many others, however, occur in the midstream, at the level of oil and gas transportation. Oil and gas pipelines often lose flow or are shut down as a result of accident or sabotage (often one mascarades as the other). Examples include corrosion-induced leaks in BP’s Alaskan pipeline, explosions at Russian gas pipelines in Georgia, sabotage of Iraqi oil pipelines by insurgents, siphoning off from Shell’s pipelines by Nigerian militants, etc. The most significant transportation vulnerability, however, comes from threats to oil and liquefied natural gas that must be shipped along the world’s sea lanes and pass through a number of well-known “chokepoints”, like the Straits of Hormuz, the Straits of Malacca, the Bosporus and Dardanelles Straits and the Suez and Panama Canals. Nearly half of the world’s 86mbd of oil must flow through these potentially vulnerable chokepoints every day. It is estimated that by 2030, if current trends continue, some 30% of the world’s oil will have to pass daily through both the Straits of Hormuz and Malacca, almost all of it bound for East Asia. Accidents, sabotage, piracy, terrorist or military action are all capable of stopping or slowing the flow of petroleum through certain chokepoints, at least temporarily, unleashing potentially devastating effects on world prices. The most likely possibility for such action in the minds of many right now is the potential for Iran to affect the flow of oil through the Straits of Hormuz, possibly as a retaliatory action for a military strike on its territory.

Chapter 1: Energy Geopolitics and Energy Security
P. Isbell and F. Steinberg Page 21
The downstream scenario is dominated, on the hydrocarbon side, by refineries, petroleum product distributions systems, internal gas pipeline networks, and strategic reserves. On the electricity side of the fence, energy security means sufficient, reliable and safe generation, transmission and distribution, along with adequate international electricity and gas connections, particularly in relatively isolated countries like the UK or Spain. The energy security of the downstream in most countries boils down to regulatory regimes that optimize investment and maintenance of the refinery/generation systems, the distribution/transmission networks and storage facilities. Although as a rule there are relatively few breaches of energy security in the downstream, the nature of the regulatory regime is of extreme importance in order to avoid an undermining of sufficient investment or a weakening of maintenance which can, in given moments, produce blackouts like those in California and New York in recent years, or even like that experience in Barcelona last year. The extreme importance of downstream security is highlighted by the fact that such disruptions hit consumers most directly and most suddenly, typically in the form of supply cuts only ameliorated with great difficulty and distress, as opposed to the more gradual price increases produced by the kinds of disruptions mentioned above that can occur in the upstream and the midstream. 1.3. DIVERSITY IS THE KEY The key to increasing energy security is not the intuitive assumption that the ideal would be national energy independence and the capacity to control one’s own (or another’s) energy sources. Rather the key is to be inserted into the globally interdependent energy reality in the most diversified and, therefore least, vulnerable fashion. Diversity across the plane of the energy field is a more appropriate – and realistic – goal than energy independence. This means, where possible, diversity not only in energy types and geographic sources, but also of modes and routes of transportation. Better to have oil and gas from as many different geographic and political sources as possible, as well as a broad range of types of energy, ranging from fossil fuels to bio-fuels, from renewable energies to nuclear power, from combustion engines to electric hybrid motors and fuel cells. It also means diversity in the matrix of energy transportation from the upstream to the downstream. For example, rather than depending just on transit countries, like Ukraine, to pipeline Russian gas into Europe, or depending only on Russian pipelines which bypass the transit states and come directly into Germany, like the projected North Stream pipeline, Europe should encourage a balance between dependence on Russian gas that must pass through transit countries and dependence on Russian gas piped directly to the EU. This would produce a balancing effect on lobby pressures which either Russia or Ukraine might bring to bear on the EU. Likewise,
Security of Supply & Risk of Energy Availability
Editors: Haris Doukas, Alexandros Flamos & John Psarras Page 22
Spain should attempt to transform itself from a mere gas import terminal into a transit country funnelling much of Algeria’s gas (and regasified LNG from Trinidad and Tobago o Qatar) into France. It might also encourage Algeria to become, in addition to its key role as gas producer and exporter, a transit country for Nigerian gas passing through a future Trans-Saharan pipeline, on its eventual path to Europe via future trans-Mediterranean pipelines. The point is that diversity of supply increases energy flexibility and reduces vulnerability to any form of supply disruption, while diversity of transport modes and routes mitigates the political capacity – and the political will – of producer and transit states to be tempted into using supply cuts as a political weapon. Moreover, this strategy reinforces the long run policy objective of the EU of promoting market mechanism to manage global energy markets. Therefore, diversifying supply and making the world energy system more interdependent reduces the incentives of producers to try to use energy as a political weapon, thus reducing energy insecurity, international rivalry and energy nationalism. CONCLUSIONS Energy prices in general (and oil prices in particular) have permanently shifted to a much higher level than was usual in the past. If there is further price movement in the future, it is much more likely to be upward than downward. The perception that energy is now the central geopolitical battlefield has also grown considerably in Europe as a result of the disruptions to the supply of Russian energy, regardless of their duration or true causes. Public awareness of the role of our dependence on hydrocarbons in climate change has heightened even more the sensation of urgency that is felt in Europe to shape a European energy policy capable of overcoming this three-pronged economic, geopolitical and environmental challenge –a challenge that is being exacerbated and made more difficult by the new rise in Asian demand, on the one hand, and the US’s persistent preference for a policy that is not far from laissez faire (take this to mean: business as usual), on the other–. Europe advocates market principles and efficient economic competition as opposed to the traditional criteria of realism and geopolitical competition which are increasingly defining today’s energy field, to the detriment of global economic integration. This attitude is not without its risks, as each of the various energy policies possible only makes sense in the context of the international environment that emerges to dominate the future outlook. It will not be easy to make clinging to market principles work in the international energy sector if other significant players in the game –the major producer countries (for example Russia), the major consumer countries (China) and
Chapter 1: Energy Geopolitics and Energy Security
P. Isbell and F. Steinberg Page 23
even the major member states with their major national champions– continue to play by the rules of national rivalry and geopolitical competition. Even if energy nationalism proves incapable of truly achieving its aims –compared with the overall superiority of a well-designed and regulated market scenario– it will end up defining our world energy reality if there are enough players who espouse this idea, as there appear to be currently, posing risks to those who continue along the market path. If Europe attempts this anyway, one of its major challenges will be to carry on preserving its unity in the face of likely pressures and difficulties, seeking feasible formulas to share the burden of the inevitable adjustments. In any case, as we have argued, diversification and increased interdependence appear as the most effective long run strategies. But these dilemmas are always more acute in the case of a single small country, a typically run-of-the-mill player unable to shape the characteristics of the global energy landscape as it evolves (most EU countries would in fact fall into this category). For a major player with the potential to change the direction and profile of the international scene, acting as world leader, there is a credible possibility of success. However, in the energy issue it seems that the major actor who takes on the role of world leader is not going to be the US –it would have to be Europe–. Indeed, in the final analysis, if all remains the same, the fragmentation of the world economy that would result from national competition in the energy sector would threaten not only the future of the EU’s single market but also the possibility of progressing further with world economic integration and, as witnessed at the end of the last stage of late 19th-century and early 20th-century globalisation, it is very likely that sooner or later this trend will lead to war. What choice, then, for Europe? REFERENCES [1] British Petroleum (2007). Statistical Review of Energy 2007. [2] European Commission (2006a). Green Paper: European Strategy for a sustainable, competitive and secure energy policy. Brussels. [3] European Commission and the Secretary General/High Representative Javier Solana for the European Council (2006b). “An external Policy to serve Europe’s Energy Interests” Brussels. [4] International Energy Agency (2007). World Energy Outlook.
Security of Supply & Risk of Energy Availability
Editors: Haris Doukas, Alexandros Flamos & John Psarras Page 24
[5] Isbell, Paul (2007). “Revisiting Energy Security” Oxford Energy Forum, Issue 70. [6] Mabro, Robert (2007). “Oil Nationalism, the Oil Industry and Energy Security Concerns” ARI 114/2007 Royal Elcano Institute. [7] Snijder, René (2008). “The Future of Gas and the Role of LNG: Economic and Geopolitical Implications” WP 14/2008, Royal Elcano Institute. [8] Youngs, Richard (2007). “Europe’s External Energy Policy: Between Geopolitics and the Market” CEPS Working Paper 278.

Chapter 2: Risks on Energy Security of Supply: An Exploratory Analysis for the Researcher
M. Flouri et al. Page 25
Chapter 2: RISKS ON ENERGY SECURITY OF SUPPLY: AN EXPLORATORY ANALYSIS FOR THE RESEARCHER Maria Flouri, Charikleia Karakosta, Haris Doukas and Alexandros Flamos NTUA-EPU, National Technical University of Athens, Greece European energy demand and import dependence continues to increase and primary energy sources are mainly used to cover European energy needs, making clear that the risks of energy security of supply and their minimization, is a critical issue. Aim of this chapter is to address the overall energy supply status, considering the energy supply corridors and procedures in the European Union, in order to underline the importance of risk analysis and risk minimization. The emphasis is given on oil and natural gas’s categorization of most important risks, as well as, in the presentation and analysis of collection of incidents that justify the categorization itself, while it demonstrates the importance of risk analysis and prediction.
Security of Supply & Risk of Energy Availability
Editors: Haris Doukas, Alexandros Flamos & John Psarras Page 26
INTRODUCTION European energy demand increases, throughout the years, resulting in a simultaneous increase in its import dependence. European dependence on import of natural gas is the current reality for the majority of European countries. Approximately nine out of 33 European countries are more than 95% dependent on imports and only 5 are self-sufficient or net exporters [1]. According to International Energy Agency (IEA) in 2020 the European import dependency is expected to reach 90% for oil and 63% for natural gas, in comparison to 50% for oil and 36% for natural gas in 2000. In addition, 70% of the European energy needs are expected to be met by primary (and not renewable) sources by 2030. This is particularly important, taking into consideration the fact that primary energy sources are imported from areas outside Europe that are either difficult to reach or geopolitically unstable. All the above, combined with the surge in oil prices that took place in 2000, have made the issue of risks on energy security of supply and their minimization, more critical than ever. Apart from the increasing oil dependence, a gradual decrease in oil import security has been observed within the IEA network during the last 20 years. This decrease, translated into numbers, accounts for 50 days of net imports from 1986 to 2001 (110 days in 2001, while 160 days in 1986) and it constitutes an evidence of an industrial trend towards a gradual maintenance of lower levels of resources since the beginning of 1980’s, combined with the stabilization of state security resources since 1986. Nowadays, this decrease has been accelerated reflecting rationalistic trends, cost restrictions and high reliance on crude oil. The decreasing security resources restrict the possibility of an effective confrontation in case of a possible supply interruption. Thus, the market is becoming more vulnerable to possible crises, such as the occasional export interruptions in Iraq [2]. Moreover, it is more than true that oil resources are not abundant and are even less equally distributed than coal and natural gas. Furthermore, oil demand is focalized on developed countries, though its production is limited in a small number of developing countries. The Organization of the Petroleum Exporting Countries (OPEC) holds 40% of the global oil production and 80% of its known resources. Six countries of the Middle East, members of OPEC, control the 2/3 of the known oil resources worldwide [7]. OPEC’s Middle East producers are responsible for 27% of the global oil supply, a share which is expected to be doubled during the next two decades, whilst other areas’ production is reaching saturation and thus decreasing. Middle East is also responsible for 40% of crude oil’s global trade. These areas would not represent energy’s supply uncertainty factor in case they were politically and economically stable and they followed policies delimited by the market [2].
Chapter 2: Risks on Energy Security of Supply: An Exploratory Analysis for the Researcher
M. Flouri et al. Page 27
Therefore, income from oil exploitation is really crucial not only for OPEC countries’ economy but also for non-OPEC countries that export oil, such as Russia, Mexico and Norway. Periods of intense and increased competition, along with changes in the market’s share, are followed by periods of co-operation among the OPEC countries, in the framework of an effort to influence oil markets. Acts of mutual support between the oil-producing countries are expected, in order to assure a lower limit in oil price. In order for a cartel to operate properly, the existence of some rules is really important. During a crisis due to extra sufficiency in supply, which resulted in really low prices of oil, OPEC members reduced their production to levels prior to the crisis, as happened during the period 1985 -1986 and according to the agreement for reducing production of 1998 - 1999. Moving on to the natural gas market, demand is expected to increase rapidly in all sectors, due to its increased share in electricity generation in industrial countries and its use in developing countries instead of fossil fuels. The geographical allocation of natural gas resources constitutes also a serious issue, considering that 70% of the known resources are situated in the former Soviet Union and the Middle East, with Russia and Iran, obtaining half of this share. Furthermore, the natural gas import dependence from non-European countries is expected to increase from 1/3 of demand in 2000 to 2/3 in the next two decades. On an international basis this increase is justified by the fact that 9 out of the 33 European countries are 95% depended on natural gas imports, while only 5 are self-sufficient or net exporting countries. The situation is better for EU-15, with 7 countries being 95% depended and 3 countries being self sufficient or exporting. North Europe is totally depended on natural gas imports, mostly from Russia, having no alternative choices. The same situation is, also, observed in Central and South East Europe, except for the case of Romania and Croatia that are rather independent as well as Hungary and Switzerland that have more alternatives. South Europe is also highly depended on natural gas import, having only a few other alternatives. South Europe, with the only exceptions of Italy and Spain, relies mostly on Russian and Algerian natural gas and Liquefied Natural Gas (LNG). West Europe, which holds 2% of the global resources, imports from Russia and Algeria 40% of its needs. Besides the fact that North West Europe is highly import depended, with imports, not only, from countries outside the European Union (EU) but, also from England, through the Interconnector pipeline, offering additional flexibility. Greece imports 75% of its natural gas needs from Russia and 25% from Algeria. Generally, no alteration concerning the import dependence is expected during the next years and until 2020. Russia, Algeria and Norway will, gradually, increase their exports, with, a rather high, possibility to create a Baltic “corridor” for the Russian natural gas and a Mediterranean “corridor” for the Algerian

Security of Supply & Risk of Energy Availability
Editors: Haris Doukas, Alexandros Flamos & John Psarras Page 28
natural gas. Moreover, there is a high possibility of new energy routes being created, with Turkey playing a leading role in this respect [1]. In addition to the above, the fact that the majority of natural gas supplies is released through a pipeline network, concentrated on a few trunk lines, which are nearly fully booked and partially not interconnected or reversible [3, 4], has as a consequence the inflexibility of the European natural gas supply logistics. In case part of the chain is blocked, the consequences within the whole system will be quite severe and they will affect both natural gas and LNG market [5]. The danger for a prolonged interruption comes from the destruction of a major production or processing facility or a deep water pipeline, whose replacement might take several months [6]. European natural gas supplies from particular sources are vulnerable to potential accidents at key transmission and import facilities, some of which are remote from the European area. The facilities of greatest importance are the Yamal – Nenets pipeline corridor, which carries nearly 90% of Russian natural gas production, the Ukrainian pipeline corridor, which carries nearly 90% of Russian natural gas exports, the Trans-Mediterranean and GME from Algeria to Italy, Spain and Portugal and, finally, the Troll field and associated pipeline infrastructure, which accounts for more than half of Norwegian production and exports. Although it is quite unlikely that any of these facilities, particularly those involving multiple pipelines or LNG trains, would suffer a major failure, such low probability events could have a substantial impact on a particular source of transit route and therefore an entire European region [1]. Moreover, regarding natural gas, market liberalization could signal the beginning of a risk domino. Particularly, investments that reach the amount of 2 billion dollars will continue to be financed by long-term contracts. However, there is a doubt whether or not investments concerning amounts higher than 2 billion dollars, and in particular higher than 5 billion dollars, could be financed. This doubt can be explained by taking under consideration the fact that these investments will take place in non European countries, with no previous structures territories, where reassuring the investments’ commercial viability and full outcome makes impossible their materialization into stages and, also, the fact that the outcome of these investments will be sold in liberated and competitive markets. This kind of investments will be, mostly, essential, in order to cover the increased demand of the period after 2010 [1]. In the above framework, this study aims to present an approach to the overall energy supply status, regarding energy supply corridors and procedures in the European Union, laying emphasis on oil and natural gas. The main scope of this chapter is to underline the importance of risk analysis for energy supply security issues. In particular, the study is an effort to
Chapter 2: Risks on Energy Security of Supply: An Exploratory Analysis for the Researcher
M. Flouri et al. Page 29
present historical data, including incidents that resulted in the interruption of energy supply, along with their assessment; evaluation. Apart from the introduction, where a brief description of the energy situation in Europe was provided, as well as a, rather indirectly, recording of potential risks, the chapter is structured along five sections. The second section is devoted to the presentation of the risk categorization that appears to be the most practical to be taken into consideration in a risk analysis of security of supply. The actual incidents per risk category are described in the third section, while their assessment and evaluation is provided in the fourth section. Finally, in the last section are the conclusions, which summarize the main points, arisen in this chapter.
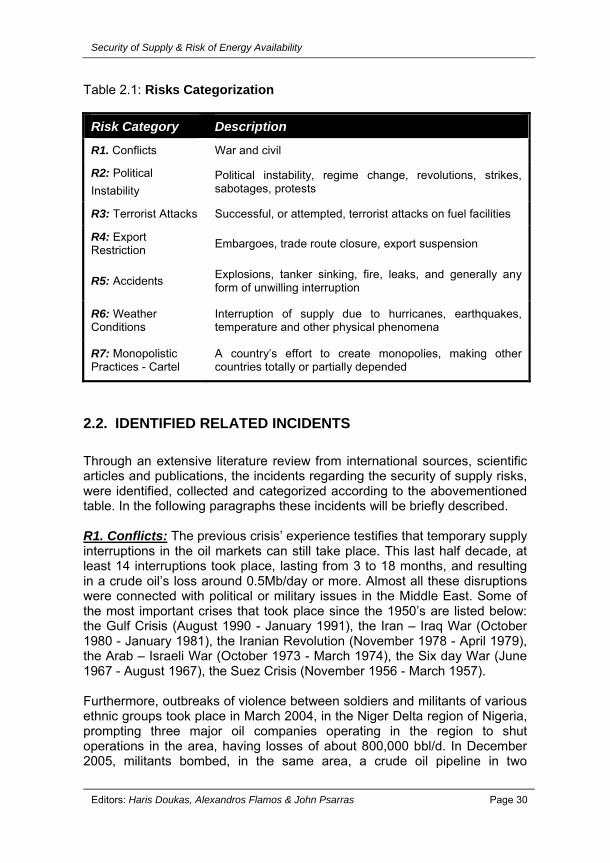
2.1. METHODOLOGICAL NOTES In the international literature, many studies exist that propose specific categorizations of risks possible to occur during energy supply. A proposed energy supply risk categorization falls into source dependence, transit dependence, facility dependence and structural risks, which contain natural disasters, political blackmail, terrorism, war, civil unrest etc [3]. Another study proposes a categorization that includes import dependence, source dependence, transit dependence, facility dependence and security incidents [1]. Moreover, risk categorization can also be found in international literature, according to the period of time; short term (12-18 months): disruptions of international supplies, medium term (3-5 years): export cartel issues, short to medium term: political issues, long term (10-15 years): resource shock, medium to long term: “real climate policy” shock [8]. Finally, another categorization includes war and civil conflicts, political instability, regime change, revolutions, successful terrorist attacks on oil facilities, export restriction, closure of trade routes and sanctions [9]. With respect to the above mentioned studies, this chapter’s categorization of oil and natural gas risks, in energy security of supplies, is defined and described in the following table.
Security of Supply & Risk of Energy Availability
Editors: Haris Doukas, Alexandros Flamos & John Psarras Page 30
Table 2.1: Risks Categorization
2.2. IDENTIFIED RELATED INCIDENTS Through an extensive literature review from international sources, scientific articles and publications, the incidents regarding the security of supply risks, were identified, collected and categorized according to the abovementioned table. In the following paragraphs these incidents will be briefly described. R1. Conflicts: The previous crisis’ experience testifies that temporary supply interruptions in the oil markets can still take place. This last half decade, at least 14 interruptions took place, lasting from 3 to 18 months, and resulting in a crude oil’s loss around 0.5Mb/day or more. Almost all these disruptions were connected with political or military issues in the Middle East. Some of the most important crises that took place since the 1950’s are listed below: the Gulf Crisis (August 1990 - January 1991), the Iran – Iraq War (October 1980 - January 1981), the Iranian Revolution (November 1978 - April 1979), the Arab – Israeli War (October 1973 - March 1974), the Six day War (June 1967 - August 1967), the Suez Crisis (November 1956 - March 1957). Furthermore, outbreaks of violence between soldiers and militants of various ethnic groups took place in March 2004, in the Niger Delta region of Nigeria, prompting three major oil companies operating in the region to shut operations in the area, having losses of about 800,000 bbl/d. In December 2005, militants bombed, in the same area, a crude oil pipeline in two
Risk Category Description
R1. Conflicts War and civil
R2: Political Instability
Political instability, regime change, revolutions, strikes, sabotages, protests
R3: Terrorist Attacks Successful, or attempted, terrorist attacks on fuel facilities
R4: Export Restriction Embargoes, trade route closure, export suspension
R5: Accidents Explosions, tanker sinking, fire, leaks, and generally any form of unwilling interruption
R6: Weather Conditions
Interruption of supply due to hurricanes, earthquakes, temperature and other physical phenomena
R7: Monopolistic Practices - Cartel
A country’s effort to create monopolies, making other countries totally or partially depended
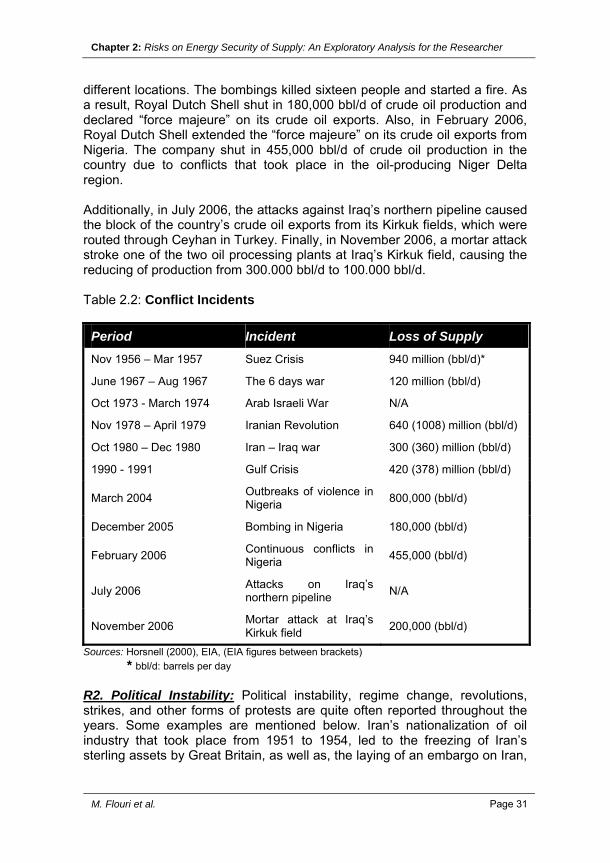
Chapter 2: Risks on Energy Security of Supply: An Exploratory Analysis for the Researcher
M. Flouri et al. Page 31
different locations. The bombings killed sixteen people and started a fire. As a result, Royal Dutch Shell shut in 180,000 bbl/d of crude oil production and declared “force majeure” on its crude oil exports. Also, in February 2006, Royal Dutch Shell extended the “force majeure” on its crude oil exports from Nigeria. The company shut in 455,000 bbl/d of crude oil production in the country due to conflicts that took place in the oil-producing Niger Delta region. Additionally, in July 2006, the attacks against Iraq’s northern pipeline caused the block of the country’s crude oil exports from its Kirkuk fields, which were routed through Ceyhan in Turkey. Finally, in November 2006, a mortar attack stroke one of the two oil processing plants at Iraq’s Kirkuk field, causing the reducing of production from 300.000 bbl/d to 100.000 bbl/d. Table 2.2: Conflict Incidents
Period Incident Loss of Supply Nov 1956 – Mar 1957 Suez Crisis 940 million (bbl/d)*
June 1967 – Aug 1967 The 6 days war 120 million (bbl/d)
Oct 1973 - March 1974 Arab Israeli War N/A
Nov 1978 – April 1979 Iranian Revolution 640 (1008) million (bbl/d)
Oct 1980 – Dec 1980 Iran – Iraq war 300 (360) million (bbl/d)
1990 - 1991 Gulf Crisis 420 (378) million (bbl/d)
March 2004 Outbreaks of violence in Nigeria 800,000 (bbl/d)
December 2005 Bombing in Nigeria 180,000 (bbl/d)
February 2006 Continuous conflicts in Nigeria 455,000 (bbl/d)
July 2006 Attacks on Iraq’s northern pipeline N/A
November 2006 Mortar attack at Iraq’s Kirkuk field 200,000 (bbl/d)
Sources: Horsnell (2000), EIA, (EIA figures between brackets) * bbl/d: barrels per day R2. Political Instability: Political instability, regime change, revolutions, strikes, and other forms of protests are quite often reported throughout the years. Some examples are mentioned below. Iran’s nationalization of oil industry that took place from 1951 to 1954, led to the freezing of Iran’s sterling assets by Great Britain, as well as, the laying of an embargo on Iran,

Security of Supply & Risk of Energy Availability
Editors: Haris Doukas, Alexandros Flamos & John Psarras Page 32
challenging, this way, the legality of the oil nationalization and taking its case at the International Court of Justice in Hague. Another similar incident, concerning though the interruption of natural gas supply and energy supply in general, is the Norwegian workers’ strike that took place in UK (near the Frigg area), in April 1986, and lasted for several days, resulting in the loss of almost one fourth (1/4) of the country’s total natural gas strategic supplies. Furthermore, in April 2002, thousands of workers at the Venezuelan state oil company PdVSA protested, by closing the gates of the facilities. Some days later, a general strike begun in Venezuela, causing the shutdown of several stores and factories and almost halting oil production, refining and export. In December 2003, the business and labour groups in Venezuela, including the employees of PdVSA, begun a strike in order to obtain an early referendum on the rule of Venezuelan President Hugo Chavez. The estimated loss of production was calculated to 3 million barrels per day of strike. In June 2004, two explosions damaged the Kirkuk-Ceyhan oil pipeline, something that later was determined to be an act of sabotage. Several other Iraqi pipelines were damaged in acts of sabotage throughout the same month. In August 2004, Iraq’s crucial northern pipeline from Kirkuk to the Turkish port of Ceyhan was attacked, only two days after being brought into operation for the first time since the war, thus stopping the flow of the oil. Finally, in March 2005, Iraq closed its northern crude oil export pipeline indefinitely due to sabotage concerns. The 600,000 bbl/d - pipeline, which ran from the city of Kirkuk to the Mediterranean port of Ceyhan, was the target of over 15 attacks since January 2005. In addition, in December 2004, around 300 unarmed Nigerian villagers, including women and children, from the Kula community in Rivers State in the Southern Niger Delta, seized three oil flow stations, which were operated by the multinational oil companies of Shell and Chevron Texaco, shutting in 100,000 barrels per day (bbl/d) of production for one week. Moreover, a strike that took place in France (May 2005), caused the shut-down of five, out of six, oil refineries, operated by the international oil major Total. Another strike in July 2005, this time in Angola’s Block 0 offshore oil project, resulted in the shut down of almost all the production of the project. In September 2005, a strike at the largest oil refinery in France, Total’s Facility in Gonfreville, shut in 343,000 bbl/d of refining capacity in the country. During October 2005, in another continent, in Nigeria’s Brass River crude oil export terminal, a strike of workers caused the termination of operations at the facility for two days. At the same month workers at the Royal Dutch Shell’s Pernis refinery begun a gradual shut-down of the facility, as part of a labour dispute with the company.

Chapter 2: Risks on Energy Security of Supply: An Exploratory Analysis for the Researcher
M. Flouri et al. Page 33
In August 2005, protests in Equador’s northeast, oil-producing provinces shut in most of the country’s crude oil production. Finally, in February 2006, protesters in Equador shut down all crude oil production, that operated by state-owned Petroecuador. Table 2.3: Political Instability Incidents
Period Incident Loss of Supply March 1951 - Oct 1954 Nationalization of oil industry in Iran 940 million (bbl/d)
April 1971 - Aug 1971
Nationalization of oil industry in Algeria 90 million (bbl/d)
April 1986 Strike in UK’s – Frigg area natural gas production facilities N/A
April 2002 Strike at Venezuelan PdVSA which was generalized in all Venezuela N/A
December 2003 Strike in Venezuela 3 million (bbl/d) June 2004 - Aug 2004
Attacks at the Kirkuk – Ceyhan oil pipeline N/A
December 2004 Seizure of 3 oil flow stations in Nigeria 100,000 (bbl/d)
March 2005 Indefinite closure of Kirkuk-Ceyhan oil pipeline 600,000 (bbl/d)
May 2005 Strike in France’s oil refinery N/A July 2005 Strike in Angola’s oil project N/A
August 2005 Protests in Equador’s oil producing provinces N/A
September 2005 Strike in France, Total’s facilities 343,000 (bbl/d)
October 2005 Strike in Nigeria’s crude oil export terminal N/A
October 2005 Strike at the Royal Dutch Shell’s Pernis refinery N/A
February 2006 Protests in Equador – shutting down all crude oil production N/A
Sources: Horsnell (2000)[10], EIA [11]. R3. Terrorist Attacks: Terrorist attacks, though not so often, can cause serious damages in the energy supply procedure, either due to actual destructions or even because of the state of terror that a possible terrorism act creates. The most important terrorist attacks in the energy supply include two incidents and are mentioned and described below. In November 1997, a terrorist attack occurred when a bomb exploded in an on-shore Algerian section of the Trans-Mediterranean pipeline between Tunisia and Italy. Supplies were maintained through security storage and through additional imports by alternative suppliers, thus, limiting any further

Security of Supply & Risk of Energy Availability
Editors: Haris Doukas, Alexandros Flamos & John Psarras Page 34
problems. This incident, though, triggered the fear for more similar incidents, due to the civil disturbances that were taking place at that time in Algeria [1]. Finally, in October 2002, a French oil tanker, chartered by Malaysian state oil company Petronas, was attacked off the coast of Yemen. As a result, the tanker named VLCC, which was carrying about 400,000 barrels of oil, suffered serious damage (it caught fire) and one crew member was killed. Table 2.4: Terrorist Attacks Incidents
Period Incident Loss of Supply November 1997 Bomb explosion in the Trans-
Mediterranean pipeline N/A
October 2002 Attack at French oil tanker 400,000 bbl R4. Export Restrictions: Embargoes on oil, placed by exporting countries towards particular importing countries (e.g. the Arab oil embargo of 1973) have as a consequence the reallocation of the national market’s supply. Distortion of the national trade can, also, be caused by UN’s supply embargo against selected exporting countries or by embargoes against foreign investment of fund or technology in their oil industries (e.g. UN sanctions on Iraq). Based on the historical records, the probability of UN embargoes against the exporters is higher than the one of the exporters against the importers. In addition, the involvement of countries that do not import from the under restriction country in such a national and political scene is inevitable [8]. Shipments of crude oil through the IPC (Iraq Petroleum Company) pipeline in Syria were halted for three months in 1966 and 1967 due to a dispute over transit fees between IPC and the government of Syria. Furthermore, in June 2001 and since July 1991 the interruption of Iraq’s oil exportation was imposed. Finally, in April 2002, Iraq announced the forthcoming interruption of its “oil-for-food” exports for 30 days as a gesture of support for the Palestinians’ struggle with Israel. Table 2.5: Export Restriction Incidents
Period Incident Loss of Supply Dec 1966 - March 1967 Syrian oil transit dispute 65 million (bbl/d)
Oct 1973 - March 1974 Arab oil embargo N/A
1991 - 2001 Interruption of Iraq’s oil exportation N/A
April 2002 Iraq’s halting its “oil-for-food” exports N/A
Chapter 2: Risks on Energy Security of Supply: An Exploratory Analysis for the Researcher
M. Flouri et al. Page 35
R5. Accidents: Among all factors that are potential risks, during the energy supply procedure, accidents play a very crucial role. For example the explosion that took place in 1998, in an on shore processing plant in the Australian state of Victoria caused the interruption of natural gas supplies to all customers throughout the entire state for two weeks [12]. In July 2000, the UK Interconnector, the sub-sea natural gas pipeline and terminal facilities that provide a strategic bi-directional link between the UK and Continental Europe, was interrupted for one month due to a breakdown. It is believed that this interruption was a fake one, in an effort to alter the prices, considering the fact that even small interruptions of the energy supply cause disproportionate spikes in energy prices [13]. Furthermore, the El Paso natural gas disruption in New Mexico is a characteristic example of how accidents can affect the energy supply procedure. In August 2000, one of the three parallel interstate pipelines blew up, causing the temporary shut-down of the other two. This resulted in a 60% decrease in the usual flow, of 2 billion cubic feet per day, from El Paso to the Natural Gas markets in Arizona and California, for several weeks. However, an IEA study on the effects of this disruption concluded that these markets were able to make, in an independent way, the appropriate adjustments, in order to avoid severe natural gas shortages, as a result of the El Paso disruptions [6]. This was accompanied by soaring natural gas prices, on a temporary basis. According to IEA, the system relied on alternate transportation, natural gas from storage, or other non-natural gas remedies, such as switching to other fuels to supplement the loss of natural gas supplies [14]. In addition, in March 2005, an explosion occurred at BP’s Texas City oil refinery, caused the death of 15 people and the injury of more than 70. In August 2005, BP shut in the production of its 120,000bbl/d Shiehallion oil field, in the UK sector of the North Sea, due to a fire in the staff facilities. The fire was representative of the problems that impaired North Sea’s oil production in August 2005, such as non-scheduled outages, resulting in the reduction of the production by more than 250,000 bbl/d [8]. Moreover, in March 2006, workers at the Prudhoe Bay oil field in Alaska discovered a leak in a pipeline, something that forced the field operator BP, to shut in 100,000 bbl/d of crude oil production. A fire, also, at the Impianti Nord refinery in Sicily, Italy, caused the shut-down of the 160,000 bbl/d facility, in April 2006. Another fire damaged the Khor al- Amaya oil export terminal, in Iraq, forcing it to closure, in June 2006. Furthermore, in July 2006, a leak at the Royal Dutch Shell-operated pipeline in Nigeria shut in 180,000 bbl/d of crude oil production, forcing the company to declare “force majeure” on its Bonny Light August loadings. Finally, in August 2006, UK-
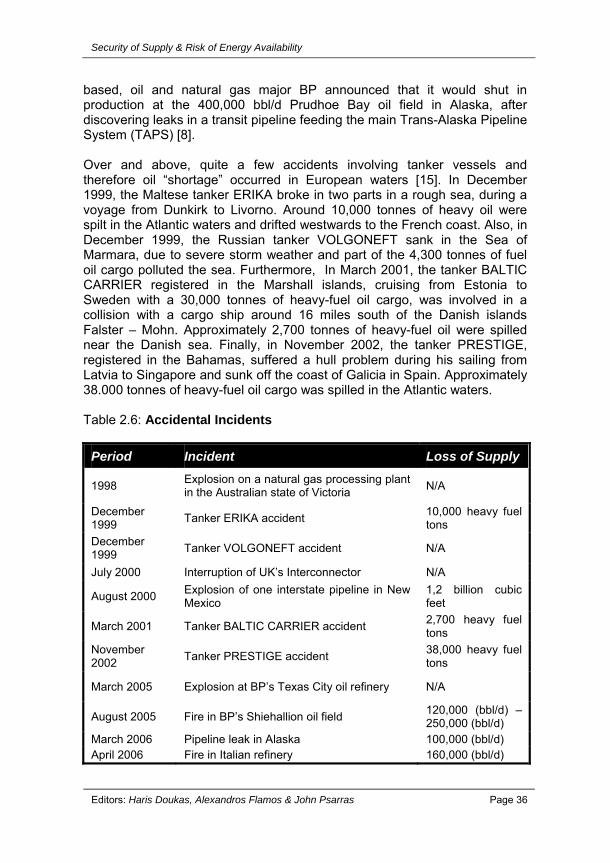
Security of Supply & Risk of Energy Availability
Editors: Haris Doukas, Alexandros Flamos & John Psarras Page 36
based, oil and natural gas major BP announced that it would shut in production at the 400,000 bbl/d Prudhoe Bay oil field in Alaska, after discovering leaks in a transit pipeline feeding the main Trans-Alaska Pipeline System (TAPS) [8]. Over and above, quite a few accidents involving tanker vessels and therefore oil “shortage” occurred in European waters [15]. In December 1999, the Maltese tanker ERIKA broke in two parts in a rough sea, during a voyage from Dunkirk to Livorno. Around 10,000 tonnes of heavy oil were spilt in the Atlantic waters and drifted westwards to the French coast. Also, in December 1999, the Russian tanker VOLGONEFT sank in the Sea of Marmara, due to severe storm weather and part of the 4,300 tonnes of fuel oil cargo polluted the sea. Furthermore, In March 2001, the tanker BALTIC CARRIER registered in the Marshall islands, cruising from Estonia to Sweden with a 30,000 tonnes of heavy-fuel oil cargo, was involved in a collision with a cargo ship around 16 miles south of the Danish islands Falster – Mohn. Approximately 2,700 tonnes of heavy-fuel oil were spilled near the Danish sea. Finally, in November 2002, the tanker PRESTIGE, registered in the Bahamas, suffered a hull problem during his sailing from Latvia to Singapore and sunk off the coast of Galicia in Spain. Approximately 38.000 tonnes of heavy-fuel oil cargo was spilled in the Atlantic waters. Table 2.6: Accidental Incidents
Period Incident Loss of Supply
1998 Explosion on a natural gas processing plant in the Australian state of Victoria N/A
December 1999 Tanker ERIKA accident 10,000 heavy fuel
tons December 1999 Tanker VOLGONEFT accident N/A
July 2000 Interruption of UK’s Interconnector N/A
August 2000 Explosion of one interstate pipeline in New Mexico
1,2 billion cubic feet
March 2001 Tanker BALTIC CARRIER accident 2,700 heavy fuel tons
November 2002 Tanker PRESTIGE accident 38,000 heavy fuel
tons
March 2005 Explosion at BP’s Texas City oil refinery N/A
August 2005 Fire in BP’s Shiehallion oil field 120,000 (bbl/d) – 250,000 (bbl/d)
March 2006 Pipeline leak in Alaska 100,000 (bbl/d) April 2006 Fire in Italian refinery 160,000 (bbl/d)

Chapter 2: Risks on Energy Security of Supply: An Exploratory Analysis for the Researcher
M. Flouri et al. Page 37
June 2006 Fire at an oil export terminal in Iraq N/A
July 2006 Leak at a Nigerian oil pipeline 180,000 (bbl/d)
August 2006 Leaks on a transit pipeline feeding TAPS 400,000 (bbl/d)
R6. Weather Conditions: Regarding this category, weather conditions, the accidents in energy supply occurred due to extreme weather conditions and are not so few. With reference to the natural gas market, IEA mentions the examples of Canada during the winter of 1992 - 1993 and the USA in January 1994 [16]. Recently, cold weather threatened the Dutch transmission system, where storage facilities had to be addressed in order to prevent the interruption of natural gas deliveries. In October 2002, hurricane Lili made its landfall on the US Gulf coast after passing through offshore hydrocarbon production areas and the Louisiana Offshore Oil Port (LOOP). Nearly all offshore production (about 15 million bbl/d of oil production) as well as some on-shore refineries were shut down. In September 2004, hurricane Ivan forced Shell Oil Co., Chevron Texaco, ExxonMobil and Total to shut in some hundreds of thousands of barrels per day of Gulf of Mexico’s production, as the companies proceeded to the evacuation of more than 3,000 workers from the off-shore platform. In addition, in July 2005, tropical storm Cindy disrupted oil and natural gas production in the US Gulf of Mexico (GOM) region. The storm caused the shut-down of oil and natural gas platforms and forced the closure of Louisiana Offshore Oil Port (LOOP), the largest US oil import terminal. Cindy also caused some oil refineries in the region to cease operations. Furthermore, in July 2005, hurricane Denis, caused serious damage to the Thunder Horse project, a semi-submersible platform under development by BP. At the same month hurricane Emily shut in most of Mexico’s offshore oil production in the Gulf of Mexico region. Additionally, in August 2005, hurricane Katrina stroke in the US Gulf of Mexico (GOM) region near New Orleans, severely impacting local oil and natural gas production. One month later, in September 2005, hurricane Rita made its landfall along the US Gulf Coast. Energy companies operating in the region shut in almost all oil and natural gas production in anticipation of the storm. Refiners also, shut in over 3,9 million bbl/d of refining capacity, which along with the refining capacity that they had already shut down, due to damage caused by hurricane Katrina, represented over one quarter of total US capacity. Finally, in December 2005, oil tankers transiting the Bosporus Straits faced delays of 19 days, due to poor weather and increased tanker traffic.
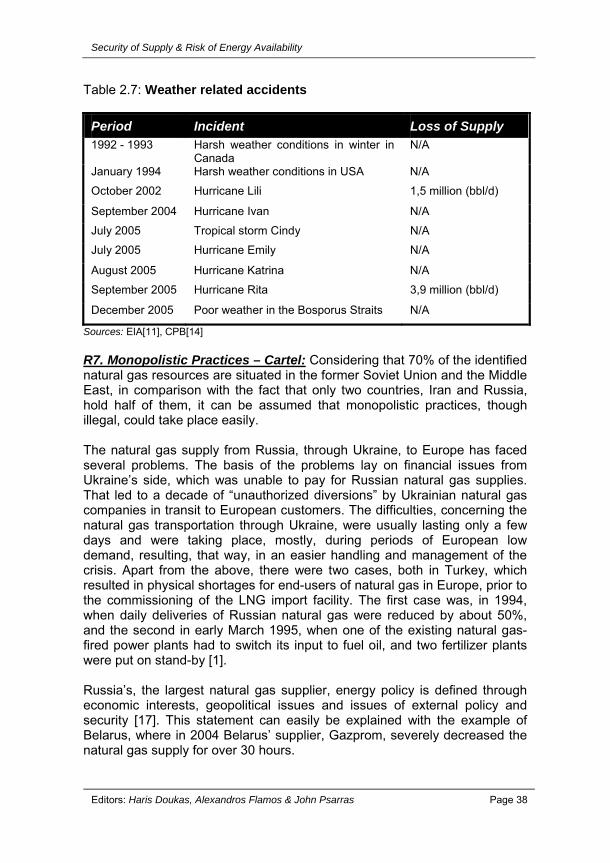
Security of Supply & Risk of Energy Availability
Editors: Haris Doukas, Alexandros Flamos & John Psarras Page 38
Table 2.7: Weather related accidents
Period Incident Loss of Supply 1992 - 1993 Harsh weather conditions in winter in
Canada N/A
January 1994 Harsh weather conditions in USA N/A
October 2002 Hurricane Lili 1,5 million (bbl/d)
September 2004 Hurricane Ivan N/A
July 2005 Tropical storm Cindy N/A
July 2005 Hurricane Emily N/A
August 2005 Hurricane Katrina N/A
September 2005 Hurricane Rita 3,9 million (bbl/d)
December 2005 Poor weather in the Bosporus Straits N/A
Sources: EIA[11], CPB[14] R7. Monopolistic Practices – Cartel: Considering that 70% of the identified natural gas resources are situated in the former Soviet Union and the Middle East, in comparison with the fact that only two countries, Iran and Russia, hold half of them, it can be assumed that monopolistic practices, though illegal, could take place easily. The natural gas supply from Russia, through Ukraine, to Europe has faced several problems. The basis of the problems lay on financial issues from Ukraine’s side, which was unable to pay for Russian natural gas supplies. That led to a decade of “unauthorized diversions” by Ukrainian natural gas companies in transit to European customers. The difficulties, concerning the natural gas transportation through Ukraine, were usually lasting only a few days and were taking place, mostly, during periods of European low demand, resulting, that way, in an easier handling and management of the crisis. Apart from the above, there were two cases, both in Turkey, which resulted in physical shortages for end-users of natural gas in Europe, prior to the commissioning of the LNG import facility. The first case was, in 1994, when daily deliveries of Russian natural gas were reduced by about 50%, and the second in early March 1995, when one of the existing natural gas-fired power plants had to switch its input to fuel oil, and two fertilizer plants were put on stand-by [1]. Russia’s, the largest natural gas supplier, energy policy is defined through economic interests, geopolitical issues and issues of external policy and security [17]. This statement can easily be explained with the example of Belarus, where in 2004 Belarus’ supplier, Gazprom, severely decreased the natural gas supply for over 30 hours.
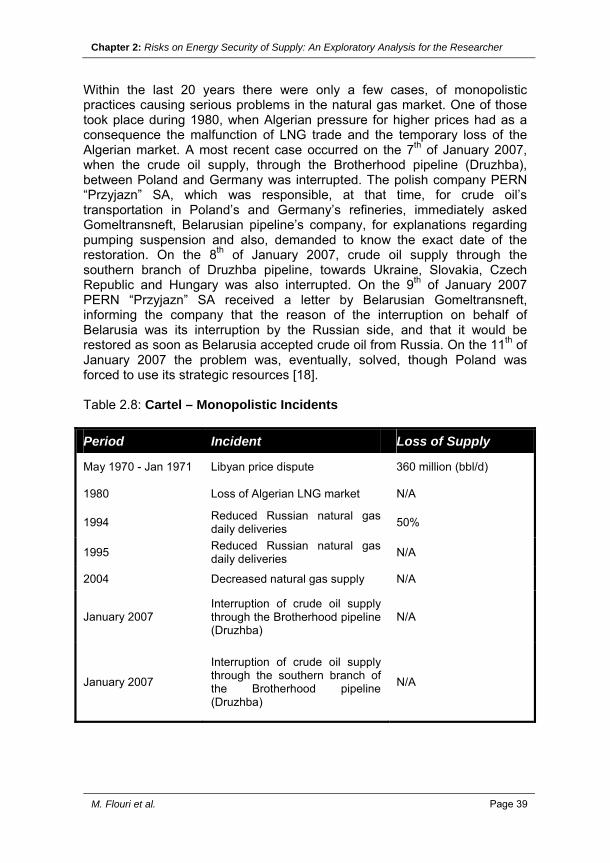
Chapter 2: Risks on Energy Security of Supply: An Exploratory Analysis for the Researcher
M. Flouri et al. Page 39
Within the last 20 years there were only a few cases, of monopolistic practices causing serious problems in the natural gas market. One of those took place during 1980, when Algerian pressure for higher prices had as a consequence the malfunction of LNG trade and the temporary loss of the Algerian market. A most recent case occurred on the 7th of January 2007, when the crude oil supply, through the Brotherhood pipeline (Druzhba), between Poland and Germany was interrupted. The polish company PERN “Przyjazn” SA, which was responsible, at that time, for crude oil’s transportation in Poland’s and Germany’s refineries, immediately asked Gomeltransneft, Belarusian pipeline’s company, for explanations regarding pumping suspension and also, demanded to know the exact date of the restoration. On the 8th of January 2007, crude oil supply through the southern branch of Druzhba pipeline, towards Ukraine, Slovakia, Czech Republic and Hungary was also interrupted. On the 9th of January 2007 PERN “Przyjazn” SA received a letter by Belarusian Gomeltransneft, informing the company that the reason of the interruption on behalf of Belarusia was its interruption by the Russian side, and that it would be restored as soon as Belarusia accepted crude oil from Russia. On the 11th of January 2007 the problem was, eventually, solved, though Poland was forced to use its strategic resources [18]. Table 2.8: Cartel – Monopolistic Incidents Period Incident Loss of Supply
May 1970 - Jan 1971 Libyan price dispute 360 million (bbl/d)
1980 Loss of Algerian LNG market N/A
1994 Reduced Russian natural gas daily deliveries 50%
1995 Reduced Russian natural gas daily deliveries N/A
2004 Decreased natural gas supply N/A
January 2007 Interruption of crude oil supply through the Brotherhood pipeline (Druzhba)
N/A
January 2007
Interruption of crude oil supply through the southern branch of the Brotherhood pipeline (Druzhba)
N/A

Security of Supply & Risk of Energy Availability
Editors: Haris Doukas, Alexandros Flamos & John Psarras Page 40
2.3. RISKS QUALITATIVE ASSESSMENT
In the previous sections an indicative categorization of risks was defined, along with the identification and description of actual incidents that, historically, have led to energy supply disruptions and shortages.
In Table 2.9 the connection between the categorization and the actual incidents is illustrated, by estimating their occurrence probability and the result of their impact. Table 2.9: Qualitative Assessment of Related Risks Risk Categories Probability Impact Oil Natural
Gas Oil Natural
Gas
R1. Conflicts ++ - ++ ++
R2: Political Instability ++ - ++ ++
R3: Terrorist Attacks - - - -
R4: Export Restriction + - + +
R5: Accidents + + + +
R6: Weather + + - -
R7: Monopolistic Practices – Cartel ++ ++ ++ ++
++: High, +: Medium, -: Low Based on the above-mentioned Table, the following points can be underlined: • Incidents concerning oil supply are more than those concerning natural
gas supply. • The probability of coming across an energy supply interruption incident
is much higher for the case of oil than for the case of natural gas. • However, the impact in the case of an oil interruption incident is the
same as the impact in the case of a natural gas supply interruption incident.
• Incidents that have taken place fifty years ago must be taken into serious consideration, as there is always the possibility to occur again, especially regarding the unstable situation prevailing in the Middle East.

Chapter 2: Risks on Energy Security of Supply: An Exploratory Analysis for the Researcher
M. Flouri et al. Page 41
CONCLUSIONS This chapter reviewed the possible risks in the energy supply and presented their consequences. The most important conclusions, regarding each risk category, are presented below. • R1: Incidents concerning conflicts seem to reappear, followed by severe
consequences. Even though the areas involved in wars or civil conflicts are, mostly, non-European, their contribution in energy production and distribution is grand. Therefore, their serious consideration is more than crucial.
• R2: Political instability, regime change, revolutions, strikes and other forms of protest never rest throughout the years. Since each of the above can cause grave insecurity and consequences in the energy supply chain they ought to be taken into critical account.
• R3: Although not many terrorist attack incidents have been noted, their importance is not less, due to the fear and outcome one single event can cause.
• R4: Embargoes and export restriction incidents, in general, may not be numerous, but they can be considered as quite recent. Distortion of a national energy trade can end up having broader “complications”.
• R5: Accidents play a crucial role in the energy supply procedure, due to their uncertain nature. Various accidents have been reported in this chapter, which have caused serious losses in supply. Such risks though difficult to foresee, should be taken under thoughtful consideration.
• R6: Since 1992, and mostly during 2005, weather conditions have caused serious interruptions in the energy supply chain. Nowadays, extreme weather conditions tend to replace, to some extent, wars and civil conflicts, pointing out their importance.
• R7: Though monopolistic practices are illegal, the geographical allocation of oil and natural gas resources has caused a certain amount of related incidents. This indicates that such practices are neither difficult, nor improbable to occur, causing general discomfort.
With reference to the qualitative assessment of the related risks the following main points can be deduced. • Oil Risk Probability: Considering oil supply, the probability of a risk to
occur is medium and high in almost all risk categories, with the exception of R3. It is, also, important to note that incidents which concerned the oil supply were more than those concerning the natural gas supply.

Security of Supply & Risk of Energy Availability
Editors: Haris Doukas, Alexandros Flamos & John Psarras Page 42
• Oil Risk Impact: The impact of a risk actually occurring, in the case of oil supply, is, also, medium and high in, almost, all categories, with the exceptions of R3 and R6. In these categories the actual incidents have shown that whenever such a risk was taking place, the impact was at a minimum level.
• Gas Risk Probability: Considering natural gas supply, the probability of a risk to occur is low in almost all categories with the three exceptions of R5, R6 and R7. Generally, the probability of coming across an energy supply interruption incident is much lower for the case of natural gas than for the case of oil.
• Gas Risk Impact: Even though the probability of a risk to take place is quite low for the case of natural gas, the impact of a risk occurring in the gas supply is exactly the same as it is in the oil supply. This conclusion points out that, although, probabilities are low, the impact factor should be taken under serious consideration.
The overview of the oil and natural gas market, and, the related risks and incidents, clearly indicate that even today the risks are many. War and civil conflicts might have been replaced, to some extent, by weather conditions and monopolistic practises, but they are still playing a crucial factor in energy supply. Therefore, risks may have altered their nature, but their impact on international markets and global energy supply remains of great importance. Considering the importance of the energy supply risk issue, a great number of future potential research areas can be recognised so as to achieve an integrated examination of the subject. The quantification and assessment, of each risk’s probabilities is a really demanding and important task, almost never attempted. The situation is the same for the impact of each risk, as well. Wouldn’t it be scientifically valuable to numerically acknowledge each risk’s impact? To sum up, it is obvious that the security of energy supply is a critical issue that will concern scientists for the years to come, as energy could be considered as “the global lever”.

Chapter 2: Risks on Energy Security of Supply: An Exploratory Analysis for the Researcher
M. Flouri et al. Page 43
REFERENCES
[1] Jonathan Stern (2002). Security of European Natural Gas Supplies, The Impact of Import Dependence and Liberalization. The Royal Institute of International Affairs, Sustainable Development Programme. [2] J. Bielecki (2002). Energy Security: is the wolf at the door?. The Quarterly Review of Economics and Finance, vol. 42, no 2, p. 235-250. [3] Hellmuth Weisser (2005). The Security of Gas Supply, A Critical Issue for Europe. ENERGY POLICY. [4] G. Luciani (2004). Security of Supply for Natural Gas Markets: What is it and what is not?. FEEM Working Paper no 119.04. [5] C. Egenhofer, K. Gialoglou, G. Luciani, M. Boots, M. Scheepers, V. Constantini, F. Gracceva, A. Mankandya, G. Vicini (2004). Market-based Options for Security of Energy Supply. IEM Working Paper No 117.04. [6] IEA. World Energy Outlook 2000, p147. [7] BP Almoco (1999). BP Almoco Statistical Review of World Energy, 1999. [8] John V. Mitchell (2002). Renewing Energy Security. The Royal Institute for International Affairs, Sustainable Development Programme. [9] Bassam Fattouh (2007). How Secure are Middle East Oil Supplies. Oxford Institute for Energy Studies, WPM 33. [10] P. Horsnell (2000). The Probability of Oil Market Disruption with an Emphasis on the Middle East. Working Paper published by James A. Baker Institute for Public Policy. [11] Energy Information Administration (2007). International Energy Outlook. [12] The Longford Royal Commission (1999). The Esso Longford Gas Plant Accident Report. Government Printer for the State of Victoria. No61, Session 1998-1999. [13] INDES Study – Executive Summary (2004). Insurance against Disruptions of Energy Supply, IEA 2004. Security of Gas Supply in Open Markets.
Security of Supply & Risk of Energy Availability
Editors: Haris Doukas, Alexandros Flamos & John Psarras Page 44
[14] J. De Joode, D. Kingma, M. Lijesen, M. Mulder, V. Shestalova (2004). Energy Policies and Risks on Energy Markets, A Cost-Benefit Analysis. Netherlands Bureau for Economic Policy Analysis. [15] A. Bigano, M. Cassinelli, A. Markandya, F. Sferra (2004). The Role of Risk Aversion and Lay Risk in the Probabilistic Externality Assessment for Oil Tanker Routes to Europe: A Methodological Note. Technical Paper No 1.7a – RS1c. NEEDS. [16] IEA – International Energy Agency (1995). The IEA Natural Gas Security Study, Paris. [17] Notzold & Konrad Adenauer Stiftung (2004). Die europaische Strategie zur Energieversorgungssicherheit. [18] Malgorzata Palinska (2004). Security of Oil and Gas Supplies to Poland. Deliverable No 3.2 – RS 3b. Proceedings of the Second Forum – NEEDS.

Chapter 3: Security of Supply and the New European Energy Policy
S. Verde Page 45
Chapter 3: SECURITY OF SUPPLY AND THE NEW EUROPEAN ENERGY POLICY Stefano Verde RIE – Ricerche Industriali ed Energetiche - Bologna, Italy Security of supply is one of the main concerns for the European Union, aiming to reach a sustainable, competitive and secure energy market. In the latest years, the EU set main objectives and targets to develop a new energy policy and some measures focusing on a single aim may affect other ones as well. In this view, this short contribution is intended to shed some light and to provide a first insight with regard to the relationships between sustainability and security objectives. As a consequence, this chapter focuses on the latest measures proposed by the EU institutions to promote renewable energies and energy efficiency, trying to identify the main effects of these measures on the European energy security.

Security of Supply & Risk of Energy Availability
Editors: Haris Doukas, Alexandros Flamos & John Psarras Page 46
INTRODUCTION Security of supply is one of the main objectives put forward by the European Commission in order to reshape the energy industry in the coming years. Main objectives were included in the 2006 Green Paper (European Commission, 2006a) and identified as it follows: sustainability, competitiveness and supply security of energy markets, giving rise to the well-known “triangle graph”, underlining existing relationships between each objectives pair. Following the 2006 Green Paper and other calls from institutions (i.e. the European Parliament), industries and communities, the Spring 2007 European Council reached an agreement on the action plan named “Energy Policy for Europe” (Annex I, of European Council, 2007), regarded as the current European Union (EU) energy policy milestone. Briefly, the action plan set main goals known as the “20-20-20 targets” among which it is particularly relevant for our purposes to focus on: • a 20% energy consumption reduction, to be calculated on 2020 baseline
projections, to be reached by 2020; • the promotion of Renewable Energy Sources (RES) in the aim their
consumption share will amount to 20% by 2020; • a similar promotion of biofuels to increase their road transport final
consumption share to 10% by 2020; • a unilateral commitment for a 20% reduction of greenhouse gases
(GHG) emissions by 2020, compared to their base-year levels (1990). This objective may be increased to 30% in a globally cooperative framework.
Following the Council conclusions, the European Commission was asked to define and to present a comprehensive legislative “road map” to reach the above-mentioned targets at a EU level. In this framework, on 23rd January 2008 the Commission published its “Climate Action” package, including some initial proposed measures to tackle the climate change challenge. After summarizing the very main stages of the current energy policy, this work aims to provide some basic observations about the relationship between the sustainability targets, as set forth by the European Council in its action plan (i.e. RES, energy efficiency) with security of supply ones. Relationships among all these variables are complex, several tradeoffs exist and it is necessary to bear in mind advantages and disadvantages coming from each measure, in order to choose and to adopt the best policy mix.
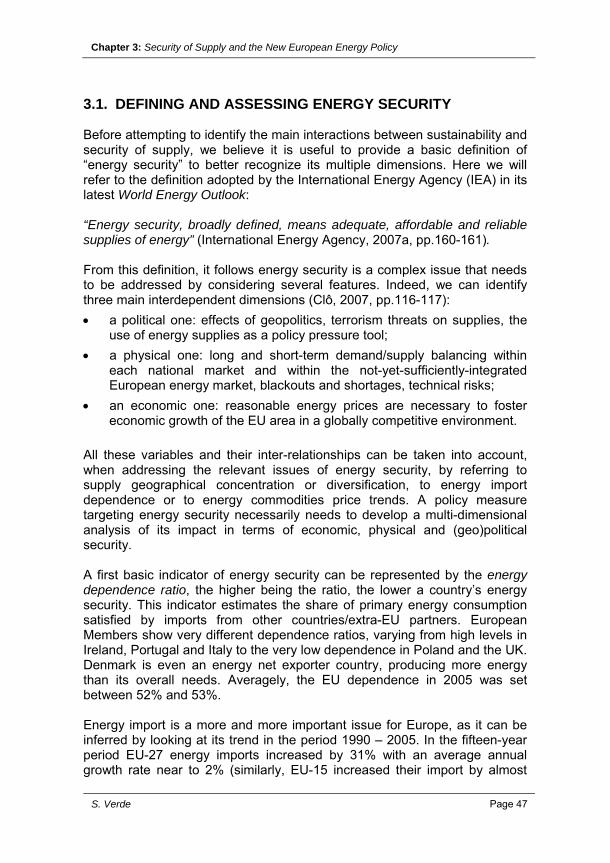
Chapter 3: Security of Supply and the New European Energy Policy
S. Verde Page 47
3.1. DEFINING AND ASSESSING ENERGY SECURITY Before attempting to identify the main interactions between sustainability and security of supply, we believe it is useful to provide a basic definition of “energy security” to better recognize its multiple dimensions. Here we will refer to the definition adopted by the International Energy Agency (IEA) in its latest World Energy Outlook: “Energy security, broadly defined, means adequate, affordable and reliable supplies of energy” (International Energy Agency, 2007a, pp.160-161). From this definition, it follows energy security is a complex issue that needs to be addressed by considering several features. Indeed, we can identify three main interdependent dimensions (Clô, 2007, pp.116-117): • a political one: effects of geopolitics, terrorism threats on supplies, the
use of energy supplies as a policy pressure tool; • a physical one: long and short-term demand/supply balancing within
each national market and within the not-yet-sufficiently-integrated European energy market, blackouts and shortages, technical risks;
• an economic one: reasonable energy prices are necessary to foster economic growth of the EU area in a globally competitive environment.
All these variables and their inter-relationships can be taken into account, when addressing the relevant issues of energy security, by referring to supply geographical concentration or diversification, to energy import dependence or to energy commodities price trends. A policy measure targeting energy security necessarily needs to develop a multi-dimensional analysis of its impact in terms of economic, physical and (geo)political security. A first basic indicator of energy security can be represented by the energy dependence ratio, the higher being the ratio, the lower a country’s energy security. This indicator estimates the share of primary energy consumption satisfied by imports from other countries/extra-EU partners. European Members show very different dependence ratios, varying from high levels in Ireland, Portugal and Italy to the very low dependence in Poland and the UK. Denmark is even an energy net exporter country, producing more energy than its overall needs. Averagely, the EU dependence in 2005 was set between 52% and 53%. Energy import is a more and more important issue for Europe, as it can be inferred by looking at its trend in the period 1990 – 2005. In the fifteen-year period EU-27 energy imports increased by 31% with an average annual growth rate near to 2% (similarly, EU-15 increased their import by almost
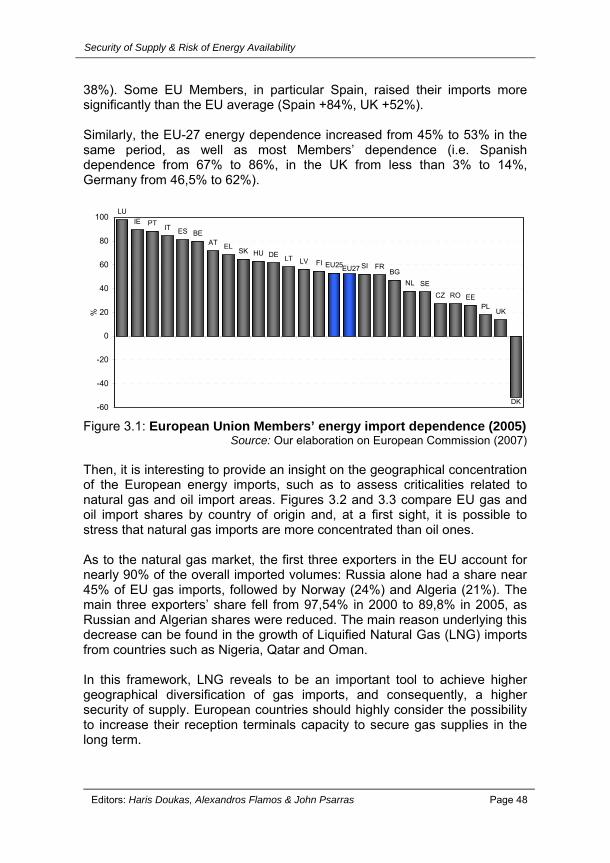
Security of Supply & Risk of Energy Availability
Editors: Haris Doukas, Alexandros Flamos & John Psarras Page 48
38%). Some EU Members, in particular Spain, raised their imports more significantly than the EU average (Spain +84%, UK +52%). Similarly, the EU-27 energy dependence increased from 45% to 53% in the same period, as well as most Members’ dependence (i.e. Spanish dependence from 67% to 86%, in the UK from less than 3% to 14%, Germany from 46,5% to 62%).
LUIE PT IT ES BE
AT EL SK HU DE LT LV FI EU25 SI FRBG
NL SECZ RO EE
PLUK
DK
EU27
-60
-40
-20
0
20
40
60
80
100
%
Figure 3.1: European Union Members’ energy import dependence (2005)
Source: Our elaboration on European Commission (2007) Then, it is interesting to provide an insight on the geographical concentration of the European energy imports, such as to assess criticalities related to natural gas and oil import areas. Figures 3.2 and 3.3 compare EU gas and oil import shares by country of origin and, at a first sight, it is possible to stress that natural gas imports are more concentrated than oil ones. As to the natural gas market, the first three exporters in the EU account for nearly 90% of the overall imported volumes: Russia alone had a share near 45% of EU gas imports, followed by Norway (24%) and Algeria (21%). The main three exporters’ share fell from 97,54% in 2000 to 89,8% in 2005, as Russian and Algerian shares were reduced. The main reason underlying this decrease can be found in the growth of Liquified Natural Gas (LNG) imports from countries such as Nigeria, Qatar and Oman. In this framework, LNG reveals to be an important tool to achieve higher geographical diversification of gas imports, and consequently, a higher security of supply. European countries should highly consider the possibility to increase their reception terminals capacity to secure gas supplies in the long term.
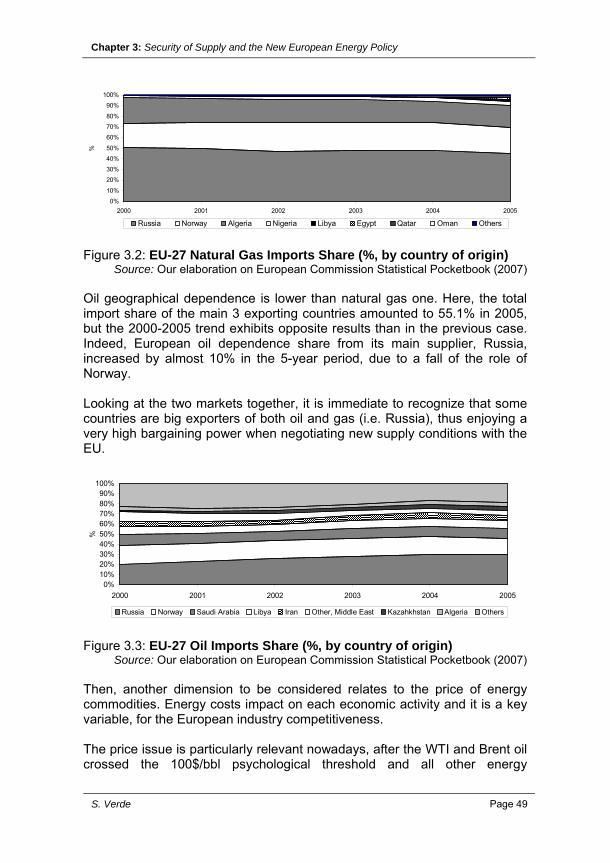
Chapter 3: Security of Supply and the New European Energy Policy
S. Verde Page 49
0%10%
20%30%40%50%
60%70%80%
90%100%
2000 2001 2002 2003 2004 2005
%
Russia Norway Algeria Nigeria Libya Egypt Qatar Oman Others Figure 3.2: EU-27 Natural Gas Imports Share (%, by country of origin)
Source: Our elaboration on European Commission Statistical Pocketbook (2007) Oil geographical dependence is lower than natural gas one. Here, the total import share of the main 3 exporting countries amounted to 55.1% in 2005, but the 2000-2005 trend exhibits opposite results than in the previous case. Indeed, European oil dependence share from its main supplier, Russia, increased by almost 10% in the 5-year period, due to a fall of the role of Norway. Looking at the two markets together, it is immediate to recognize that some countries are big exporters of both oil and gas (i.e. Russia), thus enjoying a very high bargaining power when negotiating new supply conditions with the EU.
0%10%20%30%40%50%60%70%80%90%
100%
2000 2001 2002 2003 2004 2005
%
Russia Norway Saudi Arabia Libya Iran Other, Middle East Kazahkhstan Algeria Others Figure 3.3: EU-27 Oil Imports Share (%, by country of origin)
Source: Our elaboration on European Commission Statistical Pocketbook (2007) Then, another dimension to be considered relates to the price of energy commodities. Energy costs impact on each economic activity and it is a key variable, for the European industry competitiveness. The price issue is particularly relevant nowadays, after the WTI and Brent oil crossed the 100$/bbl psychological threshold and all other energy
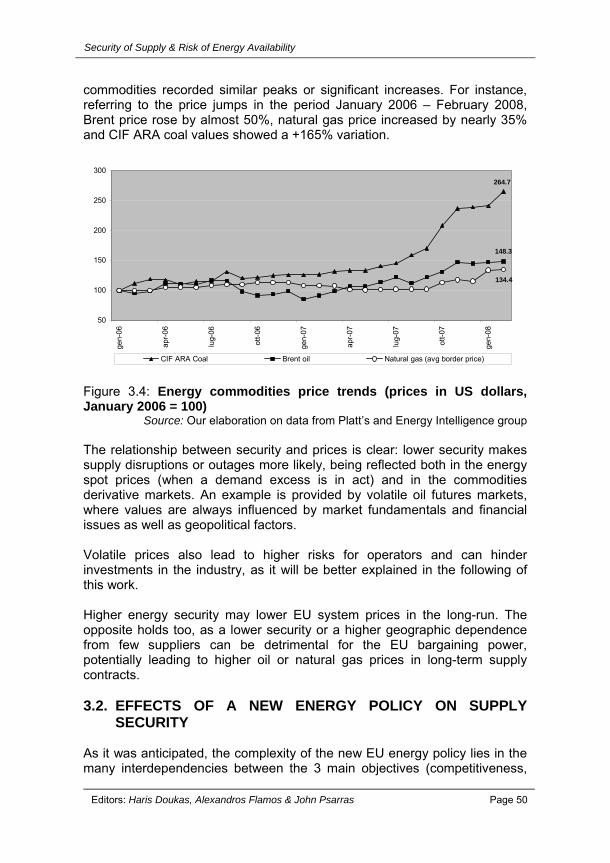
Security of Supply & Risk of Energy Availability
Editors: Haris Doukas, Alexandros Flamos & John Psarras Page 50
commodities recorded similar peaks or significant increases. For instance, referring to the price jumps in the period January 2006 – February 2008, Brent price rose by almost 50%, natural gas price increased by nearly 35% and CIF ARA coal values showed a +165% variation.
264.7
148.3
134.4
50
100
150
200
250
300
gen-
06
apr-0
6
lug-
06
ott-0
6
gen-
07
apr-0
7
lug-
07
ott-0
7
gen-
08
CIF ARA Coal Brent oil Natural gas (avg border price) Figure 3.4: Energy commodities price trends (prices in US dollars, January 2006 = 100)
Source: Our elaboration on data from Platt’s and Energy Intelligence group The relationship between security and prices is clear: lower security makes supply disruptions or outages more likely, being reflected both in the energy spot prices (when a demand excess is in act) and in the commodities derivative markets. An example is provided by volatile oil futures markets, where values are always influenced by market fundamentals and financial issues as well as geopolitical factors. Volatile prices also lead to higher risks for operators and can hinder investments in the industry, as it will be better explained in the following of this work. Higher energy security may lower EU system prices in the long-run. The opposite holds too, as a lower security or a higher geographic dependence from few suppliers can be detrimental for the EU bargaining power, potentially leading to higher oil or natural gas prices in long-term supply contracts. 3.2. EFFECTS OF A NEW ENERGY POLICY ON SUPPLY
SECURITY As it was anticipated, the complexity of the new EU energy policy lies in the many interdependencies between the 3 main objectives (competitiveness,
Chapter 3: Security of Supply and the New European Energy Policy
S. Verde Page 51
security and sustainability) and the other more specific targets, as they were set by the Council and by the Commission. In this section we will focus on the relationships between sustainability and security of supply. An interesting quantitative and qualitative analysis on the interactions between these two policy areas has recently been released by the International Energy Agency (see IEA, 2007b). The Energy Policy for Europe (EPE) action plan set policy measures targeted both at the supply side (i.e. promotion of RES and biofuels) and at the demand one (i.e. energy efficiency), resulting in a very different 2020 energy mix, if compared to the baseline scenario. Thus, in Figure 3.5 we plotted current primary energy consumption by source, consumptions projections in 2020 under a Baseline scenario, as it was identified in the latest published PRIMES model estimates (European Commission, 2006b), and projected values under the assumption of a full achievement of the EPE mandatory measures. Not surprisingly, RES consumption would increase by 160% in the EPE scenario, to the detriment of fossil fuels. If compared to current levels (2005) coal consumption would be halved, oil use would be reduced by nearly one-fifth, nuclear energy would drop by almost 35% and natural gas consumption would record an 11% fall, which becomes a particularly relevant 29% decrease, if it is calculated on 2020 baseline projections.
280 320157
556 445
395
236257
168
204121
315
539
666693
0
200
400
600
800
1000
1200
1400
1600
1800
2000
2020 (Baseline) 2005 2020 (EPE)
mln
. toe
Coal Oil Natural Gas Nuclear Electricity Net Imports RES
-12,5% -50,9%
+4,1%-19,1%
+24,9%
-11,2%
-8,2%
-34,6%
+68,6%
+160,3%
Figure 3.5: A comparison of the EU-27 primary energy consumption: current situation, Baseline scenario and “Energy policy for Europe” scenario
Source: our elaboration on European Commission forecasts (PRIMES model, 2006)
Security of Supply & Risk of Energy Availability
Editors: Haris Doukas, Alexandros Flamos & John Psarras Page 52
Such a strong and deep intervention on the energy demand and supply sides is far from bringing no effect on the security of the industry, so we can easily identify both main positive and negative possible outcomes. First, advantages from an EPE action in terms of energy security are clearly found in lower import dependence. The reduction of EU overall energy consumption and the substitution of imported fossil fuels with domestically produced RES can improve the EU energy independence. In addition, a higher share of RES consumption is also likely to lead to a more balanced energy mix diversification. These advantages can be easily inferred by looking at Figures 3.6 and 3.7, where EU energy domestic production and imports are plotted under the two different above-mentioned scenarios. Note that following the IEA assumptions (IEA, 2007b, pp. 41), our elaboration also presumes that uranium imports are not accounted for in the energy imports share, as nuclear power is less prone to security risks (due to its particular use and geographic concentration). Therefore, nuclear energy is fully computed as “domestic production” in the figures here below.
0%10%20%30%40%50%60%70%80%90%
100%
1990 1995 2000 2005 2010 2020
mln
.toe
Coal Oil Natural Gas Nuclear RES Imports Figure 3.6: EU-27 Energy domestic production and net imports (Baseline scenario)
Source: our elaboration on European Commission forecasts (2006b)

Chapter 3: Security of Supply and the New European Energy Policy
S. Verde Page 53
0%10%20%30%40%50%60%70%80%90%
100%
1990 1995 2000 2005 2010 2020
mln
.toe
Coal Oil Natural Gas Nuclear RES Imports Figure 3.7: EU-27 Energy domestic production and net imports (EPE scenario)
Source: our elaboration on European Commission forecasts (2006b) As it appears from graphs, under the baseline scenario EU imports in 2020 will account for nearly 65% of energy consumption. Conversely, in the EPE hypothesis, imports will be stabilized, first, and then they will reduce nearly to a 48% share in 2020. A more diversified energy mix would also result in a lower exporting countries’ bargaining power. As to possible disadvantages coming from the EPE, in terms of energy security, we draw the attention on the expected rational behaviour of operators. If industry actors perceive the EU 20-20-20 commitment as a credible one, they will rationally drop their investments in other-than-RES capacity. Indeed, RES investments are now more profitable than fossil ones, thanks to subsidies and other incentive mechanisms granted to new renewable capacity. Theoretically, as far as fossil fuel energy is perfectly replaced by RES, as to timing and overall production, there will be no differences for the long-term balancing of the whole system, except for some technical issues and limits imposed by the architecture of electricity distribution networks. The ambitious objectives and the support policies which are going to be developed by each Member set the way for an unprecedented interest towards RES investments and, conversely, some planned traditional fuels new capacities or plant turnovers have already being dropped. In this regard, a first problem related to the time dimension arises. Will the RES growth rate be sufficient to set off against the fall in planned “traditional” investments? The whole supply security may be affected if this were not the case, as a transitory period characterized by higher-than-before energy imports or by a critical short-term supply/demand balancing could occur. To raise doubts about the likely growth rate of RES is legitimate, at least, if we think of slow authorization and administrative procedures to build new
Security of Supply & Risk of Energy Availability
Editors: Haris Doukas, Alexandros Flamos & John Psarras Page 54
capacity (i.e. Italy is an example of maillot noir in this respect, as a wind farm project needs from 27 to 84 months to be realized!) or if we refer to the still uncertain EU guarantees of origin trading system. By the way, a clear trading system is a necessary and essential tool to reach the renewable targets and to achieve an optimal economic and technical allocation too. Otherwise, RES investments, supported by incentives, will merely aim to achieve quantitative national targets, irrespectively of their optimal location and technical efficiency. Investments are the main driver common to all the three objectives of the EU energy policy. Investments in new generation and import capacity, together with a reduction in consumption, can bring back to supply excess conditions which prevailed in the Nineties and that revealed to be essential for promoting any competitive behaviour in this particular network industry. In addition, a supply excess and a stronger competition would also importantly affect energy prices, with benefits for residential and industrial consumers. Likewise, new interconnection capacity is crucial to foster effective competition, to move towards an integrated EU energy market and to allow for an easier short-term demand/supply balancing. Then, new RES generation capacity and the replacement of old traditional plants is also an essential move to reach EU 2020 emission targets. From the above, it is possible to draw a main preliminary conclusion. The “EU 20-20-20 targets”, are able to positively contribute to the achievement of the security of supply objectives set by the EU. Nonetheless, attention has to be paid as this “positive correlation” is not straightforward. Indeed, the road map to the full achievement of the overall energy market objectives would need to be more focused on how to give a new impetus to all energy investments, irrespective of their type, and how to change companies attitude to invest. Energy players recorded high earnings in the latest year, but these earnings were generally not used to invest in new capacity (in contrast with strategies of the previous decades), due to regulatory uncertainties, high capital market risks, long investment payback periods. Instead, main EU energy companies opted to use their revenues for M&As strategies, increasing their dimensions, both as a defensive measure and as strategic repositioning before a complete EU market integration, and their bargaining power when dealing with extra-EU energy giants (Verde, 2008). Conversely, it appears that the sole common “centre of mass” of the “policies triangle” (security, sustainability, competitiveness) is represented by an optimal and balanced amount of new investments.
Chapter 3: Security of Supply and the New European Energy Policy
S. Verde Page 55
ACKNOWLEDGEMENTS The author is grateful to Prof. Clô for his valuable suggestions and to the participants at the 1st REACCESS International Conference for their useful remarks. Usual disclaimers apply. REFERENCES [1] Clô A. (2007). I nuovi termini della sicurezza energetica fra stato e mercato. Economia e Politica Industriale; 34(3); 105-122. [2] European Commission (2006a). Green Paper – A European strategy for sustainable, competitive and secure energy. SEC(2006) 317. Available online at the following address: http://eur-lex.europa.eu/LexUriServ/LexUriServ.do?uri=COM:2006:0105:FIN:EN:PDF [3] European Commission (2006b). European energy and transport. Scenarios on energy efficiency and renewables. Available online at: http://ec.europa.eu/dgs/energy_transport/figures/pocketbook/doc/2007/2007_energy_en.pdf [4] European Commission (2007). Energy and transport in figures – Statistical Pocketbook 2007. The energy section is available online at: http://ec.europa.eu/dgs/energy_transport/figures/pocketbook/doc/2007/2007_energy_en.pdf [5] European Council (2007). Presidency conclusions, 8-9 March 2007. 7224/1/07 REV I. Available online at the following address http://www.consilium.europa.eu/ueDocs/cms_Data/docs/pressData/en/ec/93135.pdf [6] International Energy Agency (2007a). World Energy Outlook 2007: China and India insights. OECD/IEA publisher. [7] International Energy Agency (2007b). Energy security and climate policy – Assessing interactions. OECD/IEA publisher. [8] Verde S. (2008). Everybody merges with somebody – The wave of M&As in the energy industry and the EU merger policy. Energy Policy ; 36(3); 1125-1133.

Security of Supply & Risk of Energy Availability
Editors: Haris Doukas, Alexandros Flamos & John Psarras Page 56
Chapter 4: ENERGY SECURITY FROM A SYSTEMS ANALYSIS POINT OF VIEW: INTRODUCTORY REMARKS GianCarlo Tosato IEA/ETSAP – ASATREM Srl, Italy The concept of “energy services security” extends the security of supply to the energy system as a whole. Analyses encompass all energy systems technologies and commodities. The risk aspects of the single points of the chains can be combined to form a “system risk”. Another important result is that the same system and analytical tool is used for analyzing the effects of undesired events and remedial policies on all the three main objectives of energy policies: energy security, economic development and environment sustainability at the same time. The space of risky events is much wider and the evaluation of the damages more complete. The traditional policy of diversification is now extended from the energy sources to the dual fuel energy technologies.

Chapter 4: Energy Security from a Systems Analysis Point of View: Introductory Remarks
G. C. Tosato Page 57
4.1. AN EXTENDED CONCEPT OF ENERGY SECURITY In traditional analyses, energy security is dominated by concerns about oil and gas imports. This concept is reflected by the often used expression “energy supply security”. Talking about energy supply security appears restrictive from an energy system point of view. Energy systems include the extraction of primary energy, the satisfaction of the demands for energy services and all the chain of commodities and processes that link the latter to the former (see figure 4.1). Therefore, having in mind the whole energy system, it is necessary to extend the concept of energy security and talk about “energy services security”.
Figure 4.1: Example of a simplified Reference Energy System [27] This extended concept is much wider than securing the smooth behavior of the global crude or natural gas markets. It encompasses all the energy vectors and all steps of each energy chain, from the oil reservoir or coal mine to the passenger kilometers or the warm water demanded by end users. The rationale of extending the concept is clear. What matters is the security of supplying the economic producers with the energy service necessary to maximize their profits, and the final consumers – families and community systems – with the energy service that maximizes their utility. The implications of extending the concept of energy security to the satisfaction of energy services are wide ranged. The first and most obvious implication is that analyses encompass all energy systems technologies and commodities. So the risk aspects of the single points of the chains can be combined to form a “system risk”. Another important result is that the same
Security of Supply & Risk of Energy Availability
Editors: Haris Doukas, Alexandros Flamos & John Psarras Page 58
system and analytical tool is used for analysing the effects of undesired events and remedial policies on all the three main objectives of energy policies: energy security, economic development and environment sustainability at the same time. Furthermore, the concept of “energy service security” makes the analysts aware that two points of view exist. Energy importing countries commonly discuss the problems of securing the constant and unrestricted supply of primary energy vectors at affordable prices. Technology importing countries sometimes face the problem of securing unrestricted imports of new energy technologies at affordable prices. Sometimes this second barrier is not less damaging than the first. 4.2. IDENTIFICATION OF THE EVENT SPACE Adopting this extended concept of energy service security allows including in the risk analysis several events that have actually happened in the near past. The undesired event most frequently mentioned in the literature is the physical disruption of oil & gas supplies in general and imports in particular. Physical disruptions of primary supply are caused not only by wars, local instabilities from political unrest, but also by concomitant accidents, social problems in one or more supply countries, and perturbations to international trades. But end users suffer the consequences of unsatisfied demands for energy services in several other circumstances. Most of us have experienced supply disruptions due to failures of the transportation or distribution network, mainly electricity, at the regional level, but also natural gas at the national level and at the local level also district heating. This is the effect of being served by complex energy chains. The risk is not negligible because different steps of the chain, each one with non negligible failure probability, are interlinked in order to satisfy the demand in the instant it is requested. And in fact in recent years electricity blackouts due to technical failures caused the most expensive damages. Additional energy service disruptions are caused by environmental problems. For instance, in several large cities in Italy the private traffic is banned or restricted when the air pollution level caused by fuel combustion reaches levels dangerous for human health. Also plants and factories are sometimes obliged to change their operational schedule to avoid harmful emissions under special weather conditions.

Chapter 4: Energy Security from a Systems Analysis Point of View: Introductory Remarks
G. C. Tosato Page 59
4.3. THE PROBLEM OF QUANTIFYING THE RISK The risk of single adverse events is traditionally quantified by probability distributions. Reliability analysis combines the single probability distributions into system indexes. The question is whether simpler and macro indicators measure the energy service security status of a system. The first order answer is negative. However some indicators are used, such as energy intensity of the GDP, total primary energy supply per person, percent dependence on energy imports, and in particular on crude oil and oil product imports. A simple measure of supply security is given by the percent of endogenous supply: risks start when imports rise over 30%. In this sense several countries and regional aggregations (such as the EU) are at risk now and increasingly so in the future. Another important indicator is the flexibility of the system, measured in terms of percentage of energy service that can be satisfied with more than one energy supply source; it is sometimes called fuel-switching capability. An additional static indicator of risk is the degree of dependence on a single source, as stated by the old say: don’t put all your eggs in one basket. 4.4. QUANTIFICATION OF THE DAMAGES Remaining without energy for long would bring effects difficult to predict. But even the reduction of energy services, when unexpected and undesired, has big consequences. Several specialists have debated the issue of economic costs of non secure energy systems. One way to quantify this cost is to analyze the cost components of oil price. The difference between the average present production cost, which is below 20 USD per barrel, and the average purchase cost, which ranges between 50 and 60 USD per barrel, can be explained by the rigidity of the system combined with monopoly situations. The further gap with the present prices of futures for oil – around 100 USD per barrel – is attributable to the fear of shortages, signaled by the risk of even higher prices. If this latter gap is multiplied by the quantities, energy consumers signal the willingness to pay for oil more than 1 T.USD, equivalent to about 2% of the global GDP. The analysis of the economic effects of past energy price shocks gives similar values. The debate on the macroeconomic effects of energy price shocks, both internalized and externalized, is still open: however several experts have attributed to the oil shocks the economic recessions experienced globally after 1973 and 1980. Although the specialists are still
Security of Supply & Risk of Energy Availability
Editors: Haris Doukas, Alexandros Flamos & John Psarras Page 60
debating on the details, the majority of researchers give positive values to these costs. The GDP losses associated to the 1973 and 1980 oil crises have been measured in some percentage points. Other indirect costs – externalities – are linked to non secure oil dependences. Among the indirect cost of oil imports, specialists have mentioned economic costs deriving from depreciation of the national currency, inflation and military expenditures in the oil production regions. 4.5. WHAT MAKES THE DAMAGE OF UNDESIRED EVENTS SO
HIGH? The first reason why undesired events happening to the energy chains cause high losses is the huge physical and economic dimension of the market. It is not only global from the economic point of view, but also pervasive, with ramifications in all aspects of our daily life. The demand for energy services has grown continuously in the last two centuries, due to the increase of population (factor 6), life expectancy (factor 2), income (factor 70); as a result the demand for mobility has increased by a factor of one thousand [10]. Even if the demand for final and primary energy has grown much less – for instance, in the last thirty years the energy intensity of 11 OECD economies has reduced to 70% [11] – the world total primary energy supply exceeds 10 billion tonnes oil equivalent in the last few years [9]. The share of oil decreased from 44% in 1973 to 33% in 2001, the share of natural gas increased from 15% to 20% in the same period. International oil trade accounts for about 55% of the total yearly oil consumption. The market value of primary energy supply was in the order of 1.5 T$US2004. The market value of final energy purchased by economic producers and consumers is three to four times larger, reaching the order of 10-12% of GDP: 6-7% paid by the families to purchase households and transportation services, the rest appearing as intermediate expenditures of economic producers in industry and services. However, the private consumers devote a much higher share of their budget to satisfy their demand for energy services. When it is included also the purchase and maintenance of end use devices and other capital goods necessary to transform the final energy into energy services, the expenditure amounts to 20-30%. Furthermore in some countries consumers pay for automotive fuels a price five times larger than the equivalent market price of oil, without showing any sign of leaving automobiles in their garages. In other words consumers presently pay for oil a unit price much higher than marginal production costs, in order to ensure the amount of oil necessary to satisfy the demand for energy services. This is a signal that at least some deciles of energy end users are willing to pay
Chapter 4: Energy Security from a Systems Analysis Point of View: Introductory Remarks
G. C. Tosato Page 61
much more to access the energy sources necessary to satisfy their demand for energy services. Why then does this situation generate large security concerns? Can we learn something from other economic subsystems, of comparable size and importance? The supply of food and drink, which for human beings seems an economic sector more vital than energy, raises much lower security concerns. Seemingly, energy security problems stem from the centralized nature of energy systems: relatively few locations and companies supply oil & gas, infrastructure for electricity and fuels are largely centralized. The flexibility, distribution and variety of food and drinks chains are something unknown in the energy sector. Clearly, concentration of major suppliers in a few locations creates security concerns. Further concerns are caused by the narrow margins – of the order of few percent points – of production capacity and fuel switching capabilities in the short-medium term. In other words the rigidity combined with the dimension explains the high economic cost of events reducing the supply of energy services. 4.6. TRADITIONAL OPTIONS TO REDUCE THE RISK AND THE
DAMAGE The first discussion point is whether risk and damage reduction policies can be exerted by the market alone. Most analysts do not view the market as providing sufficient or correct signals to address the problem of the disruption of energy service supply due to whatever type of reason [12]. It is recognized that oil imports have hidden costs on the economy that are not reflected in the market price of oil or in the private decisions regarding the use of oil instead of alternatives. The security dimensions of energy supply have always been viewed as appropriate concerns of the government, also in the US where the market forces have the highest importance. Controversy appears about the degree of control to be exerted in the system, whether is thought appropriate to plan a transition coordinated across countries anticipating long-term problems and even more on the precise actions to be taken. From an energy security point of view, different analysts have suggested different governmental actions. So far most policy suggestions refer to actions to be taken in order to tackle the security of oil & gas imports. For instance, a recent analysis identifies four major themes relevant to US energy security in the 21st century: new ways to manage growing dependence on oil imports [rather than aiming at achieving energy independence], the need to diversify the geographic origin of energy, of pursuing a diversified fuel mix, and more energy efficiency. But the discussion concentrates on the first two, and argues that interdependence
Security of Supply & Risk of Energy Availability
Editors: Haris Doukas, Alexandros Flamos & John Psarras Page 62
rather than independence is the cornerstone of contemporary oil security and warns that technology cannot make up for declining resources [22]. According to another less recent analysis, the problem of energy security is dealt in the USA by three main policies: improve the stability of the Persian Gulf region, establishing government owned and controlled strategic oil stocks, establishing a coordinated internationally response procedure. The main criticism to these policies is that they do not address the basic problem of oil price instability and dwindling energy reserves and they merely bolster the ability to respond to temporary disruptions once they have occurred, without reducing reliance on insecure oil supplies [23]. 4.7. TECHNICAL OPTIONS AND THEIR IMPACT EVALUATED
THROUGH TECHNICAL ECONOMIC MODELS Sporadic attention has been devoted so far to proposals addressing energy security problems from the technology system point of view, which offer at the same time solutions to more general sustainability problems. Energy efficiency improvements and renewable sources, flexible energy system and fuel switching capabilities, are judged not sufficient to increase energy security in the USA in the ‘90s without a prior comprehensive solution of oil supply security [23]. The extended concept of energy service security that is proposed in this chapter, allows analysing several other remedial options. An analytical framework such as the MARKAL-TIMES models is useful in evaluating costs and benefits of remedial options in the whole system with the same rules. A few examples are reported below.
4.7.1. The IEA energy RD&D strategy (1980) After the first oil embargo, the objective was to identify a new chain of technologies to satisfy the same demand for energy services by means of more secure primary energy supplies and to assess their cost. The starting tool has been the analysis of the technological content of energy balances across nations with static tools (1976-7). The natural evolution has been to use a pseudo-dynamic tool for scenario analyses. Starting from energy systems existing at the time of the first embargo, studies were made of the possibility to ensure a smooth transition to less vulnerable systems by investing in energy RD&D. In the early eighties the IEA suggested guidelines for national and cooperative energy RD&D program and priorities to OECD governments, based upon energy technologies dynamic cost benefit analyses carried out by ETSAP [1].
Chapter 4: Energy Security from a Systems Analysis Point of View: Introductory Remarks
G. C. Tosato Page 63
More recently the global market mechanisms in the model have been extended to include the choice between existing technologies, competitive in the short term and new technologies that might become competitive in the long term if their markets would become big enough to trigger “learning” and “experience” processes observed so frequently with new technologies in the past (endogenous technology learning models). The problem is to evaluate potential economic benefits for developers and users – depending on learning ratios and international spillovers. If it is assumed that some of these technologies are capable of solving the main problems – security of a growing demand for energy services, climate change, local and regional pollution – at the same time, then governments may evaluate the possibility of advancing the costs of technology learning. Analyses are rather surprising, because negligible variations of the global utility imply divergent technological developments and policies [7]. The initial exercises of cost-oil import tradeoffs gave insight in terms of technological options [14]. The average discounted cost (over 45 years) of displacing permanently a barrel of oil through new technologies was 25-30 US$2004 per barrel, with variations from 1 to 100 $ across countries. First on the list were primary energy supply technologies – enhanced oil & gas recovery, development of unconventional oil & gas resources – followed by more efficient end use devices in residential and transportation, then cogeneration in industry, electric power plants from nuclear and renewable sources and eventually coal liquefaction processes. The most stringent policies, accepting the highest extra-costs, had the effect of reducing oil imports of the 15 participating countries to one third of 1980 levels, which was about 1.1 btoe per year. More recent scenarios to 2050 for UK and Germany, find the possibility to reduce oil dependence (and CO2 emissions) to about 30% of present values with a cumulative GDP penalty in 2050 of the order of 1.5% in UK and 0.6% to zero in Germany [15]. Three sets of technologies, which have been evaluated through energy technology systems analysis tools, exemplify hereafter in more detail the potential of technological options to trigger a transition to a new system.
4.7.2. Energy efficient devices Most energy analysts using technical economic models have experienced what may be called the “paradox of the statistical year”. It happens that calculated equilibrium quantities and prices are far different from the statistical values and calculate a solution more competitive than the actual one. It most often happens that the competitive equilibrium model would prefer to choose a set of existing end use technologies much more efficient than the actual one. To adjust solution values to statistics, as necessary

Security of Supply & Risk of Energy Availability
Editors: Haris Doukas, Alexandros Flamos & John Psarras Page 64
before looking for equilibrium projections, it is customary to increase the interest rate of private energy consumers in the residential and transport sectors far above the value of the national real discount rate, to reach values of 30% or more. Without entering into the debate about the possible energy efficiency gain factors that existing end use devices might bring to the global energy system without economic losses (factor two, four or even ten), every serious path towards more efficient end use devices improves the utility of the economic system. A recent exercise carried out to evaluate the possibility to increase “white certificates” obligations in Italy above the threshold established by present regulations, brings positive conclusions, because such obligations are a way to overcome behavioural barriers [17]. These policies can reduce primary energy supplies and CO2 emissions by a few percentage points, while increasing the GDP by a few thousandth of a percentage. This policy is effective in the short term and is promising also in the medium and long term, because there seems to be scope for improving the energy efficiency through the use of new technologies for decades. Throughout the years and the national circumstances, whatever assumptions are made on energy prices, demand developments, model time horizon, discount rates, energy efficient end use devices are always used more in the models than in the actual systems [1-7]. Particularly when the methodology is used to model large developing countries such as China and India, there seems to be no other way to satisfy a demand for energy service growing at a pace similar to GDP (four-five times in 40 years) without disrupting global oil & gas markets and financial markets to enable investments.
4.7.3. New technologies with high “learning” potential On the supply side, there seems to be little scope for change. Business as usual projections show an absolute increase of global primary energy supply (a factor of two in forty years) and little shifts among different fuels. This results most of the time from extrapolation prepared with econometric models whose parameters are estimated from historical data. The picture changes when technologies are described one by one and their technical characteristic explicitly included in the models. In fact technology learning in hydrocarbon exploration techniques has improved enormously the success ratio of oil & gas drilling, achieving a considerable reduction in overall production costs. If appropriate investments are made available to other energy technologies and just some of them continue to improve with a progress rate similar to the past until they achieve their full market potential, energy systems might experience the transition

Chapter 4: Energy Security from a Systems Analysis Point of View: Introductory Remarks
G. C. Tosato Page 65
hoped by most analysts [6, 7]. The model experiments carried out by ETSAP modellers show that scenarios including endogenous technology learning diverge completely from the non learning case at the same cumulative discounted global system costs. By taking into account the expected technological progress, the same demand is satisfied in 2050 with negligible use of fossils fuels and CO2 emissions [20]. The most important message of these model experiments is that the present energy supply systems, relying on century old concepts, has the possibility to change. The transition needs appropriate investments but not necessarily net additional costs. It reaches several objectives: in the field of security it reduces the need of fossils fuels, from the environmental point of view it reduces all forms of regional pollution and global climate change and from the system point of view it may trigger the transition to less centralised networks. In this sense, potential progress in some key supply technologies has to be supplemented by a transition of the system of infrastructures. More importantly, this type of analysis indicates the way to follow in order to avoid the risk of cutting the energy system out of technological progress (sometimes addressed as “technology lock-in”).
4.7.4. Coal transformation processes and new management of energy intensive materials
System analysis studies indicate further technological options and policies useful to increase security and reduce pollution. One example is the set of technologies that transform coal into final energy carriers – electricity, process and district heat, liquid fuels and gas including hydrogen – with CO2 capture and sequestration. R&D in coal transformation technologies started decades ago and received further attention after the two oil embargos. Although tens of processes have been developed and experimented, nowadays they are considered less important in pursuing energy security. Their competitiveness is linked to technological progress, to availability of cheap coal, and to the willingness to pay the resulting energy carriers more than their production cost with insecure fuels, but less than the amount final consumers pay now. Their development seems particularly important in countries such as China and India, where the oil & gas import bill to some extent would hinder economic growth, and worldwide to reduce strains in global oil & gas markets, which could create large security problems to all countries. Therefore coal can continue to be the most important primary energy resource in countries endowed with this resource. However, to reduce local and regional environmental impacts and the contribution to global climate changes, coal use must rely on centralised gasification and liquefaction
Security of Supply & Risk of Energy Availability
Editors: Haris Doukas, Alexandros Flamos & John Psarras Page 66
technologies, where particulate, acid deposition precursors and CO2 can be removed and sequestered [21]. Liquid fuels from coal reduce the global pressure on oil markets, because they also can be used as a feedstock for several chemical industries. In this same direction, systems analyses of the energy system extended to energy intensive materials has shown that oil imports and CO2 emissions can be reduced by about 10% without scientific or technical breakthroughs by starting from alternative raw materials and managing in an energy conscious way the manufacturing chain [5, 6, 7]. FINAL REMARKS Most strategies that have been proposed to make energy systems more secure, environmentally friendly and economically sustainable signal the need for a transition to new energy systems. Since the time necessary to trigger a transition from the present energy system, whose design is basically a century old, to a new sustainable system appears very long, governments of knowledge producing countries are expected to finance large R&D programs [12]. The most appropriate answer to sustainability including energy security seems to be the development of a large variety of technologies, without which relevant energy mix changes appear unlikely. However, the allocation of resources to R&D in new energy technologies seems largely insufficient. Out of a total world R&D budget of about US$B 600, the amount devoted to energy has remained stable in the last decade at about US$B 10. While the present total R&D effort is about 1.5-2% of the global GDP and an increase to 3% is sought from many, the energy R&D is only about 0.3% of the value of the energy system. This percentage is not higher in industry. The international industry in software & IT, health, pharmaceuticals spend in R&D more than 10% of their sales, oil & gas industries less than 1%, as is the case for the beverages and tobacco industries. Only 1.5% of the venture capital investments in 1998 – nearly US$B 40 – has been used by energy industries [24]. This goal also requires major contributions from those new science fields, which recently experienced huge progress and could inject new concepts into the energy sector. To be commensurate to the problem, energy R&D programs are expected to remain at the physiological level of 3% for decades, i.e. time scales similar to the lifetime of energy infrastructures. Waiting for a full transition, fast deployments of the most energy efficient end-use devices may trigger a partial transition and reduce the weight of the problem. However, since market forces have not been able to reduce the

Chapter 4: Energy Security from a Systems Analysis Point of View: Introductory Remarks
G. C. Tosato Page 67
“energy efficiency gap” and energy supply companies will never contradict their core business and propose to their clients to consume less energy goods, the main responsibility for energy efficiency policies has to be shifted to companies and markets that provide more energy efficient devices. The success of both policies is heavily linked to non-energy sectors and factors [25]. A sign of political will to trigger a transition towards sustainability could be to attribute the responsibility of energy security and environment problems to the offices and groups that have to bare the costs of less security and more polluting energy systems, instead of leaving the responsibility to the groups that profit from maintaining the status quo. ACKNOWLEDGMENTS This contribution draws from the following paper submitted to WEC2004: Energy Technologies and Sustainability: Insight from Markal–Times Bottom-Up Partial Equilibrium Models, by G.C. TOSATO, Energy Technology Systems Analysis Programme; IEA, P. TSENG, Energy Information Administration, USA; O. SATO, JAERI, Japan; P. TAYLOR, AEA Technology, UK; E. LAVAGNO, Polytechnic University of Turin, Italy. The statistical data mentioned in this chapter have not been updated. REFERENCES [1] Tosato, G.C., et al. editors: Energy after the Eighties, A cooperative study by countries of the international energy agency, Final Report of ETSAP Annex I, Elesevier, ISBN 0-444-41846-6, 1984. [2] Kolb, G., Vos, H., Hill, D. editors: Final Report of ETSAP Annex II; (Juel-Spez-421) ISSN 0343-7639 1987. [3] Hill, D., Rowe, M.D. editors: Estimating National Costs of Controlling Emissions from the Energy System, Summary Report of ETSAP Annex III, (BNL 52253), 1989. [4] Kram, T. editor: National Energy Options for Reducing CO2 Emissions, Summary Report of ETSAP Annex IV (1990-3); Volume 1: The International Connections, (ECN-C—93-101), 1993. [5] Hill, D., Kram, T. editors: New Directions in Energy Modelling, Summary Report of ETSAP Annex V (1993-5), 1997.
Security of Supply & Risk of Energy Availability
Editors: Haris Doukas, Alexandros Flamos & John Psarras Page 68
[6] Hill, D., Kram, T. editors: Dealing with Uncertainties Together, Summary Report of ETSAP Annex VI (1996-8), 1999. [7] Hill, D., Kram, T. editors: Contributing to the Kyoto Protocol, Summary Report of ETSAP Annex VII (1998-2002), 2002. [8]Dorfmann, Samuelson, Solow, Linear programming and economic models, 1958. [9] IEA: Key world energy statistics, downloadable from www.iea.org, yearly issue. [10] Nakicenovic, N., et al. editors: Global Energy Perspecitves, Cambridge University press, 1998, ISBN 0 521 64569 7. [11] Unander, F., Oil crises & climate changes: 30 years of energy use in IEA countries, IEA, ISBN 92-64-01882-4, 2004. [12] Kolstad, C. D.: Energy and depletable resources: economics and policies, 1973 – 1998, Journal of Environmental Economics and Management, 39, 282-305, 2000. [13] Bohi, D. R., Toman, M. A.: Energy security: externalities and policies, Energy Policy, November 1993, 1093-1109. [14] IEA: A group strategy for energy research development and demonstration, Paris, 1980, ISBN 92-64-12124-2. [15] Remme, U., Blesl, M., TIMES model for Germany ; and Taylor, P., Long term, low carbon options for the UK; in Proceedings of the ETSAP workshop, held in Torino, 28-31 October 2002, downloadable from www.etsap.org. [16] Huntington, H. G., Brown, S. P. A.: Energy security and global climate change mitigation, Energy Policy, 32 (2004) 715-718. [17] Contaldi, M., Gracceva, F., Tosato, G.C. Evaluation of Green and White Certificates Policies using the MARKAL-Macro-Italy model, Energy Policy, accepted for publication, 2004. [18] Jaffe, A. B., Stavins, R. N.: The energy efficiency gap, Energy Policy, 22 (10) 804-810, 1994. [19] Barreto, L., Technological learning in energy optimisation models and development of emerging technologies, dissertation ETH Nr. 14151, Zuerich, 2000.

Chapter 4: Energy Security from a Systems Analysis Point of View: Introductory Remarks
G. C. Tosato Page 69
[20] Wene, C-O., Experience curves for energy technology policy, IEA, 2000. [21] Larson, E., Zongxin, W., DeLaquil, P., Wenying, C., Pengfei, G.: Future implications of China’s energy-technology choices, Energy Policy, 31 (2003) 1189-1204. [22] Salameh, M. G.: The new frontiers for the United States energy security in the 21st century, Applied Energy, 76 (2003) 135-144. [23] Georgiou, G. C.: US energy security and policy options for the 1990s, Energy Policy, August 1993, 831-839. [24] Tosato, G.C., Socio–Economic Evaluation of Long Term Energy Options: the Case of Fusion, Proceedings of the 26th IAEE International Conference, Prague, June 4-7, 2003, section 5: Electricity [25] Mills, E., Rosenfeld, A.: Consumer non-energy benefits as a motivation for making energy efficiency improvements, Energy, Vol. 21, N0. 7/8, pp. 707-720, 1996. [26] Gargiulo, M. at al.: Getting started with TIMES-VEDA, January 2008, downloadable from www.etsap.org. [27] Tosato, G.C., at al.: The MARKAL-TIMES methodology, proceedings of the training course held in Brasilia, November 21, 2007, downloadable from www.etsap.org. [28] 2007, TOSATO, G. C.: Global long-term energy scenarios: lessons learnt, Institute for Plasma Physics of the Max Plank Gesellschaft (Garching bei Munich), IPP Report No. 16/13, March 2007.
Security of Supply & Risk of Energy Availability
Editors: Haris Doukas, Alexandros Flamos & John Psarras Page 70
Chapter 5: SUSTAINABLE ELECTRICITY FOR EUROPE, MIDDLE EAST AND NORTH AFRICA Franz Trieb DLR – German Aerospace Center, Germany This chapter describes the perspective of a sustainable supply of electricity for Europe (EU), the Middle East (ME) and North Africa (NA) up to the year 2050. It shows that a transition to competitive, secure and compatible supply is possible using renewable energy sources and efficiency gains, and fossil fuels as backup for balancing power. A close cooperation between EU and MENA for market introduction of renewable energy and interconnection of electricity grids by high-voltage direct-current transmission are keys for economic and physical survival of the whole region. However, the necessary measures will take at least two decades to be-come effective. Therefore, adequate policy and economic frameworks for their realization must be introduced immediately.
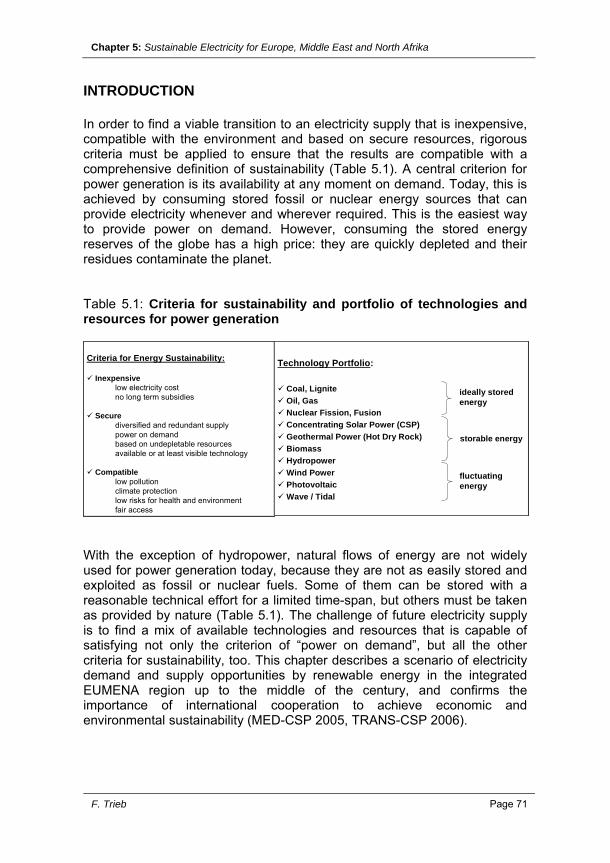
Chapter 5: Sustainable Electricity for Europe, Middle East and North Afrika
F. Trieb Page 71
INTRODUCTION In order to find a viable transition to an electricity supply that is inexpensive, compatible with the environment and based on secure resources, rigorous criteria must be applied to ensure that the results are compatible with a comprehensive definition of sustainability (Table 5.1). A central criterion for power generation is its availability at any moment on demand. Today, this is achieved by consuming stored fossil or nuclear energy sources that can provide electricity whenever and wherever required. This is the easiest way to provide power on demand. However, consuming the stored energy reserves of the globe has a high price: they are quickly depleted and their residues contaminate the planet. Table 5.1: Criteria for sustainability and portfolio of technologies and resources for power generation Criteria for Energy Sustainability:
Inexpensivelow electricity cost no long term subsidies
Secure diversified and redundant supply power on demandbased on undepletable resourcesavailable or at least visible technology
Compatible low pollution climate protectionlow risks for health and environmentfair access
Technology Portfolio:
Coal, LigniteOil, Gas Nuclear Fission, FusionConcentrating Solar Power (CSP)Geothermal Power (Hot Dry Rock)BiomassHydropowerWind PowerPhotovoltaicWave / Tidal
ideally storedenergy
fluctuatingenergy
storable energy
Technology Portfolio:
Coal, LigniteOil, Gas Nuclear Fission, FusionConcentrating Solar Power (CSP)Geothermal Power (Hot Dry Rock)BiomassHydropowerWind PowerPhotovoltaicWave / Tidal
ideally storedenergy
fluctuatingenergy
storable energy
Criteria for Energy Sustainability:
Inexpensivelow electricity cost no long term subsidies
Secure diversified and redundant supply power on demandbased on undepletable resourcesavailable or at least visible technology
Compatible low pollution climate protectionlow risks for health and environmentfair access
Technology Portfolio:
Coal, LigniteOil, Gas Nuclear Fission, FusionConcentrating Solar Power (CSP)Geothermal Power (Hot Dry Rock)BiomassHydropowerWind PowerPhotovoltaicWave / Tidal
ideally storedenergy
fluctuatingenergy
storable energy
Technology Portfolio:
Coal, LigniteOil, Gas Nuclear Fission, FusionConcentrating Solar Power (CSP)Geothermal Power (Hot Dry Rock)BiomassHydropowerWind PowerPhotovoltaicWave / Tidal
ideally storedenergy
fluctuatingenergy
storable energy
With the exception of hydropower, natural flows of energy are not widely used for power generation today, because they are not as easily stored and exploited as fossil or nuclear fuels. Some of them can be stored with a reasonable technical effort for a limited time-span, but others must be taken as provided by nature (Table 5.1). The challenge of future electricity supply is to find a mix of available technologies and resources that is capable of satisfying not only the criterion of “power on demand”, but all the other criteria for sustainability, too. This chapter describes a scenario of electricity demand and supply opportunities by renewable energy in the integrated EUMENA region up to the middle of the century, and confirms the importance of international cooperation to achieve economic and environmental sustainability (MED-CSP 2005, TRANS-CSP 2006).

Security of Supply & Risk of Energy Availability
Editors: Haris Doukas, Alexandros Flamos & John Psarras Page 72
5.1. INCREASING PRESSURE ON POWER SOURCES As a first step, our analysis has quantified electricity demand in Europe and MENA up to the middle of the century. Population growth is a major driving force for power consumption. According to the World Population Prospect of the United Nations the population of the European region will stabilize at around 600 million while MENA will grow from 300 million in the year 2000 to a similar 600 million by the middle of the century (UN 2004). The second driving force is economic growth, which usually has two opposite effects on energy and water demand: on the one hand, the demand increases because new services are requested within a developing economy. On the other hand, efficiency of production, distribution and end-use is enhanced, thus allowing the provision of more services for a given amount of energy. In past decades, all industrial nations observed a typical decoupling of economic growth and energy demand. In order to be able to afford efficiency measures, a certain economic level beyond sheer subsistence must have been attained, something that is now true of most countries in EUMENA. The demand study is described elsewhere (Trieb, Klann 2006). Our analysis shows that by 2050 power consumption in the Middle East and North Africa is likely to be around 3000 TWh/year, which is comparable with what is consumed in Europe today. Meanwhile, European consumption is likely to increase to and stabilize at a value of about 4000 TWh/year. Due to increased efficiency gains, our model yields lower levels of predicted demand than most other scenarios (IEA 2005, IEA 2006, CEC 2006, Mantzos and Capros 2005). However, there are also scenarios indicating lower demand (Benoit and Comeau 2005, Teske et al., 2007). 5.2. PORTFOLIO OF SOURCES AND TECHNOLOGIES In the financial and insurance business there is a clear answer to the question of security and risk management: the diversification of the assets portfolio (Awerbuch and Berger 2003). This simple truth has been completely ignored in the energy sector. Here, investment decisions were based on “least cost and proven technology” and the portfolio was usually limited to fossil fuel, hydropower and nuclear plants. This short-sighted policy has been harmful both for consumers and for the environment: prices of all kinds of fossil fuels and of uranium have multiplied several times since the year 2000 and the burning of these fuels is seriously contaminating the global atmosphere. Today, consumers and taxpayers have no choice but to pay the higher cost of fossil fuels, as the energy policies of the past failed to build up alternatives in good time and to establish them as part of the energy market. To add insult to injury, fossil and nuclear energy technologies still receive 75 % of current energy subsidies (EEA 2004), a number that increases to over 90 % if the failure to include external costs is also considered.
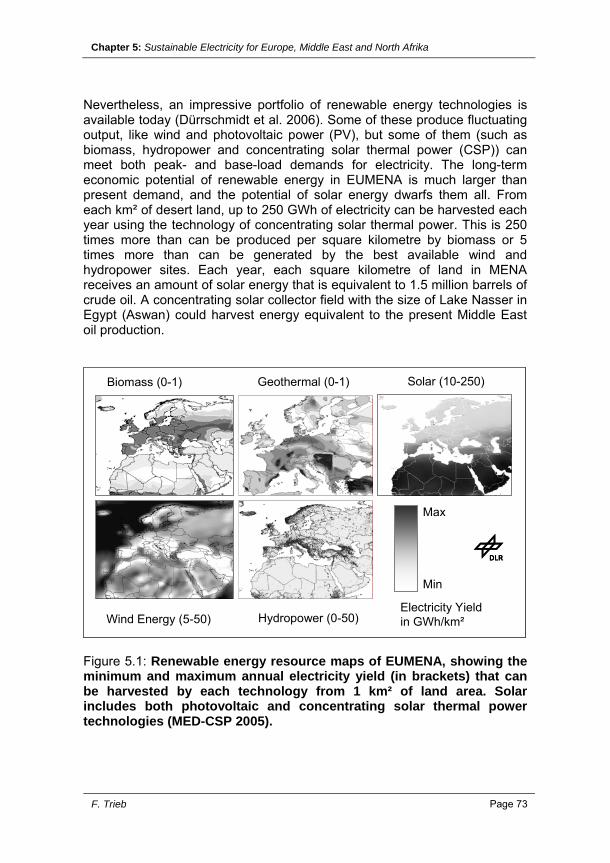
Chapter 5: Sustainable Electricity for Europe, Middle East and North Afrika
F. Trieb Page 73
Nevertheless, an impressive portfolio of renewable energy technologies is available today (Dürrschmidt et al. 2006). Some of these produce fluctuating output, like wind and photovoltaic power (PV), but some of them (such as biomass, hydropower and concentrating solar thermal power (CSP)) can meet both peak- and base-load demands for electricity. The long-term economic potential of renewable energy in EUMENA is much larger than present demand, and the potential of solar energy dwarfs them all. From each km² of desert land, up to 250 GWh of electricity can be harvested each year using the technology of concentrating solar thermal power. This is 250 times more than can be produced per square kilometre by biomass or 5 times more than can be generated by the best available wind and hydropower sites. Each year, each square kilometre of land in MENA receives an amount of solar energy that is equivalent to 1.5 million barrels of crude oil. A concentrating solar collector field with the size of Lake Nasser in Egypt (Aswan) could harvest energy equivalent to the present Middle East oil production.
Biomass (0-1)
Wind Energy (5-50)
Geothermal (0-1)
Hydropower (0-50)
Solar (10-250)
Max
Min
Electricity Yield in GWh/km²
Biomass (0-1)
Wind Energy (5-50)
Geothermal (0-1)
Hydropower (0-50)
Solar (10-250)
Max
Min
Electricity Yield in GWh/km²
Figure 5.1: Renewable energy resource maps of EUMENA, showing the minimum and maximum annual electricity yield (in brackets) that can be harvested by each technology from 1 km² of land area. Solar includes both photovoltaic and concentrating solar thermal power technologies (MED-CSP 2005).

Security of Supply & Risk of Energy Availability
Editors: Haris Doukas, Alexandros Flamos & John Psarras Page 74
In addition, there are other large sources of renewable energy in EUMENA: there is potential of almost 2000 TWh of wind power and 4000 TWh/y of power from geothermal, hydro and biomass sources including agricultural and municipal waste. Also PV, wave and tidal power have considerable potentials in the region. By contrast with fossil and nuclear fuels, renewable energy sources in the region are over-abundant. However, each renewable energy resource has a specific geographic distribution (Figure Figure 5.1). Each country will therefore have its specific mix of resources, with hydropower, biomass and wind energy being the preferred sources in the North, and solar and wind energy being the most powerful sources in the South of EUMENA. Fossil energy sources like coal, oil and gas can be a useful complement to the renewable energy mix, being stored forms of energy that can easily be used for balancing power and for grid stabilization. If their consumption is reduced to the point where they are used exclusively for this purpose, their cost escalation will be reduced and cause only a minor burden to economic development and their environmental impact will be minimized. Moreover, their availability will be extended for decades or even centuries. By contrast, nuclear fission plants are not easily combined with renewables because their output cannot, economically, be varied to meet fluctuating demands. Moreover, decommissioning costs of nuclear plants exceed their initial investment (NDA 2002) and, half a century after market introduction, there are still unsolved problems like plutonium proliferation and nuclear waste disposal. The other nuclear option, fusion, is not expected to be commercially available before 2050 and is therefore not relevant for our proposals (HGF 2001). Several renewable power technologies can also provide base-load and balancing power. These include: geothermal (hot dry rock) systems that are today in a phase of research and development; hydropower plants with large storage dams in Norway, Iceland and the Alps; most biomass plants; and concentrating solar thermal power plants (CSP) in MENA. CSP plants use the high annual solar irradiance of that region, the possibility of solar thermal energy storage for overnight operation and the option of backup firing with fossil fuels or biomass. CSP in Europe is subject to significant seasonal fluctuations. Constant output for base-load power can only be provided with a considerable fossil fuel share. Due to the higher solar irradiance in MENA, the cost of concentrating solar power there is usually lower and its availability is better than in Europe. Therefore, there will be a significant market for solar electricity imports to complement the European sources and provide firm power capacity at competitive cost.

Chapter 5: Sustainable Electricity for Europe, Middle East and North Afrika
F. Trieb Page 75
5.3. CONCENTRATING SOLAR POWER AS PART OF THE ENERGY MIX
Steam turbines and gas turbines powered by coal, uranium, oil and natural gas are today’s guarantors of electrical grid stability, providing both base-load and balancing power. However, turbines can also be powered by high temperature heat from concentrating solar collector fields (Figure 5.2). Power plants of this type with 30 - 80 MW unit capacity are operating successfully in California since 20 years, and new plants are currently erected in the U.S. and Spain. The concentrating solar collectors are efficient fuel savers, today producing heat at a cost equivalent to 50-60 $/barrel of fuel oil, with the perspective to achieve a level below 25 $/barrel within a decade (MED-CSP 2005, Pitz-Paal et al. 2005). Just like conventional power stations, concentrating solar power plants can deliver base-load or balancing power, directly using sunshine during the day, making use of thermal energy storage facilities during the night and in case there is a longer period without sunshine, using fossil or biomass fuel as backup heat source. Just like fossil fuel fired conventional power stations, CSP plants have an availability that is close to 100 %, but with significantly lower fuel consumption. A CSP plant with a thermal energy storage facility for additional 8 hours of full load operation is currently build in the Spanish Sierra Nevada near Guadix, allowing solar electricity generation also during night-time. This plant with a capacity of 50 MW will have a minimum annual solar share of 85 %.
Fuel
Thermal Power Cycle (e.g. Steam
Turbine)
Process Heat
ElectricityFuel
Thermal Power Cycle (e.g. Steam
Turbine)
Process Heat
Electricity
Concentrating Solar Collector Field (Mirrors)
Solar Heat
Thermal Energy Storage
Concentrating Solar Collector Field (Mirrors)
Solar Heat
Thermal Energy Storage
Concentrating Solar Collector Field (Mirrors)
Solar Heat
Thermal Energy Storage
Figure 5.2: Left: Configuration of a concentrating solar power station for power or for combined generation of electricity and heat. Right: Line-concentrating solar thermal collector technologies.
Security of Supply & Risk of Energy Availability
Editors: Haris Doukas, Alexandros Flamos & John Psarras Page 76
5.4. SUSTAINABLE ELECTRICITY MIX FOR EUMENA Following the criteria for sustainability in Table 5.1 and additional technical, social and economic frame conditions described in other reports (MED-CSP 2005, TRANS-CSP 2006), we have developed a scenario for electricity generation for 50 countries in EUMENA up to the year 2050. Except for wind power that is already booming today, and hydropower that has been established since decades, renewable energy will hardly become visible in the electricity mix before 2020. At the same time, phasing out of nuclear power in many European countries and the stagnating use of coal and lignite due to climate protection will generate increasing pressure on natural gas resources, increasing their consumption as well as their installed capacity for power generation. Until 2020, renewables like wind and PV power will mainly have the effect of reducing fuel consumption, but will do little to replace existing capacities of balancing power. Owing to growing demands and the replacement of nuclear power, consumption of fossil fuels cannot be reduced before 2020. Fuel oil for electricity will largely disappear by 2030 and nuclear power will follow after 2040. The consumption of gas and coal will increase until 2030 and thereafter be reduced to a compatible and affordable level by 2050. In the long term, new services such as electric vehicles may increase the electricity demand further and thus require a higher exploitation of renewables. The electricity mix in the year 2000 depends mainly on five resources, most of them limited, while the mix in 2050 will be based on ten energy sources, most of them renewable. Thus, our scenario responds positively to the European Strategy for Sustainable, Competitive and Secure Energy declared by the European Commission in the corresponding Green Paper and Background Document, aiming at higher diversification and security of the European energy supply (Commission of the European Communities 2006). A prerequisite of the electricity mix is to provide firm capacity with a reserve of about 25 % in addition to the expected peaking load. Before significant CSP transmission starts in the year 2020, this can only be provided by extending the capacity and fuel consumption of gas fired peaking plants based on natural gas and later eventually on coal gasification. In Europe, the consumption of natural gas doubles with respect to the starting year 2000; but it is then brought back to the initial level, after the introduction in 2020 of increasing shares of CSP transmission from MENA as well as geothermal and hydropower from Scandinavia, via High-Voltage Direct-Current (HVDC) interconnections. European renewable energy sources that could provide firm capacity are rather limited from the point of view of their potential. Therefore, CSP transmission from MENA to Europe will be essential to reduce both the installed capacity and the fuel consumption of gas fired peaking plants and to provide firm renewable power capacity. In MENA, concentrating solar power is the only source that can really cope with rapidly growing electricity consumption, providing both
Chapter 5: Sustainable Electricity for Europe, Middle East and North Afrika
F. Trieb Page 77
base-load- and balancing power. By 2050, fossil energy sources will be used solely for backup purposes. This will reduce their consumption to a sustainable level and bring down the otherwise rapidly escalating cost of power generation. Fossil fuels will be used to guarantee firm balancing power capacity, while renewables will serve to reduce their consumption for everyday use and base-load. An efficient backup infrastructure will be necessary to complement the renewable electricity mix: on one hand to provide firm capacity on demand by quickly-reacting, natural-gas-fired peaking plants, and on the other hand as an efficient grid infrastructure that allows the transmission of renewable electricity from the best centers of production to the main centers of demand. The best solution is a combination of High-Voltage Direct-Current (HVDC) transmission lines and the conventional Alternating Current (AC) grid. At lower voltage levels, decentralized structures will also gain importance, combining, for example, PV, wind and micro-turbines operating together just like a single virtual power plant. Such a grid infrastructure will not be motivated by the use of renewables alone. In fact, its construction will probably take place anyway, in order to stabilize the growing European grid, to provide greater security of supply, and to foster competition (Asplund 2004, Eurelectric 2003). By 2050, transmission lines with a capacity of 2.5-5.0 GW each will transport about 700 TWh/y of solar electricity from 20-40 different locations in the Middle East and North Africa to the main centers of demand in Europe. HVDC technology has been a mature technology for several decades and is becoming increasingly important for the stabilization of large-scale electricity grids, especially if more fluctuating resources are incorporated. HVDC transmission over long distances contributes considerably to increase the compensational effects between distant and local energy sources. And it allows failures of large power stations to be accommodated via distant backup capacity. It can be expected that a HVDC backbone will be established in the long term to support the conventional electricity grid and to increase the stability of the future power-supply system.

Security of Supply & Risk of Energy Availability
Editors: Haris Doukas, Alexandros Flamos & John Psarras Page 78
Installed Capacity vs. Peak Load in EUMENA
0
400
800
1200
1600
2000
2400
2000 2010 2020 2030 2040 2050Year
Inst
alle
d C
apac
ity [G
W]
0
400
800
1200
1600
2000
2400 PhotovoltaicWind PowerGeothermalHydropowerBiomassTidal/WaveCSPOil & GasCoalNuclearFirm CapacityPeak Load
Installed Capacity vs. Peak Load in EUMENA
0
400
800
1200
1600
2000
2400
2000 2010 2020 2030 2040 2050Year
Inst
alle
d C
apac
ity [G
W]
0
400
800
1200
1600
2000
2400 PhotovoltaicWind PowerGeothermalHydropowerBiomassTidal/WaveCSPOil & GasCoalNuclearFirm CapacityPeak Load
Figure 5.3: Scenario of the installed power capacity in comparison to the cumulated peak load of all countries in the EUMENA region. Firm power capacity is calculated on the basis of capacity credits for each technology. By the year 2050, 68 % of the installed CSP capacity is used for local supplies, 19 % for long-distance transmission and 13 % for desalination.
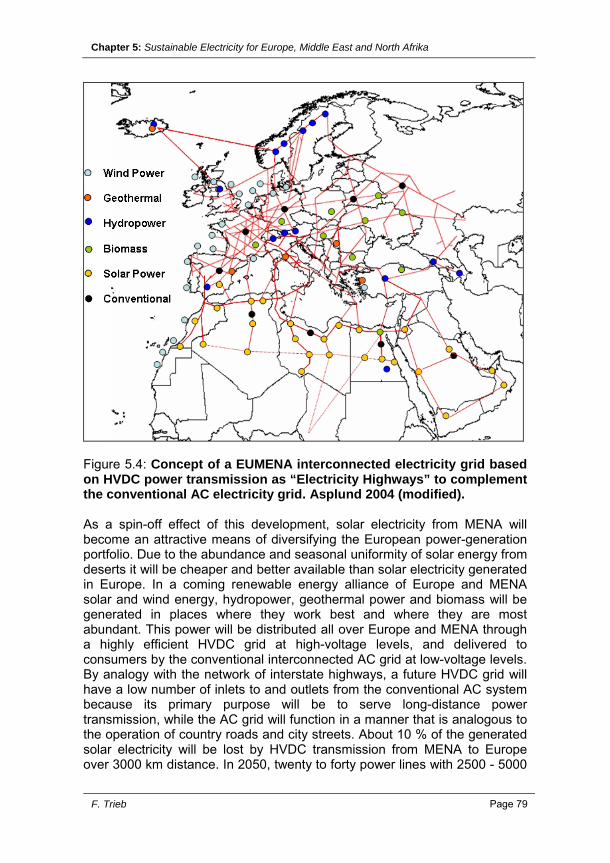
Chapter 5: Sustainable Electricity for Europe, Middle East and North Afrika
F. Trieb Page 79
Figure 5.4: Concept of a EUMENA interconnected electricity grid based on HVDC power transmission as “Electricity Highways” to complement the conventional AC electricity grid. Asplund 2004 (modified). As a spin-off effect of this development, solar electricity from MENA will become an attractive means of diversifying the European power-generation portfolio. Due to the abundance and seasonal uniformity of solar energy from deserts it will be cheaper and better available than solar electricity generated in Europe. In a coming renewable energy alliance of Europe and MENA solar and wind energy, hydropower, geothermal power and biomass will be generated in places where they work best and where they are most abundant. This power will be distributed all over Europe and MENA through a highly efficient HVDC grid at high-voltage levels, and delivered to consumers by the conventional interconnected AC grid at low-voltage levels. By analogy with the network of interstate highways, a future HVDC grid will have a low number of inlets to and outlets from the conventional AC system because its primary purpose will be to serve long-distance power transmission, while the AC grid will function in a manner that is analogous to the operation of country roads and city streets. About 10 % of the generated solar electricity will be lost by HVDC transmission from MENA to Europe over 3000 km distance. In 2050, twenty to forty power lines with 2500 - 5000

Security of Supply & Risk of Energy Availability
Editors: Haris Doukas, Alexandros Flamos & John Psarras Page 80
MW capacity each could provide about 15 % of the European electricity as clean power from deserts, motivated by a low production cost of around 5 €-cent/kWh (not accounting for further cost reduction via carbon credits) and their high flexibility for base-, intermediate- and peak-load operation. Table 5.2: Main indicators of a EUMENA High Voltage Direct Current (HVDC) interconnection for Concentrating Solar Thermal Power (CSP) from 2020 – 2050 according to the TRANS-CSP scenario. In 2050, lines with a capacity of 5 GW each will transmit about 700 TWh/y of electricity from 20-40 different locations in the Middle East and North Africa to the main centres of demand in Europe.
0.800.750.670.60Capacity Factor
35045
24531
14320
425
Investment CSPBillion € HVDC
0.0400.010
0.0400.010
0.0450.010
0.0500.014
Elec. Cost CSP€/kWh HVDC
50 x 503600 x 1.0
40 x 403600 x 0.7
30 x 303600 x 0.4
15 x 153100 x 0.1
Land Area CSPkm x km HVDC
352412.53.8Turnover Billion €/y
70047023060Electricity Transfer TWh/y
20 x 514 x 58 x 52 x 5Transfer Capacity GW
2050204020302020Year
Concentrating Solar Thermal Power (CSP) plants use mirrors to concentrate sunlight for steam and power generation. Solar heat can be stored in tanks of molten salt and used for nighttime operation of the turbines, which can also be powered by oil, natural gas or biomass fuels.
High Voltage Direct Current (HVDC) transmission lines are used in some 100 projects world wide transmitting today about 80 GW of electricity from remote, mostly renewable sources like large hydropower dams and geothermal plants to large centres of demand.
There is a wide-spread belief that for every wind farm or PV plant a fossil fuel fired backup power plant must be installed. However, hourly time series modelling of the power supply system of selected countries according to our scenario showed that even without additional storage capacities for electricity, the existing balancing capacity is sufficient for the purpose of covering fluctuations in demand. No extra capacity is needed as long as the fluctuating renewable energy share is smaller than the existing peaking plant capacity, which is the case in our scenario. In fact, as a consequence of the increasing share of renewable electricity generation, the need for conventional base load plants with constant output will step by step disappear (Figure 5.5). Base load will be covered by plants for combined generation of heat and power (CHP) using fossil and biomass fuels, river run-off hydropower, wind power and photovoltaics. Intermediate power capacity will be provided by better storable sources like hydropower from dams, biomass and geothermal power. This combination of power sources will not totally cover, but fairly approximate the daily load curve. The remaining balancing capacity will be supplied by pump storage, hydropower dams, concentrating solar power and fossil fuel fired peaking plants. In addition to that, enhanced demand side management will increasingly be

Chapter 5: Sustainable Electricity for Europe, Middle East and North Afrika
F. Trieb Page 81
used to minimize the need of pump storage capacity and fossil fuel consumption for peaking power, which both will remain in the same order of magnitude as today (Brischke 2005). The fossil fuel fired power capacities remaining in 2050 will exclusively serve balancing duties and combined generation of heat and power. This is in line with the strategy of using those valuable, perfectly stored energy sources exclusively for what they are best suited for and not wasting them for quotidian use. Base load plants with constant output fuelled by nuclear fission, fusion or lignite will not fit well into such a system, as they are not capable of providing quickly changing output to fill the gap between the partially fluctuating supply from cogeneration and renewables and the otherwise fluctuating demand. In fact, gas driven plants will be the preferred choice for this purpose. In the very long-term after 2050, renewable sources supported by advanced storage and load management in close coordination with other energy sectors like heating and cooling as well as transport and mobility will finally also take over the remaining demand for balancing power and combined generation.
0
10
20
30
40
50
60
25.6. 26.6. 27.6. 28.6. 29.6. 30.6. 1.7.
Pow
er C
onsu
mpt
ion
[GW
]
CHP (fossil) Domestic Renewables Solar ImportOther Import & Storage Balancing Power (fossil) Renewable Surplus
Figure 5.5: Model of the hourly electricity balance of Germany in 2050 (Brischke 2005)

Security of Supply & Risk of Energy Availability
Editors: Haris Doukas, Alexandros Flamos & John Psarras Page 82
5.5. LEAST COST RENEWABLE ELECTRICITY Installing CSP plants worldwide, a reduction of the solar electricity cost due to economies of scale can be achieved with a progress ratio of about 85-90 % (Pitz-Paal et al. 2005). As an example, a CSP-plant today can produce electricity at about 0.14-0.18 €/kWh depending on solar irradiance. With 5000 MW installed world-wide the cost would drop to about 0.08-0.12 €/kWh, and to 0.04-0.06 €/kWh once a capacity of 100 GW would be installed. A prerequisite for this cost reduction is a global CSP expansion from 415 MW today to about 28 GW by 2020 and roughly 140 GW by 2030 (MED-CSP 2005), (TRANS-CSP 2006), (AQUA-CSP 2007). In the long-term, a total of 500 GW could be installed by 2050. For the calculation of this learning curve we have assumed solar only operation, an economic lifetime of 25 years and a real project rate of return of 6.5 %/y. All renewable energy sources show similar learning curves, becoming cheaper the more they are exploited. While most renewable sources show capacity limits of exploitation, the solar energy resource in MENA is about hundred times larger than demand will ever be. Further, due to better solar radiation costs of clean power from deserts including transmission will be lower than for solar power produced by the same type of power plants located in Europe. If we take as example the Spanish electricity mix as described in (TRANS-CSP 2006) a scenario based on a mix of domestic renewable energies, solar electricity from North Africa and fossil fuels for balancing power has the medium-term perspective of stable and even slightly reduced electricity costs, while a business-as-usual scenario would lead to steadily escalating costs of energy (Figure 5.6) as has happened since the year 2000. In the TRANS-CSP scenario, the expansion of renewable energy will take place in niche markets like the Spanish Renewable Energy Act until about 2020, temporarily leading to slightly higher electricity costs than for a business-as-usual mix. During that time, the share of renewable energy will increase while the cost of renewable energy will decrease.
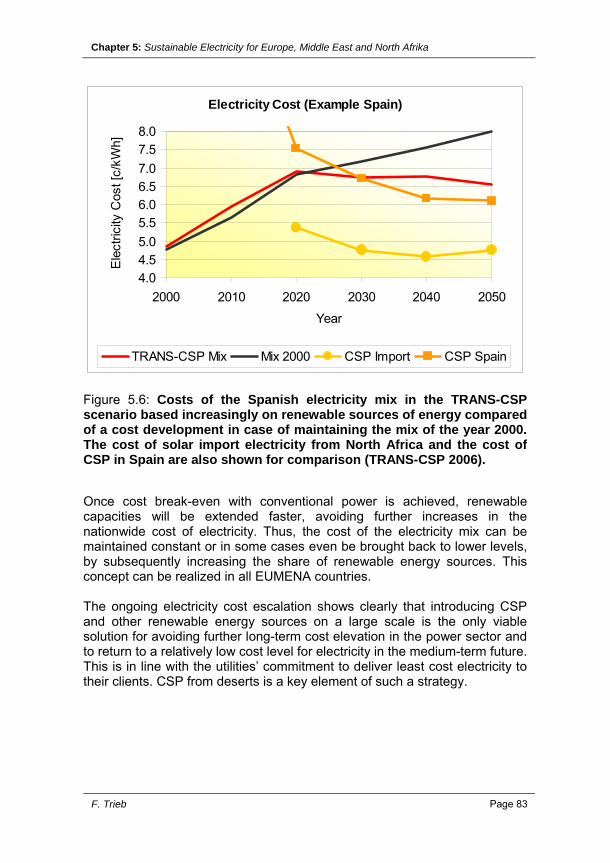
Chapter 5: Sustainable Electricity for Europe, Middle East and North Afrika
F. Trieb Page 83
Electricity Cost (Example Spain)
4.04.55.05.56.06.57.07.58.0
2000 2010 2020 2030 2040 2050
Year
Ele
ctric
ity C
ost [
c/kW
h]
TRANS-CSP Mix Mix 2000 CSP Import CSP Spain
Figure 5.6: Costs of the Spanish electricity mix in the TRANS-CSP scenario based increasingly on renewable sources of energy compared of a cost development in case of maintaining the mix of the year 2000. The cost of solar import electricity from North Africa and the cost of CSP in Spain are also shown for comparison (TRANS-CSP 2006). Once cost break-even with conventional power is achieved, renewable capacities will be extended faster, avoiding further increases in the nationwide cost of electricity. Thus, the cost of the electricity mix can be maintained constant or in some cases even be brought back to lower levels, by subsequently increasing the share of renewable energy sources. This concept can be realized in all EUMENA countries. The ongoing electricity cost escalation shows clearly that introducing CSP and other renewable energy sources on a large scale is the only viable solution for avoiding further long-term cost elevation in the power sector and to return to a relatively low cost level for electricity in the medium-term future. This is in line with the utilities’ commitment to deliver least cost electricity to their clients. CSP from deserts is a key element of such a strategy.
Security of Supply & Risk of Energy Availability
Editors: Haris Doukas, Alexandros Flamos & John Psarras Page 84
5.6. AN ALTERNATIVE TO CLIMATE CHANGE AND NUCLEAR PROLIFERATION
By implementing our scenario, carbon emissions can be reduced to values that are compatible with the goal of stabilizing the CO2 content of the atmosphere at 450 parts per million that is considered necessary by the Intergovernmental Panel on Climate Change in order to keep global warming in a range of 1.5 to 3.9 °C (IPCC 2001). Starting with 1790 million tons of carbon dioxide per year in the year 2000, emissions can be reduced to 690 Mt/y in 2050, instead of growing to 3700 Mt/y in a business as usual case (Figure 5.7). The final per capita emission of 0.58 tons/cap/y in the electricity sector is acceptable in terms of a maximum total emission of 1-1.5 tons/cap/y that has been recommended by the German Scientific Council on Global Environmental Change (Graßl 2003). Further reductions can be achieved after 2050. Other pollutants are reduced in a similar way, without any need to expand the use of nuclear energy and its associated risks. Carbon capture and sequestration (CCS) has been considered in our study as a complement, but not as an alternative to renewable energy, as it will reduce power plant efficiency and thus accelerate the consumption of fossil fuels. The fact that the cost of carbon capturing always adds to the cost of fossil fuels will accelerate cost break-even with renewables and increase the speed of their market introduction. The area required for the total renewable energy infrastructure including the proposed HVDC transmission lines for the period up to 2050 amounts to roughly 1 % of the total land area of EUMENA. This is comparable to the land required at present for the transport and mobility infrastructure in Europe. Using a geographic information system (GIS) three examples of HVDC lines connecting very good sites for CSP generation in MENA with three major European centres of demand were analyzed on the basis of a life cycle eco-balance (May 2005). The GIS was programmed to minimize cost, environmental impacts and visibility of the power lines, and we found that the resulting impacts are in an acceptable range. In general, the environmental impacts of HVDC lines are much lower than those of comparable AC overhead lines using conventional technology. Altogether, our scenario shows a way to reduce significantly the negative environmental impacts of power generation, and could also serve as a model for global application. This has been recognized by a study of the U.S. Department of Energy analyzing the feasibility of this concept for the U.S. (Price 2007).
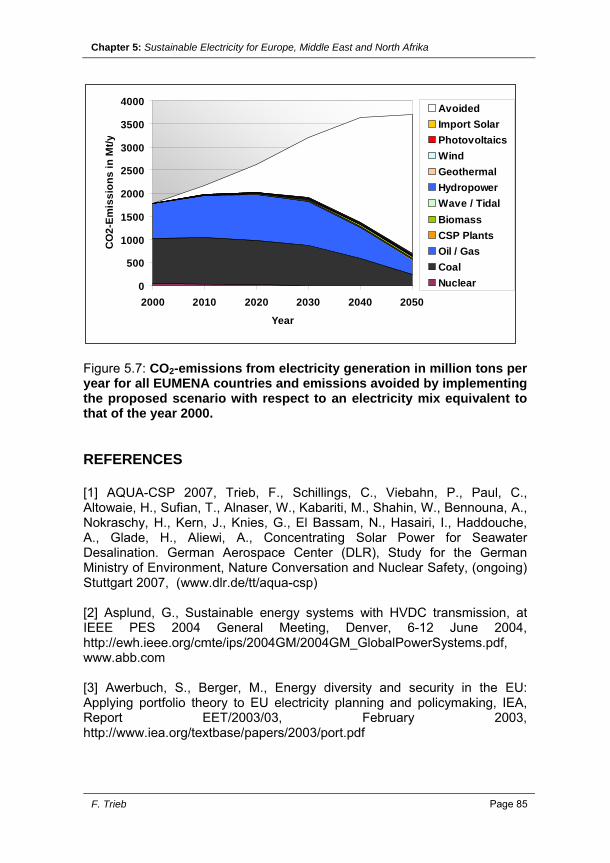
Chapter 5: Sustainable Electricity for Europe, Middle East and North Afrika
F. Trieb Page 85
0
500
1000
1500
2000
2500
3000
3500
4000
2000 2010 2020 2030 2040 2050
Year
CO
2-Em
issi
ons
in M
t/yAvoidedImport SolarPhotovoltaicsWindGeothermalHydropowerWave / TidalBiomassCSP PlantsOil / GasCoalNuclear
Figure 5.7: CO2-emissions from electricity generation in million tons per year for all EUMENA countries and emissions avoided by implementing the proposed scenario with respect to an electricity mix equivalent to that of the year 2000. REFERENCES [1] AQUA-CSP 2007, Trieb, F., Schillings, C., Viebahn, P., Paul, C., Altowaie, H., Sufian, T., Alnaser, W., Kabariti, M., Shahin, W., Bennouna, A., Nokraschy, H., Kern, J., Knies, G., El Bassam, N., Hasairi, I., Haddouche, A., Glade, H., Aliewi, A., Concentrating Solar Power for Seawater Desalination. German Aerospace Center (DLR), Study for the German Ministry of Environment, Nature Conversation and Nuclear Safety, (ongoing) Stuttgart 2007, (www.dlr.de/tt/aqua-csp) [2] Asplund, G., Sustainable energy systems with HVDC transmission, at IEEE PES 2004 General Meeting, Denver, 6-12 June 2004, http://ewh.ieee.org/cmte/ips/2004GM/2004GM_GlobalPowerSystems.pdf, www.abb.com [3] Awerbuch, S., Berger, M., Energy diversity and security in the EU: Applying portfolio theory to EU electricity planning and policymaking, IEA, Report EET/2003/03, February 2003, http://www.iea.org/textbase/papers/2003/port.pdf

Security of Supply & Risk of Energy Availability
Editors: Haris Doukas, Alexandros Flamos & John Psarras Page 86
[4] Bennouna, A., Nokraschy, H., A Sustainable Solution to the Global Problem of Water Scarcity in the Arab World, Proceedings of GCREADER Conference, Amman, 2006 [5] Benoit, G., Comeau, A., A Sustainable Future for the Mediterranean, Earthscan 2005 http://shop.earthscan.co.uk/ProductDetails/mcs/productID/667 [6] BMU 2004, German Federal Ministry for the Environment, Nature Conservation and Nuclear Safety (BMU), The Renewable Energy Sources Act, Berlin 2004, http://www.erneuerbare-energien.de/inhalt/6465/5982/ [7] Brischke, L.A., Model of a Future Electricity Supply in Germany with Large Contributions from Renewable Energy Sources using a Single Node Grid (in German), VDI Fortschritt Berichte, Reihe 6, Energietechnik, Nr. 530, ISBN 3-18-353006-6, VDI Düsseldorf 2005, http://www.vdi-nachrichten.com/onlineshops/buchshop/literaturshop/langanzeige.asp?vr_id=7124 [8] Commission of the European Communities, DG Research, World Energy Technology Outlook 2050 (WETO-H2), Luxembourg 2006, http://ec.europa.eu/research/energy/pdf/weto-h2_en.pdf [9] Commission of the European Communities, GREEN PAPER - A European Strategy for Sustainable, Competitive and Secure Energy, COM(2006) 105 final, Brussels, 8.3.2006 http://europa.eu.int/comm/energy/green-paper-energy/index_en.htm [10] Dürrschmidt, W., Zimmermann, G., Böhme, D., Eds., Renewable Energies - Innovation for the Future, German Federal Ministry for the Environment, Nature Conservation and Nuclear Safety, Berlin 2006, http://www.erneuerbare-energien.de/inhalt/37453/36356/ [11] Eurelectric, Union of the Electricity Industry, Mediterranean Interconnection - SYSTMED, Brussels 2003 http://public.eurelectric.org/Content/Default.asp?PageID=35 [12] European Environment Agency, Energy Subsidies in the European Union, EEA Technical Report 1/2004, Copenhagen 2004, http://reports.eea.europa.eu/technical_report_2004_1/en [13] Graßl H., et. al., World in Transition – Towards Sustainable Energy Systems, German Advisory Council on Global Change, WBGU, Berlin March 2003, http://www.wbgu.de/wbgu_jg2003_engl.html
Chapter 5: Sustainable Electricity for Europe, Middle East and North Afrika
F. Trieb Page 87
[14] Helmholtz-Gemeinschaft der Großforschungsunternehmen (HGF), Hearing on Nuclear Fusion before the Bundestag Committee for Education, Research and Technology Assessment, Berlin, 28. March 2001, http://fire.pppl.gov/eu_bundestag_english.pdf [15] International Energy Agency, World Energy Outlook 2005, Paris, 2005, http://www.worldenergyoutlook.org/ [16] International Energy Agency, Projected Costs of Generating Electricity - 2005 Update, Paris, 2005 [17] International Energy Agency, World Energy Outlook 2006, Paris, 2006, http://www.worldenergyoutlook.org/ [18] Intergovernmental Panel on Climate Change (IPCC), Climate Change 2001 – Synthesis Report – Summary for Policy Makers, www.ipcc.ch/pub/un/syreng/spm.pdf [19] Mantzos L., Capros, P., European Energy and Transport Trends to 2030, Update 2005, The European Commission, Brussels 2005, http://ec.europa.eu/dgs/energy_transport/figures/trends_2030/1_pref_en.pdf [20] May, N., Eco-Balance of Solar Electricity Transmission from North Africa to Europe, Diploma Thesis, University of Braunschweig, 2005, http://www.dlr.de/tt/trans-csp [21] MED-CSP 2005, Trieb, F., Schillings, C., Kronshage, S., Viebahn, P., May, N., Paul, C., Klann, U., Kabariti, M., Bennouna, A., Nokraschy, H., Hassan, S., Georgy Yussef, L., Hasni, T., Bassam, N., Satoguina, H., Concentrating Solar Power for the Mediterranean Region. German Aerospace Center (DLR), Study for the German Ministry of Environment, Nature Conversation and Nuclear Safety, April 2005. (www.dlr.de/tt/med-csp) [22] Nuclear Decommissioning Authority (NDA), Managing the Nuclear Legacy - A strategy for action, Whitepaper of the UK Nuclear Decommissioning Authority, London 2002, www.nda.gov.uk [23] Neij, L., et al., Experience Curves: A Tool for Energy Policy Assessment, Lund University, European Commission, Lund 2003, http://www.iset.uni-kassel.de/extool/Extool_final_report.pdf [24] Pitz-Paal, R., Dersch, J., Milow, B., European Concentrated Solar Thermal Road Mapping, ECOSTAR, SES6-CT-2003-502578, European Commission, 6th Framework Programme, German Aerospace Center, Cologne 2005 ftp://ftp.dlr.de/ecostar/ECOSTAR_Roadmap2005.pdf
Security of Supply & Risk of Energy Availability
Editors: Haris Doukas, Alexandros Flamos & John Psarras Page 88
[25] Price, H., DLR TRANS-CSP Study applied to North America, Department of Energy of the United States of America (DOE) 2007, http://www.osti.gov/bridge/purl.cover.jsp?purl=/910505-F2lSrR/ [26] Teske, S., Zervos, A., Schäfer, O., Energy (R)evolution, Greenpeace, EREC 2007 http://www.greenpeace.de/fileadmin/gpd/user_upload/themen/energie/energyrevolutionreport_engl.pdf [27] TRANS-CSP 2006, Trieb, F., Schillings, C., Kronshage, S., Viebahn, P., May, N., Paul, C., Klann, U., Kabariti, M., Bennouna, A., Nokraschy, H., Hassan, S., Georgy Yussef, L., Hasni, T., Bassam, N., Satoguina, H., Trans-Mediterranean Interconnection for Concentrating Solar Power. German Aerospace Center (DLR), German Ministry of Environment, Nature Conversation and Nuclear Safety, June 2006. (www.dlr.de/tt/trans-csp) [28] Trieb, F., Müller-Steinhagen, H., Concentrating Solar Power for Seawater Desalination in the Middle East and North Africa, (submitted for review) Desalination 2007 [29] Trieb, F., Müller-Steinhagen, H., Kern, J., Scharfe, J., Kabariti, M., Al Taher, A., Technologies for Large Scale Seawater Desalination Using Concentrated Solar Radiation, (submitted for review) Desalination 2007 [30] Trieb, F., Klann, U., Modelling the Future Electricity Demand of Europe, Middle East and North Africa, Internal Report, DLR 2006 http://www.dlr.de/tt/institut/abteilungen/system/projects/all_projects/projektbeschreibung_med-csp/additional_reports/Demand-Model_20061128.pdf [31] United Nations, World Population Prospects: The 2004 Revision Population Data Base, Medium Growth Scenario, Department of Economic and Social Affairs, Population Division Homepage 2006 http://esa.un.org/unpp/ [32] World Bank, Global Environmental Facility, Promotion of a Wind Power Market in Jordan, Project Executive Summary, GEF Council Work Programme Submission, Washington 2006, http://www.gefweb.org/documents/Council_Documents/GEF_C28/documents/2555JordanWindExecutiveSummary04-26-06Clean.pdf
Chapter 6: Security of Electricity Supply: Issues of Regulatory Importance
K. G. Perrakis Page 89
Chapter 6: SECURITY OF ELECTRICITY SUPPLY: ISSUES OF REGULATORY IMPORTANCE Kostis G. Perrakis RAE – Regulatory Authority for Energy, Athens, Greece Security of electricity supply is among the key issues and main focus of most significant framework of relevance for the EU electricity market and regulation, including not just legislation (Directives 2003/54/EC, 2005/89/EC) but also the EC Green Paper, the DG COMP Sector Inquiry (Final Report), etc. It is therefore of topmost priority to address the issue of security of electricity supply in a coherent and systematic way, from the regulatory perspective and taking into account all relevant impacts and dependencies. In this chapter, several aspects concerning the situation and practical implementation of the security of supply issues are presented.

Security of Supply & Risk of Energy Availability
Editors: Haris Doukas, Alexandros Flamos & John Psarras Page 90
INTRODUCTION The interest on issues related to security of supply (SoS) in modern liberalised electricity markets has been gaining interest during the last years. The European Commission has also shown concerns about issue: Directive 2003/54/EC of 26 June 2003 (Article 7) has encouraged backup mechanism like tendering procedure to ensure generation adequacy if on the basis of the authorisation procedure for new capacity and market arrangements the generating capacity being built or the energy efficiency/demand-side management measures being taken were not sufficient. Further, Directive 2005/89/EC of 18 January 2006 has pointed out: • the importance of transparent and stable regulatory framework and
investment climate; • the importance of encouraging the establishment of liquid wholesale
markets that provide suitable price signals; • the importance of removing administrative barriers to investments; • the possibility to take additional measures like provisions facilitating new
generation capacity and tendering or equivalent procedures; • the possibility to take account of the degree of diversity in electricity
generation. The European Commission is not prescriptive in the way generation adequacy has to be ensured. Within that scope, all timeframes have to be considered from a few years ahead (investments in new generation capacities) to close to real time (e.g. sufficient margin over peak load). Thus, practices largely differ today in Europe. As there were concerns that energy-only markets may not ensure generation adequacy, some alternatives have been designed and implemented (or could be in near future). Furthermore, the Council of European Energy Regulators (CEER) has been performing related work, within the Electricity Security of Supply Task Force - ESS TF [1]. As there are usually more than one definitions of terms related with security of supply issues, in the present context it would be helpful to mention some definitions which have appeared in the literature. According to the CEER [1], “Security of supply means that customers have access to electricity at the time they need it with the defined quality and at a transparent and cost-oriented price ”. Further, a distinction between the generation system and the overall electricity system is used. Thus, (a) the term generation adequacy means an adequate level for meeting demand of predictable consumers is available; all timeframes are considered from a few years ahead (investments in new generation

Chapter 6: Security of Electricity Supply: Issues of Regulatory Importance
K. G. Perrakis Page 91
capacities) to close to real time and (b) the term system adequacy means that an adequate level of generation and network capacities are available in relation to the predictable level and location of demand. According to EURELECTRIC [2], Security of Supply involves several factors, structured as follows: • Long term
o access to primary fuels o system adequacy
generation adequacy network adequacy
o market adequacy • Short term
o operational security According to UCTE, System Adequacy measures the ability of a power system to cope with its load in all the steady states it may operate in standard conditions. Generation adequacy analyses the ability of the generation assets to cover the peak load taking into account uncertainties on the generation availability and on the load level. Uncertainties result from planned and unplanned outages, availability of primary sources, weather conditions such as temperature, wind, water inflows. Transmission adequacy enhances the analysis with the flexibility provided by interconnections and import/export flows. The fundamental question is whether SoS can be provided by the market. As an example, some naïve approach for the case of ensuring electricity generation in the medium term, could suggest that if market cannot deliver security of supply we have to address an “externality”, by either imposing some last resort or similar public service obligations and socialise the costs, or use a central entity for tendering of new capacity. An alternative approach could be to let the market free to deliver sufficient price signals; this, of course leads to the question whether the market is perfect or not. There is a lot of evidence in todays´ designs that this is generally not true: other external costs, market power, transaction costs, asymmetric information, insufficient market integration, absence of risk management, barriers to entry, lack of variety in supply, etc. are some of the reasons for such market failures. In what follows, a methodology for the taxonomy of security of supply issues is proposed, a list of criteria against which ´energy only´ markets should be analysed is presented, possible practices and mechanisms for achieving generation adequacy (European practices as well as capacity requirements
Security of Supply & Risk of Energy Availability
Editors: Haris Doukas, Alexandros Flamos & John Psarras Page 92
implemented in the USA) are mentioned and, finally, some issues and indexes for monitoring electricity security of supply are discussed. 6.1. TAXONOMY SCHEME FOR ELECTRICITY SECURITY OF
SUPPLY There are at least three dimensions under which electricity security of supply could be analysed, as follows: • time, where we distinguish
a) long term (over 5-7 yrs, and up to an horizon which allows major infrastructures and sources of primary energy to change)
b) medium term (up to 5 yrs, dealing with the so called adequacy issues, under the assumption that existing facilities and installations may change but overall infrastructure, primary resources, etc. may not change)
c) short term (dealing with existing facilities and issues e.g. more or less related with the engineering issue of ´reliability´)
• sector a) generation – demand b) transmission c) distribution
• functional, where we distinguish a) technical issues (codes and standards, etc) b) regulatory issues (market design issues, etc.)
6.2. ENERGY ONLY MARKETS Many scholars sustain that an “energy only” market design may result as the most efficient approach to ensure generation adequacy: transparent scarcity pricing would create better incentives for both operation and investment than any prescriptive regulation. However such an approach may face constraints in real energy markets, especially where market power is still too concentrated, demand flexibility and transparency are too limited, forward contracting is not fully developed (which may still be the case for many European markets) and political aversion against price spikes could lead to introduction of price cap. Some criteria for judging the ”energy only” design are mentioned below. The use of such criteria would be necessary in order to assess the effectiveness
Chapter 6: Security of Electricity Supply: Issues of Regulatory Importance
K. G. Perrakis Page 93
as well as key issues related to generation adequacy of a specific electricity market. • Ability to ensure adequate installed generation capacity; • Ability to ensure adequate available generation capacity; • Ability to ensure diversity of primary energy sources; • Ability to ensure adequate mix of generation technologies; • Compatibility with locational signals; • Compatibility with cross-border trade and internal electricity market; • Compatibility with current market designs in Europe; • Information needed by market players. 6.3. MECHANISMS ON GENERATION SIDE TO ENSURE
ADEQUATE CAPACITY Opinions differ sharply on whether liberalised “energy only” markets will deliver efficient, adequate and timely investment, or whether additional instruments, such as capacity payments, obligations or options are necessary or even desirable. Standard economic theory as applied to electricity markets (e.g. by Caramanis, 1982 in [3]) shows that a well-designed set of competitive (nodal) spot markets give prices that, if correctly predicted, would induce the efficient level and type of investment. The practical question is whether such markets will or can work according to the theory, whether investors will forecast future conditions and/or prices sufficiently accurately, and whether they will be otherwise deterred (by risk aversion or the fear of regulatory intervention) from responding to those signals in a timely manner. It has been mentioned [4] that whether or not liberalised markets are provided with mechanisms specifically designed to ensure capacity adequacy depends on the initial conditions in each jurisdiction. In some cases (England and Wales, the Northeast US, among others) the vertically integrated utility had a well-defined planning margin for reserves, and it was considered important to protect this during the transition to competitive markets by a mechanism that would deliver the same degree of security. In other markets, continued state-ownership of the bulk of generation may have provided assurances that investment would be forthcoming if future margins appeared uncomfortably tight. In yet other jurisdictions, surplus capacity, concentration and the slow evolution of workable markets may have reduced the urgency to consider whether capacity payments were needed, and whether if created they might over-reward already comfortable incumbents, given that a satisfactory design would be challenging.
Security of Supply & Risk of Energy Availability
Editors: Haris Doukas, Alexandros Flamos & John Psarras Page 94
Some of the mechanisms which have been used in various electricity markets to assure capacity adequacy are mentioned. • Tendering; • Backup (or peak) Reserve; • Capacity Payments; • Capacity Requirement; • Reliability Options. 6.4. MONITORING THE ELECTRICITY SECURITY OF SUPPLY The term monitoring implies definition of appropriate indices, parameters etc., indicating ´performance´ of the system, the values of which should either be monitored (eg. in case of a ´simple´ index) or calculated (in case of a ´composite´ index) based on an appropriate method. Thus, monitoring could consist of at least the following entities: • the indices, parameters, etc. which are subject to monitoring, and
relevant time frames (i.e. yearly index, weekly, daily, etc); • a methodology (used to collect data and, where necessary, process
them ); • the actual values of the indices, parameters, etc; • a discussion of the causes for the specific performance; • measures (taken, or expected to be taken) to maintain / improve the
performance and the associated indicators. It should be mentioned that ´monitoring´ may involve both backward looking as well as forward-looking (or ´forecast´) elements. Any forward-looking elements in the electricity sector usually come from analysis of existing (´historical´) information. The number of years to the past or to the future should be defined in each case. A forward-looking monitoring activity consists of at least the following entities: • existing data - and information; • an analysis (of the above data and information); • a methodology (used to perform the above analysis); • the forecast per se. In both cases (monitoring and forecast) and since in the electricity markets there are various actors involved, having a variety of roles (regulators, TSOs, generators, consumers, etc), suitable indexes – signals should be produced
Chapter 6: Security of Electricity Supply: Issues of Regulatory Importance
K. G. Perrakis Page 95
for each category of actors. An example of possible indexes, for medium and short term issues, is shown in Table 6.1. REFERENCES [1] CEER - Security of Supply Report 2004, September 2004 [2] EURELECTRIC, Security of Supply – Roles, responsibilities and experiences within the EU, Jan. 2006. [3] Caramanis, M.C. (1982) “Investment decisions and long-term planning under electricity spot pricing”, IEEE, Transactions on Power Apparatus and Systems 101 (12): 4640-4648. [4] David Newberry, Karsten Neuhoff and Fabien Roques, ´Generation adequacy and investment incentives in liberalised markets´, Univ. of Cambridge, 2005

Security of Supply & Risk of Energy Availability
Editors: Haris Doukas, Alexandros Flamos & John Psarras Page 96
Table 6.1: Indices for Electricity Security of Supply
GENERATION SUPPLY NETWORKS SYSTEM
FOR
EC
AS
T
Installed capacity (additions, retirements) Load (eg. monthly peaks) Energy demand (eg. monthly) Energy available (eg. for hydro) Prices (wholesale)
Prices (retail)
New investments (national, interconnectors) Congestion on specific ´corridors´ ATC on specific ´corridors´ Tariffs for transmission / distribution networks
MO
NIT
OR
ING
Installed capacity (additions, retirements) Load (eg. monthly peaks) Energy demand (eg. monthly) Energy available (eg. for hydro) Prices (wholesale)
Existence of measures for shortfall of suppliers DSM measures (eg. interruptible contracts, advanced metering, etc) Prices (retail)
Outages of equipment Congestion on specific ´corridors´ Implemented investments (national, interconnectors) ATC on specific ´corridors´ Tariffs for transmission / distribution networks
SAIFI, SAIDI, etc. Existence and publicity of: -operational rules -load curtailment criteria and methodology -rules and requirements for information exchange between TSOs
Chapter 7: Monitoring and Evaluation of the RES Directives Implementation in EU27 and Policy Recommendation for 2020-RES2020
G. Giannakidis Page 97
Chapter 7: MONITORING AND EVALUATION OF THE RES DIRECTIVES IMPLEMENTATION IN EU27 AND POLICY RECOMMENDATIONS FOR 2020-RES2020 George Giannakidis CRES – Centre for Renewable Energy Sources, Greece One of the main priorities of the EU is analysing the present situation in the renewable energy sources implementation in EU27, defining future options for policies and measures, calculating concrete targets for the RES contribution that can be achieved by the implementation of these options and finally examine the implications of the achievement of these targets to the European Economy. A number of future options for policies and measures will be defined and they will be studied with the use of the TIMES energy systems analysis model, in order to analyze the quantitative effects on the RES development. TIMES offers the possibility of developing an aggregate parameter in order to quantify the impact of a wide range of support schemes. The results will be combined to provide recommendations of optimal mix scenarios for policy measures, in order to ensure the achievement of the targets.
Security of Supply & Risk of Energy Availability
Editors: Haris Doukas, Alexandros Flamos & John Psarras Page 98
INTRODUCTION Three major European Energy Policy priorities, Security of Supply, Climate Change and Competitiveness, depend heavily on the contribution of RES to the primary energy mix of the EU countries. In this context the EC has published two Directives setting targets for renewable electricity and biofuels, and also the Biomass action plan in order to promote the use of biomass. An increased interest is also evident in the field of renewable heating and cooling, with the possibility of a directive being discussed. Furthermore, the Communication on the support of electricity from renewable energy sources has made it clear that coordination and optimisation of policy instruments will remain a priority for the coming years. To this end, there is a need for a concrete and accurate methodology to monitor the level of implementation of the quantitative targets set by the RES and environmental policies. 7.1. OBJECTIVES The first step in this chapter will be a detailed description of the existing situation in EU27 regarding RES. The European Renewable Energy Council (EREC) and the RES technology associations provided the necessary data, through contacts with local producers, in each Member State, in order to obtain an independent market view. This will include a) Installed capacities b) Financial & political framework c) Technological potential d) Issues regarding market penetration of RES The TIMES energy systems analysis model, developed in the framework of the ETSAP Implementing Agreement of the IEA, will be applied in the scenario analysis stage. The advantage of the model is its ability to model the whole of the energy sector on a country level, taking in mind the contribution of RES-E, biomass, biofuels and renewable heating/cooling in general. TIMES is able to model trade of biomass among different countries, both as primary products or as derived products. This is an issue often neglected in existing studies, and the ability to cover this issue provides a clear advantage of the model. A number of future options for policies and measures will be defined and they will be studied with the use of TIMES, in order to analyze the quantitative effects on the RES development. TIMES offers the possibility of
Chapter 7: Monitoring and Evaluation of the RES Directives Implementation in EU27 and Policy Recommendation for 2020-RES2020
G. Giannakidis Page 99
developing an aggregate parameter in order to quantify the impact of a wide range of support schemes. The results will be combined to provide recommendations of optimal mix scenarios for policy measures, in order to ensure the achievement of the EC targets. These optimal mix scenarios for policy measures will be presented and discussed in regional workshops as well as in a policy event to be organized during the following years, and will be presented in a session of an Interparliamentary meeting of the European Parliament. In this respect, the following have to be elaborated so as EC to achieve the related targets: • A quantitative analysis of the effects of the current RES policies and
measures. • Independent, accurate monitoring of RES policies in EU25 (and EU27) • Quantitative targets for RES for 2020 and related benefits. • Policy recommendations for EU25 (and EU27). • Potential Impacts (environmental, economic, etc.) from RES
penetration. • Detailed representation of renewable energies costs and potentials in a
dedicate set of reliable energy models for the EU-27. • Regional workshops and an International Policy Event. 7.2. MODELLING OF DISTRIBUTED GENERATION Distributed Generation (DG) is the implementation of various power generating resources, near the site of demand, either for reducing reliance on, or for feeding power directly into the grid. DG may also be used to increase the transmission and distribution system reliability. Figure 7.1 shows the final proposal for the new electricity structure in the reference energy system. The structure of electricity transportation and distribution systems includes processes that describe the grids. The idea is to add in the initial electricity templates, the transmission and distribution grids (as processes), and to differentiate between the commodities produced from the centralised power plants from those consumed and produced form decentralised technologies. In this way the new scheme will represent the difference between centralised production of electricity, and decentralised production of electricity. Some hypotheses are necessary to simplify the network issues. 1) The distribution networks should be operating in a radial or meshed
configuration. Modelling meshed networks would however require the implementation of advanced load flow calculation, which is not the

Security of Supply & Risk of Energy Availability
Editors: Haris Doukas, Alexandros Flamos & John Psarras Page 100
purpose of this model. Therefore a simplified approach is assumed here.
2) Each voltage level of the network is modelled by an equivalent simplified system (EVTRANS_X-X) composed of lines, transformers, infrastructure for electricity transport and distribution. The requested minimum data for these technologies are efficiency (losses for each voltage level) and variable cost to simulate the grid tariff on each voltage level.
The technology EVTRANS_H-H changes input commodity of process from ELCHIG to ELCHIGG and describes the high voltage transport before the use and the transformation in medium voltage. The efficiency values of EVTRANS_H-H reflect grid losses of high voltage level and the variable cost for the transmission tariffs. The technology EVTRANS_H-M is a transformation / grid process reflecting high – medium voltage transformation and the medium voltage grid (from ELCHIGG to ELCMED) and adds transmission losses as process efficiency according to medium voltage grid loss values. The technology EVTRANS_M-L is a transformation / grid process reflecting medium – low voltage transformation and the low voltage grid. The new process EVTRANS_M-L has ELCMED as input and ELCLOW as output. Efficiency is adopted from commodity efficiency of ELCLOW and variable costs are represented by grid utilization cost of low voltage consumers minus costs of medium and high voltage level.
Figure 7.1: Electricity Structure

Chapter 7: Monitoring and Evaluation of the RES Directives Implementation in EU27 and Policy Recommendation for 2020-RES2020
G. Giannakidis Page 101
Wind energy in the RES approach, is divided into two technologies, on-shore and off-shore. In the base year, 2000, off-shore wind was negligible, so only existing on-shore wind turbines are be considered. The key parameters are installed capacities and an average availability factor in each time slice of the model. In future years average availabilities are calculated for each country and milestone year on the basis of disaggregated data and assumptions. This simplified structure is compatible with the detailed assumptions on availability in time slices. Introducing different classes of wind power may be considered after test runs of the model. However, it is currently preferred to model availability factors depending on calculation based on disaggregated technologies. For each country the maximum potential for on-shore and off-shore wind has been collected. Data for planned installed capacities are requested as minimum capacities for the optimisation model. Further installed capacities will be considered as scenario assumptions. Data for planned installed capacities are requested as minimum capacities for the optimisation model. Further installed capacities will be considered as scenario assumptions. Considering the variation in wind resources from year to year an even more simplified structure is recommended. Monthly data for wind power are available from UCTE and Nordel for most countries from 2005. These data are easily converted to seasonal data following the TIMES time slices. For all countries with a significant capacity of wind power there is a common pattern of seasonal variation. Winter: 20-30 %, Fall: 20-25 %, Spring 15-25 %, and Summer: 10-20 %. Statistics for diurnal variations are available from few countries only (Denmark and Greece). Although the average daytime availability tends to be slightly higher than nighttime availability, it is not recommended to consider this variation in the model. Data for installed capacities by the end of the year are available from EWEA since 2004. At the end of 2006, offshore wind farm installations represented 1.8% of total installed wind power capacity, generating 3.3% of Europe's wind power. The largest share of offshore wind capacity is 13% in Denmark. For countries with coasts to the Atlantic Ocean, the North Sea the annual availability factor is set as 40 % with seasonal variations similar to onshore wind power. For countries in the Baltic Sea the Finnish assumption at 34% is used. Average seasonal availabilities calculated from the monthly statistics for 2005 and 2006 are used for BE, DE, DK, ES, FR, IT, NL, NO, PL, PT. National studies are used for FI and GR, because the generation of the currently small capacity will not represent future investments. For UK monthly data on ‘Other electricity’ from BERR are used for 2006 only. For

Security of Supply & Risk of Energy Availability
Editors: Haris Doukas, Alexandros Flamos & John Psarras Page 102
the rest of the countries the national data from countries with similar climate and large wind capacity are used. The TIMES model also considers the availability for each technology in peak load hours. In the Pan-European model an availability for wind power at 6 % had been assumed for most countries. However, before making any assumption of an arbitrary number, the impact of such assumption should be tested by running the model. Many methods for demand peak shaving are currently being tested by European system operators. These include – among other measures - international trade and flexible demand, using far more detailed models than TIMES focusing on the short-term operation of the electricity system. In contrast, TIMES is designed to give the right answers for long-term technology choices. 7.3. MODELLING OF THE BIOENERGY SUPPLY CHAIN A detailed modelling of the bioenergy supply chain is performed in the framework of achieving EC’s targets. The main problems that have to be addressed regarding the potentials of bioenergy are: • Finding a source that fits the categories and the definition of different
biomass/waste types. • The availability of data for potentials as well as for costs. Regarding bio-energy crops the data on potentials and costs originate from the European IEE project REFUEL. In the REFUEL project three scenarios are considered. The first is a reference scenario (‘baseline’) that describes the ‘most likely’ developments under current policy settings. Baseline essentially reflects effects of ongoing trends in food consumption patterns on the one hand and technological progress in food production on the other hand, and it assumes a continuation of current self-reliance levels in Europe’s aggregate food and feed commodities. In the other two scenarios, the focus is more on difference in land area becoming available in the future for bio-fuel feedstock production (scenario ‘high’ and scenario ‘low’). Agricultural production intensity, depends on agricultural and environmental policies as well as technological progress, and may vary significantly in different scenarios. In first instance the potentials from the Baseline scenario will be used. Potentials of the high and low scenario can be used for the scenario analysis of the RES targets. Competing land use requirements for Europe’s food and livestock sector as well as land use conversion from agriculture to other uses, in particular built-up and associated land areas, will determine the future availability of land for energy crop production. Future food and feed area requirements are the result of developments in food demand combined with changes in the production intensity and trade of

Chapter 7: Monitoring and Evaluation of the RES Directives Implementation in EU27 and Policy Recommendation for 2020-RES2020
G. Giannakidis Page 103
agricultural products. Moreover, areas of high nature conservation value are excluded from the potential biofuel crop area. The source for potentials and costs of wastes and residues is the EEA study “How much bioenergy can Europe produce without harming the environment?”. The report covers several residue flows of biomass. From the EEA study, the following flows have been taken into account: forestry residues, wood processing residues, municipal solid waste, wet manures and black liquor. From the REFUEL study, the costs and potentials of agricultural residues have been used. The EEA data assumes certain sustainability interests into account, thereby limiting the potentials somewhat. Contrary to the data on bioenergy crops, some of the data on residues have been modified in order to guarantee better correspondence to national insight into the residue potentials. Most of the enhancements in the representation of biofuels are made on the supply side, for instance on the differentiation of crop types and waste and residues sources to be used for the production of biofuels. The basic enhancements are: • Differentiation of potentials of energy crops with different costs, taking
into account land-use competition between different crops. • Rape oil as an intermediate product that also can be imported or traded. • Ethanol production from sugar as well as from starch crops. • Differentiation of potentials of energy crops with different costs. Although no additional production technologies are implemented, all the technology data are updated with data from the REFUEL project. Using the REFUEL data, all second generation biofuels production technologies will have electricity as a by-product. By-products from oil extraction from rape seed, bio-diesel production, ethanol production from sugar crops and ethanol production from starch crops, are respectively oil pulp glycerol, stillage and beet pulp. Using these by-products as fodder is at this moment more economic than using it for other energy uses like electricity production. Prices of by-products are based on current market prices, taking into account a downward price effect because of increased supply of the by-products (figure based on the Biofuels Progress Report from Jan. 2007 by the European Commission). Alternatively, they are taken from the ConCaWe (JRC) study which also takes such effects into account. 7.4. DEFINITION OF SCENARIOS When talking about scenarios definition for a model it is important to make a distinction between ‘external’ developments, which cannot be influenced directly by policy makers, and policy measures. The first can be translated
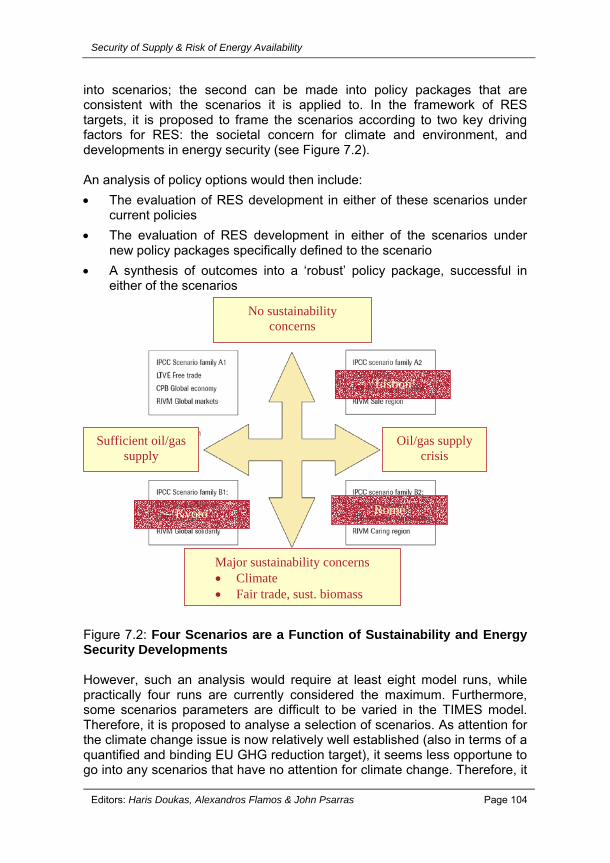
Security of Supply & Risk of Energy Availability
Editors: Haris Doukas, Alexandros Flamos & John Psarras Page 104
into scenarios; the second can be made into policy packages that are consistent with the scenarios it is applied to. In the framework of RES targets, it is proposed to frame the scenarios according to two key driving factors for RES: the societal concern for climate and environment, and developments in energy security (see Figure 7.2). An analysis of policy options would then include: • The evaluation of RES development in either of these scenarios under
current policies • The evaluation of RES development in either of the scenarios under
new policy packages specifically defined to the scenario • A synthesis of outcomes into a ‘robust’ policy package, successful in
either of the scenarios
Figure 7.2: Four Scenarios are a Function of Sustainability and Energy Security Developments However, such an analysis would require at least eight model runs, while practically four runs are currently considered the maximum. Furthermore, some scenarios parameters are difficult to be varied in the TIMES model. Therefore, it is proposed to analyse a selection of scenarios. As attention for the climate change issue is now relatively well established (also in terms of a quantified and binding EU GHG reduction target), it seems less opportune to go into any scenarios that have no attention for climate change. Therefore, it
Major sustainability concerns • Climate • Fair trade, sust. biomass
No sustainability concerns
Oil/gas supply crisis
Sufficient oil/gassupply
‘Rome’ ‘Kyoto’
‘Lisbon’
Chapter 7: Monitoring and Evaluation of the RES Directives Implementation in EU27 and Policy Recommendation for 2020-RES2020
G. Giannakidis Page 105
is proposed to focus on the ‘Kyoto’ and ‘Rome’ scenarios in Figure 7.2, in which future developments in energy security are the key differentiating factor between the two. The proposal is then to have the following four analyses: 1. The evaluation of RES development in Kyoto under current policies 2. The evaluation of RES development in Rome under current policies 3. The evaluation of RES development in Kyoto under a newly developed
set of policy measures consistent with this scenario 4. The evaluation of RES development in Rome under another, also newly
developed set of policy measures consistent with this scenario On the basis of the results, then a package of policy measures can be suggested that represents a relatively robust strategy, leading to e.g. meeting the 2020 targets in either of the scenarios. Furthermore, these results will be accompanied by the insights from several sensitivity analysis, in which only specific model parameters will be varied. These include: • Changes in GDP growth and related primary energy demand • Changes in the applied discount rate • Additional changes in the imports for biomass in terms of potential
volume and costs, as a reflection of biomass sustainability concerns The key difference between the two scenarios is in terms of the availability of raw materials for energy (see Table 7.1). In the Kyoto scenario, we assume that oil and gas supply are relatively high and stable, at moderate prices. The same applies to the availability of biomass. Furthermore, the absence of a global energy security issue allows for relatively open international trade. In the Rome scenario, there is a crisis in raw material supply. This means that oil and gas have strongly increased prices. Furthermore, biomass is available in less high amounts and against higher prices. This is partly caused by increased domestic use of biomass in exporting regions that are also facing high oil and gas prices. But the high fossil prices have also lead to a reduction of international trade, by the formation of trading blocks and a more assertive attitude of major energy export countries such as Russia.
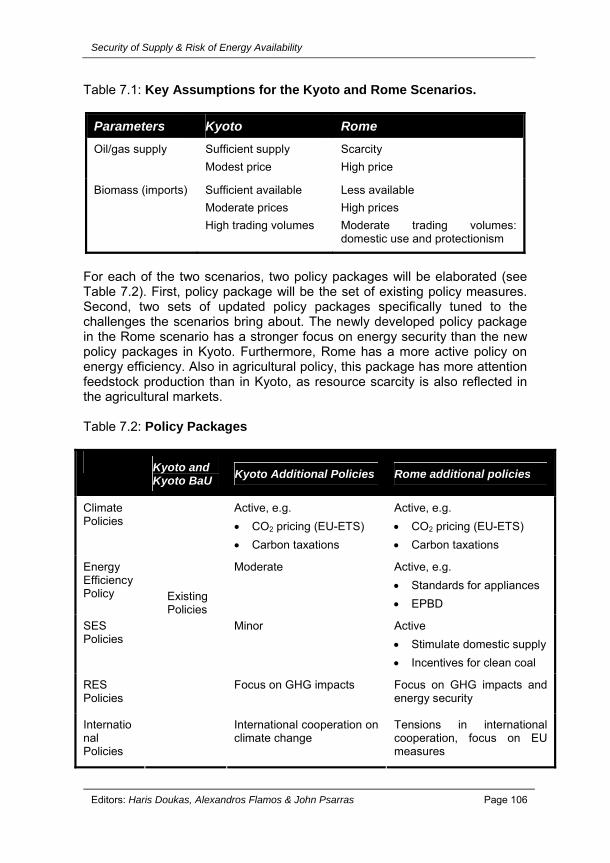
Security of Supply & Risk of Energy Availability
Editors: Haris Doukas, Alexandros Flamos & John Psarras Page 106
Table 7.1: Key Assumptions for the Kyoto and Rome Scenarios.
Parameters Kyoto Rome Oil/gas supply Sufficient supply
Modest price Scarcity High price
Biomass (imports) Sufficient available Moderate prices High trading volumes
Less available High prices Moderate trading volumes: domestic use and protectionism
For each of the two scenarios, two policy packages will be elaborated (see Table 7.2). First, policy package will be the set of existing policy measures. Second, two sets of updated policy packages specifically tuned to the challenges the scenarios bring about. The newly developed policy package in the Rome scenario has a stronger focus on energy security than the new policy packages in Kyoto. Furthermore, Rome has a more active policy on energy efficiency. Also in agricultural policy, this package has more attention feedstock production than in Kyoto, as resource scarcity is also reflected in the agricultural markets. Table 7.2: Policy Packages Kyoto and
Kyoto BaU Kyoto Additional Policies Rome additional policies
Climate Policies
Active, e.g. • CO2 pricing (EU-ETS) • Carbon taxations
Active, e.g. • CO2 pricing (EU-ETS) • Carbon taxations
Energy Efficiency Policy
Moderate Active, e.g. • Standards for appliances • EPBD
SES Policies
Minor Active • Stimulate domestic supply • Incentives for clean coal
RES Policies
Focus on GHG impacts Focus on GHG impacts and energy security
International Policies
Existing Policies
International cooperation on climate change
Tensions in international cooperation, focus on EU measures
Chapter 7: Monitoring and Evaluation of the RES Directives Implementation in EU27 and Policy Recommendation for 2020-RES2020
G. Giannakidis Page 107
ACKNOWLEDGEMENTS The RES2020 project is supported by the “Intelligent Energy – Europe” programme. The sole responsibility for the content of this publication lies with the authors. It does not necessarily reflect the opinion of the European Communities. The European Commission is not responsible for any use that may be made of the information contained therein. REFERENCES [1] Gargiulo, M, Grohnheit P.E., (2008). Modelling distributed generation and variable loads from RES. RES2020 project Deliverable 3.1, www.res2020.eu [2] Rosler, H, (2008). Technology characterisation for biofuels and renewable heating/cooling. RES2020 project Deliverable 3.2, www.res2020.eu [3] Londo, M, Rosler, H, Lensink, S. Proposal for Scenarios and Policy Packages in RES2020. RES2020 project, www.res2020.eu [4] REFUEL, Intelligent Energy Europe Project, www.refuel.eu [5] EEA (2007): How much bioenergy can Europe produce without harming the environment? European Environment Agency (EEA), EEA Report No 7/2006.

Security of Supply & Risk of Energy Availability
Editors: Haris Doukas, Alexandros Flamos and John Psarras Page 108
Chapter 8: CROSS BORDER INTERCONNECTIONS: A DRIVING FORCE IN SECURITY SUPPLY AND MARKETS DEVELOPMENT Antonio Lopez de Sebastian UNESA – Asociacion Espanola de la Industria Electrica, Spain The issue of the cross-border interconnections is a peculiar element of the transmission networks, as well as of the reinforcement of the European Transmission network. This chapter explores the place of cross-border interconnections in the European Energy Strategy and in particular, its connection with the most relevant concerns on the European energy policy: the fight against the climate change and the security of energy supply. In addition, the chapter examines the specific singularity of the interconnectors as a weak element in Transmission Networks, the important role that the reinforcement of networks and interconnectors plays in security of supply and in markets development and expansion. Finally, particular emphasis will be laid in two cases, the Medring and the Iberian Market.
Chapter 8: Cross Border Interconnections: A Driving Force In Security Supply And Markets Development
A. L. de Sebastian Page 109
8.1. SECURITY OF SUPPLY AND MARKETS DEVELOPMENT IN
THE EUROPEAN ENERGY STRATEGY 8.1.1. Main Objectives
The European Union (EU) has set its core energy objectives. These objectives are the following: • Security of supply: In the framework of the European energy strategy,
an issue of major importance is the increasing dependence of the energy supply in Europe from imported primary energies. It has been estimated that there will be an increase in the contribution of imported primary energies from the current 50% to 65% in 2030 [1], if no measures are adopted.
• Environmental sustainability: The fight against the climate change requires a reduction of greenhouse-gases emissions (GG emissions). According to the Kyoto Protocol, the EU has been committed to reducing GG emissions by 8% below “base year” 1990 emission levels. Moreover, the European Union plans an energy policy that includes a unilateral 20% reduction in GG emissions from their 1990 emission levels by 2020 [2].
• Driving EU economical competitiveness: Both objectives mentioned above should be achieved without any reductions in the European economical competitiveness.
8.1.2 Action Plan: Tools
A genuine Internal Electricity Market (IEM) is essential as a basic tool in keeping the European competitiveness undiminished. The starting principle of the “Third Package of measures” of the European Parliament on liberalisation and competition in the Internal Energy Market is the total confidence of the EU in the market mechanisms and in the liberalisation process. Furthermore, the modification of the Generation mix, the consequent reinforcement of the transmission network and the substitution of aged units is needed in order to achieve an adequate power energy balance concerning the requirements for a drastic reduction of CO2 emissions.
According to estimations of IEA, electricity demand is going to be doubled worldwide and tripled in developing countries by 2030 [3]. Therefore, a financial effort without precedent has to be made.
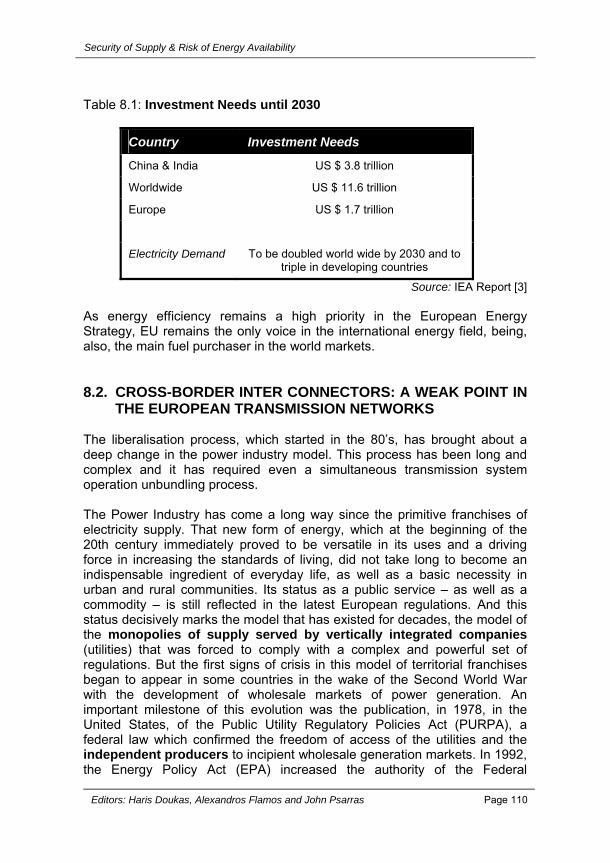
Security of Supply & Risk of Energy Availability
Editors: Haris Doukas, Alexandros Flamos and John Psarras Page 110
Table 8.1: Investment Needs until 2030
Country Investment Needs
China & India US $ 3.8 trillion
Worldwide US $ 11.6 trillion
Europe US $ 1.7 trillion
Electricity Demand To be doubled world wide by 2030 and to triple in developing countries
Source: IEA Report [3] As energy efficiency remains a high priority in the European Energy Strategy, EU remains the only voice in the international energy field, being, also, the main fuel purchaser in the world markets.
8.2. CROSS-BORDER INTER CONNECTORS: A WEAK POINT IN THE EUROPEAN TRANSMISSION NETWORKS
The liberalisation process, which started in the 80’s, has brought about a deep change in the power industry model. This process has been long and complex and it has required even a simultaneous transmission system operation unbundling process. The Power Industry has come a long way since the primitive franchises of electricity supply. That new form of energy, which at the beginning of the 20th century immediately proved to be versatile in its uses and a driving force in increasing the standards of living, did not take long to become an indispensable ingredient of everyday life, as well as a basic necessity in urban and rural communities. Its status as a public service – as well as a commodity – is still reflected in the latest European regulations. And this status decisively marks the model that has existed for decades, the model of the monopolies of supply served by vertically integrated companies (utilities) that was forced to comply with a complex and powerful set of regulations. But the first signs of crisis in this model of territorial franchises began to appear in some countries in the wake of the Second World War with the development of wholesale markets of power generation. An important milestone of this evolution was the publication, in 1978, in the United States, of the Public Utility Regulatory Policies Act (PURPA), a federal law which confirmed the freedom of access of the utilities and the independent producers to incipient wholesale generation markets. In 1992, the Energy Policy Act (EPA) increased the authority of the Federal

Chapter 8: Cross Border Interconnections: A Driving Force In Security Supply And Markets Development
A. L. de Sebastian Page 111
Regulatory Commission (FERC) in order to make easier the transmission of electricity in wholesale transactions, something that resulted in beginning the end of an era and defining a new regulatory environment. In parallel, the European Union’s initiatives in this field have gradually tended towards the implementation, within its territorial sphere, of a genuine internal electricity market which responds to the fundamental objective of the Treaty of Rome in 1957: the establishment of a common free trade zone and the removal of barriers which hinder the free movement of goods within the European Community. But it was not until 1990, with the publication of Directive 90/547/CEE [4] relating to the transit of electricity through the major European electricity networks, and, above all, until 1996, with Directive 96/92/CE [5] concerning common rules for the Internal Electricity Market, that the electricity liberalisation process started in Europe. The Directive concerning transmission through the major networks (Directive 90/547/CEE) was the first rule to deal with the use of the transmission networks by entities which do not own these networks, thereby confirming the principle of the right of any agent to sign transmission contracts under non-discriminatory conditions for all the parties concerned. Considering now the Directive of common rules for the Internal Electricity Market (Directive 96/92/CE), which was published on 19th December 1996, it made these principle deeper and defined the objective of establishing an Internal Electricity Market, designed as a space without borders in which free electricity movement is guaranteed. But the appearance, at the end of the 80´s of a new technology, the combined cycle power plants (burning natural gas), was a decisive factor in the end of the former industrial model. That new generation technology provides higher energy efficiency, it is cleaner and friendlier with the environment and it offers lower investment recovery periods than conventional thermal power plants. Furthermore, a new modality of generating companies, existing yet, the “independent power producers”, was considered, in that time, as the most appropriate agents to bring the new technology in the market. As a result, the need for opening a door (as much direct as possible) to those agents and to that new technology in final electricity markets was the main driving force in opening transmission networks that, in future, could be used by whatever agent, whichever the ownership of the transmission network. So, the concept – basic in the liberalisation process and established in the European Directive 90/547/CEE – is the use of the Transmission Network as a common carrier, operated in a non discriminatory way. In this sense, the Market Opening Principle is the main aim of the EU Directives on IEM and it reflects the right of whatever consumer to be supplied by whatever supplier
Security of Supply & Risk of Energy Availability
Editors: Haris Doukas, Alexandros Flamos and John Psarras Page 112
through free-trading agreements. It implies the end of the territorial franchises or monopolies of exclusive supply. This end that was brought by the market opening, led to the end of a paradigmatic principle: the generation-demand balance in every power system (in general, national systems and in many cases, owned by the State) that was substituted by a new supply model (and by a new paradigm, the creation of an Internal Electricity Market in the whole EU territory) based on cross-border transactions. This implied the end of the main aim of the former national Planning Studies on expansion of the generation mix, carried out periodically in order to keep the above balance. The self-sufficient National Power Systems (“almost” self sufficient in some complementary neighbouring systems and not self-sufficient at all in some of them) imply predominant internal power flows in every national system. The resulting transmission network pattern, in most of the countries, was a messed domestic network in order to serve the above mentioned flows. National transmission systems are linked to the neighbouring systems by means of inter-connectors with a predominant role – even though it is essential, it does not require, generally, large transmission capacities – to provide security and mutual support in the operation of neighbouring systems. The new power flow pattern that the incipient Internal Electricity Market is bringing about, with increasing cross-border transactions, is putting in evidence the weakness of the cross-border inter-connectors. Its role is nowadays, not only to provide security and mutual support to neighbouring system but also to provide “physical” support to the new European market, that shall operate all over Europe in the future. The function of the current European networks has been modified but their original design has not been modified. The consequence is the frequent appearance of permanent bottle-necks in many cross-border inter-connectors as a result of scarcity of transmission capacity. These situations are leading to frequent congestions that are hampering the European market performance. 8.3. SCARCITY MANAGEMENT AND REINFORCEMENT OF THE
NETWORK There are two ways to face the important problem of congestions in transmission networks: managing, in the most rational way possible, the scarcity of transmission capacities or reinforcing the transmission network in congested areas in order to remove bottle-necks and to transform, gradually, the current network in a genuine European network.

Chapter 8: Cross Border Interconnections: A Driving Force In Security Supply And Markets Development
A. L. de Sebastian Page 113
Congestion management – together with the European Transmission Tariffs issue – was regulated in the Regulation (EC) 1228/2003 on network access requirements for cross-border trading [6]. Former procedures – allocated capability on a “first-come/first-served” basis, curtailment of the available capacity – were replaced by methods or procedures to allocate the available transmission capacity, based on market mechanisms that take into account the economical interest of the different trading transaction candidates. The allocation mechanisms that were proposed and accepted by the European Commission are [6]: • Explicit or implicit auctions that take into account the electricity price in
the “down-flow” market. • The Market Splitting (favourite of the EC) was applied successfully in
the Scandinavian Market, managed by Nordpool. • The Flow-based Market Coupling is not far from the Market Splitting
principles, but it takes into account the available transmission capacities in several interconnected system in order to achieve a more efficient use of these capacities.
The Trans European Network Program (The TEN Program) [7], in the framework of the reinforcement of the transmission network, is the tool used by the EC in order to define priorities in the projects proposed by the Member States. Priorities are given to projects that prevent severe and permanent congestions and hamper the international electricity trading. The Energy TEN Program reflects the three main objectives of the European energy policy: sustainability, competitiveness and security of supply. The list of projects included in the TEN Program is updated periodically and published by the European Commission. 8.4. TRANSMISSION NETWORK ADEQUACY: SECURITY OF
SUPPLY AND MARKET DEVELOPMENT It is an evidence that the permanent improving of the European Transmission Network, under the principles and objectives just described, has a decisive influence on the performance of the whole power system and, in particular, on the security of supply and on the power market efficiency and its developing capacities. Talking about the security of supply, ensuring a high quality of power supply in the short term – guarantee and reliability in real-time – is highly dependent on the system operation adequacy, the co-ordination among TSOs (or ISOs) and the existence of a consistent common body of Rules

Security of Supply & Risk of Energy Availability
Editors: Haris Doukas, Alexandros Flamos and John Psarras Page 114
and Procedures on System Operation and its level in compulsory application. On the other hand, the long-term security of supply is strongly dependent on an appropriate environment for ensuring required transmission investments, taking into account that Transmission is a regulated activity (natural monopoly). However, several decisive requirements should be underlined, such as the existence of a stable and predictable regulatory body, a fair and efficient regulated payment system that includes investment recovery, a clear allocation of responsibilities and competencies in the transmission network expansion planning as well as the resulting investments, a friendly financial climate and, finally, a clear policy that promotes reduction of barriers (including social barriers) to building new transmission facilities. Regarding, now, the transmission network, it can be considered as the physical element that links offers and demands, making possible the commercial transactions of electricity. In other words it is the market’s physical support. So, in order to achieve a genuine Internal Electricity Market, a clear and strong support in the transit from national networks to a genuine European Transmission System is strongly required. In addition, the integration of RES in the network introduces another aspect of the issue. The Environmental Package of measures, published by the European Parliament in January 2008, includes, as a main objective, that in 2020, the 20% of the energy consumption in the European Union shall come from Renewable Energy Sources (RES) [2]. Most of that energy will be used as electricity, generated mainly by the wind power (aeolian parks), which is the most important RES. As a result, an important effort shall be carried out in order to reinforce the transmission network, making possible the integration of these technologies in the high-voltage grid. Without the above network reinforcement the final use of the wind power would be drastically reduced. Furthermore, considering the aeolian parks, one of the most controversial aspects of the wind power is its low energy availability and capacity reliability. Consequently, important investments are required in order to provide back-up generation capacity. At this respect, the increase of cross-border transmission capacity becomes an important aspect. New requirements of support from neighbouring power systems can take place to face this new situation, complementing each other their respective RES power plants unavailability, reducing that way the investments in back-up capacity in both sides of the border.
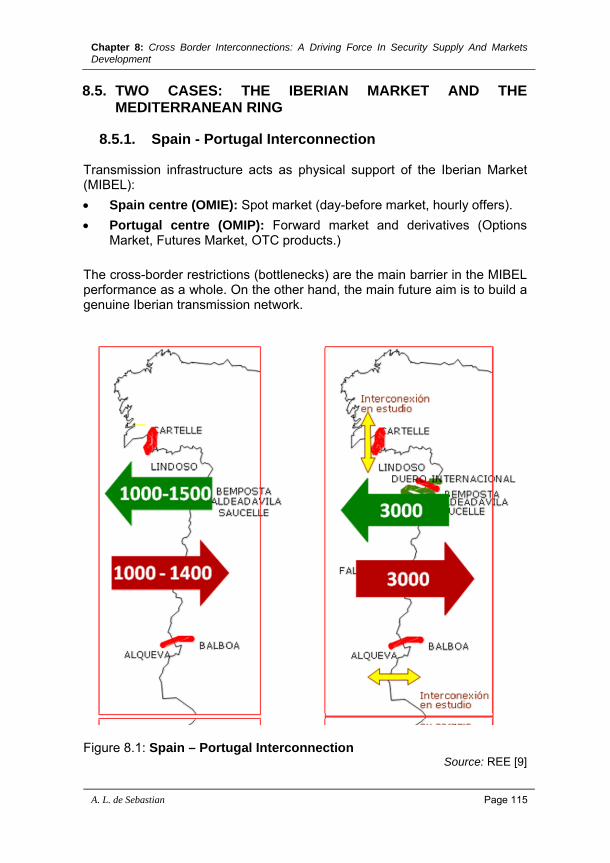
Chapter 8: Cross Border Interconnections: A Driving Force In Security Supply And Markets Development
A. L. de Sebastian Page 115
8.5. TWO CASES: THE IBERIAN MARKET AND THE MEDITERRANEAN RING
8.5.1. Spain - Portugal Interconnection
Transmission infrastructure acts as physical support of the Iberian Market (MIBEL): • Spain centre (OMIE): Spot market (day-before market, hourly offers). • Portugal centre (OMIP): Forward market and derivatives (Options
Market, Futures Market, OTC products.) The cross-border restrictions (bottlenecks) are the main barrier in the MIBEL performance as a whole. On the other hand, the main future aim is to build a genuine Iberian transmission network.
Figure 8.1: Spain – Portugal Interconnection
Source: REE [9]

Security of Supply & Risk of Energy Availability
Editors: Haris Doukas, Alexandros Flamos and John Psarras Page 116
The Maximum Peak Demand for the two countries is: Spain 43378 MW Portugal 8804 MW The current objective on Maximum Transmission Capacity is 3000 MW and is expected to be achieved at short term.
8.5.2. Mediterranean Electricity Projects Since the end of the Cold War, at the beginning of the 90’s, several initiatives have taken place in Europe, because new potential markets in South-Eastern and Central-Eastern European countries, lead to the “electric synchronous area” expansion from the Union for the Co-ordination of Transmission of Electricity (UCTE) towards the East and the South East. In that framework, several projects on “electric rings” are proposed, such as the Baltic Ring – in order to reduce the new Baltic Republics energy dependency from Russia, the Black Sea Ring and the Mediterranean Ring (MEDRING). The Mediterranean Ring UNIPEDE-UCTE creates a Working Group (WG SYTINT) in order to make possible a consistent approach, from a technical and economical point of view, to the MEDRING. In 1991, several organisations in both sides of the Mediterranean Basin (EURELECTRIC-UCTE/COMELEC, AUPTDE, UPDEA) create MEDELEC [8]. The Working Group WG SYSMED is created in order to study, in a consistent and realistic way, technical and economical issues linked to the MEDRING: inter-connectors, economic benefits and main specific problems such as disturbances spreading, networks weakness, and others. The Spain-Morocco Interconnection is the first electricity interconnection between Europe and Africa, developed by REE (Red Eléctrica de España), as the Spanish developer, and OME, as the Morocco partner. Its length covers 25 km (undersea) and it consists of two circuits of 400 kV, created in 1997 and 2006 respectively.

Chapter 8: Cross Border Interconnections: A Driving Force In Security Supply And Markets Development
A. L. de Sebastian Page 117
8.6. MEDRING
Figure 8.2: MEDRING Region Through the MEDRING project, an enlarged new power market that provides new space for a Euro-Mediterranean co-operation and a new economical and institutional link between the North and the South is created. In that framework, there is a need for an institution able to promote Complementarily and Mutual Trust and Confidence between Europe and North Africa by supporting the power supply in Africa, providing technical support and advising about market development issues. As a result, this can contribute to more balanced and fair natural gas transactions. Moreover, political stability could be obtained by the reinforcement of economical links in different areas. The MEDRING project creates new challenges for North Africa and Middle East countries in many aspects, including: Power Industry organisation, Regulatory Framework, Commercial and Institutional Guarantees, Market Transactions, Technical development, Human resources (system operation, maintenance and construction).
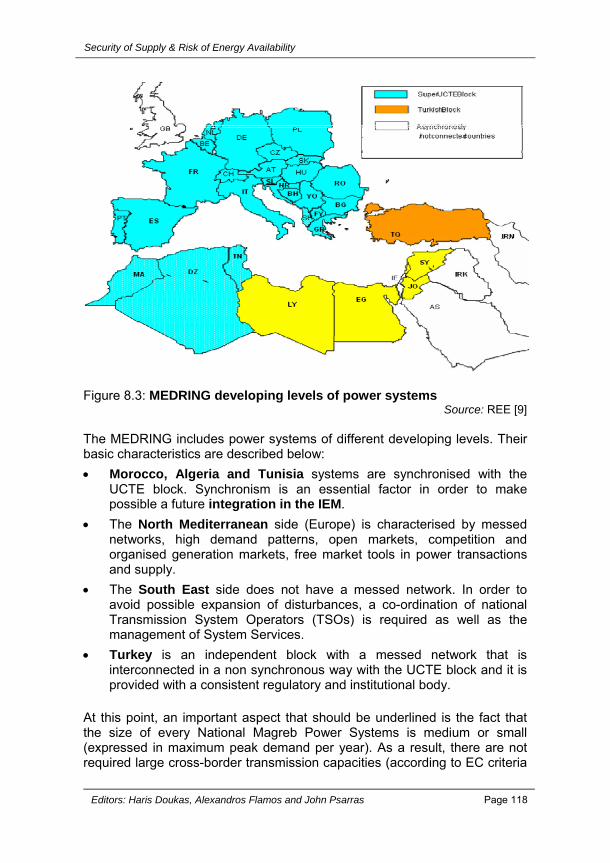
Security of Supply & Risk of Energy Availability
Editors: Haris Doukas, Alexandros Flamos and John Psarras Page 118
Figure 8.3: MEDRING developing levels of power systems
Source: REE [9] The MEDRING includes power systems of different developing levels. Their basic characteristics are described below: • Morocco, Algeria and Tunisia systems are synchronised with the
UCTE block. Synchronism is an essential factor in order to make possible a future integration in the IEM.
• The North Mediterranean side (Europe) is characterised by messed networks, high demand patterns, open markets, competition and organised generation markets, free market tools in power transactions and supply.
• The South East side does not have a messed network. In order to avoid possible expansion of disturbances, a co-ordination of national Transmission System Operators (TSOs) is required as well as the management of System Services.
• Turkey is an independent block with a messed network that is interconnected in a non synchronous way with the UCTE block and it is provided with a consistent regulatory and institutional body.
At this point, an important aspect that should be underlined is the fact that the size of every National Magreb Power Systems is medium or small (expressed in maximum peak demand per year). As a result, there are not required large cross-border transmission capacities (according to EC criteria
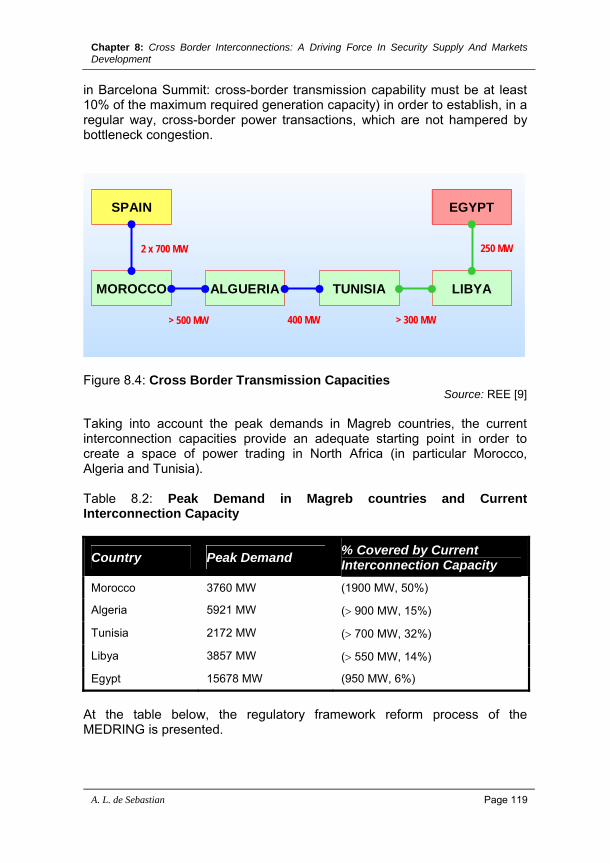
Chapter 8: Cross Border Interconnections: A Driving Force In Security Supply And Markets Development
A. L. de Sebastian Page 119
in Barcelona Summit: cross-border transmission capability must be at least 10% of the maximum required generation capacity) in order to establish, in a regular way, cross-border power transactions, which are not hampered by bottleneck congestion.
MOROCCO ALGUERIA TUNISIA LIBYA
SPAIN EGYPT
2 x 700 MW 250 MW
> 500 MW 400 MW > 300 MW
Figure 8.4: Cross Border Transmission Capacities
Source: REE [9]
Taking into account the peak demands in Magreb countries, the current interconnection capacities provide an adequate starting point in order to create a space of power trading in North Africa (in particular Morocco, Algeria and Tunisia). Table 8.2: Peak Demand in Magreb countries and Current Interconnection Capacity
Country Peak Demand % Covered by Current Interconnection Capacity
Morocco 3760 MW (1900 MW, 50%)
Algeria 5921 MW (> 900 MW, 15%)
Tunisia 2172 MW (> 700 MW, 32%)
Libya 3857 MW (> 550 MW, 14%)
Egypt 15678 MW (950 MW, 6%)
At the table below, the regulatory framework reform process of the MEDRING is presented.
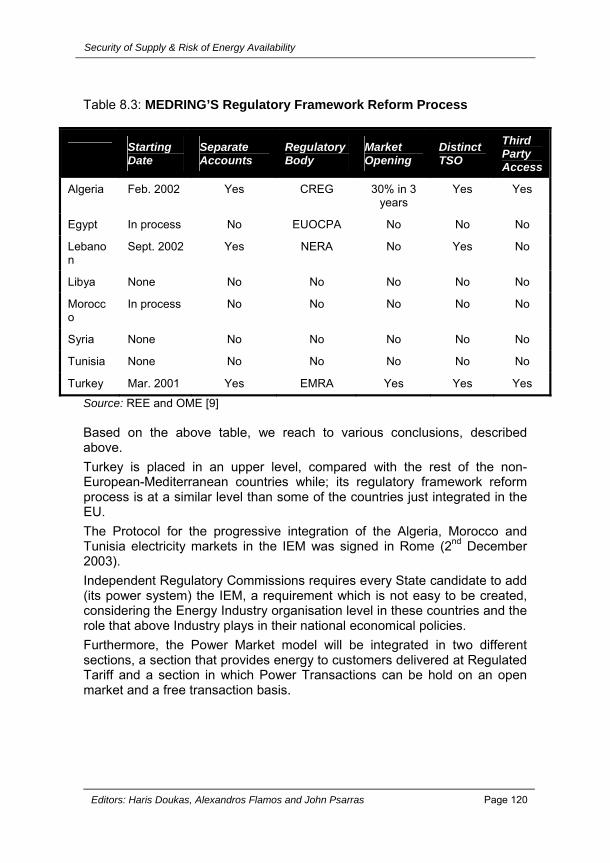
Security of Supply & Risk of Energy Availability
Editors: Haris Doukas, Alexandros Flamos and John Psarras Page 120
Table 8.3: MEDRING’S Regulatory Framework Reform Process
Starting Date
Separate Accounts
Regulatory Body
Market Opening
Distinct TSO
Third Party Access
Algeria Feb. 2002 Yes CREG 30% in 3 years
Yes Yes
Egypt In process No EUOCPA No No No
Lebanon
Sept. 2002 Yes NERA No Yes No
Libya None No No No No No
Morocco
In process No No No No No
Syria None No No No No No
Tunisia None No No No No No
Turkey Mar. 2001 Yes EMRA Yes Yes Yes
Source: REE and OME [9] Based on the above table, we reach to various conclusions, described above. Turkey is placed in an upper level, compared with the rest of the non-European-Mediterranean countries while; its regulatory framework reform process is at a similar level than some of the countries just integrated in the EU. The Protocol for the progressive integration of the Algeria, Morocco and Tunisia electricity markets in the IEM was signed in Rome (2nd December 2003). Independent Regulatory Commissions requires every State candidate to add (its power system) the IEM, a requirement which is not easy to be created, considering the Energy Industry organisation level in these countries and the role that above Industry plays in their national economical policies. Furthermore, the Power Market model will be integrated in two different sections, a section that provides energy to customers delivered at Regulated Tariff and a section in which Power Transactions can be hold on an open market and a free transaction basis.

Chapter 8: Cross Border Interconnections: A Driving Force In Security Supply And Markets Development
A. L. de Sebastian Page 121
REFERENCES [1] European Commission, http://europa.eu/scadplus/leg/en/s14006.htm [2] European Commission, 20 20 by 2020 - Europe's climate change opportunity, Document 52008DC0030, 23 January 2008 [3] IEA, http://www.iea.org [4] Directive 90/547/CEE du Conseil, relative au transit d'électricité sur les grands réseaux, “Législation communautaire en vigueur”, Document 390L0547, 29 octobre 1990 [5] Directive 96/92/CE du parlement européen et du conseil, concernant des règles communes pour le marché intérieur de l'électricité, Document 31996L0092, 19 décembre 1996 [6] Regulation (EC) No 1228/2003 of the European Parliament and of the Council on conditions for access to the network for cross-border exchanges in electricity, Document 32003R1228, 26 June 2003 [7] European Commission, Trans-European Energy Networks (“TEN - E”), http://ec.europa.eu/ten/energy [8] MEDELEC, http://www.medelec.org [9] REE - Red Eléctrica de España, 2006, http://www.ree.es/ingles/home.asp