
Security Measures and Metrics Pete Lindstrom Research Director Spire Security.
49
Security Measures and Metrics Pete Lindstrom Research Director Spire Security
-
Upload
betty-fisher -
Category
Documents
-
view
225 -
download
5
Transcript of Security Measures and Metrics Pete Lindstrom Research Director Spire Security.

Security Measures and Metrics
Pete Lindstrom
Research Director
Spire Security
Agenda
Elements of metrics
Interlude: Four disciplines
Back to metrics
ROI/ROSI
Status of security
Difficult to define “good security”
Minimal difference between security and “lucky”
We don’t know how to measure success.
One incident doesn’t necessarily mean “failure”

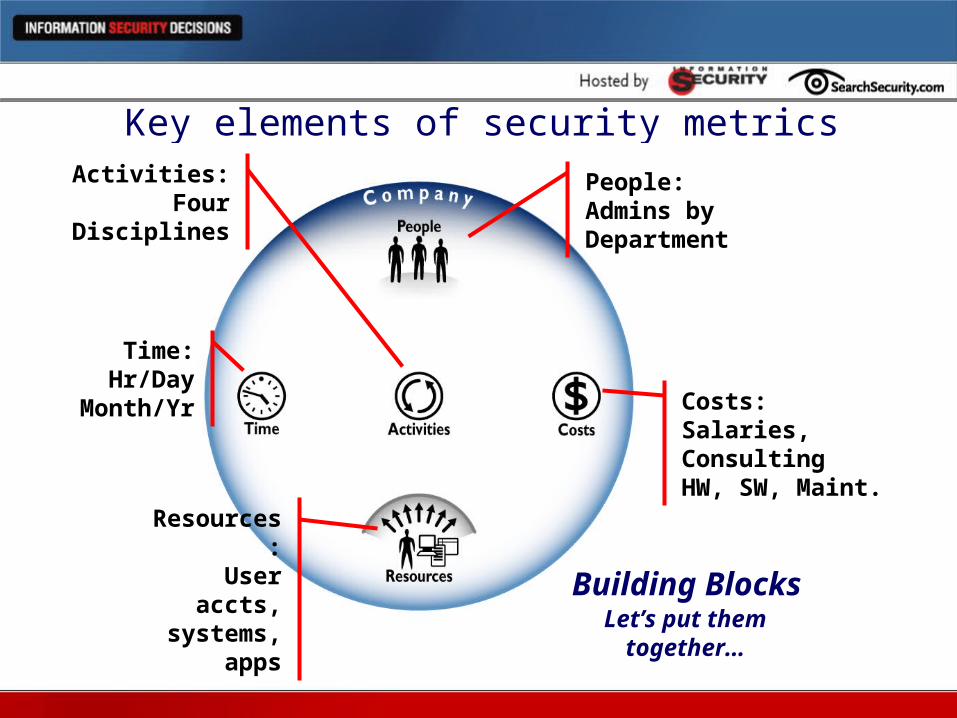
Key elements of security metrics
Key elements of security metrics
Building BlocksLet’s put them
together…
People:Admins by Department
Costs:Salaries, ConsultingHW, SW, Maint.
Activities:Four Disciplines
Time:Hr/Day
Month/Yr
Resources:User accts,
systems, apps
Agenda
Elements of metrics
Interlude: Four disciplines
Back to metrics
ROI/ROSI

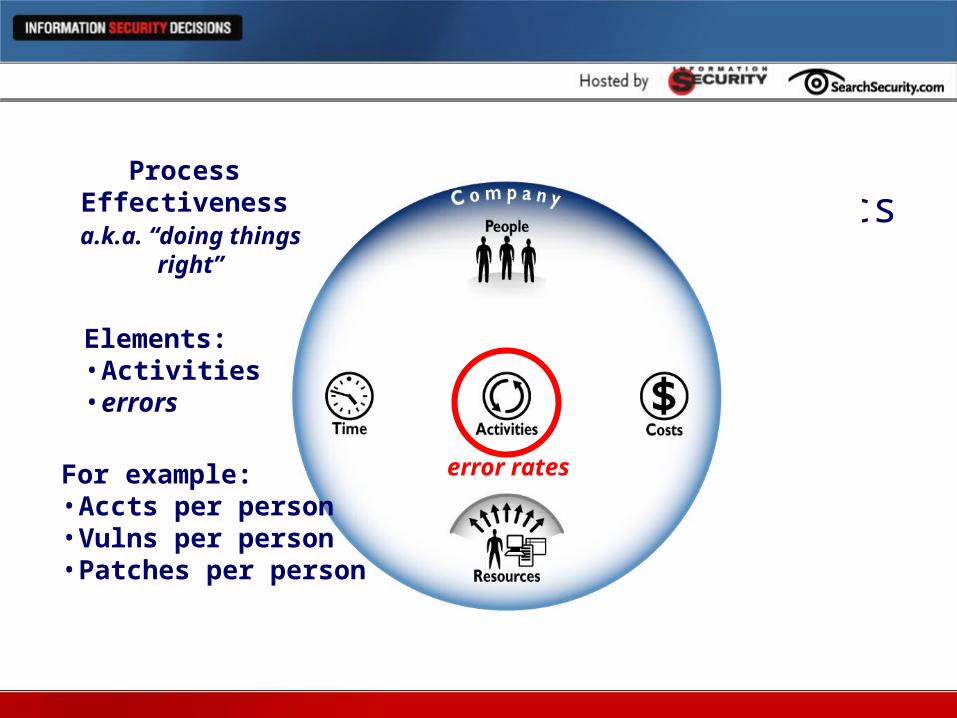
Process Effectiveness MetricsProcess
Effectivenessa.k.a. “doing things
right”
Elements:• Activities• errors
For example:• Accts per person• Vulns per person• Patches per person
error rates

ThreatMANAGEMENT
TrustMANAGEMENT
IdentityMANAGEMENT
VulnerabilityMANAGEMENT
Security reference model
1. Harden the Infrastructure
2. Control sources (users/others)
3. Harden the Process/data
4. Monitor/detectinappropriate and/or
malicious activity

ThreatMANAGEMENT
TrustMANAGEMENT
VulnerabilityMANAGEMENT
IdentityMANAGEMENT
Identity ValidationAccount ManagementPassword Management
Policy ManagementSecurity Arch. DesignTicket Management
Vulnerability AssessmentsPatch ManagementSoftware Security
Four disciplines of security management
Threat IdentificationSecurity MonitoringIncident Management
INLINEINLINE
Intrusion Prevention
AuthenticationUser Access
Control
EncryptionIntegrity
System Access Control
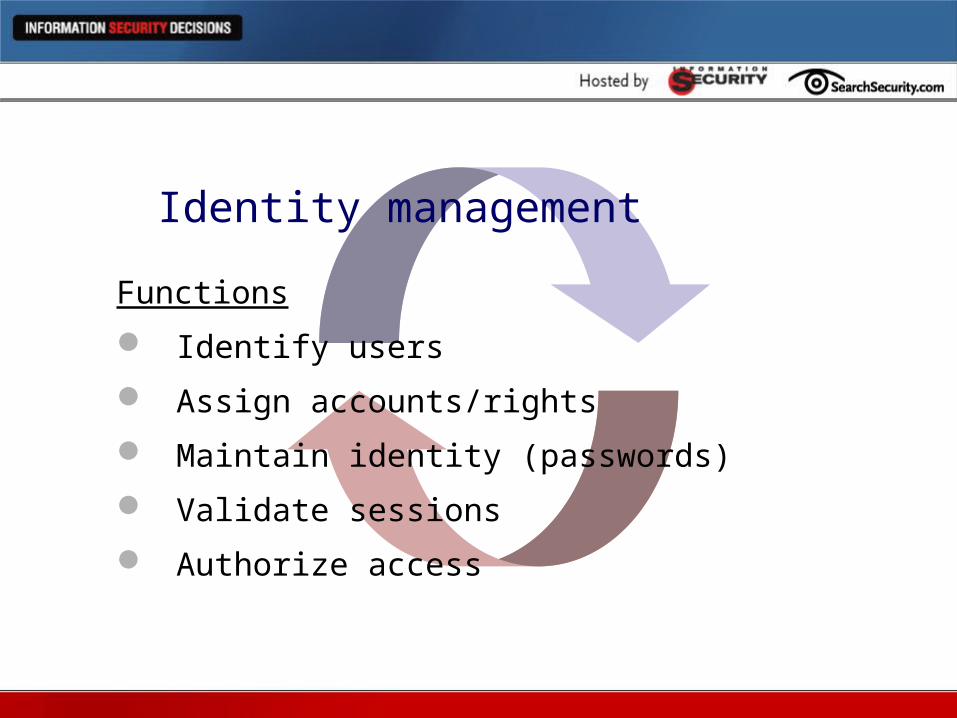
Identity management
Functions
Identify users
Assign accounts/rights
Maintain identity (passwords)
Validate sessions
Authorize access
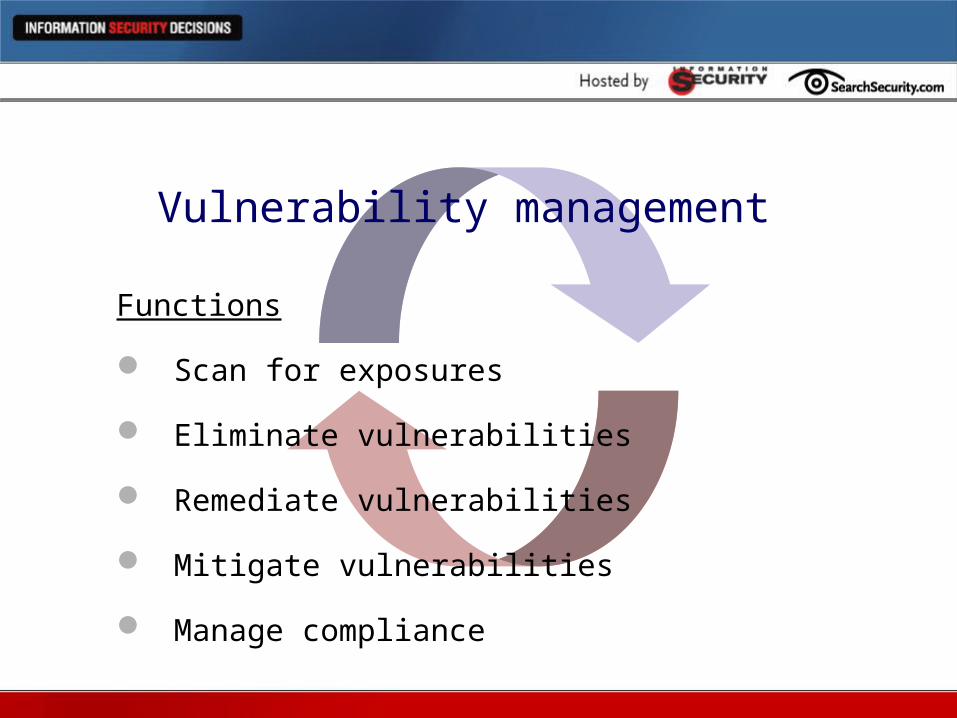
Vulnerability management
Functions
Scan for exposures
Eliminate vulnerabilities
Remediate vulnerabilities
Mitigate vulnerabilities
Manage compliance

Trust management
Functions
Write policies
Design security
Ensure confidentiality
Ensure integrity

Threat management
Functions
Analyze traffic
Analyze logs
Manage incidents
Conduct forensics
Agenda
Elements of metrics
Interlude: Four disciplines
Back to metrics
ROI/ROSI
Process Effectiveness MetricsProcess
Effectivenessa.k.a. “doing things
right”
Elements:• Activities• errors
For example:• Accts per person• Vulns per person• Patches per person
error rates

Process effectiveness
Error rates
Identity management• Request errors
Vulnerability management• Vulnerabilities remaining
Threat management• Incident response
Trust management• Policy violations

Staff Productivity MetricsStaff
productivitya.k.a. “people doing
things” better
Elements:• People• Activities
For example:• Accts per person• Vulns per person• Patches per person

Staff productivityProductivity and workload for all manual activities
(activities/people) Identity management• Requests per administrator• Account disablements per admin• Password resets per admin
Vulnerability management• Vulnerabilities resolved per administrator
Threat management• Incidents per person
Trust management• Policy changes per person

Cycle Time MetricsCycle Time
a.k.a. avg “time to perform activity x”
Elements:• Time• Activities
For example:• Accts per month• Vulns fixed per month• Patches per month

Process efficiency (cycle time)
Time/activities
Identity management• Request time
Vulnerability management• Remediation time
Threat management• Incident response time
Trust management• Policy creation time

Efficiency MetricsAdmins by
Department
2000 Hours per FTE
Efficiencya.k.a. “people doing
things” quicker
Elements:• People• Activities• Time
For example:• Accts/person/hr• Vulns/person/hr• Patches/person/hr

Cost Effectiveness MetricsAdmins by Department
Salaries, Consulting Fees
Costeffectiveness
a.k.a. “people doing things” cheaper
Elements:• People• Activities• Costs
For example:• Cost per acct• Cost per vuln fixed• Cost per patch

Cost effectivenessDollars/activities; dollars/resources; dollars/demographics Identity management• Cost per request• Cost per password reset
Vulnerability management• Cost per vulnerability• Cost per system setting
Threat management• Cost per incident
Trust management• Cost per policy• Cost per project
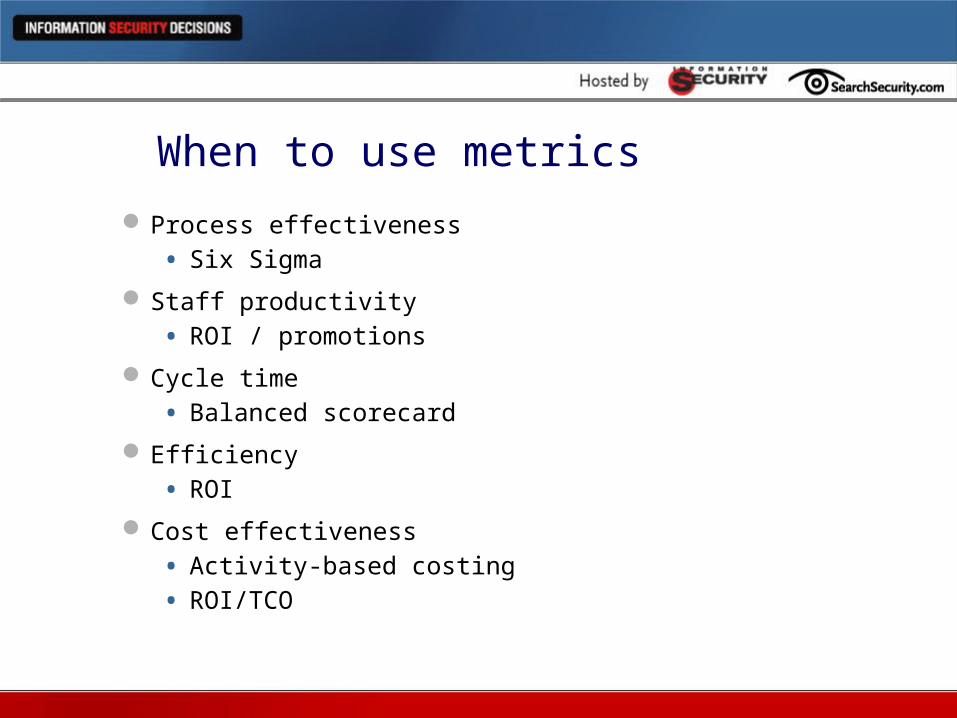
When to use metrics
Process effectiveness• Six Sigma
Staff productivity• ROI / promotions
Cycle time• Balanced scorecard
Efficiency• ROI
Cost effectiveness• Activity-based costing• ROI/TCO

Business uses of security
Benchmarking (Balanced scorecard)
Baselining (Six Sigma)
Activity-based costing/Mgt
ROI
Risk management (ROSI)

Missing Element: RISK! Risk Managementa.k.a. “people doing
things” more securely!
Elements:• Activities• Resources
Four Disciplines:• Identity Mgt• Vuln Mgt• Trust Mgt• Threat Mgt
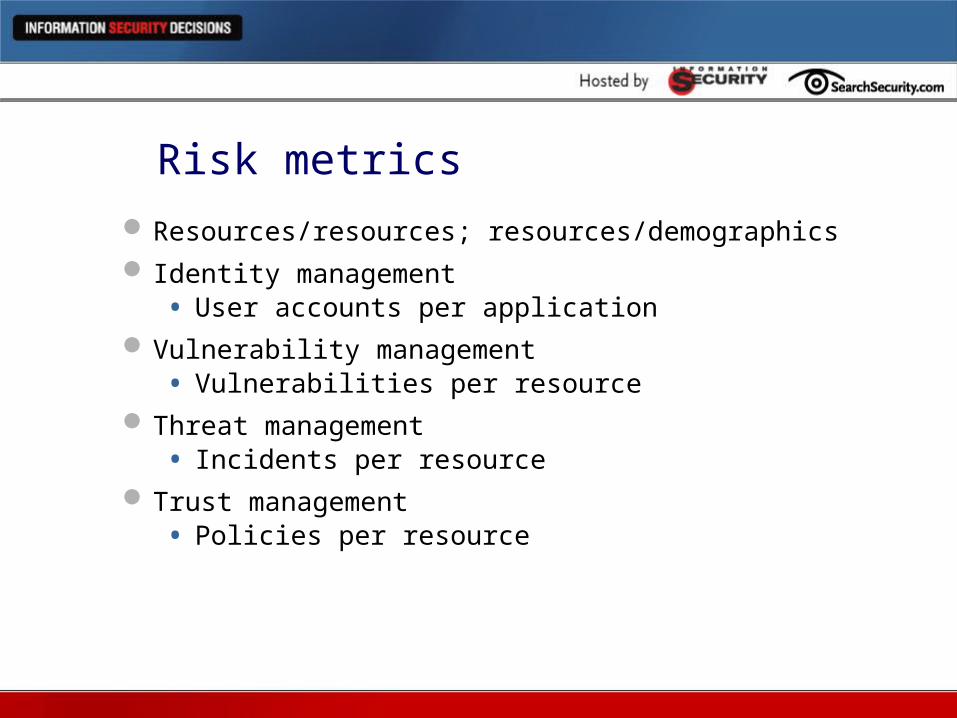
Risk metricsResources/resources; resources/demographics Identity management• User accounts per application
Vulnerability management• Vulnerabilities per resource
Threat management• Incidents per resource
Trust management• Policies per resource

Risk effectiveness
Activities/activities (automated)
Identity management
• Failed logins/total logins
Vulnerability management
• Access denied/total access
Threat management
• Incidents/events
Trust management
Agenda
Elements of metrics
Interlude: Four disciplines
Back to metrics
ROI/ROSI

Examples:Return on Investment (ROI) & Return on Security Investment (ROSI)
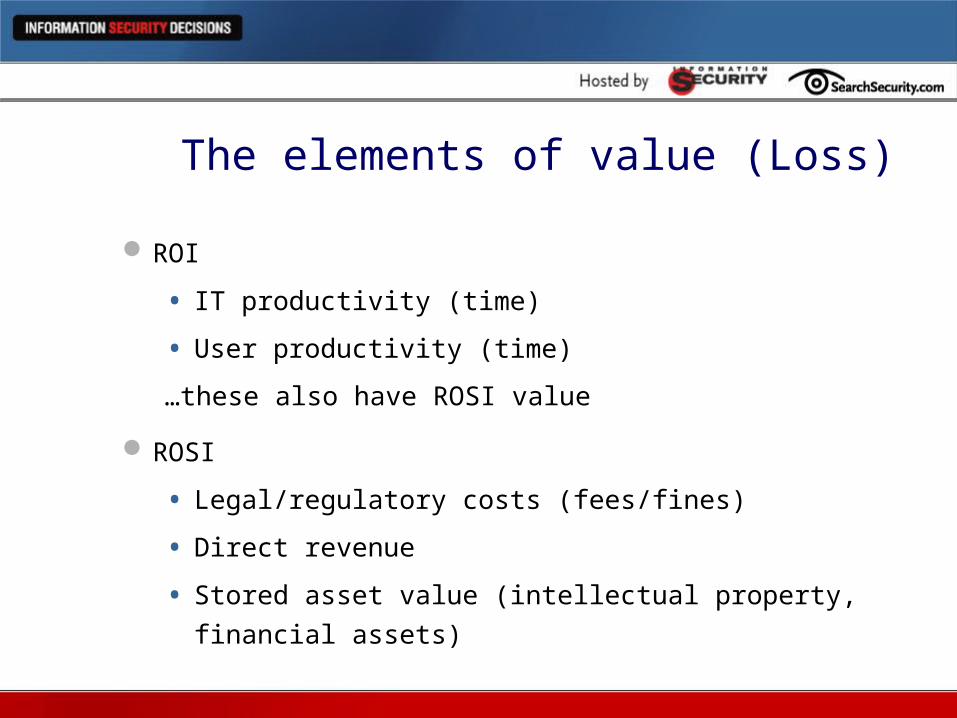
The elements of value (Loss)
ROI
• IT productivity (time)
• User productivity (time)
…these also have ROSI value
ROSI
• Legal/regulatory costs (fees/fines)
• Direct revenue
• Stored asset value (intellectual property, financial
assets)
Let’s talk ROI
Keyword is efficiency
Reduced Capital Expenditures (CapEx)• Lower h/w, s/w costs
Scalability, manageability, performance
Reduced Operating Expenditures (OpEx)• Lower IT, end-user costs
(higher productivity)
Productivity
Where users and IT spend their time.
Time-is-money philosophy.
Often the only aspect of loss we quantify.
Basic source of ROI.
Hourly rate x hours of effort.
In order to determine the value of activities, you first have to determine what activities are performed.

Identity management ROI
Provisioning• New employee productivity• Automated account management
Password management• Reduced help desk time• Employee productivity
Web access control• Developer efficiency (build vs. buy)

Trust management ROI
Public Key Infrastructure
• Managing certificates
Virtual Private Networks
• Leased lines
SSL Acceleration
• Hardware efficiency

Vulnerability management ROI
Firewalls
• Reduce ACL management
Vulnerability assess/remediate
• Reduce manual efforts
Patch management
• Automate patching
Software quality
• Reduce bug fixes

Threat management ROI
Antivirus• Recovery of systems
Network IDS• Reduce manual detection/forensics
Host IDS• Manual log efforts
Security Event Management• Aggregation/prioritization of work

Getting to ROI
Identify amount of labor allocated to
individual security activities.
Identify solution and its corresponding
activities.
Identify labor difference with and without
solution.
The roots of ROSI
Our overall objective is to reduce risk.We are relatively “new” to spending on
solutions.We often didn’t really do anything that was
considered a recurring expense (I am guessing a bit here).
But, the Internet has changed all that (or at least made it apparent).

Return on Security Investment
Keyword: Effectiveness
Effectiveness = Reduced risk
Protecting Value and Loss
• Legal/regulatory costs (fees/fines)
• Direct revenue
• Stored asset value (intellectual property,
financial assets)

Legal/regulatory costs
Lawsuits:
• Privacy suits
• Downstream liability
• Legal fees
Regulatory issues:
• Regulatory fines
• Remediation costs
Direct revenue
E-Commerce systems
Level of materiality
Seasons, cycles, forecasts drive expected
losses
Some benchmarks: shrinkage; materiality
(internal controls)

Stored asset value
Stored Value (financial assets)
Stored Knowledge (intellectual property)
Market Cap (or equivalent) – Book Value = Goodwill (intangible assets)
Some % of this Goodwill is attributable to information assets.• Professional services – higher percentage• Contract manufacturing or retail - lower

Determining loss
No physical goods
Ubiquitous supply
Full asset value is not necessarily lost
Look at loss in other ways:
• Type of loss
• For each application/system

Types of losses
How much value would be lost under the following conditions (for each app/dataset)?
Information-centric loss• Modified data (Integrity)• Copied data (Confidentiality)• Deleted data (Availability)
System/App-centric loss• Resource availability (Productivity)• Resource misuse (Liability)
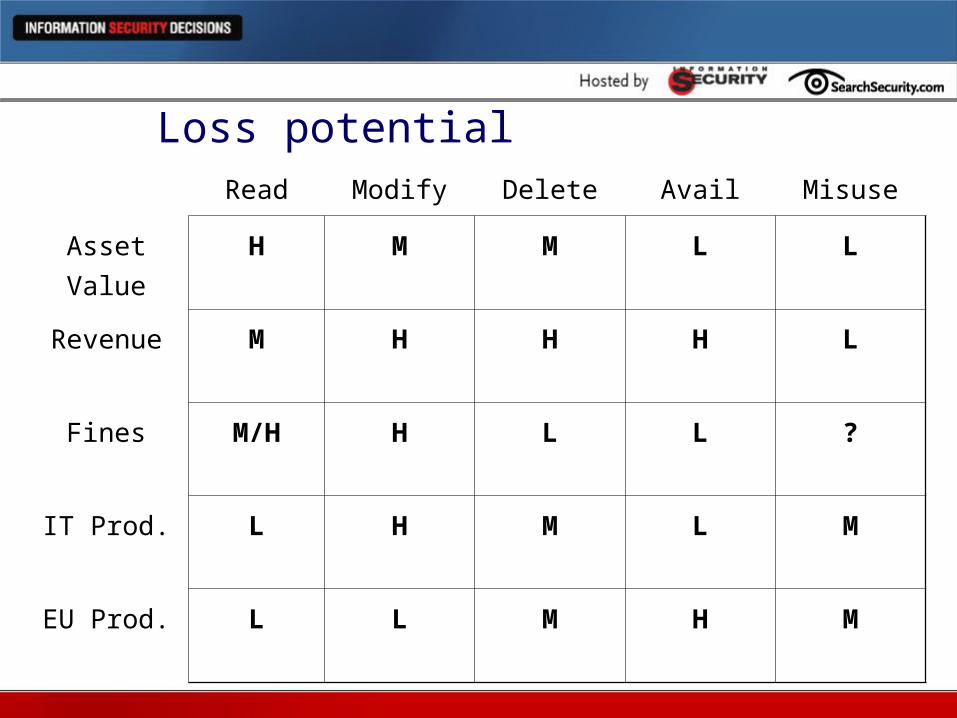
Loss potentialRead Modify Delete Avail Misuse
Asset
Value
H M M L L
Revenue M H H H L
Fines M/H H L L ?
IT Prod. L H M L M
EU Prod. L L M H M

Calculating potential loss
Annual Loss Expectancy = Probability x ValueALE = P x A
(Insurance Industry)
Level One: Calculate overall loss potential in 5 categories.• ALE = P x L(Assets, Revenue, Fines, IT Prod, EU Prod)
Level Two: Take above and factor in types of losses.• ALE = P x (C(A,R,F,I,E); I(A,R,F,I,E); A(A,R,F,I,E))
Level Three: Perform above for all applications/data.• ALE = P x App1(C(A,R,F,I,E); I(A,R,F,I,E); A(A,R,F,I,E))…
Appn(C(A,R,F,I,E); I(A,R,F,I,E); A(A,R,F,I,E))

Getting to ROSI
Determines cost effectiveness of proposed
solution.
Calculate losses with and without solution.
Compare the difference.