Secured Lending and Borrowers Riskiness · PDF fileSecured Lending and Borrowers’...
31
Secured Lending and Borrowers’ Riskiness by Alberto Franco Pozzolo* Abstract This paper investigates the relationship between secured lending and borrowers’ riskiness. First it builds a theoretical model showing that banks may find optimal to cover higher credit risk by requiring a guarantee and simultaneously charging higher interest rates. Second, it finds empirical support to the predictions of the model, that banks normally require guarantees on loans that appear to be riskier, because they are larger or because they are granted to borrowers of smaller size, less capitalized, and with multiple banking relationships. It also provides evidence that a bank loan is more likely to be secured when the borrower owns assets that can be posted as collateral. Third, it shows that interest rates on secured loans are higher than on unsecured loans, confirming that guarantees are not sufficient to completely offset their higher riskiness. Finally, it finds no evidence that the higher riskiness of firms operating in the new economy sectors makes it more likely that they obtain bank credit only on a secured basis. JEL-classification: G21, G32 Keywords: Bank loans, collateral, guarantee * Banca d’Italia, Research Department. I would like to thank Ugo Albertazzi, Allen Berger, Dario Focarelli, Andrea Generale, Giorgio Gobbi, Leonardo Gambacorta, Luigi Leva, Paolo Mistrulli, Fabio Panetta, Carmine Panzella, Bruno Parigi, Loriana Pellizzon, Salvatore Rossi, Gregory Udell and seminar participants at the Banca d’Italia, at the University of Padua and at the XIV Australasian Finance and Banking Conference for their comments and suggestions, Cinzia Chini and Stefania De Mitri for helping me through the data-bases. All remaining errors are my own responsibility. Opinions expressed do not necessarily reflect the views of the Banca d’Italia. Address for correspondence: Banca d’Italia, Servizio Studi, Via Nazionale 91, 00184, Rome, Italy. Tel.: +39-06-47922787 Fax: +39-06- 47923723 E-Mail: [email protected].
Transcript of Secured Lending and Borrowers Riskiness · PDF fileSecured Lending and Borrowers’...
Secured Lending and Borrowers’ Riskiness
by
Alberto Franco Pozzolo*
Abstract
This paper investigates the relationship between secured lending and borrowers’ riskiness.First it builds a theoretical model showing that banks may find optimal to cover highercredit risk by requiring a guarantee and simultaneously charging higher interest rates.Second, it finds empirical support to the predictions of the model, that banks normallyrequire guarantees on loans that appear to be riskier, because they are larger or because theyare granted to borrowers of smaller size, less capitalized, and with multiple bankingrelationships. It also provides evidence that a bank loan is more likely to be secured whenthe borrower owns assets that can be posted as collateral. Third, it shows that interest rateson secured loans are higher than on unsecured loans, confirming that guarantees are notsufficient to completely offset their higher riskiness. Finally, it finds no evidence that thehigher riskiness of firms operating in the new economy sectors makes it more likely thatthey obtain bank credit only on a secured basis.
JEL-classification: G21, G32Keywords: Bank loans, collateral, guarantee
* Banca d’Italia, Research Department. I would like to thank Ugo Albertazzi, Allen Berger,Dario Focarelli, Andrea Generale, Giorgio Gobbi, Leonardo Gambacorta, Luigi Leva, PaoloMistrulli, Fabio Panetta, Carmine Panzella, Bruno Parigi, Loriana Pellizzon, SalvatoreRossi, Gregory Udell and seminar participants at the Banca d’Italia, at the University ofPadua and at the XIV Australasian Finance and Banking Conference for their commentsand suggestions, Cinzia Chini and Stefania De Mitri for helping me through the data-bases.All remaining errors are my own responsibility. Opinions expressed do not necessarilyreflect the views of the Banca d’Italia. Address for correspondence: Banca d’Italia, ServizioStudi, Via Nazionale 91, 00184, Rome, Italy. Tel.: +39-06-47922787 Fax: +39-06-47923723 E-Mail: [email protected].
2
1 Introduction
A large number of bank loans are backed by real or personal guarantees.1 Berger and Udell
(1990) report that in the United States nearly 70 per cent of all commercial and industrial
loans are made on a secured basis. Harhoff and Körting (1998) and Binks, Ennew and Reed
(1988) report similar or even larger ratios for Germany and the United Kingdom,
respectively.
The consequences of guarantee requirements for the availability of bank financing
have been studied in a large number of papers, both theoretical and empirical. Information
asymmetries in bank relationships can alter significantly the allocation of credit with
respect to what would be socially optimal (i.e., that all projects with a positive net present
value − NPV − will be financed; see, e.g., de Meza and Webb, 1987). Backing loans by
guarantees may help to alleviate these distortions, by reducing the problems of moral hazard
and those of adverse selection among the pool of borrowers. The guarantee transforms
borrowers’ incentives, alters the risk for the bank and eventually modifies the equilibrium
credit allocation. Smith and Warner (1979), for example, argue that “the issuance of
secured debt lowers the total cost of borrowing by controlling the incentive for stockholders
to take projects that reduce the value of the firm”; Stulz and Johnson (1985) show that in
some cases the recourse to secured debt may permit to finance positive NPV projects that
otherwise would not be financed.
However, the requirement of a guarantee on a bank loan can also introduce new
inefficiencies in credit allocation. For example, banks might devote fewer resources in
screening and monitoring projects financed with secured loans, as the guarantee itself helps
1 In the banking literature loans backed by a guarantee are normally defined as collateralized.The guarantee itself is generically defined as the collateral. In the following a further distinction ismade between personal guarantees (i.e., contractual obligations of third parties to make payments incase of default of the borrower, such as a surentyship) and real guarantees (i.e., physical assets orequities that the lender can sell to obtain the payments in case of default of the borrower), to whichthe use of the word collateral is here restricted.
3
reducing the credit risk (see, e.g., Manove, Padilla and Pagano, 2000). If banks are more
qualified than the average investor to evaluate projects, credit allocation may be less
efficient when there is a larger fraction of loans that are made on a secured basis. Moreover,
if banks find it less expensive to require guarantees than to monitor projects, it is possible
that investors that cannot provide them will not be financed, even if the NPV of their
investment is positive. A further distortion might be introduced if some banks, watching at
collateral requirements made by other institutions, free ride on their auditing activity. As
Rajan and Winton (1995) have shown, this may lead to too few monitoring with respect to
what is optimal.
The consequences of the widespread use of guarantees on bank loans can be
particularly relevant for new and small businesses, which are more dependent on bank
financing and have relatively fewer resources to post as collateral (see, e.g., Berger and
Udell, 2000). Firms with a larger share of immaterial assets and with higher risk of default,
such as those operating in the new economy sectors, might be required to post a collateral
on their bank loans more frequently than other borrowers. In fact, small and new firms are
more likely to be required to pledge some guarantee on bank loans, also because they are
typically more informationally opaque than larger enterprises and they are not subject to
shareholders’ monitoring.
One of the most interesting issues in the analysis of secured bank lending is whether
guarantees are required to safer borrowers or riskier borrowers. Many different answers
have been given to this question, by considering the predictions of theoretical models, the
conventional wisdom among bankers, the results of econometric analyses.
The predictions of the theoretical literature on this issue strongly depend on the
informational framework that is adopted.2 Following the seminal contribution of Stiglitz
and Weiss (1981), a large class of models has been developed assuming that banks cannot
observe borrowers’ characteristics, so that the average interest rate on loans is higher than
the rate that would be optimal to require to safe borrowers, if they could be identified. This
4
creates an adverse selection problem, because only riskier borrowers apply for bank loans.
In the original model the equilibrium entails some degree of credit rationing. However, a
possible alternative is to allow loan applicants to post a guarantee, so that safer borrowers
can credibly signal their characteristics, and banks can screen potential borrowers by their
degree of riskiness, and offer better credit conditions to the safer ones. In this framework,
secured loans are always those made to the safer borrowers, as shown by Bester (1985 and
1987), Chan and Kanatas (1985) and Besanko and Thakor (1987).
Theoretical models where secured loans are made to riskier borrowers, although less
common, have also been proposed in the literature. Boot, Thakor and Udell (1991) work on
the hypothesis that bank financing creates a moral hazard problem: with limited liability
borrowers have an incentive to choose projects with negative NPV, but higher returns if
good states of the world realize. Thus, if banks can observe the borrowers’ characteristics,
they have an incentive to require guarantees to riskier borrowers, those with a stronger
incentive to take on riskier projects.3 Bester (1994) shows that when the lender cannot
credibly commit to impose bankruptcy to a borrower that cheats on the outcome of the
project and decides not to repay his debt, the collateral can be used to make the strategic
default less attractive. Because in equilibrium the incentives to strategically default are
negatively correlated with project riskiness, secured loans will be those made to riskier
borrowers. Coco (1999) obtains a similar result under the assumption that borrowers are
heterogeneous with respect to their degree of risk aversion, and that the more risk averse are
also less willing to post a collateral on their debt. John, Lynch and Puri (2000) consider
instead the role of agency problems between managers and claimholders, showing that if
collateralized assets are the least risky assets, managers have an incentive to consume more
out of them if they are secured than if they are not. As a result, the equilibrium yield of
2 For recent surveys of the theoretical literature on the role of collateral in banking see Coco(2000).3 On the other hand, Boot, Thakor and Udell (1991) also show that if banks cannot observeborrowers characteristics, agents may post a collateral in order to credibly commit to a virtuousbehavior. If, as it is likely, safer borrowers have a stronger incentive to use such a signaling strategy,secured loans will be made to safer borrowers.
5
collateralized debt is higher than that of uncollateralized debt. Finally, de Meza and
Southey (1996) show that when the population is composed of a number of overoptimistic
borrowers, projects posting high collateral are more likely to default.
The heterogeneity of results of the theoretical literature on the risk characteristics of
secured bank loans is not shared by the conventional wisdom among bankers, as shown by
Morsman (1986). Consistent with this, the majority of empirical studies finds that banks
typically require a guarantee on loans to riskier borrowers. Berger and Udell (1990) present
the most stringent test of the hypothesis that banks require guarantees when financing
riskier projects. Using data from the FED survey on Terms of Bank Lending, they show that
the interest rates on secured loans are on average higher than those on unsecured loans.4
This result has two major implications: that secured loans are typically made to borrowers
that banks consider ex-ante riskier, and that the presence of guarantees is insufficient to
offset the higher credit risk. Berger and Udell (1995) confirm this result using data on lines
of credit from the same source.5 Finally, John, Lynch and Puri (2000), considering a sample
of over 1,000 fixed rate straight debt public issues made between 1993 and 1995, find that
yield on collateralized debt is higher than on general debt, even after controlling for credit
ratings.
Other authors have checked directly whether secured loans have characteristics that
plausibly signal them as riskier. A large number of variables related to riskiness have been
considered. The neatest result in this literature is that loans with longer duration have a
higher probability of being secured, as found by Boot, Thakor and Udell (1991) and
Harhoff and Körting (1998). With respect to the size of loans and borrowers, the results are
less clear-cut. Harhoff and Körting (1998) and Elsas and Kranen (2000) find a higher
incidence of securitization on larger loans, but Boot, Thakor and Udell (1991) find a lower
4 This hypothesis is consistent with the results of the model proposed by Barro (1976), whoshows that if the value of the collateral on bank loans is stochastic and borrowers strategically defaultwhen its realization is lower than the sum of the value of the loan and its service, the equilibriuminterest rate on secured loans is higher than that on unsecured loans.5 Harhoff and Körting (1998), at the opposite, using data from a survey of small and medium-size German firms find that the interest rates on secured loans are lower than those on secured loans.
6
incidence. Beger and Udell (1995) find a positive relationship between the size of the
borrowing firms, measured by their total assets, and the probability that their lines of credit
will be secured; Harhoff and Körting (1998), proxying size with the firm’s workforce, also
find a positive relationship with the presence of guarantees. However, at the opposite, Elsas
and Kranen (2000) find a negative relationship between collateralization and the borrowers’
total sales.6 Harhoff and Körting (1998) also find that the share of collateralized loans
decreases with the number of banking relationships, possibly because multi-banking wipes
out the incentives to monitor borrowers’ behavior or to require a collateral to firms in
financial distress, as suggested by Rajan and Winton (1995). Finally, Berger and Udell
(1995) and Harhoff and Körting (1998) show that loans to borrowers with longer lending
relationships, that they argue to be less risky, are less likely to be secured,7 but Elsas and
Kranen (2000), using data from a survey of German banks, find instead that housebanks
have a higher probability of having loans backed by a guarantee.8
This paper contributes both to the theoretical and to the empirical literature on
secured bank lending. Section 2 presents a simple model showing why banks may prefer to
secure the loans made to riskier borrowers. In particular, it shows that if the projects
financed by banks can differ with respect to their probability of success, banks will use the
guarantees and the level of interest rates as complements: riskier borrowers will be charged
higher interest rates and required to post a guarantee on their bank loans. The following two
sections present the results of an empirical analysis of secured bank lending. Using high
quality data on individual long-term bank loans, it is shown that banks normally require
guarantees on loans to those borrowers that can plausibly be identified as riskier, and that
6 These differences might be due to the fact the size of the borrower is related to his overallcreditworthiness, which implies a negative relationship, but reflects also his availability of assets topost as collateral, which implies instead a positive relationship.7 These results are consistent with the predictions of Boot and Thakor (1994), who show thatan optimal contract implies that credit conditions become more favorable late in the relationship, afterthe borrower has shown at earlier stages to be able to fulfill his obligations.8 Elsas and Khranen (2000) justify their result with the argument made by Welch (1997) andLonghofer and Santos (2000), who show that it is optimal for bank debt to be more senior whenlending relationships are stronger.
7
they also charge them with higher interest rates. Section 5 focuses on some results specific
to firms of the new economy. The final section concludes.
2 A Simple Theoretical Model
Although the theoretical literature has provided a number of reasons why banks require
guarantees to riskier borrowers, none of them is so transparent as it seems to be implied by
the strength of bankers’ conventional wisdom.
In the model presented in this section, two major assumptions drive the results. The
first is that the value of the guarantees is not identical for banks and entrepreneurs,
consistent with the hypothesis that borrowers have some specific skills that make their
assets more valuable to them than to others (see, e.g., Hart, 1995).9 The existence of such a
difference in the valuation of guarantees implies that the schedules describing the trade-off
between having a secured loan and paying a higher interest rate are not identical for
borrowers and lenders. The equilibrium is therefore at the point where the two schedules
intersect. The second major assumption is that borrowers maximize their profits by
choosing the level of effort to put in the project. As it will be shown, the optimal level of
effort is independent of the sum of the value of the interest rates on the loan and the value
of the guarantee. Under these hypotheses, riskier projects are secured, and they are also
charged higher interest rates.
Assume that there is an entrepreneur willing to finance a project of size 1. The
project is risky: with probability P(σ,e) it pays a return X > 1, otherwise it fails and pays
nothing. The probability of success of the project depends on an exogenously given
measure of its riskiness, σ, and on the level of effort that the entrepreneur puts in
developing it, e, with Pe' > 0 and Pσ
' < 0 . The effort of the entrepreneur has a cost that can
be expressed in monetary units as f(e), with f f' , ' ' > 0 . The entrepreneur finances his
9 An alternative justification for this assumption is that banks incur some fixed costs, such aslegal expenses, to have the guarantees fully available for sale.

8
project with a bank loan, at a given gross interest rate R > 1. On the loan it is possible to
post a guarantee of value C ≤ 1, that is lost in case of default. The entrepreneur chooses the
level of effort in order to solve the following maximization problem:
( ) [ ]max ( ) ( , ) ( , ) ( )e
e P e X R P e C f eΠ = − − − −σ σ1 . (1)
The first order condition for the solution of this problem gives a relationship between the
optimal level of effort, the return of the project in case of success, the return to be paid on
the bank loan, and the value of the collateral:
g e f eP e
X R Ce
( , *) ' ( *)( , *)'
σσ
≡ = − + , (2)
where e* is the level of effort that maximizes the profits of the entrepreneur. A sufficient
condition for a maximum is that Pe' ' < 0 . Expression (2) makes it clear that in equilibrium
the level of the interest rate is a positive function of the value of collateral.
The banking sector is assumed to be competitive. Risk neutral banks equalize their
expected return from financing the project to the exogenously given gross return on a risk-
free investment, ρ:
[ ]P e R P e C( , ) ( , )σ σ α ρ+ − =1 , (3)
where )1,0(∈α is the share of the value of collateral that is recovered by the bank when the
entrepreneur defaults.
Solving the system of equations (2) and (3) it is possible to obtain two expressions
for the gross return on the bank loan and the level of collateral as a function of the optimal
level of effort:
[ ] [ ]RP e X g e
P e=
+ − −− +
ρ σ α σσ α α
11
( , *) ( , *)( , *)( )
, (4)
[ ]CP e X g eP e
=− −
− +ρ σ σ
σ α α( , *) ( , *)( , *)( )1
. (5)
9
Assume now that the economy is composed by a fixed number of entrepreneurs, n,
each one with a project of a different level of riskiness, σi (i = 1,…,n). From inspection of
equations (4) and (5) it is clear that as long as ( )P ei i iσ σ σ' *, ( ) < 0 (for all σi; i = 1,…,n),
riskier projects have both higher interest rates and a higher level of collateral.
The intuition for this result is the following. For a given probability of success,
P(σ,e), banks face a trade-off between higher interest rates and lower levels of collateral.
However, when the probability of success decreases, banks cover the higher credit risk both
by augmenting the degree of securitization and charging higher interest rates. These two
instruments for reducing credit risk are used as complements, not as substitutes.10
The empirical implications of this simple model are that, in a cross section of bank
lending relationships (i.e., with different levels of σi), one would find that secured loans are
used to finance riskier projects and are charged higher interest rates. The following sections
tests such predictions.
3 Data and Summary Statistics
The empirical analysis uses information on bank loans to a large sample of Italian non-
financial firms. The data are taken from three sources: the Banks’ Supervisory Reports to
the Bank of Italy (Segnalazioni di Vigilanza), the Central Credit Register (Centrale dei
Rischi) and the Company Account Data Survey (Centrale dei Bilanci).11 The first source is
used for data on banks’ balance sheets. The second contains information on single bank
loans, the interest rates charged and the value of the assets posted as guarantees
10 The model considers only the case of collateral not represented by the borrower’s assets(external collateral) and that therefore causes a net loss to an entrepreneur that defaults. However, itcan be demonstrated that the results carry over also if the collateral is represented by the borrower’sassets (internal collateral), as long as its posting reduces the entrepreneur’s profits, for examplebecause it “restrains the firm from potentially profitable disposition of collateral “(Smith and Warner,1979), and the value of g e( , *)σ is sufficiently low.11 For a detailed description of the Banks’ Supervisory Reports to the Bank of Italy, the CentralCredit Register and the Company Account Data Survey see also Pagano, Panetta and Zingales (1998).
10
(distinguished between real and personal);12 credits are recorded only when they are above a
threshold level of ITL 150 millions (around € 75,000). The third source contains balance
sheet information on a large number of non-financial enterprises. In the following the data
for 1997 from the Central Credit Register have been used.
For real guarantees, the distinction between internal collateral, which is represented
by the debtor’s assets (and ultimately only gives a privilege, in the case of default, to the
lender who owns it with respect to the other debt holders), and external collateral (that
increases the value of the assets that the lenders can repossess in case of default in order to
obtain the payment of his debt) is not available. Personal guarantees can only be external.
Tables 1-4 introduce the summary statistics for data from the sample of bank loans
obtained from the merge of the information from the Central Credit Register and the
Company Account Data Survey. Table 1 presents some basic statistics by type of guarantee.
Secured loans are 17.3 per cent of the total number of loans. For long-term loans secured
with real guarantees this ratio is 15.0 per cent, for short-term loans it is 3.4 per cent; 5.4 per
cent of loans are secured with personal guarantees. The mode of the ratios of the value of
the guarantee to that of the loan is zero in all cases. For collateralized long-term loans the
value is 100 per cent at the 90th percentile, for short-term loans it is 100 at the 99th
percentile, for personal guarantees it is 100 per cent at the 95th percentile. These statistics
show clearly that, when present, guarantees normally cover the full amount of the loan. The
requirement of guarantees that cover only partially the value of the loan, which is largely
suggested by the theoretical literature, seems to be irrelevant from an empirical point of
view.13
Table 2 presents some summary statistics on the ratio of secured to total loans, with a
break down by type of guarantee, size of the lending bank and geographical area of activity
12 In the case of personal guarantees the information on whether they are posted on theborrowers’ short-term or long-term loans is not available.13 In fact, it is to be expected that when collateral does not cover the full value it is eitherbecause the price of assets pledged has reduced since the time when the loan was granted or thatpersonal guarantees have also been posted. In the case of personal guarantees, for which thisinformation is available, it is often found that their value exceeds that of the loan.
11
of the borrower. The ratio of the overall value of guarantees to that of loans is 25.6 per cent:
18.7 per cent for real guarantees (25.9 and 5.1 per cent, respectively, for long-term and
short-term loans) and 6.9 per cent for personal guarantees.14
For all types of guarantees, the share of secured loans shows a high variability across
geographical areas. The value of real guarantees ranges from 14.9 per cent of loans in the
Center to 30.2 in the Islands; that of personal guarantees ranges from 6.2 per cent in the
North-East to 32.4 in the South. This reflects the higher riskiness of borrowers resident in
the Mezzogiorno of Italy. The ratio of secured to total loans varies significantly also with
bank size (measured by bank total assets), ranging from 8.7 per cent for smaller banks to
33.0 per cent for banks in the 4th quintile.
Table 3 presents the breakdown by branch of economic activity of the borrower. The
ratio of the value of real guarantees to that of loans ranges from 4.8 per cent for energy to
55.8 per cent for hotels. Within the manufacturing sector, the maximum value is 35.2 in
metallurgy and transformation of non-metalliferous metals. Ratios above 30 per cent
characterize also agriculture and construction. Industries that have traditionally a good
export performance, such as textiles, electrical machinery and machinery for industry and
agriculture, have lower ratios. Personal guarantees follow a similar pattern across sectors.
The ratios range from 2.2 per cent in energy to 11.9 in construction. Values above 10 per
cent are registered also in metallurgy and transformation of non-metalliferous metals,
electrical machinery and other services.
Table 4 introduces some additional statistics. The first two columns present a
breakdown by size of the borrower, measured by the value of total sales, showing that
smaller firms are more likely to be required to post a collateral. The ratio of the value of
real guarantees to that of loans ranges from 27.8 per cent for borrowers within the 1st
quintile of the distribution by total sales to 15.6 per cent for borrowers in the 5th quintile.
With respect to personal guarantees, the differences among size classes are much smaller,
ranging from 7.6 per cent for the 1st quintile to 6.8 per cent for the 4th. Columns 3 and 4
14 When the value of the guarantee exceeds that of the loan, the latter is used in calculating the

12
show that there is no monotone relation between the length of the lending relationship and
the share of secured loans. Finally, columns 5 and 6 present a breakdown by size of the
borrower’s total credit with the bank, showing that larger loans are more likely to be
secured.
4 The Empirical Results
4.1 The Characteristics of Lenders and Borrowers with Secured
Loans
The first implication of the model presented in section 2 is that banks require guarantees on
loans to riskier borrowers. In order to verify this hypothesis it has been tested what
characteristics of banks and borrowers make it more likely that a loan will be secured. Only
long-term loans are considered in the empirical analysis, due to the low incidence of
securitization in short-term credit.
Three groups of explanatory variables have been considered: those describing the
characteristics of the lending relationship between the bank and the borrower (such as the
size of the loan and its duration), those describing the characteristics of the borrower (such
as its capital structure and its profitability) and those proxying for the capability of banks to
evaluate the riskiness of a project (such as the size of the bank and its degree of sector and
geographic specialization in lending).
In practice, the hypothesis that there exists a correlation between some measures of a
borrower’s riskiness and the presence of guarantees on his bank debt is tested using the
following discrete choice model:
Pr (Yij = g) = f (Xij,Zi,Wj,Ki) g = 1, 2 (6)
numerator of the ratios.
13
where: Yij equals 1 if the loan made by bank i to borrower j is secured with a real guarantee,
2 if it is secured with a personal guarantee and 0 otherwise; Xij is a vector of variables
specific of the bank-borrower relationship; Zi is a vector of characteristics of the lending
bank; Wj is a vector of characteristics of the borrower; and Ki is a vector of dummy
variables for the sector of operation of the borrower and its geographic location. The
adoption of a discrete choice model is justified by the fact that, as it is clear from table 1,
the value of the collateral pledged on each loan is not significant information: with the
exception of few cases, loans are either fully collateralized or not collateralized.
Equation (6) is estimated using a multinomial logit model.15 In order to avoid
simultaneity problems, lagged averages of the balance sheet information of the borrowers
between 1993 and 1996 have been used.16
Columns A and B of table 5 report the results of the estimates of the probability of
long-term loans being secured. The pseudo R2 of the regression is 0.10.17
A first point that emerges from these results is that not al the explanatory variables
have the same effect on the probability of the loan being secured with real or personal
guarantees. This mainly happens because real guarantees are likely to be safer than personal
guarantees, although more onerous to provide, and because they can be internal, while
personal guarantees can only be external. This latter distinction has two major implications.
First, that real guarantees are partly required by lenders only to obtain a privilege with
15 In order to test the robustness of the results with respect to the econometric model adoptedtwo logit regressions with firm specific fixed effects have also been estimated, respectively for realand personal guarantees. The coefficients of the variables describing the loan and bank characteristicsare qualitatively and quantitatively identical to those of the regression reported in table 5.16 Each regression was estimated also excluding information on the level of interest ratescharged on the loan, as these are reported only by a smaller sample of large and medium size banks.The results, unreported, confirm those of the estimates on the smaller sample.17 Columns C and D of table 5 report the results of the estimates on the sample of firms in thefirst quartile of the distribution by total sales, confirming the basic findings of the regression on thewhole sample.

14
respect to the other debt-holders. Second, that the possibility of providing real guarantees is
often linked to the availability of assets to post as a collateral.18
Consistent with the findings of Berger and Udell (1990), the level of the interest rate
has a positive and significant effect on the probability that the loan on which it is charged
will be secured with both real and personal guarantees; this result will be addressed in more
detail in the next section.
A first measure of the borrowers’ riskiness included among the explanatory variables
is the ratio of capital to total assets. The negative coefficients in both regressions for real
and personal guarantees confirm that loans to riskier borrowers are more likely to be
secured. The firm’s performance, measured by its past returns on equity (ROE), also has a
negative effect on the probability that its loans will be secured with personal guarantees,
consistent with previous findings, but it has a positive effect on the probability of its loans
being secured with real guarantees. However, a number of factors can influence the sign of
this relationship. For example, more profitable firms could be in reality riskier, and simply
have happened to survive default. In fact, the previous evidence by Berger and Udell (1995)
and Harhoff and Körting (1998) is also bewildering. Finally, the coefficient of the firms’
leverage is negative and significant in the case of personal guarantees, but it is not
significantly different from zero for real guarantees, possibly because the larger availability
of resources to post as collateral that characterizes less indebted firms counterbalances their
lower riskiness.
The positive coefficient of the logarithm of the value of the bank’s total credit to the
borrower shows that larger loans have a higher probability of being secured with both real
and personal guarantees. These finding, confirming the evidence by Harhoff and Körting
(1998), are consistent with the interpretation that larger expositions entail higher risk.19 A
possible interpretation is that when loans are large, the bargaining power of the borrowers is
18 In terms of the model presented in section 2, this result could be accounted for by allowingfor the cost of posting the collateral to differ across entrepreneurs.19 Boot, Thakor and Udell (1991) find, at the opposite, that larger loans are less likely to besecured. However, their result may depend on the fact that they do not control for the borrowers’ size.
15
harmed, and the banks’ preference for reducing the riskiness of large expositions prevails.
Consistent with the interpretation that collateralization depends in part on the relative
bargaining power of banks and borrowers, the coefficient of a measure of the size of the
borrower, the logarithm of its total sales, is negative and significant for both real and
personal guarantees.20
The results on measures of the strength of the lending relationships are not easy to
interpret, because the final effect often results from the summation of opposing forces. The
dummy for housebank relationships has a positive and significant coefficient in both
regressions for real and personal guarantees, similar to what is found by Elsas and Kranen
(2000), but opposite to Harhoff and Körting (1998).This result is consistent with the
argument of Longhofer and Santos (2000), who show that borrowers have an incentive to
post collateral when lending relationships are stronger, because in this case banks are more
prone to help them in case of financial distress.21 However, when the strength of a lending
relationship is measured instead by its time length, different results obtain distinguishing
between real and personal guarantees, and depending on whether the loan is granted by the
borrower’s main bank or not. If borrowers with stronger lending relationships are
considered safer by banks, as it seems likely to be the case, one would expect that they are
required to post fewer guarantees. Indeed, this result is found for personal guarantees on
loans made by a borrower’s main bank, although not for real guarantees. Consistent with
this result is the finding that older firms have a progressively lower probability of securing
their loans with personal guarantees. At the opposite, loans made by non main banks to
borrowers with longer lending relationships are more likely to be secured, possibly because
20 The coefficient of the logarithm of total assets, an alternative measure of the size of theborrower, is negative in the case of real guarantees, but it is instead positive for personal guarantees.This probably happens because, for given size, it is easier for firms with large total assets to findexternal guarantees.21 Welch (1997) also suggests that because banks are better equipped to contest priority infinancial distress, it is more efficient to give them ex-ante higher seniority. Extending this reasoningone could say that banks with a stronger lending relationship are also in a better position than othersto contest priority.
16
in this case lenders have stronger incentives to rebalance their position relative to that of the
main bank.
The number of lending relationships of the borrower also has a positive and
significant impact on the probability of loans being secured with real guarantees, consistent
with the findings of Harhoff and Körting (1998). In fact, banks have a stronger incentive to
hold internal guarantees when the number of debt holders is larger, as they give them a
privilege in case of default. An additional reason might be that multiple banking
relationships wipe out the incentive for banks to monitor their borrowers, that then turn out
being riskier. In the case of personal guarantees, the coefficient of the number of lending
relationships is also positive, but it is not significantly different from zero, suggesting that
the result for real guarantees is more likely to depend on the desire of lenders to increase
the seniority of their debt than on the need to balance lower monitoring.
The positive coefficients on the shares of physical and liquid assets and the negative
coefficient on the share of immaterial assets show that borrowers with a larger availability
of resources that can be posted as collateral are more likely to secure their loans, despite the
fact that it is plausible to expect them to be less risky. Furthermore, the result that older
firms have a higher probability of having collateralized loans, but only for enterprises that
are more than 60 years old, is also likely to be explained by the fact that they probably have
more assets to post as collateral. These variables have instead an opposite effect on the
probability that loans will be secured with personal guarantees. Firms with a higher share of
liquid assets and a lower share of immaterial assets are less likely to have loans covered
with personal guarantees, most likely because they are considered less risky by banks. The
fact that a potentially fraudulent borrower can more easily divert liquid funds is probably
more than offset by the higher market value of his assets, that are less specific to the firm’s
activity.
Finally, a number of variables describing the characteristics of the credit market and
of the lending banks also affect the probability of loans being secured. Competition in the
loan market is negatively correlated with the probability of loans being secured with real
and personal guarantees, as shown by the positive coefficient of the Herfindhal index in the
province of activity of the borrowing enterprise. This is consistent with the view that the

17
requirement of a guarantee is a burden that banks are more likely to impose when their
market power is higher.
The ratio of the value of the bank’s loans to the branch and the province receiving the
largest share of its total credit and the total value of loans, two measures of bank credit
concentration, have a negative coefficient, although not always significantly different form
zero. Banks that have a more concentrated loan portfolio are typically more likely to have
developed specific skills in evaluating their borrowers, as they know better the functioning
of the economic environment where they operate. Henceforth, they grant credit on the basis
of more precise analyses of the expected performance of the borrower, and are less likely to
require collateral as a general way of covering credit risk.
Smaller banks, with higher unit labor costs and larger branches (measured by of the
logarithm of the average number of workers in each bank’s dependency) are more likely to
have secured loans, most likely because these characteristics signal lower efficiency in
screening loan applications and making a correct evaluation of their riskiness.
4.2 Loan riskiness and guarantees
The second implication of the model presented in section 2 is that riskier projects are not
only backed by guarantees, but they also have higher interest rates. This, in turn, implies a
positive relationship between the level of interest rates and the incidence of securitization.
Following the approach of Berger and Udell (1990), this hypothesis can be tested by
regressing the interest rate charged on each bank loan on two dummies, taking the value of
1 if, respectively, real or personal guarantees are present. If the level of interest rates and
the presence of guarantees are both driven by the riskiness of the project that is financed,
the coefficient of the dummies for secured loans should be positive. In practice, the
following model can be estimated:
iij = f(Sij, Xij, Zi, Wj) (7)
where iij is the interest rate on the loan made by bank i to borrower j; Sij are two dummy
variables taking the value of 1 if the loan is secured, respectively, with real and personal

18
guarantees and 0 otherwise; Xij is a vector of variables describing characteristics of the
lending relationship; Zi is a vector of variables describing characteristics of the lending
bank; Wj is a vector of variables describing characteristics of the borrower.
Column A of table 6 reports the results of the estimation of equation (7) for long-term
loans with fixed effects on banks, but without any other control for characteristics of the
lending relationship or of the borrower. In this way, the effect of loan’s and borrower’s
riskiness on the interest rate should be entirely captured by the coefficients of the dummy
variables for the presence of guarantees. As expected, these coefficients are both positive
and significantly different from zero, confirming the hypothesis that banks consider secured
loans as riskier. Moreover, the coefficient of the dummy variable for the presence of real
guarantees is larger than that for personal guarantees, suggesting that banks consider the
latter as less useful than the former in reducing loan riskiness.
The model in section 2 predicts that in a cross section of bank lending relationships
one should find that secured loans are charged higher interest rates because they are riskier.
Therefore, if one could control perfectly for differences in the degree of riskiness, the
coefficients of the dummy variables for the presence of real and personal guarantees should
be zero. Column B of table 6 presents the results of the estimation of equation (7) with
fixed effects on banks and controlling for characteristics of the lending relationship and of
the borrower. As expected, the coefficient of the dummy variables for the presence of real
guarantees, although still positive and significantly different from zero, is lower than in the
regression without controls. In the case of personal guarantees the coefficient is not
significantly different in the two regressions.
The fact that, even controlling for the characteristics of the lending relationships and
of the borrowers, the coefficients of the dummy variables are still positive and significantly
different from zero is likely to be due to the difficulties in measuring adequately the degree
of riskiness. A confirmation of this interpretation comes from the results of a regression
including fixed effects on both bank and borrowers characteristics. This estimation is made
possible by the fact that a large number of borrowers have more than one bank relationship.
Column C of table 6 shows that in this case the coefficients of the dummy variables for the

19
presence of real and personal guarantees are still positive and statistically different from
zero, but their size is less than one half that of the original regression.
Table 7 reports the results of a regression on a sample of smaller firms (defined as
those below the first quartile in the ranking by total sales) that, as argued by Berger and
Udell (1998 and 2000), are more likely than others to have stronger lending relationships
with banks. The estimated coefficients are qualitatively similar to those obtained from the
whole sample. However, the absolute value of the coefficient of the dummy variables for
secured loans is lower than in the previous regression, in particular that for personal
guarantees. This suggests that banks consider loans to smaller firms secured with personal
guarantees as relatively safer.
5 The specific riskiness of new economy firms
The analysis of the previous sections shows that bank lending to riskier borrowers is
often made on a secured basis. As argued before, the requirement of guarantees on bank
loans may reduce the ability of the banking sector to finance small start-ups, in particular if
they are operating in risky sectors, such as those of the new economy. This aspect should be
of foremost importance in particular in countries like Italy, where the venture capital
industry is not yet developed, and the financial needs of firms operating in the hi-tech
sectors are mainly fulfilled by internal funds and bank credit (Bugamelli et al., 2001).
Many authors have argued that lending to firms producing Information and
Telecommunication Technologies (ICT) is indeed riskier than financing other types of
investment. In fact, new economy start-ups typically have a larger share of intangibles out
of total assets and, more importantly, these assets are very likely to be highly specific to the
firm, and its entrepreneur. In fact, some of the characteristics that make the firms of the new
economy riskier than others are not well measured by the explanatory variables included in
the regressions commented in the previous section. As a result, the estimates of the
probability that loans to new economy firms will be secured could be biased downwards. In
order to account for this problem, equation (6) has been estimated including a dummy
20
variable for telecom service providers, telecom equipment manufacturers, computers and
semiconductors manufacturers and internet related companies.22
The results, reported in table 8, show that the coefficients of a dummy variable that
takes the value of 1 when the borrower is a firm of the new economy and 0 otherwise is not
significantly different from zero, providing evidence that these firms have the same
probability of being granted bank loans on a secured basis as other borrowers with similar
characteristics. The hypothesis that the potential lack of guarantees to back bank loans
might be a problem for the financing of new economy firms in Italy seems therefore not
supported by that data.
These results do not imply the absence of a specific type of risk for this category of
borrowers, that banks may want to account for. In fact, table 9 shows that, in a regression
on the determinants of the interest rates on bank loans, the coefficient of the dummy
variable for new economy firms is positive and significantly different from zero. Indeed,
this is evidence that banks consider these firms as riskier borrowers, even if they do not
make use of real or personal guarantees to cover their higher riskiness.
6 Conclusions
This paper has analyzed the relationship between secured lending and borrowers’ riskiness
by building a simple model and testing its implications. The theoretical model predicts that
banks cover the higher credit risk associated with loans to riskier borrowers by
simultaneously requiring a guarantee and charging higher interest rates. In a cross-section
of borrowers of different riskiness one would therefore find that banks charge higher
interest rates on secured loans than on unsecured loans. This result does not depend on the
existence of information asymmetries between borrowers and lenders, but on two other very
plausible hypotheses. The first is that the value of the guarantee is lower for the bank than
for the entrepreneur that posts it. The second is that entrepreneurs maximize their profits
22 The choice of the sectors has been proposed by Antoniewicz (2001), and is adopted by the

21
with respect to the effort that they put in developing the project that is financed by the bank,
for any given level of the interest rate on the loan and of the collateral.
The empirical analysis shows that the predictions of the model are indeed met by the
data: banks normally require guarantees on loans that can be considered ex-ante as riskier.
In particular, larger loans and those made to borrowers of smaller size, less capitalized, and
with multiple banking relationships have a higher probability of being secured. Another
important set of characteristics that make it more likely that a bank loan will be secured
with real guarantees is the availability for the borrowers of assets that can be posted as
collateral. In fact, these borrowers have a lower cost of using the collateral, and therefore
stronger incentives to substitute it for lower interest rates. Moreover, measures of the ability
of banks to screen loan applications, such as the sector concentration of credit, and of its
efficiency also reduce the incidence of guarantees.
Interest rates on secured loans are on average higher than those on unsecured loans,
confirming that guarantees are indeed required to ex-ante riskier borrowers, and that their
presence is not sufficient to completely offset the higher credit risk of the loan. However,
controlling for borrowers’ riskiness, the relationship between the presence of guarantees
and the interest rate on bank loans is weaker, consistent with the predictions of the
theoretical model.
Finally, no evidence is found that firms operating in the new economy sectors are
more likely to have secured loans than other borrowers with the same characteristics.
BIS Working Group on the Financing of the New Economy.
22
ReferencesAntoniewicz, R. L. (2001), “Financing of ‘New Economy’ Firms in the United States”,
Federal Reserve Board, mimeo.
Barro, R. J. (1976), “The Loan Market, Collateral, and Rate of Interest”, Journal of MoneyCredit and Banking, 8, 839-856.
Berger, A. N. and G. F. Udell (1990), “Collateral, Loan Quality, and Bank Risk”, Journal ofMonetary Economics, 25, 21-42.
Berger, A. N. and G. F. Udell (1995), “Relationship Lending and Lines of Credit in SmallFirms Finance”, Journal of Business, 68, 351-81.
Berger, A. N. and G. F. Udell (1998), “The Economics of Small Business Finance: theRoles of Private Equity and Debt Markets in the Financial Growth Cycle”, Journal ofBanking and Finance, 22, 613-673.
Berger, A. N. and G. F. Udell (2000), “Small Business and Debt Finance”, in Zoltan, J. Aand D. B. Audretsch (eds.), Handbook of Entrepreneurship, forthcoming.
Besanko, D. and A. V. Thakor (1987), “Collateral and Rationing: Sorting Equilibria inMonopolistic and Competitive Credit Markets”, International Economic Review, 28,671-690.
Bester, H. (1985), “Screening vs. Rationing in Credit Markets with Imperfect Information”,American Economic Review, 57, 850-855.
Bester, H. (1987), “The Role of Collateral in Credit Market with Imperfect Information”,European Economic Review, 31, 887-99.
Bester, H. (1994), “The Role of Collaterl in Model of Debt Renegotiation”, Journal ofMoney Credit and Banking, 26, 72-86.
Binks, M., C. Ennew and G. Reed (1988), “Small Business and Banks: A Two NationPerspective”, prepared for the Forum of Private Business, UK and the NationalFederation of independent Business, USA.
Boot, A. W. A. and A. V. Thakor (1994), “Moral Hazard and Secured Lending in anInfinitely Repeated Credit Game”, International Economic Review, 35, 899-920.
Boot, A. W. A., A. V. Thakor and G. F. Udell (1991), “Secured Lending and Default Risk:Equilibrium Analysis, Policy Implications and Empirical Results”, EconomicJournal, 101, 458-72.
Bugamelli. M. , P. Pagano, F. Paternò, A. F. Pozzolo, S. Rossi and F. Schivardi (2001),“Ingredients for the New Economy: How Much Does Finance Matter?”, Bancad’Italia, Temi di Discussione, no. 418.
Chan, Y. and G. Kanatas (1985), “Asymmetric Valuations and the Role of Collateral inLoan agreements”, Journal of Money Credit and Banking, 17, 84-95.
23
Coco, G. (1999), “Collateral, Heterogeneity in Risk Attitude and Credit MarketEquilibrium”, European Economic Review, 43, 559-574.
Coco, G. (2000), “On the Use of Collateral”, Journal of Economic Surveys, 2, 191-214.
de Meza, D. and D. C. Webb (1987), “Too Much Investment: A Problem of AsymmetricInformation”, Quarterly Journal of Economics, 102, 281-92.
de Meza, D. and C. Southey, (1996), “The Borrowers Curse: Optimism, Finance andEntrepreneurship”, Economic Journal, 106, 375-386.
Diamond, D. W. (1084), “Financial Intermediation and Delegated Monitoring”, Review ofEconomic Studies, 51, 393-414.
Elsas, R. and J. P. Krahnen (2000), “Collateral, Default Risk, and Relationship Lending: AnEmpirical Study on Financial Contracting”, CEPR Discussion Paper n. 2540.
Greenbaum, S. I. , G. Kanatas and I. Venezia (1989), “Equilibrium Loan Pricing under theBank-Client Relationship”, Journal of Banking and Finance, 13, 221-235.
Harhoff, D. and T. Körting (1998), “Lending Relationship in Germany − EmpiricalEvidence from Survey Data”, Journal of Banking and Finance, 22, 1317-53.
Hart, O. (1995), Firms, Contracts, and Financial Structure, Oxford, Clarendon Press.
John, K., A. W. Lynch and M. Puri (2000), “Credit Ratings, Collateral and LoanCharacteristics: Implications for Yield”, mimeo, available from www.ssrn.com.
Longhofer, S. D. and J. A. Santos (2000), “The Importance of Bank Seniority forRelationship Lending”, Journal of Financial Intermediation, 9, 57-89.
Manove, M., A. J. Padilla and M. Pagano (2000), “Collateral vs. Project Screening: AModel of Lazy Banks”, CEPR Discussion Paper no. 2439.
Morsman, E. Jr. (1986), “Commercial Loan Structuring”, Journal of Commercial BankLending, 68, 2-20.
Pagano, M., F. Panetta and L. Zingales (1998), “Why Do Companies Go Public? AnEmpirical Analysis”, Journal of Finance, 53, 27-64.
Rajan, R. (1992), “Insiders and Outsiders: The Choice Between Informed and Arm’s-Length Debt”, Journal of Finance, 47, 1367-1400.
Rajan, R. and A. Winton (1995), “Covenants and Collateral as Incentives to Monitor”,Journal of Finance, 50, 1113-46.
Sharpe, S. A. (1990), “Asymmetric Information, Bank Lending, and Implicit Contracts: AStylized model of Customer Relationships”, Journal of Finance, 45, 1069-1087.
Smith, C. W. and J. B. Warner (1979), “On Financial Contracting. An Analysis of BondCovenants”, Journal of Financial Economics, 7, 117-161.
Stiglitz, J. E. and A. Weiss (1981), “Credit Rationing in Markets with ImperfectInformation”, American Economic Review, 71, 393-410.

24
Stulz, R. M. and H. Johnson (1985), “An Analysis of Secured Debt”, Journal of FinancialEconomics, 14, 501-22.
Welch, I. (1997), “Why is Bank Debt Senior? A Theory of Asymmetry and Claim PriorityBased on Influence Costs”, Review of Financial Studies, 10, 1203-1236.
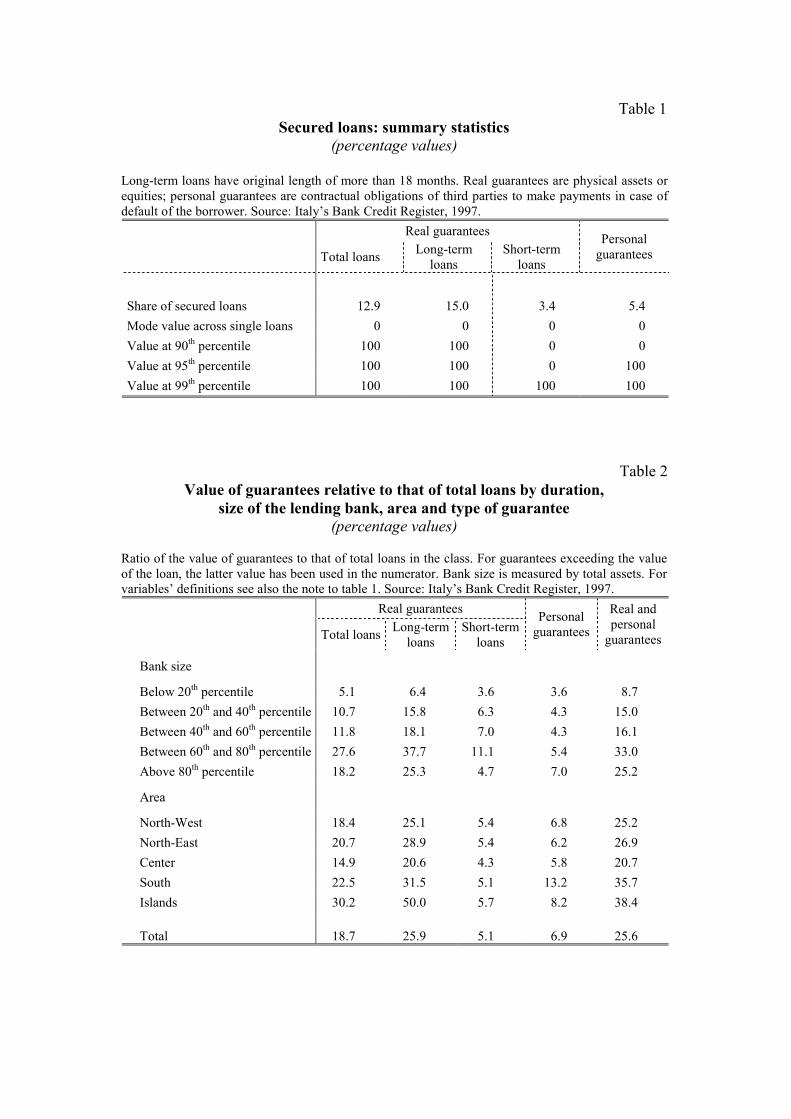
Table 1Secured loans: summary statistics
(percentage values)
Long-term loans have original length of more than 18 months. Real guarantees are physical assets orequities; personal guarantees are contractual obligations of third parties to make payments in case ofdefault of the borrower. Source: Italy’s Bank Credit Register, 1997.
Real guarantees
Total loans Long-termloans
Short-termloans
Personalguarantees
Share of secured loans 12.9 15.0 3.4 5.4Mode value across single loans 0 0 0 0Value at 90th percentile 100 100 0 0Value at 95th percentile 100 100 0 100Value at 99th percentile 100 100 100 100
Table 2Value of guarantees relative to that of total loans by duration,
size of the lending bank, area and type of guarantee(percentage values)
Ratio of the value of guarantees to that of total loans in the class. For guarantees exceeding the valueof the loan, the latter value has been used in the numerator. Bank size is measured by total assets. Forvariables’ definitions see also the note to table 1. Source: Italy’s Bank Credit Register, 1997.
Real guarantees
Total loans Long-termloans
Short-termloans
Personalguarantees
Real andpersonal
guarantees
Bank size
Below 20th percentile 5.1 6.4 3.6 3.6 8.7Between 20th and 40th percentile 10.7 15.8 6.3 4.3 15.0Between 40th and 60th percentile 11.8 18.1 7.0 4.3 16.1Between 60th and 80th percentile 27.6 37.7 11.1 5.4 33.0Above 80th percentile 18.2 25.3 4.7 7.0 25.2
Area
North-West 18.4 25.1 5.4 6.8 25.2North-East 20.7 28.9 5.4 6.2 26.9Center 14.9 20.6 4.3 5.8 20.7South 22.5 31.5 5.1 13.2 35.7Islands 30.2 50.0 5.7 8.2 38.4
Total 18.7 25.9 5.1 6.9 25.6

Table 3Value of guarantees relative to that of total loansby branch of economic activity of the borrower
(percentage values)
Ratio of the value of guarantees to that of total loans in the class. For guarantees exceeding the value of the loan, thelatter value has been used in the numerator. For variables’ definitions see also the note to table 1. Source: Italy’s BankCredit Register, 1997.
Branch of activity Realguarantees
Personalguarantees Branch of activity Real
guaranteesPersonal
guarantees
Agriculture 30.9 9.2 Machinery for industry andagriculture 18.9 7.3
Energy 4.8 2.2 Electrical machinery 17.2 10.4
Food and tobacco products 18.8 5.2 Motor-cars and othertransport equipment 9.5 8.2
Textiles 18.1 6.6 Other manufactures 25.1 3.2Leather and footwear 14.5 6.0 Construction 30.0 11.9Wood and furniture 25.8 6.1 Commerce 12.7 4.6Paper and publishing 29.4 9.5 Hotels 55.8 4.1Chemicals 18.0 6.1 Transports 25.9 8.6Rubber and plastic products 25.5 6.3 Communication 29.9 3.8Metallurgy and transf. of nonmetalliferous minerals 35.2 11.2 Other services 16.9 10.2
Metals 22.3 8.1 Total 18.7 6.9
Table 4Value of guarantees to that of total loans by size of the borrower,
length of the lending relationship and size of the loan(percentage values)
Ratio of the value of guarantees to that of total loans in the class. For guarantees exceeding the value of the loan, thelatter value has been used in the numerator. Firm size is measured by total sales. For variables’ definitions see also thenote to table 1. Source: Italy’s Bank Credit Register, 1997.
Size of borrower Length of lendingrelationship (1)
Size of loanPercentiles
RealGuarantees
Personalguarantees
Realguarantees
Personalguarantees
Realguarantees
Personalguarantees
Below 20th 27.8 7.6 18.1 6.9 6.7 3.8
Between 20th and 40th 22.1 5.5 15.3 5.8 8.2 4.1
Between 40th and 60th 22.0 5.2 21.1 9.0 9.5 4.5
Between 60th and 80th 22.7 6.8 21.6 8.7 14.5 5.2
Above 80th 15.6 6.7 20.9 7.0 20.8 7.5
Total 18.7 6.9 18.7 6.9 18.7 6.6(1) The classes considered for the length of the lending relationship are 1-2, 3-4, 5-6, 7-8 and more than 9 years.
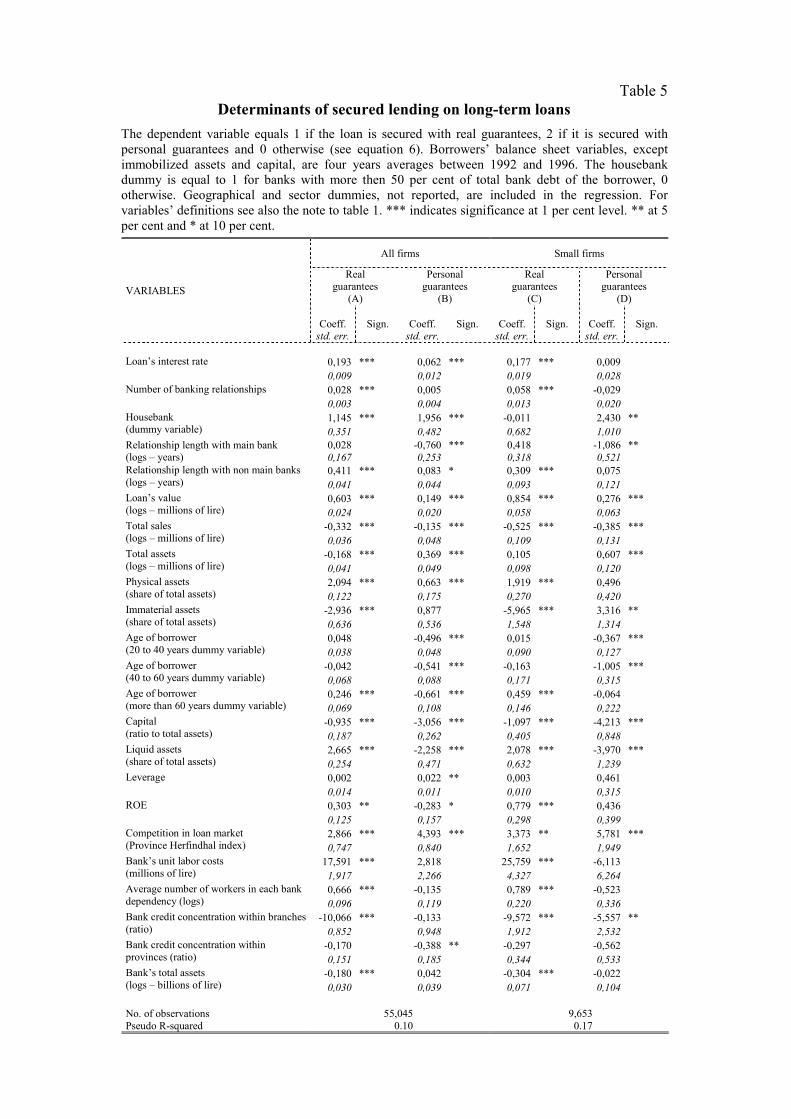
Table 5Determinants of secured lending on long-term loans
The dependent variable equals 1 if the loan is secured with real guarantees, 2 if it is secured withpersonal guarantees and 0 otherwise (see equation 6). Borrowers’ balance sheet variables, exceptimmobilized assets and capital, are four years averages between 1992 and 1996. The housebankdummy is equal to 1 for banks with more then 50 per cent of total bank debt of the borrower, 0otherwise. Geographical and sector dummies, not reported, are included in the regression. Forvariables’ definitions see also the note to table 1. *** indicates significance at 1 per cent level. ** at 5per cent and * at 10 per cent.
All firms Small firms
Realguarantees
Personalguarantees
Realguarantees
Personalguarantees
(A) (B) (C) (D)
Coeff. Sign. Coeff. Sign. Coeff. Sign. Coeff. Sign.
VARIABLES
std. err. std. err. std. err. std. err.
0,193 *** 0,062 *** 0,177 *** 0,009Loan’s interest rate0,009 0,012 0,019 0,0280,028 *** 0,005 0,058 *** -0,029Number of banking relationships0,003 0,004 0,013 0,0201,145 *** 1,956 *** -0,011 2,430 **Housebank
(dummy variable) 0,351 0,482 0,682 1,0100,028 -0,760 *** 0,418 -1,086 **Relationship length with main bank
(logs – years) 0,167 0,253 0,318 0,5210,411 *** 0,083 * 0,309 *** 0,075Relationship length with non main banks
(logs – years) 0,041 0,044 0,093 0,1210,603 *** 0,149 *** 0,854 *** 0,276 ***Loan’s value
(logs – millions of lire) 0,024 0,020 0,058 0,063-0,332 *** -0,135 *** -0,525 *** -0,385 ***Total sales
(logs – millions of lire) 0,036 0,048 0,109 0,131-0,168 *** 0,369 *** 0,105 0,607 ***Total assets
(logs – millions of lire) 0,041 0,049 0,098 0,1202,094 *** 0,663 *** 1,919 *** 0,496Physical assets
(share of total assets) 0,122 0,175 0,270 0,420-2,936 *** 0,877 -5,965 *** 3,316 **Immaterial assets
(share of total assets) 0,636 0,536 1,548 1,3140,048 -0,496 *** 0,015 -0,367 ***Age of borrower
(20 to 40 years dummy variable) 0,038 0,048 0,090 0,127-0,042 -0,541 *** -0,163 -1,005 ***Age of borrower
(40 to 60 years dummy variable) 0,068 0,088 0,171 0,3150,246 *** -0,661 *** 0,459 *** -0,064Age of borrower
(more than 60 years dummy variable) 0,069 0,108 0,146 0,222-0,935 *** -3,056 *** -1,097 *** -4,213 ***Capital
(ratio to total assets) 0,187 0,262 0,405 0,8482,665 *** -2,258 *** 2,078 *** -3,970 ***Liquid assets
(share of total assets) 0,254 0,471 0,632 1,2390,002 0,022 ** 0,003 0,461Leverage0,014 0,011 0,010 0,3150,303 ** -0,283 * 0,779 *** 0,436ROE0,125 0,157 0,298 0,3992,866 *** 4,393 *** 3,373 ** 5,781 ***Competition in loan market
(Province Herfindhal index) 0,747 0,840 1,652 1,94917,591 *** 2,818 25,759 *** -6,113Bank’s unit labor costs
(millions of lire) 1,917 2,266 4,327 6,2640,666 *** -0,135 0,789 *** -0,523Average number of workers in each bank
dependency (logs) 0,096 0,119 0,220 0,336-10,066 *** -0,133 -9,572 *** -5,557 **Bank credit concentration within branches
(ratio) 0,852 0,948 1,912 2,532-0,170 -0,388 ** -0,297 -0,562Bank credit concentration within
provinces (ratio) 0,151 0,185 0,344 0,533-0,180 *** 0,042 -0,304 *** -0,022Bank’s total assets
(logs – billions of lire) 0,030 0,039 0,071 0,104
No. of observations 55,045 9,653Pseudo R-squared 0.10 0.17

Table 6
Guarantees and interest rates on long-term loans – all firmsThe dependent variable is the level of the interest rate on the loan (see equation 7). Geographical andsector dummies, not reported, are included in the regression. For variables’ definitions see also thenotes to tables 1 and 5. *** indicates significance at 1 per cent level, ** at 5 per cent and * at 10 percent.
(A) (B) (C)VARIABLES
Coeff. Sign. Coeff. Sign. Coeff. Sign.std. err. std. err. std. err.
0,727 *** 0,648 *** 0,302 ***Real guarantees(dummy variable) 0,032 0,032 0,030
0,142 *** 0,150 *** 0,093 **Personal guarantees(dummy variable) 0,040 0,038 0,047
0,087 * 0,135 ***Housebank(dummy variable) 0,046 0,047
0,006 0,126 ***Relationship length(log – years) 0,015 0,017
-0,112 *** -0,092 ***Loan’s value(logs – millions of lire) 0,006 0,007
0,005 ***Number of banking relationships0,002
-0,341 ***Total sales(logs – millions of lire) 0,019
0,005Total assets(logs – millions of lire) 0,021
0,182 ***Physical assets(share of total assets) 0,059
2,953 ***Immaterial assets(share of total assets) 0,256
0,048 ***Age of borrower(20 to 40 years dummy variable) 0,016
0,137 ***Age of borrower(40 to 60 years dummy variable) 0,028
0,307 ***Age of borrower(more than 60 years dummy variable) 0,035
-1,632 ***Capital(ratio to total assets) 0,080
-1,774 ***Liquid assets(share of total assets) 0,118
0,002Leverage0,012
-0,537 ***ROE0,054
-0,279Competition in loan market(Province Herfindhal index) 0,339
-12,038 ***Bank’s unit labor costs(millions of lire) 0,774
0,772 ***Average number of workers in each bankdependency (logs) 0,044
-0,228Bank credit concentration within branches(ratio) 0,348
0,145 **Bank credit concentration withinprovinces (ratio) 0,068
0,037 **Bank’s total assets(logs – billions of lire) 0,015
No. of observations 55,045 55,045 55,045Adjusted R-squared 0.08 0.19 0.52

Table 7
Guarantees and interest rates on long-term loans – small firmsThe dependent variable is the level of the interest rate on the loan (see equation 7). Geographical andsector dummies, not reported, are included in the regression. For variables’ definitions see also thenotes to tables 1 and 5. *** indicates significance at 1 per cent level, ** at 5 per cent and * at 10 percent.
(A) (B) (C)VARIABLES
Coeff. Sign. Coeff. Sign. Coeff. Sign.std. err. std. err. std. err.
0,630 *** 0,583 *** 0,174 **Real guarantees(dummy variable) 0,072 0,074 0,074
0,071 -0,040 0,128Personal guarantees(dummy variable) 0,104 0,103 0,124
0,043 0,039Housebank(dummy variable) 0,102 0,098
0,006 0,145 ***Relationship length(log – years) 0,040 0,046
-0,152 *** -0,137 ***Loan’s value(logs – millions of lire) 0,018 0,019
-0,003Number of banking relationships0,006
-0,284 ***Total sales(logs – millions of lire) 0,074
0,312 ***Total assets(logs – millions of lire) 0,053
0,165Physical assets(share of total assets) 0,136
2,343 ***Immaterial assets(share of total assets) 0,700
0,166 ***Age of borrower(20 to 40 years dummy variable) 0,042
0,306 ***Age of borrower(40 to 60 years dummy variable) 0,079
0,301 ***Age of borrower(more than 60 years dummy variable) 0,083
-1,844 ***Capital(ratio to total assets) 0,183
-1,498 ***Liquid assets(share of total assets) 0,310
-0,008Leverage0,010
-0,255 *ROE0,1470,115Competition in loan market
(Province Herfindhal index) 0,828-9,979 ***Bank’s unit labor costs
(millions of lire) 2,0041,061 ***Average number of workers in each bank
dependency (logs) 0,1150,869Bank credit concentration within branches
(ratio) 0,857-0,010Bank credit concentration within
provinces (ratio) 0,1740,031Bank’s total assets
(logs – billions of lire) 0,038
No. of observations 9,563 9,563 9,563Adjusted R-squared 0.11 0.20 0.54
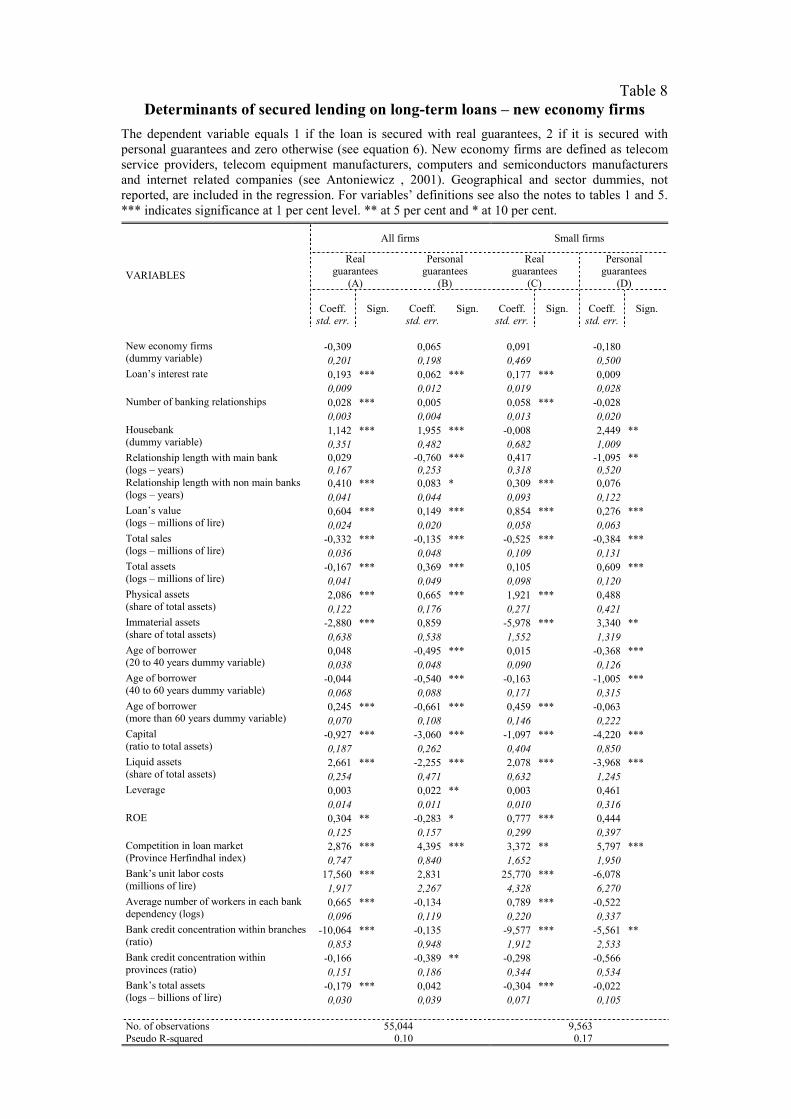
Table 8Determinants of secured lending on long-term loans – new economy firms
The dependent variable equals 1 if the loan is secured with real guarantees, 2 if it is secured withpersonal guarantees and zero otherwise (see equation 6). New economy firms are defined as telecomservice providers, telecom equipment manufacturers, computers and semiconductors manufacturersand internet related companies (see Antoniewicz , 2001). Geographical and sector dummies, notreported, are included in the regression. For variables’ definitions see also the notes to tables 1 and 5.*** indicates significance at 1 per cent level. ** at 5 per cent and * at 10 per cent.
All firms Small firms
Realguarantees
Personalguarantees
Realguarantees
Personalguarantees
(A) (B) (C) (D)
Coeff. Sign. Coeff. Sign. Coeff. Sign. Coeff. Sign.
VARIABLES
std. err. std. err. std. err. std. err.
-0,309 0,065 0,091 -0,180New economy firms(dummy variable) 0,201 0,198 0,469 0,500
0,193 *** 0,062 *** 0,177 *** 0,009Loan’s interest rate0,009 0,012 0,019 0,0280,028 *** 0,005 0,058 *** -0,028Number of banking relationships0,003 0,004 0,013 0,0201,142 *** 1,955 *** -0,008 2,449 **Housebank
(dummy variable) 0,351 0,482 0,682 1,0090,029 -0,760 *** 0,417 -1,095 **Relationship length with main bank
(logs – years) 0,167 0,253 0,318 0,5200,410 *** 0,083 * 0,309 *** 0,076Relationship length with non main banks
(logs – years) 0,041 0,044 0,093 0,1220,604 *** 0,149 *** 0,854 *** 0,276 ***Loan’s value
(logs – millions of lire) 0,024 0,020 0,058 0,063-0,332 *** -0,135 *** -0,525 *** -0,384 ***Total sales
(logs – millions of lire) 0,036 0,048 0,109 0,131-0,167 *** 0,369 *** 0,105 0,609 ***Total assets
(logs – millions of lire) 0,041 0,049 0,098 0,1202,086 *** 0,665 *** 1,921 *** 0,488Physical assets
(share of total assets) 0,122 0,176 0,271 0,421-2,880 *** 0,859 -5,978 *** 3,340 **Immaterial assets
(share of total assets) 0,638 0,538 1,552 1,3190,048 -0,495 *** 0,015 -0,368 ***Age of borrower
(20 to 40 years dummy variable) 0,038 0,048 0,090 0,126-0,044 -0,540 *** -0,163 -1,005 ***Age of borrower
(40 to 60 years dummy variable) 0,068 0,088 0,171 0,3150,245 *** -0,661 *** 0,459 *** -0,063Age of borrower
(more than 60 years dummy variable) 0,070 0,108 0,146 0,222-0,927 *** -3,060 *** -1,097 *** -4,220 ***Capital
(ratio to total assets) 0,187 0,262 0,404 0,8502,661 *** -2,255 *** 2,078 *** -3,968 ***Liquid assets
(share of total assets) 0,254 0,471 0,632 1,2450,003 0,022 ** 0,003 0,461Leverage0,014 0,011 0,010 0,3160,304 ** -0,283 * 0,777 *** 0,444ROE0,125 0,157 0,299 0,3972,876 *** 4,395 *** 3,372 ** 5,797 ***Competition in loan market
(Province Herfindhal index) 0,747 0,840 1,652 1,95017,560 *** 2,831 25,770 *** -6,078Bank’s unit labor costs
(millions of lire) 1,917 2,267 4,328 6,2700,665 *** -0,134 0,789 *** -0,522Average number of workers in each bank
dependency (logs) 0,096 0,119 0,220 0,337-10,064 *** -0,135 -9,577 *** -5,561 **Bank credit concentration within branches
(ratio) 0,853 0,948 1,912 2,533-0,166 -0,389 ** -0,298 -0,566Bank credit concentration within
provinces (ratio) 0,151 0,186 0,344 0,534-0,179 *** 0,042 -0,304 *** -0,022Bank’s total assets
(logs – billions of lire) 0,030 0,039 0,071 0,105
No. of observations 55,044 9,563Pseudo R-squared 0.10 0.17

Table 9Guarantees and interest rates on long-term loans – specific riskiness of
new economy firmsThe dependent variable is the level of the interest rate on the loan (see equation 7). Geographical andsector dummies, not reported, are included in the regression. For variables’ definitions see also thenotes to tables 1, 5 and 8. *** indicates significance at 1 per cent level, ** at 5 per cent and * at 10 percent.
All firms Small firms(A) (B)
Coefficient Significance Coefficient Significance
VARIABLES
standard error standard error
0,649 *** 0,583 ***Real guarantees(dummy variable) 0,032 0,074
0,150 *** -0,040Personal guarantees(dummy variable) 0,038 0,103
0,222 *** -0,075New economy firms(dummy variable) 0,082 0,227
0,087 * 0,044Housebank(dummy variable) 0,046 0,102
0,005 0,006Relationship length(log – years) 0,015 0,040
-0,112 *** -0,152 ***Loan’s value(logs – millions of lire) 0,006 0,018
0,005 *** -0,003Number of banking relationships0,002 0,006
-0,341 *** -0,284 ***Total sales(logs – millions of lire) 0,019 0,074
0,004 0,312 ***Total assets(logs – millions of lire) 0,021 0,053
0,188 *** 0,163Physical assets(share of total assets) 0,059 0,137
2,924 *** 2,355 ***Immaterial assets(share of total assets) 0,255 0,701
0,048 *** 0,166 ***Age of borrower(20 to 40 years dummy variable) 0,016 0,042
0,138 *** 0,307 ***Age of borrower(40 to 60 years dummy variable) 0,028 0,079
0,308 *** 0,302 ***Age of borrower(more than 60 years dummy variable) 0,035 0,082
-1,637 *** -1,845 ***Capital(ratio to total assets) 0,080 0,183
-1,770 *** -1,498 ***Liquid assets(share of total assets) 0,118 0,310
0,002 -0,008Leverage0,012 0,010
-0,539 *** -0,253 *ROE0,054 0,147
-0,270 0,122Competition in loan market(Province Herfindhal index) 0,339 0,829
-12,019 *** -9,982 ***Bank’s unit labor costs(millions of lire) 0,773 2,004
0,773 *** 1,061 ***Average number of workers in each bankdependency (logs) 0,044 0,115
-0,225 0,871Bank credit concentration within branches(ratio) 0,348 0,858
0,144 ** -0,010Bank credit concentration withinprovinces (ratio) 0,068 0,174
0,037 ** 0,031Bank’s total assets(logs – billions of lire) 0,015 0,038
No. of observations 55,044 9,563Adjusted R-squared 0.19 0.17