
SECTOR Tech, Semis, Components and UPDATE Distributors …
20
SECTOR UPDATE January 13, 2016 Tech, Semis, Components and Distributors William Stein, CFA 212-319-3808 [email protected] Joseph Meares, CFA 212-303-4135 [email protected] Elliott Smith, CFA 212-303-4150 [email protected] The Industrialization of Semis Favor growth over safety • Formalizing our Industrialization of Semis thesis. After writing on this topic for the last 3 years, we formalize our industrialization thesis today, showing detailed regression analyses: Our analysis shows that semi investors have historically paid up for safety characteristics; however, growth characteristics have been better at generating alpha. As semis have become a more mature, slower-growing industry (more like industrials), investors, companies, and boards of directors should shift their favor away from safety to growth. As long as debt capital markets cooperate, expect M&A to be a major part of growth (as is the case in industrials). Key ways to invest in this thesis are to buy NXPI, AVGO, MSCC, and ADI. • Semi investors have historically "paid up" for safety. Semiconductor investors have historically "paid up" (with high P/E and EV/EBITDA multiples) for high gross margins, and low net leverage, characteristics we call "safety". Industrials investors have not consistently paid up for these metrics. • But, safety characteristics have not generated alpha. Our analysis shows that across the three time periods we studied, investing in semi companies with safety characteristics has not generated alpha. • Semi investors should instead "pay up" for growth. Across the three time periods we studied, the characteristics of semi companies that were most strongly correlated with total shareholder return were (1) earnings growth, (2) revenue growth, and (3) free cash flow growth. The same characteristics are the three most strongly correlated with shareholder return in industrials. This appears extremely supportive of continued M&A in semis (as long as debt capital markets cooperate), reflecting the same approach industrial companies have taken. • Semi Boards of Directors should shift to compensate growth metrics. We reviewed dozens of 10- K filings to investigate how compensation metrics align with our "growth over safety" view. Semi BoDs compensate for high margins in 85% of cases, but compensate for EPS and cash flow in only 35% and 13% of cases, respectively. We advocate semi BoDs should more prominently target EPS and cash flow growth, like their industrial counterparts which use these metrics in 48% and 30% of cases. • We believe the best ways to invest in the industrialization of semis is through companies that have embraced M&A to grow sales & EPS. The most prominent of these are NXPI, AVGO, MSCC, and ADI. Companies Impacted in This Note Ticker Price Rating Target ADI $51.65 Buy $71.00 APH $47.43 Neutral $55.00 ARW $48.32 Buy $65.00 ATML $7.68 Neutral $8.83 AVT $39.08 Buy $50.00 BDC $41.78 Buy $80.00 LLTC $39.51 Neutral $45.00 MCHP $41.85 Neutral $50.00 MXIM $33.15 Neutral $39.00 NXPI $77.78 Buy $103.00 PLAB $12.20 Buy $15.00 ST $39.64 Neutral $50.00 TEL $58.46 Buy $74.00 TXN $51.53 Neutral $57.00 XLNX $43.36 Neutral $45.00 AVGO $129.92 Buy $180.00 MSCC $31.33 Buy $49.00 INTC $32.68 Neutral $35.00 CY $8.39 Neutral $9.00 SEE PAGE 18 FOR REQUIRED DISCLOSURE INFORMATION Page 1 Search by ticker for required disclosures, price target risks: https://suntrust.bluematrix.com/sellside/Disclosures.actionTech, Semis, Components and Distributors Equity Research
Transcript of SECTOR Tech, Semis, Components and UPDATE Distributors …

SECTORUPDATEJanuary 13, 2016
Tech, Semis, Components andDistributors
William Stein, [email protected]
Joseph Meares, [email protected]
Elliott Smith, [email protected]
The Industrialization of SemisFavor growth over safety
• Formalizing our Industrialization of Semis thesis. After writing on this topic for the last 3 years, weformalize our industrialization thesis today, showing detailed regression analyses: Our analysis showsthat semi investors have historically paid up for safety characteristics; however, growth characteristicshave been better at generating alpha. As semis have become a more mature, slower-growing industry(more like industrials), investors, companies, and boards of directors should shift their favor away fromsafety to growth. As long as debt capital markets cooperate, expect M&A to be a major part of growth (asis the case in industrials). Key ways to invest in this thesis are to buy NXPI, AVGO, MSCC, and ADI.
• Semi investors have historically "paid up" for safety. Semiconductor investors have historically "paidup" (with high P/E and EV/EBITDA multiples) for high gross margins, and low net leverage, characteristicswe call "safety". Industrials investors have not consistently paid up for these metrics.
• But, safety characteristics have not generated alpha. Our analysis shows that across the three timeperiods we studied, investing in semi companies with safety characteristics has not generated alpha.
• Semi investors should instead "pay up" for growth. Across the three time periods we studied, thecharacteristics of semi companies that were most strongly correlated with total shareholder return were(1) earnings growth, (2) revenue growth, and (3) free cash flow growth. The same characteristics are thethree most strongly correlated with shareholder return in industrials. This appears extremely supportiveof continued M&A in semis (as long as debt capital markets cooperate), reflecting the same approachindustrial companies have taken.
• Semi Boards of Directors should shift to compensate growth metrics. We reviewed dozens of 10-K filings to investigate how compensation metrics align with our "growth over safety" view. Semi BoDscompensate for high margins in 85% of cases, but compensate for EPS and cash flow in only 35% and13% of cases, respectively. We advocate semi BoDs should more prominently target EPS and cash flowgrowth, like their industrial counterparts which use these metrics in 48% and 30% of cases.
• We believe the best ways to invest in the industrialization of semis is through companies thathave embraced M&A to grow sales & EPS. The most prominent of these are NXPI, AVGO, MSCC,and ADI.
Companies Impacted in This NoteTicker Price Rating Target
ADI $51.65 Buy $71.00
APH $47.43 Neutral $55.00
ARW $48.32 Buy $65.00
ATML $7.68 Neutral $8.83
AVT $39.08 Buy $50.00
BDC $41.78 Buy $80.00
LLTC $39.51 Neutral $45.00
MCHP $41.85 Neutral $50.00
MXIM $33.15 Neutral $39.00
NXPI $77.78 Buy $103.00
PLAB $12.20 Buy $15.00
ST $39.64 Neutral $50.00
TEL $58.46 Buy $74.00
TXN $51.53 Neutral $57.00
XLNX $43.36 Neutral $45.00
AVGO $129.92 Buy $180.00
MSCC $31.33 Buy $49.00
INTC $32.68 Neutral $35.00
CY $8.39 Neutral $9.00
SEE PAGE 18 FOR REQUIRED DISCLOSURE INFORMATION Page 1
Search by ticker for required disclosures, price target risks: https://suntrust.bluematrix.com/sellside/Disclosures.actionTech, Semis, Components and Distributors Equity Research

The Industrialization of Semis
Contents PM Summary: favor growth over value ........................................................................................................ 3
Introduction & A brief word on our methodology ....................................................................................... 3
Semi investors have historically “paid up” for safety ................................................................................... 3
Safety characteristics have not generated alpha .......................................................................................... 7
Semi investors should instead “pay up” for growth ................................................................................... 10
Best individual metrics ........................................................................................................................ 10
Multivariate analysis ........................................................................................................................... 13
Semi Boards of Directors should shift compensation metrics to favor growth over safety ....................... 15
Best ways to invest in the industrialization of semis theme ...................................................................... 16
NXP Semiconductors (NXPI, $77.78, Buy) ............................................................................................... 16
Avago Technologies (AVGO, $129.92, Buy) ............................................................................................ 16
Microsemi Corporation (MSCC, $31.33, Buy) ......................................................................................... 17
Analog Devices (ADI, $51.65, Buy) .......................................................................................................... 17
Tech, Semis, Components and Distributors
Page 2 of 20Search by ticker for required disclosures, price target risks: https://suntrust.bluematrix.com/sellside/Disclosures.action

PM Summary: favor growth over value Over the last three years we’ve written about our “industrialization of semis” thesis. Today we
formalize our thesis with regression analyses. In summary, our work suggests that as management
teams, boards of directors, and investors come to terms with a semiconductor industry that grows only
slightly faster than global GDP,
Companies will transition focus away from “safety” (high gross profit margin and low leverage)
to “growth” (sales, EPS, and cash flow per share), often by acquiring other companies, cutting
costs, and using appropriate financial leverage.
Boards of directors will likewise shift performance targets away from safety to growth metrics,
and
Ultimately we believe investors will begin to reward companies that deliver faster earnings
growth (through acquisitions & cost cuts, or otherwise) with higher valuation metrics.
Introduction & A brief word on our methodology In 2012 when we launched coverage of the semiconductor industry, feedback from investors indicated
that the key metric in evaluating semiconductors is gross profit margin, that acquisitions don’t create
value for equity because they rarely enable gross margin expansion, and that financially levered
semiconductor companies represent very risky investments. We disagreed with those views, and over
time built the regression analyses to support our opinions.
We collected 10 fundamental metrics for approximately 90 companies across the semiconductor and
industrial sectors over 3 separate time periods (the trailing 1, 3, and 5 year periods each ending
12/31/2014). We ran simple and multiple regressions of the fundamental data relative to valuation
metrics (P/E and EV/EBITDA) to determine the answers to three questions for semis and (separately) for
industrials: (1) what fundamental metrics were most highly correlated with high valuation?, (2) did
investments that favored those fundamental metrics generate alpha?, and (3) if not, what were the
characteristics most correlated with alpha generation? Separately, we studied whether performance
criteria that boards of directors established for management teams were aligned with metrics that
generate investment returns.
We found that semi investors have historically favored safety (high gross margin and low financial
leverage). These characteristics are not associated with alpha generation. Outsized returns are most
correlated with growth metrics, specifically EPS, cash flow, and sales growth. We also found that BoDs
place too much emphasis on safety (specifically margins) and not enough on EPS or cash flow growth.
Semi investors have historically “paid up” for safety The valuation component of our study had the most striking differences between semi and industrial
companies, and is an important area regarding our industrialization theme. We based this study on a
simple regression of historical metrics versus valuation multiples at the beginning of the study period,
which we then verified through multivariate iterations. For semis, investors have historically "paid up"
Tech, Semis, Components and Distributors
Page 3 of 20Search by ticker for required disclosures, price target risks: https://suntrust.bluematrix.com/sellside/Disclosures.action

(with high P/E and EV/EBITDA multiples) for high gross margins and low net leverage. By contrast, in
industrials, investors do not place a consistent premium on any particular fundamental metric, meaning
no metric was significant across all 3 periods of the study.
While different time periods have slight differences in which metrics have the highest correlations (and
some time periods have much stronger correlations than others), the important trends were evident –
semi investors apply premium valuations to companies with historically high gross margins and low net
leverage. Other metrics were correlated during different periods, but we were more concerned with
what investors have repeatedly paid a premium for. In the following exhibit, we show an example of the
high correlation between historical gross profit margin and EV/EBITDA valuation for semiconductor
companies in the 2011-2014 study.
Exhibit 1: Semiconductor 2011-2014 simple regression study, historical GPM vs. EV/EBITDA valuation
Source: Company Data, FactSet, STRH Analysis
In the following exhibit, we outline the simple regression conclusions for each time period.
y = 14.823x + 0.1274R² = 0.5072
0
2
4
6
8
10
12
14
16
18
20
0% 10% 20% 30% 40% 50% 60% 70% 80% 90% 100%
EV/E
BIT
DA
Historical GPM
Historical GPM vs. EV/EBITDA
Tech, Semis, Components and Distributors
Page 4 of 20Search by ticker for required disclosures, price target risks: https://suntrust.bluematrix.com/sellside/Disclosures.action

Exhibit 2: Simple regression study conclusions for what investors have “paid up” for
Source: Company Data, FactSet, STRH Analysis
Next, we show the filtered, multiple regression conclusions. These results take the simple regression
output a few steps further, removing high levels of multicollinearity and false positives to try and find
the true drivers of valuation. In the following exhibit, we show an example of our multiple regression
analysis for the same 2011-2014 semiconductor study comparing EV/EBITDA valuation with historical
gross profit margin. The multiple regression analysis verifies our simple regression above, and we show
the results below.
Regression Simple Regression Simple Regression Simple Regression
Gross Profit Margin Level Gross Profit Margin Level Net Leverage
Net Leverage Net Leverage Gross Profit Margin Level
ROIC level Gross Profit Margin Level Gross Profit Margin LevelGross Profit Margin Level Operating Profit Margin Level ROIC Level
ROIC LevelNet Leverage
No significant metrics ROIC Level Operating Profit Margin Level
Gross Leverage
Net Leverage
Gross Profit Margin Level Gross Profit Margin Level Net leverageEV/EBITDA
Valuation
What do Investors
Pay For?
2009 - 2014 2011 - 2014
P/E Valuation
EV/EBITDA
Valuation
2013 - 2014
P/E Valuation
Semis
Industrials
Tech, Semis, Components and Distributors
Page 5 of 20Search by ticker for required disclosures, price target risks: https://suntrust.bluematrix.com/sellside/Disclosures.action
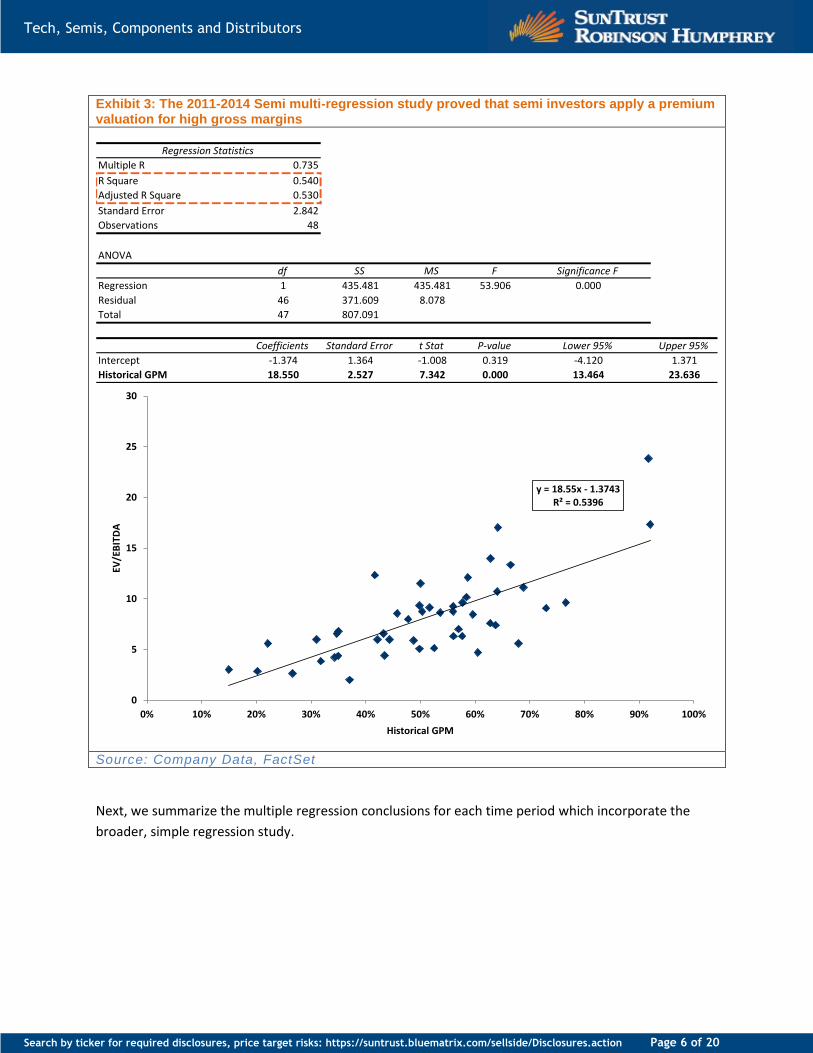
Exhibit 3: The 2011-2014 Semi multi-regression study proved that semi investors apply a premium valuation for high gross margins
Source: Company Data, FactSet
Next, we summarize the multiple regression conclusions for each time period which incorporate the
broader, simple regression study.
Regression Statistics
Multiple R 0.735
R Square 0.540
Adjusted R Square 0.530
Standard Error 2.842
Observations 48
ANOVA
df SS MS F Significance F
Regression 1 435.481 435.481 53.906 0.000
Residual 46 371.609 8.078
Total 47 807.091
Coefficients Standard Error t Stat P-value Lower 95% Upper 95%
Intercept -1.374 1.364 -1.008 0.319 -4.120 1.371
Historical GPM 18.550 2.527 7.342 0.000 13.464 23.636
y = 18.55x - 1.3743R² = 0.5396
0
5
10
15
20
25
30
0% 10% 20% 30% 40% 50% 60% 70% 80% 90% 100%
EV/E
BIT
DA
Historical GPM
Tech, Semis, Components and Distributors
Page 6 of 20Search by ticker for required disclosures, price target risks: https://suntrust.bluematrix.com/sellside/Disclosures.action

Exhibit 4: Multiple regression study conclusions for what investors have “paid up” for
Source: Company Data, FactSet, STRH Analysis
And finally, considering both regression sets across the 3 time periods, we show our conclusions. In this
final set of results, it was important to discover the most important trends across all of the time periods
as whole, not intermittent sources of significance. We found that while semi investors are willing pay a
premium for high gross profit margins and low net leverage, industrial investors are not willing to a
pay a consistent premium for any single metric.
Exhibit 5: Final study conclusions for what investors have “paid up” for
Source: Company Data, FactSet, STRH Analysis
Safety characteristics have not generated alpha Across the three time periods we studied, investing in semi companies with high margins and low net
leverage (buying "safety") has not generated alpha. In the following exhibits, we demonstrate the lack
of correlation between both historical GPM levels and net leverage with future returns over each of the
3 time periods. While some of regression lines do slope in a positive direction, the largest R-squared
among the data set is 0.08, implying a correlation of approximately 28% in the best case.
Regression Multiple Regression Multiple Regression Multiple Regression
Gross Profit Margin Level Gross Profit Margin level Net Leverage
Net Leverage Gross Profit Margin Level
ROIC level Gross Profit Margin level Gross Profit Margin LevelGross Profit Margin Level
No significant metrics No significant metrics No significant metrics
Gross Profit Margin Level Gross Profit Margin Level Net leverageEV/EBITDA
Valuation
What do Investors
Pay For?
2009 - 2014 2011 - 2014
P/E Valuation
EV/EBITDA
Valuation
2013 - 2014
P/E Valuation
Semis
Industrials
Regression
Gross Profit Margin Level
Net Leverage
Gross Profit Margin Level
No significant metrics
No significant metrics
Final Conclusion
EV/EBITDA
Valuation
What do Investors
Pay For?
P/E Valuation
EV/EBITDA
Valuation
P/E Valuation
Semis
Industrials
Tech, Semis, Components and Distributors
Page 7 of 20Search by ticker for required disclosures, price target risks: https://suntrust.bluematrix.com/sellside/Disclosures.action

Exhibit 6: 2009-2014 semi regression comparing historical GPM and net leverage to the company’s future total return
Source: Company Data, FactSet
y = 1.1349x - 0.1912R² = 0.0816
-150.0%
-100.0%
-50.0%
0.0%
50.0%
100.0%
150.0%
200.0%
0% 10% 20% 30% 40% 50% 60% 70% 80% 90% 100%Tota
l Re
turn
Historical GPM
Historical GPM vs Future Return
y = -0.0055x + 0.3928R² = 0.0058
-150.0%
-100.0%
-50.0%
0.0%
50.0%
100.0%
150.0%
200.0%
-35.00 -30.00 -25.00 -20.00 -15.00 -10.00 -5.00 0.00 5.00 10.00 15.00 20.00
Tota
l Re
turn
Historical Net Leverage
Historical Net Leverage vs Future Return
Tech, Semis, Components and Distributors
Page 8 of 20Search by ticker for required disclosures, price target risks: https://suntrust.bluematrix.com/sellside/Disclosures.action

Exhibit 7: 2011-2014 semi regression comparing historical GPM and net leverage to the company’s future total return
Source: Company Data, FactSet
y = -0.267x + 0.4822R² = 0.0095
-100.0%
-50.0%
0.0%
50.0%
100.0%
150.0%
0.0% 10.0% 20.0% 30.0% 40.0% 50.0% 60.0% 70.0% 80.0% 90.0% 100.0%Tota
l Re
turn
Historical GPM
Historical GPM vs Future Return
y = 0.0177x + 0.4821R² = 0.0301
-100.0%
-50.0%
0.0%
50.0%
100.0%
150.0%
200.0%
250.0%
-20.00 -15.00 -10.00 -5.00 0.00 5.00 10.00
Tota
l Re
turn
Historical Net Leverage
Historical Net Leverage vs Future Return
Tech, Semis, Components and Distributors
Page 9 of 20Search by ticker for required disclosures, price target risks: https://suntrust.bluematrix.com/sellside/Disclosures.action

Exhibit 8: 2013 – 2014 semi regression comparing historical GPM and net leverage to the company’s future total return
Source: Company Data, FactSet
Semi investors should instead “pay up” for growth Now that we know applying premium valuations for “safe” plays does not typically work, the next logical
question becomes: “What should I pay for?” Across the three time periods we studied, the coincident
metrics most strongly correlated with total shareholder return were (1) earnings growth, (2) revenue growth,
and (3) free cash flow growth. Investors should note: the same characteristics are also the three most
strongly correlated with shareholder return among industrials.
Best individual metrics
We used the same format to evaluate this section – a diverse set of simple regressions, coordinated with
a final multiple regression study. In the following exhibits as an example, we show the simple regression
analysis of EPS growth and total return for semiconductor companies in the 2011 - 2014 study, followed
by a multiple regression analysis that verifies the result.
y = -0.121x + 0.2279R² = 0.0028
-100.0%
-80.0%
-60.0%
-40.0%
-20.0%
0.0%
20.0%
40.0%
60.0%
80.0%
100.0%
120.0%
0% 10% 20% 30% 40% 50% 60% 70% 80% 90% 100%Tota
l Re
turn
Historical GPM
Historical GPM vs Future Return
y = 0.0208x + 0.2574R² = 0.0725
-80.0%
-60.0%
-40.0%
-20.0%
0.0%
20.0%
40.0%
60.0%
80.0%
100.0%
120.0%
-20.00 -15.00 -10.00 -5.00 0.00 5.00 10.00
Tota
l Re
turn
Historical Net Leverage
Historical Net Leverage vs Future Return
Tech, Semis, Components and Distributors
Page 10 of 20Search by ticker for required disclosures, price target risks: https://suntrust.bluematrix.com/sellside/Disclosures.action

Exhibit 9: Semiconductor 2011-2014 simple regression study, EPS growth vs. total return
Source: Company Data, FactSet
y = 0.7199x + 0.3735R² = 0.5338
-100%
-50%
0%
50%
100%
150%
200%
250%
300%
-150% -100% -50% 0% 50% 100% 150% 200% 250%
Tota
l Re
turn
EPS Growth
EPS Growth vs. Total Return
Tech, Semis, Components and Distributors
Page 11 of 20Search by ticker for required disclosures, price target risks: https://suntrust.bluematrix.com/sellside/Disclosures.action

Exhibit 10: The 2011-2014 Semi multi-regression study proved that EPS growth was the best coincident indicator of Total Return
Source: Company Data, FactSet
In the following exhibit, we show the most significant individual metrics to explain total shareholder
return for both Semi and Industrial investors across each of the three time periods. These are the final
Regression Statistics
Multiple R 0.921
R Square 0.848
Adjusted R Square 0.843
Standard Error 0.273
Observations 32
ANOVA
df SS MS F Significance F
Regression 1 12.50 12.50 167.57 0.000
Residual 30 2.24 0.07
Total 31 14.74
Coefficients Standard Error t Stat P-value Lower 95% Upper 95%
Intercept 0.323 0.053 6.087 0.000 0.215 0.432
EPS Growth 1.083 0.084 12.945 0.000 0.912 1.254
Correlation EPS Growth Rev Growth FCF Growth
EPS Growth 1.00
Rev Growth 0.76 1.00
FCF Growth 0.63 0.39 1.00
y = 1.0831x + 0.3234R² = 0.8482
-100%
-50%
0%
50%
100%
150%
200%
250%
300%
-100% -50% 0% 50% 100% 150% 200% 250%
Tota
l Re
turn
EPS Growth
EPS Growth vs. Total Return
Tech, Semis, Components and Distributors
Page 12 of 20Search by ticker for required disclosures, price target risks: https://suntrust.bluematrix.com/sellside/Disclosures.action

results for the best coincident indicator, based on both regression sets. When looking for the single
most important metric, EPS growth is hands down the largest driver of incremental shareholder value.
Exhibit 11: Summary table showing the single best coincident indicator for total shareholder return over each period
Source: Company Data, FactSet, and STRH Analysis
Multivariate analysis
Aside from uncovering the best individual metrics, we also contemplated a traditional multivariate
analysis that attempted to uncover the best combination of variables to describe total return. While
most models ended up best described by only a single, independent variable (shown in the above
section), two portions of the study were better explained through a combination of variables. The 2011-
2014 industrial model was best described by a combination of revenue growth and free cash flow
growth, and with correlation between the two independent variables at only 39%. The 2011-2014 semi
model was also best described by a combination of revenue growth and free cash flow growth. The
multicollinearity was slightly more prevalent here with a correlation of 46%. The multiple regression
analysis results are shown in the 2 exhibits below.
2009 - 2014 2010 - 2014 2011 - 2014 Final Conclusion
EPS Growth EPS Growth EPS Growth EPS Growth
2009 - 2014 2010 - 2014 2011 - 2014 Final Conclusion
EPS Growth EPS Growth FCF Growth EPS Growth
Semis
Industrials
Tech, Semis, Components and Distributors
Page 13 of 20Search by ticker for required disclosures, price target risks: https://suntrust.bluematrix.com/sellside/Disclosures.action

Exhibit 12: The 2011-2014 industrial multi-regression study proved that Rev growth and FCF growth together were the best coincident indicators of Total Return
Source: Company Data, FactSet, STRH Analysis
Regression Statistics
Multiple R 0.813
R Square 0.661
Adjusted R Square 0.637
Standard Error 0.415
Observations 32
ANOVA
df SS MS F Significance F
Regression 2 9.74 4.87 28.24 1.558E-07
Residual 29 5.00 0.17
Total 31 14.74
Coefficients Standard Error t Stat P-value Lower 95% Upper 95%
Intercept 0.298 0.085 3.505 0.002 0.124 0.472
Rev Growth 0.824 0.207 3.977 0.000 0.400 1.248
FCF Growth 0.244 0.057 4.299 0.000 0.128 0.360
Correlation EPS Growth Rev Growth FCF Growth
EPS Growth 1.00
Rev Growth 0.76 1.00
FCF Growth 0.63 0.39 1.00
Tech, Semis, Components and Distributors
Page 14 of 20Search by ticker for required disclosures, price target risks: https://suntrust.bluematrix.com/sellside/Disclosures.action

Exhibit 13: The 2013 - 2014 semi multi-regression study proved that Rev growth and FCF growth together were the best coincident indicators of Total Return
Source: Company Data, FactSet, STRH Analysis
Semi Boards of Directors should shift compensation metrics to favor
growth over safety Armed with a view that, for both semis and industrials, growth in cash flow, earnings, and sales are
more correlated with alpha generation than safety characteristics like high gross margin and low
leverage, we investigated how well aligned management teams’ compensation metrics are with
characteristics that drive alpha.
We analyzed dozens of 10-K filings to first determine compensation metrics for both semi and industrial
management teams. We then compared these results with the metrics that are most highly correlated
with shareholder returns (growth in revenue, EPS, and FCF).
Our analysis, summarized in the following exhibit, suggests BoDs, especially for semiconductor
companies, could do a much better job of aligning performance metrics with alpha generating
characteristics.
Regression Statistics
Multiple R 0.725
R Square 0.526
Adjusted R Square 0.494
Standard Error 0.254
Observations 32
ANOVA
df SS MS F Significance F
Regression 2 2.08 1.04 16.10 1.978E-05
Residual 29 1.87 0.06
Total 31 3.96
Coefficients Standard Error t Stat P-value Lower 95% Upper 95%
Intercept 0.174 0.050 3.449 0.002 0.071 0.277
Rev Growth 0.621 0.220 2.823 0.009 0.171 1.071
FCF Growth 0.144 0.049 2.949 0.006 0.044 0.244
Correlation Rev Growth EBITDA Growth EPS Growth FCF Growth
Rev Growth 1.00
EBITDA Growth 0.82 1.00
EPS Growth 0.70 0.92 1.00
FCF Growth 0.46 0.76 0.80 1.00
Tech, Semis, Components and Distributors
Page 15 of 20Search by ticker for required disclosures, price target risks: https://suntrust.bluematrix.com/sellside/Disclosures.action

Exhibit 14: The percentage of companies that reward their management team based on each of the criteria listed
Source: Company Data, FactSet, STRH Analysis
In particular, we highlight that the most commonly used compensation metric for Semiconductor
companies is margins, despite our analysis showing that high margins isn’t an alpha-generating
characteristic. Meanwhile, the big alpha generating characteristics EPS and Cash Flow are used by
semiconductor boards in only 35% and 13% of the time, respectively.
Simply put, to better align management’s and shareholders’ interests, semiconductor boards of
directors should shift the metrics on which they measure management from safety (specifically margins)
to growth (specifically EPS and cash flow).
Best ways to invest in the industrialization of semis theme While M&A has been an ongoing phenomenon of semiconductor investing for the last three years, we
anticipate it will continue, so long as debt capital markets cooperate. Companies in our coverage that
we believe are most aligned with our industrialization thesis include:
NXP Semiconductors (NXPI, $77.78, Buy) We believe NXPI is a leader relative to our industrialization of semiconductors theme. Even before the
company acquired Freescale, it targeted outsized EPS growth through a combination of superior sales
growth (with leading positions in ID and automotive) and shareholder friendly capital allocation (share
buybacks). Freescale gives NXP a significant step-up in EPS and a $500 million per year cost savings EPS
accelerator. Ultimately we believe NXP’s earnings growth will be approximately 17% per year. Our PT is
$103 based on 14x our 2016 EPS.
Avago Technologies (AVGO, $129.92, Buy) We see AVGO as a clear innovator relative to our industrialization of semiconductors theme. The
company’s RF filtering expertise affords it a stable growth engine that it supplements with significant
acquisitions. With BRCM we believe AVGO will have long-term organic earnings growth of 13% that
bumps to 17% with future potential M&A. Our PT is $180 based on 14x our 2017 EPS.
Metric Semis Industrials Drives Returns?
Margin / cost 87% 61% No
Sales/Bookings growth 78% 57% Yes
EPS-related 35% 48% Yes
Cash flow 13% 30% Yes
Returns (fundamental) 9% 48% No
Returns (stock) 13% 30% Yes
Tech, Semis, Components and Distributors
Page 16 of 20Search by ticker for required disclosures, price target risks: https://suntrust.bluematrix.com/sellside/Disclosures.action

Microsemi Corporation (MSCC, $31.33, Buy) Microsemi’s intermittent acquisitions fuel a mostly inorganic growth profile. In the near-term we
anticipate approximately 40% of company sales are poised to accelerate in 2016-2017. Following its
pending acquisition of PMC-Sierra (PMCS, $11.63, NR) we believe MSCC will have long-term organic
earnings growth of 14% that bumps to 19% with future potential M&A. Our PT is $49 based on 12x our
2017 EPS.
Analog Devices (ADI, $51.65, Buy) ADI is a more recent fit into our industrialization of semis theme. We believe management is slowly
transitioning the company’s under-levered balance sheet to one that uses leverage to fuel growth. This
is most recently evidenced by the company’s raise of $875m net incremental debt that it will use to fund
either an acquisition or stock repurchase. Our PT is $71 based on 20x our C16 EPS.
Tech, Semis, Components and Distributors
Page 17 of 20Search by ticker for required disclosures, price target risks: https://suntrust.bluematrix.com/sellside/Disclosures.action

Companies Mentioned in This NoteAnalog Devices, Inc. (ADI, $51.65, Buy)Amphenol Corp (APH, $47.43, Neutral)Arrow Electronics, Inc. (ARW, $48.32, Buy)Atmel Corp. (ATML, $7.68, Neutral)Avnet, Inc. (AVT, $39.08, Buy)Belden Inc. (BDC, $41.78, Buy)Linear Technology Corp. (LLTC, $39.51, Neutral)Microchip Technology Inc (MCHP, $41.85, Neutral)Maxim Integrated (MXIM, $33.15, Neutral)NXP Semiconductors N.V. (NXPI, $77.78, Buy)Photronics, Inc. (PLAB, $12.20, Buy)Sensata Technologies Holding NV (ST, $39.64, Neutral)TE Connectivity, Ltd. (TEL, $58.46, Buy)Texas Instruments Inc. (TXN, $51.53, Neutral)Xilinx, Inc. (XLNX, $43.36, Neutral)Avago (AVGO, $129.92, Buy)Microsemi (MSCC, $31.33, Buy)Cypress (CY, $8.39, Neutral)Intel (INTC, $32.68, Neutral)PMC-Sierra (PMCS, $11.63, NR)
Analyst CertificationI, William Stein , hereby certify that the views expressed in this research report accurately reflect my personal views about the subjectcompany(ies) and its (their) securities. I also certify that I have not been, am not, and will not be receiving direct or indirect compensation inexchange for expressing the specific recommendation(s) in this report.
Required DisclosuresAnalyst compensation is based upon stock price performance, quality of analysis, communication skills, and the overall revenue and profitability ofthe firm, including investment banking revenue.
As a matter of policy and practice, the firm prohibits the offering of favorable research, a specific research rating or a specific target price asconsideration or inducement for the receipt of business or compensation. In addition, associated persons preparing research reports are prohibitedfrom owning securities in the subject companies.
Charts indicating changes in ratings can be found in recent notes and/or reports at our website or by contacting SunTrust Robinson Humphrey.Please see our disclosures page for more complete information at https://suntrust.bluematrix.com/sellside/Disclosures.action.
Tech, Semis, Components and Distributors
Page 18 of 20Search by ticker for required disclosures, price target risks: https://suntrust.bluematrix.com/sellside/Disclosures.action
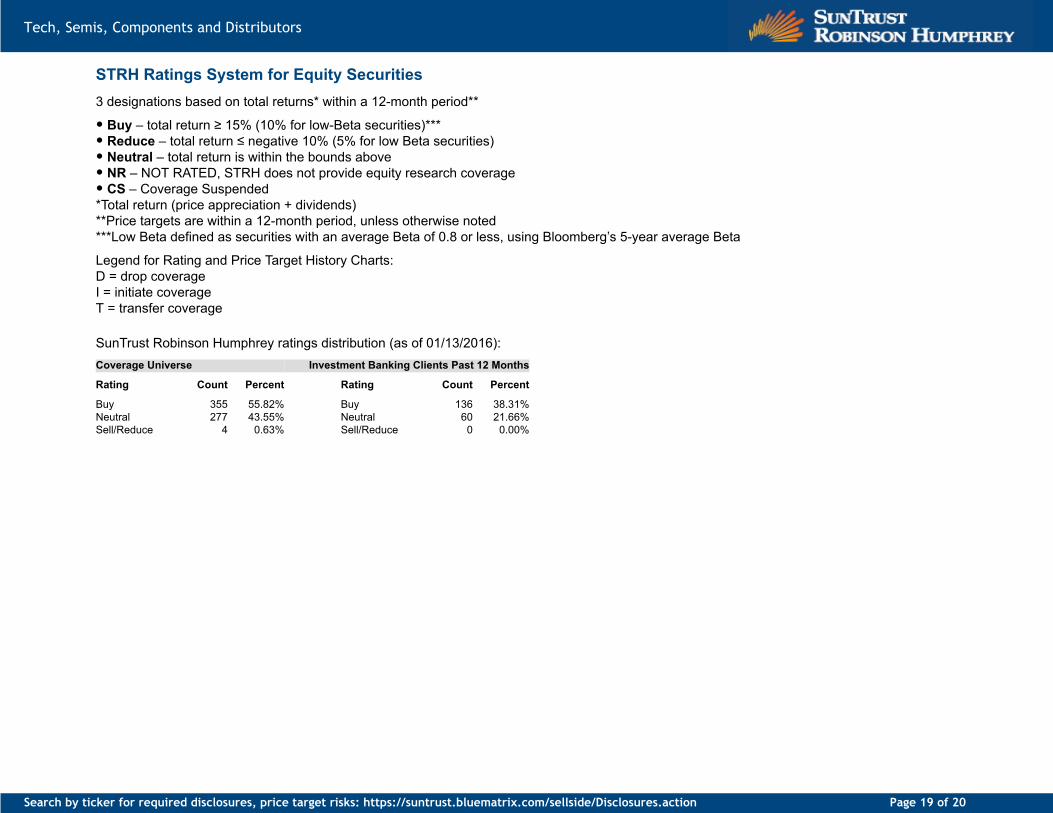
STRH Ratings System for Equity Securities3 designations based on total returns* within a 12-month period**
• Buy – total return ≥ 15% (10% for low-Beta securities)***• Reduce – total return ≤ negative 10% (5% for low Beta securities)• Neutral – total return is within the bounds above• NR – NOT RATED, STRH does not provide equity research coverage• CS – Coverage Suspended*Total return (price appreciation + dividends)**Price targets are within a 12-month period, unless otherwise noted***Low Beta defined as securities with an average Beta of 0.8 or less, using Bloomberg’s 5-year average Beta
Legend for Rating and Price Target History Charts:D = drop coverageI = initiate coverageT = transfer coverage
SunTrust Robinson Humphrey ratings distribution (as of 01/13/2016):Coverage Universe Investment Banking Clients Past 12 Months
Rating Count Percent Rating Count Percent
Buy 355 55.82% Buy 136 38.31%Neutral 277 43.55% Neutral 60 21.66%Sell/Reduce 4 0.63% Sell/Reduce 0 0.00%
Tech, Semis, Components and Distributors
Page 19 of 20Search by ticker for required disclosures, price target risks: https://suntrust.bluematrix.com/sellside/Disclosures.action

Other DisclosuresInformation contained herein has been derived from sources believed to be reliable but is not guaranteed as to accuracy and does not purportto be a complete analysis of the security, company or industry involved. This report is not to be construed as an offer to sell or a solicitation ofan offer to buy any security. SunTrust Robinson Humphrey, Inc. and/or its officers or employees may have positions in any securities, options,rights or warrants. The firm and/or associated persons may sell to or buy from customers on a principal basis. Investors may be prohibited incertain states from purchasing some over-the-counter securities mentioned herein. Opinions expressed are subject to change without notice. Theinformation herein is for persons residing in the United States only and is not intended for any person in any other jurisdiction.
SunTrust Robinson Humphrey, Inc.’s research is provided to and intended for use by Institutional Accounts as defined in FINRA Rule 4512(c).The term “Institutional Account" shall mean the account of: (1) a bank, savings and loan association, insurance company or registered investmentcompany; (2) an investment adviser registered either with the SEC under Section 203 of the Investment Advisers Act or with a state securitiescommission (or any agency or office performing like functions); or (3) any other person (whether a natural person, corporation, partnership, trust orotherwise) with total assets of at least $50 million.
SunTrust Robinson Humphrey, Inc. is a registered broker-dealer and a member of FINRA and SIPC. It is a service mark of SunTrust Banks, Inc.SunTrust Robinson Humphrey, Inc. is owned by SunTrust Banks, Inc. ("SunTrust") and affiliated with SunTrust Investment Services, Inc. Despitethis affiliation, securities recommended, offered, sold by, or held at SunTrust Robinson Humphrey, Inc. and at SunTrust Investment Services, Inc.(i) are not insured by the Federal Deposit Insurance Corporation; (ii) are not deposits or other obligations of any insured depository institution(including SunTrust Bank); and (iii) are subject to investment risks, including the possible loss of the principal amount invested. SunTrust Bankmay have a lending relationship with companies mentioned herein.
© SunTrust Robinson Humphrey, Inc. 2016 . All rights reserved. Reproduction or quotation in whole or part without permission is forbidden.
ADDITIONAL INFORMATION IS AVAILABLE at our website, www.suntrustrh.com, or by writing to:SunTrust Robinson Humphrey, Research Department, 3333 Peachtree Road N.E., Atlanta, GA 30326-1070
Tech, Semis, Components and Distributors
Page 20 of 20Search by ticker for required disclosures, price target risks: https://suntrust.bluematrix.com/sellside/Disclosures.action