Sector Overview GA Housing and homelessness … · REPORT ON GOVERNMENT SERVICES 2018 HOUSING AND...
30
REPORT ON GOVERNMENT SERVICES 2018 HOUSING AND HOMELESSNESS SERVICES SECTOR OVERVIEW GA Data reported in the attachment tables are the most accurate available at the time of data collection. Historical data may have been updated since the last edition of RoGS. This file is available on the Review website at www.pc.gov.au/rogs/2018. Housing and homelessness services sector overview — attachment Unsourced information was obtained from the Australian, State and Territory governments. Data in this Report are examined by the Housing and Homelessness Working Group, but have not been formally audited by the Secretariat.
Transcript of Sector Overview GA Housing and homelessness … · REPORT ON GOVERNMENT SERVICES 2018 HOUSING AND...

REPORT ONGOVERNMENTSERVICES 2018
HOUSING AND HOMELESSNESSSERVICES SECTOR OVERVIEW
GA
Data reported in the attachment tables are the most accurate available at the time of datacollection. Historical data may have been updated since the last edition of RoGS.
This file is available on the Review website at www.pc.gov.au/rogs/2018.
Housing and homelessness servicessector overview — attachment
Unsourced information was obtained from the Australian, State and Territory governments.
Data in this Report are examined by the Housing and Homelessness Working Group, but havenot been formally audited by the Secretariat.

CONTENTS
REPORT ONGOVERNMENTSERVICES 2018
HOUSING AND HOMELESSNESSSERVICES SECTOR OVERVIEW
PAGE 1 of CONTENTS
Attachment contentsTable GA.1 Australian Government expenditure relating to the National Affordable Housing
Agreement (NAHA) ($million),2016-17 dollars
Table GA.2 Proportion of low income households in rental stress, by State and Territory, by location
Table GA.3 Proportion of low income private rental households in rental stress, by State andTerritory, 2015-16
Table GA.4 Supplementary contextual data
Table GA.5 Australian Government expenditure for Commonwealth Rent Assistance, 2012-13 to2016-17 ($ million) (2016-17 dollars)
Table GA.6 Australian Government real expenditure for CRA, per person, 2012-13 to 2016-17(2016-17 dollars)
Table GA.7 Income units receiving CRA, 2017
Table GA.8 Aboriginal and Torres Strait Islander income units receiving CRA, 2017
Table GA.9 CRA income units, by payment type, 2017
Table GA.10 CRA income units, by remoteness 2017
Table GA.11 Income units receiving CRA, by special needs and geographic location, 2017 (x), (y)
Table GA.12 Income units receiving CRA paying enough rent to be eligible for maximum assistance,by jurisdiction, 2013 to 2017 (per cent)
Table GA.13 Proportion of income units receiving CRA, paying more than 30 per cent of income onrent, with and without CRA, by special needs, 2017 (per cent)
Table GA.14 Proportion of income units receiving CRA with more than 50 per cent of income spenton rent, with and without CRA, by special needs, 2017 (per cent)
Table GA.15 Housing composition by tenure type (per cent)
Table GA.16 Households residing in public housing (per cent)
Table GA.17 Households residing in community housing (per cent)

TABLE GA.1
REPORT ONGOVERNMENTSERVICES 2018
HOUSING AND HOMELESSNESSSERVICES SECTOR OVERVIEW
PAGE 1 of TABLE GA.1
Table GA.1
NSW Vic Qld WA SA Tas ACT NT Aust2016-17
NAHA Specific Purpose Payment 429.4 343.9 268.9 141.4 94.5 28.6 22.4 13.5 1 342.6National Partnership agreements (in support of the NAHA)
on Homelessness 30.0 22.8 28.7 15.0 8.9 2.8 1.5 5.3 115.0on Remote Indigenous Housing – – 59.0 35.4 9.5 – – 145.9 249.8Total expenditure on National Partnership agreements 30.0 22.8 87.7 50.4 18.4 2.8 1.5 151.2 364.8
Total Australian Government expenditure related to the NAHA 459.4 366.7 356.6 191.8 112.9 31.4 23.9 164.7 1 707.42015-16
NAHA Specific Purpose Payment 430.8 336.7 270.0 146.2 95.6 29.1 22.1 13.7 1 344.2National Partnership agreements (in support of the NAHA)
on Homelessness 30.5 23.1 29.1 15.2 9.0 2.8 1.5 5.4 116.8on Remote Indigenous Housing 48.8 – 146.4 112.4 19.0 – – 65.3 391.9Total expenditure on National Partnership agreements 79.3 23.1 175.5 127.6 28.0 2.8 1.5 70.7 508.6
Total Australian Government expenditure related to the NAHA 510.0 359.9 445.6 273.9 123.6 31.9 23.6 84.4 1 852.82014-15
NAHA Specific Purpose Payment 435.2 338.6 273.3 148.5 97.3 29.6 22.3 14.0 1 358.8National Partnership agreements (in support of the NAHA)
on Homelessness 37.2 23.7 35.5 15.6 9.2 3.5 1.6 5.5 131.8on Remote Indigenous Housing 63.1 2.6 149.3 152.9 28.9 2.6 – 73.9 473.2Total expenditure on National Partnership agreements 100.3 26.3 184.8 168.4 38.1 6.1 1.6 79.4 605.0
Total Australian Government expenditure related to the NAHA 535.5 364.9 458.0 316.9 135.4 35.7 23.9 93.4 1 963.82013-14
NAHA Specific Purpose Payment 432.6 329.0 270.8 146.7 99.3 31.7 23.7 20.7 1 354.5National Partnership agreements (in support of the NAHA)
on Homelessness 34.8 31.8 33.2 19.7 16.2 4.2 5.8 5.4 151.3
Australian Government expenditure relating to the National Affordable Housing Agreement (NAHA) ($million),2016-17 dollars (a)
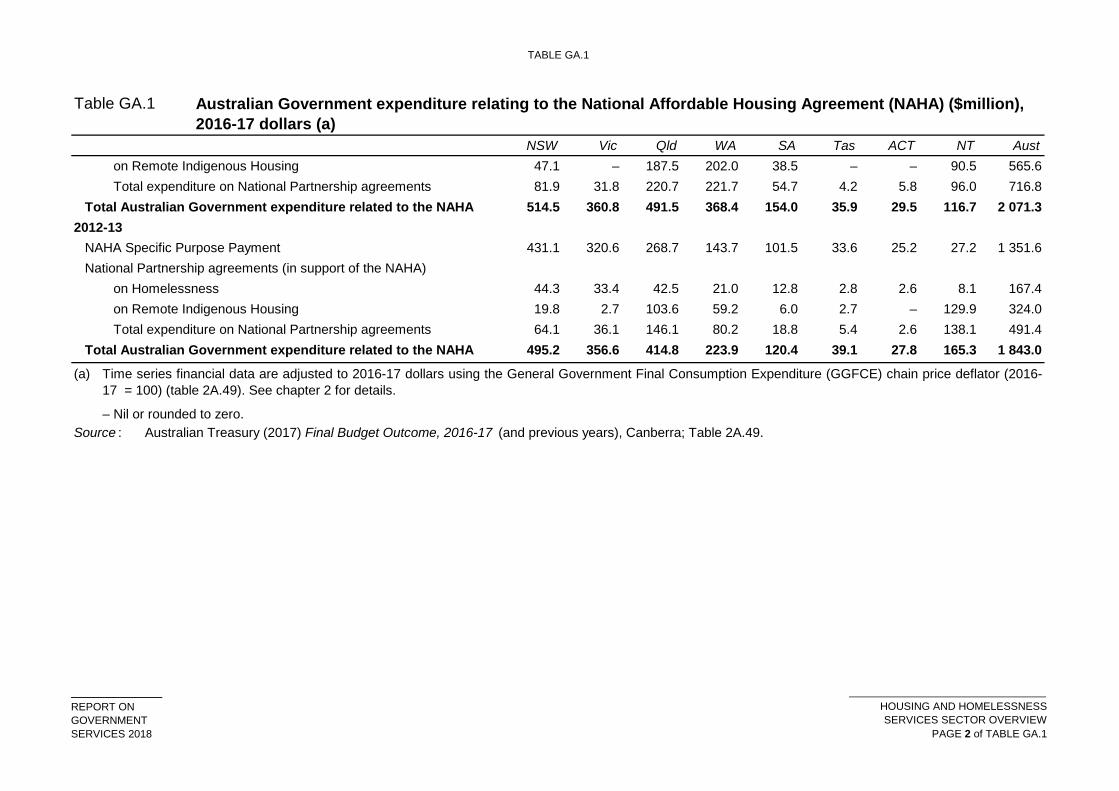
TABLE GA.1
REPORT ONGOVERNMENTSERVICES 2018
HOUSING AND HOMELESSNESSSERVICES SECTOR OVERVIEW
PAGE 2 of TABLE GA.1
Table GA.1
NSW Vic Qld WA SA Tas ACT NT Aust
Australian Government expenditure relating to the National Affordable Housing Agreement (NAHA) ($million),2016-17 dollars (a)
on Remote Indigenous Housing 47.1 – 187.5 202.0 38.5 – – 90.5 565.6Total expenditure on National Partnership agreements 81.9 31.8 220.7 221.7 54.7 4.2 5.8 96.0 716.8
Total Australian Government expenditure related to the NAHA 514.5 360.8 491.5 368.4 154.0 35.9 29.5 116.7 2 071.32012-13
NAHA Specific Purpose Payment 431.1 320.6 268.7 143.7 101.5 33.6 25.2 27.2 1 351.6National Partnership agreements (in support of the NAHA)
on Homelessness 44.3 33.4 42.5 21.0 12.8 2.8 2.6 8.1 167.4on Remote Indigenous Housing 19.8 2.7 103.6 59.2 6.0 2.7 – 129.9 324.0Total expenditure on National Partnership agreements 64.1 36.1 146.1 80.2 18.8 5.4 2.6 138.1 491.4
Total Australian Government expenditure related to the NAHA 495.2 356.6 414.8 223.9 120.4 39.1 27.8 165.3 1 843.0
(a)
– Nil or rounded to zero.Australian Treasury (2017) Final Budget Outcome, 2016-17 (and previous years), Canberra; Table 2A.49.Source :
Time series financial data are adjusted to 2016-17 dollars using the General Government Final Consumption Expenditure (GGFCE) chain price deflator (2016-17 = 100) (table 2A.49). See chapter 2 for details.
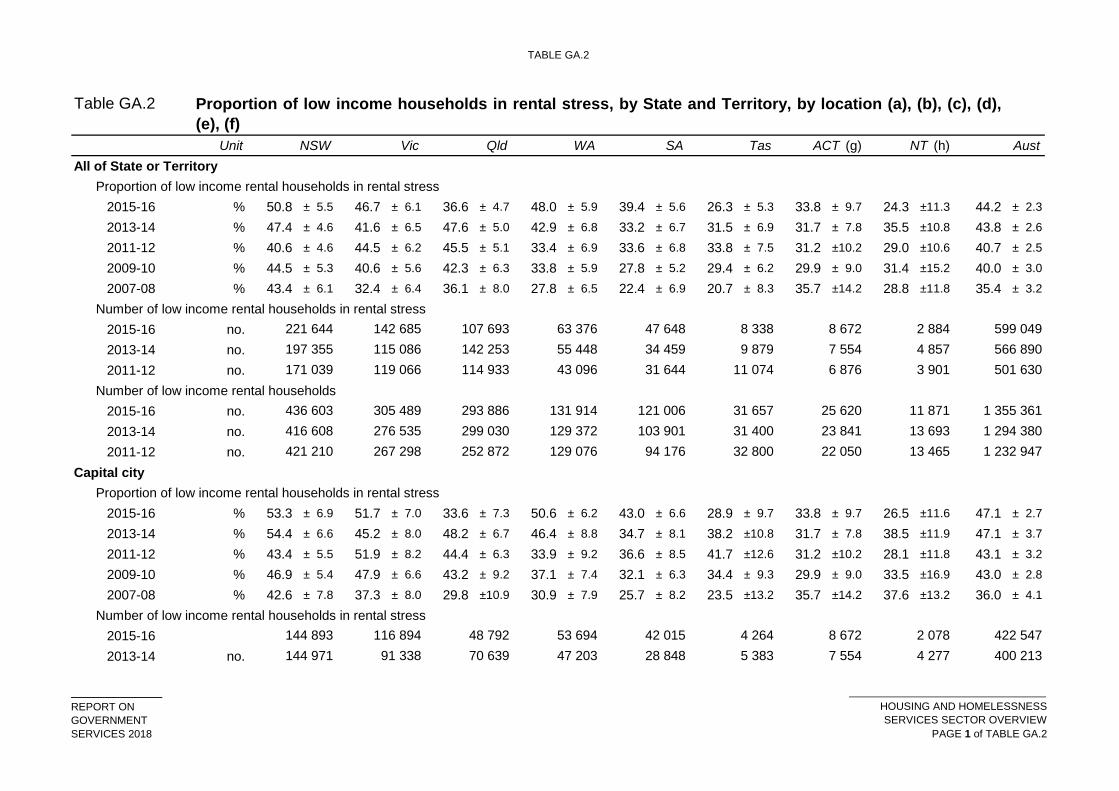
TABLE GA.2
REPORT ONGOVERNMENTSERVICES 2018
HOUSING AND HOMELESSNESSSERVICES SECTOR OVERVIEW
PAGE 1 of TABLE GA.2
Table GA.2
Unit NSW Vic Qld WA SA Tas ACT (g) NT (h) AustAll of State or Territory
Proportion of low income rental households in rental stress2015-16 % 50.8 ± 5.5 46.7 ± 6.1 36.6 ± 4.7 48.0 ± 5.9 39.4 ± 5.6 26.3 ± 5.3 33.8 ± 9.7 24.3 ±11.3 44.2 ± 2.3
2013-14 % 47.4 ± 4.6 41.6 ± 6.5 47.6 ± 5.0 42.9 ± 6.8 33.2 ± 6.7 31.5 ± 6.9 31.7 ± 7.8 35.5 ±10.8 43.8 ± 2.6
2011-12 % 40.6 ± 4.6 44.5 ± 6.2 45.5 ± 5.1 33.4 ± 6.9 33.6 ± 6.8 33.8 ± 7.5 31.2 ±10.2 29.0 ±10.6 40.7 ± 2.5
2009-10 % 44.5 ± 5.3 40.6 ± 5.6 42.3 ± 6.3 33.8 ± 5.9 27.8 ± 5.2 29.4 ± 6.2 29.9 ± 9.0 31.4 ±15.2 40.0 ± 3.0
2007-08 % 43.4 ± 6.1 32.4 ± 6.4 36.1 ± 8.0 27.8 ± 6.5 22.4 ± 6.9 20.7 ± 8.3 35.7 ±14.2 28.8 ±11.8 35.4 ± 3.2
Number of low income rental households in rental stress2015-16 no.2013-14 no.2011-12 no.
Number of low income rental households2015-16 no.2013-14 no.2011-12 no.
Capital cityProportion of low income rental households in rental stress
2015-16 % 53.3 ± 6.9 51.7 ± 7.0 33.6 ± 7.3 50.6 ± 6.2 43.0 ± 6.6 28.9 ± 9.7 33.8 ± 9.7 26.5 ±11.6 47.1 ± 2.7
2013-14 % 54.4 ± 6.6 45.2 ± 8.0 48.2 ± 6.7 46.4 ± 8.8 34.7 ± 8.1 38.2 ±10.8 31.7 ± 7.8 38.5 ±11.9 47.1 ± 3.7
2011-12 % 43.4 ± 5.5 51.9 ± 8.2 44.4 ± 6.3 33.9 ± 9.2 36.6 ± 8.5 41.7 ±12.6 31.2 ±10.2 28.1 ±11.8 43.1 ± 3.2
2009-10 % 46.9 ± 5.4 47.9 ± 6.6 43.2 ± 9.2 37.1 ± 7.4 32.1 ± 6.3 34.4 ± 9.3 29.9 ± 9.0 33.5 ±16.9 43.0 ± 2.8
2007-08 % 42.6 ± 7.8 37.3 ± 8.0 29.8 ±10.9 30.9 ± 7.9 25.7 ± 8.2 23.5 ±13.2 35.7 ±14.2 37.6 ±13.2 36.0 ± 4.1
Number of low income rental households in rental stress2015-162013-14 no.
4 264 8 672 2 078 422 547
6 876 3 901 501 630 171 039 119 066 114 933 43 096 31 644 11 074
436 603 305 489 293 886 131 914 121 006 31 657 25 620 11 871 1 355 361
Proportion of low income households in rental stress, by State and Territory, by location (a), (b), (c), (d),(e), (f)
197 355 115 086 142 253 55 448 34 459 9 879 7 554 4 857 566 890 221 644 142 685 107 693 63 376 47 648 8 338 8 672 2 884 599 049
400 213
13 693 1 294 380 421 210 267 298 252 872 129 076 94 176 32 800 22 050 13 465 1 232 947 416 608 276 535 299 030 129 372 103 901 31 400 23 841
144 893 116 894 48 792 53 694 42 015 144 971 91 338 70 639 47 203 28 848 5 383 7 554 4 277

TABLE GA.2
REPORT ONGOVERNMENTSERVICES 2018
HOUSING AND HOMELESSNESSSERVICES SECTOR OVERVIEW
PAGE 2 of TABLE GA.2
Table GA.2
Unit NSW Vic Qld WA SA Tas ACT (g) NT (h) Aust
Proportion of low income households in rental stress, by State and Territory, by location (a), (b), (c), (d),(e), (f)
2011-12 no.Number of low income rental households
2015-16 no.2013-14 no.2011-12 no.
Balance of stateProportion of low income rental households in rental stress
2015-16 % 45.2 ± 7.3 31.5 ± 9.3 37.9 ± 7.4 35.9 ± 9.2 23.0 ± 8.3 22.7 ± 6.0 .. np 38.2 ± 2.9
2013-14 % 34.9 ± 7.0 31.9 ± 9.0 47.0 ± 6.6 29.9 ± 7.9 27.0 ± 8.9 26.0 ± 8.6 .. .. np 37.4 ± 3.4
2011-12 % 35.0 ± 7.9 27.8 ± 8.8 46.5 ± 9.3 31.6 ± 9.1 23.1 ± 7.4 26.3 ± 7.0 .. np 35.9 ± 4.3
2009-10 % 40.6 ± 9.3 25.9 ± 9.8 41.4 ± 8.9 23.5 ± 9.1 15.5 ± 6.6 24.9 ± 8.4 .. np 34.9 ± 5.5
2007-08 % 44.8 ±14.0 17.4 ±10.2 41.2 ± 9.6 13.6 ±11.6 12.4 ±13.4 18.3 ±12.0 .. np 34.2 ± 6.7
Number of low income rental households in rental stress2015-16 no.2013-14 no.2011-12 no.
Number of low income rental households2015-16 no.2013-14 no.2011-12 no.
(a)
(b)
458 762
52 384 23 748 71 615 8 245 5 611 4 496 .. np 166 678.. np 149 728
np
897 475
76 236 25 191 55 279 8 929 5 412 3 977 .. np 175 311
279 373 185 651 126 327 101 779 73 167 15 945 22 050 11 637 815 928
14 736
..
25 620 7 840
6 876 3 275 351 901
266 461 202 028 146 696 101 811 83 130 14 087 23 841
121 338 96 357 56 144 34 473 26 788 6 649
11 123 849 178 271 709 226 086 145 066 106 200 97 669
49 701 22 709 58 789 8 624 4 855 4 425
168 578 80 055 145 978 24 901 23 491 17 543np 445 202
141 837 81 648 126 545 27 297 21 009 16 855 .. np 150 147 74 506 152 334 27 561 20 771 17 313 ..
The percentages reported in this table include 95 per cent confidence intervals (for example, 80.0 per cent ± 2.7 per cent).
417 018
Low income households are defined as households with equivalised disposable household income (excluding CRA) at or below the 40th percentile, calculatedfor capital city and balance of state, on a state-by-state basis. Note that a different definition of low income households applies for social housing affordabilityanalyses reported in chapter 18.

TABLE GA.2
REPORT ONGOVERNMENTSERVICES 2018
HOUSING AND HOMELESSNESSSERVICES SECTOR OVERVIEW
PAGE 3 of TABLE GA.2
Table GA.2
Unit NSW Vic Qld WA SA Tas ACT (g) NT (h) Aust
Proportion of low income households in rental stress, by State and Territory, by location (a), (b), (c), (d),(e), (f)
(c)
(d)(e)(f)
(g)(h)
.. Not applicable. np Not published.
Data for the NT should be interpreted with caution as the SIH excludes very remote areas, which comprise around 23 per cent of the estimated residentpopulation of the NT.
Data for 'All of State or Territory' are calculated by summation of data for greater capital city areas and rest of state. Totals may not add due to rounding.
Cells in this table have been randomly adjusted to avoid the release of confidential data. Discrepancies may occur between sums of the component items andtotals.
Source : ABS (unpublished) Survey of Income and Housing, 2015-16 (and previous years).
See ABS 2017, Household Expenditure Survey and Survey of Income and Housing, User Guide, Australia, 2015-16 , Cat. no. 6503.0 for furtherinformation about these data.
Greater capital city area estimates for the ACT relate to total ACT.
Historical data have been revised and may differ from previous Reports.

TABLE GA.3
REPORT ONGOVERNMENTSERVICES 2018
HOUSING AND HOMELESSNESSSERVICES SECTOR OVERVIEW
PAGE 1 of TABLE GA.3
Table GA.3
Unit NSW Vic Qld WA SA Tas ACT NT (d) AustProportion of low income private rental households in rental stress
% 57.5 ± 5.2 53.2 ± 7.4 43.5 ± 5.3 60.0 ± 6.1 53.2 ± 7.2 31.6 ± 6.5 47.8 ±13.2 34.1 ±16.7 52.9 ± 2.6Number of low income private rental households in rental stress
no.Number of low income rental households
no.
(a)
(b)(c)
(d) Data for the NT should be interpreted with caution as the SIH excludes very remote areas, which comprise around 23 per cent of the estimated residentpopulation of the NT.
Low income households are defined as households with equivalised disposable household income (excluding CRA) at or below the 40th percentile, calculatedfor capital city and balance of state, on a state-by-state basis. Note that a different definition of low income households applies for social housing affordabilityanalyses reported in chapter 18.The percentages reported in this table include 95 per cent confidence intervals (for example, 80.0 per cent ± 2.7 per cent).
Source : ABS (unpublished) Survey of Income and Housing, 2015-16.
998 102 7 528 321 993 237 963 220 589 98 855 74 938 20 750 16 664
See ABS 2017, Household Expenditure Survey and Survey of Income and Housing, User Guide, Australia, 2015-16 , Cat. no. 6503.0 for further informationabout these data.
6 549 7 960 2 567 527 588
Proportion of low income private rental households in rental stress, by State and Territory, 2015-16 (a), (b), (c)
185 072 126 665 95 990 59 265 39 842

TABLE GA.4
REPORT ONGOVERNMENTSERVICES 2018
HOUSING AND HOMELESSNESSSERVICES SECTOR OVERVIEW
PAGE 1 of TABLE GA.4
Table GA.4 Supplementary contextual data — Housing affordabilityUnit NSW Vic Qld WA SA Tas ACT NT (a) Aust
Number of homes sold or built per 1000 low and moderate income households that are affordable by low and moderate income households (b)2015-16 Rate 21.8 39.6 56.0 28.8 30.0 53.7 63.2 35.1 36.12013-14 Rate 37.3 40.0 66.1 30.7 50.1 55.8 62.2 55.1 45.02011-12 Rate 31.5 28.0 20.4 23.2 27.8 37.5 37.1 36.5 27.52009-10 Rate 41.8 41.1 21.1 29.7 29.3 35.9 50.6 71.0 35.52007-08 Rate 24.1 43.7 20.7 8.0 31.3 35.6 37.3 43.7 27.9
(a)
(b)Source :
Data for the NT should be interpreted with caution as the SIH excludes very remote areas, which comprise around 23 per cent of the estimated resident population of the NT. Income statistic used: median gross incomes of the 59th–61st percentiles of equivalised disposable household incomes for all states and territories.
ABS (unpublished) Survey of Income and Housing, 2015-16 (and previous years).

TABLE GA.5
REPORT ONGOVERNMENTSERVICES 2018
HOUSING AND HOMELESSNESSSERVICES SECTOR OVERVIEW
PAGE 1 of TABLE GA.5
Table GA.5
NSW Vic Qld WA SA Tas ACT NT Aust 1 400.8 983.3 1 136.8 371.6 326.2 123.1 34.7 22.1 4 399.0 1 431.1 998.2 1 143.9 355.7 331.6 123.7 36.2 21.9 4 442.4 1 431.4 983.2 1 107.9 331.0 320.0 120.9 36.5 20.6 4 351.8 1 392.5 944.9 1 051.3 312.4 305.4 109.4 34.5 20.1 4 170.6 1 303.0 872.2 977.8 289.6 285.1 102.5 30.9 19.5 3 880.5
(a)
(b)
(c)(d)
2016-172015-162014-152013-142012-13
Time series financial data are adjusted to 2016-17 dollars using the General Government Final Consumption Expenditure (GGFCE) chain price deflator (2016-17 = 100) (table 2A.49). See chapter 2 for details.
Australian totals include other territories and unknown addresses.
Source : Department of Social Services (unpublished); Table 2A.49.
Expenditure data in this table include CRA payments made with DVA and Abstudy payments. These typically make up less than 2 per cent of CRA expenditure.
Actual expenditure on Commonwealth Rent Assistance (CRA) is reported at a national level. State and Territory figures are estimated by apportioning nationalexpenditure to States and Territories based on each jurisdiction’s total daily amount of CRA an income unit is entitled to receive as at the end of June for thereporting year, multiplied by the number of days for that year.
Australian Government expenditure for Commonwealth Rent Assistance, 2012-13 to 2016-17 ($ million) (2016-17 dollars) (a), (b), (c), (d)

TABLE GA.6
REPORT ONGOVERNMENTSERVICES 2018
HOUSING AND HOMELESSNESSSERVICES SECTOR OVERVIEW
PAGE 1 of TABLE GA.6
Table GA.6
Unit NSW Vic Qld WA SA Tas ACT NT Aust
$ million 1 400.8 983.3 1 136.8 371.6 326.2 123.1 34.7 22.1 4 399.0$ 180 157 233 145 190 237 85 90 180$ 3 299 3 247 3 290 3 235 3 244 3 348 3 127 3 163 3 274
$ million 1 431.1 998.2 1 143.9 355.7 331.6 123.7 36.2 21.9 4 442.4$ 187 166 238 137 195 239 92 90 186$ 3 328 3 271 3 320 3 246 3 270 3 379 3 124 3 178 3 300
$ million 1 431.4 983.2 1 107.9 331.0 320.0 120.9 36.5 20.6 4 351.8$ 189 167 233 128 189 235 94 84 184$ 3 270 3 208 3 260 3 168 3 203 3 331 3 069 3 122 3 239
$ million 1 392.5 944.9 1 051.3 312.4 305.4 109.4 34.5 20.1 4 170.6$ 187 163 224 122 182 213 90 83 179$ 3 201 3 141 3 196 3 093 3 129 3 237 2 977 3 040 3 171
$ million 1 303.0 872.2 977.8 289.6 285.1 102.5 30.9 19.5 3 880.5$ 177 154 212 117 172 200 81 82 169$ 3 093 3 032 3 090 2 977 3 001 3 114 2 862 2 949 3 060
(a)
Australian Government real expenditure for CRA, per person, 2012-13 to 2016-17 (2016-17 dollars) (a), (b), (c)
2016-17Total expenditureExpenditure per person in population
Expenditure per income unit
Total expenditureExpenditure per person in population
Expenditure per income unit2015-16
Total expenditureExpenditure per person in population
This table has been changed since an earlier version of the Report. See errata at http://www.pc.gov.au/research/ongoing/report-on-government-services/2018/housing-and-homelessness.
Expenditure per income unit
Actual expenditure on CRA is reported at a national level. State and Territory figures are estimated by apportioning national expenditure to States and Territoriesbased on each jurisdiction’s total daily amount of CRA an income unit is entitled to receive as at the end of June for the reporting year, multiplied by the numberof days for the relevant year.
Expenditure per income unit2012-13
Total expenditureExpenditure per person in population
Expenditure per income unit2013-14
Total expenditureExpenditure per person in population
2014-15

TABLE GA.6
REPORT ONGOVERNMENTSERVICES 2018
HOUSING AND HOMELESSNESSSERVICES SECTOR OVERVIEW
PAGE 2 of TABLE GA.6
Table GA.6
Unit NSW Vic Qld WA SA Tas ACT NT Aust
Australian Government real expenditure for CRA, per person, 2012-13 to 2016-17 (2016-17 dollars) (a), (b), (c)
This table has been changed since an earlier version of the Report. See errata at http://www.pc.gov.au/research/ongoing/report-on-government-services/2018/housing-and-homelessness.
(b)(c)
Source : Department of Social Services (unpublished); ABS (unpublished) Australian Demographic Statistics, Cat. no. 3101.0; tables 2A.2 and 2A.49.
State and Territory totals include unknown localities, Australian totals include other territories and unknown addresses.Time series financial data are adjusted to 2016-17 dollars using the General Government Final Consumption Expenditure (GGFCE) chain price deflator (2016-17 = 100) (table 2A.49). See chapter 2 for details.

TABLE GA.7
REPORT ONGOVERNMENTSERVICES 2018
HOUSING AND HOMELESSNESSSERVICES SECTOR OVERVIEW
PAGE 1 of TABLE GA.7
Table GA.7 Income units receiving CRA, 2017 (a), (b), (c), (d)Type of income unit NSW Vic Qld WA SA Tas ACT NT Aust
Number of CRA recipientsSingle — no dependant children 173 226 123 837 130 485 44 927 42 398 16 694 4 499 2 831 538 953Single — no children, sharer 50 411 44 458 48 011 17 215 12 693 3 440 2 019 933 179 200Single — 1 or 2 dependant children 69 905 48 373 62 319 20 579 18 555 6 813 1 460 1 193 229 199Single — 3 or more dependant children 17 551 10 907 16 095 4 693 3 943 1 718 273 311 55 491Partnered — no dependant children 39 135 22 690 31 442 9 295 7 656 3 196 573 371 114 362Partnered — 1 or 2 dependant children 49 843 36 437 35 996 12 047 10 581 3 094 1 589 837 150 429Partnered — 3 or more dependant children 23 528 15 468 20 379 5 775 4 442 1 728 661 434 72 415Partnered — illness or temporary separated 1 042 668 854 357 279 86 18 79 3 383Total 424 641 302 838 345 581 114 888 100 547 36 769 11 092 6 989 1 343 432Number of dependent children in income units (e) 321 291 217 654 275 964 84 589 72 103 26 807 7 806 5 684 1 011 909Total number of children in income units (f) 483 755 317 239 409 270 122 282 104 877 40 775 10 016 7 986 1 496 226
Proportion of CRA recipientsSingle — no dependant children 40.8 40.9 37.8 39.1 42.2 45.4 40.6 40.5 40.1Single — no children, sharer 11.9 14.7 13.9 15.0 12.6 9.4 18.2 13.3 13.3Single — 1 or 2 dependant children 16.5 16.0 18.0 17.9 18.5 18.5 13.2 17.1 17.1Single — 3 or more dependant children 4.1 3.6 4.7 4.1 3.9 4.7 2.5 4.4 4.1Partnered — no dependant children 9.2 7.5 9.1 8.1 7.6 8.7 5.2 5.3 8.5Partnered — 1 or 2 dependant children 11.7 12.0 10.4 10.5 10.5 8.4 14.3 12.0 11.2Partnered — 3 or more dependant children 5.5 5.1 5.9 5.0 4.4 4.7 6.0 6.2 5.4Partnered — illness or temporary separated 0.2 0.2 0.2 0.3 0.3 0.2 0.1 1.1 0.3Total 100.0 100.0 100.0 100.0 100.0 100.0 100.0 100.0 100.0
(a)
(b)
Includes income units paid CRA under the Social Security Act 1991 or under A New Tax System (Family Assistance) Act 1999 who were entitled to a daily rateof assistance at 30 June 2017.Australian totals include other territories and unknown addresses.

TABLE GA.7
REPORT ONGOVERNMENTSERVICES 2018
HOUSING AND HOMELESSNESSSERVICES SECTOR OVERVIEW
PAGE 2 of TABLE GA.7
Table GA.7 Income units receiving CRA, 2017 (a), (b), (c), (d)Type of income unit NSW Vic Qld WA SA Tas ACT NT Aust(c)
(d)
(e)(f) Total number of children aged under 25 years recorded in Centrelink Administrative data as living with parents.
Department of Social Services (unpublished).Source :
Due to recent policy changes to Family Tax Benefit Part A, eligible 16-19 year old full-time secondary students are included from 2014. Section G.4 Definitionsof key terms and indicators has more detail.CRA figures from 2014-15 are extracted from a new dataset built from the new Department of Human Services Enterprise Data Warehouse environment.While every effort has been made to replicate the old dataset, there are some small discrepancies due to differences between the old and new environments.Therefore, data may not be strictly comparable with earlier years.Dependent children who are counted as eligible CRA children in an income unit.
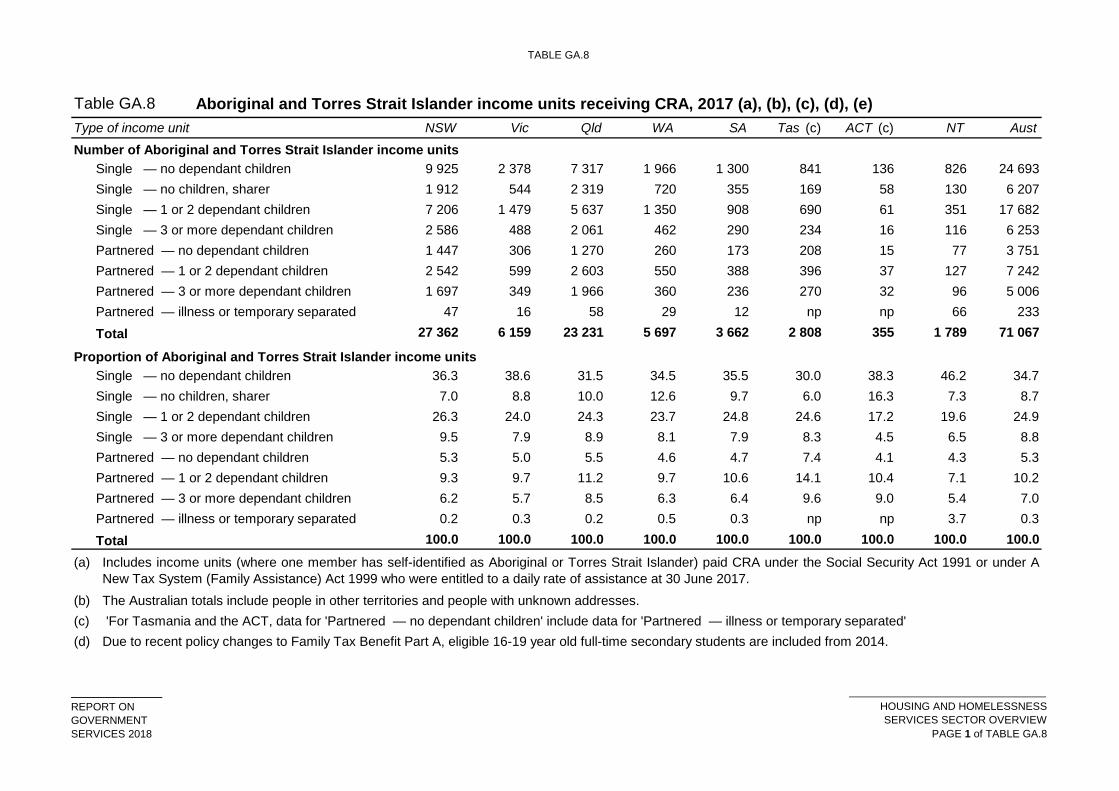
TABLE GA.8
REPORT ONGOVERNMENTSERVICES 2018
HOUSING AND HOMELESSNESSSERVICES SECTOR OVERVIEW
PAGE 1 of TABLE GA.8
Table GA.8 Aboriginal and Torres Strait Islander income units receiving CRA, 2017 (a), (b), (c), (d), (e)Type of income unit NSW Vic Qld WA SA Tas (c) ACT (c) NT Aust
Number of Aboriginal and Torres Strait Islander income unitsSingle — no dependant children 9 925 2 378 7 317 1 966 1 300 841 136 826 24 693Single — no children, sharer 1 912 544 2 319 720 355 169 58 130 6 207Single — 1 or 2 dependant children 7 206 1 479 5 637 1 350 908 690 61 351 17 682Single — 3 or more dependant children 2 586 488 2 061 462 290 234 16 116 6 253Partnered — no dependant children 1 447 306 1 270 260 173 208 15 77 3 751Partnered — 1 or 2 dependant children 2 542 599 2 603 550 388 396 37 127 7 242Partnered — 3 or more dependant children 1 697 349 1 966 360 236 270 32 96 5 006Partnered — illness or temporary separated 47 16 58 29 12 np np 66 233Total 27 362 6 159 23 231 5 697 3 662 2 808 355 1 789 71 067
Proportion of Aboriginal and Torres Strait Islander income unitsSingle — no dependant children 36.3 38.6 31.5 34.5 35.5 30.0 38.3 46.2 34.7Single — no children, sharer 7.0 8.8 10.0 12.6 9.7 6.0 16.3 7.3 8.7Single — 1 or 2 dependant children 26.3 24.0 24.3 23.7 24.8 24.6 17.2 19.6 24.9Single — 3 or more dependant children 9.5 7.9 8.9 8.1 7.9 8.3 4.5 6.5 8.8Partnered — no dependant children 5.3 5.0 5.5 4.6 4.7 7.4 4.1 4.3 5.3Partnered — 1 or 2 dependant children 9.3 9.7 11.2 9.7 10.6 14.1 10.4 7.1 10.2Partnered — 3 or more dependant children 6.2 5.7 8.5 6.3 6.4 9.6 9.0 5.4 7.0Partnered — illness or temporary separated 0.2 0.3 0.2 0.5 0.3 np np 3.7 0.3Total 100.0 100.0 100.0 100.0 100.0 100.0 100.0 100.0 100.0
(a)
(b)(c)(d)
Includes income units (where one member has self-identified as Aboriginal or Torres Strait Islander) paid CRA under the Social Security Act 1991 or under ANew Tax System (Family Assistance) Act 1999 who were entitled to a daily rate of assistance at 30 June 2017.The Australian totals include people in other territories and people with unknown addresses.
Due to recent policy changes to Family Tax Benefit Part A, eligible 16-19 year old full-time secondary students are included from 2014. 'For Tasmania and the ACT, data for 'Partnered — no dependant children' include data for 'Partnered — illness or temporary separated'

TABLE GA.8
REPORT ONGOVERNMENTSERVICES 2018
HOUSING AND HOMELESSNESSSERVICES SECTOR OVERVIEW
PAGE 2 of TABLE GA.8
Table GA.8 Aboriginal and Torres Strait Islander income units receiving CRA, 2017 (a), (b), (c), (d), (e)Type of income unit NSW Vic Qld WA SA Tas (c) ACT (c) NT Aust(e)
np Not published.Department of Social Services (unpublished).Source :
CRA figures from 2014-15 are extracted from a new dataset built from the new Department of Human Services Enterprise Data Warehouse environment. Whileevery effort has been made to replicate the old dataset, there are some small discrepancies due to differences between the old and new environments.Therefore, data may not be strictly comparable with earlier years.

TABLE GA.9
REPORT ONGOVERNMENTSERVICES 2018
HOUSING AND HOMELESSNESSSERVICES SECTOR OVERVIEW
PAGE 1 of TABLE GA.9
Table GA.9Type of income unit Unit NSW Vic Qld WA SA Tas ACT NT Aust
Proportion of CRA unitsDisability Support Pension % 19.9 20.2 18.2 15.0 19.2 24.6 15.9 18.3 19.2Age Pension % 21.7 18.6 20.5 20.0 18.8 19.1 12.0 15.8 20.1Carer Payment % 5.8 4.4 4.1 2.5 3.9 4.7 1.5 2.1 4.5Newstart Allowance % 19.6 21.7 21.6 27.3 24.9 22.2 16.5 25.6 21.7Youth Allowance (student) % 3.7 5.8 4.2 3.7 4.7 4.6 17.8 1.8 4.5Youth Allowance (other) % 0.9 0.9 1.5 1.7 1.4 1.7 1.3 1.6 1.2Austudy % 1.3 1.9 1.5 1.6 1.7 1.3 2.7 1.3 1.6Parenting Payment (Single) % 9.7 8.7 10.7 11.3 10.5 11.1 7.2 11.0 10.0Parenting Payment (Partnered) % 2.0 1.8 1.7 1.5 1.7 1.7 1.5 1.6 1.8FTB (only) % 14.2 14.8 15.2 14.5 12.2 8.4 22.4 20.2 14.4Other % 1.3 1.1 0.8 0.9 0.9 0.7 1.1 0.7 1.1
Proportion of Aboriginal and Torres Strait Islander CRA recipientsDisability Support Pension % 24.1 25.3 19.5 14.3 19.8 26.4 20.8 30.7 21.9Age Pension % 6.6 5.9 5.5 4.9 3.9 4.5 2.3 7.0 5.8Carer Payment % 7.4 6.3 5.6 3.8 5.4 7.3 3.1 2.9 6.2Newstart Allowance % 25.1 27.6 29.9 38.7 31.1 25.3 28.2 28.5 28.4Youth Allowance (student) % 0.7 1.3 0.8 0.6 1.5 1.3 4.5 0.2 0.8Youth Allowance (other) % 2.6 2.4 3.0 4.4 4.6 2.9 4.5 2.7 3.0Austudy % 0.2 0.6 0.2 0.1 0.4 – 0.8 0.1 0.2Parenting Payment (Single) % 20.8 17.4 20.5 21.4 19.8 17.2 12.1 14.2 20.1Parenting Payment (Partnered) % 2.3 2.1 2.9 2.2 2.8 3.8 2.0 1.6 2.5FTB (only) % 9.7 10.5 11.3 8.5 10.0 10.3 20.6 11.2 10.3Other % 0.6 0.6 0.9 1.0 0.7 1.0 1.1 0.7 0.7
(a)
CRA income units, by payment type, 2017 (a), (b), (c), (d), (e)
Includes income units paid CRA under the Social Security Act 1991 or under A New Tax System (Family Assistance) Act 1999 who were entitled to a daily rateof assistance at 30 June 2017.

TABLE GA.9
REPORT ONGOVERNMENTSERVICES 2018
HOUSING AND HOMELESSNESSSERVICES SECTOR OVERVIEW
PAGE 2 of TABLE GA.9
Table GA.9Type of income unit Unit NSW Vic Qld WA SA Tas ACT NT Aust
CRA income units, by payment type, 2017 (a), (b), (c), (d), (e)
(b)(c) Totals may not add due to rounding.(d)(e)
– Nil or rounded to zero. Source : Department of Social Services (unpublished).
Australian totals include people in other territories and people with unknown addresses.
Primary Payment Type is allocated to an income unit using a hierarchy of the payments received by the members of the income unit. CRA figures from 2014-15 are extracted from a new dataset built from the new Department of Human Services Enterprise Data Warehouse environment.While every effort has been made to replicate the old dataset, there are some small discrepancies due to differences between the old and new environments.Therefore data may not be strictly comparable with previous years.
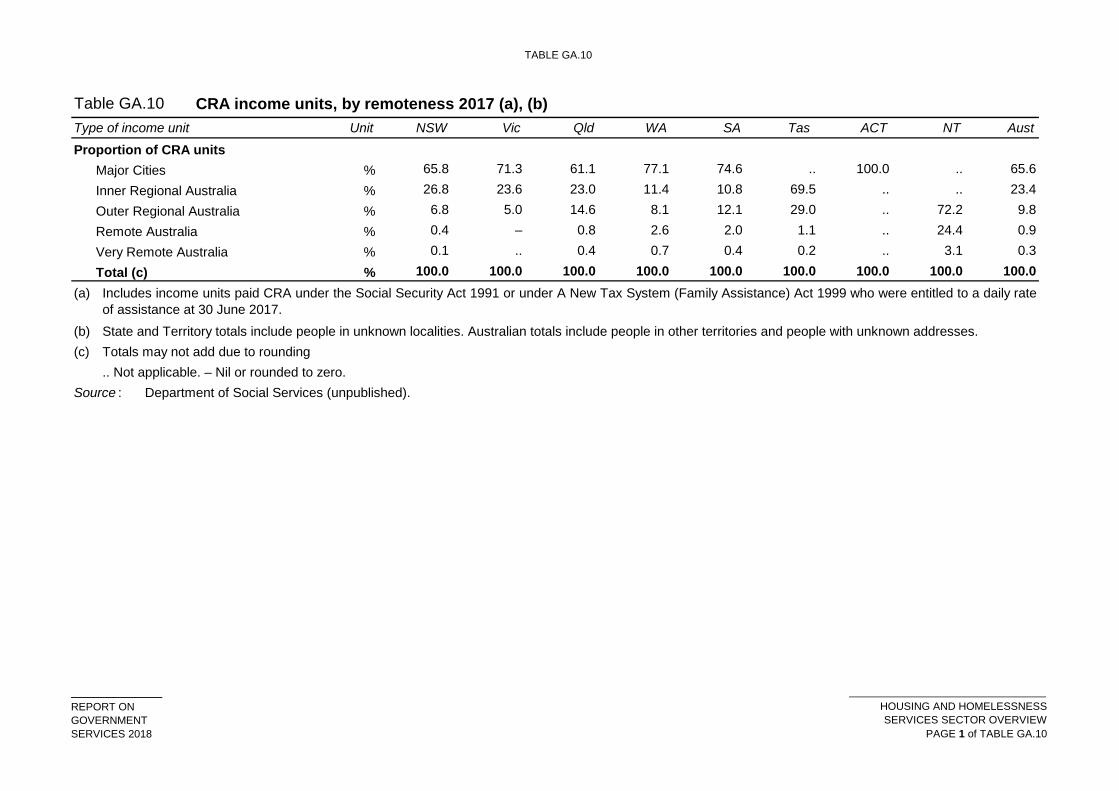
TABLE GA.10
REPORT ONGOVERNMENTSERVICES 2018
HOUSING AND HOMELESSNESSSERVICES SECTOR OVERVIEW
PAGE 1 of TABLE GA.10
Table GA.10Type of income unit Unit NSW Vic Qld WA SA Tas ACT NT Aust
Proportion of CRA unitsMajor Cities % 65.8 71.3 61.1 77.1 74.6 .. 100.0 .. 65.6Inner Regional Australia % 26.8 23.6 23.0 11.4 10.8 69.5 .. .. 23.4Outer Regional Australia % 6.8 5.0 14.6 8.1 12.1 29.0 .. 72.2 9.8Remote Australia % 0.4 – 0.8 2.6 2.0 1.1 .. 24.4 0.9Very Remote Australia % 0.1 .. 0.4 0.7 0.4 0.2 .. 3.1 0.3Total (c) % 100.0 100.0 100.0 100.0 100.0 100.0 100.0 100.0 100.0
(a)
(b)(c) Totals may not add due to rounding
.. Not applicable. – Nil or rounded to zero. Source : Department of Social Services (unpublished).
CRA income units, by remoteness 2017 (a), (b)
Includes income units paid CRA under the Social Security Act 1991 or under A New Tax System (Family Assistance) Act 1999 who were entitled to a daily rateof assistance at 30 June 2017.State and Territory totals include people in unknown localities. Australian totals include people in other territories and people with unknown addresses.

TABLE GA.11
REPORT ONGOVERNMENTSERVICES 2018
HOUSING AND HOMELESSNESSSERVICES SECTOR OVERVIEW
PAGE 1 of TABLE GA.11
Table GA.11 Income units receiving CRA, by special needs and geographic location, 2017 (a), (b), (c), (d)Unit NSW Vic Qld WA SA Tas ACT NT Aust (c)
Non-IndigenousIncome units no. 397 279 296 679 322 350 109 191 96 885 33 961 10 737 5 200 1 272 365
% 93.6 98.0 93.3 95.0 96.4 92.4 96.8 74.4 94.7
% 97.0 99.1 95.6 96.3 97.6 94.8 98.2 69.6 96.9
Aboriginal and Torres Strait Islander (e)Income units no. 27 362 6 159 23 231 5 697 3 662 2 808 355 1 789 71 067
% 6.4 2.0 6.7 5.0 3.6 7.6 3.2 25.6 5.3
% 3.0 0.9 4.4 3.7 2.4 5.2 1.8 30.4 3.1
Disability support pension (f)Income units no. 84 621 61 162 63 046 17 196 19 327 9 036 1 769 1 281 257 466
% 19.9 20.2 18.2 15.0 19.2 24.6 15.9 18.3 19.2
% 3.3 3.2 3.3 2.2 4.1 5.4 2.2 3.5 3.2
Aged 24 years or under (g)Income units no. 36 848 31 634 37 914 12 569 11 249 4 559 2 545 731 138 062
% 8.7 10.4 11.0 10.9 11.2 12.4 22.9 10.5 10.3
% 13.0 13.2 13.4 12.9 12.8 12.6 13.5 14.0 13.1
Aged 75 years or over (h)
Income units as proportion of all CRA recipient income units
Aboriginal and Torres Strait Islander population, as proportion of total population (June 2016)
Non-Indigenous population, as proportion of total population (June 2016)
This table has been changed since an earlier version of the Report. See errata at http://www.pc.gov.au/research/ongoing/report-on-government-services/2018/housing-and-homelessness.
Income units as proportion of all CRA recipient income units
Income units as proportion of all CRA recipient income units
Income units as proportion of all CRA recipient income unitsDisability Support Pension population, as proportion of total population (June 2016)
People aged 15–24 years, as proportion of total population (June 2016)

TABLE GA.11
REPORT ONGOVERNMENTSERVICES 2018
HOUSING AND HOMELESSNESSSERVICES SECTOR OVERVIEW
PAGE 2 of TABLE GA.11
Table GA.11 Income units receiving CRA, by special needs and geographic location, 2017 (a), (b), (c), (d)Unit NSW Vic Qld WA SA Tas ACT NT Aust (c)
This table has been changed since an earlier version of the Report. See errata at http://www.pc.gov.au/research/ongoing/report-on-government-services/2018/housing-and-homelessness.
Income units no. 44 677 27 324 32 714 11 336 9 609 3 402 650 354 130 079
% 10.5 9.0 9.5 9.9 9.6 9.3 5.9 5.1 9.7
% 7.1 6.7 6.1 5.7 8.0 7.9 5.1 2.1 6.6
Geographic locationCap city
Income units no. 224 716 208 438 155 121 90 910 77 559 15 461 11 092 5 046 788 300
% 52.9 68.8 44.9 79.1 77.1 42.0 100.0 72.2 58.7
Rest of State/Territory
no. 199 432 94 107 190 015 23 741 22 879 21 283 .. 1 926 553 390
% 47.0 31.1 55.0 20.7 22.8 57.9 .. 27.6 41.2
Total income units (c) no. 424 641 302 838 345 581 114 888 100 547 36 769 11 092 6 989 1 343 432
(a)
(b)
(c)(d)(e)(f)(g)(h)
Income units as proportion of all CRA recipient income units
Income units as proportion of all CRA recipient income units
Income units as proportion of all CRA recipient income unitsPeople aged 75 years or over, as proportion of total population (June 2016)
Income units
Includes income units paid CRA under the Social Security Act 1991 or under A New Tax System (Family Assistance) Act 1999 who were entitled to a daily rateof assistance at 30 June 2017.
State and Territory totals include unknown localities, Australian totals include other territories and unknown addresses.
Includes income units where one member was 75 years old or older at 30 June 2017.
Includes income units where one member was in recipient of Disability Support Pension at 30 June 2017.Includes income units where one member was 24 years old or younger at 30 June 2017.
Includes income units where one member has self-identified as Aboriginal or Torres Strait Islander. Totals may not add due to rounding.
CRA figures from 2014-15 are extracted from a new dataset built from the new Department of Human Services Enterprise Data Warehouse environment. Whileevery effort has been made to replicate the old dataset, there are some small discrepancies due to differences between the old and new environments.Therefore data may not be strictly comparable with previous years.

TABLE GA.11
REPORT ONGOVERNMENTSERVICES 2018
HOUSING AND HOMELESSNESSSERVICES SECTOR OVERVIEW
PAGE 3 of TABLE GA.11
Table GA.11 Income units receiving CRA, by special needs and geographic location, 2017 (a), (b), (c), (d)Unit NSW Vic Qld WA SA Tas ACT NT Aust (c)
This table has been changed since an earlier version of the Report. See errata at http://www.pc.gov.au/research/ongoing/report-on-government-services/2018/housing-and-homelessness.
.. Not applicable. DSS (Department of Social Services) (unpublished); ABS (Australian Bureau of Statistics) (2016) Australian Demographic Statistics, June 2016 , Cat. no.3101.0, Canberra; ABS (2014) Estimates and Projections, Aboriginal and Torres Strait Islander Australians, 2001 to 2026 , Cat. no. 3238.0; DSS DSS Demographics June 2016 , https://data.gov.au/dataset/cff2ae8a-55e4-47db-a66d-e177fe0ac6a0/resource/829fc910-e263-4a59-ad33-1cd1159ce0df/download/dss-demographics-june-2016.xlsx, accessed 7 February 2018.
Source :

TABLE GA.12
REPORT ONGOVERNMENTSERVICES 2018
HOUSING AND HOMELESSNESSSERVICES SECTOR OVERVIEW
PAGE 1 of TABLE GA.12
Table GA.12
NSW Vic Qld WA SA Tas ACT NT Aust 80.2 78.4 81.6 81.4 75.4 73.8 84.6 80.5 79.8 79.6 77.8 81.6 81.2 75.1 73.8 84.4 80.6 79.4 78.1 76.1 80.2 79.5 73.2 72.3 83.6 81.2 77.8 76.4 74.5 79.1 77.6 71.2 71.2 83.4 78.3 76.3 76.0 74.4 79.4 76.7 70.7 71.6 82.7 79.2 76.1
(a)
(b)
Includes income units paid CRA under the Social Security Act 1991 or under A New Tax System (Family Assistance) Act 1999 who were entitled to a daily rateof assistance at 30 June 2017.Some income units pay enough rent to be entitled to the maximum rate yet only receive a part rate of assistance because of an income test on the payment withwhich CRA is paid.
Source: Department of Social Services (unpublished).
2013
Income units receiving CRA paying enough rent to be eligible for maximum assistance, by jurisdiction, 2013 to2017 (per cent) (a), (b)
2017201620152014

TABLE GA.13
REPORT ONGOVERNMENTSERVICES 2018
HOUSING AND HOMELESSNESSSERVICES SECTOR OVERVIEW
PAGE 1 of TABLE GA.13
Table GA.13
NSW Vic Qld WA SA Tas ACT NT AustAll Income units
With CRA 44.1 39.5 41.3 46.4 35.8 29.6 48.0 43.5 41.6Without CRA 70.4 66.5 68.3 71.7 65.0 63.0 70.7 68.8 68.5
Aboriginal and Torres Strait Islander income units (c)With CRA 31.8 32.3 34.9 44.8 32.9 23.2 38.6 37.8 33.8Without CRA 65.0 64.3 65.2 73.5 64.4 57.4 64.6 68.1 65.4
Disability Support Pension income units (d)With CRA 34.1 31.1 33.3 36.3 28.8 23.7 28.1 33.4 32.5Without CRA 72.8 68.6 71.6 75.0 68.0 64.1 72.0 73.0 71.0
Income units which includes a member aged 24 years or under (e)With CRA 61.2 59.2 55.6 59.4 52.2 46.9 72.7 52.4 58.0Without CRA 80.9 79.5 77.1 79.9 76.2 73.9 86.6 73.6 78.9
Income units which includes a member aged 75 years or over (f)With CRA 27.8 27.3 31.3 25.7 20.6 21.5 33.0 29.9 27.7Without CRA 58.4 57.7 62.5 55.5 49.9 58.2 60.6 63.5 58.4
Income units by geographic locationCapital City
With CRA 51.5 43.7 43.3 49.0 39.5 35.4 48.0 46.8 46.0Without CRA 74.6 68.8 68.6 73.5 67.7 67.2 70.7 70.3 70.9
Rest of State/TerritoryWith CRA 35.7 30.1 39.7 36.4 23.3 25.3 .. 34.8 35.3Without CRA 65.7 61.2 68.1 64.6 55.9 60.0 .. 64.8 65.1
(a)
(b)
Proportion of income units receiving CRA, paying more than 30 per cent of income on rent, with and withoutCRA, by special needs, 2017 (per cent) (a), (b)
Includes income units paid CRA under the Social Security Act 1991 or under A New Tax System (Family Assistance) Act 1999 who were entitled to a daily rate of assistance at 30 June 2017. Excludes a small number of income units where income details are incomplete.Australian totals include other territories and unknown addresses.

TABLE GA.13
REPORT ONGOVERNMENTSERVICES 2018
HOUSING AND HOMELESSNESSSERVICES SECTOR OVERVIEW
PAGE 2 of TABLE GA.13
Table GA.13
NSW Vic Qld WA SA Tas ACT NT Aust
Proportion of income units receiving CRA, paying more than 30 per cent of income on rent, with and withoutCRA, by special needs, 2017 (per cent) (a), (b)
(c)
(d)(e)(f)
.. Not applicable. Source : Department of Social Services (unpublished).
Includes income units where one member has self-identified as Aboriginal or Torres Strait Islander. Some members of an income unit may also self-identify asSouth Sea Islander.Includes income units where one member was in recipient of Disability Support Pension at 30 June 2017.Includes income where one member was 24 years old or younger at 30 June 2017.Includes income where one member was 75 years old or older at 30 June 2017.

TABLE GA.14
REPORT ONGOVERNMENTSERVICES 2018
HOUSING AND HOMELESSNESSSERVICES SECTOR OVERVIEW
PAGE 1 of TABLE GA.14
Table GA.14
NSW Vic Qld WA SA Tas ACT NT AustAll income units
With CRA 15.3 12.4 12.2 15.5 9.3 6.0 21.9 15.3 13.2Without CRA 29.7 26.9 27.2 32.7 24.3 18.8 35.6 31.5 28.0
Aboriginal and Torres Strait Islander income units (c)With CRA 8.6 8.6 9.0 13.3 7.7 4.6 12.6 10.9 9.0Without CRA 21.3 22.1 22.9 33.0 22.4 14.1 28.0 26.9 22.8
Disability Support pension income units (d)With CRA 8.1 6.1 5.9 8.5 5.3 2.0 9.2 6.6 6.7Without CRA 20.9 18.4 19.1 23.8 17.3 11.8 17.9 24.0 19.5
Aged 24 years and under income units (e)With CRA 28.6 27.2 22.6 21.2 16.8 14.9 44.1 23.3 24.8Without CRA 49.1 47.8 43.5 45.7 39.4 35.2 64.6 43.1 45.9
Aged 75 years and over income units (f)With CRA 7.3 6.5 6.2 6.9 3.8 2.9 9.4 8.5 6.4Without CRA 15.8 15.3 17.0 15.5 10.9 10.6 19.8 16.8 15.5
Income units by geographic locationCapital City
With CRA 20.4 14.9 13.1 17.0 10.9 8.0 21.9 17.1 16.0Without CRA 35.1 30.1 28.6 34.8 26.9 22.5 35.6 34.0 31.4
Rest of State/TerritoryWith CRA 9.5 6.8 11.5 9.9 3.9 4.5 .. 10.4 9.3Without CRA 23.5 19.7 26.1 24.8 15.5 16.0 .. 25.1 23.2
(a)
(b)
Proportion of income units receiving CRA with more than 50 per cent of income spent on rent, with and without CRA, by special needs, 2017 (per cent) (a), (b)
Includes income units paid CRA under the Social Security Act 1991 or under A New Tax System (Family Assistance) Act 1999 who were entitled to a dailyrate of assistance at 30 June 2017. Excludes a small number of income units where income details are incomplete.Australian totals include other territories and unknown addresses.

TABLE GA.14
REPORT ONGOVERNMENTSERVICES 2018
HOUSING AND HOMELESSNESSSERVICES SECTOR OVERVIEW
PAGE 2 of TABLE GA.14
Table GA.14
NSW Vic Qld WA SA Tas ACT NT Aust
Proportion of income units receiving CRA with more than 50 per cent of income spent on rent, with and without CRA, by special needs, 2017 (per cent) (a), (b)
(c)
(d)(e)(f)
.. Not applicable. Source : Department of Social Services (unpublished).
Includes income units where one member was in recipient of Disability Support Pension at 30 June 2017.Includes income where one member was 24 years old or younger at 30 June 2017.Includes income where one member was 75 years old or older at 30 June 2017.
Includes income units where one member has self-identified as Aboriginal or Torres Strait Islander. Some members of an income unit may also self-identifyas South Sea Islander.

TABLE GA.15
REPORT ONGOVERNMENTSERVICES 2018
HOUSING AND HOMELESSNESSSERVICES SECTOR OVERVIEW
PAGE 1 of TABLE GA.15
2007–08 2009–10 2011–12 2013-14 2015-16Proportion of households, by tenure type:Home owners/purchasers 68.3 68.8 67.4 67.2 67.5Renters
Private rental 23.9 23.7 25.1 25.7 25.3Public housing (a) 4.5 3.9 3.9 3.6 3.5Total renters (b) 29.7 28.7 30.3 31.0 30.3
All households (c) 100.0 100.0 100.0 100.0 100.0(a)(b)(c)
Table GA.15 Housing composition by tenure type (per cent)
Source :
Includes 'other' landlord type, which accounts for less than 2 per cent of all renters.Includes 'other' tenure types, which accounts for less than 3 per cent of all households.
ABS Housing Occupancy and Costs, Australia, 2015–16 ; ABS Household Income and Wealth,2013–14, Canberra.
Includes all households renting from a State or Territory housing authority.

TABLE GA.16
REPORT ONGOVERNMENTSERVICES 2018
HOUSING AND HOMELESSNESSSERVICES SECTOR OVERVIEW
PAGE 1 of TABLE GA.16
NSW Vic Qld WA SA Tas ACT NT (b), (c) Aust2015-16 3.9 2.2 3.2 3.1 6.2 4.4 6.1 5.4 3.52013-14 3.7 2.6 3.4 3.1 5.9 4.1 7.1 6.4 3.62011-12 4.7 2.8 2.7 3.8 5.7 5.6 7.5 8.1 3.9
3.9 2.5 3.7 4.7 6.4 5.6 6.4 7.8 3.9 5.0 3.6 2.8 4.3 7.7 6.9 8.5 10.9 4.5
(a)(b)
(c) Estimates for the NT for 2007–08, 2009–10 and 2015–16 have relative standard errors of 25 per cent to50 per cent and should be used with caution.
Source : ABS Housing Occupancy and Costs, Australia, 2015–16; ABS Household Income and Wealth,2013–14, Canberra.
Data for the NT should be interpreted with caution as the SIH excludes very remote areas, which comprisearound 23 per cent of the estimated resident population of the NT.
Table GA.16 Households residing in public housing (per cent) (a)
2009-102007-08
Includes all households renting from a State or Territory housing authority.

TABLE GA.17
REPORT ONGOVERNMENTSERVICES 2018
HOUSING AND HOMELESSNESSSERVICES SECTOR OVERVIEW
PAGE 1 of TABLE GA.17
NSW Vic Qld WA SA Tas ACT NT Aust 0.7 0.5 0.5 0.5 1.1 1.0 0.5 2.1 0.6 0.7 0.5 0.6 0.7 1.1 0.8 0.5 2.9 0.7
(a)
(b)
(c)Source : ABS (unpublished) 2016 Census of Population and Housing, 2011 Census of Population and
Housing, table generated on 13/12/2017 using ABS TableBuilder.
2016
Table GA.17 Households residing in community housing (per cent) (a), (b), (c)
Cells in this table have been randomly adjusted to avoid the release of confidential data. Data for 2011have been revised and may differ from previous Reports.Households in dwellings rented from a housing co-operative, community or church group.
2011
Excludes households with tenure type not stated, rental households with landlord type not stated anddwellings with tenure type not applicable.