SECTOR IN-DEPTH Arrears Rising in All Australian · PDF fileMortgage Delinquency Map: Home...
19
STRUCTURED FINANCE SECTOR IN-DEPTH 6 April 2017 Contacts Alena Chen 612-9270-8131 Vice President [email protected] RMBS - Australia Mortgage Delinquency Map: Home Loan Arrears Rising in All Australian States Summary » Delinquencies increased Australia-wide: The proportion of Australian residential mortgages that were more than 30 days in arrears (30+ delinquency rate) increased to 1.52% in November 2016 from 1.20% in November 2015. Mortgage delinquencies increased in all eight Australian states and territories over the year to November 2016, hitting record highs in Western Australia, South Australia and the Northern Territory. A significant portion of the increase in delinquencies can be attributed to the inclusion of loans under hardship arrangements in the calculation of delinquency rates, but delinquencies increased irrespective of this development. » Delinquencies highest in Western Australia, lowest in NSW and ACT: Western Australia had the highest 30+ delinquency rate of any state or territory in Australia. The Western Australian economy is heavily reliant on the resources sector and growth has slowed since the end of the mining boom. The Australian Capital Territory (ACT) had the lowest 30+ delinquency rate. Mortgage performance in New South Wales (NSW) was also relatively strong, despite an increase in delinquencies over the year to November 2016. Over the four years to November 2016, delinquencies in NSW have fallen notably, a decline that has coincided with the run-up in home prices in Sydney. » Mining regions dominate worst performing areas, Sydney suburbs top best- performing list: Regions in Western Australia and Queensland with exposure to the resource and mining sectors dominated the list of areas with the highest delinquencies. Suburbs in Sydney — where housing market and economic conditions were the most supportive for mortgage borrowers — topped the list of best-performing areas. » Delinquencies will continue to increase: We expect mortgage delinquencies to continue to increase over 2017. Weaker conditions in states reliant on the mining industry, high underemployment, and less favourable housing and income dynamics will drive delinquencies higher. Our semi-annual delinquency map report provides a detailed analysis of the rate of residential mortgage arrears at a national, regional and postcode level in Australia. The report is based on the data contained in our supplementary excel report, titled “Australian Residential Mortgage Delinquency Map – November 2016 ” published on 6 April 2017.
Transcript of SECTOR IN-DEPTH Arrears Rising in All Australian · PDF fileMortgage Delinquency Map: Home...
STRUCTURED FINANCE
SECTOR IN-DEPTH6 April 2017
Contacts
Alena Chen 612-9270-8131Vice [email protected]
RMBS - Australia
Mortgage Delinquency Map: Home LoanArrears Rising in All Australian StatesSummary
» Delinquencies increased Australia-wide: The proportion of Australian residentialmortgages that were more than 30 days in arrears (30+ delinquency rate) increasedto 1.52% in November 2016 from 1.20% in November 2015. Mortgage delinquenciesincreased in all eight Australian states and territories over the year to November 2016,hitting record highs in Western Australia, South Australia and the Northern Territory.A significant portion of the increase in delinquencies can be attributed to the inclusionof loans under hardship arrangements in the calculation of delinquency rates, butdelinquencies increased irrespective of this development.
» Delinquencies highest in Western Australia, lowest in NSW and ACT: WesternAustralia had the highest 30+ delinquency rate of any state or territory in Australia. TheWestern Australian economy is heavily reliant on the resources sector and growth hasslowed since the end of the mining boom. The Australian Capital Territory (ACT) had thelowest 30+ delinquency rate. Mortgage performance in New South Wales (NSW) wasalso relatively strong, despite an increase in delinquencies over the year to November2016. Over the four years to November 2016, delinquencies in NSW have fallen notably,a decline that has coincided with the run-up in home prices in Sydney.
» Mining regions dominate worst performing areas, Sydney suburbs top best-performing list: Regions in Western Australia and Queensland with exposure to theresource and mining sectors dominated the list of areas with the highest delinquencies.Suburbs in Sydney — where housing market and economic conditions were the mostsupportive for mortgage borrowers — topped the list of best-performing areas.
» Delinquencies will continue to increase: We expect mortgage delinquencies tocontinue to increase over 2017. Weaker conditions in states reliant on the miningindustry, high underemployment, and less favourable housing and income dynamics willdrive delinquencies higher.
Our semi-annual delinquency map report provides a detailed analysis of the rate of residentialmortgage arrears at a national, regional and postcode level in Australia. The report is based onthe data contained in our supplementary excel report, titled “Australian Residential MortgageDelinquency Map – November 2016” published on 6 April 2017.
MOODY'S INVESTORS SERVICE STRUCTURED FINANCE
NATIONAL PERFORMANCEDelinquencies increased Australia-wideThe proportion of Australian residential mortgages that were more than 30 days in arrears increased to 1.52% in November 2016 from1.20% in November 2015. 1 Higher delinquencies raise the risk of mortgage defaults and are therefore credit negative for Australianresidential mortgage-backed securities (RMBS).
Mortgage delinquencies increased in all eight Australian states and territories over the year to November 2016, hitting record highs inWestern Australia, South Australia and the Northern Territory (Exhibit 1).
A significant portion of the increase in delinquencies can be attributed to the inclusion of loans under hardship arrangements - loanswhere repayments are temporarily postponed or reduced - in the calculation of delinquency rates by some lenders (see highlight box).However, delinquencies increased irrespective of this development.
Exhibit 1
30+ Delinquency Rate for Australian States and Territories
State/Territory 2010 2011 2012 Nov-13 Nov-14 Nov-15 Nov-16
Nov-16 - Nov-15
Change (% pts)
Western Australia 1.44% 2.14% 1.82% 1.38% 1.23% 1.71% 2.76% 1.05
Northern Territory 0.56% 0.94% 0.75% 0.88% 0.49% 0.98% 2.23% 1.25
South Australia 0.97% 1.42% 1.58% 1.43% 1.54% 1.63% 2.16% 0.53
Tasmania 1.05% 1.60% 1.44% 1.17% 1.12% 1.68% 1.84% 0.16
Queensland 1.30% 2.17% 1.98% 1.36% 1.41% 1.37% 1.75% 0.38
Victoria 1.05% 1.43% 1.51% 1.10% 1.18% 1.19% 1.43% 0.24
New South Wales 1.62% 2.02% 1.99% 1.24% 1.02% 0.85% 0.94% 0.09
Australian Capital Territory 0.57% 1.00% 0.83% 0.68% 0.76% 0.82% 0.91% 0.09
Australia 1.33% 1.87% 1.81% 1.24% 1.19% 1.20% 1.52% 0.32
Source: Moody's Investors Service; periodic investor/servicer reports
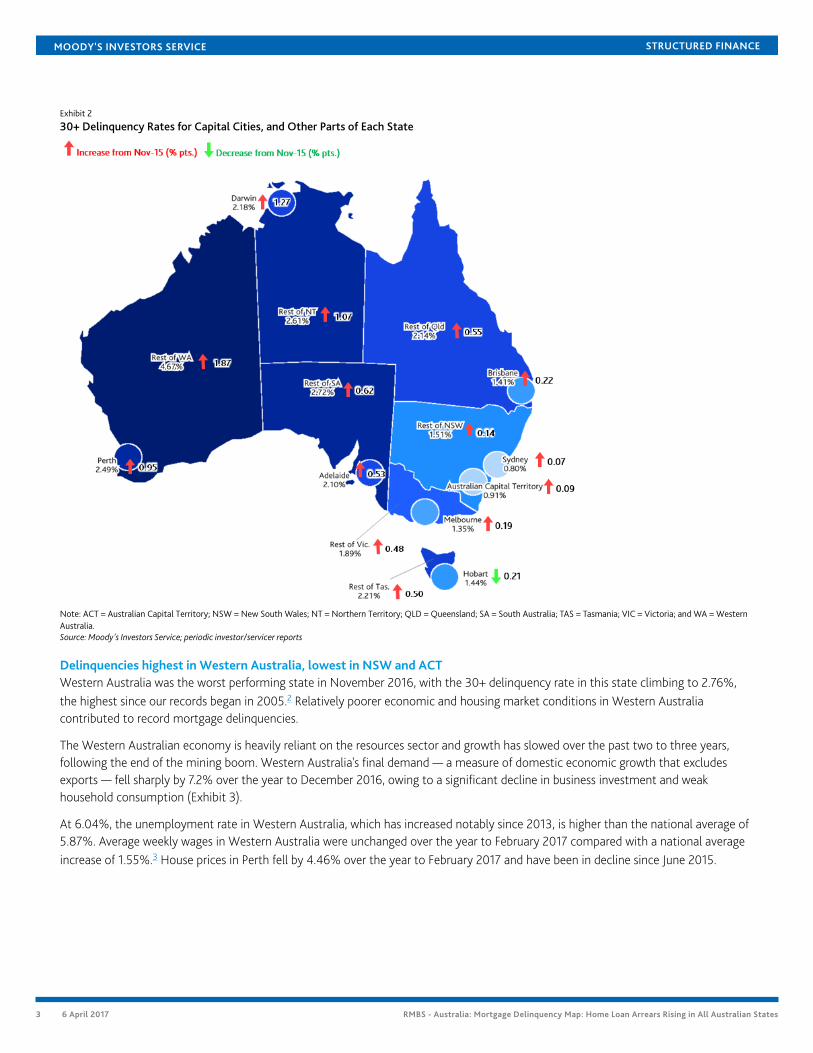
In each state and territory, delinquency rates were lower in capital cities than other regions, reflecting the higher levels of economicdiversity and employment stability in city areas (Exhibit 2).
This publication does not announce a credit rating action. For any credit ratings referenced in this publication, please see the ratings tab on the issuer/entity page onwww.moodys.com for the most updated credit rating action information and rating history.
2 6 April 2017 RMBS - Australia: Mortgage Delinquency Map: Home Loan Arrears Rising in All Australian States
MOODY'S INVESTORS SERVICE STRUCTURED FINANCE
Exhibit 2
30+ Delinquency Rates for Capital Cities, and Other Parts of Each State
Note: ACT = Australian Capital Territory; NSW = New South Wales; NT = Northern Territory; QLD = Queensland; SA = South Australia; TAS = Tasmania; VIC = Victoria; and WA = WesternAustralia.Source: Moody's Investors Service; periodic investor/servicer reports
Delinquencies highest in Western Australia, lowest in NSW and ACTWestern Australia was the worst performing state in November 2016, with the 30+ delinquency rate in this state climbing to 2.76%,the highest since our records began in 2005.2 Relatively poorer economic and housing market conditions in Western Australiacontributed to record mortgage delinquencies.
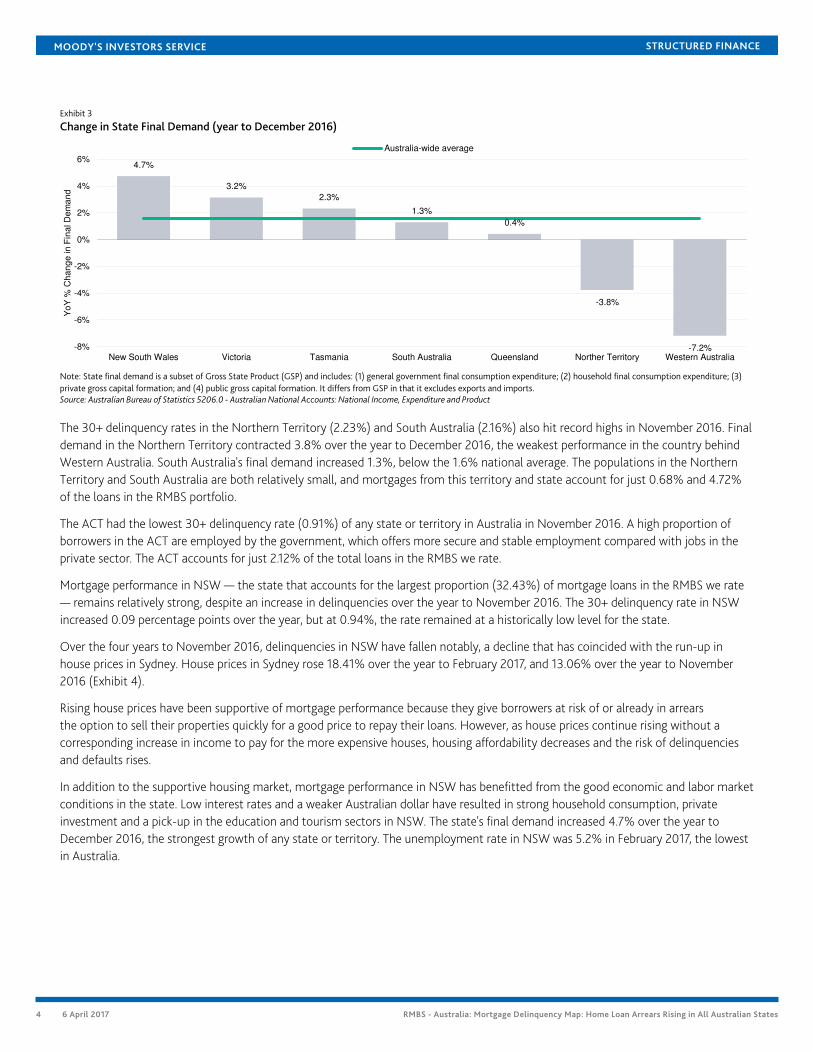
The Western Australian economy is heavily reliant on the resources sector and growth has slowed over the past two to three years,following the end of the mining boom. Western Australia's final demand — a measure of domestic economic growth that excludesexports — fell sharply by 7.2% over the year to December 2016, owing to a significant decline in business investment and weakhousehold consumption (Exhibit 3).
At 6.04%, the unemployment rate in Western Australia, which has increased notably since 2013, is higher than the national average of5.87%. Average weekly wages in Western Australia were unchanged over the year to February 2017 compared with a national averageincrease of 1.55%.3 House prices in Perth fell by 4.46% over the year to February 2017 and have been in decline since June 2015.
3 6 April 2017 RMBS - Australia: Mortgage Delinquency Map: Home Loan Arrears Rising in All Australian States
MOODY'S INVESTORS SERVICE STRUCTURED FINANCE
Exhibit 3
Change in State Final Demand (year to December 2016)
4.7%
3.2%
2.3%
1.3%
0.4%
-3.8%
-7.2%-8%
-6%
-4%
-2%
0%
2%
4%
6%
New South Wales Victoria Tasmania South Australia Queensland Norther Territory Western Australia
Yo
Y %
Ch
an
ge
in
Fin
al D
em
an
d
Australia-wide average
Note: State final demand is a subset of Gross State Product (GSP) and includes: (1) general government final consumption expenditure; (2) household final consumption expenditure; (3)private gross capital formation; and (4) public gross capital formation. It differs from GSP in that it excludes exports and imports.Source: Australian Bureau of Statistics 5206.0 - Australian National Accounts: National Income, Expenditure and Product
The 30+ delinquency rates in the Northern Territory (2.23%) and South Australia (2.16%) also hit record highs in November 2016. Finaldemand in the Northern Territory contracted 3.8% over the year to December 2016, the weakest performance in the country behindWestern Australia. South Australia's final demand increased 1.3%, below the 1.6% national average. The populations in the NorthernTerritory and South Australia are both relatively small, and mortgages from this territory and state account for just 0.68% and 4.72%of the loans in the RMBS portfolio.
The ACT had the lowest 30+ delinquency rate (0.91%) of any state or territory in Australia in November 2016. A high proportion ofborrowers in the ACT are employed by the government, which offers more secure and stable employment compared with jobs in theprivate sector. The ACT accounts for just 2.12% of the total loans in the RMBS we rate.
Mortgage performance in NSW — the state that accounts for the largest proportion (32.43%) of mortgage loans in the RMBS we rate— remains relatively strong, despite an increase in delinquencies over the year to November 2016. The 30+ delinquency rate in NSWincreased 0.09 percentage points over the year, but at 0.94%, the rate remained at a historically low level for the state.
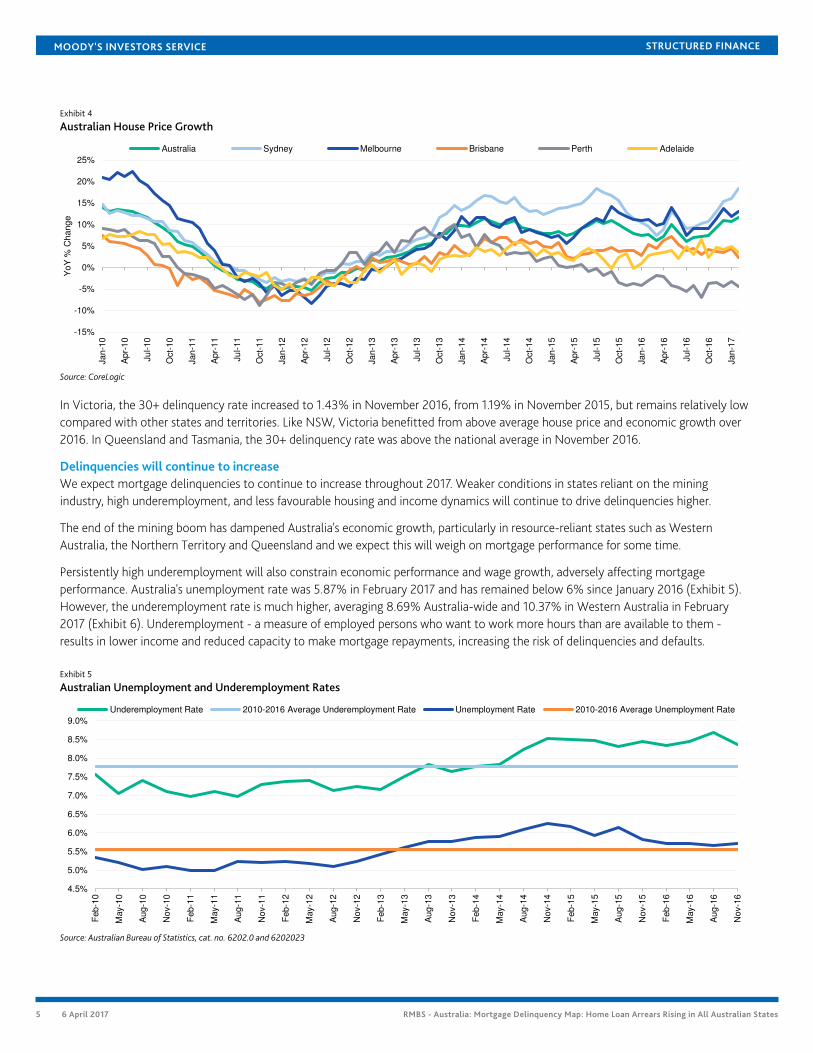
Over the four years to November 2016, delinquencies in NSW have fallen notably, a decline that has coincided with the run-up inhouse prices in Sydney. House prices in Sydney rose 18.41% over the year to February 2017, and 13.06% over the year to November2016 (Exhibit 4).
Rising house prices have been supportive of mortgage performance because they give borrowers at risk of or already in arrearsthe option to sell their properties quickly for a good price to repay their loans. However, as house prices continue rising without acorresponding increase in income to pay for the more expensive houses, housing affordability decreases and the risk of delinquenciesand defaults rises.
In addition to the supportive housing market, mortgage performance in NSW has benefitted from the good economic and labor marketconditions in the state. Low interest rates and a weaker Australian dollar have resulted in strong household consumption, privateinvestment and a pick-up in the education and tourism sectors in NSW. The state's final demand increased 4.7% over the year toDecember 2016, the strongest growth of any state or territory. The unemployment rate in NSW was 5.2% in February 2017, the lowestin Australia.
4 6 April 2017 RMBS - Australia: Mortgage Delinquency Map: Home Loan Arrears Rising in All Australian States
MOODY'S INVESTORS SERVICE STRUCTURED FINANCE
Exhibit 4
Australian House Price Growth
-15%
-10%
-5%
0%
5%
10%
15%
20%
25%
Ja
n-1
0
Ap
r-1
0
Ju
l-10
Oct-
10
Ja
n-1
1
Ap
r-1
1
Ju
l-11
Oct-
11
Ja
n-1
2
Ap
r-1
2
Ju
l-12
Oct-
12
Ja
n-1
3
Ap
r-1
3
Ju
l-13
Oct-
13
Ja
n-1
4
Ap
r-1
4
Ju
l-14
Oct-
14
Ja
n-1
5
Ap
r-1
5
Ju
l-15
Oct-
15
Ja
n-1
6
Ap
r-1
6
Ju
l-16
Oct-
16
Ja
n-1
7
Yo
Y %
Ch
an
ge
Australia Sydney Melbourne Brisbane Perth Adelaide
Source: CoreLogic
In Victoria, the 30+ delinquency rate increased to 1.43% in November 2016, from 1.19% in November 2015, but remains relatively lowcompared with other states and territories. Like NSW, Victoria benefitted from above average house price and economic growth over2016. In Queensland and Tasmania, the 30+ delinquency rate was above the national average in November 2016.
Delinquencies will continue to increaseWe expect mortgage delinquencies to continue to increase throughout 2017. Weaker conditions in states reliant on the miningindustry, high underemployment, and less favourable housing and income dynamics will continue to drive delinquencies higher.
The end of the mining boom has dampened Australia's economic growth, particularly in resource-reliant states such as WesternAustralia, the Northern Territory and Queensland and we expect this will weigh on mortgage performance for some time.
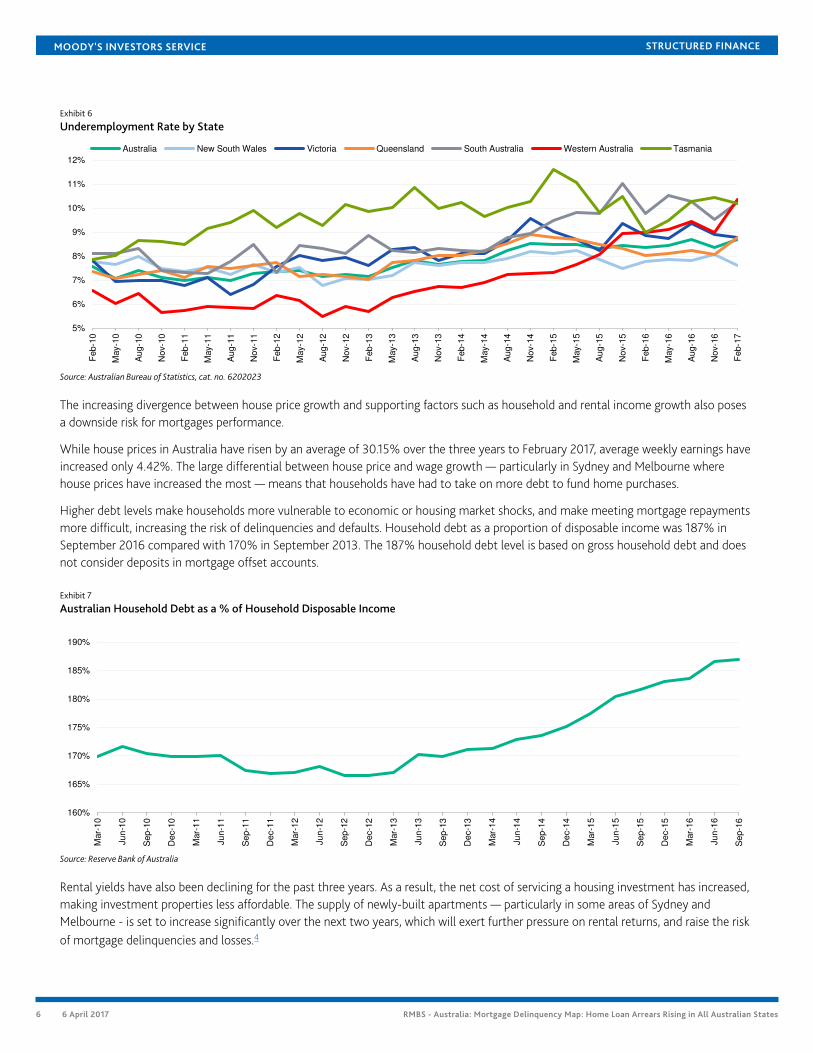
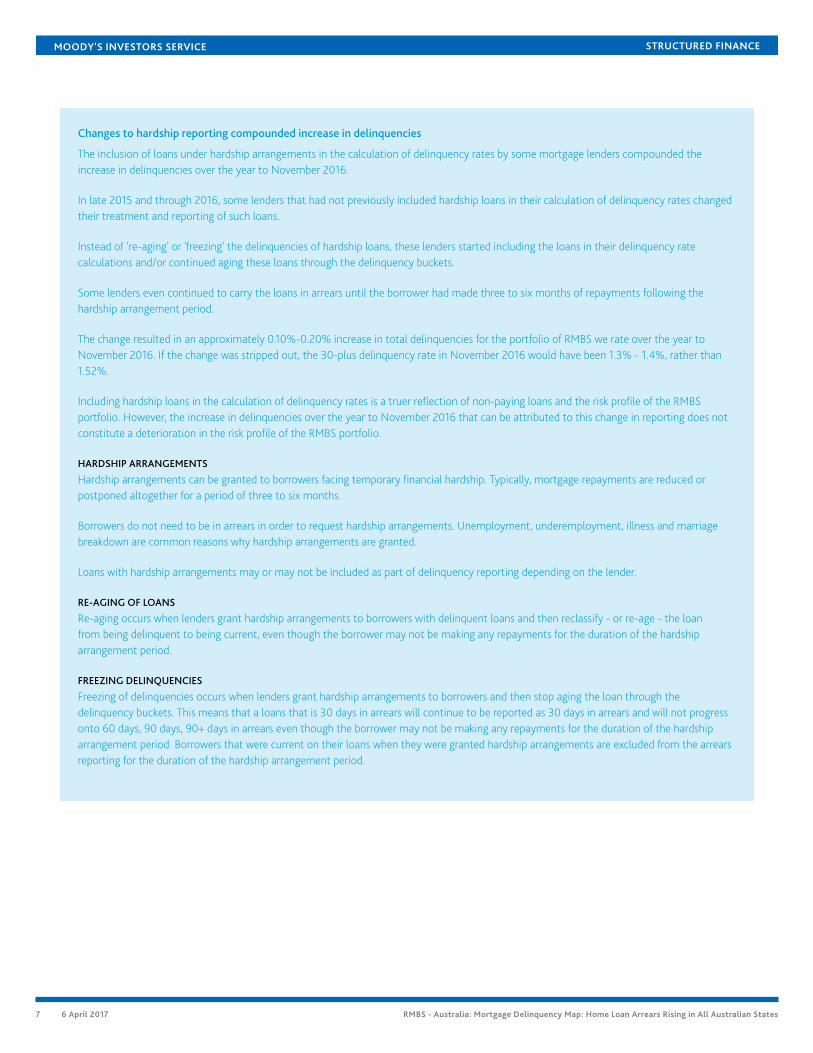
Persistently high underemployment will also constrain economic performance and wage growth, adversely affecting mortgageperformance. Australia's unemployment rate was 5.87% in February 2017 and has remained below 6% since January 2016 (Exhibit 5).However, the underemployment rate is much higher, averaging 8.69% Australia-wide and 10.37% in Western Australia in February2017 (Exhibit 6). Underemployment - a measure of employed persons who want to work more hours than are available to them -results in lower income and reduced capacity to make mortgage repayments, increasing the risk of delinquencies and defaults.
Exhibit 5
Australian Unemployment and Underemployment Rates
4.5%
5.0%
5.5%
6.0%
6.5%
7.0%
7.5%
8.0%
8.5%
9.0%
Feb
-10
May-1
0
Au
g-1
0
No
v-1
0
Feb
-11
May-1
1
Au
g-1
1
No
v-1
1
Feb
-12
May-1
2
Au
g-1
2
No
v-1
2
Feb
-13
May-1
3
Au
g-1
3
No
v-1
3
Feb
-14
May-1
4
Au
g-1
4
No
v-1
4
Feb
-15
May-1
5
Au
g-1
5
No
v-1
5
Feb
-16
May-1
6
Au
g-1
6
No
v-1
6
Underemployment Rate 2010-2016 Average Underemployment Rate Unemployment Rate 2010-2016 Average Unemployment Rate
Source: Australian Bureau of Statistics, cat. no. 6202.0 and 6202023
5 6 April 2017 RMBS - Australia: Mortgage Delinquency Map: Home Loan Arrears Rising in All Australian States
MOODY'S INVESTORS SERVICE STRUCTURED FINANCE
Exhibit 6
Underemployment Rate by State
5%
6%
7%
8%
9%
10%
11%
12%
Feb
-10
May-1
0
Au
g-1
0
No
v-1
0
Feb
-11
May-1
1
Au
g-1
1
No
v-1
1
Feb
-12
May-1
2
Au
g-1
2
No
v-1
2
Feb
-13
May-1
3
Au
g-1
3
No
v-1
3
Feb
-14
May-1
4
Au
g-1
4
No
v-1
4
Feb
-15
May-1
5
Au
g-1
5
No
v-1
5
Feb
-16
May-1
6
Au
g-1
6
No
v-1
6
Feb
-17
Australia New South Wales Victoria Queensland South Australia Western Australia Tasmania
Source: Australian Bureau of Statistics, cat. no. 6202023
The increasing divergence between house price growth and supporting factors such as household and rental income growth also posesa downside risk for mortgages performance.
While house prices in Australia have risen by an average of 30.15% over the three years to February 2017, average weekly earnings haveincreased only 4.42%. The large differential between house price and wage growth — particularly in Sydney and Melbourne wherehouse prices have increased the most — means that households have had to take on more debt to fund home purchases.
Higher debt levels make households more vulnerable to economic or housing market shocks, and make meeting mortgage repaymentsmore difficult, increasing the risk of delinquencies and defaults. Household debt as a proportion of disposable income was 187% inSeptember 2016 compared with 170% in September 2013. The 187% household debt level is based on gross household debt and doesnot consider deposits in mortgage offset accounts.
Exhibit 7
Australian Household Debt as a % of Household Disposable Income
160%
165%
170%
175%
180%
185%
190%
Mar-
10
Ju
n-1
0
Se
p-1
0
De
c-1
0
Mar-
11
Ju
n-1
1
Se
p-1
1
Dec-1
1
Mar-
12
Ju
n-1
2
Se
p-1
2
Dec-1
2
Mar-
13
Ju
n-1
3
Se
p-1
3
De
c-1
3
Mar-
14
Ju
n-1
4
Se
p-1
4
Dec-1
4
Mar-
15
Ju
n-1
5
Se
p-1
5
De
c-1
5
Mar-
16
Ju
n-1
6
Se
p-1
6
Source: Reserve Bank of Australia
Rental yields have also been declining for the past three years. As a result, the net cost of servicing a housing investment has increased,making investment properties less affordable. The supply of newly-built apartments — particularly in some areas of Sydney andMelbourne - is set to increase significantly over the next two years, which will exert further pressure on rental returns, and raise the riskof mortgage delinquencies and losses.4
6 6 April 2017 RMBS - Australia: Mortgage Delinquency Map: Home Loan Arrears Rising in All Australian States
MOODY'S INVESTORS SERVICE STRUCTURED FINANCE
Changes to hardship reporting compounded increase in delinquencies
The inclusion of loans under hardship arrangements in the calculation of delinquency rates by some mortgage lenders compounded theincrease in delinquencies over the year to November 2016.
In late 2015 and through 2016, some lenders that had not previously included hardship loans in their calculation of delinquency rates changedtheir treatment and reporting of such loans.
Instead of 're-aging' or 'freezing' the delinquencies of hardship loans, these lenders started including the loans in their delinquency ratecalculations and/or continued aging these loans through the delinquency buckets.
Some lenders even continued to carry the loans in arrears until the borrower had made three to six months of repayments following thehardship arrangement period.
The change resulted in an approximately 0.10%-0.20% increase in total delinquencies for the portfolio of RMBS we rate over the year toNovember 2016. If the change was stripped out, the 30-plus delinquency rate in November 2016 would have been 1.3% - 1.4%, rather than1.52%.
Including hardship loans in the calculation of delinquency rates is a truer reflection of non-paying loans and the risk profile of the RMBSportfolio. However, the increase in delinquencies over the year to November 2016 that can be attributed to this change in reporting does notconstitute a deterioration in the risk profile of the RMBS portfolio.
HARDSHIP ARRANGEMENTS
Hardship arrangements can be granted to borrowers facing temporary financial hardship. Typically, mortgage repayments are reduced orpostponed altogether for a period of three to six months.
Borrowers do not need to be in arrears in order to request hardship arrangements. Unemployment, underemployment, illness and marriagebreakdown are common reasons why hardship arrangements are granted.
Loans with hardship arrangements may or may not be included as part of delinquency reporting depending on the lender.
RE-AGING OF LOANS
Re-aging occurs when lenders grant hardship arrangements to borrowers with delinquent loans and then reclassify - or re-age - the loanfrom being delinquent to being current, even though the borrower may not be making any repayments for the duration of the hardshiparrangement period.
FREEZING DELINQUENCIES
Freezing of delinquencies occurs when lenders grant hardship arrangements to borrowers and then stop aging the loan through thedelinquency buckets. This means that a loans that is 30 days in arrears will continue to be reported as 30 days in arrears and will not progressonto 60 days, 90 days, 90+ days in arrears even though the borrower may not be making any repayments for the duration of the hardshiparrangement period. Borrowers that were current on their loans when they were granted hardship arrangements are excluded from the arrearsreporting for the duration of the hardship arrangement period.
7 6 April 2017 RMBS - Australia: Mortgage Delinquency Map: Home Loan Arrears Rising in All Australian States
MOODY'S INVESTORS SERVICE STRUCTURED FINANCE
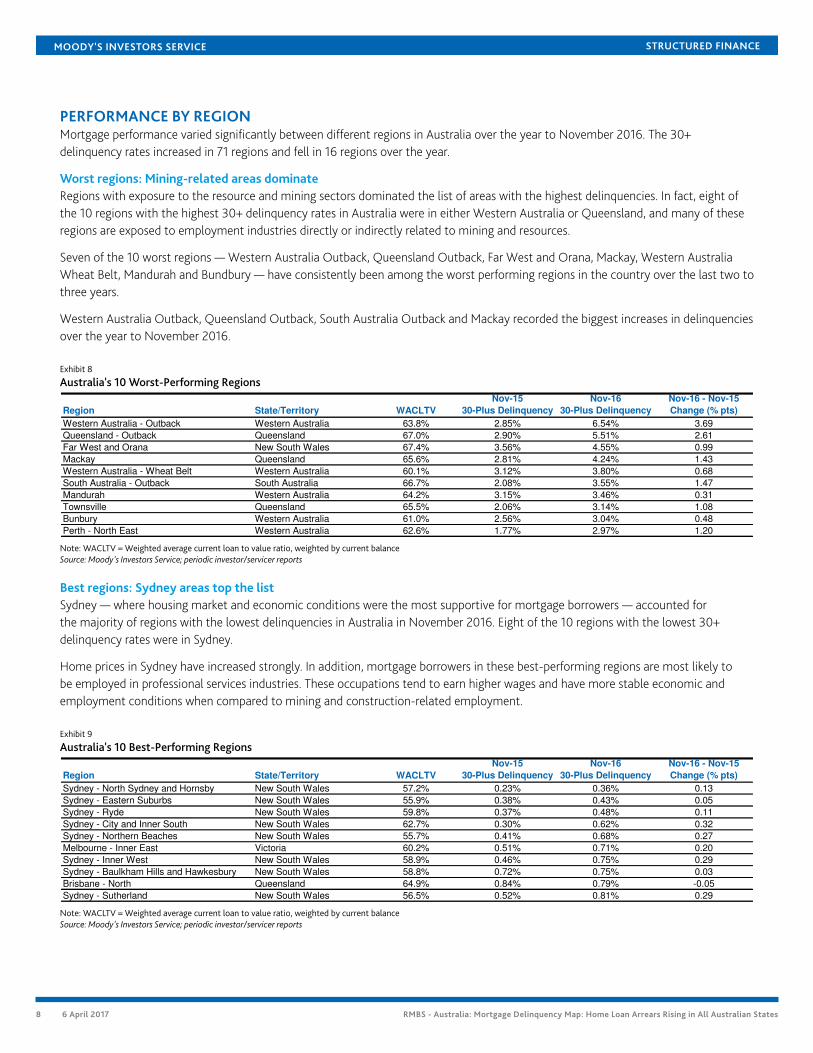
PERFORMANCE BY REGIONMortgage performance varied significantly between different regions in Australia over the year to November 2016. The 30+delinquency rates increased in 71 regions and fell in 16 regions over the year.
Worst regions: Mining-related areas dominateRegions with exposure to the resource and mining sectors dominated the list of areas with the highest delinquencies. In fact, eight ofthe 10 regions with the highest 30+ delinquency rates in Australia were in either Western Australia or Queensland, and many of theseregions are exposed to employment industries directly or indirectly related to mining and resources.
Seven of the 10 worst regions — Western Australia Outback, Queensland Outback, Far West and Orana, Mackay, Western AustraliaWheat Belt, Mandurah and Bundbury — have consistently been among the worst performing regions in the country over the last two tothree years.
Western Australia Outback, Queensland Outback, South Australia Outback and Mackay recorded the biggest increases in delinquenciesover the year to November 2016.
Exhibit 8
Australia's 10 Worst-Performing Regions
Region State/Territory WACLTV
Nov-15
30-Plus Delinquency
Nov-16
30-Plus Delinquency
Nov-16 - Nov-15
Change (% pts)
Western Australia - Outback Western Australia 63.8% 2.85% 6.54% 3.69
Queensland - Outback Queensland 67.0% 2.90% 5.51% 2.61
Far West and Orana New South Wales 67.4% 3.56% 4.55% 0.99
Mackay Queensland 65.6% 2.81% 4.24% 1.43
Western Australia - Wheat Belt Western Australia 60.1% 3.12% 3.80% 0.68
South Australia - Outback South Australia 66.7% 2.08% 3.55% 1.47
Mandurah Western Australia 64.2% 3.15% 3.46% 0.31
Townsville Queensland 65.5% 2.06% 3.14% 1.08
Bunbury Western Australia 61.0% 2.56% 3.04% 0.48
Perth - North East Western Australia 62.6% 1.77% 2.97% 1.20
Note: WACLTV = Weighted average current loan to value ratio, weighted by current balanceSource: Moody's Investors Service; periodic investor/servicer reports
Best regions: Sydney areas top the listSydney — where housing market and economic conditions were the most supportive for mortgage borrowers — accounted forthe majority of regions with the lowest delinquencies in Australia in November 2016. Eight of the 10 regions with the lowest 30+delinquency rates were in Sydney.
Home prices in Sydney have increased strongly. In addition, mortgage borrowers in these best-performing regions are most likely tobe employed in professional services industries. These occupations tend to earn higher wages and have more stable economic andemployment conditions when compared to mining and construction-related employment.
Exhibit 9
Australia's 10 Best-Performing Regions
Region State/Territory WACLTV
Nov-15
30-Plus Delinquency
Nov-16
30-Plus Delinquency
Nov-16 - Nov-15
Change (% pts)
Sydney - North Sydney and Hornsby New South Wales 57.2% 0.23% 0.36% 0.13
Sydney - Eastern Suburbs New South Wales 55.9% 0.38% 0.43% 0.05
Sydney - Ryde New South Wales 59.8% 0.37% 0.48% 0.11
Sydney - City and Inner South New South Wales 62.7% 0.30% 0.62% 0.32
Sydney - Northern Beaches New South Wales 55.7% 0.41% 0.68% 0.27
Melbourne - Inner East Victoria 60.2% 0.51% 0.71% 0.20
Sydney - Inner West New South Wales 58.9% 0.46% 0.75% 0.29
Sydney - Baulkham Hills and Hawkesbury New South Wales 58.8% 0.72% 0.75% 0.03
Brisbane - North Queensland 64.9% 0.84% 0.79% -0.05
Sydney - Sutherland New South Wales 56.5% 0.52% 0.81% 0.29
Note: WACLTV = Weighted average current loan to value ratio, weighted by current balanceSource: Moody's Investors Service; periodic investor/servicer reports
8 6 April 2017 RMBS - Australia: Mortgage Delinquency Map: Home Loan Arrears Rising in All Australian States
MOODY'S INVESTORS SERVICE STRUCTURED FINANCE
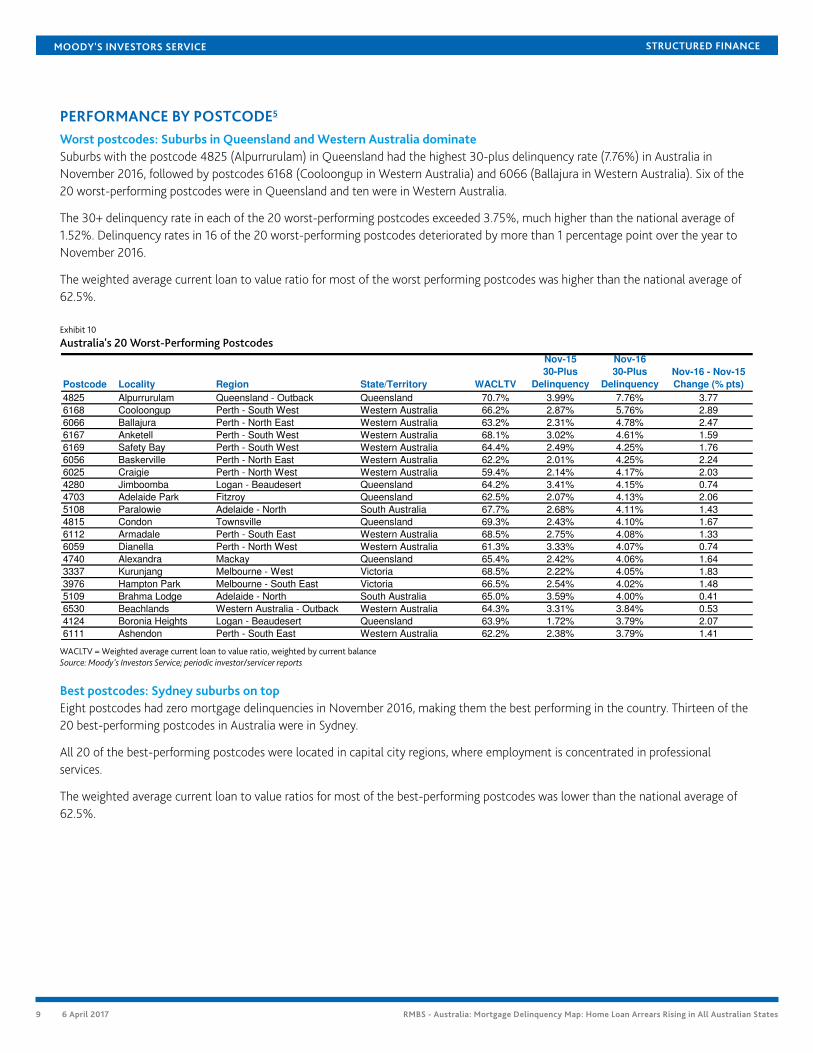
PERFORMANCE BY POSTCODE5
Worst postcodes: Suburbs in Queensland and Western Australia dominateSuburbs with the postcode 4825 (Alpurrurulam) in Queensland had the highest 30-plus delinquency rate (7.76%) in Australia inNovember 2016, followed by postcodes 6168 (Cooloongup in Western Australia) and 6066 (Ballajura in Western Australia). Six of the20 worst-performing postcodes were in Queensland and ten were in Western Australia.
The 30+ delinquency rate in each of the 20 worst-performing postcodes exceeded 3.75%, much higher than the national average of1.52%. Delinquency rates in 16 of the 20 worst-performing postcodes deteriorated by more than 1 percentage point over the year toNovember 2016.
The weighted average current loan to value ratio for most of the worst performing postcodes was higher than the national average of62.5%.
Exhibit 10
Australia's 20 Worst-Performing Postcodes
Postcode Locality Region State/Territory WACLTV
Nov-15
30-Plus
Delinquency
Nov-16
30-Plus
Delinquency
Nov-16 - Nov-15
Change (% pts)
4825 Alpurrurulam Queensland - Outback Queensland 70.7% 3.99% 7.76% 3.77
6168 Cooloongup Perth - South West Western Australia 66.2% 2.87% 5.76% 2.89
6066 Ballajura Perth - North East Western Australia 63.2% 2.31% 4.78% 2.47
6167 Anketell Perth - South West Western Australia 68.1% 3.02% 4.61% 1.59
6169 Safety Bay Perth - South West Western Australia 64.4% 2.49% 4.25% 1.76
6056 Baskerville Perth - North East Western Australia 62.2% 2.01% 4.25% 2.24
6025 Craigie Perth - North West Western Australia 59.4% 2.14% 4.17% 2.03
4280 Jimboomba Logan - Beaudesert Queensland 64.2% 3.41% 4.15% 0.74
4703 Adelaide Park Fitzroy Queensland 62.5% 2.07% 4.13% 2.06
5108 Paralowie Adelaide - North South Australia 67.7% 2.68% 4.11% 1.43
4815 Condon Townsville Queensland 69.3% 2.43% 4.10% 1.67
6112 Armadale Perth - South East Western Australia 68.5% 2.75% 4.08% 1.33
6059 Dianella Perth - North West Western Australia 61.3% 3.33% 4.07% 0.74
4740 Alexandra Mackay Queensland 65.4% 2.42% 4.06% 1.64
3337 Kurunjang Melbourne - West Victoria 68.5% 2.22% 4.05% 1.83
3976 Hampton Park Melbourne - South East Victoria 66.5% 2.54% 4.02% 1.48
5109 Brahma Lodge Adelaide - North South Australia 65.0% 3.59% 4.00% 0.41
6530 Beachlands Western Australia - Outback Western Australia 64.3% 3.31% 3.84% 0.53
4124 Boronia Heights Logan - Beaudesert Queensland 63.9% 1.72% 3.79% 2.07
6111 Ashendon Perth - South East Western Australia 62.2% 2.38% 3.79% 1.41
WACLTV = Weighted average current loan to value ratio, weighted by current balanceSource: Moody's Investors Service; periodic investor/servicer reports
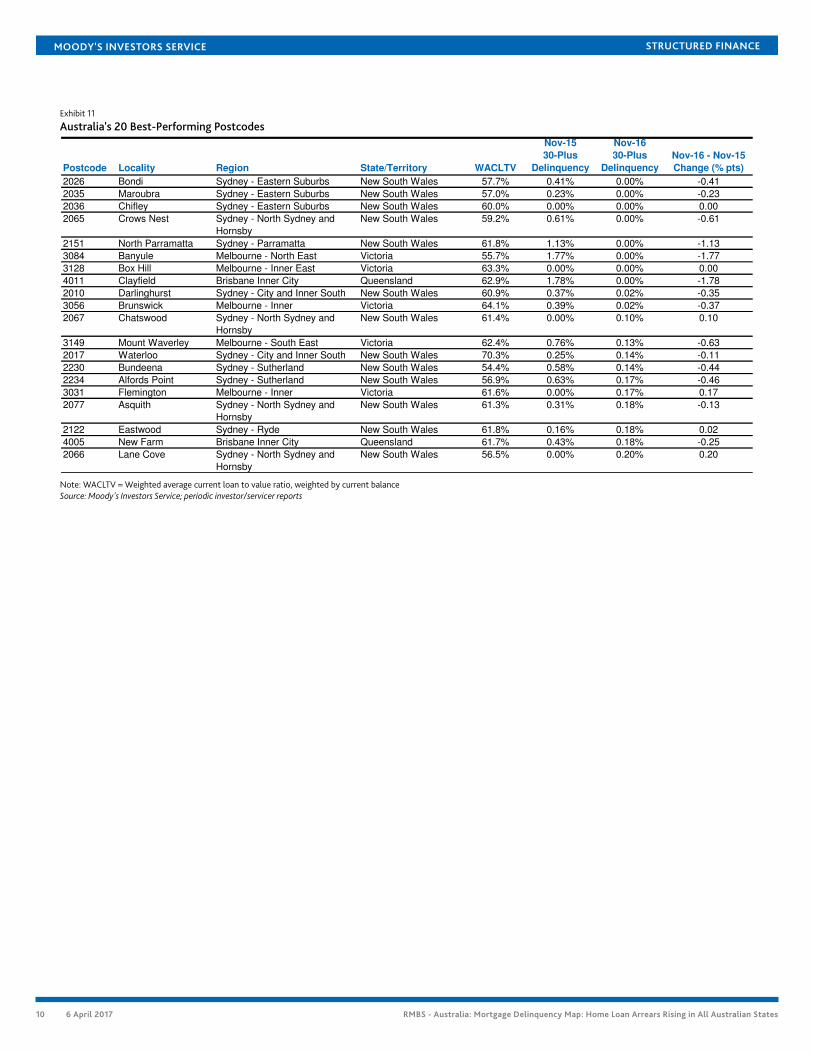
Best postcodes: Sydney suburbs on topEight postcodes had zero mortgage delinquencies in November 2016, making them the best performing in the country. Thirteen of the20 best-performing postcodes in Australia were in Sydney.
All 20 of the best-performing postcodes were located in capital city regions, where employment is concentrated in professionalservices.
The weighted average current loan to value ratios for most of the best-performing postcodes was lower than the national average of62.5%.
9 6 April 2017 RMBS - Australia: Mortgage Delinquency Map: Home Loan Arrears Rising in All Australian States
MOODY'S INVESTORS SERVICE STRUCTURED FINANCE
Exhibit 11
Australia's 20 Best-Performing Postcodes
Postcode Locality Region State/Territory WACLTV
Nov-15
30-Plus
Delinquency
Nov-16
30-Plus
Delinquency
Nov-16 - Nov-15
Change (% pts)
2026 Bondi Sydney - Eastern Suburbs New South Wales 57.7% 0.41% 0.00% -0.41
2035 Maroubra Sydney - Eastern Suburbs New South Wales 57.0% 0.23% 0.00% -0.23
2036 Chifley Sydney - Eastern Suburbs New South Wales 60.0% 0.00% 0.00% 0.00
2065 Crows Nest Sydney - North Sydney and
Hornsby
New South Wales 59.2% 0.61% 0.00% -0.61
2151 North Parramatta Sydney - Parramatta New South Wales 61.8% 1.13% 0.00% -1.13
3084 Banyule Melbourne - North East Victoria 55.7% 1.77% 0.00% -1.77
3128 Box Hill Melbourne - Inner East Victoria 63.3% 0.00% 0.00% 0.00
4011 Clayfield Brisbane Inner City Queensland 62.9% 1.78% 0.00% -1.78
2010 Darlinghurst Sydney - City and Inner South New South Wales 60.9% 0.37% 0.02% -0.35
3056 Brunswick Melbourne - Inner Victoria 64.1% 0.39% 0.02% -0.37
2067 Chatswood Sydney - North Sydney and
Hornsby
New South Wales 61.4% 0.00% 0.10% 0.10
3149 Mount Waverley Melbourne - South East Victoria 62.4% 0.76% 0.13% -0.63
2017 Waterloo Sydney - City and Inner South New South Wales 70.3% 0.25% 0.14% -0.11
2230 Bundeena Sydney - Sutherland New South Wales 54.4% 0.58% 0.14% -0.44
2234 Alfords Point Sydney - Sutherland New South Wales 56.9% 0.63% 0.17% -0.46
3031 Flemington Melbourne - Inner Victoria 61.6% 0.00% 0.17% 0.17
2077 Asquith Sydney - North Sydney and
Hornsby
New South Wales 61.3% 0.31% 0.18% -0.13
2122 Eastwood Sydney - Ryde New South Wales 61.8% 0.16% 0.18% 0.02
4005 New Farm Brisbane Inner City Queensland 61.7% 0.43% 0.18% -0.25
2066 Lane Cove Sydney - North Sydney and
Hornsby
New South Wales 56.5% 0.00% 0.20% 0.20
Note: WACLTV = Weighted average current loan to value ratio, weighted by current balanceSource: Moody's Investors Service; periodic investor/servicer reports
10 6 April 2017 RMBS - Australia: Mortgage Delinquency Map: Home Loan Arrears Rising in All Australian States
MOODY'S INVESTORS SERVICE STRUCTURED FINANCE
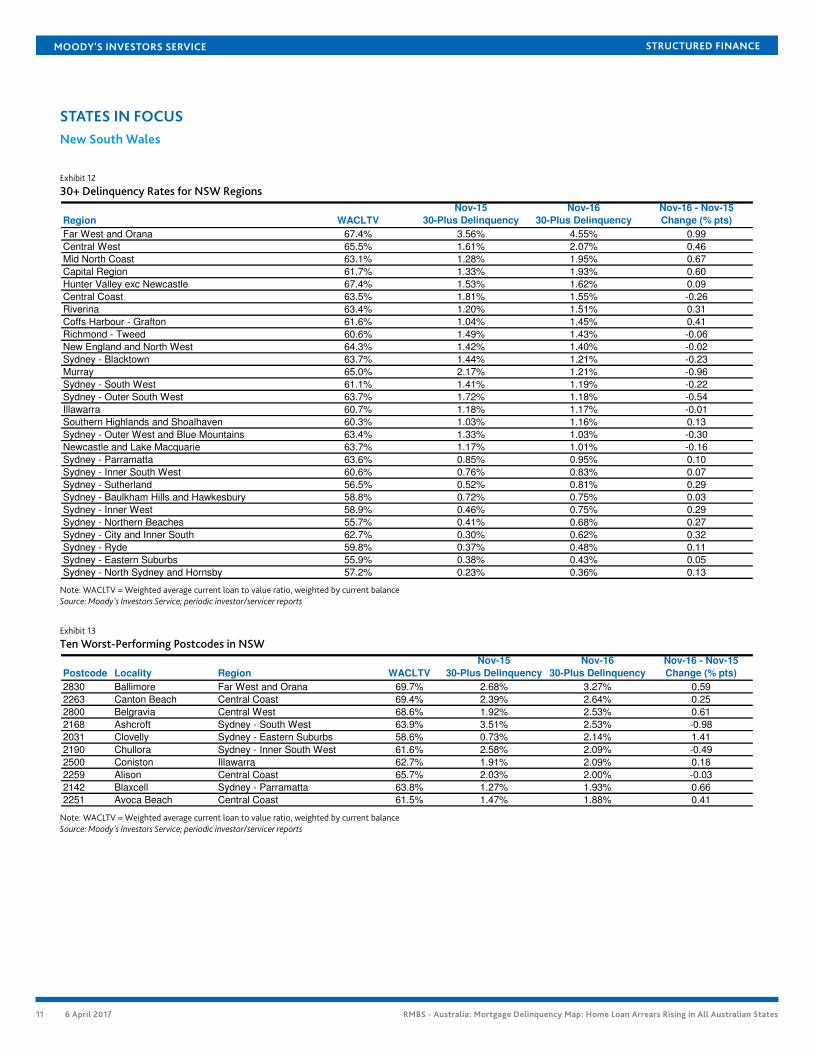
STATES IN FOCUSNew South Wales
Exhibit 12
30+ Delinquency Rates for NSW Regions
Region WACLTV
Nov-15
30-Plus Delinquency
Nov-16
30-Plus Delinquency
Nov-16 - Nov-15
Change (% pts)
Far West and Orana 67.4% 3.56% 4.55% 0.99
Central West 65.5% 1.61% 2.07% 0.46
Mid North Coast 63.1% 1.28% 1.95% 0.67
Capital Region 61.7% 1.33% 1.93% 0.60
Hunter Valley exc Newcastle 67.4% 1.53% 1.62% 0.09
Central Coast 63.5% 1.81% 1.55% -0.26
Riverina 63.4% 1.20% 1.51% 0.31
Coffs Harbour - Grafton 61.6% 1.04% 1.45% 0.41
Richmond - Tweed 60.6% 1.49% 1.43% -0.06
New England and North West 64.3% 1.42% 1.40% -0.02
Sydney - Blacktown 63.7% 1.44% 1.21% -0.23
Murray 65.0% 2.17% 1.21% -0.96
Sydney - South West 61.1% 1.41% 1.19% -0.22
Sydney - Outer South West 63.7% 1.72% 1.18% -0.54
Illawarra 60.7% 1.18% 1.17% -0.01
Southern Highlands and Shoalhaven 60.3% 1.03% 1.16% 0.13
Sydney - Outer West and Blue Mountains 63.4% 1.33% 1.03% -0.30
Newcastle and Lake Macquarie 63.7% 1.17% 1.01% -0.16
Sydney - Parramatta 63.6% 0.85% 0.95% 0.10
Sydney - Inner South West 60.6% 0.76% 0.83% 0.07
Sydney - Sutherland 56.5% 0.52% 0.81% 0.29
Sydney - Baulkham Hills and Hawkesbury 58.8% 0.72% 0.75% 0.03
Sydney - Inner West 58.9% 0.46% 0.75% 0.29
Sydney - Northern Beaches 55.7% 0.41% 0.68% 0.27
Sydney - City and Inner South 62.7% 0.30% 0.62% 0.32
Sydney - Ryde 59.8% 0.37% 0.48% 0.11
Sydney - Eastern Suburbs 55.9% 0.38% 0.43% 0.05
Sydney - North Sydney and Hornsby 57.2% 0.23% 0.36% 0.13
Note: WACLTV = Weighted average current loan to value ratio, weighted by current balanceSource: Moody's Investors Service; periodic investor/servicer reports
Exhibit 13
Ten Worst-Performing Postcodes in NSW
Postcode Locality Region WACLTV
Nov-15
30-Plus Delinquency
Nov-16
30-Plus Delinquency
Nov-16 - Nov-15
Change (% pts)
2830 Ballimore Far West and Orana 69.7% 2.68% 3.27% 0.59
2263 Canton Beach Central Coast 69.4% 2.39% 2.64% 0.25
2800 Belgravia Central West 68.6% 1.92% 2.53% 0.61
2168 Ashcroft Sydney - South West 63.9% 3.51% 2.53% -0.98
2031 Clovelly Sydney - Eastern Suburbs 58.6% 0.73% 2.14% 1.41
2190 Chullora Sydney - Inner South West 61.6% 2.58% 2.09% -0.49
2500 Coniston Illawarra 62.7% 1.91% 2.09% 0.18
2259 Alison Central Coast 65.7% 2.03% 2.00% -0.03
2142 Blaxcell Sydney - Parramatta 63.8% 1.27% 1.93% 0.66
2251 Avoca Beach Central Coast 61.5% 1.47% 1.88% 0.41
Note: WACLTV = Weighted average current loan to value ratio, weighted by current balanceSource: Moody's Investors Service; periodic investor/servicer reports
11 6 April 2017 RMBS - Australia: Mortgage Delinquency Map: Home Loan Arrears Rising in All Australian States
MOODY'S INVESTORS SERVICE STRUCTURED FINANCE
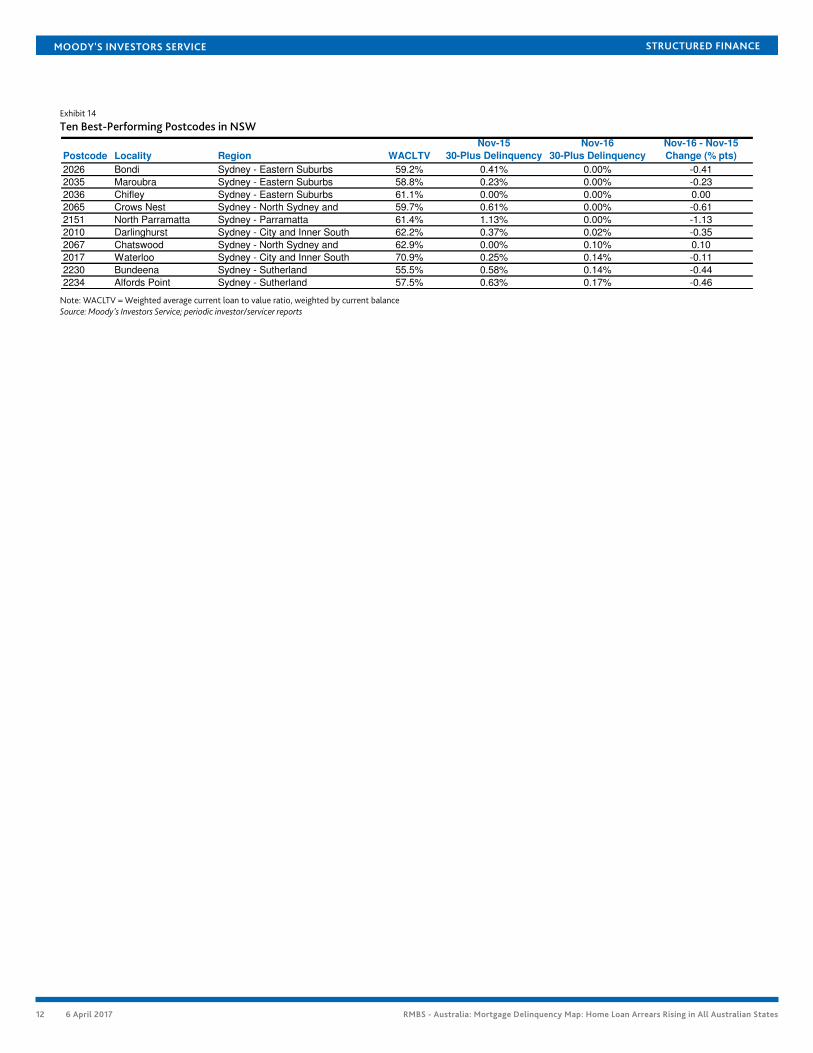
Exhibit 14
Ten Best-Performing Postcodes in NSW
Postcode Locality Region WACLTV
Nov-15
30-Plus Delinquency
Nov-16
30-Plus Delinquency
Nov-16 - Nov-15
Change (% pts)
2026 Bondi Sydney - Eastern Suburbs 59.2% 0.41% 0.00% -0.41
2035 Maroubra Sydney - Eastern Suburbs 58.8% 0.23% 0.00% -0.23
2036 Chifley Sydney - Eastern Suburbs 61.1% 0.00% 0.00% 0.00
2065 Crows Nest Sydney - North Sydney and 59.7% 0.61% 0.00% -0.61
2151 North Parramatta Sydney - Parramatta 61.4% 1.13% 0.00% -1.13
2010 Darlinghurst Sydney - City and Inner South 62.2% 0.37% 0.02% -0.35
2067 Chatswood Sydney - North Sydney and 62.9% 0.00% 0.10% 0.10
2017 Waterloo Sydney - City and Inner South 70.9% 0.25% 0.14% -0.11
2230 Bundeena Sydney - Sutherland 55.5% 0.58% 0.14% -0.44
2234 Alfords Point Sydney - Sutherland 57.5% 0.63% 0.17% -0.46
Note: WACLTV = Weighted average current loan to value ratio, weighted by current balanceSource: Moody's Investors Service; periodic investor/servicer reports
12 6 April 2017 RMBS - Australia: Mortgage Delinquency Map: Home Loan Arrears Rising in All Australian States
MOODY'S INVESTORS SERVICE STRUCTURED FINANCE
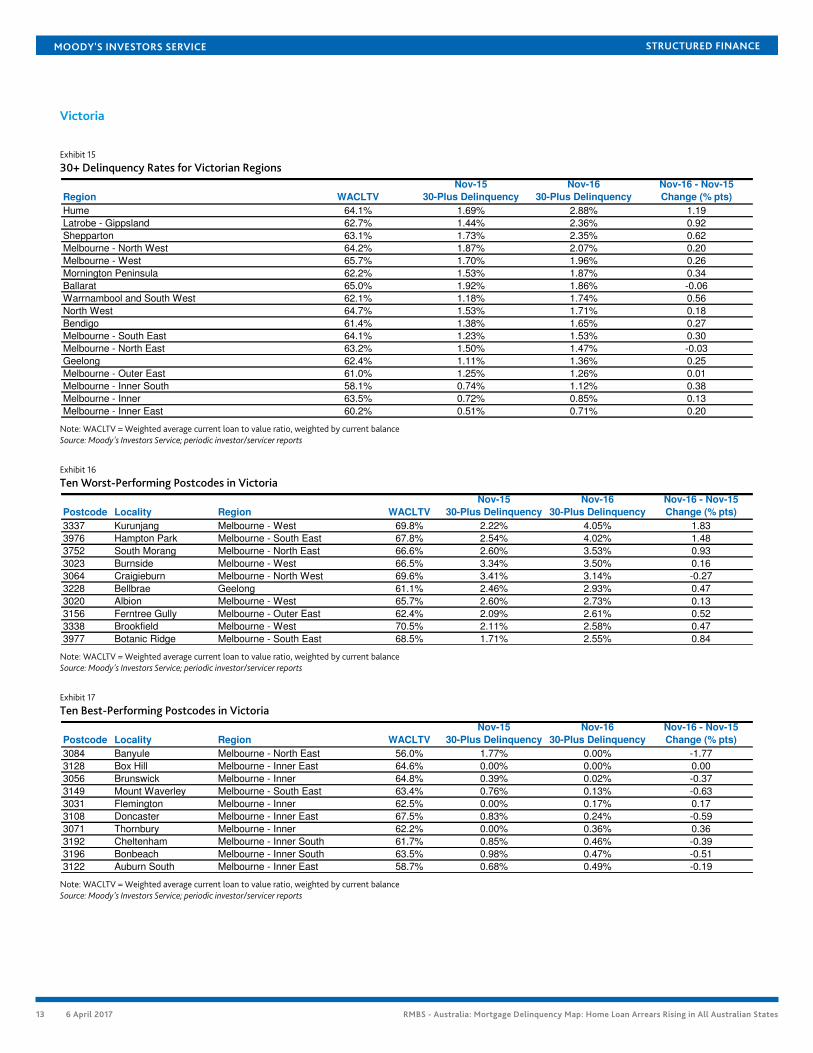
Victoria
Exhibit 15
30+ Delinquency Rates for Victorian Regions
Region WACLTV
Nov-15
30-Plus Delinquency
Nov-16
30-Plus Delinquency
Nov-16 - Nov-15
Change (% pts)
Hume 64.1% 1.69% 2.88% 1.19
Latrobe - Gippsland 62.7% 1.44% 2.36% 0.92
Shepparton 63.1% 1.73% 2.35% 0.62
Melbourne - North West 64.2% 1.87% 2.07% 0.20
Melbourne - West 65.7% 1.70% 1.96% 0.26
Mornington Peninsula 62.2% 1.53% 1.87% 0.34
Ballarat 65.0% 1.92% 1.86% -0.06
Warrnambool and South West 62.1% 1.18% 1.74% 0.56
North West 64.7% 1.53% 1.71% 0.18
Bendigo 61.4% 1.38% 1.65% 0.27
Melbourne - South East 64.1% 1.23% 1.53% 0.30
Melbourne - North East 63.2% 1.50% 1.47% -0.03
Geelong 62.4% 1.11% 1.36% 0.25
Melbourne - Outer East 61.0% 1.25% 1.26% 0.01
Melbourne - Inner South 58.1% 0.74% 1.12% 0.38
Melbourne - Inner 63.5% 0.72% 0.85% 0.13
Melbourne - Inner East 60.2% 0.51% 0.71% 0.20
Note: WACLTV = Weighted average current loan to value ratio, weighted by current balanceSource: Moody's Investors Service; periodic investor/servicer reports
Exhibit 16
Ten Worst-Performing Postcodes in Victoria
Postcode Locality Region WACLTV
Nov-15
30-Plus Delinquency
Nov-16
30-Plus Delinquency
Nov-16 - Nov-15
Change (% pts)
3337 Kurunjang Melbourne - West 69.8% 2.22% 4.05% 1.83
3976 Hampton Park Melbourne - South East 67.8% 2.54% 4.02% 1.48
3752 South Morang Melbourne - North East 66.6% 2.60% 3.53% 0.93
3023 Burnside Melbourne - West 66.5% 3.34% 3.50% 0.16
3064 Craigieburn Melbourne - North West 69.6% 3.41% 3.14% -0.27
3228 Bellbrae Geelong 61.1% 2.46% 2.93% 0.47
3020 Albion Melbourne - West 65.7% 2.60% 2.73% 0.13
3156 Ferntree Gully Melbourne - Outer East 62.4% 2.09% 2.61% 0.52
3338 Brookfield Melbourne - West 70.5% 2.11% 2.58% 0.47
3977 Botanic Ridge Melbourne - South East 68.5% 1.71% 2.55% 0.84
Note: WACLTV = Weighted average current loan to value ratio, weighted by current balanceSource: Moody's Investors Service; periodic investor/servicer reports
Exhibit 17
Ten Best-Performing Postcodes in Victoria
Postcode Locality Region WACLTV
Nov-15
30-Plus Delinquency
Nov-16
30-Plus Delinquency
Nov-16 - Nov-15
Change (% pts)
3084 Banyule Melbourne - North East 56.0% 1.77% 0.00% -1.77
3128 Box Hill Melbourne - Inner East 64.6% 0.00% 0.00% 0.00
3056 Brunswick Melbourne - Inner 64.8% 0.39% 0.02% -0.37
3149 Mount Waverley Melbourne - South East 63.4% 0.76% 0.13% -0.63
3031 Flemington Melbourne - Inner 62.5% 0.00% 0.17% 0.17
3108 Doncaster Melbourne - Inner East 67.5% 0.83% 0.24% -0.59
3071 Thornbury Melbourne - Inner 62.2% 0.00% 0.36% 0.36
3192 Cheltenham Melbourne - Inner South 61.7% 0.85% 0.46% -0.39
3196 Bonbeach Melbourne - Inner South 63.5% 0.98% 0.47% -0.51
3122 Auburn South Melbourne - Inner East 58.7% 0.68% 0.49% -0.19
Note: WACLTV = Weighted average current loan to value ratio, weighted by current balanceSource: Moody's Investors Service; periodic investor/servicer reports
13 6 April 2017 RMBS - Australia: Mortgage Delinquency Map: Home Loan Arrears Rising in All Australian States
MOODY'S INVESTORS SERVICE STRUCTURED FINANCE
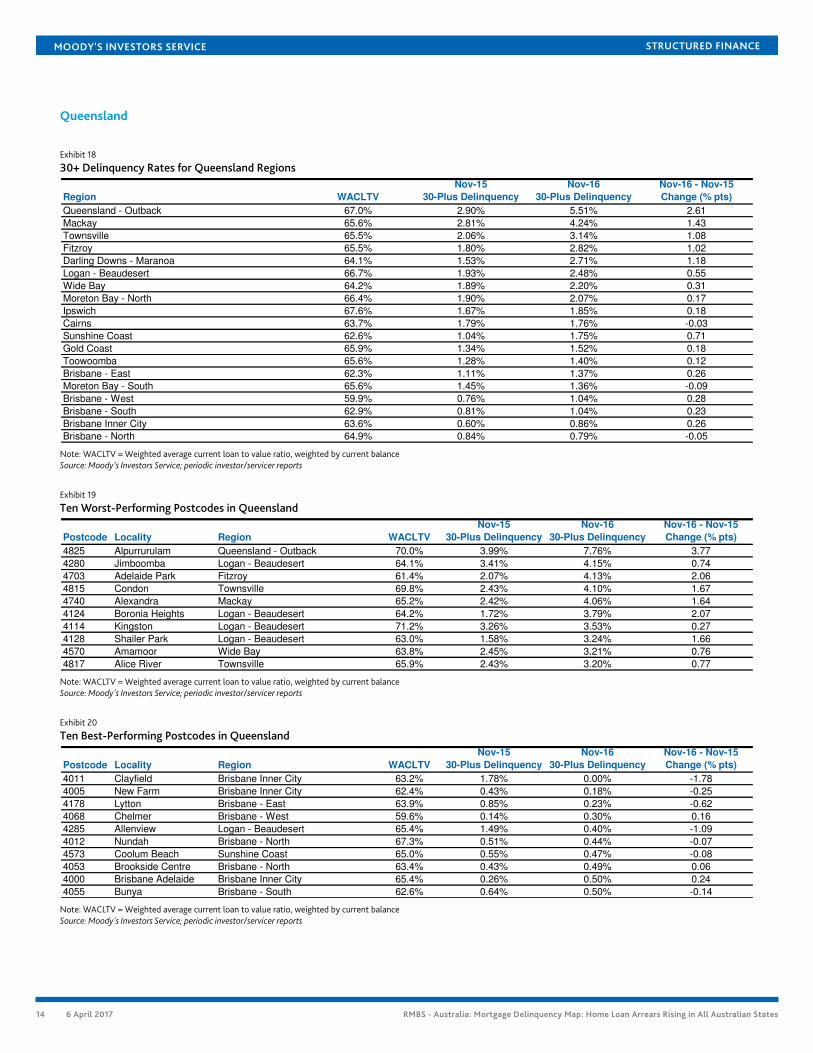
Queensland
Exhibit 18
30+ Delinquency Rates for Queensland Regions
Region WACLTV
Nov-15
30-Plus Delinquency
Nov-16
30-Plus Delinquency
Nov-16 - Nov-15
Change (% pts)
Queensland - Outback 67.0% 2.90% 5.51% 2.61
Mackay 65.6% 2.81% 4.24% 1.43
Townsville 65.5% 2.06% 3.14% 1.08
Fitzroy 65.5% 1.80% 2.82% 1.02
Darling Downs - Maranoa 64.1% 1.53% 2.71% 1.18
Logan - Beaudesert 66.7% 1.93% 2.48% 0.55
Wide Bay 64.2% 1.89% 2.20% 0.31
Moreton Bay - North 66.4% 1.90% 2.07% 0.17
Ipswich 67.6% 1.67% 1.85% 0.18
Cairns 63.7% 1.79% 1.76% -0.03
Sunshine Coast 62.6% 1.04% 1.75% 0.71
Gold Coast 65.9% 1.34% 1.52% 0.18
Toowoomba 65.6% 1.28% 1.40% 0.12
Brisbane - East 62.3% 1.11% 1.37% 0.26
Moreton Bay - South 65.6% 1.45% 1.36% -0.09
Brisbane - West 59.9% 0.76% 1.04% 0.28
Brisbane - South 62.9% 0.81% 1.04% 0.23
Brisbane Inner City 63.6% 0.60% 0.86% 0.26
Brisbane - North 64.9% 0.84% 0.79% -0.05
Note: WACLTV = Weighted average current loan to value ratio, weighted by current balanceSource: Moody's Investors Service; periodic investor/servicer reports
Exhibit 19
Ten Worst-Performing Postcodes in Queensland
Postcode Locality Region WACLTV
Nov-15
30-Plus Delinquency
Nov-16
30-Plus Delinquency
Nov-16 - Nov-15
Change (% pts)
4825 Alpurrurulam Queensland - Outback 70.0% 3.99% 7.76% 3.77
4280 Jimboomba Logan - Beaudesert 64.1% 3.41% 4.15% 0.74
4703 Adelaide Park Fitzroy 61.4% 2.07% 4.13% 2.06
4815 Condon Townsville 69.8% 2.43% 4.10% 1.67
4740 Alexandra Mackay 65.2% 2.42% 4.06% 1.64
4124 Boronia Heights Logan - Beaudesert 64.2% 1.72% 3.79% 2.07
4114 Kingston Logan - Beaudesert 71.2% 3.26% 3.53% 0.27
4128 Shailer Park Logan - Beaudesert 63.0% 1.58% 3.24% 1.66
4570 Amamoor Wide Bay 63.8% 2.45% 3.21% 0.76
4817 Alice River Townsville 65.9% 2.43% 3.20% 0.77
Note: WACLTV = Weighted average current loan to value ratio, weighted by current balanceSource: Moody's Investors Service; periodic investor/servicer reports
Exhibit 20
Ten Best-Performing Postcodes in Queensland
Postcode Locality Region WACLTV
Nov-15
30-Plus Delinquency
Nov-16
30-Plus Delinquency
Nov-16 - Nov-15
Change (% pts)
4011 Clayfield Brisbane Inner City 63.2% 1.78% 0.00% -1.78
4005 New Farm Brisbane Inner City 62.4% 0.43% 0.18% -0.25
4178 Lytton Brisbane - East 63.9% 0.85% 0.23% -0.62
4068 Chelmer Brisbane - West 59.6% 0.14% 0.30% 0.16
4285 Allenview Logan - Beaudesert 65.4% 1.49% 0.40% -1.09
4012 Nundah Brisbane - North 67.3% 0.51% 0.44% -0.07
4573 Coolum Beach Sunshine Coast 65.0% 0.55% 0.47% -0.08
4053 Brookside Centre Brisbane - North 63.4% 0.43% 0.49% 0.06
4000 Brisbane Adelaide Brisbane Inner City 65.4% 0.26% 0.50% 0.24
4055 Bunya Brisbane - South 62.6% 0.64% 0.50% -0.14
Note: WACLTV = Weighted average current loan to value ratio, weighted by current balanceSource: Moody's Investors Service; periodic investor/servicer reports
14 6 April 2017 RMBS - Australia: Mortgage Delinquency Map: Home Loan Arrears Rising in All Australian States
MOODY'S INVESTORS SERVICE STRUCTURED FINANCE
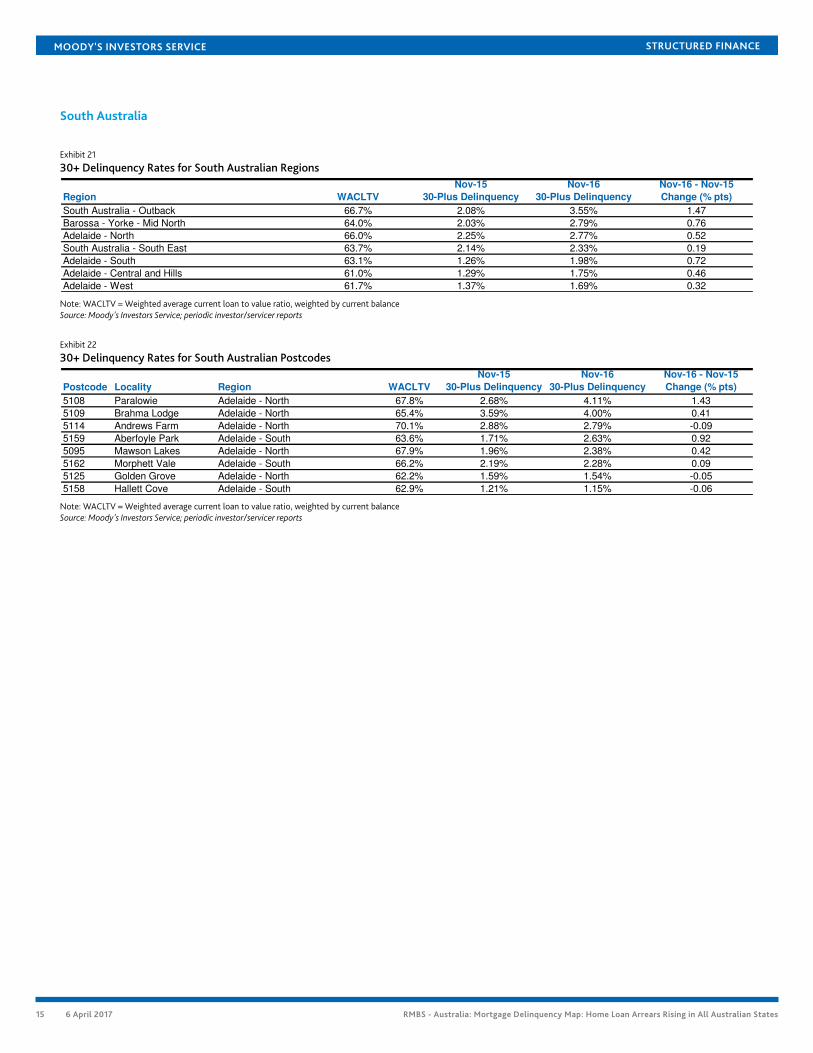
South Australia
Exhibit 21
30+ Delinquency Rates for South Australian Regions
Region WACLTV
Nov-15
30-Plus Delinquency
Nov-16
30-Plus Delinquency
Nov-16 - Nov-15
Change (% pts)
South Australia - Outback 66.7% 2.08% 3.55% 1.47
Barossa - Yorke - Mid North 64.0% 2.03% 2.79% 0.76
Adelaide - North 66.0% 2.25% 2.77% 0.52
South Australia - South East 63.7% 2.14% 2.33% 0.19
Adelaide - South 63.1% 1.26% 1.98% 0.72
Adelaide - Central and Hills 61.0% 1.29% 1.75% 0.46
Adelaide - West 61.7% 1.37% 1.69% 0.32
Note: WACLTV = Weighted average current loan to value ratio, weighted by current balanceSource: Moody's Investors Service; periodic investor/servicer reports
Exhibit 22
30+ Delinquency Rates for South Australian Postcodes
Postcode Locality Region WACLTV
Nov-15
30-Plus Delinquency
Nov-16
30-Plus Delinquency
Nov-16 - Nov-15
Change (% pts)
5108 Paralowie Adelaide - North 67.8% 2.68% 4.11% 1.43
5109 Brahma Lodge Adelaide - North 65.4% 3.59% 4.00% 0.41
5114 Andrews Farm Adelaide - North 70.1% 2.88% 2.79% -0.09
5159 Aberfoyle Park Adelaide - South 63.6% 1.71% 2.63% 0.92
5095 Mawson Lakes Adelaide - North 67.9% 1.96% 2.38% 0.42
5162 Morphett Vale Adelaide - South 66.2% 2.19% 2.28% 0.09
5125 Golden Grove Adelaide - North 62.2% 1.59% 1.54% -0.05
5158 Hallett Cove Adelaide - South 62.9% 1.21% 1.15% -0.06
Note: WACLTV = Weighted average current loan to value ratio, weighted by current balanceSource: Moody's Investors Service; periodic investor/servicer reports
15 6 April 2017 RMBS - Australia: Mortgage Delinquency Map: Home Loan Arrears Rising in All Australian States
MOODY'S INVESTORS SERVICE STRUCTURED FINANCE
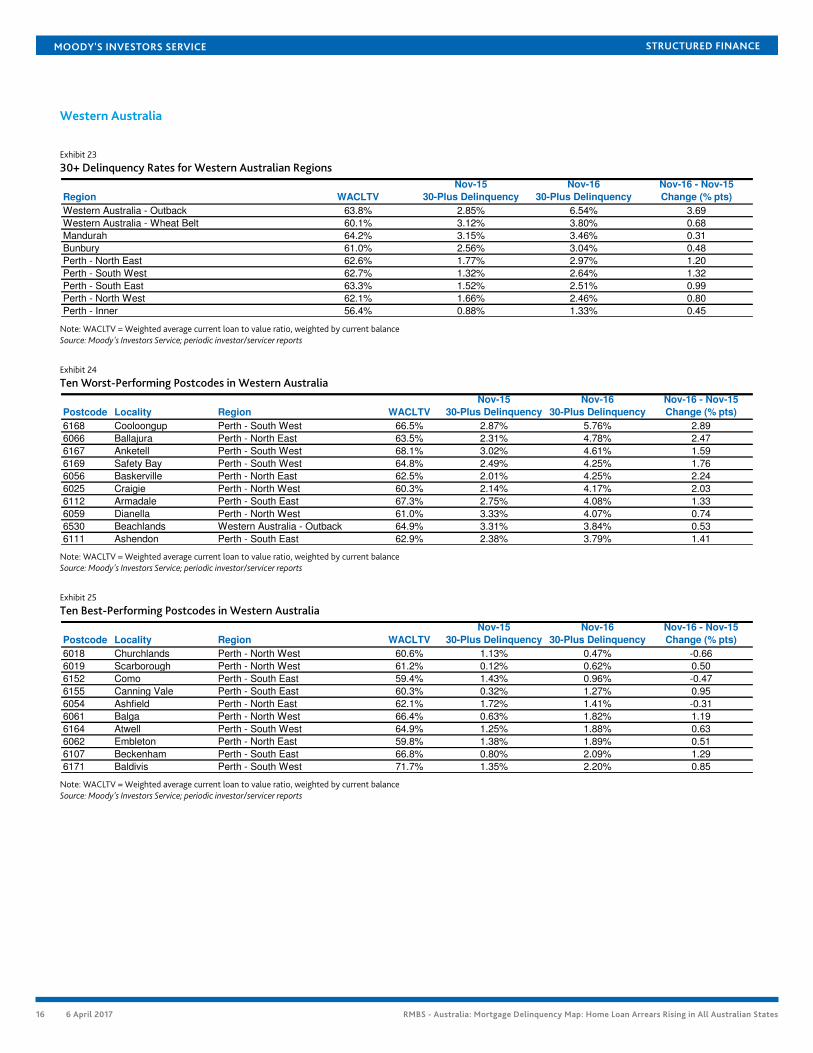
Western Australia
Exhibit 23
30+ Delinquency Rates for Western Australian Regions
Region WACLTV
Nov-15
30-Plus Delinquency
Nov-16
30-Plus Delinquency
Nov-16 - Nov-15
Change (% pts)
Western Australia - Outback 63.8% 2.85% 6.54% 3.69
Western Australia - Wheat Belt 60.1% 3.12% 3.80% 0.68
Mandurah 64.2% 3.15% 3.46% 0.31
Bunbury 61.0% 2.56% 3.04% 0.48
Perth - North East 62.6% 1.77% 2.97% 1.20
Perth - South West 62.7% 1.32% 2.64% 1.32
Perth - South East 63.3% 1.52% 2.51% 0.99
Perth - North West 62.1% 1.66% 2.46% 0.80
Perth - Inner 56.4% 0.88% 1.33% 0.45
Note: WACLTV = Weighted average current loan to value ratio, weighted by current balanceSource: Moody's Investors Service; periodic investor/servicer reports
Exhibit 24
Ten Worst-Performing Postcodes in Western Australia
Postcode Locality Region WACLTV
Nov-15
30-Plus Delinquency
Nov-16
30-Plus Delinquency
Nov-16 - Nov-15
Change (% pts)
6168 Cooloongup Perth - South West 66.5% 2.87% 5.76% 2.89
6066 Ballajura Perth - North East 63.5% 2.31% 4.78% 2.47
6167 Anketell Perth - South West 68.1% 3.02% 4.61% 1.59
6169 Safety Bay Perth - South West 64.8% 2.49% 4.25% 1.76
6056 Baskerville Perth - North East 62.5% 2.01% 4.25% 2.24
6025 Craigie Perth - North West 60.3% 2.14% 4.17% 2.03
6112 Armadale Perth - South East 67.3% 2.75% 4.08% 1.33
6059 Dianella Perth - North West 61.0% 3.33% 4.07% 0.74
6530 Beachlands Western Australia - Outback 64.9% 3.31% 3.84% 0.53
6111 Ashendon Perth - South East 62.9% 2.38% 3.79% 1.41
Note: WACLTV = Weighted average current loan to value ratio, weighted by current balanceSource: Moody's Investors Service; periodic investor/servicer reports
Exhibit 25
Ten Best-Performing Postcodes in Western Australia
Postcode Locality Region WACLTV
Nov-15
30-Plus Delinquency
Nov-16
30-Plus Delinquency
Nov-16 - Nov-15
Change (% pts)
6018 Churchlands Perth - North West 60.6% 1.13% 0.47% -0.66
6019 Scarborough Perth - North West 61.2% 0.12% 0.62% 0.50
6152 Como Perth - South East 59.4% 1.43% 0.96% -0.47
6155 Canning Vale Perth - South East 60.3% 0.32% 1.27% 0.95
6054 Ashfield Perth - North East 62.1% 1.72% 1.41% -0.31
6061 Balga Perth - North West 66.4% 0.63% 1.82% 1.19
6164 Atwell Perth - South West 64.9% 1.25% 1.88% 0.63
6062 Embleton Perth - North East 59.8% 1.38% 1.89% 0.51
6107 Beckenham Perth - South East 66.8% 0.80% 2.09% 1.29
6171 Baldivis Perth - South West 71.7% 1.35% 2.20% 0.85
Note: WACLTV = Weighted average current loan to value ratio, weighted by current balanceSource: Moody's Investors Service; periodic investor/servicer reports
16 6 April 2017 RMBS - Australia: Mortgage Delinquency Map: Home Loan Arrears Rising in All Australian States
MOODY'S INVESTORS SERVICE STRUCTURED FINANCE
Moody's Related ResearchSector Comments
» Alt-Doc Mortgages Subject to Stricter Underwriting than Pre-2008 Low-Doc Mortgages, March 2017 (1046369)
» Housing Market Imbalances Growing in Some States, March 2017 (1042914)
» Rising Housing Prices Provide Equity Cushion to Absorb Losses, January 2017 (1052145)
» Buy-to-Let RMBS - Global: Regulations Easing Risks in Mature Markets; Developing Markets Gain Traction, December 2016(1042762)
» Resurgent Housing Prices Eroding Affordability Despite Interest Rate Cuts, November 2016 (1046359)
» Apartment Construction Boom Poses Moderate Risk to Australian RMBS, September 2016 (1043599)
» Record Low Rental Yields Increase Risks for Residential Property Investors, April 2016 (1020998)
» Residential Mortgage Delinquency Map: Improving NSW Underpins Steady Performance, March 2016 (1021746)
» Negative Euribor Rates Pose Risks to Some Australian RMBS and ABS, February 2016 (1015737)
Outlook
» Structured Finance - Global: Outlook 2017 - Tepid Growth Props Up Asset Quality, December 2016 (1056203)
» Australia 2017 Outlook - Delinquencies Will Increase Moderately, November 2016 (1043742)
Index
» Global Structured Finance Collateral Performance Review (SF220325)
» Australian RMBS Indices - Q4 2016 - Excel Data, March 2017 (SF449146)
Rating Methodology
» Moody’s Approach to Rating RMBS Using the MILAN Framework (1039709)
» RMBS Rating Methodology Supplement - Australia (SF393088)
To access any of these reports, click on the entry above. Note that these references are current as of the date of publication of thisreport and that more recent reports may be available. All research may not be available to all clients.
17 6 April 2017 RMBS - Australia: Mortgage Delinquency Map: Home Loan Arrears Rising in All Australian States
MOODY'S INVESTORS SERVICE STRUCTURED FINANCE
Endnotes1 This report compares delinquencies between November 2016 and November 2015 rather than May 2016 (the period for the previous Mortgage
Delinquency Map report) to avoid differences caused by seasonal fluctuations.
2 See Australian Residential Mortgage Delinquency Map - November 2016 for historical 30+ delinquency rates stretching back to 2005.
3 Source: Australian Bureau of Statistics.
4 See RMBS - Australia: Apartment Construction Boom Poses Moderate Risk to Australian RMBS and RMBS - Australia: Record Low Rental Yields IncreaseRisks for Residential Property Investors.
5 Postcode analysis has several well-known deficiencies, including the fact that it is difficult to apply meaningful analytical judgment at such a granularlevel. To ensure that results are meaningful, we have excluded postcodes with less than 400 loans.
18 6 April 2017 RMBS - Australia: Mortgage Delinquency Map: Home Loan Arrears Rising in All Australian States
MOODY'S INVESTORS SERVICE STRUCTURED FINANCE
© 2017 Moody’s Corporation, Moody’s Investors Service, Inc., Moody’s Analytics, Inc. and/or their licensors and affiliates (collectively, “MOODY’S”). All rights reserved.
CREDIT RATINGS ISSUED BY MOODY'S INVESTORS SERVICE, INC. AND ITS RATINGS AFFILIATES (“MIS”) ARE MOODY’S CURRENT OPINIONS OF THE RELATIVE FUTURE CREDITRISK OF ENTITIES, CREDIT COMMITMENTS, OR DEBT OR DEBT-LIKE SECURITIES, AND MOODY’S PUBLICATIONS MAY INCLUDE MOODY’S CURRENT OPINIONS OF THERELATIVE FUTURE CREDIT RISK OF ENTITIES, CREDIT COMMITMENTS, OR DEBT OR DEBT-LIKE SECURITIES. MOODY’S DEFINES CREDIT RISK AS THE RISK THAT AN ENTITYMAY NOT MEET ITS CONTRACTUAL, FINANCIAL OBLIGATIONS AS THEY COME DUE AND ANY ESTIMATED FINANCIAL LOSS IN THE EVENT OF DEFAULT. CREDIT RATINGSDO NOT ADDRESS ANY OTHER RISK, INCLUDING BUT NOT LIMITED TO: LIQUIDITY RISK, MARKET VALUE RISK, OR PRICE VOLATILITY. CREDIT RATINGS AND MOODY’SOPINIONS INCLUDED IN MOODY’S PUBLICATIONS ARE NOT STATEMENTS OF CURRENT OR HISTORICAL FACT. MOODY’S PUBLICATIONS MAY ALSO INCLUDE QUANTITATIVEMODEL-BASED ESTIMATES OF CREDIT RISK AND RELATED OPINIONS OR COMMENTARY PUBLISHED BY MOODY’S ANALYTICS, INC. CREDIT RATINGS AND MOODY’SPUBLICATIONS DO NOT CONSTITUTE OR PROVIDE INVESTMENT OR FINANCIAL ADVICE, AND CREDIT RATINGS AND MOODY’S PUBLICATIONS ARE NOT AND DO NOTPROVIDE RECOMMENDATIONS TO PURCHASE, SELL, OR HOLD PARTICULAR SECURITIES. NEITHER CREDIT RATINGS NOR MOODY’S PUBLICATIONS COMMENT ON THESUITABILITY OF AN INVESTMENT FOR ANY PARTICULAR INVESTOR. MOODY’S ISSUES ITS CREDIT RATINGS AND PUBLISHES MOODY’S PUBLICATIONS WITH THE EXPECTATIONAND UNDERSTANDING THAT EACH INVESTOR WILL, WITH DUE CARE, MAKE ITS OWN STUDY AND EVALUATION OF EACH SECURITY THAT IS UNDER CONSIDERATION FORPURCHASE, HOLDING, OR SALE.
MOODY’S CREDIT RATINGS AND MOODY’S PUBLICATIONS ARE NOT INTENDED FOR USE BY RETAIL INVESTORS AND IT WOULD BE RECKLESS AND INAPPROPRIATE FORRETAIL INVESTORS TO USE MOODY’S CREDIT RATINGS OR MOODY’S PUBLICATIONS WHEN MAKING AN INVESTMENT DECISION. IF IN DOUBT YOU SHOULD CONTACTYOUR FINANCIAL OR OTHER PROFESSIONAL ADVISER. ALL INFORMATION CONTAINED HEREIN IS PROTECTED BY LAW, INCLUDING BUT NOT LIMITED TO, COPYRIGHT LAW,AND NONE OF SUCH INFORMATION MAY BE COPIED OR OTHERWISE REPRODUCED, REPACKAGED, FURTHER TRANSMITTED, TRANSFERRED, DISSEMINATED, REDISTRIBUTEDOR RESOLD, OR STORED FOR SUBSEQUENT USE FOR ANY SUCH PURPOSE, IN WHOLE OR IN PART, IN ANY FORM OR MANNER OR BY ANY MEANS WHATSOEVER, BY ANYPERSON WITHOUT MOODY’S PRIOR WRITTEN CONSENT.
All information contained herein is obtained by MOODY’S from sources believed by it to be accurate and reliable. Because of the possibility of human or mechanical error as wellas other factors, however, all information contained herein is provided “AS IS” without warranty of any kind. MOODY'S adopts all necessary measures so that the information ituses in assigning a credit rating is of sufficient quality and from sources MOODY'S considers to be reliable including, when appropriate, independent third-party sources. However,MOODY’S is not an auditor and cannot in every instance independently verify or validate information received in the rating process or in preparing the Moody’s publications.
To the extent permitted by law, MOODY’S and its directors, officers, employees, agents, representatives, licensors and suppliers disclaim liability to any person or entity for anyindirect, special, consequential, or incidental losses or damages whatsoever arising from or in connection with the information contained herein or the use of or inability to use anysuch information, even if MOODY’S or any of its directors, officers, employees, agents, representatives, licensors or suppliers is advised in advance of the possibility of such losses ordamages, including but not limited to: (a) any loss of present or prospective profits or (b) any loss or damage arising where the relevant financial instrument is not the subject of aparticular credit rating assigned by MOODY’S.
To the extent permitted by law, MOODY’S and its directors, officers, employees, agents, representatives, licensors and suppliers disclaim liability for any direct or compensatorylosses or damages caused to any person or entity, including but not limited to by any negligence (but excluding fraud, willful misconduct or any other type of liability that, for theavoidance of doubt, by law cannot be excluded) on the part of, or any contingency within or beyond the control of, MOODY’S or any of its directors, officers, employees, agents,representatives, licensors or suppliers, arising from or in connection with the information contained herein or the use of or inability to use any such information.
NO WARRANTY, EXPRESS OR IMPLIED, AS TO THE ACCURACY, TIMELINESS, COMPLETENESS, MERCHANTABILITY OR FITNESS FOR ANY PARTICULAR PURPOSE OF ANY SUCHRATING OR OTHER OPINION OR INFORMATION IS GIVEN OR MADE BY MOODY’S IN ANY FORM OR MANNER WHATSOEVER.
Moody’s Investors Service, Inc., a wholly-owned credit rating agency subsidiary of Moody’s Corporation (“MCO”), hereby discloses that most issuers of debt securities (includingcorporate and municipal bonds, debentures, notes and commercial paper) and preferred stock rated by Moody’s Investors Service, Inc. have, prior to assignment of any rating,agreed to pay to Moody’s Investors Service, Inc. for appraisal and rating services rendered by it fees ranging from $1,500 to approximately $2,500,000. MCO and MIS also maintainpolicies and procedures to address the independence of MIS’s ratings and rating processes. Information regarding certain affiliations that may exist between directors of MCO andrated entities, and between entities who hold ratings from MIS and have also publicly reported to the SEC an ownership interest in MCO of more than 5%, is posted annually atwww.moodys.com under the heading “Investor Relations — Corporate Governance — Director and Shareholder Affiliation Policy.”
Additional terms for Australia only: Any publication into Australia of this document is pursuant to the Australian Financial Services License of MOODY’S affiliate, Moody’s InvestorsService Pty Limited ABN 61 003 399 657AFSL 336969 and/or Moody’s Analytics Australia Pty Ltd ABN 94 105 136 972 AFSL 383569 (as applicable). This document is intendedto be provided only to “wholesale clients” within the meaning of section 761G of the Corporations Act 2001. By continuing to access this document from within Australia, yourepresent to MOODY’S that you are, or are accessing the document as a representative of, a “wholesale client” and that neither you nor the entity you represent will directly orindirectly disseminate this document or its contents to “retail clients” within the meaning of section 761G of the Corporations Act 2001. MOODY’S credit rating is an opinion asto the creditworthiness of a debt obligation of the issuer, not on the equity securities of the issuer or any form of security that is available to retail investors. It would be recklessand inappropriate for retail investors to use MOODY’S credit ratings or publications when making an investment decision. If in doubt you should contact your financial or otherprofessional adviser.
Additional terms for Japan only: Moody's Japan K.K. (“MJKK”) is a wholly-owned credit rating agency subsidiary of Moody's Group Japan G.K., which is wholly-owned by Moody’sOverseas Holdings Inc., a wholly-owned subsidiary of MCO. Moody’s SF Japan K.K. (“MSFJ”) is a wholly-owned credit rating agency subsidiary of MJKK. MSFJ is not a NationallyRecognized Statistical Rating Organization (“NRSRO”). Therefore, credit ratings assigned by MSFJ are Non-NRSRO Credit Ratings. Non-NRSRO Credit Ratings are assigned by anentity that is not a NRSRO and, consequently, the rated obligation will not qualify for certain types of treatment under U.S. laws. MJKK and MSFJ are credit rating agencies registeredwith the Japan Financial Services Agency and their registration numbers are FSA Commissioner (Ratings) No. 2 and 3 respectively.
MJKK or MSFJ (as applicable) hereby disclose that most issuers of debt securities (including corporate and municipal bonds, debentures, notes and commercial paper) and preferredstock rated by MJKK or MSFJ (as applicable) have, prior to assignment of any rating, agreed to pay to MJKK or MSFJ (as applicable) for appraisal and rating services rendered by it feesranging from JPY200,000 to approximately JPY350,000,000.
MJKK and MSFJ also maintain policies and procedures to address Japanese regulatory requirements.
REPORT NUMBER 1066797
19 6 April 2017 RMBS - Australia: Mortgage Delinquency Map: Home Loan Arrears Rising in All Australian States