Sector F-5/1, Islamabad PROCESSING INDUSTRY... · 7.1 Shezan International Ltd. 104 7.2 TrippleEm...
99
Transcript of Sector F-5/1, Islamabad PROCESSING INDUSTRY... · 7.1 Shezan International Ltd. 104 7.2 TrippleEm...


AuthorsDr. Lubna Shahnaz
Supervised byMr. Muhammad JavaidNational Consultant/ Deputy Team LeaderComponent 3 – Labour Market Information Services
Photo creditsMr.
Layout and designS.M.Khan | 0333 5104564
Printed by
January 2015
National Vocational & Technical Training Commission (NAVTTC)5th Floor, Evacuee Trust ComplexSector F-5/1, IslamabadTel: +92 51 904404Fax: +92 51 904404Email: [email protected]
Labour Market Intelligence Survey in Food Processing sector is second one of the series produced by the National Skills Information System (NSIS) cell, National Vocational & Technical Training Commission (NAVTTC) with the technical assistance of the TVET Reform Support Programme, which is funded by the European Union, the Embassy of the Kingdom of the Netherlands, the Federal Republic of Germany, the Royal Norwegian Embassy, and has been commissioned by the German Federal Ministry for Economic Cooperation and Development (BMZ). The Deutsche Gesellschaft fur Internationale Zusammenarbeit (GIZ) GmbH is implementing this Programme in close collaboration of the NAVTTC. The analysis, results and recommendations in this report represent the opinion of the authors and are not necessarily representative of the position of the GIZ.

Food Processing Industry | 02
Labour Market Intelligence Survey
Acknowledgements
Labour Market Intelligence Survey in Food processing sector is second one of the series under the TVET Reform
Support Programme, funded by the European Union, the Embassy of the Kingdom of the Netherlands, the
Federal Republic of Germany and the Royal Norwegian Embassy, has been commissioned by the German Federal
Ministry for Economic Cooperation and Development (BMZ). The Deutsche Gesellschaft für Internationale
Zusammenarbeit (GIZ) GmbH is implementing this programme in close collaboration with the National
Vocational and Technical Training Commission (NAVTTC). The first survey was in Textile sector the report of
which is released in December 2015.
The TVET Reform Support Programme would like to thanks Dr. Lubna Shahnaz Short Term Expert for report
writing and Muhammad Javaid Consultant/Deputy Team Leader of Component 3 who worked tirelessly to
supervise the field work of data collection and coordinated the activities. I would also like to acknowledge the
contributions from Ch. Shamim Rafique Director General Bureau of Statistics (BoS) Punjab who supervised the
training and field work of the survey. I would also like to extend my thanks to Ch. Sajid Rasul Director BoS Punjab,
Mr. Shah Nawaz Jiskani Additional Director BoS Sindh, Mr. Khalid Parveez Additional Director BoS Balochistan
and Mr. Muhammad Farooq Assistant Director BoS Khyber Pakhtunkhwa and their team members who
successfully completed the field work in their respective provinces. In addition, I would like to thank the members
of Technical Working Group (TWG) that provided the necessary technical backstopping.
Jens SiebertTVET Reform Support Programme Pakistan
GFA Team Leader
Labour Market Information Services – Component 3
Implemented by GFA Consulting Group

Labour Market Intelligence Survey
Messages from Minister
03 | Food Processing Industry

Food Processing Industry | 04
Labour Market Intelligence Survey
Messages from ED

Labour Market Intelligence Survey
05 | Food Processing Industry

Food Processing Industry | 06
List of Abbreviations 7
Executive Summary 8
Concepts and Definition 10
1. Introduction 12
2. Methodology 14
3. Establishment Profile 153.1 Coverage 15
3.2 Work Status 18
3.3 Year of Establishment 19
3.4 Legal Status 23
3.5 Existence of HR Department 26
3.6 TVET Arrangement for Own Employees 28
4. Employees Profile 30
4.1 Composition of Employees by Skill 30
4.2 Composition of Employees by Status 34
4.3 Employees by Gender 38
4.3 Employees by Source of Skill and Gender 40
3.4 Employees by Skill and Status 44
4.5 Employment Trends 50
4.5.1 Level of Education 50
4.5.2 Average Monthly Wages 55
5. TVET Requirement of Establishments 595.1 Recruitment Procedure 59
5.2 Sources of Skilled Employees 64
5.3 Preference in Fixing the Wages of Skill Workers 67
5.4 Employer’s Satisfaction on Skill Level of Workers 69
5.6 Skill Shortages 88
5.7 Management of Skill Shortages 90
5.8 Future Expansion Plan of Establishments 93
5.9 Future Skill Requirements 94
6. Conclusion & Main Findings 101
7. Case Studies (Lahore) 104
7.1 Shezan International Ltd. 104
7.2 TrippleEm Pvt. Limited, Pakistan 105
8. Case Studies (Karachi) 107
8.1 Meat Processing Sub-sector 107
8.1.1 Al Shaheer Corporation 107
8.1.2 Al Aien Corporation 109
Contents
Labour Market Intelligence Survey

07 | Food Processing Industry
8.2 Soft Drinks and Bottled Water Sub-sector 110
8.2.1 Habib Consumer Products (Pvt) Ltd. 110
8.3 Dairy Sub-sector 111
8.3.1 Bu�elds Agriculture Products (Pvt) Ltd. 111
8.3.2 Taam Foods 114
9. Recommendations 117
Appendices 119
Appendix 1 120
Appendix 2 129
Appendix 3 130
Appendix 4 131
Appendix 5 133
Appendix 6 136
List of Tables Table 1: Survey Coverage - by category
Table 2: Survey Coverage - by Province
Table 3: Number of Establishment by Sub-sector and Province
Table 4: Number of Establishment by Sub-sector, Province and Working Status
Table 5: Year of Establishment by Sub-sector
Table 6: Year of Establishment by Province
Table 7: Year of Establishment by Sub-sector, Punjab
Table 8: Year of Establishment by Sub-sector, Sindh
Table 9: Year of Establishment by Sub-sector, KP
Table 10: Year of Establishment by Sub-sector, Balochistan
Table11: Number of Establishment by Sub-sector, Province and Corporate Status of the Establishment - Pakistan
Table12: Number of Establishments by Sub-sector, Province and Corporate Status of the Establishment - Punjab
Table13: Number of Establishments by Sub-sector, Province and Corporate status of the establishment - Sindh
Table 14: Number of Establishment by Sub-sector, Province and Corporate Status of the Establishment – KP
Table 15: Number of Establishment by Sub-sector, Province and Corporate Status of the establishment – Balochistan
Table 16: Establishments having Human Resource (HR) Department – by Sub-sector and Province
Table 17: Establishments Maintaining Record of Skilled Employees – by Sub-sector and Province
Table 18: Establishments having Own Arrangement of Technical & Vocational Training – by Sub-sector and Province
Table 19: Establishments having Own Training a Arrangement (if yes in table 18) – by Sub-sector and Province
Table 20: Employees by Type of Skill
Table 21: Total Number of Employees by Sub-sector and Status of Employment
Table 22: Number of Skilled/Semi-Skilled Employees by Sub-sector, Gender and Province (excluding admin and general
workers)
Table 22(a): Number of Skilled/Semi-Skilled Employees by Sub-sector, Gender and Province (excluding admin and
general workers)
Table 23: Employment Trend of Skilled/ Semi-skilled Workers, by Sub-sector
Table 23(a): Employment Trend of Skilled/ Semi-skilled Workers, by Sub-sector (Female Employees)
Table 24: Employment Trend of Skilled/ Semi-skilled Workers, by Level of Education
Table 25: Minimum and Maximum Average Wages Average Wages by Sub-sector and Province (2013 & 2009)
in Rupees
Table 26: Recruitment of Skilled / Semi-skilled Worker through di�erent Methods (priority order)
Table 27: Priority in Selection of Skilled/Semi-Skilled workers from Di�erent Source of Supply
Table 28: Basis of Fixing Wages of Skilled/Semi-skilled Workers
Labour Market Intelligence Survey

List of FiguresFigure 1: Percentage Distribution of Coverage by Province
Figure 2: Percentage Distribution of Establishment by Sub-sector and Province
Figure 3: Percentage Distribution of Establishment by Working Status & Province
Figure 4: Percentage Distribution of Year of Establishment-Pakistan
Figure 5: Percentage Distribution of Establishment by Corporate Status of the Establishment, by Province
Figure 6: Distribution of Skilled Workers and Semi-skilled Workers, by Province
Figure 7: Distribution of Employees by Status of Employment in Pakistan
Figure 8: Percentage Distribution of Skilled/Semi-skilled Employees by Gender (excluding Admin and General Workers)
Figure 9: Number of Skilled/Semi-skilled Employees by Gender and Type of Training
Figure 10: Employment Trend of Skilled/ Semi-skilled Workers by Type of Contract and Province as in December 2013
Figure 10(a): Employment Trend of Skilled/ Semi-skilled Workers by Type of Contract and Province as on December 2009
Figure 11: Employment Trend of Skilled/ Semi-skilled Workers, by Level of Education, No. of Employees in 2013
Figure 11(a): Employment Trend of Skilled/ Semi-skilled Workers, by Level of Education, No. of Employees in 2009
Figure 12: Recruitment of skilled/semi-skilled Workers by Priority – Punjab
Figure 12(a): Recruitment of Skilled/Semi-skilled Workers by Priority - Sindh
Figure 12(b): Recruitment of Skilled/Semi-skilled Workers by Priority - KP
Figure 12(c): Recruitment of Skilled/Semi-skilled Worker by Priority – Balochistan
Figure 13: First Priority in Selection of Skilled/Semi-Skilled Workers from Di�erent Source of Supply in Pakistan
Figure 14: Level of Satisfaction of Skilled Workers Trained from Public TVET Institutions in Pakistan by Sub-sector (%)
Figure 14(a): Level of Satisfaction of Skilled Workers Trained from Private TVET Institutions in Pakistan by Sub-sector (%)
Figure 14(b): Level of Satisfaction of Skilled Workers Trained from ‘Ustadi-Shagirdi’ in Pakistan by Sub-sector (%)
Figure 14(c): Level of Satisfaction of Skilled Workers Trained from Family Trade in Pakistan by Sub-sector (%)
Figure 14 (d): Level of Satisfaction of Skilled Workers Trained with “On Job” Training in Pakistan, by Sub-sector (%)
Figure 14(e): Level of Satisfaction of Skilled Workers Trained with Apprenticeship in Pakistan by Sub-sector (%)
Figure 15: Required Enhancement to Improve Skill Level of Skilled Worker Trained by Public TVET Institutions in Pakistan
Figure 15(a): Required Enhancement to Improve Skill Level of Skilled Worker Trained by Private TVET Institutions in Pakistan
Figure 16: Shortage of any Particular Skill by Sub-sector in Pakistan
Table 29: Satisfaction or otherwise with the Standards of Skill of Skilled Worker - Pakistan
Table 30: Level of Satisfaction of Skilled Workers Trained from Public TVET Institutions
Table 30(a): Level of Satisfaction of Skilled Workers Trained from Private TVET Institutions
Table 30(b): Level of Satisfaction of Skilled Workers Trained from ‘Ustadi-Shagirdi’
Table 30(c): Level of Satisfaction of Skilled Workers Trained from Family Trade
Table 30(d): Level of Satisfaction of Skilled Workers Trained with “On Job” Training
Table 30(e): Level of Satisfaction of Skilled Workers Trained with Apprenticeship
Table 31: Required Enhancement to Improve Skill level of Skilled Worker Trained by Public TVET Institutions
Table 31(a): Required Enhancement to Improve Skill level of Skilled Worker Trained by Private TVET Institutions
Table 32: Shortage of any particular Skill by Sub-sector
Table 33: Preference of the Employers to Manage the Shortage of Skilled/Semi-skilled Workers
Table 33(a): Employers’ Preference to Manage the Shortage of Skilled/Semi-skilled Workers – by Sub-sector
Table 34: Factory Plan for Expansion within next two years
Table 35: Additional Employment required for Expansion of Factory Over next two years (% of Total Employment)
Table 36: Additional Employees required for Expansion of Factory Over next two years
Table 37: Additional Employees Required Annually for Establishments with no Expansion Plans (% of Total
Employment)
Table 38: Additional Employees Required Annually for Establishments with no Expansion
Labour Market Intelligence Survey
Food Processing Industry | 08
09 | Food Processing Industry
List of Abbreviations
BoS Bureau of Statistics
DAE Diploma in Associate Engineering
GIZ Deutsche Gesellschaftfür Internationale Zusammenarbeit GmbH
HR Human Resource
LMIS Labour Market Information System
KP Khyber Pakhtunkhwa
NAVTTC National Vocational and Technical Training Commission
NOSS National Occupational Skills Standards
NSS National Skills Strategy
PASCO Pakistan Standard Classification of Occupations
PVTC Punjab Vocational Training Council
TEVTA Technical Education and Vocational Training Authority
TVET Technical, Vocational Education and Training
ERP ???
Labour Market Intelligence Survey

Executive SummaryThe TVET Reform Support Programme aims at assisting the Government of Pakistan in the implementation of
its TVET sector reform plans in general and in implementing the National Skills Strategy in particular. Under the
programme’s Second and Third Components – Vocational Counseling and Job Placement and E�ective and
Innovative Training Delivery and Labour Market Information and Services, National Vocational & Technical
Training Commission (NAVTTC), provincial Technical Education and Vocational Training Authorities (TEVTAs
and Punjab Vocational Training Council (PVTC) are being assisted in capacity management and analyzing
labour market information for more e�ective planning and policy development for promoting skills
development. The labour market intelligence surveys of the emerging sectors of the economy is expected to
help enhancing understanding on labour market trends, skill profiles, identify skill shortages and training needs
based on the preferences of the employers.
Based on the analysis of the labour market intelligence survey data of more than two hundred establishments
in the food processing industry across Pakistan, it is observed that the largest share of these establishments
were involved in production of sweets, to�ee candy and bakery products, followed by manufacturers of soft
and other bottled water. Majority of employees falls under the semi-skilled workers category while skilled
workers account for just a tenth of total employment in the sector. Almost half of skilled and semi-skilled
workers were employed on regular basis and a third on temporary basis. Almost one third of skilled/semi-skilled
employees were engaged in manufacturing of soft drinks and bottled water, another one-third in manufacturing
of dairy products, one tenth in fruits processing. Less than a tenth of the total skilled/ semi-skilled employees
were women, mostly involved in manufacturing of bakery products. The above analysis shows that there is large
potential of growth investment and employment in fruit processing and meat processing sub-sectors.
The information gathered on hiring practices of the employers reveal that personal contacts and hiring based
on some reference are the most preferred methods – prevalent in more than two thirds of recruitment of
workers. Around one third of establishments prefer hiring skilled/semi-skilled workers trained through the
informal mechanisms (ustadi-shagirdi) while a quarter of establishments hire skilled/semi-skilled workers
trained from public TVET institutions. Wages of skilled/ semi-skilled workers are set based on the basis of actual
skills possessed by the workers in most cases, followed be setting wages according to the market trend. Only a
small fraction of employers prefer TEVT education in terms of determining wages of skilled workers.
Overwhelming majority of the employers expressed their satisfaction with the skills standard of the existing
skilled/semi-skilled workers, the highest proportion of satisfied establishments with the skills standard were in
the processing and preserving of fruits and vegetables sub-sector while the lowest proportion belonged to
establishments engaged in manufacturing of dairy products. The survey results show that employers are
satisfied with the existing skilled/ semi-skilled workers trained through the informal ustadi-shagirdi system
compared to the workers trained on the job and those trained from public TVET institutions. However, the
employers assign high priority to practical training and training on modern equipment in order to improve
public and private TVET institutions. Around a quarter of establishments in the food processing sector report
skills shortages, mostly reported by the establishments in Punjab.
In order to enrich the data analysis, field visits to some of the establishments in Karachi and Lahore helped in
firming up the recommendations, which include the need for developing linkages between TVET institutions/
universities and industry; promoting teacher training through attachment and collaboration with industry;
mandatory attachment of TVET students with industry to get practical working experience; creating awareness
about the importance and benefits of research for better planning and policy making. It was good to note that
the industry is willing to o�er internship opportunities for fresh graduates in relevant fields if an appropriate
agreed mechanism is devised in order to benefit from such opportunities for the benefit of employer as well as
potential employees.
Labour Market Intelligence Survey
Food Processing Industry | 10
11 | Food Processing Industry
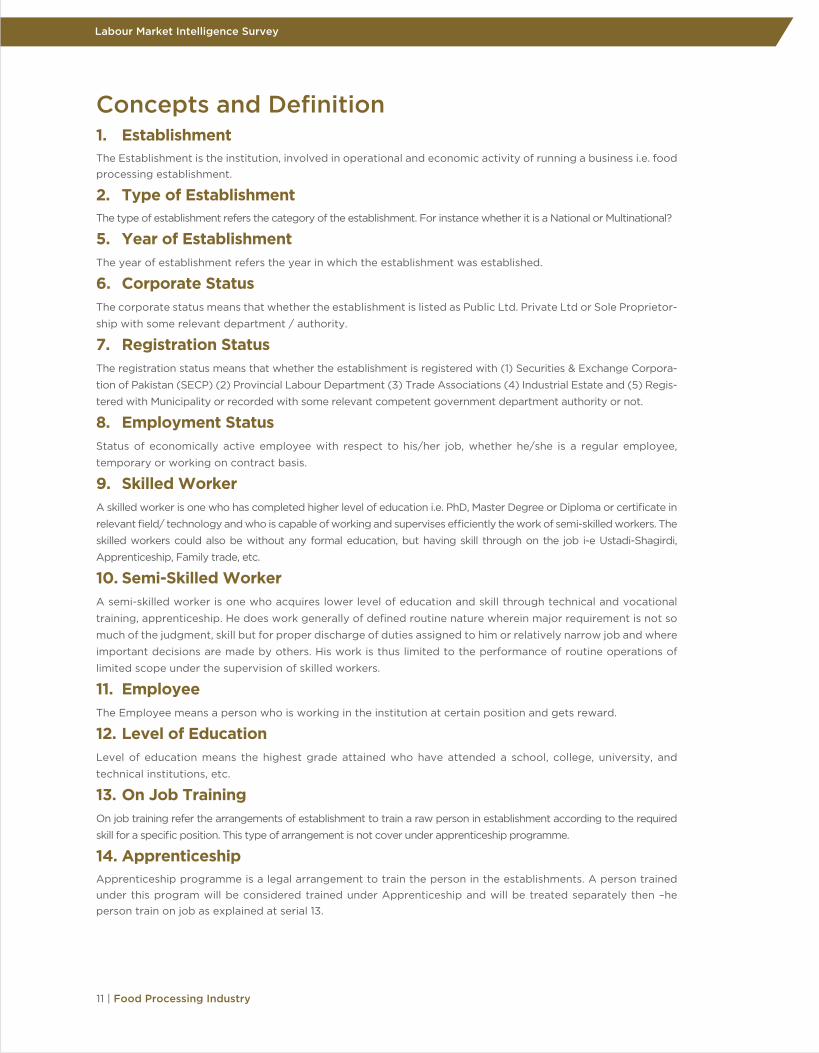
Concepts and Definition1. EstablishmentThe Establishment is the institution, involved in operational and economic activity of running a business i.e. food processing establishment.
2. Type of EstablishmentThe type of establishment refers the category of the establishment. For instance whether it is a National or Multinational?
5. Year of EstablishmentThe year of establishment refers the year in which the establishment was established.
6. Corporate StatusThe corporate status means that whether the establishment is listed as Public Ltd. Private Ltd or Sole Proprietor-
ship with some relevant department / authority.
7. Registration StatusThe registration status means that whether the establishment is registered with (1) Securities & Exchange Corpora-
tion of Pakistan (SECP) (2) Provincial Labour Department (3) Trade Associations (4) Industrial Estate and (5) Regis-
tered with Municipality or recorded with some relevant competent government department authority or not.
8. Employment StatusStatus of economically active employee with respect to his/her job, whether he/she is a regular employee,
temporary or working on contract basis.
9. Skilled WorkerA skilled worker is one who has completed higher level of education i.e. PhD, Master Degree or Diploma or certificate in
relevant field/ technology and who is capable of working and supervises e�ciently the work of semi-skilled workers. The
skilled workers could also be without any formal education, but having skill through on the job i-e Ustadi-Shagirdi,
Apprenticeship, Family trade, etc.
10. Semi-Skilled WorkerA semi-skilled worker is one who acquires lower level of education and skill through technical and vocational
training, apprenticeship. He does work generally of defined routine nature wherein major requirement is not so
much of the judgment, skill but for proper discharge of duties assigned to him or relatively narrow job and where
important decisions are made by others. His work is thus limited to the performance of routine operations of
limited scope under the supervision of skilled workers.
11. EmployeeThe Employee means a person who is working in the institution at certain position and gets reward.
12. Level of EducationLevel of education means the highest grade attained who have attended a school, college, university, and
technical institutions, etc.
13. On Job TrainingOn job training refer the arrangements of establishment to train a raw person in establishment according to the required
skill for a specific position. This type of arrangement is not cover under apprenticeship programme.
14. ApprenticeshipApprenticeship programme is a legal arrangement to train the person in the establishments. A person trained under this program will be considered trained under Apprenticeship and will be treated separately then –he person train on job as explained at serial 13.
Labour Market Intelligence Survey

1. IntroductionThe TVET Reform Support Programme has been assisting the Government of Pakistan in the implementation of its TVET sector reform plans. The programme is funded by the European Union, the Embassy of the Kingdom of the Netherlands, the Federal Republic of Germany and the Royal Norwegian Embassy, has been commissioned by the German Federal Ministry for Economic Cooperation and Development (BMZ). The Deutsche Gesellschaftfür Internationale Zusammenarbeit (GIZ) GmbH is implementing this programme in close collaboration with the National Vocational and Technical Training Commission (NAVTTC)), provincial Technical Education and Vocational Training Authorities (TEVTAs) and other TVET related institution like Punjab Vocational Training Council (PVTC).
The programme aims to assist the Pakistani governments at the federal and provincial levels to implement the National Skills Strategy (NSS). The module objective is to improve access to vocational education and training, in which equal opportunities, relevance and quality are enhanced. The programme extends to all provinces. The Program has five Components:
Under Component 3 – E�ective and Innovative Training Delivery and Labour Market Information and Services, Vocational Counseling and Job Placement, the TVET Reform Support Programme is assisting the National Vocational and Technical Training Commission (NAVTTC) along with the provincial Technical Education and Vocational Training Authorities (TEVTAs) and Punjab Vocational Training Council (PVTC) to establish and improve their capacity for managing and analyzing labour market information for developing more responsive plans and policies for promoting skills development.
In line with its support under Component 3, the TVET Reform Support Programme is conducting labour market intelligence surveys in the emerging sectors of the economy to enhance knowledge on Labour market trends, skill profiles, identify skill shortages, skill training needs, skills exceeding demand, and preferences/capacities of the employers. It would help to assess the needs of the market for demanded skills and would also prove helpful in selecting and designing skill specific curricula.
This Report presents findings from the Labour Market Intelligence Survey conducted for the Food Processing Sector. The objectives of this survey are summarized below:
1. Collection of data to determine the gap between demand and supply of skilled and semi-skilled workers.
2. Assessment of training needs, i.e., identification of the key training and technical skills required
by the employers.
3. Facilitating to develop National Occupational Skills Standards (NOSS) for the demanded occupations based on information from labour market intelligence4. Facilitating NAVTTC, PEVTAs and other stakeholders to utilize the NOSS and introduce new disciplines in TVET institutes and schools.
5. Feedback to Pakistan Bureau of Statistics (PBS) in revising the Pakistan Standard Classification of Occupations (PASCO).
Labour Market Intelligence Survey
Food Processing Industry | 12
Co
mp
one
nt 1
TVET Governanceand Management
Co
mp
one
nt 2 Vocational
QualificationsFrameworkd (NQF)and Human ResourceDevelopment (HRD)
Co
mp
one
nt 4
Capacity Buildingfor TEVTAs
Co
mp
one
nt 5
CooperativeTraining and GreenSkills
Co
mp
one
nt 3
Innovative TVETand Labour MarketInformation andServices.

13 | Food Processing Industry
2. MethodologyThe Component 3 team designed a questionnaire and circulated among the local experts and other concerned institutions for their comments / suggestions. The inputs received from various stakeholders were reviewed and questionnaire was redesigned. The revised questionnaire was placed before Technical Working Group (TWG) a national forum to streamline and supervise the Skill Information System in the country under NAVTTC. The questionnaire was approved by the forum. A copy of the questionnaire is placed at Appendix I.
All food processing units covered in the Census of Manufacturing Industries (CMI) conducted by Bureaus of Statistics (BoS) were taken as universe. BoS Punjab was given the task to work out the suitable sample size to obtain reliable information. The sampling technique has been exercise keeping in view the purposive process that helped in determining the representative sample in all selected provinces. The sample units were selected by using simple random sampling.
A two days comprehensive training programme was organized at Lahore to impart directly training to the field o�cers before starting the field operation. The questionnaire was discussed at length during training sessions held with field O�cers. A Manual of Instructions was also prepared containing concepts, definitions and terminology to be used in survey for guidance. The training programme was supervised by Director General Director, Data Analyst of BOS Punjab and Deputy Team leader of Component 3 GFA. Mock interviews were also conducted in training session to get more acquainted with questionnaire. Pilot testing of questionnaire was also carried out by di�erent enumerators. Data was collected through face to face interview. Highly qualified O�cers from all four provincial Bureau of Statistics were assigned the responsibility as enumerators.
The coverage of survey was highly encouraging. Out of 228 selected units 222 establishments responded and provided the requisite information as per designed questionnaire. It works out 97 percent coverage which is high level coverage even comparing with international standard. The coverage in detail is discussed in Chapter 3.
Labour Market Intelligence Survey

3. Establishment Profile
3.1 CoverageA total of 228 establishments in the food processing sector were selected for the Labour Market Intelligence
Survey and information was collected through interview of employers and HR department of selected
establishments. Response was obtained from 222 establishments, representing 97 percent of the selected
sample. The break-up of the response received by the di�erent sub-sectors of food processing sector is shown
in table 1.
Table 1: Survey Coverage – by category
The distribution of the study sample, including both filled in questionnaires as well as non-response by province is presented in table 2 and figure 1. The majority of the filled in questionnaires were from the province of Punjab at 118 (53.2 percent of total sample), while 10 (4.5 percent) of the questionnaires were from Balochistan. The highest number of refusals was also from Punjab at 4, compared to 1 each from Sindh and Khyber Pakhtunkhwa (KP).
Table 2: Survey Coverage – by Province
* The target sample of establishments for Sindh was 70, but due to the prevailing law & order situation at the
time of survey, data from only 39 establishments was collected.
Labour Market Intelligence Survey
Food Processing Industry | 14
Province
Punjab
Sindh*
KP
Balochistan
Total
Filled in
118
39
55
10
222
Refusal etc.
4
1
1
0
6
Total
122
40
56
10
228
Coverage (%)
97
98
98
100
97
Description
Processing & Preserving of Meat
Processing & Preserving of Fruits & Vegetables
Manufacture of Dairy Products
Sweets Honey To�ee Candy and Bakery Products
Manufacture of Soft & Other Bottled Water
Total
Filled in
8
38
42
87
47
222
Refusal etc.
0
1
1
3
1
6
Total
8
39
43
90
48
228
Coverage (%)
100
97
98
97
98
97

The further break up of responses received from the establishments by di�erent sub-sectors of the food processing sector across the four provinces is given in table 3 and figure 2. The largest number of establishments at 87 (39.2 percent) were involved in production of sweets, to�ee candy and bakery products, followed by manufacturers of soft and other bottled water at 47 (21.2 percent) and manufacturers of dairy products – 42 (18.9 percent). Only 8 establishments (3.6 percent of the total sample) were engaged in processing and preserving of meat. In the province of Punjab, the highest number of sampled establishments were involved in manufacture of dairy products (40), followed by sweets, candy and bakery products (36) and processing and preserving of fruits & vegetables (28). In Sindh, 19 establishments were manufacturers of soft drinks & other bottled water and 11 were engaged in production of sweets, candy & bakery products. In KP, the significant majority of establishments at 35 (36.6 percent) were producing sweets, candy & bakery products, while 14 establishments were producing soft drinks and other bottled water. Similarly, in Balochistan, the majority of establishments (5) were producing sweets, candy & bakery products.
Table 3: Number of Establishments by Sub-sector and Province
15 | Food Processing Industry
Labour Market Intelligence Survey

Labour Market Intelligence Survey
Food Processing Industry | 16
In Punjab, food processing sector is dominated by Dairy Products in contrast with
Sindh where Soft Drinks & other Bottled Water has major share in the sector. On the
other hand, in KP and Baluchistan majority of establishments are engaged in
producing sweets, candy & bakery products.

17 | Food Processing Industry
Labour Market Intelligence Survey
3.2 Work StatusThe analysis of sample establishments by working status, i.e., whether an establishment is working on a seasonal basis or is operational throughout the year, is presented in table 4 and figure 3 by province and sub-sector. The data shows that overall a majority of the sample establishments – 166 (75 percent) are working throughout the year, while 56 (25 percent) work on a seasonal basis. The proportion of establishments working year round is highest in Balochistan, where all 10 sample establishment work throughout the year, followed by Sindh (92 percent), KP (72.7 percent) and Punjab (67.8 percent). In Punjab, the largest numbers of establishments working on a seasonal basis are in the sub-sector of processing and preserving of fruits & vegetables (22), followed by manufacturers of dairy products (13). In KP, the largest number of seasonal establishments is in the manufacturing of dairy products (8) and soft drinks & bottled water sub-sectors (6).
Table 4: Number of Establishments by Sub-sector, Province and Working Status
Sub-sectors
Processing & Preservingof MeatProcessing & Preservingof Fruit & VegetablesManufacturing of Dairy ProductsManufacturing of Bakery ProductsManufacturing of Soft Drinks & Other Bottled WaterTotal Food Processing
PunjabSeasonal
0
22
13
2
1
38
All time2
6
27
34
11
80
Sindh
Seasonal1
1
0
0
1
3
All time3
4
0
11
18
36
KP
Seasonal0
0
1
8
6
15
All time1
4
0
27
8
40
Balochistan
Seasonal0
0
0
0
0
0
All time1
1
1
5
2
10
Total
Seasonal1
23
14
10
8
56
All time7
15
28
77
39
166

Labour Market Intelligence Survey
Food Processing Industry | 18
3.3 Year of EstablishmentInformation on the year of establishment of the sample firms by sub-sector is given in table 5 and figure 4. Data
for 14 establishments is missing, implying that information on year of establishment is only available for 208 of
the sample establishments. The analysis indicates that more than half of the sample establishments – 121 (54.5
percent) were set up during 1991-2010. Another 19 percent (42) were set up during 1971-90. Most of the
establishments in operation before 1950 are in the manufacturing of dairy products (5) and processing &
preserving of fruits and vegetables (3) sub-sectors; whereas majority of the newer establishments set up after
2011 are in manufacturing of bakery products and soft drinks and bottled water sub-sectors, at 5 each. Within all
the five sub-sectors, the majority of sample establishments have been established during 1991-2010.
Table 5: Year of Establishment by Sub-sector
Sub-sectors
Year of
Establishment
Before 1950
1951-1970
1971-1990
1991-2010
After 2011
Missing
Total
Processing &
Preserving
of Meat
0
0
1
5
0
2
8
Processing &
Preserving of
Fruit & Vegetables
3
8
6
19
2
0
38
Manufacturing
of Dairy
Products
5
3
19
12
1
2
42
Manufacturing
of Bakery
Products
1
2
11
59
9
5
87
Manufacturing of
Soft Drinks
& Other Bottled Water
1
1
5
26
9
5
47
Food
Processing
10
14
42
121
21
14
222
The survey reveals that over all percentage growth in food processing sector increased from 14% during 1951-71 to peak at 200 % during 1971-90. It declined slightly to 188 % during 1991-2010.

Table 6 shows the disaggregation of the year of establishment by all four provinces of the country. It is seen that the majority of establishments in the provinces of Punjab, Sindh and KP were set up during the period 1991-2010. In Balochistan 3 establishments were set up in 1991-2010 and another 2 were established after 2011, while data on year of establishment for 2 is missing.
Table 6 Year of Establishment by Province
The break-up of establishments by year of set up and sub-sector for the province of Punjab is presented in table 7. The majority of establishments in the processing & preserving of fruits & vegetables, manufacturing of bakery products and soft drinks and bottled water sub-sectors at 17 (60.7 percent), 23 (64 percent) and 6 (50 percent) were set up during the period 1991-2010. A large proportion of establishments in the manufacturing of dairy products sub-sector at 19 (47.5 percent) were established during 1991-2010.
19 | Food Processing Industry
Labour Market Intelligence Survey
Before 1950
1951-1970
1971-1990
1991-2010
After 2011
Missing
Total
Punjab
7
10
32
58
5
6
118
Sindh
0
2
6
24
4
3
39
KP
1
2
3
36
10
3
55
Balochistan
2
0
1
3
2
2
10
Total
10
14
42
121
21
14
222

Table 7 Year of Establishment by Sub-sector, Punjab
In Balochistan, a majority of establishments in the largest sub-sector – manufacturing of bakery products, were established during 1991-2010, while the single sample establishments in the fruits and vegetables and dairy products sub-sectors have been working before 1950 (table 10).
Table 10 Year of Establishment by Sub-sector, Balochistan
Sub-sectors
Year of
Establishment
Before 1950
1951-1970
1971-1990
1991-2010
After 2011
Missing
Total
Processing &
Preserving
of Meat
0
0
1
0
0
1
2
Processing &
Preserving of
Fruit & Vegetables
1
0
0
1
2
0
4
Manufacturing
of Dairy
Products
0
0
0
1
0
0
1
Manufacturing
of Bakery
Products
0
2
1
26
4
2
35
Manufacturing of
Soft Drinks
& Other Bottled Water
0
0
2
7
4
1
14
Food
Processing
1
2
3
36
10
3
55
Sub-sectors
Year of
Establishment
Before 1950
1951-1970
1971-1990
1991-2010
After 2011
Missing
Total
Processing &
Preserving
of Meat
0
0
0
0
0
1
1
Processing &
Preserving of
Fruit & Vegetables
1
0
0
0
0
0
1
Manufacturing
of Dairy
Products
1
0
0
0
0
0
1
Manufacturing
of Bakery
Products
0
0
1
3
1
0
5
Manufacturing of
Soft Drinks
& Other Bottled Water
0
0
0
0
1
1
2
Food
Processing
2
0
1
3
2
2
10
Labour Market Intelligence Survey
Food Processing Industry | 20
The analysis above reveals that growth in the food processing sector during the period
1991-2010 has been driven mainly by the processing & preserving of meat, fruits &
vegetables and manufacturing of soft drinks & other bottled water sub-sectors. This has led
to expansion of skills requirements in these sub-sectors which needs to be adequately
catered to in order to sustain the growth momentum.

21 | Food Processing Industry
Labour Market Intelligence Survey
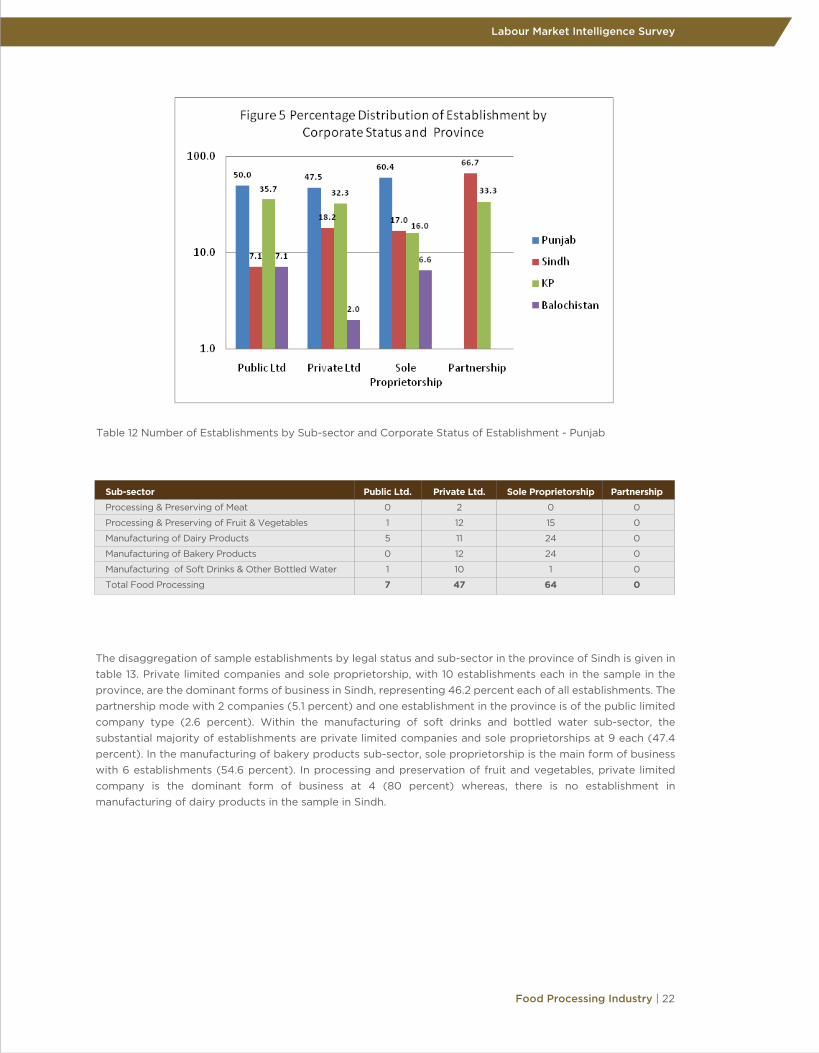
3.4 Legal StatusInformation on the legal status of the sample establishments by sub-sector is provided in table 11 and its provincial disaggregation is shown in figure 5. Out of the total of 222 establishments whose data is available, the largest number of establishments (106) has been established as sole proprietorship, representing over 47 percent of all establishments. Another 99 establishments are private limited companies (44.6 percent), while 14 are public limited companies listed on the stock exchange. Only 3 establishments are working as partnerships.
Within the bakery products manufacturing sub-sector, most of the establishments are sole proprietorships and private limited companies at 47 and 37, accounting for 54 percent and 42.6 percent of establishments in this sub-sector, respectively. In the soft drinks and other bottled water sub-sector, the majority of establishments at 28 (60 percent) are private limited companies, followed by sole proprietorships at 14 (30 percent) and 5 public limited companies (12 percent). Majority of establishments in dairy products sub-sector are sole proprietorships – 25 (60 percent), followed by 12 private limited companies (29 percent). In the fruits and vegetable and meat processing and preserving sub-sectors, most of the establishments are private limited companies and sole proprietors, at 18 & 17 (92 percent) and 4 & 3 (87.5 percent), respectively.
Table 11 Number of Establishments by Sub-sector and Corporate Status of Establishment - Pakistan
The disaggregation of sample establishments by legal status and sub-sector in the province of Punjab is given in table 12. Sole proprietorship, with 64 establishments, is the dominant form of business in Punjab, representing 54 percent of all establishments, which is followed by private limited companies (40 percent), while no establishment in the province is of the partnership type. Within the soft drinks and bottled water sub-sector, the substantial majority of establishments are private limited companies at 10 (89.3 percent). In the manufacturing of bakery and dairy products sub-sectors, sole proprietorship is the main form of business with 24 establishments each (60 percent and 66.7 percent of the respective sample in the province). In manufacturing of soft drinks & other bottled water sub-sector, private limited company is the main form of business representing 83.3 percent of the sample in the province.
Sub-sector
Processing & Preserving of Meat
Processing & Preserving of Fruit & Vegetables
Manufacturing of Dairy Products
Manufacturing of Bakery Products
Manufacturing of Soft Drinks & Other Bottled Water
Total Food Processing
Public Ltd.
0
3
5
2
4
14
Private Ltd.
4
18
12
37
28
99
Sole Proprietorship
3
17
25
47
14
106
Partnership
1
0
0
1
1
3
Labour Market Intelligence Survey
Food Processing Industry | 22
The disaggregation of sample establishments by legal status and sub-sector in the province of Sindh is given in table 13. Private limited companies and sole proprietorship, with 10 establishments each in the sample in the province, are the dominant forms of business in Sindh, representing 46.2 percent each of all establishments. The partnership mode with 2 companies (5.1 percent) and one establishment in the province is of the public limited company type (2.6 percent). Within the manufacturing of soft drinks and bottled water sub-sector, the substantial majority of establishments are private limited companies and sole proprietorships at 9 each (47.4 percent). In the manufacturing of bakery products sub-sector, sole proprietorship is the main form of business with 6 establishments (54.6 percent). In processing and preservation of fruit and vegetables, private limited company is the dominant form of business at 4 (80 percent) whereas, there is no establishment in manufacturing of dairy products in the sample in Sindh.
Table 12 Number of Establishments by Sub-sector and Corporate Status of Establishment - Punjab
Sub-sector
Processing & Preserving of Meat
Processing & Preserving of Fruit & Vegetables
Manufacturing of Dairy Products
Manufacturing of Bakery Products
Manufacturing of Soft Drinks & Other Bottled Water
Total Food Processing
Public Ltd.
0
1
5
0
1
7
Private Ltd.
2
12
11
12
10
47
Sole Proprietorship
0
15
24
24
1
64
Partnership
0
0
0
0
0
0

In KP province, break-up of the establishments by legal status and sub-sector are given in table 14. Private limited companies, with 32 establishments in the sample, are the dominant form of business in KP, representing 58.2 percent of all establishments, which is followed by the sole proprietorship mode with 17 establishments (30.9 percent). Presence of 5 public limited companies in food processing sector constitutes 9.1 percent of the sample in the province while just one partnership form of establishment represents 1.8 percent of the sample. Within the manufacturing of bakery products, the substantial majority of establishments are private limited companies at 21 establishments (60 percent) followed by sole proprietorship at 13 each (37.1 percent). In manufacturing of soft drinks & other bottled water, private limited company is the dominant form of business at 8 (57.1 percent) in the sample in KP.
Table 14 Number of Establishment by Sub-sector and Corporate Status of Establishment - KP
For Balochistan province, break-up of the establishments by legal status and sub-sector is given in table 15. Sole proprietorship, with 7 establishments in the sample, are the dominant form of business in Balochistan, representing 70 percent of all establishments, followed by the private limited companies mode with 2 establishments (20 percent). In the manufacturing of bakery products sub-sector, the majority of establishments are sole proprietorship at 4 establishments (80 percent).
Table 15 Number of Establishment by Sub-sector and Corporate Status of Establishment - Balochistan
Table 13 Number of Establishment by Sub-sector and Corporate Status of Establishment - Sindh
Sub-sector
Processing & Preserving of Meat
Processing & Preserving of Fruit & Vegetables
Manufacturing of Dairy Products
Manufacturing of Bakery Products
Manufacturing of Soft Drinks & Other Bottled Water
Total Food Processing
Public Ltd.
0
1
0
0
0
1
Private Ltd.
1
4
0
4
9
18
Sole Proprietorship
3
6
0
0
9
18
Partnership
0
0
0
1
1
2
Sub-sector
Processing & Preserving of Meat
Processing & Preserving of Fruit & Vegetables
Manufacturing of Dairy Products
Manufacturing of Bakery Products
Manufacturing of Soft Drinks & Other Bottled Water
Total Food Processing
Public Ltd.
0
1
0
1
3
5
Private Ltd.
0
2
1
21
8
32
Sole Proprietorship
0
1
0
13
3
17
Partnership
1
0
0
0
0
1
Sub-sector
Processing & Preserving of Meat
Processing & Preserving of Fruit & Vegetables
Manufacturing of Dairy Products
Manufacturing of Bakery Products
Manufacturing of Soft Drinks & Other Bottled Water
Total Food Processing
Public Ltd.
0
0
0
1
0
1
Private Ltd.
1
0
0
0
1
2
Sole Proprietorship
0
1
1
4
1
7
Partnership
0
0
0
0
0
0
23 | Food Processing Industry
Labour Market Intelligence Survey

Sub-sectors
Processing & Preservingof MeatProcessing & Preservingof Fruit & VegetablesManufacturing of Dairy ProductsManufacturing of Bakery ProductsManufacturing of Soft Drinks & Other Bottled Water
Total Food Processing
PakistanYes3
(37.5)16
(42.1)16
(38.1)29
(33.3)25
(53.2)89
(40.1)
No5
(62.5)22
(57.9)26
(61.9)58
(66.7)22
(46.8)133
(59.9)
PunjabYes2
(100)11
(39.3)16
(40)14
(38.9)9
(75)52
(44.1)
No0
(0)17
(60.7)24
(60)22
(61.1)3
(25)66
(55.9)
SindhYes
1(25)
4(80)
..6
(54.6)7
(36.8)18
(46.2)
No3
(75)1
(20)
..5
(45.5)12
(63.2)21
(53.9)
KPYes0
(0)0
(0)0
(0)8
(22.9)8
(57.1)16
(29.1)
No1
(100)4
(100)1
(100)27
(77.1)6
(42.9)39
(70.9)
BalochistanYes0
(0)1
(100)0
(0)1
(20)1
(50)3
(30)
No1
(100)0
(0)1
(100)4
(80)1
(50)7
(70)
The analysis by sub-sector across Pakistan indicates that the highest number as well as proportion of establishments with dedicated HR departments is in the manufacturing of soft drinks and other bottled water sub-sector at 25 (53.2 percent), followed by processing of fruits and vegetables sub-sector at 16 (42 percent) and manufacturing of dairy products at 16 (38 percent). The provincial disaggregation shows that in Punjab, all two establishments in the meat processing sub-sector and 75 percent (9) of establishments in soft drinks and bottled water manufacturing sub-sector, have a separate HR department. In Sindh, 80 percent (4), followed by 54.6 percent (6) and 36.8 percent (7) establishments have a separate HR department. In KP, 8 establishments each in manufacturing of soft drinks and manufacturing of bakery products sub-sectors have an HR department, representing 57 percent and 23 percent, respectively of all establishments in those sub-sectors. In Balochistan, one establishment each in soft drinks manufacturing, fruit & vegetables processing and manufacturing of dairy products sub-sectors has an HR department.
The disaggregation of establishments with HR departments that are maintaining proper record of their skilled employees is given in table 17 by sub-sector and province. Overall, the overwhelming majority of establishments with HR department across Pakistan – 95.5 percent (85) maintain record of skilled employees. The breakup across province shows that all three establishments in Balochistan, 50 establishments (96.2 percent) in Punjab, 17 establishments in Sindh (94.4 percent) and 15 establishments across KP (93.8 percent) are maintaining record of their skilled employees.
3.5 Existence of HR DepartmentThe responses of the sample establishments with respect to the presence of a dedicated human resource (HR) department are shown in table 16. Overall, at the national level, 89 establishments report having own HR department, representing 40 percent of the total sample. Province-wise, it is seen that the highest proportion of establishments with an HR department are in Sindh at over 46 percent (18), while the lowest proportion is in KP at 29 percent, comprising of 16 establishments.
Table 16 Establishments having Human Resource (HR) Department – by sub-sector and province
Note: Figures in parenthesis under each main column are row percentages.
.. no establishment included in the sample
Table 13 Number of Establishment by Sub-sector and Corporate Status of Establishment - Sindh
Labour Market Intelligence Survey
Food Processing Industry | 24

Sub-sectors
Processing & Preservingof MeatProcessing & Preservingof Fruit & VegetablesManufacturing of Dairy ProductsManufacturing of Bakery ProductsManufacturing of Soft Drinks & Other Bottled Water
Total Food Processing
PakistanYes3
(100)16
(100)16
(100)26
(89.7)24
(96)85
(95.5)
No0
(0)0
(0)0
(0)3
(10.3)1
(4)4
(4.5)
PunjabYes2
(100)11
(100)16
(100)12
(85.7)9
(100)50
(96.1)
No0
(0)0
(0)0
(0)2
(14.3)0
(0)2
(3.8)
SindhYes
1(100)
4(100)
..6
(100)6
(85.7)17
(94.4)
No0
(0)0
(0)
..0
(0)1
(14.3)1
(5.5)
KPYes
-
-
-7
(87.5)8
(100)15
(93.7)
No-
-
-1
(12.5)0
(0)1
(6.2)
BalochistanYes
-1
(100)
-1
(100)1
(100)3
(100)
No
-0
(0)
-0
(0)0
(0)0
(0)
- No responseThe analysis of sample establishments, both at the national level as well as by provincial breakup, maintaining record of skilled workers by sub-sector shows that all establishments in the meat preserving & processing, fruits & vegetables processing and manufacturing of dairy products sub-sectors are maintaining record of skilled employees. In case of the soft drinks & bottled water manufacturing sub-sector, over 96 percent (24) of establishments across Pakistan maintain record of skilled workers, while this proportion is 100 percent in Punjab, KP & Balochistan and 85.7 percent in Sindh. In the bakery products manufacturing sub-sector, around 90 percent (26) establishments with separate HR department across Pakistan, 100 percent (6) across Sindh & Balochistan (1), 87.5 percent (7) in KP and 85.7 percent (12) in Punjab report maintaining record of their skilled employees.
3.6 TVET Arrangement for Own EmployeesTable 18 presents information on the number of sample establishments having their own arrangements for imparting of technical and vocational training to their workers, by sub-sector and province. The analysis shows that 23 percent of establishments across Pakistan, totaling 51 have in-house arrangements for providing technical and vocational training. The provincial disaggregation reveals that 24 establishments in Punjab, 10 in Sindh, 16 in KP while none in Balochistan have own arrangements for provision of technical and vocational training; representing 20.3 percent, 25.6 percent and 29.1 percent, respectively of the sample establishments across these provinces.
Establishments in the soft drinks manufacturing sub-sector are seen to have highest number as well as share across all sub-sectors with own arrangements for provision of technical and vocational training at 17 (36.2 percent) across Pakistan. The provincial breakup across this sub-sector shows that 50 percent establishments in KP, nearly 42 percent in Punjab and 26.3 percent in Sindh have in-house arrangements for imparting technical and vocational training, while none of the two establishments in Balochistan have any arrangements for providing technical and vocational training. Following this, the highest share of establishments having own arrangements for technical and vocational training is in the dairy products manufacturing sub-sector at 23.8 percent, processing of fruits & vegetables sub-sector at 21 percent and manufacturing of bakery products sub-sector at 17.2 percent.
Note: Figures in parenthesis under each main column are row percentages. .. no establishment included in the sample
Table 17 Establishments Maintaining Record of Skilled Employees – by sub-sector and province
25 | Food Processing Industry
Labour Market Intelligence Survey

Sub-sectors
Processing & Preservingof MeatProcessing & Preservingof Fruit & VegetablesManufacturing of Dairy ProductsManufacturing of Bakery ProductsManufacturing of Soft Drinks & Other Bottled Water
Total Food Processing
PakistanYes
1(12.5)
8(21.1)
10(23.8)
15(17.2)
17(36.2)
51(22.9)
No7
(87.5)30
(78.9)32
(76.1)72
(76.2)30
(63.8)171
(77.0)
PunjabYes0
(0)3
(10.7)10
(25)6
(16.7)5
(41.7)24
(20.3)
No2
(100)25
(89.3)30
(75)30
(83.3)7
(58.3)94
(79.7)
SindhYes0
(0)3
(60)
..2
(18.2)5
(26.3)10
(25.6)
No4
(100)2
(40)
..9
(81.8)14
(73.7)29
(74.6)
KPYes
1(100)
2(50)
0(0)7
(20)7
(50)16
(29.1)
No0
(0)2
(50)1
(100)28
(80)7
(50)39
(70.9)
BalochistanYes0
(0)0
(0)0
(0)0
(0)0
(0)0
(0)
No1
(100)1
(100)1
(100)5
(100)2
(100)10
(100)
Information on the type of in-house training arrangement in establishments which reported ‘yes’ to having own arrangement of technical and vocational training is given in table 19, by sub-sector and province. The responses, which are overlapping suggest that majority of establishments (over 84 percent) conduct on job training as and when the need arises, over 39 percent have own training department/ institute to deliver trainings in-house, while nearly 22 percent establishments have a�liation with regular training centres. The provincial analysis shows that over 83 percent of establishments in Punjab, 90 percent in Sindh and 82.4 percent in KP conduct on job training when required, while 54 percent establishments in Punjab, 35.3 percent in KP and 10 percent in Sindh have own training department/ institute. Another 37.5 percent establishments in Punjab, 10 percent in Sindh and 6 percent in KP are a�liated with regular training centre, for delivery of technical and vocational training to their workers.
Table 19 Establishments having Own Training Arrangement (if yes in table 18) – by sub-sector and province
Table 18 Establishments having Own Arrangement of Technical &Vocational Training – by sub-sector and
province
Note: Figures in parenthesis under each main column are row percentages.
.. no establishment included in the sample
Table 17 Establishments Maintaining Record of Skilled Employees – by sub-sector and province
Labour Market Intelligence Survey
Food Processing Industry | 26
Processing &Preserving of MeatProcessing & Preserving of Fruit& VegetablesManufacturing of Dairy ProductsManufacturing ofBakery ProductsManufacturing of Soft Drinks & Other Bottled WaterTotal Food Processing
Sub-sector Own training institute A�liated with regular training centre
On job training in the establishment when required
Pakistan
100.0
87.5
80.0
86.7
82.4
84.3
-
100.0
80.0
83.3
80.0
83.3
-
-
-
100.0
80.0
90.0
100.0
50.0
-
85.7
85.7
82.4
Punjab Sindh PKPakistan
0.0
12.5
40.0
13.3
23.5
21.6
-
33.3
40.0
16.7
60.0
37.5
-
0.0
-
0.0
20.0
10.0
0.0
0.0
-
14.3
0.0
5.9
Punjab Sindh PKPakistan
0.0
37.5
60.0
33.3
35.3
39.2
-
66.7
60.0
16.7
80.0
54.2
-
0.0
-
50.0
0.0
10.0
0.0
50.0
-
42.9
28.6
35.3
Punjab Sindh PK

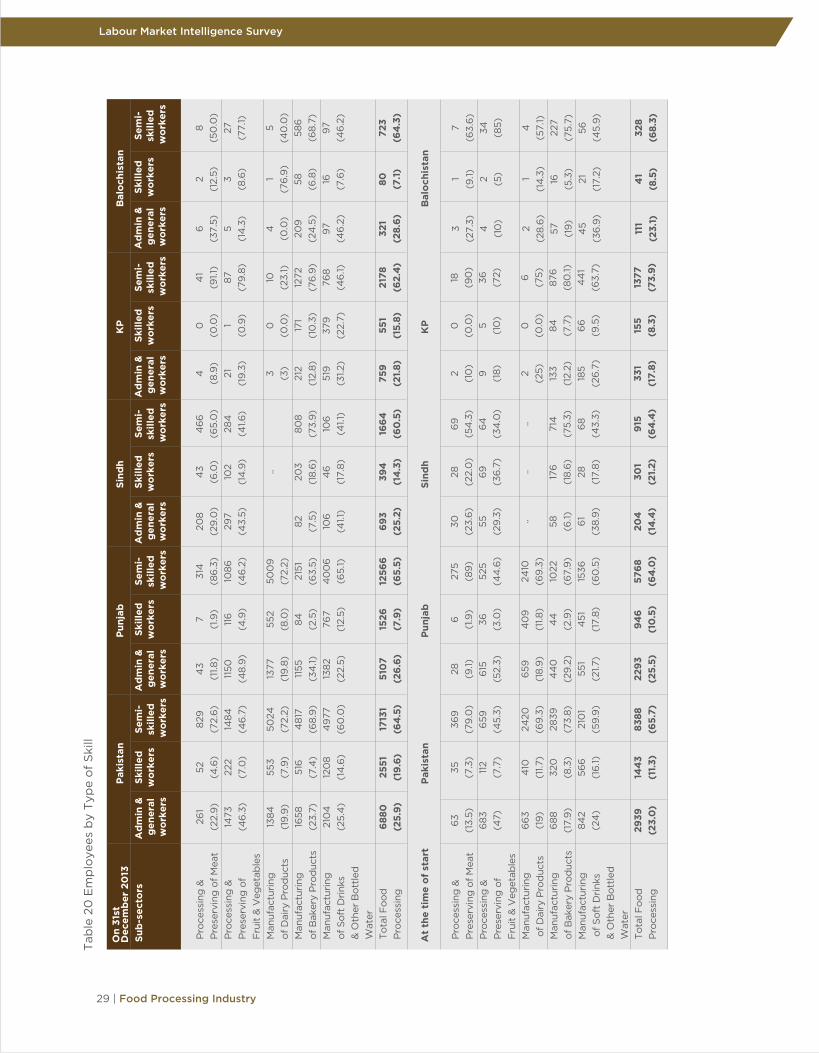
4. Employees ProfileThis section presents the results of the survey with respect to employment in the sample establishments. The total employment in the 222 sample establishments under di�erent categories is presented in table 20 by the five sub-sectors of the food processing sector for overall Pakistan and separately by province, in December 2013 and at time of start of production. The total employment across the sample establishments in December 2013 stood at 26,562, with the majority of employees (64.5 percent) falling under the semi-skilled workers category at 17,131. This is followed by administrative and general workers at 6,880 (26 percent), while skilled workers account for close to 10 percent of total employment (2,551).
The aggregate employment in these sample establishments stood at 12,770 at the time they commenced commercial operations, implying a growth of 108 percent upto December 2013. The analysis of growth in employment by di�erent skill type shows that the highest growth in employment in the food processing sector was recorded in the category of administrative and general workers, which grew by 134 percent, followed by growth in employment of semi-skilled workers (104.2 percent), while lowest growth was observed for the skilled workers category at 76.8 percent (Appendix 2). The disaggregated examination by sub-sector shows that the processing and preserving of meat sub-sector witnessed an abnormally high growth in administrative and general workers at 314.3 percent. The highest growth in skilled as well as semi-skilled workers was observed for the manufacturing of soft drinks and other bottled water sub-sector at 113.4 percent and 136.9 percent, respectively. The provincial analysis indicates that the highest growth in administrative and general workers was seen in Sindh (239.7 percent), while highest growth in skilled workers and semi-skilled workers was observed in KP (255.5 percent) and Balochistan (120.4 percent), respectively.
4.1 Composition of Employees by SkillThe break-up of employment by skill type and by the five sub-sectors of the food processing sector shows that
the highest proportion of skilled/ semi-skilled workers was in the manufacturing of dairy products sub-sectors;
accounting for 80 percent of all employment in this sector. On the other hand, the share of semi-skilled and
skilled workers was the lowest in the preserving and processing of fruits and vegetables sub-sectors,
representing close to 54 percent of all employment in this sub-sector. The share of skilled/ semi-skilled
employees in the remaining three sub-sectors ranged between 75 percent and 77 percent.
The distribution of employment in the sample establishments by province shows that majority of workers at
19,199 (72.3 percent) were working in establishments operating in the province of Punjab. The share of total
employment in Punjab based establishments at 72.3 percent is much higher than the share of these
establishments in the overall survey sample at 53.2 percent, implying that employment intensity is higher in
establishments operating in the province of Punjab. This was followed by employees working in establishments
operating in KP at 3,488 (12 percent), Sindh at 2,751 (10.4 percent) and Balochistan at 1,124 (4.2 percent). The
sub-sectoral analysis at the provincial level indicates that the highest share of skilled/ semi-skilled workers in
the province of Punjab is engaged in the meat processing sub-sectors at over 88 percent of that sub-sector’s
employment, while the lowest proportion of semi-skilled/ skilled workers is in the processing & preserving of
fruits and vegetables sub-sector at 51.1 percent. Thus, the abnormally high share of administrative and general
workers observed earlier for Pakistan is driven by the higher proportion of these workers in Punjab. In Sindh,
the largest proportion of skilled/ semi-skilled workers is found in the bakery products manufacturing sub-sector
at 92.5 percent, while in KP and Balochistan; the highest share of skilled/ semi-skilled workers is employed in
the meat processing and fruits & vegetables processing sub-sectors, respectively (91 percent and 85.7 percent).
The composition of total employment by skill type when the sample establishments started production
activities is also shown in table 20, for the overall food processing sector as well as separately by its five
sub-sectors. The total employment of all sample establishments across Pakistan at the time of start of their
production was 12,770, with the majority of workers at 8,388 (65.7 percent) being semi-skilled and 1,443 skilled
workers (11.3 percent). The remaining 2,939 workers (23 percent) were in the administrative
27 | Food Processing Industry
Labour Market Intelligence Survey

and general workers category. The comparison with the latter period of December 2013 thus shows that the
share of administrative and general workers in total employment has increased slightly to 26 percent.
The sub-sectoral analysis indicates that, in line with the earlier analysis of employment by skill type at end of
December 2013, the highest proportion of semi-skilled and skilled workers at the time of start of production was
engaged in the meat processing sub-sector at 86.5 percent (9,831). Similarly, the lowest proportion of skilled/
semi-skilled workers was in the fruit & vegetable processing and preserving sub-sector at 53 percent. The
analysis shows that the share of administrative and general workers has remained high at 47 percent in the
processing and preserving of fruits and vegetables sub-sector from the time of start of production. This would
indicate that the production process in this sub-sector does not require much skilled/ semi-skilled workforce, so
the establishments prefer to hire more general type of workers at a lower wage rate to meet their operational
requirements.
The distribution of employment at the time of start of production activities of the sample establishments by
province shows that the significant majority of employment was in establishments operating in the province of
Punjab at 9,007 (70.5 percent), followed by those in KP at 1,863 (14.6 percent), Sindh at 1,420 (11 percent) and
Balochistan at 480 (3.8 percent). The share of semi-skilled and skilled workers in total provincial employment
was the highest in Sindh at 85.6 percent, followed by KP (82.2 percent), Balochistan at 76.8 percent and Punjab
at 74.5 percent.
The sub-sectoral breakup of employment within each province shows that the highest share of semi-skilled
workers was in the processing and preserving of meat sub-sector in Punjab at 91 percent, manufacturing of
bakery products in Sindh at close to 94 percent, processing & preserving of meat sub-sector in KP at 90 percent
and processing & preserving of fruits and vegetables sub-sector in Balochistan at 90 percent. Figure 6 shows
the percentage distribution of skilled workers and semi - skilled workers across each of the four provinces.
Labour Market Intelligence Survey
Food Processing Industry | 28
29 | Food Processing Industry
Labour Market Intelligence Survey
On
31st
D
ecem
ber
20
13P
akis
tan
Pun
jab
Sind
hK
PB
alo
chis
tan
Sub
-sec
tors
Pro
cess
ing
&P
rese
rvin
g o
f Mea
tP
roce
ssin
g &
P
rese
rvin
g o
f F
ruit
& V
eget
able
sM
anuf
actu
ring
of D
airy
Pro
duc
tsM
anuf
actu
ring
o
f Bak
ery
Pro
duc
tsM
anuf
actu
ring
o
f So
ft D
rinks
&
Oth
er B
ott
led
Wat
erT
ota
l Fo
od
P
roce
ssin
g
Pro
cess
ing
&P
rese
rvin
g o
f Mea
tP
roce
ssin
g &
P
rese
rvin
g o
f F
ruit
& V
eget
able
sM
anuf
actu
ring
of D
airy
Pro
duc
tsM
anuf
actu
ring
o
f Bak
ery
Pro
duc
tsM
anuf
actu
ring
o
f So
ft D
rinks
&
Oth
er B
ott
led
Wat
erT
ota
l Fo
od
P
roce
ssin
g
261
(22.
9)
1473
(46
.3)
1384
(19
.9)
1658
(23.
7)21
04
(25.
4)
6880
(25.
9)
52 (4.6
)22
2(7
.0)
553
(7.9
)51
6(7
.4)
120
8(1
4.6
)
2551
(19.
6)
Ad
min
&
gen
eral
wo
rker
s
Skill
edw
ork
ers
Sem
i-sk
illed
wo
rker
s
829
(72.
6)
1484
(46
.7)
5024
(72.
2)4
817
(68.
9)
49
77(6
0.0
)
1713
1(6
4.5
)
43
(11.8
)11
50(4
8.9
)
1377
(19
.8)
1155
(34
.1)13
82(2
2.5)
510
7(2
6.6)
7(1
.9)
116
(4.9
)
552
(8.0
)84 (2.5
)76
7(1
2.5)
1526
(7.9
)
Ad
min
&
gen
eral
wo
rker
s
Skill
edw
ork
ers
Sem
i-sk
illed
wo
rker
s
314
(86
.3)
1086
(46
.2)
500
9(7
2.2)
2151
(63.
5)4
00
6(6
5.1)
1256
6(6
5.5)
208
(29
.0)
297
(43.
5)
82 (7.5
)10
6(4
1.1)
693
(25.
2)
43
(6.0
)10
2(1
4.9
)
..
203
(18.
6)
46
(17.
8)
394
(14
.3)
Ad
min
&
gen
eral
wo
rker
s
Skill
edw
ork
ers
Sem
i-sk
illed
wo
rker
s
46
6(6
5.0
)28
4(4
1.6)
808
(73.
9)
106
(41.1
)
1664
(60
.5)
4(8
.9)
21(1
9.3
)
3 (3)
212
(12.
8)51
9(3
1.2)
759
(21.
8)
0(0
.0)
1(0
.9)
0(0
.0)
171
(10
.3)
379
(22.
7)
551
(15.
8)
Ad
min
&
gen
eral
wo
rker
s
Skill
edw
ork
ers
Sem
i-sk
illed
wo
rker
s
41
(91.1
)87
(79
.8)
10(2
3.1)
1272
(76
.9)
768
(46
.1)
2178
(62.
4)
6(3
7.5)
5(1
4.3
)
4(0
.0)
209
(24
.5)
97
(46
.2)
321
(28.
6)
2(1
2.5) 3
(8.6
)
1(7
6.9
)58 (6.8
)16
(7.6
)
80 (7.1
)
Ad
min
&
gen
eral
wo
rker
s
Skill
edw
ork
ers
Sem
i-sk
illed
wo
rker
s
8(5
0.0
)27
(77.
1)
5(4
0.0
)58
6(6
8.7)
97
(46
.2)
723
(64
.3)
At
the
tim
e o
f st
art
Pak
ista
nP
unja
bSi
ndh
KP
Bal
och
ista
n
63
(13.
5)6
83(4
7)
66
3(1
9)
688
(17.
9)
842
(24
)
2939
(23.
0)
35 (7.3
)11
2(7
.7)
410
(11.7
)32
0(8
.3)
566
(16
.1)
144
3(1
1.3)
369
(79
.0)
659
(45.
3)
2420
(69
.3)
2839
(73.
8)21
01
(59
.9)
8388
(65.
7)
28 (9.1)
615
(52.
3)
659
(18.
9)
44
0(2
9.2
)55
1(2
1.7)
2293
(25.
5)
6(1
.9)
36 (3.0
)
40
9(1
1.8)
44
(2.9
)4
51(1
7.8)
946
(10
.5)
275
(89
)52
5(4
4.6
)
2410
(69
.3)
1022
(67.
9)
1536
(60
.5)
5768
(64
.0)
30(2
3.6
)55
(29
.3)
.. 58 (6.1) 61
(38.
9)
204
(14
.4)
28(2
2.0
)6
9(3
6.7
)
.. 176
(18.
6)
28(1
7.8)
301
(21.
2)
69
(54
.3)
64
(34
.0)
.. 714
(75.
3)6
8(4
3.3)
915
(64
.4)
2(1
0)
9 (18) 2
(25)
133
(12.
2)18
5(2
6.7
)
331
(17.
8)
0(0
.0)
5(1
0)
0(0
.0)
84 (7.7
)6
6(9
.5)
155
(8.3
)
18 (90
)36 (7
2) 6(7
5)87
6(8
0.1)
44
1(6
3.7)
1377
(73.
9)
3(2
7.3)
4 (10
)
2(2
8.6
)57 (19
)4
5(3
6.9
)
111
(23.
1)
1(9
.1) 2 (5) 1
(14
.3)
16(5
.3)
21(1
7.2)
41
(8.5
)
7(6
3.6
)34 (8
5) 4(5
7.1)
227
(75.
7)56
(45.
9)
328
(68.
3)
Tab
le 2
0 E
mp
loye
es b
y T
ype
of
Ski
ll

4.2 Composition of Employees by StatusThe composition of total employment in the sample establishments, in terms of the status of employees being hired ‘on regular basis’, ‘on temporary basis’ or ‘on contract’ is shown in table 21, for both December 2013 and at the time of start of production. The data shows that at end of December 2013, almost half of all employees (49.3 percent of the sample) across Pakistan were hired as ‘regular’ employees, while almost one third (31 percent) were hired on ‘temporary’ basis and around one fifth (20 percent) on ‘contract’ basis. Similar pattern in terms of status of employment is found prevalent with slight variation in all four provinces in the selected sample of food processing sector. In the provinces of Punjab and Sindh, the share of ‘regular’ employment in total employment in the sector is around 48 percent while in KP and Balochistan; it is higher – close to 57 percent. The share of employment on ‘contract’ basis in KP is just around 8 percent while it is non-existent in Balochistan.
The employment by status in December 2013 is di�erent if it is compared with the status of employment that existed at the time of ‘start of (each) business’ in the selected industries in the sample under review. At the time of start of business, the share of ‘regular’ employees was around 44 percent, with the share of ‘contract’ employees being 27 percent, while the share of ‘temporary’ employment stood at close to 30 percent. The comparison with December 2013 thus indicates that the employment structure in the food processing sector has improved over time, with increase in share of workers hired on the more secure regular basis. However, it is pertinent to point out that the increase in share of regular employment has been o�set by a fall in the share of contract employment (from 27 percent to 20 percent), while share of employment in the most vulnerable form, i.e., temporary employment has increased marginally from 30 percent to 31 percent.
At the sub-sectoral level, the employment by status across di�erent provinces is at variance from the national picture overall in the food processing sector. In the ‘processing and Preserving of meat’ sub-sector; in Punjab, Sindh and Balochistan, the overwhelming majority of employees was ‘regular’ (around 82 percent, 98 percent and 100 percent, respectively) in December 2013 while KP presents a case where majority of employees (around 73 percent) were ‘temporary’. However, ‘temporary’ employment in this sub-sector is non-existent in Sindh and Balochistan, while ‘contract’ employment is non-existent in this sub-sector in KP and Balochistan (table 21).
Labour Market Intelligence Survey
Food Processing Industry | 30

31 | Food Processing Industry
Labour Market Intelligence Survey
Over the years, the share of ‘regular’ employment in the processing & preserving of meat sub-sector has
declined in Punjab, Sindh and KP provinces (by almost 3, 2 and 3 percentage points respectively) while this
share remained at 100 percent in Balochistan (table 21). On the contrary, the share of ‘Temporary’ and ‘On
Contract’ employment in the industrial units in the sub-sector slightly increased.
In the ‘processing & preserving of fruits & vegetables’ sub-sector, a majority of employees were working on
‘regular’ basis (43 percent),with an almost equal proportion working on ‘temporary’ and ‘contract’ basis
(around 28 percent) in December 2013 (table 21). The situation has changed over the period since ‘start of (each
selected) business’, when the share of regular employees was around 26 percent, while the share of ‘contract’
employment arrangement was considerably high at 52.5 percent and ‘temporary’ employment accounted for
21.6 percent of total sub-sectoral employment. Similar improvement in the status of employment is also visible
in Punjab, where the share of regular employees is 39 percent in 2013 compared to 20 percent at the time of
start of business. During the same time period, the share of contract employees in the sub-sector fell from 62
percent to 37 percent, while the share of temporary employees increased from 19 percent to 24 percent. In
Sindh, the share of regular employees in the processing & preserving of fruits and vegetables sub-sector has
decreased slightly from around 57 percent at the time of start of business to 54 percent in December 2013, and
the share of contract employees declined from around 10 percent to 4 percent, while the share of temporary
employees has increased from around 33 percent to 42 percent, over the same period. In KP province, the share
of employment has changed marginally over the years, with the proportion of regular and temporary
employees increasing. In Balochistan, the share of temporary employment has increased from 57 percent to 65
percent, with the share in other two categories falling.
In the ‘Manufacturing of dairy products’ sub-sector almost half of the employees in Pakistan were working on
‘regular’ basis (50.5 percent), while almost half of the remaining employees were working on ‘temporary’ and
‘contract’ basis (around 26 percent and 23 percent respectively) in December 2013 (table 21). The situation is
not considerably di�erent from ‘start of (each selected) business’, when the share of regular employees was
around 47 percent compared to around 25 percent of employees on temporary basis and 28 percent on
contract basis.
The share of employment in the regular category in the ‘manufacturing of bakery products’ sub-sector
increased from 32 percent at time of start of production to 41.3 percent in December 2013. This was
accompanied by a decline in the share of contract employment from 39 percent to around 30 percent, over the
corresponding period. The pattern of change in Punjab in ‘manufacturing of bakery products’ sub-sector has
been almost similar as reported above in case of Pakistan in terms of status of employment, where the share of
regular employees was 40.7 percent in 2013 compared to 30.5 percent at the time of start of business. During
the same time period, the share of temporary employees in the sub-sector fell from around 29 percent at the
time of start of business to 25 percent in December 2013, while the share of contract employees decreased
from 40.7 percent at the time of start of business to 34.4 percent in December 2013.
Total
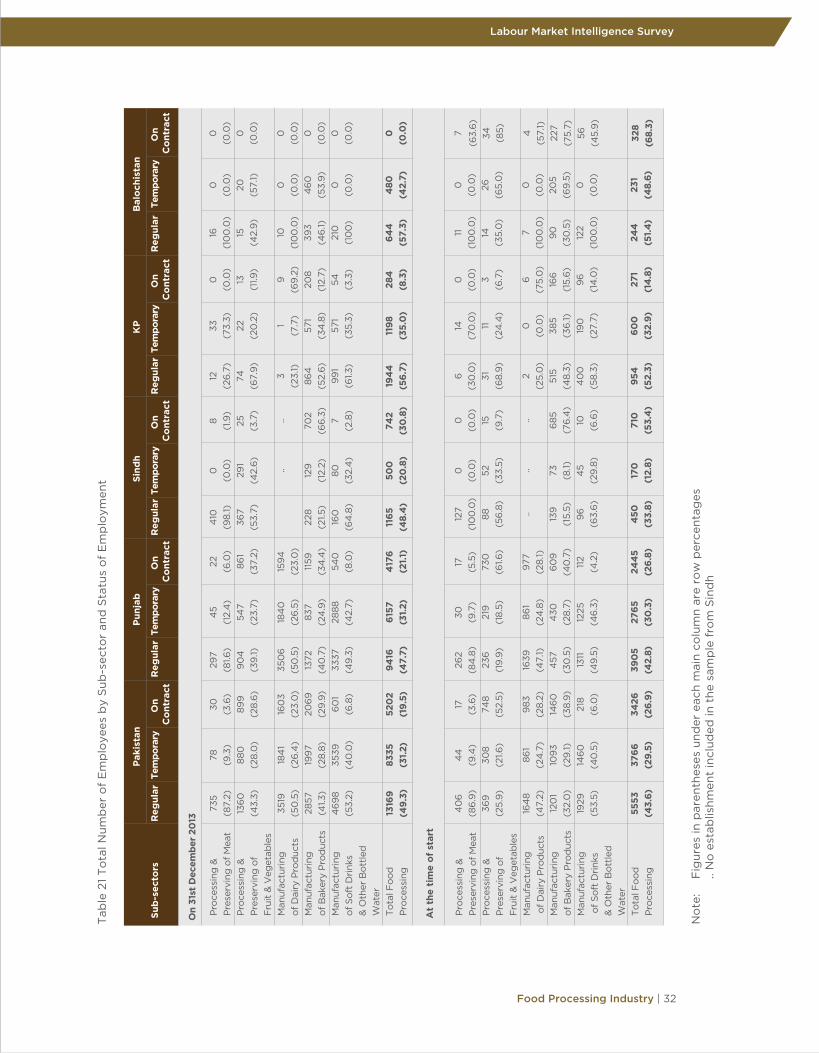
Labour Market Intelligence Survey
Food Processing Industry | 32
On
31st
Dec
embe
r 20
13
Pak
ista
nP
unja
bSi
ndh
KP
Bal
och
ista
n
Sub
-sec
tors
Pro
cess
ing
&P
rese
rvin
g o
f Mea
tP
roce
ssin
g &
P
rese
rvin
g o
f F
ruit
& V
eget
able
sM
anuf
actu
ring
of D
airy
Pro
duc
tsM
anuf
actu
ring
o
f Bak
ery
Pro
duc
tsM
anuf
actu
ring
o
f So
ft D
rinks
&
Oth
er B
ott
led
Wat
erT
ota
l Fo
od
P
roce
ssin
g
Pro
cess
ing
&P
rese
rvin
g o
f Mea
tP
roce
ssin
g &
P
rese
rvin
g o
f F
ruit
& V
eget
able
sM
anuf
actu
ring
of D
airy
Pro
duc
tsM
anuf
actu
ring
o
f Bak
ery
Pro
duc
tsM
anuf
actu
ring
o
f So
ft D
rinks
&
Oth
er B
ott
led
Wat
erT
ota
l Fo
od
P
roce
ssin
g
735
(87.
2)13
60
(43.
3)
3519
(50
.5)
2857
(41.3
)4
69
8(5
3.2)
1316
9(4
9.3)
78 (9.3
)88
0(2
8.0
)
184
1(2
6.4
)19
97
(28.
8)35
39(4
0.0
)
8335
(31.
2)
Reg
ular
Reg
ular
Reg
ular
Reg
ular
Reg
ular
Tem
pora
ryTe
mpo
rary
Tem
pora
ryTe
mpo
rary
Tem
pora
ryO
n C
ont
ract
On
Co
ntra
ctO
n C
ont
ract
On
Co
ntra
ctO
n C
ont
ract
30 (3.6
)89
9(2
8.6
)
160
3(2
3.0
)20
69
(29
.9)
60
1(6
.8)
520
2(1
9.5)
297
(81.6
)9
04
(39
.1)
350
6(5
0.5
)13
72(4
0.7
)33
37(4
9.3
)
9416
(47.
7)
45
(12.
4)
547
(23.
7)
184
0(2
6.5
)83
7(2
4.9
)28
88(4
2.7)
6157
(31.
2)
22 (6.0
)86
1(3
7.2)
159
4(2
3.0
)11
59(3
4.4
)54
0(8
.0)
417
6(2
1.1)
410
(98.
1)36
7(5
3.7)
228
(21.5
)16
0(6
4.8
)
1165
(48.
4)
0(0
.0)
291
(42.
6)
.. 129
(12.
2)80
(32.
4)
500
(20
.8)
8(1
.9)
25 (3.7
)
..
702
(66
.3)
7(2
.8)
742
(30
.8)
12(2
6.7
)74
(67.
9)
3(2
3.1)
864
(52.
6)
99
1(6
1.3)
194
4(5
6.7)
33(7
3.3)
22(2
0.2
)
1(7
.7)
571
(34
.8)
571
(35.
3)
1198
(35.
0)
0(0
.0)
13(1
1.9)
9(6
9.2
)20
8(1
2.7)
54 (3.3
)
284
(8.3
)
16(1
00
.0)
15(4
2.9
)
10(1
00
.0)
393
(46
.1)21
0(1
00
)
644
(57.
3)
0(0
.0)
20(5
7.1)
0(0
.0)
46
0(5
3.9
)0
(0.0
)
480
(42.
7)
0(0
.0)
0(0
.0)
0(0
.0)
0(0
.0)
0(0
.0)
0(0
.0)
At
the
tim
e o
f st
art
40
6(8
6.9
)36
9(2
5.9
)
164
8(4
7.2)
120
1(3
2.0
)19
29(5
3.5)
5553
(43.
6)
44
(9.4
)30
8(2
1.6)
861
(24
.7)
109
3(2
9.1)
146
0(4
0.5
)
3766
(29.
5)
17(3
.6)
748
(52.
5)
983
(28.
2)14
60
(38.
9)
218
(6.0
)
3426
(26.
9)
262
(84
.8)
236
(19
.9)
1639
(47.
1)4
57(3
0.5
)13
11(4
9.5
)
390
5(4
2.8)
30 (9.7
)21
9(1
8.5)
861
(24
.8)
430
(28.
7)12
25(4
6.3
)
2765
(30
.3)
17(5
.5)
730
(61.6
)
977
(28.
1)6
09
(40
.7)
112
(4.2
)
244
5(2
6.8)
127
(10
0.0
)88
(56
.8)
.. 139
(15.
5)9
6(6
3.6
)
450
(33.
8)
0(0
.0)
52(3
3.5)
.. 73 (8.1)
45
(29
.8)
170
(12.
8)
0(0
.0)
15(9
.7)
..
685
(76
.4)
10(6
.6)
710
(53.
4)
6(3
0.0
)31
(68.
9)
2(2
5.0
)51
5(4
8.3)
40
0(5
8.3)
954
(52.
3)
14(7
0.0
)11
(24
.4)
0(0
.0)
385
(36
.1)19
0(2
7.7)
600
(32.
9)
0(0
.0)
3(6
.7)
6(7
5.0
)16
6(1
5.6
)9
6(1
4.0
)
271
(14
.8)
11(1
00
.0)
14(3
5.0
)
7(1
00
.0)
90
(30
.5)
122
(10
0.0
)
244
(51.
4)
0(0
.0)
26(6
5.0
)
0(0
.0)
205
(69
.5)
0(0
.0)
231
(48.
6)
7
(63.
6)
34 (85) 4
(57.
1)22
7(7
5.7)
56(4
5.9
)
328
(68.
3)

33 | Food Processing Industry
Labour Market Intelligence Survey
The share of regular employment in total employment in the manufacturing of soft drinks & other bottled water sub-sector has remained constant over the period under review at 53 percent. Similarly, the proportion of employees hired on temporary basis and contract basis has also remained almost same from the time of start of business to December 2013. Similar trends for the share of regular employees are also observed across the provinces of Punjab, Sindh and Balochistan.
4.3 Employees by GenderTable 22 shows the total number of skilled and semi-skilled employees by sub-sector, gender and province in the
sample establishments. Overall, out of 18,664 employees of the selected establishments in the food processing
sector, 1,348 were female accounting for 7.2 percent of all skilled/ semi-skilled workers . Representation of female
skilled/semi-skilled employees was highest in manufacturing of bakery products sub-sector (21.8 percent),
followed by those working in processing & preserving of fruit and vegetables sub-sector (14.5 percent). Presence
of female skilled/semi-skilled workers in processing and preservation of meat is close to half a percent, which
makes this sub-sector least attractive for female skilled/semi-skilled workers, due to possibly to the nature of
work involved. Information available from other countries also shows a low share of female employment in this
sub-sector; in the meat and poultry sector in UK only 33 percent of all employees were women in 2004.
Total
The increase in the share of regular employees and decline in the share of temporary and contract employees reflect that Food Processing industry is undergoing structural changes in employment.

Labour Market Intelligence Survey
Food Processing Industry | 34
In Punjab, female workers represented only 3.4 percent of the total 14,115 employees in the food processing sector, with the highest ratio of female employees in manufacturing of bakery products (15.5 percent), while Sindh province has the highest share of female employees (around 30 percent) in total 1,455 employees in the selected industrial units in the province. The share of female skilled/semi-skilled workers is the highest in Sindh in processing and preserving of fruit and vegetables sub-sector (above 44 percent), while no industrial unit was selected from manufacturing of dairy products sub-sector in the province. In KP province, the share of female employees in the selected industrial units is around 9 percent, with almost equivalent share of female skilled/semi-skilled employees in processing &preserving of fruit &vegetables and manufacturing of bakery products sub-sectors. The data from the selected sample of Balochistan province shows a much higher share of female skilled/semi-skilled employees (31 percent) engaged in manufacturing of bakery products.
Table 22 Number of Skilled/Semi-Skilled Employees by Sub-sector, Gender and Province (excluding Admin and General Workers)
4.3 Employees by Source of Skill and GenderTable 22(a) shows the bifurcation of skilled/semi-skilled employees in the industrial units included in the sample by type of institution where they received training. The data shows that overall, some 16 percent of all skilled/semi-skilled employees in the selected establishments were trained from public training organizations. The share of female employees in the total employees within the selected sample who received training from public training organizations was 8.8 percent.
Most of the employees trained from public training organizations were employed in the establishments selected in the Punjab province (around 66 percent) – and the share of such employees is the highest in manufacturing of dairy products sub-sector (57 percent), while, the share of female skilled/semi-skilled employees is also the highest in this sub-sector (3.7 percent) in the province. The selected sample of establishments in Sindh province employ 20 percent of the total employees trained in public training organizations. The share of female skilled/semi-skilled employees trained from public training organizations is highest in the manufacturing of bakery products sub-sector at 68 percent.
The share of skilled/semi-skilled employees in the food processing sector who were trained from private training organizations is around 5 percent in the total employees in the selected sample, while only one female employee has been trained in private training organization. The bulk of skilled/semi-skilled employees trained from private institutions is seen to be employed in Punjab province (52 percent).
The report also looks at the other forms of training of skilled/semi-skilled employees; ‘ustadi-shagirdi’, family trade, on the job training and internship. The data shows that overall for the food processing sector at the country level, some 43 percent of all skilled/semi-skilled employees in the selected establishments were trained through the ‘ustadi-shagirdi’ system, making
Sub-sectors
Processing & Preservingof MeatProcessing & Preservingof Fruit & VegetablesManufacturing of Dairy ProductsManufacturing of Bakery ProductsManufacturing of Soft Drinks & Other Bottled Water
Total Food Processing
PakistanMale578
(99.5)1590(87.3)5530(99.2)4456(82.1)6510
(98.6)18664
(93.26)
Female3
(0.5)231
(12.7)47
(0.8)973
(17.9)94
(1.4)1348
(6.74)
PunjabMale321
(100.0)1146
(94.2)5514
(99.2)2012
(86.5)5122
(99.0)14115
(96.70)
Female0
(0.0)71
(5.8)47
(0.8)313
(13.5)51
(1.0)482
(3.30)
SindhMale206
(98.6)336
(69.1)
..743
(71.9)170
(99.4)1455
(76.62)
Female3
(1.4)150
(30.9)
..290
(28.1)1
(0.6)444
(23.38)
KPMale
41(100.0)
78(88.6)
10(100.0)
1257(88.1)1105
(96.3)2491
(91.82)
Female0
(0.0)10
(11.4)0
(0.0)170
(11.9)42
(3.7)222
(8.18)
BalochistanMale10
(100.0)30
(100.0)6
(100.0)444
(68.9)113
(100.0)603
(75.09)
Female0
(0.0)0
(0.0)0
(0.0)200(31.1)
0(0.0)200
(24.91)
Note: Figures in parentheses under each main column are row percentages .. No establishment included in the sample from Sindh

35 | Food Processing Industry
Labour Market Intelligence Survey
this the most prominent source of trained skilled/ semi-skilled workers. Most of the employees trained through ‘ustadi-shagirdi’ were employed in the establishments selected in the Punjab province (around 84 percent),with the share of such employees highest in the manufacturing of soft-drinks &other bottled water sub-sector (39 percent), followed by manufacturing of dairy products sub-sector (29 percent), in the province. The share of female skilled/semi-skilled employees in Punjab who received training through ‘ustadi-shagirdi’ is just 4 percent. The selected sample of the establishments in KP province employ 12 percent of the total employees trained through the ‘ustadi-shagirdi’ system. The share of female skilled/semi-skilled employees trained through ‘ustadi-shagirdi’ is the highest in Punjab (90 percent) and most of such women employees are employed in the manufacturing of bakery products sub-sector (75 percent).
Following ustadi-shagirdi regime of training, another significant proportion of the skilled/semi-skilled employees in the food processing sector report having been trained ‘on the job’, representing around 27 percent of all trained skilled/ semi-skilled employees. Around 40 percent of all female skilled/semi-skilled employees report being trained on the job. Bulk of such employees (73 percent) was engaged in establishments in Punjab province, working in the manufacturing of dairy products and manufacturing of soft drinks and other bottled water.
A very small proportion of skilled/semi-skilled workers (around 2 percent) were trained by ‘family trade’, of which majority belonged to the selected establishments in the Punjab province. Proportion of female skilled/semi-skilled workers in these establishments is negligible. Another around 2 percent of the skilled/ semi-skilled workers report having being trained through other arrangements. A negligible share of the skilled/semi-skilled employees (around 1.4 percent) have been trained through apprenticeship in compliance of law.
Table 22(a): Number of Skilled/Semi-Skilled Employees by Sub-sector, Gender and Province (excluding Admin and General Workers
Total
Processing & Preservingof MeatProcessing & Preservingof Fruit & VegetablesManufacturing of Dairy ProductsManufacturing of Bakery ProductsManufacturing of Soft Drinks & Other Bottled WaterTotal Food Processing
Processing & Preservingof MeatProcessing & Preservingof Fruit & VegetablesManufacturing of Dairy ProductsManufacturing of Bakery Products
Pakistan
Female
15(100.0)
218(99.1)1232
(96.3)774
(76.4)837
(99.2)3076
(91.25)
0(0.0)
35(100.0)
91(100.0)
299(100.0)
0(0.0)
0(0.0)
0(0.0)
0(0.0)
0(0.0)
29(100.0)
90(100.0)
32(100.0)
0(0.0)
0(0.0)
0(0.0)
0(0.0)
0(0.0)
6(100.0)
67(100.0)
0(0.0)
0(0.0)
0(0.0)
0(0.0)
0(0.0)
1(100.0)
200(100.0)
0(0.0)
0(0.0)
0(0.0)
0(0.0)
0(0.0)
0(0.0)
0(0.0)
0(0.0)
0(0.0)
0(0.0)
0(0.0)
0(0.0)
0(0.0)
2(0.9)47
(3.7)239
(23.6)7
(0.8)295
(8.75)
Female
12(100.0)
162(98.8)1231
(96.3)191
(96.5)558
(99.5)2154
(97.33)
0(0.0)
2(1.2)47
(3.7)7
(3.5)3
(0.5)59
(2.67)
Female
3(100.0)
52(100.0)
..
411(67.8)
12(75.0)478
(70.61)
0(0.0)
0(0.0)
..
195(32.2)
4(25.0)
199(29.39)
Female
0(0.0)
1(100.0)
1(100.0)
142(92.2)243
(100.0)387
(96.99)
0(0.0)
0(0.0)
0(0.0)
12(7.8)
0(0.0)
12(3.01)
MaleMaleMaleMaleMale Female
0(0.0)
3(100.0)
0(0.0)30
(54.5)24
(100.0)57
(69.51)
0(0.0)
0(0.0)
0(0.0)
25(45.5)
0(0.0)
25(30.49)
Punjab Sindh KP BalochistanSub-sectors
Number of Skilled/Semi-skilled Employees Qualified from Public Training Organization
Number of Skilled/Semi-skilled Employees Qualified from Public Training Organization
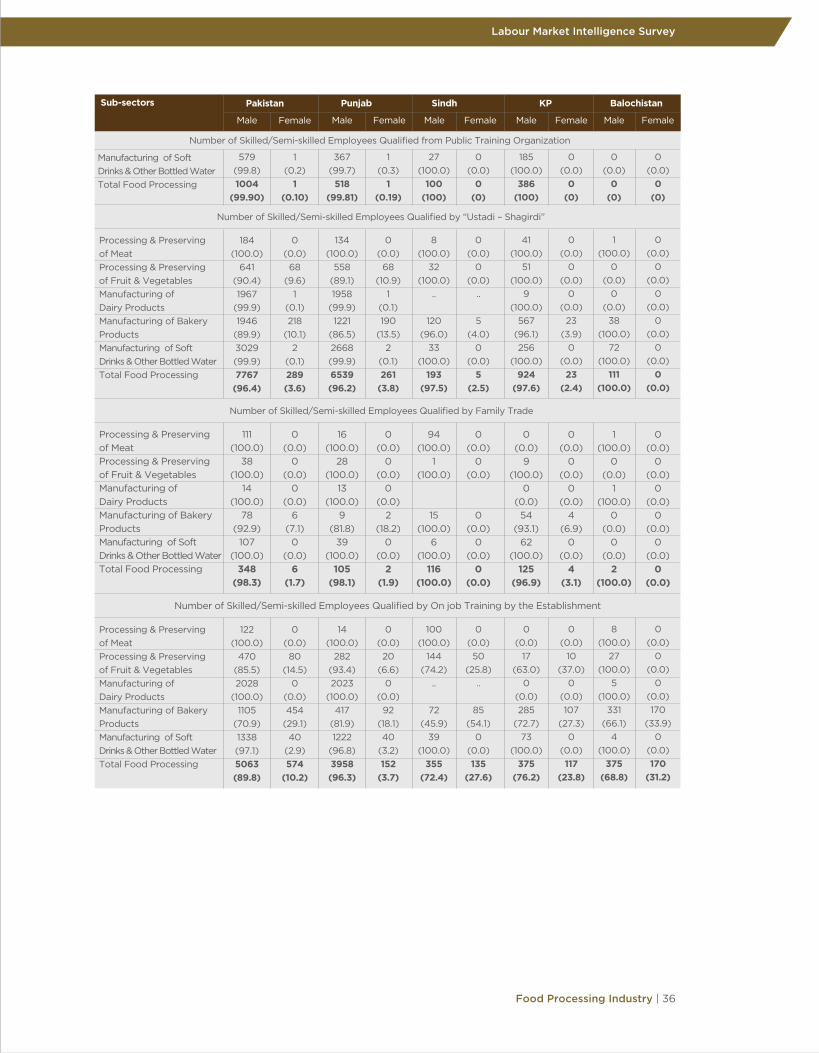
Labour Market Intelligence Survey
Food Processing Industry | 36
Pakistan
Female
579(99.8)1004
(99.90)
1(0.2)
1(0.10)
367(99.7)
518(99.81)
1(0.3)
1(0.19)
27(100.0)
100(100)
0(0.0)
0(0)
185(100.0)
386(100)
0(0.0)
0(0)
0(0.0)
0(0)
0(0.0)
0(0)
Female Female Female MaleMaleMaleMaleMale Female
Punjab Sindh KP BalochistanSub-sectors
Number of Skilled/Semi-skilled Employees Qualified from Public Training Organization
Number of Skilled/Semi-skilled Employees Qualified by “Ustadi – Shagirdi”
Number of Skilled/Semi-skilled Employees Qualified by Family Trade
Number of Skilled/Semi-skilled Employees Qualified by On job Training by the Establishment
Processing & Preservingof MeatProcessing & Preservingof Fruit & VegetablesManufacturing of Dairy ProductsManufacturing of Bakery ProductsManufacturing of Soft Drinks & Other Bottled WaterTotal Food Processing
Manufacturing of Soft Drinks & Other Bottled WaterTotal Food Processing
184(100.0)
641(90.4)1967
(99.9)1946
(89.9)3029(99.9)7767
(96.4)
0(0.0)68
(9.6)1
(0.1)218
(10.1)2
(0.1)289(3.6)
134(100.0)
558(89.1)1958
(99.9)1221
(86.5)2668(99.9)6539(96.2)
0(0.0)68
(10.9)1
(0.1)190
(13.5)2
(0.1)261
(3.8)
8(100.0)
32(100.0)
..
120(96.0)
33(100.0)
193(97.5)
0(0.0)
0(0.0)
..
5(4.0)
0(0.0)
5(2.5)
41(100.0)
51(100.0)
9(100.0)
567(96.1)256
(100.0)924
(97.6)
0(0.0)
0(0.0)
0(0.0)
23(3.9)
0(0.0)
23(2.4)
1(100.0)
0(0.0)
0(0.0)
38(100.0)
72(100.0)
111(100.0)
0(0.0)
0(0.0)
0(0.0)
0(0.0)
0(0.0)
0(0.0)
Processing & Preservingof MeatProcessing & Preservingof Fruit & VegetablesManufacturing of Dairy ProductsManufacturing of Bakery ProductsManufacturing of Soft Drinks & Other Bottled WaterTotal Food Processing
111(100.0)
38(100.0)
14(100.0)
78(92.9)
107(100.0)
348(98.3)
0(0.0)
0(0.0)
0(0.0)
6(7.1)
0(0.0)
6(1.7)
16(100.0)
28(100.0)
13(100.0)
9(81.8)
39(100.0)
105(98.1)
0(0.0)
0(0.0)
0(0.0)
2(18.2)
0(0.0)
2(1.9)
94(100.0)
1(100.0)
15(100.0)
6(100.0)
116(100.0)
0(0.0)
0(0.0)
0(0.0)
0(0.0)
0(0.0)
0(0.0)
9(100.0)
0(0.0)54
(93.1)62
(100.0)125
(96.9)
0(0.0)
0(0.0)
0(0.0)
4(6.9)
0(0.0)
4(3.1)
1(100.0)
0(0.0)
1(100.0)
0(0.0)
0(0.0)
2(100.0)
0(0.0)
0(0.0)
0(0.0)
0(0.0)
0(0.0)
0(0.0)
Processing & Preservingof MeatProcessing & Preservingof Fruit & VegetablesManufacturing of Dairy ProductsManufacturing of Bakery ProductsManufacturing of Soft Drinks & Other Bottled WaterTotal Food Processing
122(100.0)
470(85.5)2028
(100.0)1105
(70.9)1338(97.1)5063(89.8)
0(0.0)80
(14.5)0
(0.0)454
(29.1)40
(2.9)574
(10.2)
14(100.0)
282(93.4)2023
(100.0)417
(81.9)1222
(96.8)3958(96.3)
0(0.0)20
(6.6)0
(0.0)92
(18.1)40
(3.2)152
(3.7)
100(100.0)
144(74.2)
..
72(45.9)
39(100.0)
355(72.4)
0(0.0)50
(25.8)..
85(54.1)
0(0.0)135
(27.6)
0(0.0)
17(63.0)
0(0.0)285
(72.7)73
(100.0)375
(76.2)
0(0.0)
10(37.0)
0(0.0)107
(27.3)0
(0.0)117
(23.8)
8(100.0)
27(100.0)
5(100.0)
331(66.1)
4(100.0)
375(68.8)
0(0.0)
0(0.0)
0(0.0)170
(33.9)0
(0.0)170
(31.2)
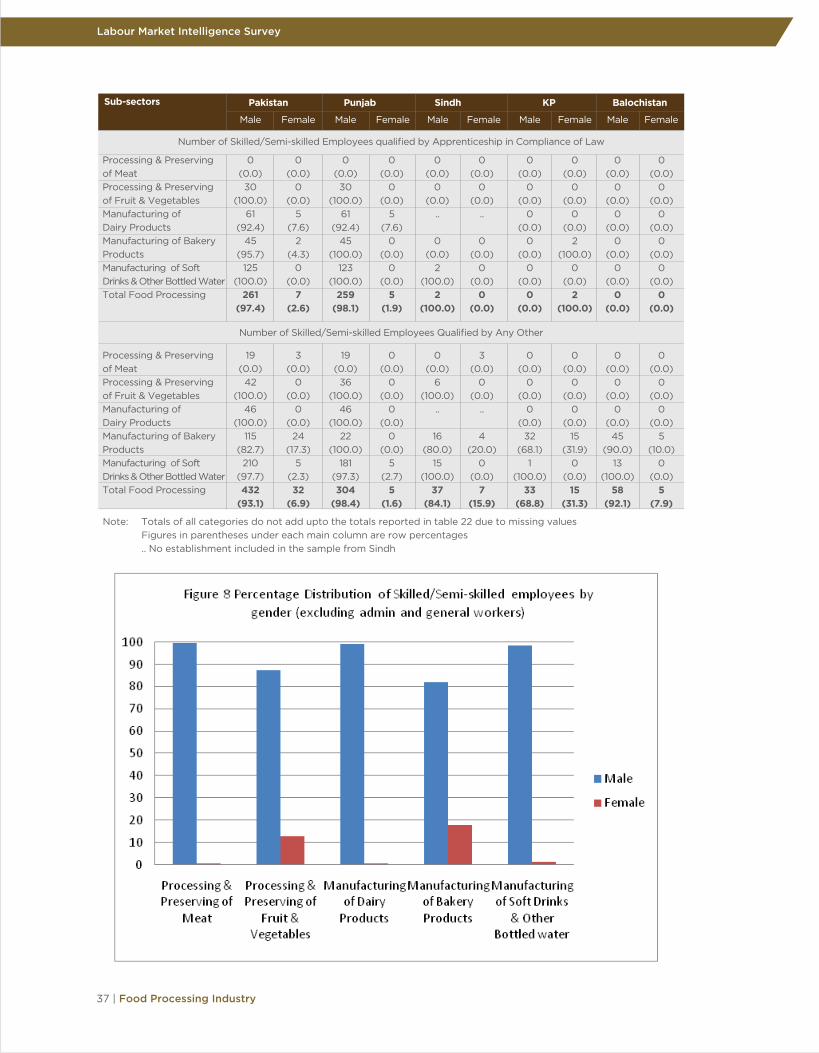
37 | Food Processing Industry
Labour Market Intelligence Survey
Pakistan
Female Female Female Female MaleMaleMaleMaleMale Female
Punjab Sindh KP BalochistanSub-sectors
Number of Skilled/Semi-skilled Employees qualified by Apprenticeship in Compliance of Law
Number of Skilled/Semi-skilled Employees Qualified by Any Other
Processing & Preservingof MeatProcessing & Preservingof Fruit & VegetablesManufacturing of Dairy ProductsManufacturing of Bakery ProductsManufacturing of Soft Drinks & Other Bottled WaterTotal Food Processing
0(0.0)30
(100.0)61
(92.4)45
(95.7)125
(100.0)261
(97.4)
0(0.0)
0(0.0)
5(7.6)
2(4.3)
0(0.0)
7(2.6)
0(0.0)30
(100.0)61
(92.4)45
(100.0)123
(100.0)259
(98.1)
0(0.0)
0(0.0)
5(7.6)
0(0.0)
0(0.0)
5(1.9)
0(0.0)
0(0.0)
..
0(0.0)
2(100.0)
2(100.0)
0(0.0)
0(0.0)
..
0(0.0)
0(0.0)
0(0.0)
0(0.0)
0(0.0)
0(0.0)
0(0.0)
0(0.0)
0(0.0)
0(0.0)
0(0.0)
0(0.0)
2(100.0)
0(0.0)
2(100.0)
0(0.0)
0(0.0)
0(0.0)
0(0.0)
0(0.0)
0(0.0)
0(0.0)
0(0.0)
0(0.0)
0(0.0)
0(0.0)
0(0.0)
Processing & Preservingof MeatProcessing & Preservingof Fruit & VegetablesManufacturing of Dairy ProductsManufacturing of Bakery ProductsManufacturing of Soft Drinks & Other Bottled WaterTotal Food Processing
19(0.0)42
(100.0)46
(100.0)115
(82.7)210
(97.7)432
(93.1)
3(0.0)
0(0.0)
0(0.0)24
(17.3)5
(2.3)32
(6.9)
19(0.0)
36(100.0)
46(100.0)
22(100.0)
181(97.3)304
(98.4)
0(0.0)
0(0.0)
0(0.0)
0(0.0)
5(2.7)
5(1.6)
0(0.0)
6(100.0)
..
16(80.0)
15(100.0)
37(84.1)
3(0.0)
0(0.0)
..
4(20.0)
0(0.0)
7(15.9)
0(0.0)
0(0.0)
0(0.0)
32(68.1)
1(100.0)
33(68.8)
0(0.0)
0(0.0)
0(0.0)
15(31.9)
0(0.0)
15(31.3)
0(0.0)
0(0.0)
0(0.0)45
(90.0)13
(100.0)58
(92.1)
0(0.0)
0(0.0)
0(0.0)
5(10.0)
0(0.0)
5(7.9)
Note: Totals of all categories do not add upto the totals reported in table 22 due to missing values Figures in parentheses under each main column are row percentages .. No establishment included in the sample from Sindh

3.4 Employees by Skill and StatusThe distribution of skilled/ semi-skilled workers by employment status, sub-sector and province is given in Table 23 at two points in time – end December 2013 compared to the position as on end December 2009. It can be seen that out of a total of 18,261 skilled/semi-skilled workers for overall Pakistan as of December 2013, around 47 percent (8,698) were employed on regular basis, a third (6,039) of them on temporary basis, with the remaining 19 percent (3,524) on contract basis . Within the five sectors of food processing sector, almost 31 percent of skilled/semi-skilled employees were engaged in manufacturing of soft drinks and other bottled water, while 30 percent were involved in manufacturing of dairy products, 28 percent in manufacturing of bakery products, around 9 percent in preserving and processing of fruits and remaining 2 percent in processing of meat. Around 8 percent of all skilled/ semi-skilled employees were women as on December 2013, with a higher share of female skilled/semi-skilled employees (around 16 percent) employed in manufacturing of bakery products.
The provincial disaggregation shows that almost three quarters of the skilled/semi-skilled employees were employed in the province of Punjab, followed by KP (14 percent), Sindh at 7 percent and Balochistan at 4.4 percent as on December 2013. In Punjab, more than half of the skilled/semi-skilled employees (around 52 percent) were working on regular basis, 28 percent on temporary basis and 20 percent on contract. In Sindh, half of the skilled/ semi-skilled workers were engaged on contract, 30 percent on regular basis and over 19 percent on temporary basis. In KP and Balochistan, majority of skilled/ semi-skilled employees were employed on temporary basis, followed by regular basis, while only a minor share were engaged on contract.
In terms of the sub-sectoral breakup, the highest proportion of regular skilled/ semi-skilled workers in Punjab was in the processing and preserving of meat sub-sector (86 percent) followed by manufacturing of soft drinks & other bottled water (56.5 percent). In Sindh, all of the skilled/ semi-skilled workers in the processing of meat sub-sector were working on regular basis, while 72 percent of employees in the processing & preserving of fruits and vegetable and manufacturing of bakery products sub-sectors were engaged on temporary and on contract basis, respectively. In KP, all employees in the processing of meat sub-sector, followed by 59 percent in the processing & preserving of fruits sub-sector were employed on regular basis. In Balochistan, all employment in the processing of meat, manufacturing of dairy products and over 97 percent of all skilled/ semi-skilled workers in the manufacturing of soft drinks & other bottled water sub-sectors were engaged on regular basis.
Labour Market Intelligence Survey
Food Processing Industry | 38
It appears that most popular system of obtaining skills in the food processing sector is Ustadi-shahgirdi. The analysis further shows that preference is also given to on-the job training and workers trained from public training institutes. However, apprenticeship is not being given due importance despite having coverage in law.

39 | Food Processing Industry
Labour Market Intelligence Survey
Total
No.
of e
mpl
oyee
s in
20
13
Pak
ista
nP
unja
bSi
ndh
KP
Bal
och
ista
n
Sub
-sec
tors
Pro
cess
ing
&P
rese
rvin
g o
f Mea
tP
roce
ssin
g &
P
rese
rvin
g o
f F
ruit
& V
eget
able
sM
anuf
actu
ring
of D
airy
Pro
duc
tsM
anuf
actu
ring
o
f Bak
ery
Pro
duc
tsM
anuf
actu
ring
o
f So
ft D
rinks
&
Oth
er B
ott
led
Wat
erT
ota
l Fo
od
P
roce
ssin
g
Pro
cess
ing
&P
rese
rvin
g o
f Mea
tP
roce
ssin
g &
P
rese
rvin
g o
f F
ruit
& V
eget
able
sM
anuf
actu
ring
of D
airy
Pro
duc
tsM
anuf
actu
ring
o
f Bak
ery
Pro
duc
tsM
anuf
actu
ring
o
f So
ft D
rinks
&
Oth
er B
ott
led
Wat
erT
ota
l Fo
od
P
roce
ssin
g
308
(87.
25)
793
(48.
74)
2655
(48.
83)
1719
(33.
57)
3223
(56
.32)
8698
(47.
63)
45
(12.
75)
476
(29
.26
)
1317
(24
.22)
1858
(36
.28)
234
3(4
0.9
4)
6039
(33.
07)
Reg
ular
Reg
ular
Reg
ular
Reg
ular
Reg
ular
Tem
pora
ryTe
mpo
rary
Tem
pora
ryTe
mpo
rary
Tem
pora
ryO
n C
ont
ract
On
Co
ntra
ctO
n C
ont
ract
On
Co
ntra
ctO
n C
ont
ract
0(0
.0)
358
(22.
00
)
146
5(2
6.9
4)
154
4(3
0.15
)15
7(2
.74
)
3524
(19.
30)
276
(85.
98)
66
1(5
4.2
7)
264
5(4
8.74
)9
81(4
3.20
)24
67
(56
.45)
7030
(51.
66)
45
(14
.02)
224
(18.
39)
1317
(24
.27)
556
(24
.48)
1770
(40
.50
)
3912
(28.
75)
0(0
.0)
333
(27,
34)
146
5(2
6.9
9)
734
(32.
32)
133
(3.0
4)
2665
(19.
59)
14(1
00
.0)
71(2
4.2
3)
230
(26
.32)
68
(69
.39
)
383
(29.
95)
0(0
.0)
210
(71.6
7)
14(1
.60
)27
(27.
55)
251
(19.
62)
0(0
.0)
12(4
.10)
630
(72.
08)
3(3
.06
)
645
(50
.43)
8(1
00
.0)
51(5
9.3
0)
4(1
00
.0)
322
(24
.21)
575
(50
.48)
960
(37.
40
)
0(0
.0)
22(2
5.58
)
0(0
.0)
828
(62.
26)
546
(47.
94
)
1396
(54
.38)
0(0
.0)
13(1
5.12
)
0(0
.0)
180
(13.
53)
18(1
.58)
211
(8.2
2)
10(1
00
.0)
10(3
3.33
)
6(1
00
.0)
186
(28.
79)
113
(97.
41)
325
(40
.22
0(0
.0)
20(6
6.6
7)
0(0
.0)
46
0(7
1.21)
0(0
.0)
480
(59.
41)
0(0
.0)
0(0
.0)
0(0
.0)
0(0
.0)
3(2
.59
)
3(0
.37)
No
. of
emp
loye
es in
20
09
261
(85.
57)
503
(43.
85)
1711
(41.2
4)
1339
(31.1
6)
2755
(50
.41)
6569
(42.
76)
44
(14
.43)
311
(27.
11)
431
(10
.39
)15
19(3
5.35
)24
70(4
5.20
)
477
5(3
1.0
8)
0(0
.0)
333
(29
.03)
200
7(4
8.37
)14
39(3
3.4
9)
240
(4.3
9)
40
19(2
6.16
)
235
(88.
68)
471
(44
.81)
170
0(4
1.08)
780
(35.
980
2078
(47.
38)
5264
(43.
84)
30(1
1.32)
268
(25.
50)
431
(10
.42)
565
(26
.06
)20
85(4
7.54
)
3379
(28.
14)
0(0
.0)
312
(29
.69
)
200
7(4
8.50
)82
3(3
7.9
6)
223
(5.0
8)
3365
(2
8.0
2)
14(1
00
.0)
24 (60
)
200
(29
.94
)54
(78.
26)
306
(38.
01)
0(0
.0)
8(2
0)
8(1
.20
)13
(18.
84)
29(3
.60
)
0(0
.0)
8(2
0)
46
0(6
8.86
)2
(2.9
0)
470
(58.
38)
49
22.2
2)1
(3.3
3)
4(1
00
.0)
230
(24
.29
)54
9(5
8.6
5)
788
(40
.72)
14(7
7.78
)16
(53.
33)
0(0
.0)
561
(59
.24
)37
2(3
9.7
4)
963
(49.
77)
0(0
.0)
13(4
3.33
)
0(0
.0)
156
(16
.47)
15(1
.60
)
184
(9.5
1)
8(1
00
.0)
7(2
6.9
2)
7(1
00
.0)
129
(25.
10)
74(1
00
.0)
225
(35.
77)
0(0
.0)
19(7
3.0
8)
0(0
.0)
385
(74
.90
)0
(0.0
)
40
4(6
4.2
3)
0(0
.0)
0(0
.0)
0(0
.0)
0(0
.0)
0(0
.0)
0(0
.0)
Not
e:
Fig
ures
in p
aren
thes
es u
nder
eac
h m
ain
colu
mn
are
row
per
cent
ages
Tab
le 2
3: E
mp
loym
ent
Tren
d o
f Sk
illed
/ Se
mi-
skill
ed W
ork
ers,
by
Sub
-sec
tor
Province-wise, the share of female skilled/semi-skilled employees was highest in Balochistan at one-fourth (200), followed by Sindh at 21.8 percent (279) and Punjab at around 7 percent (928). The share of female skilled/semi-skilled employees was lowest in KP at over 3 percent (84) in December 2013.
The comparison of the position of skilled/semi-skilled employees as on December 2009 shows that a total of 15,363 skilled/semi-skilled workers were employed by the sample establishments across Pakistan, indicating a growth in employment of around 19 percent during the period 2009-13. The distribution of these skilled/ semi-skilled workers by employment status shows that around 42 percent were employed on regular basis, 31 percent on temporary basis, while the remaining 26 percent were working on contract basis. The distribution of skilled/ semi-skilled workers by sub-sector indicates that 35 percent of skilled/semi-skilled employees were engaged in manufacturing of soft drinks and other bottled water, while 28 percent were involved in manufacturing of bakery products, around 27 percent in manufacturing of dairy products, over 7 percent in processing of fruits & vegetables and 2 percent in processing of meat sub-sectors. Around 8 percent of the skilled/ semi-skilled workers were women as on December 2009, with the highest share of female skilled/semi-skilled employees (around 18 percent) employed in manufacturing of bakery products.
The provincial picture, in line with the national situation reflects patterns broadly similar to those prevailing in December 2013, with around 78 percent of the skilled/semi-skilled employees employed in Punjab province, followed by KP (12 percent), Sindh at 5.2 percent and Balochistan (4 percent). In Punjab, 44 percent of 12,008 skilled/semi-skilled employees were working on regular basis, while 28 percent each were engaged on temporary basis and contract basis. In Sindh, majority of skilled/ semi-skilled workers were employed on contract (58 percent) followed by regular workers at 38 percent. Around half of the skilled/ semi-skilled workers in KP were employed on temporary basis, followed by another 41 percent on regular basis; while in Balochistan majority (over 64 percent) were working on temporary basis and the remaining 36 percent were engaged as regular employees.
Across the five sub-sectors of the food processing sector, the highest proportion of regular employees in the province of Punjab was in the processing of meat sub-sector (88.7 percent), although in terms of absolute numbers the regular employees in this sub-sector was the lowest across all sub-sectors in the province. In Sindh, all employees in the processing of meat sub-sector were working on regular basis, although like Punjab this was lowest in absolute numbers. In KP, all workers in the manufacturing of dairy products sub-sector, followed by 58.7 percent of workers in the manufacturing of soft drinks & other bottled water were engaged on regular basis, while around 78 percent workers in processing of meat sub-sector were employed on temporary basis. In Balochistan, all workers in the processing of meat, manufacturing of dairy products and manufacturing of soft drinks & other bottled water sub-sectors were employed on regular basis, while 73 percent of skilled/semi-skilled employees in processing of fruits & vegetables sub-sector and 75 percent in manufacturing of bakery products sub-sector were working on temporary basis.
The comparison with the earlier position of employment of skilled/ semi-skilled workers as of December 2009 shows that employment under the regular category has expanded at the highest rate (32.4 percent) during these four years. Temporary skilled/ semi-skilled workers grew by 26.5 percent, while workers hired on contract declined by 12.3 percent during this period (Appendix 3). The highest growth in regular workers was witnessed for the processing & preserving of fruits & vegetables and manufacturing of dairy products sub-sectors (57.7 percent and 55.2 percent, respectively). The manufacturing of dairy products sub-sector saw extra-ordinary growth of 205.6 percent in temporary skilled/ semi-skilled workers. Province-wise, the highest growth in regular employment was experienced in Balochistan at 44 percent, followed by Punjab at 33.6 percent. There was a huge jump of 765 percent in temporary employment in Sindh, driven mainly by the rise in temporary employment in the processing & preserving of fruits & vegetables sub- sector.
Labour Market Intelligence Survey
Food Processing Industry | 40

The highest share of female skilled/semi-skilled employees was in the province of Punjab at over 72 percent, as
on December 2009. This was followed by Sindh at over 15 percent and Balochistan at nearly 10 percent. In KP,
females represented only 2.3 percent of skilled/ semi-skilled employees (table 23 – a). In 2013, the situation
slightly improved when the highest share of female skilled/semi-skilled employees was still in Punjab at over 62
percent, followed by Sindh at over 18 percent. The share of female skilled/semi-skilled employees in Balochistan
was at over 13 percent while it was at 5.6 percent in KP.
41 | Food Processing Industry
Labour Market Intelligence Survey
Total

4.5.1 Level of EducationTable 24 shows the employment trend of skilled/ semi-skilled workers by level of education at both national and provincial level for both 2013 and 2009. The analysis indicates that the vast majority of skilled/ semi - skilled workers at 13,425 (71.5 percent) reported their level of education under the ‘other’ category as of December 2013. Around 12 percent (2,196) of the skilled/ semi-skilled workers reported having a diploma in associate engineering (DAE), with 8.3 percent (1,592) having a vocational certificate and 8.4 percent (1,569) with degree level education. Sub-sector-wise, the highest proportion of TEVT related education is found in the manufacturing of soft drinks & other bottled water sub-sector, where 9.7 percent workers have a degree, 12.5 percent have obtained a DAE, while 8.7 percent report having a vocational certificate. On the other hand, the lowest proportion of workers with TEVT education is in the processing of meat sub-sector, where just over 6 percent have a vocational certificate, 1.8 percent a degree and only one percent with a DAE.
The provincial breakup shows that in the province of Punjab, three-fourths of all skilled/ semi-skilled workers have education in the ‘other’ category, while 8.7 percent each have degree and DAE. In Sindh, the majority of workers at 61 percent have obtained a DAE and over 14 percent have degree level education. In KP and Balochistan, the vast majority of workers report having ‘other’ education, followed by vocational certificate and DAE in KP (14.9 percent and 11.7 percent, respectively) and vocational certificate and degree in Balochistan (9.8 percent and 8.7 percent, respectively).
4.5 Employment TrendsTable 23(a) Employment Trend of Skilled / Semi-skilled Workers, by Sub-sector (Female Employees)
Labour Market Intelligence Survey
Food Processing Industry | 42
Sub-sector
Processing & Preserving of Meat
Processing & Preserving of Fruits & Vegetables
Manufacture of Dairy Products
Sweets Honey To�ee Candy and Bakery Products
Manufacture of Soft & Other Bottled Water
Total Food Processing
Processing & Preserving of Meat
Processing & Preserving of Fruits & Vegetables
Manufacture of Dairy Products
Sweets Honey To�ee Candy and Bakery Products
Manufacture of Soft & Other Bottled Water
Total Food Processing
Pakistan
2
112
447
839
91
1491
0
103
397
779
24
1303
0
103
397
425
21
946
0
0
202
0
202
0
0
0
27
3
30
0
0
0
125
0
125
Punjab
0
102
447
328
51
928
Sindh
2
0
0
277
0
279
KP
0
10
0
34
40
84
Balochistan
0
0
0
200
0
200
As in December 2013
As in December 2009

43 | Food Processing Industry
Labour Market Intelligence Survey
Total
Tabl
e 24
: Em
ploy
men
t Tre
nd o
f Ski
lled/
Sem
i-ski
lled
Wor
kers
, by
Leve
l of E
duca
tion
Sub-
sect
or
Paki
stan
Pu
njab
Si
ndh
KP
Bal
ochi
stan
Degree
DAE
Vocational Certificate
Others
Degree
DAE
Vocational Certificate
Others
Degree
DAE
Vocational Certificate
Others
Degree
DAE
Vocational Certificate
Others
Degree
DAE
Vocational Certificate
Others
No.
of e
mpl
oyee
s in
2013
Pr
oces
sing
&
Pres
ervi
ng o
f M
eat
7 (1
.8)
4 (1
.0)
24
(6.3
) 34
8 (9
0.8)
3
(0.9
) 4
(1.2
) 24
(7
.5)
290
(90.
3)
2 (1
4.3)
0 (0
) 0 (0)
12
(85.
7)
1 (2
.6)
0 (0)
0 (0)
37
(97.
4)
1 (10)
0 (0)
0 (0)
9 (90)
Proc
essi
ng &
Pr
eser
ving
of
Frui
t &
Veg
etab
les
118
(8.2
) 13
0 (9
.1)
91
(6.4
) 10
92
(76.
3)
82
(6.6
) 11
3 (9
.1)
58
(4.7
) 98
2 (7
9.5)
29
(3
6.2)
17
(2
1.2)
6
(7.5
) 28
(3
5)
4 (4
.6)
0 (0)
0 (0)
82
(95.
3)
3 (10)
0 (0)
27
(90)
0 (0
)
Man
ufac
turi
ng o
f Dai
ry
Prod
ucts
546
(10.
3)
531
(10.
1)
494
(9.4
) 37
06
(70.
2)
544
(10.
3)
530
(10.
1)
492
(9.3
) 37
01
(70.
3)
.. ..
.. ..
1 (25)
1 (25)
2 (50)
0 (0)
1 (1
6.7)
0 (0)
0 (0)
5 (8
3.3)
Man
ufac
turi
ng o
f Bak
ery
Prod
ucts
255
(4.9
) 70
5 (1
3.8)
41
3 (8
.1)
3731
(7
3.1)
87
(3
.8)
68
(3.0
) 10
1 (4
.5)
2002
(8
8.7)
87
(1
0.9)
57
4 (7
2.4)
11
(1
.4)
121
(15.
3)
31
(2.2
) 48
(3
.4)
249
(17.
7)
1079
(7
6.7)
50
(7
.7)
15
(2.3
) 52
(8
.1)
529
(81.
9)
Man
ufac
turi
ng o
f Sof
t D
rinks
&
Oth
er
Bot
tled
Wat
er
643
(9.7
) 82
6 (1
2.5)
57
0 (8
.6)
4548
(6
9.0)
51
4 (1
0.2)
51
2 (1
0.1)
38
7 (7
.7)
3631
(7
1.9)
24
(2
6.9)
4
(4.5
) 4
(4.5
) 57
(6
4.0)
90
(6
.7)
288
(21.
4)
179
(13.
3)
787
(58.
6)
15
(13.
6)
22
(2)
0 (0)
73
(66.
4)
Tot
al
Food
Pr
oces
sing
1569
(8
.3)
2196
(1
1.7)
15
92
(8.5
) 13
425
(71.
5)
1230
(8
.7)
1227
(8
.7)
1062
(7
.5)
1060
6 (7
5.1)
14
2 (1
4.5)
59
5 (6
0.9)
21
(2
.1)
218
(22.
3)
127
(4.4
) 33
7 (1
1.7)
43
0 (1
4.9)
19
85
(68.
9)
70
(8.7
) 37
(4
.6)
79
(9.8
) 61
6 (7
6.8)
No.
of e
mpl
oyee
s in
2009
Pr
oces
sing
&
Pres
ervi
ng o
f M
eat
6 (1.9
) 4 (1
3.3)
18
(5
.7)
285
(91.
0)
3 (1.1
) 4 (1
.4)
18
(6.6
) 24
9 (9
0.8)
2 (1
4.3)
0 (0
) 0 (0
) 12
(8
5.7)
0 (0
) 0 (0
) 0 (0
) 17
(1
00)
1 (12.
5)
0 (0)
0 (0)
7 (87.
5)
Proc
essi
ng &
Pr
eser
ving
of
Frui
t &
Veg
etab
les
93
(9.1
) 80
(7
.8)
9 (0.9
) 83
4 (8
2.1)
74
(8
.0)
70
(7.6
) 9 (0
.9)
766
(83.
3)
14
(34.
1)
10
(24.
4)
0 (0)
17
(41.
4)
2 (6.7
) 0 (0
) 0 (0
) 28
(9
3.3)
3 (1
1.5)
0 (0
) 0 (0
) 23
(8
8.5)
Man
ufac
turi
ng o
f Dai
ry
Prod
ucts
415
(9.9
) 35
6 (8
.5)
434
(10.
4)
2965
(7
1.1)
41
3 (9
.9)
355
(8.5
) 43
2 (1
0.4)
29
59
(71.
1)
.. ..
.. ..
1 (25)
1 (2
5)
2 (50)
0 (0
) 1 (1
4.3)
0 (0
) 0 (0
) 6 (8
5.7)
Man
ufac
turi
ng o
f Bak
ery
Prod
ucts
230
(5.8
) 56
4 (1
4.3)
37
9 (9
.6)
2762
(7
0.2)
73
(4
.1)
49
(2.7
) 10
3 (5
.7)
1571
(8
7.5)
92
(1
3.0)
42
6 (6
0.5)
10
1 (1
4.3)
85
(1
2.1)
26
(2
.8)
79
(8.6
) 15
5 (1
6.8)
66
1 (7
1.7)
39
(7
.5)
10
(1.9
) 20
(3
.9)
445
(86.
6)
Man
ufac
turi
ng o
f Sof
t D
rinks
&
Oth
er
Bot
tled
Wat
er
425
(6.5
) 60
8 (9
.4)
1291
(1
9.8)
41
72
(64.
2)
335
(6.2
) 40
5 (7
.5)
1180
(2
1.8)
34
91
(64.
5)
20
(34.
5)
2 (3.4
) 5 (8
.6)
31
(53.
4)
61
(6.4
) 18
7 (1
9.6)
10
6 (1
1.1)
59
9 (6
2.8)
9 (1
2.1)
14
(1
8.9)
0 (0)
51
(68.
9)
Tot
al
Food
Pr
oces
sing
1169
(7
.3)
1612
(1
0.1)
21
31
(13.
4)
1101
8 (6
9.2)
89
8 (7
.1)
883
(7.0
) 17
42
(13.
8)
9036
(7
1.9)
13
0 (1
5.6)
43
8 (5
2.7)
10
6 (1
2.7)
15
7 (1
8.9)
90
(4
.6)
267
(13.
8)
263
(13.
6)
1305
(6
7.8)
53
(8
.4)
24
(3.8
) 20
(3
.2)
532
(84.
5)
Not
e: F
igur
es in
par
enth
eses
are
row
per
cent
ages
..
No
esta
blis
hmen
t inc
lude
d in
the
sam
ple
from
Sin
dh

The sub-sectoral disaggregation within each province shows that the highest proportion of skilled/ semi-skilled workers with TEVT related education is in the manufacturing of dairy products sub-sector (10.3 percent with degree, 10 percent with DAE and 9.3 percent with vocational certificate), while the lowest share is in the processing of meat sub-sector. Across Sindh, the available data shows that a significant majority of employees in the manufacturing of dairy products sub-sector has TEVT education, with over 72 percent with a DAE, 11 percent with a degree and 1.4 percent have a vocational certificate. In KP, the highest share of employees with TEVT education is in the manufacturing of dairy products sub-sector, with 50 percent of employees with a vocational certificate and 25 percent each having a degree and a DAE. In case of Balochistan, the highest proportion of TEVT educated workers is in processing of fruits & vegetables sub-sector, with 90 percent having a vocational certificate and 10 percent with a degree.
The comparison of skilled/semi-skilled worker’s education level with the earlier period of 2009 shows that a slightly lower proportion reported education in the ‘other’ category (69 percent) compared to 2013 (71.5 percent). The share of workers with a vocational certificate was higher at 13.4 percent compared to 8.5 percent in the latter period, while the share of workers with DAE and degree was slightly lower at 10 percent and 7.3 percent, respectively. The province-wise comparison highlights that in both the Punjab and Sindh provinces; a relatively higher proportion of the skilled/ semi-skilled workers had TEVT related education in 2009, although its composition varied, with a higher proportion of workers with vocational certificate and marginally lower share of DAE and degree holders in Punjab. In Sindh, on other hand, the share of vocational certificate holders was much higher than the latter period (12.8 percent vs. 2.2 percent); while share of DAE holders was lower (52.7 percent vs. 61 percent). In KP, the share of skilled/ semi-skilled workers with DAE was slightly higher in comparison to the latter year (13.9 percent vs. 11.7 percent), with a marginally lower share of vocational certificate holders (13.7 percent vs. 14.9 percent). For Balochistan, the share of workers in all three TEVT related education categories was lower in 2009 compared to 2013.
Labour Market Intelligence Survey
Food Processing Industry | 44

45 | Food Processing Industry
Labour Market Intelligence Survey
4.5.2 Average Monthly WagesTable 25 shows the minimum and maximum average monthly wages of the skilled/ semi-skilled workers by sub-sector and province for both 2009 and 2013. Data indicates that the di�erence between average minimum and maximum wage has increased over time across all sub-sectors of the food processing sector at the national level. The gap between the maximum and minimum wage was highest for workers involved in the processing and preserving of meat sub-sector at Rs. 5,314 , followed by the workers involved in the manufacturing of soft drinks and other bottled water (Rs. 5,271) in 2009. In 2013, the highest wage di�erence was for the workers of manufacturing of soft drinks and other bottled water (Rs. 7,752) followed by those of processing and preserving of meat at Rs. 7,206.
Both the minimum as well as maximum average wages were observed to be the highest in the manufacturing of soft drinks and other bottled water sub-sector during both the years under review. In 2009, skilled/ semi-skilled workers in this sub-sector were earning on average a minimum of Rs. 14,125 per month and a maximum of Rs. 19,396 a month, while in 2013 the minimum wages had gone upto Rs. 19,506 per month and the maximum wages had reached Rs. 27,258 a month. On the other hand, the lowest levels of minimum and maximum average wages were seen to be in the manufacturing of bakery products sub-sector in 2013 and in the processing & preserving of fruits sub-sector in 2009.
The provincial analysis shows that the minimum and maximum wages are generally higher in the province of Punjab across all sub-sectors in comparison to the other provinces. In Punjab, both the minimum and maximum wages were highest during both 2009 and 2013 in the manufacturing soft drinks & other bottled water, with the gap between maximum and minimum wages also highest in this sub-sector during both the years at Rs. 9,950 in 2009, which rose to Rs. 14,027 in 2013. The lowest levels of minimum and maximum wages in Punjab were seen in the processing & preserving of fruits & vegetables sub-sector during both the years under review. In Sindh, the highest minimum and maximum wage was paid in the processing of meat sub-sector at Rs. 18,444 and Rs. 27,931 in 2013 and Rs. 13,764 and Rs. 21,528 in 2009, respectively. Across KP, minimum and maximum wages were greatest in the manufacturing of soft drinks and other bottled water sub-sector in 2013 and the manufacturing of dairy products sub-sector in 2009. In Balochistan, the gap between maximum and minimum wage was quite low across all five sub-sectors during both the year under review. Workers in the manufacturing of soft drinks and other bottled water sub-sector were paid the highest average minimum and maximum wage in 2013, while both the minimum and maximum wage were highest in the processing of meat sub-sector in 2009. Appendix 4 to 6 give details on the Employees Occupational Title by province, Employees by work assigned in establishment and Employees by Required Qualification.
Total

Labour Market Intelligence Survey
Food Processing Industry | 46
Tabl
e 25
: Min
imum
and
Max
imum
Ave
rage
Wag
es A
vera
ge W
ages
by
Sub-
sect
or a
nd P
rovi
nce
(201
3 &
200
9) in
Rup
ees
Pa
kist
an
Punj
ab
Sind
h K
P B
aloc
hist
an
Sub-
sect
or
Ave
rage
Wag
es a
s in
Ave
rage
Wag
es a
s in
Ave
rage
Wag
es a
s in
Ave
rage
Wag
es a
s in
Ave
rage
Wag
es a
s in
Dec
embe
r 20
13
Dec
embe
r 20
09
Dec
embe
r 20
13
Dec
embe
r 20
09
Dec
embe
r 20
13
Dec
embe
r 20
09
Dec
embe
r 20
13
Dec
embe
r 20
09
Dec
embe
r 20
13
Dec
embe
r 20
09
Minimum
Maximum
Minimum
Maximum
Minimum
Maximum
Minimum
Maximum
Minimum
Maximum
Minimum
Maximum
Minimum
Maximum
Minimum
Maximum
Minimum
Maximum
Minimum
Maximum
Proc
essi
ng &
Pr
eser
ving
of
Mea
t 17
736
2494
2 13
672
1898
6 22
700
3070
0 15
200
1939
0 18
444
2793
1 13
764
2152
8 13
375
1575
0 11
250
1300
0 93
33
1066
7 12
667
1400
0 Pr
oces
sing
&
Pres
ervi
ng o
f Fr
uit &
V
eget
able
s 14
706
1933
6 88
58
1155
5 14
835
1874
2 10
164
1264
7 14
754
2524
0 33
33
7956
14
558
1765
8 67
50
9000
11
444
1316
7 83
33
9222
M
anuf
actu
ring
of D
airy
Pr
oduc
ts
1669
2 21
836
1161
0 15
114
1684
6 22
083
1170
2 15
174
.. ..
.. ..
1600
0 21
667
1166
7 19
333
1125
0 12
125
7875
85
00
Man
ufac
turin
g of
Bak
ery
Prod
ucts
13
279
1800
8 98
90
1325
7 15
681
2127
8 12
568
1681
9 11
241
1398
8 81
05
9644
11
457
1607
7 75
18
1080
1 13
222
1682
2 11
133
1274
4 M
anuf
actu
ring
of
Sof
t Drin
ks
& O
ther
B
ottle
d W
ater
19
506
2725
8 14
125
1939
6 32
263
4629
0 26
364
3631
4 12
566
1727
6 90
31
1243
0 18
093
2472
2 11
398
1541
8 18
792
2564
6 81
88
1190
6 ..
No
esta
blis
hmen
t inc
lude
d fr
om th
is su
b-se
ctor
in th
e sa
mpl
e fr
om S
indh

47 | Food Processing Industry
Labour Market Intelligence Survey
5. TVET Requirement of EstablishmentsThis section would provide an analysis of the skill shortages and requirements of the sample establishments
operating in the five chosen sub-sectors of the food processing sector. This analysis would also result in
estimates of the number of skilled manpower required across the food processing sector over the next few
years and identify the main areas of concerns vis a vis the current state of skills availability for the sector.
5.1 Recruitment ProcedureThe priority ranking of sample establishments by di�erent methods used for recruitment of skilled/
semi-skilled workers is given in table 26 by sub-sector. The data reveals that the most widely used means of
recruiting skilled/ semi-skilled workers is through personal contacts, with over 36 percent of establishments
mentioning it as their first priority, 33 percent declaring it their second priority for hiring workers and around
20 percent stating it a their third priority. Following this, recruitment through references is observed to the
second most widely used means of hiring skilled/ semi-skilled workers, with over 32 percent of establishments
stating it as their first priority, over 40 percent declaring it as second priority and another 14 percent
mentioning it as their third priority.
The use of more modern methods of recruitment – through advertisement and website are not so commonly
used by the sample establishments in the food processing sector. Just over 17 percent of the sample
establishments indicated use of website as a first priority for recruiting skilled workers, with 9 percent each
stating it as their second and third priority. Only 15 percent of establishments quoted advertisement as their
first preferred method of hiring workers, 5.5 percent mentioned they as their second priority, while over 14
percent indicated it as their first priority. In case of recruitment through both website and advertisement, it is
pertinent to point out that a significant proportion of sample establishments at 56 percent and 51 percent did
not show any preference for use of these techniques, respectively.
Total
Table 26: Recruitment of skilled / Semi-skilled Worker through different Methods (priority order)
Through Website
First Second Third Fourth Fifth No
preference Total
Processing & Preserving of Meat
1 0 1 0 0 6 8 (12.5) (0.0) (12.5) (0.0) (0.0) (75.0)
Processing & Preserving of Fruits & Vegetables
5 2 4 2 2 23 38 (13.2) (5.3) (10.5) (5.3) (5.3) (60.5)
Manufacture of Dairy Products
3 6 4 6 0 23 42 (7.1) (14.3) (9.5) (14.3) (0.0) (54.8)
Sweets Honey Toffee Candy and Bakery Products
7 6 6 17 1 49 86 (8.1) (7.0) (7.0) (19.8) (1.2) (57.0)
Manufacture of Soft & Other Bottled Water
8 6 5 5 0 22 46 (17.4) (13.0) (10.9) (10.9) (0.0) (47.8)
Total 24 20 20 30 3 123 220 (10.9) (9.1) (9.1) (13.6) (1.4) (55.9)
Through Personal contact First Second Third Fourth Fifth No preference Total
Processing & Preserving of Meat
5 2 1 0 0 0 8 (62.5) (25.0) (12.5) (0.0) (0.0) (0.0)
Processing & Preserving of Fruits & Vegetables
23 7 5 1 0 2 38 (60.5) (18.4) (13.2) (2.6) (0.0) (5.3)
Manufacture of Dairy Products
11 14 8 2 0 7 42 (26.2) (33.3) (19.0) (4.8) (0.0) (16.7)
Sweets Honey Toffee Candy and Bakery Products
30 30 17 2 1 6 86 (34.9) (34.9) (19.8) (2.3) (1.2) (7.0)
Manufacture of Soft & Other Bottled Water
11 19 12 2 0 2 46 (23.9) (41.3) (26.1) (4.3) (0.0) (4.3)
Total 80 72 43 7 1 17 220 (36.4) (32.7) (19.5) (3.2) (0.5) (7.7)

Labour Market Intelligence Survey
Food Processing Industry | 48
Through References First Second Third Fourth Fifth No preference Total
Processing & Preserving of Meat
2 5 1 0 0 0 8 (25.0) (62.5) (12.5) (0.0) (0.0) (0.0)
Processing & Preserving of Fruits & Vegetables
5 17 6 1 0 9 38 (13.2) (44.7) (15.8) (2.6) (0.0) (23.7)
Manufacture of Dairy Products
18 12 2 5 2 3 42 (42.9) (28.6) (4.8) (11.9) (4.8) (7.1)
Sweets Honey Toffee Candy and Bakery Products
32 36 15 1 0 2 86 (37.2) (41.9) (17.4) (1.2) (0.0) (2.3)
Manufacture of Soft & Other Bottled Water
14 19 7 3 0 3 46 (30.4) (41.3) (15.2) (6.5) (0.0) (6.5)
Total 71 89 31 10 2 17 220 (32.3) (40.5) (14.1) (4.5) (0.9) (7.7)
Through Advertisement First Second Third Fourth Fifth No preference Total
Processing & Preserving of Meat
0 1 1 1 0 5 8 (0.0) (12.5) (12.5) (12.5) (0.0) (62.5)
Processing & Preserving of Fruits & Vegetables
2 1 5 9 1 20 38 (5.3) (2.6) (13.2) (23.7) (2.6) (52.6)
Manufacture of Dairy Products
7 3 8 1 1 22 42 (16.7) (7.1) (19.0) (2.4) (2.4) (52.4)
Sweets Honey Toffee Candy and Bakery Products
13 6 12 11 0 44 86 (15.1) (7.0) (14.0) (12.8) (0.0) (51.2)
Manufacture of Soft & Other Bottled Water
11 1 6 7 1 20 46
(23.9) (2.2) (13.0) (15.2) (2.2) (43.5) Total 33 12 32 29 3 111 220
(15.0) (5.5) (14.5) (13.2) (1.4) (50.5) Through Other sources
First Second Third Fourth Fifth No preference Total
Processing & Preserving of Meat
0 0 0 1 0 7 8 (0.0) (0.0) (0.0) (12.5) (0.0) (87.5)
Processing & Preserving of Fruits & Vegetables
3 1 2 1 1 30 38 (7.9) (2.6) (5.3) (2.6) (2.6) (78.9)
Manufacture of Dairy Products
3 0 5 3 4 27 42 (7.1) (0.0) (11.9) (7.1) (9.5) (64.3)
Sweets Honey Toffee Candy and Bakery Products
4 1 2 4 3 72 86 (4.7) (1.2) (2.3) (4.7) (3.5) (83.7)
Manufacture of Soft & Other Bottled Water
2 0 1 2 2 39 46 (4.3) (0.0) (2.2) (4.3) (4.3) (84.8)
Total 12 2 10 11 10 175 220 (5.5) (0.9) (4.5) (5.0) (4.5) (79.5)
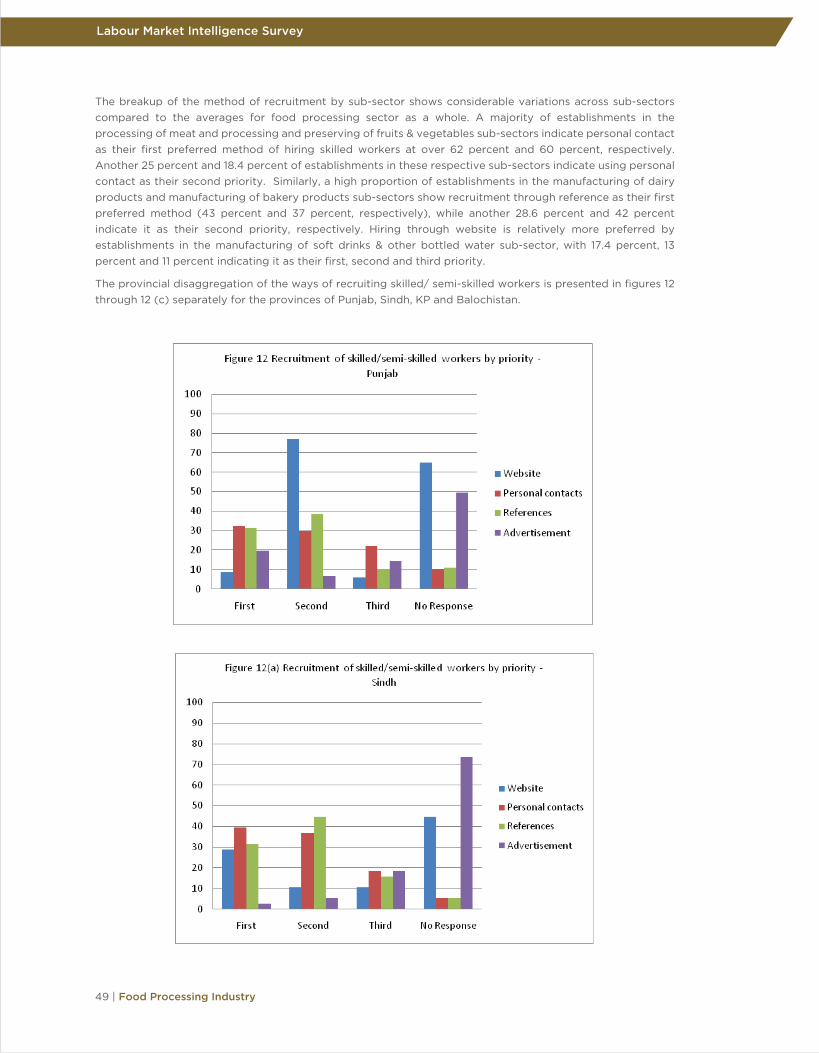
49 | Food Processing Industry
Labour Market Intelligence Survey
The breakup of the method of recruitment by sub-sector shows considerable variations across sub-sectors compared to the averages for food processing sector as a whole. A majority of establishments in the processing of meat and processing and preserving of fruits & vegetables sub-sectors indicate personal contact as their first preferred method of hiring skilled workers at over 62 percent and 60 percent, respectively. Another 25 percent and 18.4 percent of establishments in these respective sub-sectors indicate using personal contact as their second priority. Similarly, a high proportion of establishments in the manufacturing of dairy products and manufacturing of bakery products sub-sectors show recruitment through reference as their first preferred method (43 percent and 37 percent, respectively), while another 28.6 percent and 42 percent indicate it as their second priority, respectively. Hiring through website is relatively more preferred by establishments in the manufacturing of soft drinks & other bottled water sub-sector, with 17.4 percent, 13 percent and 11 percent indicating it as their first, second and third priority.
The provincial disaggregation of the ways of recruiting skilled/ semi-skilled workers is presented in figures 12 through 12 (c) separately for the provinces of Punjab, Sindh, KP and Balochistan.
Total

Labour Market Intelligence Survey
Food Processing Industry | 50
It is evident from the analysis that the most widely used means of recruiting skilled/semi-skilled workers is old traditional i-e through personal contacts, references etc. The employers are as yet not using the modern techniques may be due to absences of an e�ective LMIS.

51 | Food Processing Industry
Labour Market Intelligence Survey
5.2 Sources of Skilled EmployeesTable 27 shows the priority of sample establishments in the selection of skilled or semi-skilled workers from the various available source of supply. The responses reveal that at the overall national level, the highest proportion of establishments select workers trained through the informal ustadi-shagirdi / family trade mechanism, with over 31 percent of establishments reporting it as their first priority, 15.5 percent identify it as second priority and nearly 11 percent state it as their third priority. Following this, the most widely used source of selecting skilled/ semi-skilled workers is the formally trained TVET workers who have obtained training from public training institutions. Nearly 24 percent of establishments indicate this as first priority, 19 percent mention it as their second priority, with another 12 percent stating it as their third priority.
The third most widely used source for hiring workers includes workers trained in own establishment on the job, with close to 18 percent establishments indicating it as first priority, 28.6 percent as second priority and close to 16 percent mentioning it as third priority. Workers trained from private TVET institutions and those trained from other formal sources are given the least priority by establishments in sourcing their skilled workers; only 2.3 percent report selecting TVET trained workers from private institutions as their first priority, 10.4 percent indicate it as second priority, while 35 percent of establishments do not give any preference to this source (Figure 13).
The provincial de-segregation of priority of selecting skilled workers from di�erent sources shows patterns broadly similar to those observed at the national level. However, there are considerable variations across provinces by di�erent sources. In the largest province of Punjab, hiring workers trained through the traditional ustadi-shagirdi/ family trade is the most commonly used mechanism, with over 33 percent of provincial establishments indicating it as first priority, followed by 15.4 percent mentioning it as second priority and another 8.5 percent stating it as third priority. Coming next, TVET graduates from public institutions are reported as having second highest priority; with 22 percent establishments mentioning it as first priority, around 25 percent as second priority, while another 12 percent indicate it as third priority.
The highest share of establishments in the province of Sindh report hiring skilled workers trained in establishments on job with over 28 percent attaching first priority with this source, 25.6 percent giving it second priority, while another 5 percent stating it as third priority. This is followed by establishments selecting TVET trained workers from public institutions and those trained through the informal ustadi-shagirdi system and through general educational institutions. In KP, the ustadi-shagirdi system was the most widely used source for selecting skilled workers, followed by workers trained in establishments on job and TVET trained workers from public training institutions. In Balochistan, half of establishments indicated first priority for using the informal ustadi-shagirdi system to hire workers, with another 20 percent stating it as second priority. Following this, 40 percent of establishments in Balochistan reported TVET graduates from public institutions as their first priority, while 10 percent gave first priority to workers trained in establishments on job.
Total

Labour Market Intelligence Survey
Food Processing Industry | 52
Table 27: Priority in Selection of Skilled/Semi-Skilled Workers from Different Source of Supply
TVET through Public Institutions
First Second Third Fourth Fifth Sixth Last Not in priority Total
Pakistan 52 (23.64)
42 (19.09)
26 (11.82)
23 (10.45)
8 (3.64)
1 (0.45)
- 68 (30.91)
220
Punjab 26 (22.22)
29 (24.79)
19 (16.24)
12 (10.26)
3 (2.56)
- - 28 (23.93)
117
Sindh 10 (25.64)
7 (17.95)
2 (5.13)
3 (7.69)
1 (2.56)
1 (2.56)
- 15 (38.46)
39
KP 12 (22.22)
6 (11.11)
5 (9.26)
8 (14.82)
4 (7.41)
- - 19 (35.18)
54
Balochistan 4 (40)
(0.0)
- - - - - 6 (60)
10
TVET from Private Institutions First Second Third Fourth Fifth Sixth last Not in priority Total
Pakistan 5 (2.27)
23 (10.45)
32 (14.55)
23 (10.45)
24 (10.91)
34 (15.45)
2 (0.91)
77 (35)
220
Punjab 1 (0.85)
11 (9.40)
12 (10.26)
8 (6.84)
17 (14.53)
26 (22.22)
1 (0.85)
41 (35.04)
117
Sindh 1 (2.56)
7 (17.95)
9 (23.08)
5 (12.82)
2 (5.13)
1 (2.56)
14 (35.90)
39
KP 3 (5.56)
4 (7.41)
10 (18.52)
7 (12.96)
5 (9.26)
8 (14.81)
- 17 (31.48)
54
Balochistan 1 (10)
1 (10)
3 (30)
- - - 5 (50)
10
Trained in Establishment through Apprenticeship First Second Third Fourth Fifth Sixth last Not in priority Total
Pakistan 11 (5)
19 (8.64)
25 (11.36)
32 (14.54)
22 (10.0)
21 (9.55)
4 (1.82)
86 (39.09)
220
Punjab 2 (1.71)
6 (5.13)
8 (6.84)
23 (19.66)
17 (14.53)
13 (11.11)
4 (3.42)
44 (37.61)
117
Sindh 3 (7.69)
5 (12.82)
5 (12.82)
5 (12.82)
1 (2.56)
3 (7.69)
- 17 (43.59)
39
KP 6 (11.11)
8 (14.81)
8 (14.81)
4 (7.41)
3 (5.55)
2 (3.70)
- 23 (42.59)
54
Balochistan 0 (0.0)
0 (0.0)
4 (40.0)
0 (0.0)
1 (10.0)
3 (30.0)
0 (0.0)
2 (20.0)
10
Trained in Establishment on Job First Second Third Fourth Fifth Sixth last Not in priority Total
Pakistan 39 (17.73)
63 (28.64)
35 (15.91)
20 (9.09)
24 (10.91)
2 (0.91)
1 (0.45)
36 (16.36)
220
Punjab 17 (14.53)
33 (28.20)
21 (17.95)
11 (9.40)
14 (11.97)
2 (1.71)
1 (0.85)
18 (15.38)
117
Sindh 11 (28.20)
10 (25.64)
2 (5.13)
5 (12.82)
4 (10.26)
0 (0.0)
0 (0.0)
7 (17.95)
39
KP 11 (28.20)
10 (25.64)
2 (5.13)
5 (12.82)
4 (10.26)
0 (0.0)
0 (0.0)
7 (17.95)
39
Balochistan 1 (10.0)
6 (60.0)
3 (30.0)
0 (0.0)
0 (0.0)
0 (0.0)
0 (0.0)
0 (0.0)
10
Trained Through Informal/ Ustadi-Shagirdi/Family Trade First Second Third Fourth Fifth Sixth last Not in priority Total
Pakistan 69 34 24 24 21 23 1 24 220
Note: Figures in parenthesis are row percentages
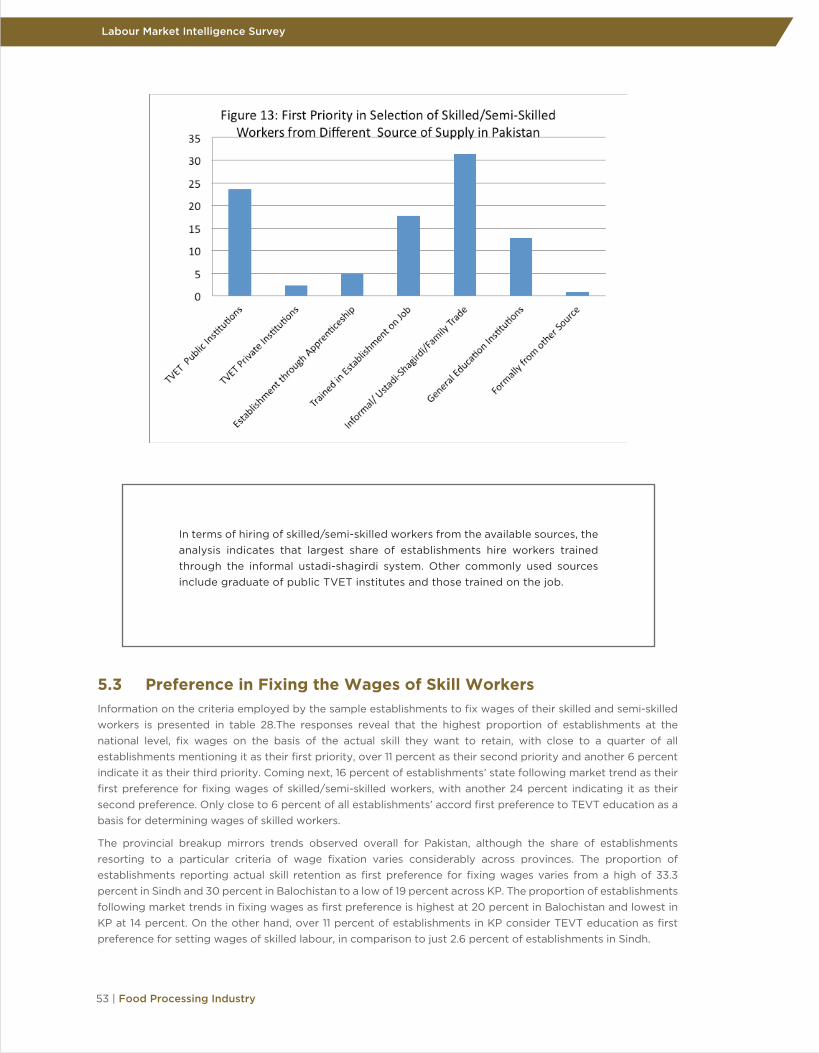
5.3 Preference in Fixing the Wages of Skill WorkersInformation on the criteria employed by the sample establishments to fix wages of their skilled and semi-skilled workers is presented in table 28.The responses reveal that the highest proportion of establishments at the national level, fix wages on the basis of the actual skill they want to retain, with close to a quarter of all establishments mentioning it as their first priority, over 11 percent as their second priority and another 6 percent indicate it as their third priority. Coming next, 16 percent of establishments’ state following market trend as their first preference for fixing wages of skilled/semi-skilled workers, with another 24 percent indicating it as their second preference. Only close to 6 percent of all establishments’ accord first preference to TEVT education as a basis for determining wages of skilled workers.
The provincial breakup mirrors trends observed overall for Pakistan, although the share of establishments resorting to a particular criteria of wage fixation varies considerably across provinces. The proportion of establishments reporting actual skill retention as first preference for fixing wages varies from a high of 33.3 percent in Sindh and 30 percent in Balochistan to a low of 19 percent across KP. The proportion of establishments following market trends in fixing wages as first preference is highest at 20 percent in Balochistan and lowest in KP at 14 percent. On the other hand, over 11 percent of establishments in KP consider TEVT education as first preference for setting wages of skilled labour, in comparison to just 2.6 percent of establishments in Sindh.
53 | Food Processing Industry
Labour Market Intelligence Survey
Total
In terms of hiring of skilled/semi-skilled workers from the available sources, the analysis indicates that largest share of establishments hire workers trained through the informal ustadi-shagirdi system. Other commonly used sources include graduate of public TVET institutes and those trained on the job.

Labour Market Intelligence Survey
Food Processing Industry | 54
The actual skill retention of their existing workers is the most important criteria employed by establishments while setting wages of skilled workers. The next most important criteria is following of market trend, while TVET eduction of workers does not matter much in setting of wages.
Table 28: Basis of Fixing Wages of Skilled/Semi-skilled Workers
TEVT Educated as basis of Fixing Wages of Skilled/Semi-skilled Workers First Second Third Fourth Not in preference Total
Pakistan 25 (5.63)
32 (7.21)
84 (18.92)
8 (1.80)
73 (16.44)
222 (50.0)
Punjab 9 (3.81)
19 (8.05)
48 (20.34)
5 (2.12)
37 (15.68)
118 (50.0)
Sindh 2 (2.56)
8 (10.26)
15 (19.23)
2 (2.56)
12 (15.38)
39 (50.0)
KP 14 (11.29)
4 (3.23)
19 (15.32)
18 (14.52)
55 (44.35)
14 (11.29)
Balochistan 1 (4.76)
2 (9.52)
1 (4.76)
6 (28.57)
10 (47.62)
1 (4.76)
Actual Skill retained as basis of Fixing Wages of Skilled/Semi-skilled Workers First Second Third Fourth Not in preference Total
Pakistan 110 (24.77)
50 (11.26)
27 (6.08)
1 (0.22)
34 (7.66)
222 (50.0)
Punjab 57 (24.15)
23 (9.75)
14 (5.93)
1 (0.42)
23 (9.74)
118 (50.0)
Sindh 26 (33.33)
9 (11.54)
2 (2.56)
0 (0.0)
2 (2.56)
39 (50.0)
KP 21 (19.09)
14 (12.73)
11 (10.0)
0 (0.0)
9 (8.18)
55 (50.0)
Balochistan 6 (30.0)
4 (20.0)
0 (0.0)
0 (0.0)
0 (0.0)
10 (50.0)
Follow Market Trend for Fixing Wages of Skilled/Semi-skilled Workers First Second Third Fourth Not in preference Total
Pakistan 71 (15.99)
106 (23.87)
32 (7.21)
1 (0.22)
12 (2.70)
222 (50.0)
Punjab 38 (16.10)
57 (24.15)
17 (7.20)
0 (0.0)
6 (2.54)
118 (50.0)
Sindh 11 (14.10)
17 (21.79)
7 (8.97)
0 (0.0)
4 (5.13)
39 (50.0)
KP 18 (16.36)
27 (24.54)
7 (6.36)
1 (0.91)
2 (1.82)
55 (50.0)
Balochistan 4 (20.0)
5 (25.00)
1 (5.00)
0 (0.0)
0 (0.0)
10 (50.0)
Follow others than the above for Fixing Wages of Skilled/Semi-skilled Workers First Second Third Fourth Not in preference Total
Pakistan 9 (2.03)
2 (0.45)
11 (2.48)
21 (4.73)
179 (40.31)
222 (50.0)
Note: Figures in parenthesis are row percentages

5.4 Employer’s Satisfaction on Skill Level of WorkersA question regarding level of skill satisfaction with standards was asked from respondent. They are asked whether they are satisfied with the skills standard of their existing skilled workers, a substantial majority respond in the a�rmative (table 29). Overall, 88 percent of the 213 establishments that respond to this question indicate that they are satisfied with the standard of their existing skilled/ semi-skilled workers. The analysis across the five sub-sectors of the food processing sector shows that the highest share of establishments satisfied by the existing skills standard is in the processing and preserving of fruits and vegetables sub-sector at nearly 92 percent, while the relatively lowest proportion of establishments belongs to the manufacturing of dairy products sub-sector at 83 percent.
Province-wise, the highest proportion of establishments satisfied with the existing skilled labour is in Balochistan, where all 10 establishments indicate their satisfaction with the skills of their existing work force. This is followed by Sindh, where over 91 percent of the 35 reporting establishments express their satisfaction with the skills standard, with all establishments in the processing of meat and processing of fruits and vegetables sub-sectors showing complete satisfaction with the exiting skills set of their employees. In Punjab, nearly 90 percent of the 115 establishments are satisfied with the existing skills standard, with all establishments operating in the processing of meat and manufacturing of soft drinks and other bottled water sub-sectors showing satisfaction with the skills of their existing workers.
KP has the relatively lowest proportion of satisfied establishments at 81 percent. Moreover, there is considerable variation across sub-sectors within this province, with all establishments in manufacturing of dairy products showing satisfaction, while the single establishment in the processing of meat sub-sector is not satisfied with the skills standard.
In the second stage, the sample establishments are asked to indicate their level of satisfaction with the skills of their existing skilled and semi-skilled workers. Figures 14 to 14(e) show the level of satisfaction with TVET and others trained workers at national level by sub-sector from di�erent sources, while Tables 30 to 30(e) show this level of satisfaction by source at the provincial level. In case of workers trained from public TVET institutions, around 42 percent of the 222 sample establishments express a satisfaction level of above 60 percent, 18 percent indicate satisfaction of between 40 percent and 60 percent, 6.8 percent show satisfaction of below 40 percent, while over 33 percent establishments do not respond to this question (Figure 14). Province-wise, the proportion of establishments indicating satisfaction of above 60 percent is highest in Punjab, with close to 51 percent of the 118 establishments showing this level of satisfaction, with another 17 percent expressing satisfaction of between 40 percent and 60 percent, while 27 percent establishments don’t respond to this question (Table 30). This is followed by 32.7 percent establishments in KP showing highest level of satisfaction with their workers trained from public TVET institutions, 30.8 percent in Sindh and 30 percent in Balochistan.
55 | Food Processing Industry
Labour Market Intelligence Survey
Total
Table 29: Satisfaction or otherwise with the Standards of Skill of Skilled Worker – Pakistan Sub-sectors Pakistan Punjab Sindh KP Balochistan
Yes No Yes No Yes No Yes No Yes No Processing & Preserving of Meat
7 (87.5)
1 (12.5)
2 (100.0)
0 (0.0)
4 (100.0)
0 (0.0)
0 (0.0)
1 (100.0)
1 (100.0)
0 (0.0)
Processing & Preserving of Fruit & Vegetables
33 (91.7)
3 (8.3)
27 (96.4)
1 (3.6)
4 (100.0)
0 (0.0)
1 (33.3)
2 (66.7)
1 (100.0)
0 (0.0)
Manufacturing of Dairy Products
34 (82.9)
7 (17.1)
32 (82.1)
7 (18.0)
.. .. 1 (100.0)
0 (0.0)
1 (100.0)
0 (0.0)
Manufacturing of Bakery Products
75 (89.3)
9 (10.7)
30 (88.2)
4 (11.8)
10 (90.9)
1 (9.1)
30 (88.2)
4 (11.8)
5 (100.0)
0 (0.0)
Manufacturing of Soft Drinks & Other Bottled Water
39 (88.6)
5 11.4
12 (100.0)
0 (0)
14 (87.5)
2 (12.5)
11 (78.6)
3 (21.4)
2 (100.0)
0 (0.0)
Total Food Processing 188 (88.3)
25 (11.7)
103 (89.6)
12 (10.4)
32 (91.4)
3 (8.6)
43 (81.1)
10 (18.9)
10 (100.0)
0 (0.0)
Note: Figures in parenthesis under each main column are row percentages .. No establishment included in the sample from Sindh

The sub-sectoral analysis at the national level indicates that 54.8 percent of establishments in manufacturing of dairy products sub-sector show a satisfaction level of above 60 percent, followed by 44.7 percent in the manufacturing of soft drinks and other bottled water sub-sector, 39.5 percent in the processing and preserving of fruits and vegetables sub-sector, while only 12.5 percent of establishments in processing and preserving of meat sub-sector indicating satisfaction of above 60 percent (Figure 14). The proportion of non-responding establishments is highest in the processing meat sub-sector at 50 percent and lowest for establishments in the manufacturing of soft drinks and other bottled water (Figure 14).
At the provincial level, the highest share of establishments reporting satisfaction level of above 60 percent with workers trained from public TVET institutions is in the manufacturing of soft drinks sub-sector in Balochistan, with the entire two establishments in this sub-sector indicating this level of satisfaction (Table 30). This is followed by over 83 percent of the 12 establishments in this same sub-sector in the province of Punjab and 60 percent of the 5 establishments in the processing and preserving of fruits and vegetables sub-sector in Sindh indicating this level of satisfaction. It is also pertinent to mention that none of the sole establishments in the manufacturing of dairy products sub-sector in KP and Balochistan and the processing of meat sub-sector in Balochistan gave response to this question.
The level of satisfaction of skilled workers qualified from private TVET institutions is shown in Figure 14(a) and table 30(a). Overall, only 19.4 percent of the 222 establishments across Pakistan express satisfaction above 60 percent with their workers trained from private TVET institutions, with another 23.4 percent reporting a satisfaction level between 40 percent and 60 percent, 13 percent indicate satisfaction below 40 percent, while over 44 percent do not respond to this query [Figure 14(a)]. The provincial disaggregation shows that 23 percent and 25.6 percent of the 39 establishments in Sindh report satisfaction in the first two levels, respectively. This is followed by 22 percent and 17.8 percent of the 118 establishments in Punjab and 14.6 percent and 38.2 percent of the 55 establishments in KP, while none of the 10 establishments in Balochistan report satisfaction in the first two levels, with 4 establishments (40 percent) indicating satisfaction level of below 40 percent and 60 percent do not respond [Table 30(a)].
Sub-sector-wise, over 26 percent and 14.3 percent of the 42 establishments in the manufacturing of dairy products sub-sector indicate satisfaction in the first two levels of above 60 percent and between 40 percent and 60 percent, respectively, while 45 percent do not respond. In the manufacturing of soft drinks and other bottled water sub-sector, 25.5 percent and around 32 percent of the 47 establishments show satisfaction in the first two levels. The lowest proportion (12.5 percent) of the 8 establishments in the processing and preserving of meat sub-sector indicate a level of satisfaction of above 60 percent, followed by another 12.5 percent reporting satisfaction of below 40 percent, while the remaining 6 establishments (75 percent) do not provide response to this [Figure 14(a)].
The sub-sectoral breakup by province shows that half of the 118 establishments in Punjab show satisfaction level of above 60 percent with workers trained from private TVET institutions, while the remaining half do not give response [Table 30(a)]. This is followed by 40 percent each of the 5 establishments in the processing of fruits and vegetables sub-sector across Sindh reporting satisfaction in the first two levels and 36.4 percent and 27.3 percent of the 11 establishments in the manufacturing of bakery products sub-sector in Sindh reporting satisfaction in the first two levels. None of the establishments in the processing of meat sub-sectors in Sindh and KP, manufacturing of dairy products sub-sector in KP as well as all sub-sectors in Balochistan indicate satisfaction in the first two levels.
Labour Market Intelligence Survey
Food Processing Industry | 56

57 | Food Processing Industry
Labour Market Intelligence Survey
Total
Table 30: Level of Satisfaction of Skilled Workers Trained from Public TVET Institutions (%)
Above 60%
Between 40% and 60%
Below 40%
No reply
Punjab Processing & Preserving of Meat 50.00 50.00 0.00 0.00
Processing & Preserving of Fruits & Vegetables 39.29 14.29 3.57 42.86
Manufacture of Dairy Products 57.50 10.00 2.50 30.00
Sweets Honey Toffee Candy and Bakery Products 41.67 25.00 11.11 22.22
Manufacture of Soft & Other Bottled Water 83.33 16.67 0.00 0.00
Total 50.85 16.95 5.08 27.12
Sindh Processing & Preserving of Meat 0.00 25.00 0.00 75.00
Processing & Preserving of Fruits & Vegetables 60.00 40.00 0.00 0.00
Sweets Honey Toffee Candy and Bakery Products 27.27 36.36 0.00 36.36
Manufacture of Soft & Other Bottled Water 31.58 15.79 5.26 47.37
Total 30.77 25.64 2.56 41.03
KP Processing & Preserving of Meat 0.00 100.00 0.00 0.00
Processing & Preserving of Fruits & Vegetables 25.00 0.00 50.00 25.00
Manufacture of Dairy Products 0.00 0.00 0.00 100.00
Sweets Honey Toffee Candy and Bakery Products 40.00 8.57 11.43 40.00
Manufacture of Soft & Other Bottled Water 21.43 35.71 14.29 28.57
Total 32.73 16.36 14.55 36.36
Balochistan Processing & Preserving of Meat 0.00 0.00 - 100.00
Processing & Preserving of Fruits & Vegetables 0.00 100.00 - 0.00
Manufacture of Dairy Products 0.00 0.00 - 100.00
Sweets Honey Toffee Candy and Bakery Products 20.00 0.00 - 80.00
Manufacture of Soft & Other Bottled Water 100.00 0.00 - 0.00
Total 30.00 10.00 - 60.00
Note: Figures in parenthesis are row percentages

Labour Market Intelligence Survey
Food Processing Industry | 58
Table 30(a): Level of Satisfaction of Skilled Workers Trained from Private TVET Institutions (%)
Above 60%
Between 40% and 60%
Below 40%
No reply
Punjab Processing & Preserving of Meat 50.00 0.00 0.00 50.00
Processing & Preserving of Fruits & Vegetables 10.71 10.71 3.57 75.00
Manufacture of Dairy Products 27.50 15.00 15.00 42.50
Sweets Honey Toffee Candy and Bakery Products 19.44 16.67 19.44 44.44
Manufacture of Soft & Other Bottled Water 33.33 50.00 8.33 8.33
Total 22.03 17.80 12.71 47.46
Sindh Processing & Preserving of Meat 0.00 0.00 0.00 100.00
Processing & Preserving of Fruits & Vegetables 40.00 40.00 0.00 20.00
Sweets Honey Toffee Candy and Bakery Products 36.36 27.27 0.00 36.36
Manufacture of Soft & Other Bottled Water 15.79 26.32 5.26 52.63
Total 23.08 25.64 2.56 48.72
KP Processing & Preserving of Meat 0.00 0.00 100.00 0.00
Processing & Preserving of Fruits & Vegetables 0.00 25.00 50.00 25.00
Manufacture of Dairy Products 0.00 0.00 0.00 100.00
Sweets Honey Toffee Candy and Bakery Products 8.57 45.71 5.71 40.00
Manufacture of Soft & Other Bottled Water 35.71 28.57 28.57 7.14
Total 14.55 38.18 16.36 30.91
Balochistan Processing & Preserving of Meat 0.00 0.00 0.00 100.00
Processing & Preserving of Fruits & Vegetables 0.00 0.00 100.00 0.00
Manufacture of Dairy Products 0.00 0.00 0.00 100.00
Sweets Honey Toffee Candy and Bakery Products 0.00 0.00 20.00 80.00
Manufacture of Soft & Other Bottled Water 0.00 0.00 100.00 0.00
Total 0.00 0.00 40.00 60.00
Note: Figures in parenthesis are row percentages

59 | Food Processing Industry
Labour Market Intelligence Survey
Total
Table 30(b): Level of Satisfaction of Skilled Workers Trained from ‘Ustadi-Shagirdi’ (%)
Above 60%
Between 40% and 60%
Below 40%
No reply
Punjab Processing & Preserving of Meat 50.00 0.00 50.00 0.00
Processing & Preserving of Fruits & Vegetables 35.71 57.14 0.00 7.14
Manufacture of Dairy Products 47.50 30.00 15.00 7.50
Sweets Honey Toffee Candy and Bakery Products 47.22 41.67 8.33 2.78
Manufacture of Soft & Other Bottled Water 33.33 58.33 8.33 0.00
Total 43.22 42.37 9.32 5.08
Sindh Processing & Preserving of Meat 75.00 25.00 0.00 0.00
Processing & Preserving of Fruits & Vegetables 0.00 20.00 60.00 20.00
Sweets Honey Toffee Candy and Bakery Products 27.27 36.36 18.18 18.18
Manufacture of Soft & Other Bottled Water 26.32 10.53 31.58 31.58
Total 28.21 20.51 28.21 23.08
KP Processing & Preserving of Meat 100.00 0.00 0.00 0.00
Processing & Preserving of Fruits & Vegetables 75.00 25.00 0.00 0.00
Manufacture of Dairy Products 100.00 0.00 0.00 0.00
Sweets Honey Toffee Candy and Bakery Products 77.14 17.14 0.00 5.71
Manufacture of Soft & Other Bottled Water 42.86 35.71 14.29 7.14
Total 69.09 21.82 3.64 5.45
Balochistan Processing & Preserving of Meat 0.00 100.00 0.00 0.00
Processing & Preserving of Fruits & Vegetables 0.00 0.00 - 100.00
Manufacture of Dairy Products 0.00 0.00 - 100.00
Sweets Honey Toffee Candy and Bakery Products 60.00 20.00 - 20.00
Manufacture of Soft & Other Bottled Water 0.00 50.00 - 50.00
Total 30.00 30.00 - 40.00
Note: Figures in parenthesis are row percentages

Labour Market Intelligence Survey
Food Processing Industry | 60
Table 30 (c): Level of Satisfaction of Skilled Workers Trained from Family Trade (%)
Above 60%
Between 40% and 60%
Below 40%
No reply
Punjab Processing & Preserving of Meat 0.00 0.00 50.00 50.00
Processing & Preserving of Fruits & Vegetables 0.00 7.14 10.71 82.14
Manufacture of Dairy Products 7.50 2.50 32.50 57.50
Sweets Honey Toffee Candy and Bakery Products 5.56 5.56 27.78 61.11
Manufacture of Soft & Other Bottled Water 8.33 41.67 16.67 33.33
Total 5.08 8.47 24.58 61.86
Sindh Processing & Preserving of Meat 75.00 25.00 0.00 0.00
Processing & Preserving of Fruits & Vegetables 0.00 0.00 80.00 20.00
Sweets Honey Toffee Candy and Bakery Products 9.09 54.55 18.18 18.18
Manufacture of Soft & Other Bottled Water 10.53 5.26 31.58 52.63
Total 15.38 20.51 30.77 33.33
KP Processing & Preserving of Meat 0.00 100.00 0.00 0.00
Processing & Preserving of Fruits & Vegetables 25.00 75.00 0.00 0.00
Manufacture of Dairy Products 0.00 0.00 100.00 0.00
Sweets Honey Toffee Candy and Bakery Products 28.57 45.71 5.71 20.00
Manufacture of Soft & Other Bottled Water 14.29 42.86 35.71 7.14
Total 23.64 47.27 14.55 14.55
Balochistan Processing & Preserving of Meat 100.00 0.00 0.00 0.00
Processing & Preserving of Fruits & Vegetables 0.00 0.00 - 100.00
Manufacture of Dairy Products 0.00 0.00 - 100.00
Sweets Honey Toffee Candy and Bakery Products 0.00 20.00 - 80.00
Manufacture of Soft & Other Bottled Water 0.00 0.00 - 100.00
Total 10.00 10.00 - 80.00
Note: Figures in parenthesis are row percentages

61 | Food Processing Industry
Labour Market Intelligence Survey
Total
Table 30 (d): Level of Satisfaction of Skilled Workers Trained with “On Job” Training (%)
Above 60%
Between 40% and 60%
Below 40%
No reply
Punjab Processing & Preserving of Meat 50.00 50.00 0.00 0.00
Processing & Preserving of Fruits & Vegetables 35.71 50.00 3.57 10.71
Manufacture of Dairy Products 35.00 32.50 0.00 32.50
Sweets Honey Toffee Candy and Bakery Products 38.89 25.00 5.56 30.56
Manufacture of Soft & Other Bottled Water 75.00 16.67 0.00 8.33
Total 40.68 33.05 2.54 23.73
Sindh Processing & Preserving of Meat 25.00 0.00 0.00 75.00
Processing & Preserving of Fruits & Vegetables 80.00 20.00 0.00 0.00
Sweets Honey Toffee Candy and Bakery Products 36.36 36.36 0.00 27.27
Manufacture of Soft & Other Bottled Water 42.11 15.79 5.26 36.84
Total 43.59 20.51 2.56 33.33
KP Processing & Preserving of Meat 100.00 0.00 0.00 0.00
Processing & Preserving of Fruits & Vegetables 75.00 0.00 0.00 25.00
Manufacture of Dairy Products 0.00 100.00 0.00 0.00
Sweets Honey Toffee Candy and Bakery Products 42.86 22.86 2.86 31.43
Manufacture of Soft & Other Bottled Water 50.00 42.86 7.14 0.00
Total 47.27 27.27 3.64 21.82
Balochistan Processing & Preserving of Meat 0.00 0.00 100.00 0.00
Processing & Preserving of Fruits & Vegetables 100.00 0.00 0.00 0.00
Manufacture of Dairy Products 0.00 0.00 0.00 100.00
Sweets Honey Toffee Candy and Bakery Products 20.00 60.00 20.00 0.00
Manufacture of Soft & Other Bottled Water 0.00 50.00 0.00 50.00
Total 20.00 40.00 20.00 20.00
Note: Figures in parenthesis are row percentages

Labour Market Intelligence Survey
Food Processing Industry | 62
Table 30 (e): Level of Satisfaction of Skilled Workers Trained with Apprenticeship (%)
Above 60%
Between 40% and 60%
Below 40%
No reply
Punjab Processing & Preserving of Meat 0.00 0.00 50.00 50.00
Processing & Preserving of Fruits & Vegetables 7.14 7.14 3.57 82.14
Manufacture of Dairy Products 17.50 27.50 2.50 52.50
Sweets Honey Toffee Candy and Bakery Products 11.11 16.67 13.89 58.33
Manufacture of Soft & Other Bottled Water 58.33 25.00 0.00 16.67
Total 16.95 18.64 6.78 57.63
Sindh Processing & Preserving of Meat - 0.00 0.00 100.00
Processing & Preserving of Fruits & Vegetables - 20.00 40.00 40.00
Sweets Honey Toffee Candy and Bakery Products - 36.36 9.09 54.55
Manufacture of Soft & Other Bottled Water - 26.32 0.00 73.68
Total - 25.64 7.69 66.67
KP Processing & Preserving of Meat 100.00 0.00 0.00 0.00
Processing & Preserving of Fruits & Vegetables 25.00 50.00 0.00 25.00
Manufacture of Dairy Products 0.00 0.00 0.00 100.00
Sweets Honey Toffee Candy and Bakery Products 22.86 25.71 0.00 51.43
Manufacture of Soft & Other Bottled Water 35.71 28.57 0.00 35.71
Total 27.27 27.27 0.00 45.45
Balochistan Processing & Preserving of Meat - 0.00 0.00 100.00
Processing & Preserving of Fruits & Vegetables - 0.00 0.00 100.00
Manufacture of Dairy Products - 0.00 0.00 100.00
Sweets Honey Toffee Candy and Bakery Products - 20.00 20.00 60.00
Manufacture of Soft & Other Bottled Water - 0.00 0.00 100.00
Total - 10.00 10.00 80.00
Note: Figures in parenthesis are row percentages

The level of satisfaction of the sample establishments with the workers trained through the informal ustadi-shagirdi system is seen to be relatively the highest across all categories of trained workers. Overall, over 46 percent of establishments across Pakistan express satisfaction level of over 60 percent with the workers trained through ustadi-shagirdi, followed by another 33 percent that show satisfaction in the range of 40 percent and 60 percent [Figure 14(b)]. The provincial break down indicates highest satisfaction with workers trained through ustadi-shagirdi in KP, with 69 percent of the 55 establishments reporting satisfaction level of over 60 percent, followed by 21.8 percent showing satisfaction in the lower range of between 40 percent and 60 percent [Table 30(b)]. Following this, over 43 percent and 42.4 percent of the 118 establishments in Punjab show satisfaction levels of over 60 percent and between 40 percent and 60 percent, respectively. Establishments in the province of Sindh indicate the relatively lowest level of satisfaction with workers trained through the informal ustadi-shagirdi system, with 28.2 percent and 20.5 percent showing satisfaction in the first two levels, respectively, with 23 percent not responding to this question.
The analysis by sub-sector at the country level shows that 62.5 percent of establishments in the processing and preserving of meat sub-sector have a satisfaction level of above 60 percent, followed by another 25 percent showing satisfaction at the lower level of 40 percent and 60 percent. At the second position, 57.5 percent and 30 percent of the 87 establishments in the manufacturing of bakery products sub-sector express satisfaction in the first two levels, with workers trained through ustadi-shagirdi. At the other end, 32 percent each of the establishments in the manufacturing of soft drinks and other bottled water sub-sector show satisfaction of over 60 percent and between 40 percent and 60 percent [Figure 14 (b)].
The sub-sectoral breakup across province shows that the sole establishment in the processing and preserving of meat and manufacturing of dairy products sub-sectors in KP indicate satisfaction of over 60 percent with the skilled/ semi-skilled workers trained by the ustadi-shagirdi mechanism [Table 30(b)]. This is followed by 77 percent of the 35 establishments in the manufacturing of bakery products sub-sector in KP and three-fourths of the four establishments each in the processing of meat and processing of fruits and vegetables sub-sectors in Sindh and KP, respectively reporting satisfaction of above 60 percent. on the other hand, none of the 5 establishments in the processing of fruits and vegetables sub-sector in Sindh, the single establishments each in the processing of meat, processing of fruits and vegetables, manufacturing of dairy products sub-sectors in Balochistan and the two establishments in the manufacturing of soft drinks and other bottled water sub-sector in Balochistan express satisfaction with workers trained from ustadi-shagirdi at the highest level of above 60 percent.
The response of the sample establishments with respect to level of satisfaction with workers trained from family trade is given in Figure 14(c) and Table 30(c). The data indicates that only 11.7 percent of the 222 establishments express satisfaction of over 60 percent with this method of training, with 20.3 percent showing satisfaction of between 40 percent and 60 percent and another 22 percent reporting satisfaction of below 40 percent, while 46 percent do not respond to this query. Province-wise, the highest proportion of establishments showing satisfaction with this mode of training is in the province of KP, where 23.6 percent and 47.3 percent of the 55 establishments report satisfaction in the above two levels, respectively. In Sindh, 15.4 percent and 20.5 percent of the 39 establishments indicate satisfaction of above 60 percent and between 40 percent and 60 percent. The lowest satisfaction with workers trained from family trade is shown by establishments in Punjab, followed by Balochistan.
The disaggregation by sub-sector shows that half of the 8 establishments in the processing and preserving of meat sub-sector, report satisfaction of over 60 percent, with another 2 (25 percent) indicating satisfaction at the lower level of 40 percent and 60 percent. Nearly 15 percent of the 87 establishments in the manufacturing of bakery products sub-sector show satisfaction of above 60 percent, followed by 28.7 percent indicating satisfaction of between 40 percent and 60 percent and another 16 percent report satisfaction of below 40 percent. Only 2.6 percent of 38 establishments in the processing and preserving of fruits and vegetables sub-sector show satisfaction of above 60 percent with workers trained through family trade, followed by another 13 percent indicating satisfaction of between 40 percent and 60 percent, while nearly 66 percent give no response [Figure 14 (c)].
In terms of the satisfaction with workers trained through on job training, nearly 42 percent of establishments at the national level express a level of satisfaction of above 60 percent, with another 29.7 percent reporting satisfaction at the lower level of between 40 percent and 60 percent [table 30(d)]. Thus, satisfaction with workers trained on the job comes in second after workers through the informal ustadi-shagirdi system at the overall national level. The provincial analysis shows that the highest share of establishments expressing satisfaction with training on the job is in KP, where 47.3 percent and 27.3 percent of the 55 establishments express
63 | Food Processing Industry
Labour Market Intelligence Survey
satisfaction at first two levels. This is followed by 43.6 percent and 20.5 percent of the 39 establishments in Sindh
reporting satisfaction at the first two levels, respectively. Only 20 percent of the 39 establishments in Balochistan
express satisfaction at above 60 percent level, while 40 percent are satisfied at the lower level of between 40
percent and 60 percent.
Sector-wise, the highest proportion of establishments satisfied with the skill level of workers trained through
on the job attachment is in the manufacturing of soft drinks and other bottled water sub-sector at over 51
percent showing satisfaction level of above 60 percent, while 25.5 percent indicate satisfaction level of
between 40 percent and 60 percent. This is followed by 47.4 percent and 39.5 percent of the 38
establishments engaged in the processing and preserving of fruits and vegetables reporting satisfaction at the
first two levels [Figure 14 (d)].
The level of satisfaction of the sample establishments with the last category of trained workers – workers trained by
apprenticeship is given in Figure 14(e). It can be observed that following family trade, the lowest share of the sample
establishments express satisfaction with skilled workers trained through apprenticeship, with close to 16 percent of
the 22 establishments having satisfaction of above 60 percent , followed by another 21.6 percent with a level of
satisfaction of between 40 percent and 60 percent. Province-wise, 27.3 percent each of the establishments in KP
indicate satisfaction in the first two levels [Table 30(e)]. This is followed by around 17 percent and 18.6 percent of the
118 establishments in Punjab reporting satisfaction of above 60 percent and between 40 percent and 60 percent,
respectively. None of the establishments in Sindh and Balochistan show satisfaction of above 60 percent with
workers trained with apprenticeship, with 25.6 percent of establishments in Sindh and 10 percent in Balochistan
having satisfaction at the lower level of between 40 percent and 60 percent.
The sectoral analysis at the national level reveals that the highest proportion of establishments showing
satisfaction with this source of trained workers is in the manufacturing of soft drinks and other bottled water
sub-sector at around 26 percent each at above 60 percent satisfaction and between 40 percent and 60
percent level of satisfaction [Figure 14(e)]. This is followed by 16.7 percent of establishments involved in the
manufacturing of dairy products indicating satisfaction of above 60 percent, with another 26.2 percent
satisfied at the lower level of between 40 percent and 60 percent. On the other hand, only around 8 percent
of the 38 establishments engaged in the processing and preserving of fruits and vegetables show satisfaction
level of above 60 percent with workers trained from apprenticeship.
The sub-sectoral analysis at the provincial level shows that the sole establishment in processing and preserving
of meat sub-sector in KP has satisfaction of over 60 percent with workers trained through apprenticeship
[Table 30(e)]. This is followed by over 58 percent of the 12 establishments working in the manufacturing of soft
drinks and other bottled water sub-sector in Punjab expressing satisfaction of above 60 percent, with another
18.6 percent indicating satisfaction at the lower level of between 40 percent and 60 percent. None of the
establishments across all sub-sectors in Sindh and Balochistan indicates satisfaction at the highest level of over
60 percent.
Labour Market Intelligence Survey
Food Processing Industry | 64
The food processing industry is generally satisfied with the skill level of existing work force. The level of satisfaction with skills standards is highest for workers trained through the informal ustadi-shagirdi mechanism. Satisfaction levels are also high for workers trained on the job and those trained through public TVET institutions.

The response of sample establishments when enquired about the type of enhancement required to improve the existing skills base of workers trained from public TVET institutions and those from private TVET institutions, in order of priority, is presented in table 31 and 31(a), respectively. The top priority of establishments with respect to required improvement from public TVET institutions is in the area of practical training, with close to 53 percent of the 188 establishments that provided response to this question, indicating need for this enhancement. This is followed by 20 percent establishments pointing towards the need to provide training to TVET graduates on modern equipment and machinery, while around 9 percent establishments highlight the need to enhance professional attitude of the trained public TVET workers (Figure 15).
The provincial breakup follows trends identified at national level, with 52 percent of the 98 establishments in the province of Punjab identifying need for more practical training, around 28 percent emphasizing on training on modern equipment and 7 percent highlighting need for improvement in professional attitude of the trained workers [Table 31(b)]. In Sindh, the respective proportion of establishments identifying need for improvement in first three aspects is 59.4 percent, 15.6 percent and 12.5 percent. In KP, 54 percent of establishments feel need for more practical training, which is followed by 19 percent indicating need for more theoretical training and another 11.5 percent mentioning training on modern equipment. In case of Balochistan, 50 percent of the 6 establishments indicate no particular area of priority for enhancing skill level of public TVET graduates, with around 17 percent each emphasizing on practical training, enhanced professional attitude and enhancement of soft skills (table 31).
65 | Food Processing Industry
Labour Market Intelligence Survey
Table 31 Required Enhancements to Improve Skill Level of Skilled Workers Trained by Public TVET Institutions
Employers’ Recommendation (in order of priority) for Public TVET Institutions
Total Practical Training
Training on Modern
Equipment
Enhance Professional
Attitude Theoretical
Training Enhance
Soft Skills Refresher Training
Not Top Priority
Punjab 51 27 7 2 5 6 - 98 (52) (27.6) (7.1) (2) (5.1) (6.1)
Sindh 19 5 4 1 2 1 - 32 (59.4) (15.6) (12.5) (3.1) (6.3) (3.1)
KP 28 6 4 10 1 - 3 52 (53.8) (11.5) (7.7) (19.2) 91.9) (5.7)
Balochistan 1 - 1 - 1 - 3 6 (16.7) (16.70 (16.7) (50)
Note: Figures in parenthesis are row percentages

The required improvements recommendations by 193 establishments with respect to graduates from private TVET institutions are given in table 31(a). The priority listing by di�erent suggested enhancements follows trends identified earlier for the public TVET qualified workers, with first preference to improvement in practical training (44 percent), followed by training on modern equipment (17.6 percent) and theoretical training (11 percent) [Figure 15 (a)]. The recommendations with respect to the province of Punjab follow national level trends, while those for the remaining three provinces diverge somewhat in terms of priority ranking. In Sindh, over 43 percent of the 30 establishments indicate practical training as top priority for enhancing skill level of private TVET institutions, with another 13.3 percent emphasizing on enhancement in professional attitude, while over 33 percent of establishments give no priority to any area for improvement. Coming to KP, it is seen that 45 percent of establishments feel the need for improvement in practical training, followed by 15.7 percent for more training on modern equipment and around 12 percent highlight need for improvement in professional attitude of the trainee workers. In Balochistan, over 33 percent (3) of the 9 establishments indicate improvement in practical training, with one establishment each (11 percent) pointing towards improvement required in theoretical training, enhanced professional attitude and refresher training, while the remaining 3 establishments do not indicate any priority area for improvement in skill level.
Labour Market Intelligence Survey
Food Processing Industry | 66
The analysis reveals that major challenge of Pakistan’s TVET system is practical training on modern equipment, which can only be made possible by providing su�cient resources. The modles existing in other countries, to generate the required resources, need to be reviewed for this purpose.
Table 31(a) Required Enhancement to Improve Skill Level of Skilled Worker Trained by Private TVET Institutions
Employers’ recommendation (in order of priority) for Private TVET institutions
Total Practical Training
Training on Modern
Equipment Theoretical
Training
Enhance Professio
nal Attitude
Enhance Soft Skills
Refresher
Training
Not Top Priority
Punjab 46 25 14 7 7 4 - 103 (44.7) (24.3) (13.6) (6.8) (6.8) (3.9)
Sindh 13 1 1 4 1 - 10 30 (43.3) (3.3) (3.3) (13.3) (3.3) (33.3)
KP 23 8 5 6 3 1 5 51 (45.1) (15.7) (9.8) (11.8) (5.9) (2.0) (9.8)
Balochistan 3 - 1 1 - 1 3 9 (33.3) (11.1) (11.1) (11.1) (33.3)
Note: Figures in parenthesis are row percentages
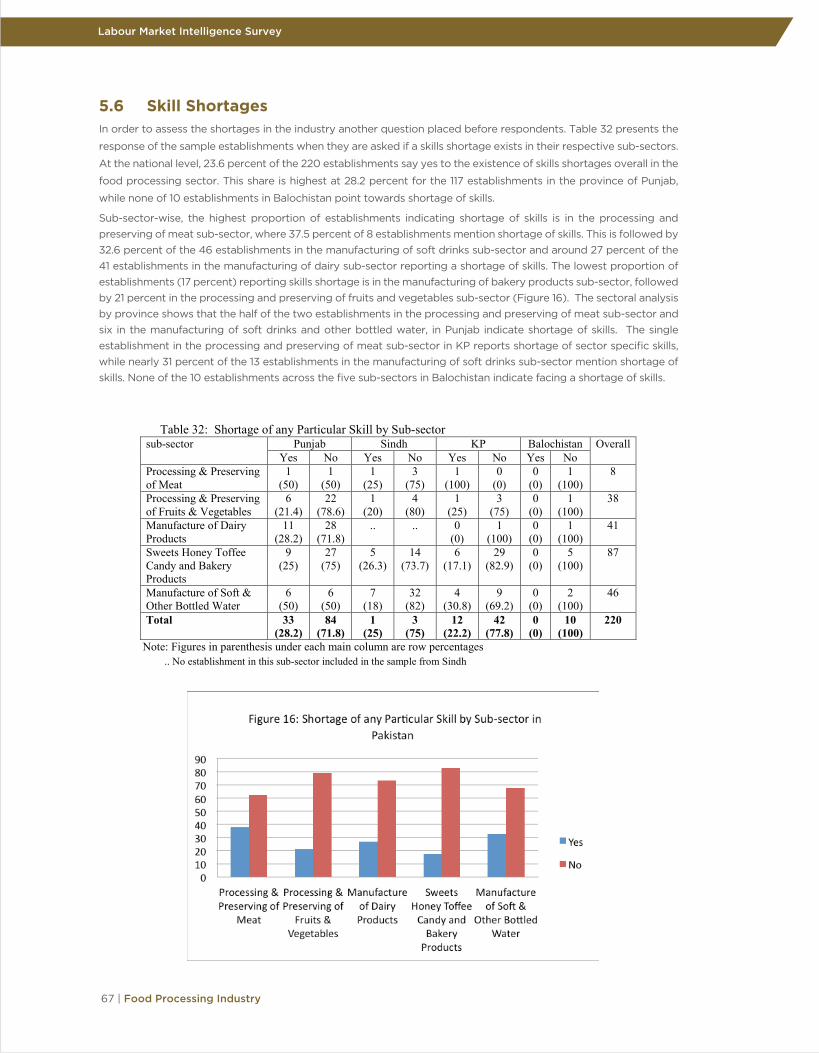
5.6 Skill ShortagesIn order to assess the shortages in the industry another question placed before respondents. Table 32 presents the
response of the sample establishments when they are asked if a skills shortage exists in their respective sub-sectors.
At the national level, 23.6 percent of the 220 establishments say yes to the existence of skills shortages overall in the
food processing sector. This share is highest at 28.2 percent for the 117 establishments in the province of Punjab,
while none of 10 establishments in Balochistan point towards shortage of skills.
Sub-sector-wise, the highest proportion of establishments indicating shortage of skills is in the processing and preserving of meat sub-sector, where 37.5 percent of 8 establishments mention shortage of skills. This is followed by 32.6 percent of the 46 establishments in the manufacturing of soft drinks sub-sector and around 27 percent of the 41 establishments in the manufacturing of dairy sub-sector reporting a shortage of skills. The lowest proportion of establishments (17 percent) reporting skills shortage is in the manufacturing of bakery products sub-sector, followed by 21 percent in the processing and preserving of fruits and vegetables sub-sector (Figure 16). The sectoral analysis by province shows that the half of the two establishments in the processing and preserving of meat sub-sector and six in the manufacturing of soft drinks and other bottled water, in Punjab indicate shortage of skills. The single establishment in the processing and preserving of meat sub-sector in KP reports shortage of sector specific skills, while nearly 31 percent of the 13 establishments in the manufacturing of soft drinks sub-sector mention shortage of skills. None of the 10 establishments across the five sub-sectors in Balochistan indicate facing a shortage of skills.
67 | Food Processing Industry
Labour Market Intelligence Survey
Table 32: Shortage of any Particular Skill by Sub-sector sub-sector Punjab Sindh KP Balochistan Overall
Yes No Yes No Yes No Yes No Processing & Preserving of Meat
1 (50)
1 (50)
1 (25)
3 (75)
1 (100)
0 (0)
0 (0)
1 (100)
8
Processing & Preserving of Fruits & Vegetables
6 (21.4)
22 (78.6)
1 (20)
4 (80)
1 (25)
3 (75)
0 (0)
1 (100)
38
Manufacture of Dairy Products
11 (28.2)
28 (71.8)
.. .. 0 (0)
1 (100)
0 (0)
1 (100)
41
Sweets Honey Toffee Candy and Bakery Products
9 (25)
27 (75)
5 (26.3)
14 (73.7)
6 (17.1)
29 (82.9)
0 (0)
5 (100)
87
Manufacture of Soft & Other Bottled Water
6 (50)
6 (50)
7 (18)
32 (82)
4 (30.8)
9 (69.2)
0 (0)
2 (100)
46
Total 33 (28.2)
84 (71.8)
1 (25)
3 (75)
12 (22.2)
42 (77.8)
0 (0)
10 (100)
220
Note: Figures in parenthesis under each main column are row percentages .. No establishment in this sub-sector included in the sample from Sindh

5.7 Management of Skill ShortagesWhen the sample establishments are enquired about ways to manage shortage of skilled/ semi-skilled workers, 48
percent (103) of the 214 establishments state that they o�er overtime to their existing workers (table 33). This is
followed by 21 percent reporting raising wages to o�set shortage of skilled workers, while 16.8 percent arrange
relevant on the job training for their existing employees. The provincial breakup shows that 68 percent of 117
establishments in Punjab o�er over time to existing workers, 12 percent arrange on job training, while 11 percent raise
wages to manage shortage of skilled workers.
In Sindh, the highest proportion of the 32 establishments (40.6 percent) arrange on job training, followed by another
25 percent o�ering over time, while 22 percent keep vacancies unfilled. In KP, 45 percent of 55 establishments resort
to raising wages, followed by another 21.8 percent o�ering over time and 20 percent keep vacancies unfilled. Half of
the 10 establishments in Balochistan raise wages, 30 percent o�er over time and 20 percent arrange on the job training
to cope with shortage of skilled workers.
Table 33(a) presents analysis of the establishments’ preferences for managing shortage of skilled/semi-skilled workers by
sub-sector. Data indicates that a large majority of the 42 establishments in the manufacturing of dairy products sub-sector
(69 percent) o�er over time to their existing workers to cope with the shortage of skilled workers, which is followed by 63
percent of the 38 establishments engaged in the processing and preserving of fruits and vegetables that resort to the
same method. In the processing and preserving of meat sub-sector, 38 percent of the 8 establishments followed by 29
percent of the 85 establishments in the manufacturing of bakery products sub-sector raise wages to retain their skilled
employees.
Labour Market Intelligence Survey
Food Processing Industry | 68
Table 33: Preference of the Employers to Manage the Shortage of Skilled/Semi skilled Workers
Offer Over Time
Rise Wage Arrange on Job Training
Keep Vacancies Unfilled
Total
Pakistan 103 47 36 28 214 (48.13) (21.96) (16.82) (13.08)
Punjab 80 13 14 10 117 (68.38) (11.11) (11.97) (8.55)
Sindh 8 4 13 7 32 (25) (12.5) (40.63) (21.88)
KP 12 25 7 11 55 (21.82) (45.45) (12.73) (20.00)
Balochistan 3 5 2 - 10 (30) (50) (20)
Note: Figures in parenthesis are row percentages
Table 33(a): Employers’ Preference to Manage Shortage of Skilled/Semi Skilled Workers, by Sub-sector Sub-sector Offer Over
Time Rise Wage On Job
Training Keep
Vacancies Unfilled
Not in Preference
Total
Processing & Preserving of Meat
2 (25)
3 (38)
2 (25)
1 (12)
- 8
Processing & Preserving of Fruits & Vegetables
24 (63)
4 (11)
6 (16)
4 (10)
- 38
Manufacture of Dairy Products
29 (69)
3 (7)
5 (12)
5 (12)
- 42
Sweets Honey Toffee Candy and Bakery Products
38 (45)
25 (29)
10 (12)
7 (8)
5 (6) 85
Manufacture of Soft & Other Bottled Water
10 (21)
12 (25)
13 (28)
11 (23)
1 (1) 47
Note: Figures in parenthesis are row percentages

On the job training is arranged by 28 percent of the 47 establishments involved in the manufacturing of soft drinks
and other bottled water, followed by 25 percent of the 8 establishments operating in the processing and preserving
of meat sub-sector. Open vacancies are kept unfilled by 23 percent of establishments engaged in manufacturing of
soft drinks and other bottled water, followed by 12 percent of establishments in the manufacturing of dairy products
sub-sector.
5.8 Future Expansion Plan of EstablishmentsThe response of the sample establishments when asked if their factory has any plans for expansion within the next two years is presented in table 34. At the overall level of the food processing sector, 77 (34.7 percent) of the 222 establishments indicate expansion plans over the next two years. The sectoral breakup shows that among these 77 establishments, the highest number of establishments having expansion plans is in the manufacturing of bakery products sub-sector at 34, representing 39 percent of the total establishments in this sub-sector. This is followed by 19 establishments engaged in manufacturing of soft drinks and 13 establishments involved in manufacturing of dairy products, accounting for 40 percent and 31 percent of all establishments in these sub-sectors, respectively.
The provincial disaggregation shows that the highest number of establishments planning expansion of their operations in the next two years is in the province of Punjab at 36, representing over 30 percent of the 118 establishments in the food processing sector in this province. In KP, 30 establishments representing 54.6 percent of the total establishments in the province indicate expansion plans. In the province of Sindh and Balochistan, 9 and 2 establishments have plans for expansion, accounting for 23 percent and 20 percent of the total establishments operating in these provinces, respectively.
69 | Food Processing Industry
Labour Market Intelligence Survey
Since the Food Processing sector is dominated by the private sector therefore adhocism is adopted in meeting skill shortages, i-e with overtime, raise wages etc. No mechanism exists to solve this issue permanently. On job training is being given less priority to meet the shortages. TVET policy should develop the mechanism to keep balance in demand and supply of skills.
Table 34: Factory Plan for Expansion within Next Two Years Sub-sectors Pakistan Punjab Sindh KP Balochistan
Yes No Yes No Yes No Yes No Yes No Processing & Preserving of Meat
3 (37.5)
5 (62.5)
0 (0.0)
2 (100.0)
2 (50.0)
2 (50.0)
0 (0.0)
1 (100.0)
1 (100)
0 (0.0)
Processing & Preserving of Fruit & Vegetables
8 (21.1)
30 (79.0)
5 (17.9)
23 (82.1)
1 (20.0)
4 (80.0)
2 (50.0)
2 (50.0)
0 (0.0)
1 (100)
Manufacturing of Dairy Products
13 (31.0)
29 (69.1)
12 (30.0)
28 (70.0)
.. .. 1 (100)
0 (0.0)
0 (0.0)
1 (100)
Manufacturing of Bakery Products
34 (39.1)
53 (60.9)
14 (38.9)
22 (61.1)
2 (18.2)
9 (81.8)
18 (51.4)
17 (48.6)
0 (0.0)
5 (100)
Manufacturing of Soft Drinks & Other Bottled Water
19 (40.4)
28 (59.6)
5 (41.7)
7 (58.3)
4 (21.1)
15 (79.0)
9 (64.3)
5 (35.7)
1 (50.0)
1 (50)
Food Processing 77 (34.7)
145 (65.3)
36 (30.5)
82 (69.5)
9 (23.1)
30 (76.9)
30 (54.6)
25 (45.5)
2 (20.0)
8 (80.0)
Note: Figures in parenthesis under each main column are row percentages .. No establishment included in the sample from Sindh

The sectoral breakup by province shows that in Punjab, the greatest number of factories with expansion plans is in the manufacturing of bakery products and manufacturing of dairy products sub-sectors at 14 and 12, constituting 39 percent and 30 percent of all establishments operating in these sub-sectors, respectively. In KP, the majority of factories intending to expand are in the manufacturing of bakery products sub-sector at 18, followed by 9 establishments engaged in the manufacturing soft drinks and other bottled water. In Sindh, 4 establishments involved in manufacturing of soft drinks indicate plans for expansion, followed by 2 establishments each in the processing and preserving of meat and manufacturing of bakery products sub-sectors. In Balochistan, the sole establishment engaged in processing and preserving of meat and one of the two establishments operating in the manufacturing of soft drinks and other bottled water sub-sector indicate plans for expansion over the next two years.
5.9 Future Skill RequirementsTable 35 gives estimates of additional employment, under di�erent categories, required by the sample establishments that have plans for expansion over the next two years expressed as percentage of total employment as of December 2013 (reported in table 20). This additional employment in numbers is shown in table 36. For the overall food processing sector, the sample establishments indicate highest requirement for skilled workers at 2.8 percent of the existing skilled employment, while additional requirement of semi-skilled and administrative & general workers comes out at 0.5 percent and 0.6 percent of total employment in these categories. Province-wise, establishments in KP show highest need for additional workers under all three categories (5.1 percent for skilled workers, 1.5 percent of semi-skilled workers and 1.8 percent for administrative & general workers).
In terms of numbers, over 46 percent (20) of additional administrative workers are required by establishments in Punjab, 32.6 percent in KP (14), while the remaining 5 percent (2) are required in Balochistan (table 36). Half of the additional skilled workers are needed in Punjab at 41, 39 percent in KP (28), 8 percent (6) in Sindh, with the remaining 2 (2.8 percent) required by establishments in Balochistan. In case of semi-skilled workers, 41 (48.8 percent) of the additional employees are required in Punjab, 32 (38 percent) in KP, 9 (10.7 percent) in Sindh, while the remaining 2 (2.4 percent) would be required by establishments in Balochistan.
The disaggregation of additional workers by sub-sector shows that at the national level, requirement of additional workers is highest in the manufacturing of bakery products sub-sector (5.6 percent), followed by the processing & preserving of meat and fruits & vegetables sub-sectors (3.9 percent and 3.2 percent, respectively). The break-up by number indicates that over 37 percent (16) of the 43 more administrative and general workers are required by establishments involved in manufacturing of bakery products, followed by 11 (25.6 percent) in the manufacturing of soft drinks and other bottled water and 8 (18.6 percent) in manufacturing of dairy products, while only 3 additional workers are needed by establishments engaged in processing and preserving of meat. Under the skilled category, 29 additional workers’ (40.3 percent) need is indicated by establishments operating in the manufacturing of bakery products sub-sector, 18 (25 percent) by establishments involved in manufacturing of soft drinks and other bottled water and 16 (22.2 percent) in manufacturing of dairy products sub-sector. Over four-tenths (36) of the additional 84 semi-skilled workers are required in the manufacturing of bakery products sub-sector, followed by 19 (22.6 percent) in manufacturing of soft drinks, 17 (20.2 percent) in manufacturing of dairy products, while only 4 additional workers are needed by establishments engaged in processing and preserving of meat.
The sectoral analysis at the provincial level indicates that a large share of additional workers, under all three categories in Punjab is required by establishments operating in the sub-sectors of manufacturing of dairy products and manufacturing of bakery products. In Sindh, most of the additional workers under all categories are needed in the manufacturing of soft drinks, manufacturing of bakery products and processing and preserving of meat sub-sectors. In KP, half of the additional administrative workers, 57 percent of skilled workers and over 59 percent of semi-skilled workers are required by establishments engaged in manufacturing of dairy products. This is followed by 5 additional administrative workers (35.7 percent), 9 skilled (32 percent) as well as semi-skilled workers (28 percent) needed in the manufacturing of soft drinks sub-sector. In case of Balochistan, the 2 additional workers required under all three categories are evenly split across establishments involved in processing and preserving of meat and manufacturing of soft drinks and other bottled water.
Labour Market Intelligence Survey
Food Processing Industry | 70
The analysis reveals that only 35 percent of establishments in the Food Processing sector have future expansion plans. This is dominated by establishments in Punjab and KP working in the manufacturing of bakery and dairy products sub sectors.

71 | Food Processing Industry
Labour Market Intelligence Survey
Tabl
e 35
: Add
ition
al E
mpl
oym
ent R
equi
red
for E
xpan
sion
of F
acto
ry O
ver N
ext T
wo
Yea
rs (%
of T
otal
Em
ploy
men
t) Su
b-se
ctor
s
Paki
stan
Pu
njab
Si
ndh
KP
Balo
chis
tan
Adm
in &
G
ener
al
Skill
ed
Sem
i-sk
illed
Ad
min
&
Gen
eral
Sk
illed
Se
mi-
skill
ed
Adm
in &
G
ener
al
Skill
ed
Sem
i-sk
illed
Ad
min
&
Gen
eral
Sk
illed
Se
mi-
skill
ed
Adm
in &
G
ener
al
Skill
ed
Sem
i-sk
illed
Pr
oces
sing
& P
rese
rvin
g of
M
eat
1.15
3.
85
0.48
-
- -
0.96
2.
33
0.43
-
- 2.
44
16.6
7 50
.00
12.5
0
Proc
essin
g &
Pre
serv
ing
of
Frui
t & V
eget
able
s 0.
34
3.15
0.
54
0.17
3.
45
0.46
0.
34
0.98
0.
35
9.52
20
0.0
2.30
-
- -
Man
ufac
turin
g of
Dai
ry
Prod
ucts
0.
58
2.89
0.
34
0.58
2.
72
0.32
-
- -
0.00
-
10.0
0 -
- -
Man
ufac
turin
g of
Bak
ery
Prod
ucts
0.
97
5.62
0.
75
0.61
14
.29
0.70
2.
44
0.49
0.
25
3.30
9.
36
1.49
-
- -
Man
ufac
turin
g o
f Soft
Dr
inks
& O
ther
Bott
led
Wat
er
0.52
1.
49
0.38
0.
22
0.65
0.
12
1.89
6.
52
3.77
0.
96
2.37
1.
17
1.03
6.
25
1.03
Food
Pro
cess
ing
0.63
2.
82
0.49
0.
39
2.36
0.
33
1.01
1.
52
0.54
1.
84
5.08
1.
47
0.62
2.
50
0.28
Ta
ble
36: A
dditi
onal
Em
ploy
men
t Req
uire
d fo
r Exp
ansi
on o
f Fac
tory
Ove
r Nex
t Tw
o Y
ears
Su
b-se
ctor
s
Paki
stan
Pu
njab
Si
ndh
KP
Balo
chis
tan
Adm
in &
G
ener
al
Skill
ed
Sem
i-sk
illed
Ad
min
&
Gen
eral
Sk
illed
Se
mi-
skill
ed
Adm
in &
G
ener
al
Skill
ed
Sem
i-sk
illed
Ad
min
&
Gen
eral
Sk
illed
Se
mi-
skill
ed
Adm
in &
G
ener
al
Skill
ed
Sem
i-sk
illed
Pr
oces
sing
& P
rese
rvin
g of
M
eat
3 2
4 -
- -
2 1
2 -
- 1
1 1
1
(7)
(2.8
) (4
.8)
- -
- (2
8.6)
(1
6.7)
(2
2.2)
-
- (3
.1)
(50)
(5
0)
(50)
Pr
oces
sing
& P
rese
rvin
g of
Fr
uit &
Veg
etab
les
5 7
8 2
4 5
1 1
1 2
2 2
- -
-
(11.
6)
(9.7
) (9
.5)
(10)
(1
1.1)
(1
2.2)
(1
4.3)
(1
6.7)
(1
1.1)
(1
4.3)
(7
.1)
(6.3
) -
- -
Man
ufac
turin
g of
Dai
ry
Prod
ucts
8
16
17
8 15
16
1
1 -
- -
(18.
6)
(22.
2)
(20.
2)
(40)
(4
1.7)
(3
9)
- -
- -
(3.6
) (3
.1)
- -
- M
anuf
actu
ring
of B
aker
y Pr
oduc
ts
16
29
36
7 12
15
2
1 2
7 16
19
-
- -
(37.
2)
(40.
3)
(42.
9)
(35)
(3
3.3)
(3
6.6)
(2
8.6)
(1
6.7)
(2
2.2)
(5
0)
(57.
1)
(59.
4)
- -
- M
anuf
actu
ring
of S
oft
Drin
ks &
Oth
er B
ottle
d W
ater
11
18
19
3 5
5 2
3 4
5 9
9 1
1 1
(25.
6)
(25)
(2
2.6)
(1
5)
(13.
9)
(12.
2)
(28.
6)
(50)
(4
4.4)
(3
5.7)
(3
2.1)
(2
8.1)
(5
0)
(50)
(5
0)
Food
Pro
cess
ing
43
72
84
20
36
41
7 6
9 14
28
32
2
2 2
Not
e: F
igur
es in
par
enth
esis
und
er e
ach
mai
n co
lum
n ar
e co
lum
n pe
rcen
tage
s

Labour Market Intelligence Survey
Food Processing Industry | 72
Tabl
e 37
: Add
ition
al E
mpl
oyee
s R
equi
red
Ann
ually
for
Est
ablis
hmen
ts w
ith n
o Ex
pans
ion
Plan
s (%
of
Tota
l Em
ploy
men
t) Su
b-se
ctor
s
Paki
stan
Pu
njab
Si
ndh
KP
Balo
chis
tan
Adm
in &
Ge
nera
l Sk
illed
Se
mi-
skill
ed
Adm
in &
Ge
nera
l Sk
illed
Se
mi-
skill
ed
Adm
in &
Ge
nera
l Sk
illed
Se
mi-
skill
ed
Adm
in &
Ge
nera
l Sk
illed
Se
mi-
skill
ed
Adm
in &
Ge
nera
l Sk
illed
Se
mi-
skill
ed
Proc
essin
g &
Pre
serv
ing
of
Mea
t 0.
77
- 0.
48
2.33
-
0.64
-
- 0.
21
25.0
0 -
2.44
16
.67
- -
Proc
essin
g &
Pre
serv
ing
of
Frui
t & V
eget
able
s 0.
34
1.80
1.
42
0.17
1.
72
1.66
0.
34
0.98
0.
35
4.76
-
1.15
-
33.3
3 3.
70
Man
ufac
turin
g of
Dai
ry
Prod
ucts
0.
72
1.81
0.
40
0.65
1.
63
0.38
-
- -
0.00
-
- 25
.00
100.
00
20.0
0
Man
ufac
turin
g of
Bak
ery
Prod
ucts
0.
78
2.71
0.
58
0.17
3.
57
0.60
-
- 0.
12
2.83
3.
51
0.71
2.
39
8.62
0.
85
Man
ufac
turin
g o
f Soft
Dr
inks
& O
ther
Bott
led
Wat
er
0.52
0.
91
0.38
0.
36
0.65
0.
17
1.89
4.
35
7.55
0.
58
0.79
0.
39
1.03
6.
25
1.03
Food
Pro
cess
ing
0.60
1.
53
0.54
0.
37
1.25
0.
47
0.43
0.
76
0.66
1.
45
1.63
0.
64
2.49
10
.00
1.11
Ta
ble
38: A
dditi
onal
Em
ploy
ees R
equi
red
Ann
ually
for E
stab
lishm
ents
with
no
Expa
nsio
n Pl
ans
Sub-
sect
ors
Paki
stan
Pu
njab
Si
ndh
KP
Balo
chist
an
Adm
in &
Ge
nera
l Sk
illed
Se
mi-
skill
ed
Adm
in &
Ge
nera
l Sk
illed
Se
mi-
skill
ed
Adm
in &
Ge
nera
l Sk
illed
Se
mi-
skill
ed
Adm
in &
Ge
nera
l Sk
illed
Se
mi-
skill
ed
Adm
in &
Ge
nera
l Sk
illed
Se
mi-
skill
ed
Proc
essin
g &
Pre
serv
ing
of
Mea
t 2
(4.8
8)
- 4
(4.3
5 1
(5.2
6)
- 2
(3.3
9)
- -
1 (9
.09)
1
(9.0
9)
- 1
(7.1
4)
1 (1
2.50
) -
-
Pr
oces
sing
& P
rese
rvin
g of
Fru
it &
Veg
etab
les
5 (1
2.20
) 4
(10.
26)
21
(22.
83)
2 (1
0.53
) 2
(10.
53)
18
(30.
51)
1 (3
3.33
) 1
(33.
33)
1 (9
.09)
1
(9.0
9)
- 1
(7.1
4)
- 1
(12.
50)
1 (1
2.50
)
Man
ufac
turin
g of
Dai
ry
Prod
ucts
10
(2
4.39
) 10
(2
5.64
) 20
(2
1.74
) 9
(47.
37
9 (4
7.37
) 19
(3
2.20
) -
- -
-
- 1
(12.
50)
1 (1
2.50
) 1
(12.
50)
M
anuf
actu
ring
of B
aker
y Pr
oduc
ts
13
(31.
71)
14
(35.
60)
28
(30.
43)
2 (1
0.53
) 3
(15.
79)
13
(22.
03)
- -
1 (9
.09)
6
(54.
55)
6 (6
6.67
) 9
(64.
29)
5 (6
2.50
5
(62.
50)
5 (6
2.50
)
Man
ufac
turin
g o
f Soft
Drin
ks &
O
ther
Bott
led
Wat
er
11
(26.
83)
11
(28.
21)
19
(20.
65)
5 (2
6.32
) 5
(26.
32)
7 (1
1.86
) 2
(66.
67)
2 (6
6.67
) 8
(72.
73)
3 (2
7.27
) 3
(33.
33)
3 (2
1.43
) 1
(12.
50)
1 (1
2.50
) 1
(12.
50)
Fo
od P
roce
ssin
g 41
39
92
19
19
59
3
3 11
11
9
14
8 8
8
Not
e: F
igur
es in
par
enth
esis
und
er e
ach
mai
n co
lum
n ar
e co
lum
n pe
rcen
tage
s

Information on the additional employees required annually to meet production by establishments that have no plans for expansion is presented in table 37 (as percentage of total employment) and table 38 (in numbers), across the three employee categories by sub-sector. Overall, the annual incremental workers required by the sample establishments in the food processing sub-sector cones to 0.6 percent for administrative & general workers, 1.5 percent for skilled workers and 0.5 percent for semi-skilled workers. The provincial breakup shows that annual requirement for additional skilled workers is highest in Balochistan at 10 percent of total employment and lowest in Sindh (0.8 percent). In case of administrative workers and semi-skilled workers, the requirement for additional workers is highest in Balochistan at 2.5 percent and 1.1 percent of the total employment in these categories in the province.
In absolute numbers, 41 additional administrative and general workers, 39 skilled workers and 92 semi-skilled workers are required annually by establishments that have no expansion plans. The provincial break down shows that 19 each of the additional administrative (45 percent) and skilled workers (48.7 percent) and 59 (64 percent) of the additional semi-skilled workers would be required by establishments in Punjab. Close to 27 percent (11) of additional administrative workers, 23 percent of skilled workers (11) and 15 percent (14) of the additional semi-skilled are required in KP. Around 20 percent each of the administrative and skilled workers and 8.7 percent of the additional semi-skilled workers are needed by establishments in Balochistan.
The sub-sectoral breakup shows that 13 out of the 41 additional administrative and skilled workers are required by establishment engaged in manufacturing of bakery products, 11 (26.8 percent) by those working in the manufacturing of soft drinks and other bottled water, while 10 (24.4 percent) are needed in the manufacturing of dairy products sub-sector. Similarly, the majority of the 39 additional skilled workers are needed annually by establishments involved engaged in manufacturing of bakery products, followed by manufacturing of soft drinks and other bottled water and manufacturing of dairy products. The distribution of additional semi-skilled workers is concentrated across the manufacturing of bakery products (30.4 percent), processing and preserving of fruits and vegetables (22.8 percent) and manufacturing of dairy products (21.7 percent).
The sub-sectoral analysis by province reveals that the highest proportion of establishments in Punjab indicating need for additional administrative, skilled and semi-skilled workers are working in the manufacturing of dairy products sub-sector, followed by manufacturing of soft drinks sub-sector in case of administrative and skilled workers and processing and preserving of fruits sub-sector for semi-skilled workers. Across KP and Balochistan, the majority of the need for additional workers under all three categories annually is indicated by establishments involved in manufacturing of bakery products, followed by those operating in the manufacturing of soft drinks and other bottled water sub-sector. In Sindh, close to 67 percent of all additional administrative and skilled workers and 73 percent of semi-skilled workers are required by establishments engaged in the manufacturing of soft drinks and other bottled water.
73 | Food Processing Industry
Labour Market Intelligence Survey
Total

6. Conclusion & Main FindingsThe analysis in this report was based on data from a sample of 222 establishments in the food processing sector across Pakistan. Province-wise, the sample comprised of 118 establishments (53 percent) from Punjab, 39 from Sindh (18 percent), 59 from KP (24 percent) and 10 from Balochistan (4 percent). Sector-wise, the largest share of these establishments (39.2 percent) were involved in production of sweets, to�ee candy and bakery products, followed by manufacturers of soft and other bottled water (21.2 percent), manufacturers of dairy products (18.9 percent), processing and preserving fruits and vegetables (17 percent) and those engaged in processing and preserving of meat.
The total employment in these 222 establishments as of December 2013 was 26,562, with the majority of employees (64.5 percent) falling under the semi-skilled workers category at 17,131, followed by administrative and general workers at 6,880 (26 percent) while skilled workers accounted for close to 10 percent of total employment (2,551). Amongst the skilled and semi-skilled workers, around 47 percent were employed on regular basis, a third on temporary basis, while the remaining 19 percent were employed on contract basis. Within the five sub-sectors of food processing, almost 31 percent of skilled/semi-skilled employees were engaged in manufacturing of soft drinks and other bottled water, while 30 percent were involved in manufacturing of dairy products, 28 percent in manufacturing of bakery products, around 9 percent in preserving and processing of fruits and remaining 2 percent in processing of meat. Around 8 percent of all skilled/ semi-skilled employees were women as on December 2013, with a higher share of female skilled/semi-skilled employees (around 16 percent) employed in manufacturing of bakery products.
The analysis of the hiring practices of these establishments with respect to the skilled and semi-skilled workers showed that the highest proportion of establishments gave first preference to personal contacts (over 36 percent), followed by hiring through references (32 percent), through advertisement (15 percent) and using website (11 percent) for recruiting workers. A majority of establishments involved in processing & preserving of meat and processing and preserving of fruits & vegetables sub-sectors indicate personal contact as their first preferred method of hiring skilled workers (over 62 percent & 60 percent, respectively).
In terms of selection of skilled/ semi-skilled workers from di�erent sources of supply, the highest proportion of establishments report first preference in selecting workers trained through the informal ustadi-shagirdi/ family trade mechanism (over 31 percent), followed by workers trained from public TVET institutions (24 percent) and those trained in establishment on the job (close to 18 percent). For setting wages of skilled/ semi-skilled workers, the highest share of the sample establishments accord first priority in setting them on basis of actual skill, next comes following market trend, while only close to 6 percent of all establishments’ accord first preference to TEVT education as a basis for determining wages of skilled workers.
Overall, over 88 percent of 188 establishments indicated satisfaction with the skills standard of their existing skilled/ semi-skilled workers. The highest share of establishments satisfied by the existing skills standard were in the processing and preserving of fruits and vegetables sub-sector at (nearly 92 percent), while the lowest proportion belonged to establishments engaged in manufacturing of dairy products (83 percent).Province-wise, this share was highest in Balochistan (100 percent), followed by Sindh, (over 91 percent), Punjab (90 percent) and KP at 81 percent.
When asked to indicate their level of satisfaction with existing skilled/ semi-skilled workers, the highest propor-tion of sample establishments reported satisfaction level greater than 60 percent with workers trained through the informal ustadi-shagirdi system (46 percent). This was followed by workers trained on the job (42 percent) and those trained from public TVET institutions (nearly 42 percent).
The top priority of establishments with respect to required improvement from both public and private TVET institutions was in the areas of practical training and training on modern equipment. Overall, 23.6 percent of the 220 establishments in the food processing sector reported existence of skills shortages overall, with this share being highest at 28.2 percent for the 117 establishments in the province of Punjab, while none of 10 estab-lishments in Balochistan point towards shortage of skills
Overall, 77 (34.7 percent) of the 222 establishments indicated expansion plans over the next two years, with the highest number being in the manufacturing of bakery products sub-sector at 34, followed by 19 establishments engaged in manufacturing of soft drinks and 13 establishments in manufacturing of dairy products. These establish-ments indicated additional requirement of 43 administrative and general workers, 72 skilled workers and 84 semi-skilled workers. The breakup of additional employment under the skilled/ semi-skilled categories by sub-sector showed that, 29 and 36 additional skilled and semi-skilled workers are required by establishments operating in the manufacturing of bakery products sub-sector, 18 and 19 workers by establishments involved in manufacturing of soft drinks and other bottled water and 16 and 17 by establishments in manufacturing of dairy products sub-sector, respectively. Establishments with no expansion plans indicated requirement of 41 additional administrative and general workers, 39 skilled workers and 92 semi-skilled workers annually to meet their production requirements.
Labour Market Intelligence Survey
Food Processing Industry | 74

7. Case Studies (Lahore)7.1 Shezan International Ltd.Incorporated in 1964 as private limited company, Shezan International started business as a joint venture with Alliance Industrial Development Corporation, USA for processing of citrus and fruits and bottling. In 1971, Shahnawaz Group purchased all shares of Alliance Industrial. In 1981, new units were installed in Karachi to cater the needs for Sindh as well as to produce exportable surplus. Bottle filling plant installed in Lahore in 1983, and Tetra Brick packing plant commissioned in 1987 o�ered the company an edge over the competitors. The company is engaged in production of juices, beverages, pickles, preserves and flavoring derived from fresh fruits and vegetables. The company won 1994 Top Companies Award of the Karachi Stock Exchange.
The company claims to be the largest processor of fresh fruits and vegetables in the country. The HR practices in the company, particularly in respect of technical employees, is that they hire technical workers on temporary basis, and based on their loyalty, experience, behavior, interest in the company, they take the best from the temporary daily wagers into contract employees. Once the employees prove their worth through hard work and growth in skill set, they are o�ered higher jobs. This was informed by the Assistant Manager incharge of three manufacturing units who is supervising 16 permanent and 110 temporary (20 semiskilled and 90 unskilled) employees. Shezan functions throughout the year, though in the months of December and January, due to reduced demand of beverages, the operations are reduced accordingly. The company works in two shifts mode (of 8+2 hours) and overtime is o�ered to the employees for additional 2 hours daily. The company hires only limited female HR (one quality control expert and an accountant). The temporary employees are o�ered minimum wage as set by the government, both for the unskilled as well as semi-skilled workers. The practice is that only permanent employees have growth path in their company while the promotion is strictly based on performance. The Assistant Manager was of the view that only a few employees (almost 8 from the 28 semi-skilled) are self-motivated, while they resort to strict supervision for the remaining (20 semi-skilled employees). The company launched tea whitener in collaboration and as joint venture with a dairy milk product concern. The Assistant Manager informed that the company does not have any permanent arrangement of training its sta�, neither at the time of recruitment or during the employment. The only method of training is ‘on the job’ training for the employees. Those from the lower ranks, show interest and enable them to take the responsibility, are promoted. The Assistant Manager Production was satisfied (at a rank of 8 on a 1-10 scale) from the performance of his team. He was of the view that there is need to give theoretical training to those who have some skills while the qualified engineers need to trained on practical aspects of the production process. He confirmed that despite advertising in the newspaper, they were not able to attract appropriately skilled and experienced skilled employees. And from this event, he had firm belief that there is lack of appropriately skilled manpower in the market.
With regard to the suggestion about making some training arrangement, he was of the view that it is upto the top management to take a decision in this regard. However, he was cognizant of the fact that motivational training sessions for the workers on the job, shall be useful in multiplying the productivity of the company employees. He suggested that the Government need to take steps for organizing soft skills training in the employees in all industrial concerns, be it in the form of providing training facility on the job, or making some arrangement with some other training institution. This is in conformity with the survey findings (table 19) wherein majority of establishments, who have some sort of in house training, prefer to do it on the job.
7.2 TrippleEm Pvt. Limited, PakistanEstablished in 1982, TrippleEm (Pvt.) Ltd. is the pioneer company in manufacturing crisps and snacks in Pakistan. In 1986, the company introduced "Super Crisp" which proved to be a success and recorded high sales. In 2007, TrippleEm introduced a new range of product “Chetty Chins” that captured sizable market share
TrippleEm is one of the premier snack food manufacturers in Pakistan with millions of regular customers. Quality control of the products TrippleEmviz ‘Super Crisp’ ‘Chetty Chins’ etc.is maintained by using carefully selected prime quality raw materials processed by the latest fully automatic American, European and Japanese combination of Technologies, under strict quality controls, conforming to the highest international standards. The products are packed in a specially laminated high barrier film suitable for tropical climates to preserve the taste and reach its customer oven-fresh. TrippleEm has a wide range of distribution system spread all over the country in rural and urban areas. TrippleEm strives for quality instead of profit.
TrippleEm employs more than 400 employees, of which some 142 work as administrative and general workers, 10 as skilled
75 | Food Processing Industry
Labour Market Intelligence Survey
and 256 as semi-skilled. Most of the employees (192 of total 408) are hired on temporary basis (as daily wagers), 125 on contract the remaining 91 as regular employees. Total number of employees had increased by 120 percent in December 2013 since its inception in 1985. TrippleEm uses customized HR software for management of the employed human resource in the company. The ERP based system is used for all HR operations. The company is involved in automated operations. It hires technically skilled employees on regular basis from the market. The Production Manager was of the view that skilled operational manpower is available in the market, however, the level of satisfaction from such skilled workers was not upto the required level. Due to lack of practical skill development in the Pakistani TEVT institutions, appropriately skilled workforce having required level of experience is not readily available in the market.
Since demand for some of the products of TrippleEm like nuts reduces in summer season (May – August), therefore the company resorts to laying o� the temporary employees for that period. The factory manager was of the view that they prefer employees trained from public sector as they tend to stay longer with them compared to the graduates from private sector, as they mostly belong to rich families, have little value for salary and tend to leave the company. The learning environment in school as well as at home does not that encourage the average students to work hard and with dedication. Demand in Pakistan is such that laborers prefer to work within the same district, and labor movement is not high. Only a few employees come from outside the Lahore district in their factory. The company o�ers internships to the students, however, do not have any training facility within the organization. The GM highlighted that lack of self-motivated employees is the main problem in Pakistan in all industries. This aspect on self-motivation of the workers was not covered in the survey questionnaire.
The GM talked about lack of quality training facilities and informed that their company also does not have any permanent arrangement of training its sta�, neither do they have any arrangement with some other training institution. TrippleEm o�ers ‘on the job’ training to its employees, as per their requirements.
With reference to TVET institutions, the GM was of the view that there is little training equipment in the private sector training organizations, and whatever they have, is locally manufactured while the industrialists prefer to import foreign fabricated machinery. Therefore, the pupils trained on local machines, are not well conversant on the imported machinery. This aspect of skill development on imported machinery was not covered in the survey. However, table 28 shows that only 6 percent of establishments consider TEVT as a basis of fixing wage.
Similarly, the state of discipline in the TVET institutions is not such that the students could prepare themselves for professional requirements of the sector. They suggested employing high tech machinery for training the students, so that the trained workforce enters the industry with confidence. Similarly, the tutors at TEVTA institutions are not rightly qualified for the job assigned to them.
The gap identified during the discussion was that the engineers qualified from universities hardly have practical knowledge while the diploma holders and workers have little theoretical knowledge. There is need to mix theoretical and practical aspects, both at all levels of technical education and training. However, this in contrast to the survey’s finding with respect of satisfaction level of employers with the level of skills, as table 29 shows that around 88 percent establishments are satisfied with the training and skill level of their existing work force. The overall feeling during the focus group discussion was that there is shortage of appropriately skilled workforce, and that the qualified workers seldom have the required practical skill set. It was also pointed out the lack of soft skills like lack of initiative and other professional qualities are must for improving productivity.
Labour Market Intelligence Survey
Food Processing Industry | 76

8.Case Studies (Karachi)8.1 Meat Processing Sub-sector8.1.1 Al Shaheer CorporationAl Shaheer Corporation is amongst the meat exporters of Pakistan, specializing in exporting ‘free range grass fed’ animals’ beef and mutton to the Middle East. The Corporation started its business in 2008. In 2010, the Corporation started franchise retail business of beef and meat in three main cities – Karachi, Lahore and Islamabad.
The production process starts with selection of healthy animals from across the country,which are then slaughtered at the company’s abattoir. Large pieces of meat are stored in specially designed cases. The meat carcasses are transported in specially designed refrigerated vans from the plant to the airport and subsequently delivered to the overseas clients via air freight. The abattoir is ISO 9001:2008 and HACCP certified and complies with international quality control requirements and food safety standards. The plant can process 80 tons of beef and mutton per day. Al Shaheer Corporation won the Best Export Performance Award 2009-10 and Best Export Performance Award 2010-11 in the category of fresh and frozen meat from the Federation of Pakistan Chamber of Commerce and Industry. The Corporation was awarded Safe Food 2009 award by United Registrar of Systems Pakistan, for quality and hygiene of its products and systems.
Mr. Zohaib Hussain, Assistant Manager (AM) HR informed that most of the processing is handled on an automated plant run and maintained by 8 semi-skilled and 2 skilled employees, who were hired in 2008 for installation of the plant and they are with the organization since then. In addition, there are a few mechanics whose job is maintenance of the air-conditioned vehicles of the company. All these skilled and semi-skilled workers are trained and experienced. They were hired from the market based on their skill set. The AM HR informed that the skilled workers trained the semi-skilled workers ‘on the job’. He informed that there was only one female employee in production side, who is responsible for quality control. He was not aware of any expansion plan of the organization.
In the Corporation, salary of the workers is set based on the acquired skill set, while lower weight is assigned to qualification and experience. This is in conformity with the survey findings, as reflected in table 28, where responses reveal that the highest proportion of establishments at the national level, fix wages on the basis of the actual skill they want to retain. AM HR informed that the Corporation does not hire employees based on mere reference, with no priority is assigned to such employees while deciding about their salary. The AM HR was of the view that trained personnel are available for most of the skilled/ semi-skilled jobs in the food industry, and with little ‘on the job training’ workers can be equipped to work on the required machine or plant. This is because in Pakistan, hardly any industry uses high-tech machinery or plant that requires specialized training. Most of the industrialists employ low to medium –tech machinery or plant, which can be operated easily.
In response to the query regarding training of labour force in meat processing sub-sector, the AM HR stated that there is a training institute in Lahore, which o�ers training on meat processing. This institution is catering to the requirement of the meat industry at the moment. He opined that presence of such an institution in Karachi would help this industry flourish in Karachi as well. 8.1.2 Al Aien CorporationAl Aien Corporation is a medium sized mechanized meat processing company, which is in business since 2010. The company’s sta� purchases healthy animals from markets from all over the country. The purchased animals are brought to the company’s slaughter house at Gadab, where the processing plant is installed. After slaughtering, these animals are cleaned and cut into large pieces for exports. Cleaning and cutting is carried out on a mechanized plant in controlled environment as per the required food and health safety standards. The company exports all its produce to Saudi Arabia. Experts of the Saudi importer frequently visit the plant to ensure that the quality standards are maintained.
Mr. Shoaib Hameed, Manager Exports, who handles HR functions also, informed that at the time of start of business, initial sta� was hired based on reliable reference. The sta� hired at the time of start of business is still working in their positions. He informed that total strength of the company is around 200 persons, most of which are unskilled daily wagers. Around 5 semi-skilled workers, who were hired at the time of start of business, are responsible to run the semi-automatic plant. He was of the view that as far as their business is concerned, there is no shortage of required skilled/semi-skilled workers in Karachi.
He informed that currently the plant was running below its full capacity, meeting requirements of regular importers. The un-utilized capacity enables the company to handle the occasional larger orders as well. In case the company is not able
77 | Food Processing Industry
Labour Market Intelligence Survey

to meet the demand of the importers, they involve another sister concern namely Organic Meat Co. which is also in the same business and follows the required standard. The Export Manager was not aware of any expansion plan in the company. He was, moreover, convinced that there is no skill mismatch. He mentioned that the only problem the company faces is the availability of space in the flight for timely export of their product. He informed that for the purpose of exporting, they pack their product in specially designed thermo-pore iced containers to maintain required temperature for the duration of flight.
8.2 Soft Drinks and Bottled Water Sub-sector8.2.1 Habib Consumer Products (Pvt) Ltd.Habib Consumer Products (Pvt.) Ltd. is part of the Habib Group of Industries of Pakistan. Habib Consumer Products (pvt) Ltd, produces bottled water trademarked as ‘Habib Aqua Vida’. The water is purified using Reverse Osmosis technology. Habib Aqua Vida has online testing at every stage of processing in order to ensure quality of water. HCP is an ISO 22000, Food Safety Management System (FSMS) and HACCP certified company.
Mr. Muhammad Hayat, GM Finance of HCP informed that the unit employs around 20 workers, of which 5 are skilled workers, including 2 diploma holders, 1 skilled worker trained by the diploma holders, and three semi-skilled helpers. The prime responsibility of this skilled workforce is to ensure that the plant is in operation and that the quality of water is maintained as per the required standards. The workforce was shifted from another sister concern of Habib Group, and they were trained on the job. He was of the view that the management of the Company prefers to hire those workers who come with a good reference. However, while fixing the salary of the workers, they prefer the skills and training over any certificate. This result is in conformity with the survey findings (table 28) stating that actual skill acquired is most valued in determining the salary or wages of skilled workers Reference matters little in setting the salary or wage of the workers.
He informed that in order to ensure that customers receive the required attention, the company serves them six days a week with the help of trained customers service agents. The company has developed Customer Relationship Management software and a call centre to meet the needs of Aqua Vida customers. The call centre sta� is also trained to take prompt action on orders, handle enquiries and service customers' needs in a friendly manner.
Mr. Hayat was of the view that there is need to inculcate a culture of internship in the regular education institutions’ curricula. Normally, the qualified graduates from Pakistani institutions prefer working as white/blue collar employees, while there are not enough positions in the industries sector for such work. It would be better to make internship a part of curriculum so that the graduates are mentally prepared to handle manual work. He o�ered that their company can also provide internship opportunities if the management is approached at appropriate level.
Mr. Hayat informed that the management of the company is planning to expand and they are preparing estimates for installing a small plastic industrial unit, for which they would be requiring around 6-7 additional skilled/semi-skilled workers. This workforce is already available with the sister concerns in the Habib Group.
Mr. Hayat suggested focusing on practical training aspects during various TVET studies program. He suggested making some law or framing rules under which each industrial unit should be bound to o�er internship to graduate and master students. He was of the opinion that no degree should be awarded without practical experience of a few months.
8.3 Dairy Sub-sector8.3.1 Bu�elds Agriculture Products (Pvt) Ltd.Bu�elds is a dairy processing unit that started commercial operations in January 2014 with 100 employees, of which 20 were skilled, 70 semi-skilled and 10 unskilled. It has witnessed high growth since inception, growing ten times each year for almost five years. Compared to the level of business last year, to the tune of around Rs. 100 million, the company plans to grow to Rs. 5 billion per annum in five years’ time. It is expected that the organization would require around 200 additional skilled workers in their unit in next five years.
Dr. Syed Ibrar Hussain, Executive Director manages the HR function of the company. He has previously served in Engro Foods and Nestle Pakistan in senior positions, where he introduced the culture of hiring qualified HR and investing on human resource. He was of the view that dairy industry requires highly skilled workforce due to the nature of the product they handle and the sensitivity of the processes involved in production of dairy products. He informed that he decided to join a relatively nascent medium size organization due to the huge growth potential it has. He has hired qualified engineers in the industry, and prefers to hire fresh graduates so that they can be trained according to the needs of the industry. He prefers local graduates while hiring who can become role model for the local community, and promote the culture of education and development in smaller cities and towns. He acknowledged that there is a need to link university education with the industry.
Labour Market Intelligence Survey
Food Processing Industry | 78

He informed that presently Pakistan’s organized dairy industry, led by Nestle, Engro Foods, Haleeb, Shakarganj Foods, Nurpur, Halla, Gourmet, Nirala, Adam, Cottage etc. has annual turnover of around Rs. 80-90 billion. The industry uses raw milk input of around 1.3 billion liters.
tin the industry, and prefers to hire fresh graduates so that they can be trained according to the needs of the industry. He prefers local graduates while hiring who can become role model for the local community, and promote the culture of education and development in smaller cities and towns. He acknowledged that there is a need to link university education with the industry.
He informed that presently Pakistan’s organized dairy industry, led by Nestle, Engro Foods, Haleeb, Shakarganj Foods, Nurpur, Halla, Gourmet, Nirala, Adam, Cottage etc. has annual turnover of around Rs. 80-90 billion. The industry uses raw milk input of around 1.3 billion liters annually (just 4% of the total annual milk produce of the country of around 34 billion liters). Therefore, there is huge potential of growth in this industry. In Pakistan more than 65 percent of milk is consumed at source or converted into indigenous products like desi ghee, khoa etc. Milk consumption in urban areas is around 7 billion liters, mostly unprocessed. It is expected that by 2020, there will be a need of around 5-6 billion liters of processed milk annually, so it is necessary to increase processing facilities and equipment by 4-5 times in the dairy industry. This would require huge capital investment and increased demand of skilled human resource (of around 75 thousand by year 2020).
To cater to this need of additional human resource, he proposed developing a system with a Public-Private education partnership to deliver skilled human resource and meet the needs of dairy industry for future. This proposed model is to be based on the following principles:
1. Self sustaining through the sales of goods manufactured at the pilot plant
2. Meeting skilled human resource needs of expanding dairy industry
3. Minimizes the gap between University and Industry
He suggested that any education institution can join a long term PPP dairy HR development model which promotes theoretical and practical aspects of dairy processing at undergraduate and graduate level. He o�ered his help in establishing a pilot plant using public/university funds for processing liquid milk and milk products at the premises of the interested university. The plant would be capable of pasteurizing around one thousand liters of milk daily and will be equipped with ancillary facilities (like bottle filler, bottle washer, cup filler, line control lab equipment, cold storage, chiller van etc.). The university will be responsible to provide utilities (water, electricity, gas etc), space for setting up pilot plant and the required constructed area. The initial operating capital can be provided by the Government, while running cost of the plant will be recovered from sale of manufactured goods.
Bu�elds can develop and deliver 1-4 months certificate/diploma courses. Students from various departments (Chemical Technology, Chemistry, Microbiology and Biotechnology) shall be provided practical training on the plant. The students would be selected through a transparent defined process. The plant can also o�er research facilities to post graduate students for developing new dairy products. The plant will be operated on commercial basis so that it can also serve as a practical model for dairy business development students. The profit earned from the plant operations can be utilized on financing students’ education on merit, with Bu�elds also sharing in it.
The pilot plant will provide quality application technology training to dairy science, dairy engineering and dairy business management graduates with science or engineering education background mainly in the field of dairy and food processing. The plant will o�er training and education facilities in the following areas relating to dairy and food processing industry:
1. Fluid Dynamics in Food Processing
2. Thermodynamics in Food Processing
3. Machinery & Equipment in Food Processing
4. Utilities in Food Processing
5. Industrial methods of Food preservation
6. Food Spoilage, Toxicity and poisoning
7. Food Additives, Labeling and Laws
8. Health and Quality Standards Certifications in Food Industries
9. Nutrition & Food Processing
10. Industrial Economic & Management
11. Food value Chain Management A-Z
79 | Food Processing Industry
Labour Market Intelligence Survey

12. Packaging in Food Industry
13. Food Product Marketing
14. Brand management in Food Industry
15. Finance & Costing in Food Industry
16. HR & Industrial Relationship in Food Industry
17. Business Strategy in Food Industry
18. Business Development in Food Industry
19. Competitive Intelligence in Food
20. Food Service Management
21. Sales & Distribution of Food Products
22. Logistics and Cold Chain in Food Industry
23. Research, Innovation and Development in Food Industry
24. Private labels, Contract Manufacturing, Acquisition & Mergers
25. Utilization of dairy industry waste
26. Research Project based on problems of food industries
Dr. Ibrar shared that Bu�elds actively promotes the culture of HR training and product development on the lines of the above model. He said that Bu�elds, despite being a medium sized industrial unit of around Rs 100 million, has allocated 10 percent of its budget for training of sta�. He was of the view that there is need to introduce internship or practical training courses for the teachers in universities and specialized colleges, which will help improve the quality and skill level of the graduates. The low quality of graduates of private and public TVET institutions is reflected in the low preference given to hiring of skilled workers as documented in tables 30 and 30a. He informed that he has helped SMEDA in developing investment models in date processing and mango value chain. He introduced portable processor in mango value chain. He suggested using media and other sources to interact with the investors in order to convince them that any investment in human resource development would pay them back and that such investments on HR development are in the interest of the producer and investors.
8.3.2 Taam FoodsTaam Foods is a small food industrial unit, which produces plain and recipe spices, synthetic vinegar, pickle, nimko, vermicelli, and mineral water, etc. The semi-automatic plant is run by 3 skilled operators who are assisted by 15 semi-skilled laborers. Mr. Altaf Hussain, Plant Manager of Taam Foods, is micro-biologist by training. He runs the mineral water plant which is based on Reverse Osmosis technology, with the help of a foreman and an electrician.
Mr. Altaf informed that the management believes in hiring additional workers based on a ‘good reference’, and in case they are unable to find a good worker having a reliable reference, they would like to go for advertisement. Their organization hired fresh graduates on the water purification plant, and since such fresh graduates need training, they benefited from the services of Pakistan Council for Scientific and Industrial Research (PCSIR) to get their fresh workers trained on the reverse osmosis water purification plant. He appreciated benefit of such government initiatives that o�er technical support to the industry.
Mr. Altaf was critical of the existing system of education at all levels. He said that despite increase in the salary of teachers in last few years, the sense of responsibility of the teachers has not improved and the quality of education is almost at the same level. He also referred to university education and suggesting improving/revising the curriculum according to modern day needs. He said that in universities, some of the teachers still follow decades old syllabus, which cannot prepare the students meet the present day needs of the industry. He suggested introducing compulsory internship for college degrees, for which government should initiate government-industry /government-private sector partnership. He referred to the courses of CA and MBBS which have compulsory internship component, and such courses prepare their graduates to adjust and o�er services as per the need of the customers. He suggested e�ective monitoring of the teachers performance to ensure better results.
Labour Market Intelligence Survey
Food Processing Industry | 80

Main Findings of Case Studies 1. There was some divergence between the information obtained through the survey questionnaire and that
gathered through the case studies for selected establishments. The reported number of skilled employees was higher in the questionnaire as compared to the number actually employed for the establishments visited for case study in Karachi.
2. The detailed discussions with the management of di�erent establishments held for the case studies pointed towards the need for developing linkages between TVET institutions/ universities and industry to promote design of more demand driven training programs/ curricula. The concerned provincial technical vocational training and education authorities (TEVTAs) need to play a pivotal role in this regard.
3. The discussions highlighted the need to promote teacher training through attachment and collaboration with industry. It was also suggested that students of TVET institutions should not be given degrees unless they have mandatory attachment with industry to get practical working experience. In this regard, Dr Syed Ibrar Hussain of Bu�elds Agriculture Products Ltd in Karachi outlined a detailed model, which is presented in the case study. Such models should be experimented to acquaint students with the practical knowledge of various aspects of business and industry.
4. The interactions with the concerned stakeholders, including industry and related government departments highlighted need for awareness-raising about the importance and benefits of research for better planning and policy making.
5. The interaction with the selected industry revealed that they are willing to o�er internship opportunities for fresh graduates in relevant fields. There is need to devise an agreed mechanism in order to benefit from such opportunities for the benefit of employer as well as potential employees.
9. RecommendationsThe labour market intelligence survey of food processing sector has helped a great deal in enhancing the understanding on labour market trends, skill profiles, skill shortages and training needs based on the preferences of the employers. Findings of the survey lead to the following policy recommendations for future reform of the TVET sector:1. The findings indicate that a small proportion of employers prefer TEVT education in terms of determining wages
of skilled workers. Similarly, there is large potential of growth, investment and employment in fruit & vegetables processing and meat processing sub-sectors. There is large employment potential for appropriately trained female workers in these sub-sectors. These findings highlight the need for developing an appropriate labour market information system to enable TEVT institutions to properly assess the skills set required by the industry.
2. Whereas an overwhelming majority of the employers expressed their satisfaction with the skills standard of the existing skilled/semi-skilled workers, they emphasized on focusing more on practical aspects of training in the TEVT training programs. The curriculum as well as training methodology of the TEVT institutions needs to be revamped in close collaboration with the industry in order to make TVET more demand driven.
3. There is need for developing linkages between TVET institutions and industry for promoting teacher training. The industry is willing to o�er internship opportunities for fresh TEVT graduates in relevant fields provided an agreed regulatory mechanism is devised. There is need to devise policy for mandatory attach-ment of students with relevant industry before awarding certificates. One option can be fully functional small industrial units established or a�liated with the professional and TEVT education institutions.
4. There is aneed to establish an employer forum to work without government interference to assess the short-ages / surpluses within the each industrial sector on regular basis and to develop linkages with technical education authority to guide in revamp the training courses base on new production technological changes in production techniques.
In addition to the above recommendations with respect to skill development and TVET reform, the follow-ing recommendations pertain to improvements in the design and coverage of labour intelligence surveys to be carried out in the future;
1. Information on some financial performance indicators from the sample establishments, such as their turnover or investment on skill development can provide greater insights into the scale of operation of di�erent firms and their preference for HRD. Such information will also help in designing specific awareness-raising about benefits of investing on HRD for better planning and policy making.
2. Experience plays a very important role in determining the quality of skills acquired as well as the remuneration paid to skilled workers. In order to assess skill gaps, work experience of the skilled/ semi-skilled workers needs to be analyzed. Gathering information on these aspects may be made integral part of intelligence surveys. Better designed information gathering tools should be employed in obtaining accurate and comprehensive information, which will lead to better analysis of the labour market situation.
81 | Food Processing Industry
Labour Market Intelligence Survey

Appendices
Labour Market Intelligence Survey
Food Processing Industry | 82

83 | Food Processing Industry
Labour Market Intelligence Survey
Appendix 1
Questionnaire - Labour Market Intelligence Survey
Food Processing Code: ______
A- Establishment Profile EP
EP1. Name of Enumerator & Code NAME……………………………………………….
CODE……………………………………………….
DISTRICT (PLACE OF DUTY)………………………..
PROVINCE………………………………………….
SIGNATURE ………………………………………...
EP1a. Name of Respondent/Designation NAME……………………………………………….
DESIGNATION……………………………………….
CONTACT LINE # (OFFICIAL)................................
CELL #...............................................................
EMAIL……………………………………………….
EP1b. Date of Interview DAY………..MONTH…………….YEAR………. 2014
EP2. Name of Establishment NAME: ___________________________________
EP2a. Location of Establishment ADDRESS:___________________________________
TEHSIL/TALUKA_______________________________
DISTRICT____________________________________
PROVINCE___________________________________
PHONE: ___________________________________
EP3. Location of Head Office
ADDRESS:___________________________________
DISTRICT:___________________________________
PROVINCE__________________________________
PHONE: ___________________________________
WEBSITE:___________________________________
EMAIL: _____________________________________

Labour Market Intelligence Survey
Food Processing Industry | 84
EP4 .Principal Product & Code PRODUCT:---------------------- CODE: ----------------------
PRODUCT:---------------------- CODE: ----------------------
PRODUCT:---------------------- CODE: ----------------------
PRODUCT:---------------------- CODE: ----------------------
PRODUCT:---------------------- CODE: ----------------------
EP5 By Product (If any) PRODUCT:---------------------- CODE: ----------------------
PRODUCT:---------------------- CODE: ----------------------
PRODUCT:---------------------- CODE: ----------------------
PRODUCT:---------------------- CODE: ----------------------
PRODUCT:---------------------- CODE: ----------------------
EP6 Working Status SEASONAL:……………………………………..…….…. 1
ALL TIME:…………………………………………..….… 2
EP7.Type of Establishment NATIONAL:…………………………………………….…. 1
MULTINATIONAL….………………………………….……2
EP8. Year of Establishment YEAR ________________________________
EP9. Corporate status of Establishment PUBLIC LTD (REGISTERED WITH STOCK EXCHANGE) …. 1
PRIVATE LTD: …………………………………………. 2
SOLE PROPRIETORSHIP................................................3
EP10. How many shifts are running in Establishment (8 hours per shift)
NUMBER: ……………………… …………………………………. …
EP11. Registration status of Establishment
SECURITY EXCHANGE COMMISSION OF PAKISTAN............A PROVINCIAL GOVT. DEPARTMENT……………….….........B TRADE ASSOCIATION………...........................................C INDUSTRIAL ESTATE…….…..........................................D REGISTERED WITH MUNICIPALITY……………..….…….E OTHER (SPECIFY) ___________________________ F

85 | Food Processing Industry
Labour Market Intelligence Survey
B. Employees Details DP
DP1.Number of employees by Skill “As on 31st December, 2013.”
[in numbers]
ADMINISTRATIVE & GENERAL WORKERS……...A
SKILLED WORKER .........................................B
SEMI-SKILLED WORKER.................................C
DP2 Number of employees by status “As on 31st December, 2013”
[in numbers]
REGULAR IN. ……….………….…..…………A
TEMPORARY IN……………………...…………B
ON CONTRACT IN ....…………………………..C
DP3 Number of employees by skill at the “Time of Start” of the production? [in numbers]
[Year: ……………………………….]
ADMINISTRATIVE &GENERALWORKERS..…...A
SKILLED WORKER ….................................... B
SEMI-SKILLED WORKER.................................C
DP4 Number of employees by status at the “Time of Start” of production? [in numbers]
[Year :-----------------------------------]
REGULAR IN …………………….…………A
TEMPORARY IN..……….…….…….………...B
ON CONTRACT IN ...………………..………..C
DP5 Number of Total Skilled/Semi-Skilled employees by gender ( excluding admin. and general workers)
[in numbers]
MALE : .……………………………..………. 1
FEMALE .. ……………………….…………..2
DP6 Number of total skilled/semi-skilled workersby gender qualified from Public Training organization
MALE : ……….……………………….……. 1
FEMALE ………….……..……………..……2
DP7 Number of total skilled/semi-skilled workers by gender qualified from Private Training organization
MALE : .……………………………….……. 1
FEMALE . ……………………………………2
“USTADI – SHAGIRDI”........A MALE #......1
FEMALE #...2
FAMILY TRADE....................B
MALE #......1
FEMALE #...2
ON JOB TRAINING BY ESTABLISHMENT…………..C
MALE #......1
FEMALE #...2
APPRENTICESHIP IN COMPLIANCE OF LAW ...........E
MALE #......1
FEMALE #...2
ANY OTHER (SPECIFY) …...X MALE #......1
FEMALE #...2
DP8. Number of skilled/semi-skilled workers having no formal TVET but skilled through other sources.
[in numbers]

Labour Market Intelligence Survey
Food Processing Industry | 86
DP9. Does factory has any plan for expansionwithin next two years?
YES:……………………..…………. 1
NO :….……………………….……. 2 DP11
DP10. If yes how much change is expected in number of employees? [in numbers]
Increase or Decrease
ADMINISTRATIVE & GENERAL WORKERS …....A
SKILLED WORKER. ...................................B
SEMI-SKILLED WORKER...............................C
DP11.If no how much additional employees are required annually to meet the production?
[in numbers]
ADMINISTRATIVE & GENERAL WORKERS …..A
SKILLED WORKER…....................................B
SEMI-SKILLED WORKER...............................C
DP12. How do you recruit the skilled / Semi-skilled worker?
[Give priority order carefully]
THROUGH ADVERTISEMENT………………...A
THROUGH PERSONAL CONTACT …………....B
THROUGH REFERENCES………. ………..…C
THROUGH ADVERTISEMENT……………...…D
OTHERS SPECIFY……………………………X
DP13 How much Priority being given in selection of Skilled/Semi-Skilled workers from various source of supply?
Rate from 01 to 07 (i.e. 01 for top & 07 for lower)
TVET FROM PUBLIC INSTITUTIONS…………....A
TVET FROM PRIVATE INSTITUTIONS……......…B
TRAINED IN ESTABLISHMENT THROUGH APPRENTICESHIP ...................................... ...C
TRAINED IN ESTABLISHMENT THROUGH
ON JOB .…………………………………...…..D
TRAINED THROUGH INFORMAL / USTADI-SHAGIRDI / FAMILY TRADE………....….E
GENERAL EDUCATIONAL INSTITUTIONS INCLUDING UNIVERSITY ……………………..F
TRAINED FROM ANY OTHER SOURCE (PLEASE SPECIFY)___________________________ .X
DP14 What is the base of fixing wages of Skilled/Semi-Skilled workers?
Rate from 01 to 04(i.e. 01 for top & 04 for lower)
TVET EDUCATED……………………..………A
ACTUAL SKILL RETAIN ………………………...B
FOLLOW MARKET TREND……………………...C
OTHERS SPECIFY_____________________ X

87 | Food Processing Industry
Labour Market Intelligence Survey
Total
C. OVERVIEW OF TVET AND OTHER TRAINED WORKERS TT
TT1 Are you satisfied with standards of Skill of Skilled workers?
YES:…………………………………………. 1
NO :….………………………………………. 2
TT2 Please Indicate the level of satisfaction of skills?
Level 1:- More than 60% Level 2:- More than 40% but less than 60 Level 3:- Less than 40%
LEVELS*:-
PUBLIC TVET INSTITUTES …… A
PRIVATE TVET INSTITUTES …...B
USTADI-SHAGIRDI…….……....C
FAMILY TRADE ……………..…D
ON JOB ……………………….E
APPRENTICESHIP ……………..F
1 2 3
TT3 What kind of enhancement in Skill would be helpful to improve the skill?
[In priority order]
SOURCES PB PVT OTH
THEORETICAL TRAINING
PRACTICAL TRAINING
TRAINING ON MODERN EQUIPMENT
PROFESSIONAL ATTITUDE
REFRESHER TRAINING COURSES
SOFT SKILL
OTHERS
TT4 Is there shortage of any particular skill in this sector?
YES:…………………………………………. 1
NO :….………………………………………. 2 TT6
TT5 If yes, please indicates the trades /occupations?
[Increase extra rows if required)
TRADES /
OCCUPATIONS
JOB
DESCRIPTION
REQUIRED
QUALIFICATIONS
TT6 How do you manage the shortage of KEEP VACANCIES UNFILLED TILL AVAILABILITY....A
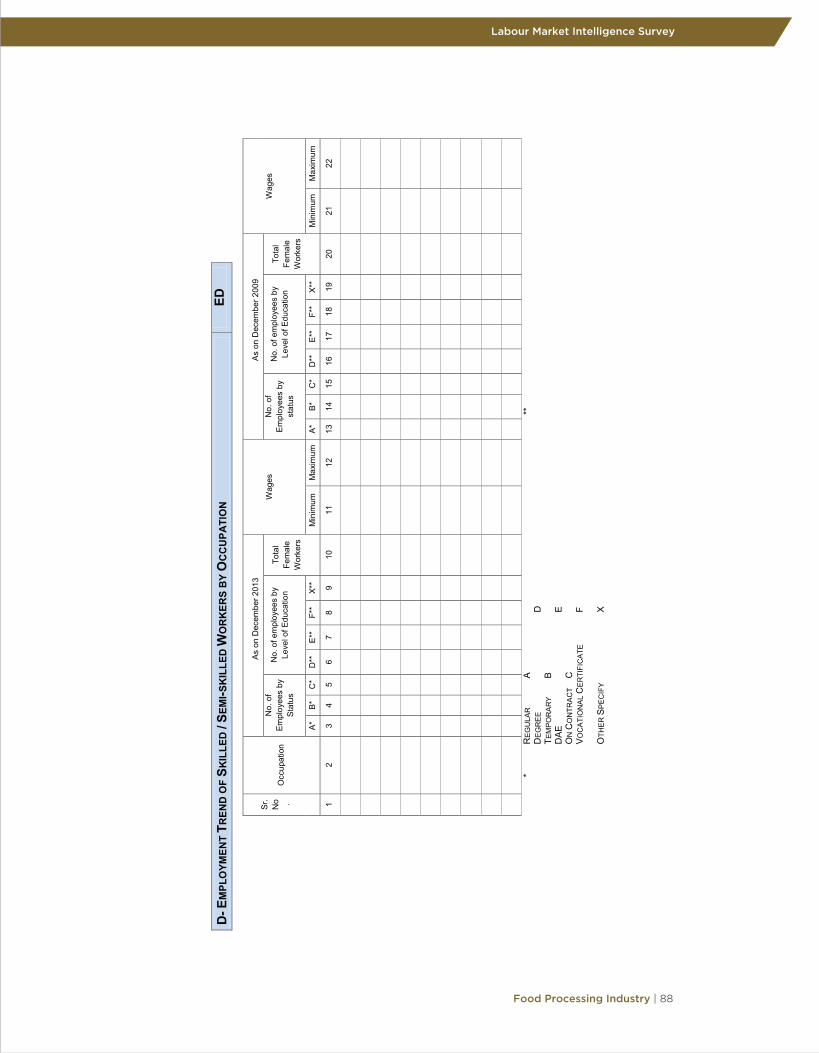
Labour Market Intelligence Survey
Food Processing Industry | 88
* R
EGU
LAR
A
**
D
EGR
EE
D
TE
MPO
RAR
Y B
DAE
E
ON
CO
NTR
ACT
C
VOC
ATIO
NAL
CER
TIFI
CAT
E F
OTH
ER S
PEC
IFY
X
D- E
MPL
OYM
ENT
T REN
D O
F S K
ILLE
D /
S EM
I- SK
ILLE
D W
OR
KER
S B
Y O
CC
UPA
TIO
N
ED
Sr.
No .
Occ
upat
ion
As o
n D
ecem
ber 2
013
Wag
es
As o
n D
ecem
ber 2
009
Wag
es
No.
of
Empl
oyee
s by
St
atus
No.
of e
mpl
oyee
s by
Le
vel o
f Edu
catio
n To
tal
Fem
ale
Wor
kers
No.
of
Empl
oyee
s by
st
atus
No.
of e
mpl
oyee
s by
Le
vel o
f Edu
catio
n To
tal
Fem
ale
Wor
kers
A*
B*
C*
D**
E*
* F*
* X*
* M
inim
um
Max
imum
A*
B*
C
* D
**
E**
F**
X**
Min
imum
M
axim
um
1 2
3 4
5 6
7 8
9 10
11
12
13
14
15
16
17
18
19
20
21
22

89 | Food Processing Industry
Labour Market Intelligence Survey
Total
Name of Establishment: ------------------------------------------------------------------
Address of establishment: ------------------------------------------------------------------
Contact Numbers: ------------------------------------------------------------------
Email Address: --------------------------------- Website: ------------------
Name of Respondent: ---------------------------------Contact #: ------------------
Sr. No Occupational Title Job Description (Brief) Required
Qualification (1) (2) (3) (4)
Instructions:
1. Please enter in Column-2 the TVET-related skilled occupational title exists in your Establishment such as Machine Operator, Plumber etc. The general occupational titles like Clerks, General Managers, Office Boy, and Sweeper etc. are not to include in this list. Only those occupational titles are to be listed which need TVET qualification or required experience worker irrespective of trained through informal means/Ustadi-Shagirdi.
2. Please give brief job description in Column-3, i.e. what is the duty or work assigned to worker in the establishment.
3. In Column-4 please give required qualification for each occupational title in the establishment.
4. Please extend as many rows as required to list all the occupations existing in your establishment.

Labour Market Intelligence Survey
Food Processing Industry | 90
App
endi
x 2
E
mpl
oyee
s by
Typ
e of
Ski
ll (g
row
th r
ates
)
Pa
kist
an
Punj
ab
Sind
h K
P B
aloc
hist
an
Sect
ors
Adm
in
&
gene
ral
wor
kers
Sk
illed
w
orke
r
Sem
i-sk
illed
w
orke
r
Adm
in&
ge
nera
l w
orke
rs
Skill
ed
wor
ker
Sem
i-sk
illed
w
orke
r
Adm
in&
ge
nera
l w
orke
rs
Skill
ed
wor
ker
Sem
i-sk
illed
w
orke
r
Adm
in&
ge
nera
l w
orke
rs
Skill
ed
wor
ker
Sem
i-sk
illed
w
orke
r
Adm
in&
ge
nera
l w
orke
rs
Skill
ed
wor
ker
Sem
i-sk
illed
w
orke
r Pr
oces
sing
&
Pres
ervi
ng o
f Mea
t 31
4.29
48
.57
124.
66
53.5
7 16
.67
14.1
8 59
3.33
53
.57
575.
36
100.
00
12
7.78
10
0.00
10
0.00
14
.29
Proc
essi
ng &
Pr
eser
ving
of F
ruit
& V
eget
able
s 11
5.67
98
.21
125.
19
86.9
9 22
2.22
10
6.86
44
0.00
47
.83
343.
75
133.
33
-80.
00
141.
67
25.0
0 50
.00
-20.
59
Man
ufac
turin
g of
D
airy
Pro
duct
s 10
8.75
34
.88
107.
60
108.
95
34.9
6 10
7.84
..
50.0
0
66.6
7 10
0.00
0.
00
25.0
0
Man
ufac
turin
g of
B
aker
y Pr
oduc
ts 14
0.99
61
.25
69.6
7 16
2.50
90
.91
110.
47
41.3
8 15
.34
13.1
7 59
.40
103.
57
45.2
1 26
6.67
26
2.50
15
8.15
Man
ufac
turin
g o
f So
ft D
rinks
& O
ther
B
ottle
d W
ater
14
9.88
11
3.43
13
6.89
15
0.82
70
.07
160.
81
73.7
7 64
.29
55.8
8 18
0.54
47
4.24
74
.15
115.
56
-23.
81
73.2
1
Tot
al F
ood
Proc
essi
ng
134.
09
76.7
8 10
4.23
12
2.72
61
.31
117.
86
239.
71
30.9
0 81
.86
129.
31
255.
48
58.1
7 18
9.19
95
.12
120.
43
.. N
o es
tabl
ishm
ent i
nclu
ded
in th
e sa
mpl
e fr
om S
indh

91 | Food Processing Industry
Labour Market Intelligence Survey
Total
App
endi
x 3
E
mpl
oym
ent T
rend
of S
kille
d/ S
emi-s
kille
d W
orke
rs, b
y Se
ctor
(gro
wth
rat
es)
Sect
or
Paki
stan
Pu
njab
Si
ndh
KP
Bal
ochi
stan
Reg
ular
Te
mpo
rary
O
n C
ontra
ct
Reg
ular
Te
mpo
rary
O
n C
ontra
ct
Reg
ular
Te
mpo
rary
O
n C
ontra
ct
Reg
ular
Te
mpo
rary
On
Reg
ular
Te
mpo
rary
O
n C
ontra
ct
Con
tract
Pr
oces
sing
&
Pres
ervi
ng o
f M
eat
18.0
1 2.
27
17
.45
50.0
0
0.00
10
0.00
-1
00.0
0
25.0
0
Proc
essi
ng &
Pr
eser
ving
of
Frui
t &V
eges
57
.65
53.0
5 7.
51
40.3
4 -1
6.42
6.
73
195.
83
2525
.00
50.0
0 50
00.0
0 37
.50
0.00
42
.86
5.26
Man
ufac
turin
g of
Dai
ry
Prod
ucts
55.1
7 20
5.57
-2
7.01
55
.59
205.
57
-27.
01
..
.. ..
0.00
-1
4.29
M
anuf
actu
ring
of B
aker
y Pr
oduc
ts 28
.38
22.3
2 7.
30
25.7
7 -1
.59
-10.
81
15.0
0 75
.00
36.9
6 40
.00
47.5
9 15
.38
44.1
9 19
.48
Man
ufac
turin
g
of S
oft D
rinks
&
Oth
er B
ottle
d W
ater
16
.99
-5.1
4 -3
4.58
18
.72
-15.
11
-40.
36
25.9
3 10
7.69
50
.00
4.74
46
.77
20.0
0 52
.70
Tota
l Foo
d Pr
oces
sing
32
.41
26.4
7 -1
2.32
33
.55
15.7
7 -2
0.80
25
.16
765.
52
37.2
3 21
.83
44.9
6 14
.67
44.4
4 18
.81
.. N
o es
tabl
ishm
ent i
nclu
ded
in th
e sa
mpl
e fr
om S
indh
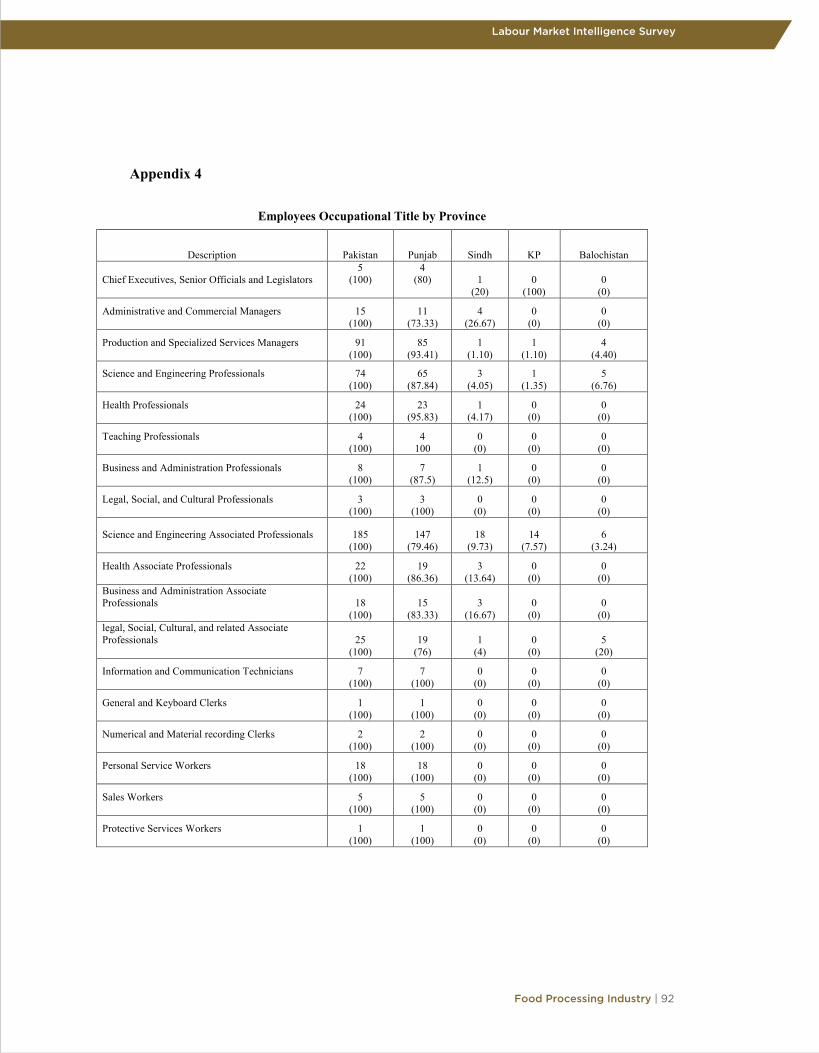
Labour Market Intelligence Survey
Food Processing Industry | 92
Appendix 4
Employees Occupational Title by Province
Description Pakistan Punjab Sindh KP Balochistan
Chief Executives, Senior Officials and Legislators
5 (100)
4 (80)
1
(20) 0
(100) 0
(0)
Administrative and Commercial Managers
15 (100)
11 (73.33)
4 (26.67)
0 (0)
0 (0)
Production and Specialized Services Managers
91 (100)
85 (93.41)
1 (1.10)
1 (1.10)
4 (4.40)
Science and Engineering Professionals
74 (100)
65 (87.84)
3 (4.05)
1 (1.35)
5 (6.76)
Health Professionals
24 (100)
23 (95.83)
1 (4.17)
0 (0)
0 (0)
Teaching Professionals
4 (100)
4 100
0 (0)
0 (0)
0 (0)
Business and Administration Professionals
8 (100)
7 (87.5)
1 (12.5)
0 (0)
0 (0)
Legal, Social, and Cultural Professionals
3 (100)
3 (100)
0 (0)
0 (0)
0 (0)
Science and Engineering Associated Professionals
185 (100)
147 (79.46)
18 (9.73)
14 (7.57)
6 (3.24)
Health Associate Professionals
22 (100)
19 (86.36)
3 (13.64)
0 (0)
0 (0)
Business and Administration Associate Professionals
18 (100)
15 (83.33)
3 (16.67)
0 (0)
0 (0)
legal, Social, Cultural, and related Associate Professionals
25 (100)
19 (76)
1 (4)
0 (0)
5 (20)
Information and Communication Technicians
7 (100)
7 (100)
0 (0)
0 (0)
0 (0)
General and Keyboard Clerks
1 (100)
1 (100)
0 (0)
0 (0)
0 (0)
Numerical and Material recording Clerks
2 (100)
2 (100)
0 (0)
0 (0)
0 (0)
Personal Service Workers
18 (100)
18 (100)
0 (0)
0 (0)
0 (0)
Sales Workers
5 (100)
5 (100)
0 (0)
0 (0)
0 (0)
Protective Services Workers
1 (100)
1 (100)
0 (0)
0 (0)
0 (0)

93 | Food Processing Industry
Labour Market Intelligence Survey
Total
Market-oriented Skilled Agricultural Workers
2 (100)
2 (100)
0 (0)
0 (0)
0 (0)
Building and related Trades Workers' excluding Electricians
16 (100)
8 (50)
7 (43.75)
1 (6.25)
0 (0)
Metal, Machinery and related Trades Workers
28 (100)
18 (64.29)
7 (25.00)
3 (10.71)
0 (0)
Handicraft and Printing Workers
1 (100)
1 (100)
0 (0)
0 (0)
0 (0)
Electrical and Electronic Trades Workers
1 (100)
1 (100)
0 (0)
0 (0)
0 (0)
Food Processing, Wood Worker, Garment and other Craft and related Trades Workers
24 (100)
20 (83.33)
1 (4.17)
1 (4.17)
2 (8.33)
Stationed Plant and Machine Operators
184 (100)
158 (85.87)
18 (9.78)
3 (1.63)
5 (2.72)
Assemblers
1 (100)
1 (100)
0 (0)
0 (0)
0 (0)
Drives and Mobile, Plant Operators
6 (100)
5 (83.33)
1 (16.67)
0 (0)
0 (0)
Cleaners and Helpers
45 (100)
43 (95.56)
2 (4.44)
0 (0)
0 (0)
Laborers in Mining, Construction, Manufacturing and Transport
29 (100)
24 (82.76)
4 (13.79)
1 (3.45)
0 (0)
Food Preparation Assistants
5 (100)
3 (60)
0 (0)
1 (20)
1 (20)
Street and related Sales and Service Workers
2 (100)
2 (100)
0 (0)
0 (0)
0 (0)
Total
918 (100)
729 (79.41)
88 (9.59)
73 (7.95)
28 (3.05)
Note: 1) Total 66 were reported missing, from which 7 are from Punjab, 12 and 47 are from Sindh and KP respectively. 2) Figures in parentheses are row percentages
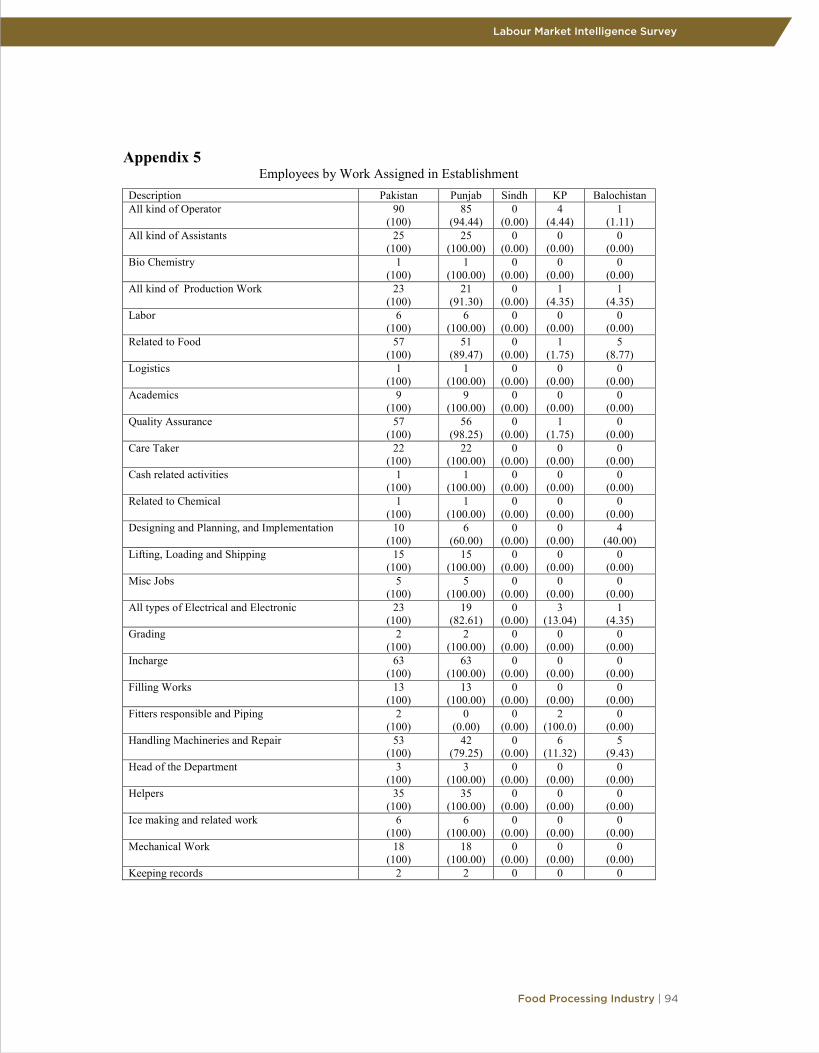
Labour Market Intelligence Survey
Food Processing Industry | 94
Appendix 5 Employees by Work Assigned in Establishment
Description Pakistan Punjab Sindh KP Balochistan All kind of Operator
90 (100)
85 (94.44)
0 (0.00)
4 (4.44)
1 (1.11)
All kind of Assistants
25 (100)
25 (100.00)
0 (0.00)
0 (0.00)
0 (0.00)
Bio Chemistry
1 (100)
1 (100.00)
0 (0.00)
0 (0.00)
0 (0.00)
All kind of Production Work
23 (100)
21 (91.30)
0 (0.00)
1 (4.35)
1 (4.35)
Labor
6 (100)
6 (100.00)
0 (0.00)
0 (0.00)
0 (0.00)
Related to Food
57 (100)
51 (89.47)
0 (0.00)
1 (1.75)
5 (8.77)
Logistics
1 (100)
1 (100.00)
0 (0.00)
0 (0.00)
0 (0.00)
Academics
9 (100)
9 (100.00)
0 (0.00)
0 (0.00)
0 (0.00)
Quality Assurance
57 (100)
56 (98.25)
0 (0.00)
1 (1.75)
0 (0.00)
Care Taker
22 (100)
22 (100.00)
0 (0.00)
0 (0.00)
0 (0.00)
Cash related activities
1 (100)
1 (100.00)
0 (0.00)
0 (0.00)
0 (0.00)
Related to Chemical
1 (100)
1 (100.00)
0 (0.00)
0 (0.00)
0 (0.00)
Designing and Planning, and Implementation
10 (100)
6 (60.00)
0 (0.00)
0 (0.00)
4 (40.00)
Lifting, Loading and Shipping
15 (100)
15 (100.00)
0 (0.00)
0 (0.00)
0 (0.00)
Misc Jobs
5 (100)
5 (100.00)
0 (0.00)
0 (0.00)
0 (0.00)
All types of Electrical and Electronic
23 (100)
19 (82.61)
0 (0.00)
3 (13.04)
1 (4.35)
Grading
2 (100)
2 (100.00)
0 (0.00)
0 (0.00)
0 (0.00)
Incharge
63 (100)
63 (100.00)
0 (0.00)
0 (0.00)
0 (0.00)
Filling Works
13 (100)
13 (100.00)
0 (0.00)
0 (0.00)
0 (0.00)
Fitters responsible and Piping
2 (100)
0 (0.00)
0 (0.00)
2 (100.0)
0 (0.00)
Handling Machineries and Repair
53 (100)
42 (79.25)
0 (0.00)
6 (11.32)
5 (9.43)
Head of the Department
3 (100)
3 (100.00)
0 (0.00)
0 (0.00)
0 (0.00)
Helpers
35 (100)
35 (100.00)
0 (0.00)
0 (0.00)
0 (0.00)
Ice making and related work
6 (100)
6 (100.00)
0 (0.00)
0 (0.00)
0 (0.00)
Mechanical Work
18 (100)
18 (100.00)
0 (0.00)
0 (0.00)
0 (0.00)
Keeping records 2 2 0 0 0

95 | Food Processing Industry
Labour Market Intelligence Survey
Total
Lab work
4 (100)
4 (100.00)
0 (0.00)
0 (0.00)
0 (0.00)
Law and order
1 (100)
1 (100.00)
0 (0.00)
0 (0.00)
0 (0.00)
Leading
1 (100)
1 (100.00)
0 (0.00)
0 (0.00)
0 (0.00)
Maintenance
39 (100)
39 (100.00)
0 (0.00)
0 (0.00)
0 (0.00)
Management and Administration Jobs
38 (100)
38 (100.00)
0 (0.00)
0 (0.00)
0 (0.00)
Marketing and Sales
11 (100)
10 (90.91)
0 (0.00)
0 (0.00)
1 (9.09)
Mining Jobs
1 (100)
1 (100.00)
0 (0.00)
0 (0.00)
0 (0.00)
Microbiologist
1 (100)
1 (100.00)
0 (0.00)
0 (0.00)
0 (0.00)
Mixing Jobs
8 (100)
8 (100.00)
0 (0.00)
0 (0.00)
0 (0.00)
Medicines and Chemists Works
3 (100)
3 (100.00)
0 (0.00)
0 (0.00)
0 (0.00)
Molding Jobs
3 (100)
3 (100.00)
0 (0.00)
0 (0.00)
0 (0.00)
Research and Development
6 (100)
6 (100.00)
0 (0.00)
0 (0.00)
0 (0.00)
Services
1 (100)
1 (100.00)
0 (0.00)
0 (0.00)
0 (0.00)
Sampling
1 (100)
1 (100.00)
0 (0.00)
0 (0.00)
0 (0.00)
Supply
1 (100)
1 (100.00)
0 (0.00)
0 (0.00)
0 (0.00)
Supervision
30 (100)
21 (70.00)
0 (0.00)
3 (10.00)
6 (20.00)
Plant Work
7 (100)
5 (71.43)
0 (0.00)
2 (28.57)
0 (0.00)
Packing and related Works
25 (100)
25 (100.00)
0 (0.00)
0 (0.00)
0 (0.00)
Responsibility
22 (100)
22 (100.00)
0 (0.00)
0 (0.00)
0 (0.00)
Repair and Maintenance
15 (100)
14 (93.33)
0 (0.00)
0 (0.00)
1 (6.67)
Testing of Items and related Work
5 (100)
2 (40.00)
0 (0.00)
0 (0.00)
3 (60.00)
Vocational Center
1 (100)
0 (0.00)
0 (0.00)
1 (100.0)
0 (0.00)
Washing Jobs
2 (100)
2 (100.00)
0 (0.00)
0 (0.00)
0 (0.00)
Water Jobs
1 (100)
1 (100.00)
0 (0.00)
0 (0.00)
0 (0.00)
Welding
4 (100)
2 (50.00)
0 (0.00)
2 (50.00)
0 (0.00)
Over Preparation
1 (100)
1 (100.00)
0 (0.00)
0 (0.00)
0 (0.00)
Total
918 (100)
729 (79.41)
88 (9.59)
73 (7.95)
28 (3.05)

Labour Market Intelligence Survey
Food Processing Industry | 96
Appendix 6 Employees by Required Qualification
Description Pakistan Punjab Sindh KP Balochist
an
0
4 (100)
4 (100)
0 (0)
0 (0)
0 (0)
Literate
1 (100)
1 (100)
0 (0)
0 (0)
0 (0)
Middle
12 (100)
12 (100)
0 (0)
0 (0)
0 (0)
Under matric
3 (100)
3 (100)
0 (0)
0 (0)
0 (0)
Matric
25 (100)
17 (68)
0 (0)
7 (28)
1 (4)
Certificate holders
26 (100)
19 (73.08)
0 (0)
0 (0)
7 (26.92)
Diploma
79 (100)
67 (84.81)
0 (0)
12 (15.19)
0 (0)
FA/FSc
6 (100)
5 (83.33)
0 (0)
0 (0)
1 (16.67)
BA/BSc/B.Com/DAE/Grad
280 (100)
256 (91.43)
0 (0)
5 (1.79)
19 (6.79)
DVM
1 (100)
1 (100)
0 (0)
0 (0)
0 (0)
MSc/MA/M.Com
94 (100)
94 (100)
0 (0)
0 (0)
0 (0)
PHD
12 (100)
12 (100)
0 (0)
0 (0)
0 (0)
Food technologists
11 (100)
11 (100)
0 (0)
0 (0)
0 (0)
Qualification And Exp
1 (100)
1 (100)
0 (0)
0 (0)
0 (0)
Experienced
73 (100)
73 (100)
0 (0)
0 (0)
0 (0)
Skilled And Experience
4 (100)
4 (100)
0 (0)
0 (0)
0 (0)
Skill
88 (100)
88 (100)
0 (0)
0 (0)
0 (0)
Trained
6 (100)
3 (50)
0 (0)
3 (50)
0 (0)
On Job Training
6 (100)
6 (100)
0 (0)
0 (0)
0 (0)

97 | Food Processing Industry
Labour Market Intelligence Survey
Total

Labour Market Intelligence Survey
Food Processing Industry | 98