Section IV.b Growth analysis - UMass...
17
Section IV.b Growth analysis Chap 11
Transcript of Section IV.b Growth analysis - UMass...

Section IV.b Growth analysis
Chap 11

Capital, Output, and Saving/Investment
Figure 11 - 1
Interactions between Output and Capital
2

Saving and capital accumulation
• Assumptions:
– Constant population, labor participation rate, and unemployment;
– No technical progress (for now).
3

• In equilibrium:
Assume that private saving is proportional to output
•Then investment is also proportional to output:
•𝐾𝑡+1 − 𝐾𝑡 = 𝐼𝑡 − 𝛿𝐾𝑡
𝐾𝑡+1 − 𝐾𝑡 = 𝑠𝑌𝑡 − 𝛿𝐾𝑡
In per worker terms:
I S
I sYt t
S sY
The Effects of Output on Capital Accumulation
Output and Investment
Investment and capital accumulation
denotes the rate of depreciation
K
N
K
Ns
Y
N
K
N
t t t t
1
(Using It=sYt)
4 of 39

• The two main relations are:
First relation: Capital determines output.
Y
Nf
K
N
t t
K
N
K
Ns
Y
N
K
N
t t t t
1
Second relation: Output determines capital accumulation
5
Change in capital stock
New investment
Depreciation
N
K
N
K tt 1
Change in capital from year t to year t + 1
N
K t_
Depreciation during year t
minus
N
Ksf t
=
Investment during year t
equals
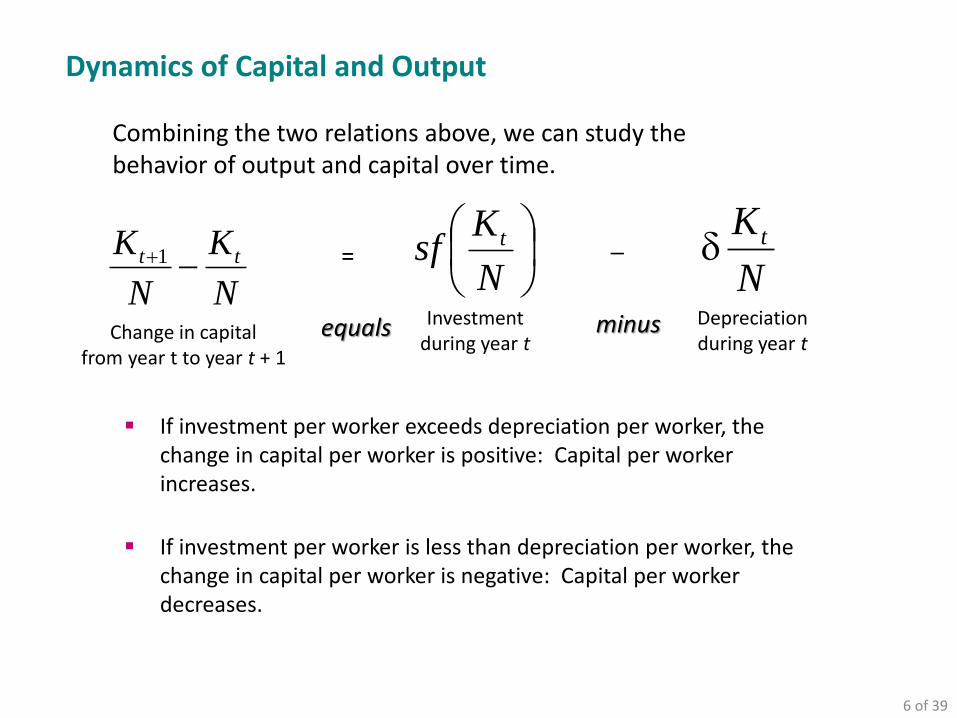
Dynamics of Capital and Output
If investment per worker exceeds depreciation per worker, the change in capital per worker is positive: Capital per worker increases.
If investment per worker is less than depreciation per worker, the change in capital per worker is negative: Capital per worker decreases.
6 of 39
Combining the two relations above, we can study the behavior of output and capital over time.

Dynamics of Capital and Output
At K*/N, output per worker and capital per worker remain constant at their long-run equilibrium levels.
At K0/N, capital per worker is low, investment exceeds depreciation, so, capital per worker
and output per worker increase over time.
Investment per worker increases with capital per worker, but by less and less as capital
per worker increases.
Depreciation per worker increases in proportion to capital per worker. 7

•The state of the economy where output per worker and capital per worker are no longer changing is called the steady state of the economy. In the steady state, the left side of the following equation equals zero:
* *K Ksf
N N
* *Y Kf
N N
Given the steady state of capital per worker (K*/N), the steady-state value of output per worker (Y*/N) is given by the production function:
K
N
K
N
K
N
t t t
1= sf
K
N
t
Steady-State Capital and Output
See graphical illustration on previous slide
8
Which yields:

•Three important observations about the effects of the saving rate on the growth rate of output per worker:
1. The saving rate has no effect on the long run growth rate of output per worker, which is equal to zero.
2. Nonetheless, the saving rate determines the level of output per worker in the long run.
3. An increase in the saving rate will lead to faster growth of output per worker but for some time. In the long-run (steady state), the growth rate of per worker output is zero.
The Saving Rate and Output
9

The Saving Rate and Output
A country with a higher
saving rate achieves a
higher steady- state level
of output per worker; but
the steady-state growth
rate is unaffected (=zero)
The Effects of an increase in the Saving Rate
Figure 11 - 3
10
At both K0/N and K1/N, the growth rate of Y/N is zero.

The Saving Rate and Output
An increase in the saving rate
leads to a period of higher
growth until output reaches its
new, higher steady-state level.
The Dynamic Effects of an Increase in the Saving Rate on Output per Worker
Figure 11 - 4
11

The Saving Rate and Output
With technological progress, an
increase in the saving rate
leads to a period of higher
growth until output reaches a
new, higher growth path.
The Dynamic Effects of an Increase in the Saving Rate on Output per Worker in an Economy with Technological Progress
Figure 11 - 5
12

The Saving Rate and Consumption
• An increase in the saving rate always leads to an increase in
the level of output per worker.
• As output increases, consumption increases.
• But as the saving rate rises higher eventually consumption
peaks and begins to decline.
• The saving rate that yields the highest level of consumption in
the steady state is known as the golden-rule saving rate; it
corresponds to a golden-rule level of capital.
13

The golden-rule saving rate or golden-rule capital accumulation rate
The Effects of the Saving Rate on Steady- State Consumption per Worker
Figure 11 - 6
Investment increases more than depreciation; so K, Y, and C increase
Investment increases less than depreciation; so K, Y, and C decrease
14

Physical versus Human Capital • Human capital means the set of skills and productive capacity of workers in the economy.
•An economy with many highly skilled and healthy workers is more productive than an economy in which a majority of workers cannot read or write.
•Human capital is accumulated through education/training and the provision of health services (curative and preventive care)
•By introducing human capital per worker, H/N, the production function may be written as:
Y
Nf
K
N
H
N
,
( , )
An increase in capital per worker or an increase in the average skill of workers leads to an increase in output per worker.
15
•Recent studies have concluded that output per worker depends roughly equally on the amount of physical capital and the amount of human capital in the economy.
•Models that generate steady long-run growth even without technological progress are called models of endogenous growth, where growth depends on variables such as the rate of human capital accumulation (e.g., education and health).
Endogenous Growth
16

Suggested practice exercises
• 1. Read the Appendix at the end of chapter 11
• 2. Solve problems 6 and 7
17


![IV.B Education and Development Carleton University ECON 3508 (Text, Chapter 8, pp. 382- 406] October 21, 2015 Arch Ritter.](https://static.fdocuments.in/doc/165x107/56649f4d5503460f94c6dfb0/ivb-education-and-development-carleton-university-econ-3508-text-chapter.jpg)