Calculation of Vortex Lift Effect Cambered Wings by the Suction ...
Upload
nguyentramCategory
view
227download
4
N A S A C O N T R A C T O R R E P O R T
h
SECTION DATA FOR THIN, HIGHLY CAMBERED AIRFOILS I N INCOMPRESSIBLE FLOW
by Jerome H. Milgrdm
Prepared by
MASSACHUSETTS INSTITUTE OF TECHNOLOGY Cambridge, Mass. 02 1 3 9
fov Langley Research Center
NATIONAL AERONAUTICS AND SPACE ADMINISTRATION WASHINGTON, D. -C. JULY 1971
https://ntrs.nasa.gov/search.jsp?R=19710020417 2018-02-01T02:44:21+00:00Z

TECH LIBRARY KAFB, NM
OObLO78 1. Report No. 2. Government Accession No. 3. Recipient's Catalog No.
NASA CR-1767 -~ ~
4. Title and Subtitle ~~
SECTION DATA FOR THIN, HIGHLY CAMBERED AlRFOILS IN INCOMPRESSIBLE FLOW
July 1971 5. Report Date
6. Performing Organization Code
I 7. Authorb) Jerome H. Milgram I 8. Performing Organization Report No.
I I ~
10. Work Unit No. 9. Performing Organization Name and Address
Department of Naval Architecture and Marine Engineering MaSsachusetts Institute of Technology
Cambridge, Massachusetts 02139 13. Type of Report and Period Covered
National Aeronautics and Space Administration Washington, D.C. 20546
11. Contract or Grant No.
NAS 1-8423
12. Sponsoring Agency Name and Address Contractor Report
14. Sponsoring Agency Code
15. Supplementary Notes
~ ~~ ~~~ ~ ~~ ~~
16. Abstract
The results of tes ts on thin, highly cambered sections are presented. The sections have sharp edges and are thin enough for the thickness effects to be negligible. Three types of mean lines are used: the NACA 65, the NACA a = 0.8, and a newly designed mean line that is somewhat similar to the a = 0.8 mean line. There are some notable differences between the section characteristics of the thin, highly cambered sections and sections having less camber and more thickness. At the ideal angle of attack, as given by thin airfoil theory, the thin, highly cambered sections have about five times as much drag as do thicker sections of less camber. The lift of the thin, highly cambered sections at angles of incidence near ideal is significantly less than that predicted by thin airfoil theory because of the effects of flow separation. The flow separation on the pressure side is increased by a reduction of angle of attack from ideal. This results in lift slopes significantly greater than 2~/radian for angles of attack slightly less than the ideal- angle of attack.
17. Key Words (Suggested by Author(s)) 18. Distribution Statement
Thin, highly cambered airfoils
Airfoil section data
Unclassified - Unlimited
19. Security Classif. (of this report) 22. Price' 21. NO. of Pages 20. Security Classif. (of this page) Unclassified $3.00 72 Unclassified
~~ ~
For sale by the National Technical Information Service,Springfield, Virginia 22151

I
SECTION DATA FOR THIN, HIGHLY CAMBEmD
AIRFOILS IN INCOMPRESSIBLE FLOW
Jerome H. Milgram Massachusetts Institute of Technology
SUMMARY
The results of tests on thin, highly cambered sections are presented. The sections have sharp edges and are thin enough for the thickness effects to be negligible. Three types of mean lines are used: the NACA 65, the NACA a = 0.8, and a newly designed mean line somewhat similar to the a = 0.8 mean line. There are some notable differences between the section characteristics of the thin, highly cambered sections and sections having less camber and more thickness. At the ideal angle of attack, as given by thin airfoil theory, the thin, highly cambered sections have about five times as much drag as do thicker sections of less camber. The lift of the thin, highly cambered sections at angles of incidence near ideal is significantly less than that predicted by thin airfoil theory because of the effects of flow separation. The flow separation on the pressure side is increased by a reduction of angle of attack from ideal. This results in lift slopes significantly greater than 2a/radian for angles of attack slightly less than the ideal angle of attack:

INTRODUCTION
Most flexible aerodynamic lifting surfaces, such as sails and parawings, are thinner and more highly cambered than rigid wings. The thin leading edge of the flexible sur- faces often results in leading edge flow separation and the large camber often causes trailing edge separation. Because of these effects, the aerodynamic characteristics of a flexi- ble wing cannot be predicted by wholly theoretical means at this time. Instead, prediction of characteristics must be made by a rational combination of theory and experimental section data, such as that described by Mendenhall, Spangler and Nielsen (Ref. 1).
Until very recently, there has been very little section data available for thin, highly cambered sections. "Highly cambered" is taken to mean camber ratios in excess of 0.10 and "thin" is taken to mean a section on which thickness effects are negligible. Data for a series of thin airfoils each having uniform curvature (circular arc) , with camber ratios between 0.0 and 0.1, are presented by Wallis (Ref. 2). The uniform curvature profile corresponds to the NACA 65 mean line. For camber ratios larger than 0.06, the lift curve slopes given by Wallis exceed 21~/radian for angles of attack less than the theoretical ideal angle of attack and are less than 2a/radian for angles of attack greater than the ideal angle of attack. This effect, which increases with increas- ing camber ratio, is due to flow separation on the pressure side at negative incidence angles and on the suction side at positive incidence angles. The purpose of this report is to present section data for thin sections having camber ratios between 0.12 and 0.18.
Data for sections having three different types of mean lines are presented. In order to extend the data given by Wallis to sections of higher camber, one group of sections tested have NACA 65 mean lines, with camber ratios of 0.120, 0.150 and 0.180. The second group of airfoils have a = 0.8 mean lines with camber ratios of 0.120, 0.129, 0.150 and 0.180. The a = 0.8 mean line was chosen because irattached flow it has a pressure distribution very different from that of the NACA 65 mean line. In particular, the slope of the theoretical pressure distribution at the trailing edge is finite for the a = 0.8 mean line and infinite for the NACA 65 mean line. The form of the pressure distribution has a marked effect on flow separation so that differences between foils having these two mean lines can be expected.
2

One section with a special mean line and a camber ratio of 0.141 was also tested. In the design of this section, an attempt was made to achieve the largest possible CRi without suction side flow separation.
3

LIST OF SYMBOLS
a - Angle of attack, degrees
"i B - Dummy variable
- Ideal angle of attack, degrees
C - Airfoil chord, meters
Cd - Drag coefficient,
- Lift coefficient,
S-
qcoc section lift
qmc CR
C Ri C m, C/4
R'Cd
Y M
P
qm
P
U
- Lift coefficient at ideal angle of attack
- Quarter chord pitching moment coefficient, - Lift-drag ratio
M
qcoc
- Quarter chord pitching moment, newton-meters: positive sense defined as that acting to increase (Y if the constraints were removed.
- Pressure, newtons/meter - Free stream dynamic pressure p U m , newtons/meter
- Fluid density, Kg/meter 3
- Speed of flow in test section in absence of an
2
1 2 2
airfoil.
urn - Free stream speed, meters/sec.
Xlylz - Rectangular Cartesian coordinates
pR - Pressure coefficient, (pupper - plower)/qm Re - Reynolds number
4

APPARATUS AND MODELS
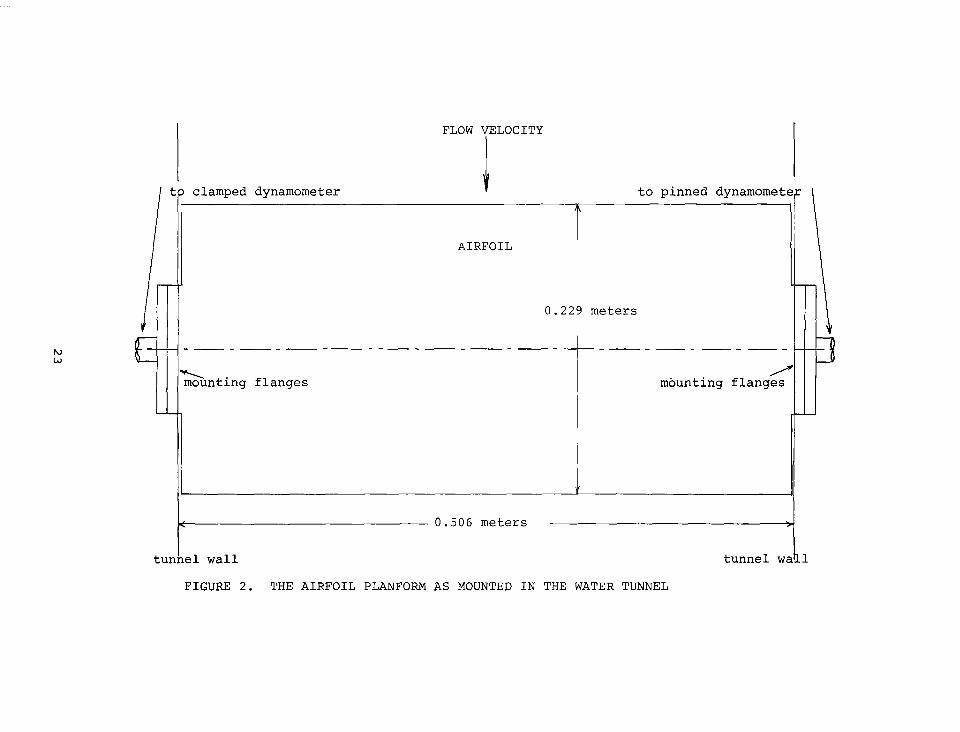
The airfoil tests were carried out in the water tunnel of the Department of Naval Architecture and Marine Engineering at M.I.T. This tunnel has an 0.501 meter x 0.506 meter x 1.37 meter test section with rather thin wall boundary layers. The velocity profile across the tunnel, as measured by a pitot tube traverse, is shown in Fig. 1. Modifications to the previously existing upstream screen locations were necessary to attain this test section profile. The flow speed during tests was determined in terms of the pressure difference measured between two taps in the contracti,on section. This pressure difference was calibrated against test section pitot tube data with no airfoil in the tunnel.
Dynamometers were built onto two opposite sides of the test section. On one side, called the pinned side, the dynamometer consisted of an x-y load cell which gave com- ponents of lift and drag directly. On the opposite side of the test section, called the clamped side, a dynamometer was built that restrained the airfoil in pitch. This dyna- mometer was mounted on a large gear, which could be rotated by means of a meshing worm gear. The force components measured with respect to the gear and the pitching moment were obtained in terms of a linear relation from three load cells connecting the airfoil to the gear. Two load cells primarily constrained the airfoil in two orthogonal directions and the third cell constrained the airfoil primarily in pitch. This cell also contributed a force in one direction. Because of mechanical cross-coupling, one force or moment affects all readings so the proper linear relations were obtained by experimental calibration. The forces with respect to the gear were resolved into lift and drag forces with-respect to the flow direction in the data reduction scheme.
The planform geometry of the airfoils and the arrangement of mounting the airfoils between the dyna- mometers is shown in Fig. 2. All the airfoils had a chord length of 0.229 meters. Circular flanges with a diameter of 0.104 meters were mounted on the ends of each airfoil; these flanges being recessed into the tunnel walls when the airfoil was mounted in the tunnel. The portions of the tips of the airfoils protruding beyond the f.langes were cut back so there was a gap of 0.0016 meters between these parts of the airfoil tips and the tunnel walls. Flanges with attached shafts were attached to the airfoil flanges to connect the airfoils to the dynamometers.
5

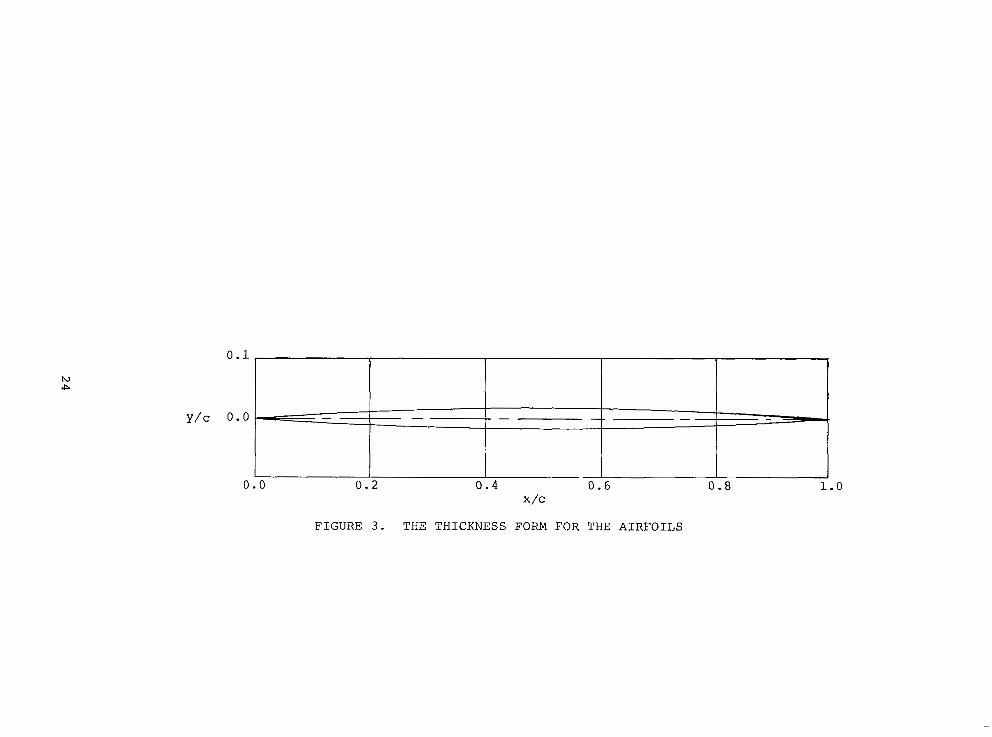
All of the airfoils had the same thickness form. Since infinitely thin airfoils were to be simulated, the thickness form was chosen to be as thin as possible consis- tent with retaining adequate stiffness, to have sharp leading and trailing edges and to have very gradual changes of slope. The form chosen is symmetrical fore and aft as well as top and bottom, has a parabolic thickness distribu- tion with a thickness ratio of 0.034 and a ratio of edge thickness to chord of 0.0022. The thickness form is shown in Fig. 3 . Each airfoil was generated by adding the desired mean line coordinates to the upper and lower surfaces of the thickness form. The vertical mean line coordinates of the leading and trailing edges were taken as zero. As a result of this procedure, the thickness at a given horizontal station equals the corresponding thickness of the thickness form when it is measured perpendicular to the local mean line.
An airfoil with the NACA 65 mean line and a camber ratio of 0.15 was made before the other airfoils. It was made of alloy 6061-T6 aluminum. The remaining airfoils were made of high yield strength manganese bronze. The machining tolerance on airfoil offsets was + 0.0016 chord lengths. Models were made having NACA 65 mean lines with camber ratios of 0.12, 0.15 and 0.18. Also models were made having a = 0.8 mean lines with camber ratios of 0.12, 0.129, 0.150 and 0.180. A single airfoil was made with a special mean line designed in an attempt to produce high lift with a minimum of flow separation and with a minimum of friction drag. The design of this section is explained in the discussion section.
Models are denoted by their mean lines, a hyphen and their camber ratios in percentage form. For example the section with an a = 0.8 mean line and a camber ratio of 0.129 will be denoted by a = 0.8-12.9. Figure 4 shows the section shapes that were tested. The section offsets are given in the appendix.
6

TEST PROCEDURES
Data were taken at three different Reynolds numbers, 6, 9 and 12 x lo5, at angle of attack increments of one degree at the clamped side of each airfoil. The angle at the pinned side was recorded and it was assumed that the twist varied parabolically across the span of the airfoil. Therefore, for each condition the average angle of attack was taken as that of the clamped side plus one-third of the difference between the angle of the pinned side and that of the clamped side. For values of angle of attack less than 10 degrees, the variation in twist across the span was nearly always less than one degree. At larger values of angle of attack the largest value of twist was two degrees. For each condition at which data were taken, lift, drag and pitching moment were determined by subtracting from the measured value of each quantity, the measured value obtained for zero speed. Then the non-dimensional lift, drag and pitching moment coefficients were determined. These data were then smoothed by the formula
BO + 2Bo Bi - - i-1 i + Boi+l 4
where B is the quantity being smoothed and Bo is the measured value of that quantity. From the smoothed data, plots were made of CR vs. a, cd vs. a, cd vs. cR, ~ ~ , ~ / 4 vs. ct and c&/cd vs. CR.
All of the above operations on the data,including plotting, were carried out by a digital computer and its peripheral equipment.
It should be noted here that wall effects have been neglected in the data reduction. These effects are discussed at some length in References 3 and 4. For the dimensions of the airfoils and the tunnel used, the only significant wall effect is the non-uniformity of the degree of flow separation at various spanwise locations. For the data that were taken, this effect cannot be estimated quantitatively.
In order to determine the magnitude of the effects of non-repeatability, machining errors and flow angle errors, the NACA 65-12 airfoil was tested at a Reynolds Number of 1.2 x lo6 in three orientations; normal , reversed, and upside down. Since this airfoil has fore and aft symmetry, identical
7

results should be obtained if c~~ cmtc/4 and a are taken as their negative values for the upside down case. The results of these tests are shown in Figures 5a, 5b, 512, and 5d. The differences between the curves in each figure indicates the magnitude of anticipated errors in the data is small. The section data for the eight thin airfoil sections at Reynolds Numbers of 6 , - 9 and 12 x l o 5 are presented in Figures 6 through 13.
8

DISCUSSION
The main purpose of this report is to make available some section data on thin, highly cambered sections. Such data is needed in the design of flexible wings (Ref. 1) and it also is of general aerodynamic interest since the section characteristics of thin, highly cambered sections are quite different from those of thicker sections with less camber.
The lift versus angle of attack characteristics of slightly cambered sections of moderate thickness withround leading edges are close to the theoretical predictions (see e.g. Abbott and Von Doenhoff, Ref. 5) until the stalling angle is reached, at which point the lift drops sharply. As opposed to this, the lift coefficient.of a thin, highly cambered section is always less than the theoretical predic- tion and a sharp stall is not observed. This reduction in lift coefficient is due to flow separation. The large pressure variation resulting from the large camber causes trailing edge flow separation for angles of incidence about equal to the ideal angle of attack and larger. The ideal angle of attack is the angle at which the forward stagnation point is just at the leading edge. When the angle of attack equals the ideal angle of attack, there is attached flow at the leading edge. When the angle of attack is less than the ideal angle of attack, there is leading edge separation on the pressure side and when the angle of attack exceeds the ideal angle of attack, there is leading edge separation on the suction side. These effects further decrease the lift coefficient from its theoretical value such that the lift slope exceeds the theoretical pxediction of 2r/radian for angles of attack less than ideal and is less than 2r/radian for angles of attack greater than the ideal angle of attack. Thus, significant flow separation exists for all values of angle of attack on a thin, highly cambered airfoil instead of suddenly beginning as the angle of attack is increased as it does on a thick airfoil of small camber. Figure 14 shows CR vs. c1 for the 65-12 section as measured and as predicted by thin airfoil theory.
The ever present flow separation causes the minimum section drag coefficient to be about 0.06 which is typically about an order of magnitude larger than the mini- mum drag coefficient of a thick wing section.
9

The pitching moment characteristics of the thin, highly cambered sections are also different from those of thicker sections. At the ideal angle of attack, the effect of flow separation is least and most of the lift is due to the pressure distribution association with the camber. For this condition the center of pressure is significantly aft of the quarter chord, so the quarter chord pitching moment is necessarily large and negative.
If a section is operating at its ideal angle of attack, semi-empirical boundary layer theory can be used to predict whether or not the flow will separate (Ref. 6). Boundary layer separation results from a slowing down of the fluid near the airfoil surface and this is caused mainly by adverse pressure gradients and to a lesser extent by wall friction. On the pressure side of most airfoils the pressure gradient is adverse over the forward portion and favorable over the aft portion. If the flow separates over the forward portion, it often reattaches over the aft portion. On the suction side the pressure gradient is usually favorable on the forward portion and adverse on the aft portion. Hence, if the flow separates on the aft portion of the suction side, it does not reattach. For this reason, semi-empirical boundary layer theory is usually applied to the suction side to determine whether or not the flow will separate. In the design of the special mean line S-14.1, an attempt was made to achieve the highest possible lift coefficient without flow separation. The pressure at the trailing edge of a very thin airfoil in unseparated flow is pm. Since the pressure rise from the maximum suction to pm is the major factor causing flow separation, the pressure distribution for maximum lift coefficient without flow separation must be nearly rectangular. At the ideal angle of attack, the pressure at the leading edge of a very thin section' is also pm. The sudden jump in pressure at the leading edge exhibited by the NACA"a"series mean lines is physically unrealistic and is avoided in the design of the special mean line. Since a favorable pressure gradient encourages laminar flow, it might be possible to minimize friction drag by having the point of minimum pressure quite far aft. It is known that finite slope of the pressure distribution near the trailing edge, such as exhibited by the NACA "a" series , (except for a = 1.0) , does not encourage flow separation as much as infinite slope of the pressure distribution at the trailing edge as exhibited by the NACA 60 series (63, 65, etc.) mean lines. Therefore the special mean line was designed to have a pressure distribution
10
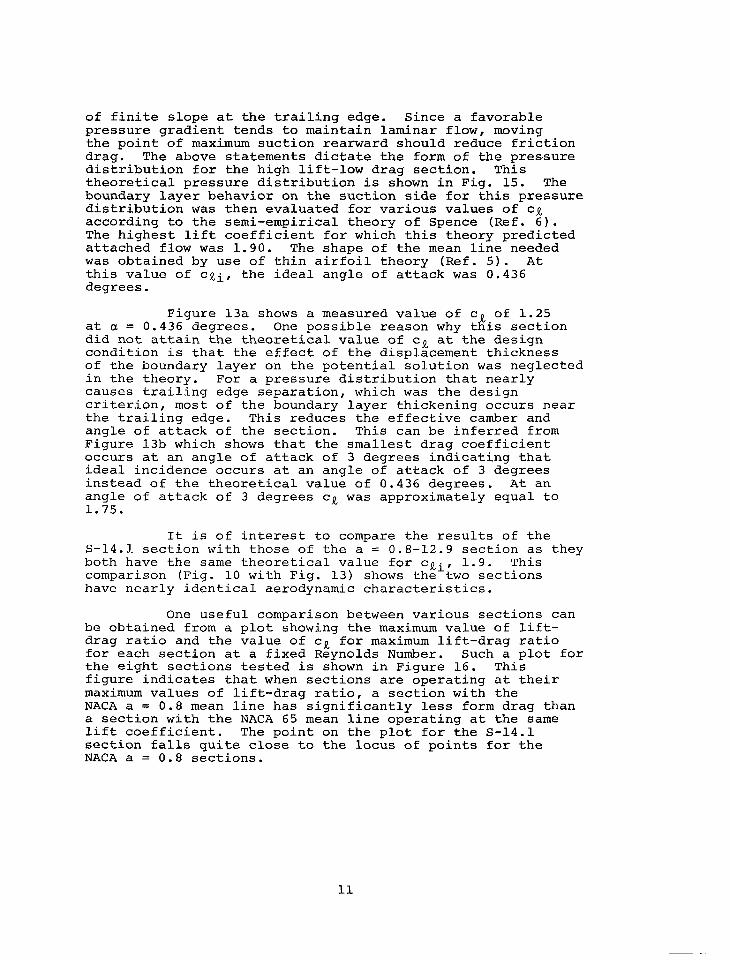
of finite slope at the trailing edge. Since a favorable pressure gradient tends to maintain laminar flow, moving the point of maximum suction rearward should reduce friction drag. The above statements dictate the form of the pressure distribution €or the high lift-low drag section. This theoretical pressure distribution is shown in Fig. 15. The boundary layer behavior on the suction side for this pressure distribution was then evaluated for various values of cg according to the semi-empirical theory of Spence (Ref. 6). The highest lift coefficient for which this theory predicted attached flow was 1.90. The shape of the mean line needed was obtained by use of thin airfoil theory (Ref. 5). At this value of cgi, the ideal angle of attack was 0.436 degrees.
at a = 0.436 degrees. One possible reason why tiis section did not attain the theoretical value of cR at the design condition is that the effect of the displacement thickness of the boundary layer on the potential solution was neglected in the theory. For a pressure distribution that nearly causes trailing edge separation, which was the design criterion, most of the boundary layer thickening occurs near the trailing edge. This reduces the effective camber and angle of attack of the section. This can be inferred from Figure 13b which shows that the smallest drag coefficient occurs at an angle of attack of 3 degrees indicating that ideal incidence occurs at an angle of attack of 3 degrees instead of the theoretical value of 0.436 degrees. At an angle of attack of 3 degrees cg was approximately equal to 1.75.
Figure 13a shows a measured value of c of 1.25
It is of interest to compare the results of the 5-14.1 section with those of the a = 0.8-12.9 section as they both have the same theoretical value for cgi, 1.9. This comparison (Fig. 10 with Fig. 13) shows the two sections have nearly identical aerodynamic characteristics.
One useful comparison between various sections can be obtained from a plot showing the maximum value of lift- drag ratio and the value of CR for maximum lift-drag ratio for each section at a fixed Reynolds Number. Such a plot for the eight sections tested is shown in Figure 16. This figure indicates that when sections are operating at their maximum values of lift-drag ratio, a section with the NACA a = 0.8 mean line has significantly less form drag than a section with the NACA 65 mean line operating at the same lift coefficient. The point on the plot for the S-14.1 section falls quite close to the locus of points for the NACA a = 0.8 sections.
11

REFERENCES
1. Mendenhall, M. R., Spangler, S. B. and Nielsen, J. N., "Investigation of Methods for Predicting the Aerodynamics of Two-Lobed Parawings," NASA Contract Report CR-1166, 1968.
2. Wallis, R. A., "Axial Flow Fans ," Academic Press, New York, 1961.
3 . Preston, J. H., "The Interference on a Wing Spanning a Closed Tunnel, Arising from the Boundary Layers on the Side Walls, with Special Reference to the Design of Two Dimensional Tunnels," Rep. Memor. Aero. Res. Coun., No. 1924, London.
4. Mendelsohn, R. A., and Polhamus, J. R., "Effect of the Tunnel Wall Boundary Layer on Tests of a Wing Protruding from a Tunnel Wall, N.A.C.A. TN-1244.
5. Abbott, I., and Von Doenhoff, A., "Theory of Wing Sections," Dover Publications, New York, 1959.
6. Spence, D. A., "The Development of Turbulent Boundary Layers," Journal of the Aero. Sci., Vol. 23, No. 1.
12

APPENDIX
The . A i r f o i l Model Design Offsets
13

65-012 SECTION
Station (%C)
0
5
10
1 5
20
25
3 0
35
40
45
5 0
5 5
6 0
6 5
7 0
7 5
80
8 5
9 0
9 5
1 0 0
Chordwise Position (Inches from Leading edge)
0
.450
.goo
1 .350
1 . 8 0 0
2.250
2.700
3.150
3 .600
4.050
4.500
4.950
5.400
5.850
6 .300
6 .750
7 .200
7 .650
8.100
8.550
9.000
Upper Surface (Inches)
. 015
.239
- 4 4 8
.633
- 7 9 2
. 9 2 8
1 . 0 3 8
""-
1 . 1 8 6
""_ 1 . 2 3 5
"-" 1 . 1 8 6
""_ 1 . 0 3 8
.928
.792
.633
, 4 4 8
.239
.015
Lower Surface (Inches )
-. 0 0 5
.171
. 330
.469
- 5 9 0
. 6 9 2
.776
.8 88
""_ . 925
. 8 8 8
.776
. 6 9 2
.590
.469
. 3 3 0
. 1 7 1
-. 0 0 5
1 4

65-015 SECTION
Station Chordwise Position (%C) (inches from leading edge)
0 0
5
1 0
1 5
.450
.goo
1 .350
20 1 .800
25
30
3 5
40
45
50
5 5
6 0
6 5
7 0
7 5
80
8 5
9 0
95
2.250
2 .700
3 .150
3.600
4 .050
4.500
4.950
5.400
5 .850
6.300
6.750
7.200
7 .650
8.100
8.550
1 0 0 9 . 0 0 0
Upper Surface (Inches)
.015
.290
.545
.7 7 1
.965
1 . 1 3 1
1 .265
Lower Surface (Inches)
-. 005
. 2 2 1
.427
.607
.763
.845
1 . 0 0 3
""_ ""-
1 .445 1 .147
""_ ""_ 1 . 5 0 5
""_ 1 .445
1 .195
""_ 1 .147
""_ ""_ 1.2 6 5
1 . 1 3 1
.965
.7 7 1
.545
.290
- 0 1 5
1 .003
.895
.763
.607
.427
. 2 2 1
" 0 0 5
1 5

65-018 SECTION
Station Chordwise Position ( % C ) (inches from leading edge)
0
5
1 0
1 5
20
2 5
3 0
0
.450
.goo
1 .350
1 . 8 0 0
2.250
2 .700
35 3.150
40
45
3.600
4.050
50 4 .500
55 4 .950
6 0
6 5
7 0
7 5
80
85
9 0
95
1 0 0
5.400
5.850
6.300
6 .750
7.200
7 .650
8.100
8.550
9.000
Upper Surface (Inches)
. 0 1 5
. 3 4 1
.642
.908
1 . 1 3 8
1 . 3 3 3
1 .492
""_ 1 . 7 0 4
""_ 1 . 7 7 5
"_" 1 . 7 0 4
"_" 1 . 4 9 2
1 . 3 3 3
1 . 1 3 8
. 9 0 8
.642
, 3 4 1
.015
Lower Surface (Inches)
-. 0 0 5
. 2 7 4
. 5 4 2
- 7 4 5
. 9 3 6
1 . 0 9 8
1 .230
""_ 1 .406
""_ 1 . 4 6 5
""_ 1 .406
_"" 1 .230
1 . 0 9 7
.936
. 7 4 5
.524
.274
-. 0 0 5
1 6

a = 0.8-12 SECTION
0
5
10
1 5
20
25
30
3 5
40
45
50
55
60
6 5
7 0
7 5
80
85
90
9 5
1 0 0
Chordwise Position (inches from leading edge)
0
.450
.goo
1 .350
1 .800
2 .250
2.700
3.150
3 .600
4 .050
4.500
4 .950
5.400
5 .850
6 .300
6 .750
7 .200
7.650
8.100
8.550
9.000
Upper Surface (Inches)
.015
.327
.543
.716
.856
.972
1 . 0 6 4
1 .136
1 .187
1 . 2 2 1
1 .235
1 . 2 3 1
1 .206
1 . 1 6 1
1 . 0 9 1
.995
.860
.668
- 4 4 6
.218
.015
Lower Surface (Inches )
-. 005
.260
.425
- 5 5 2
.654
.736
.802
.852
- 8 8 9
- 9 1 4
.925
.923
.908
.877
.829
.759
- 6 5 8
.504
.328
- 1 5 2
-. 005
1 7
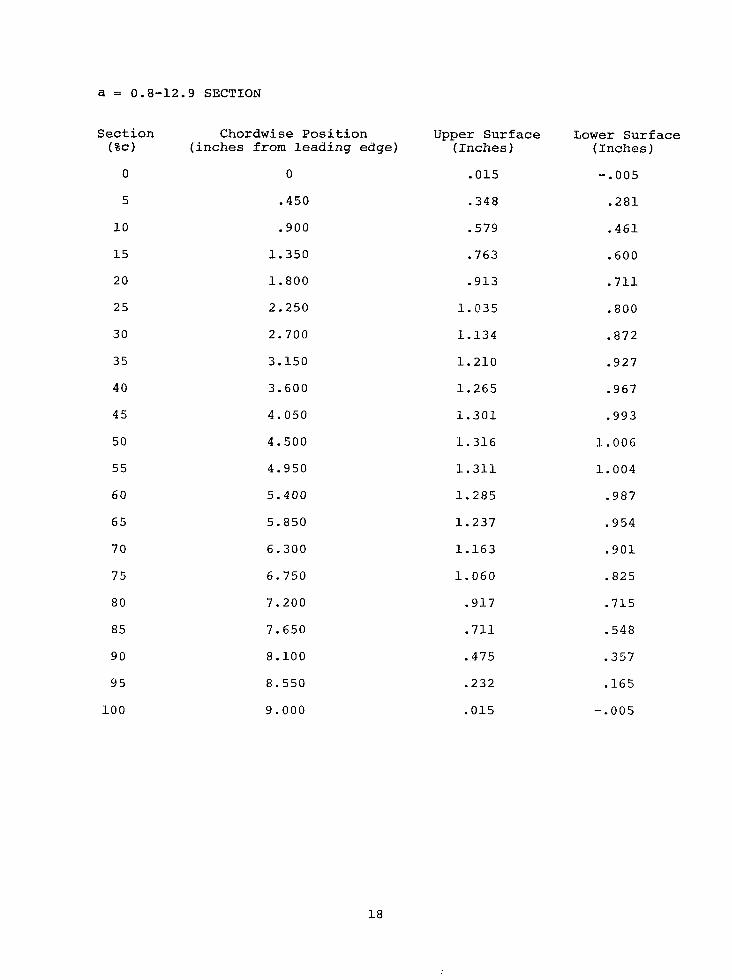
a = 0.8-12.9 SECTION
Section Chordwise Position ( 8 C ) (inches from leading edge)
0 0
5 .450
1 0 . g o o
1 5 1 . 3 5 0
20 1 .800
25 2.250
30 2 .700
35 3 .150
40 3 .600
45 4 .050
50 4 .500
5 5 4 . 9 5 0
6 0 5 . 4 0 0
65 5 .850
7 0 6 . 3 0 0
7 5 6 . 7 5 0
80 7 .200
85 7 .650
9 0 8 . 1 0 0
95 8 .550
1 0 0 9 .000
Upper Surface (Inches )
.015
. 348
* 5 7 9
.763
. 9 1 3
1 . 0 3 5
I. 1 3 4
1 .210
1 . 2 6 5
1 . 3 0 1
1 . 3 1 6
1 . 3 1 1
1 . 2 8 5
1 . 2 3 7
1 . 1 6 3
1 . 0 6 0
.917
. 7 1 1
.475
.232
. 0 1 5
Lower Surface (Inches)
-. 0 0 5
. 2 8 1
. 4 6 1
.600
. 7 1 1
.800
- 8 7 2
- 9 2 7
.967
- 9 9 3
1. O O G
1.. 0 0 4
. 9 8 7
,954
.g01
.825
- 7 1 5
. 5 4 8
* 3 5 7
,165
-. 0 0 5
1 8

a = 0.8-15 SECTION
Station (%C)
0
5
1 0
1 5
20
2 5
3 0
3 5
40
45
5 0
55
6 0
6 5
70
7 5
80
85
9 0
9 5
Chordwise Position (inches from leading edge)
0
- 4 5 0
.goo
1 .350
1 . 8 0 0
2.250
2 .700
3.150
3.600
4 .050
4.500
4 .950
5.400
5 .850
6 .300
6.750
7 .200
7.650
8.100
8.550
Upper Surface (Inches)
. 015
, 4 1 1
.684
- 9 0 0
1 .077
1 .220
1 . 3 3 6
1 . 4 2 5
1 . 4 9 0
1 . 5 3 2
1 .550
1 .544
1 . 5 1 4
1 . 4 5 7
1 . 3 7 1
1 . 2 5 0
1 . 0 8 1
.838
.559
. 2 7 2
Lower Surface (Inches )
-. 005
.345
.566
.736
.875
.985
1.074
1 . 1 4 2
1 . 1 9 2
1 . 2 2 4
1 .240
1 . 2 3 7
1 .216
1 .174
1 .109
1 . 0 1 5
.879
. 5 7 5
- 4 4 1
. 2 0 5
1 0 0 9 .000 . 0 1 5 "005
1 9

a = 0.8-18 SECTION
Gtation (%C)
0
5
10
1 5
20
2 5
3 0
35
40
45
5 0
5 5
6 0
6 5
7 0
7 5
8 0
85
9 0
9 5
1 0 0
Chordwise Position (inches from leading edge)
0
.450
.goo
1 . 3 5 0
1 .800
2.250
2.700
3.150
3.600
4.050
4.500
4.950
5.400
5 .850
6.300
6.750
7.200
7.650
8.100
8.550
Upper Surface (Inches )
.015
. 4 7 2
.785
1 .033
1 . 2 3 4
1 . 3 9 8
1 .530
1 . 6 3 3
1 .706
1 . 7 5 5
1 . 7 7 5
1 .769
1 . 7 3 4
1 . 6 7 0
1 . 5 7 1
1 . 4 3 4
1 . 2 3 9
. 9 6 1
- 6 4 0
. 3 1 0
Lower Surface ( Inches )
-. 005 . 406
. 6 6 7
. 8 6 9
1 . 0 3 2
1 . 1 6 2
1 . 2 6 8
1 . 3 4 9
1 . 4 0 8
1 . 4 4 7
1 . 4 6 5
1 . 4 6 1
1.436
1 . 3 8 6
1 . 3 0 9
1 . 1 9 8
1 . 0 3 7
. 7 9 7
. 5 2 2
- 2 4 4
9.000 .015 -. 0 0 5
2 0.
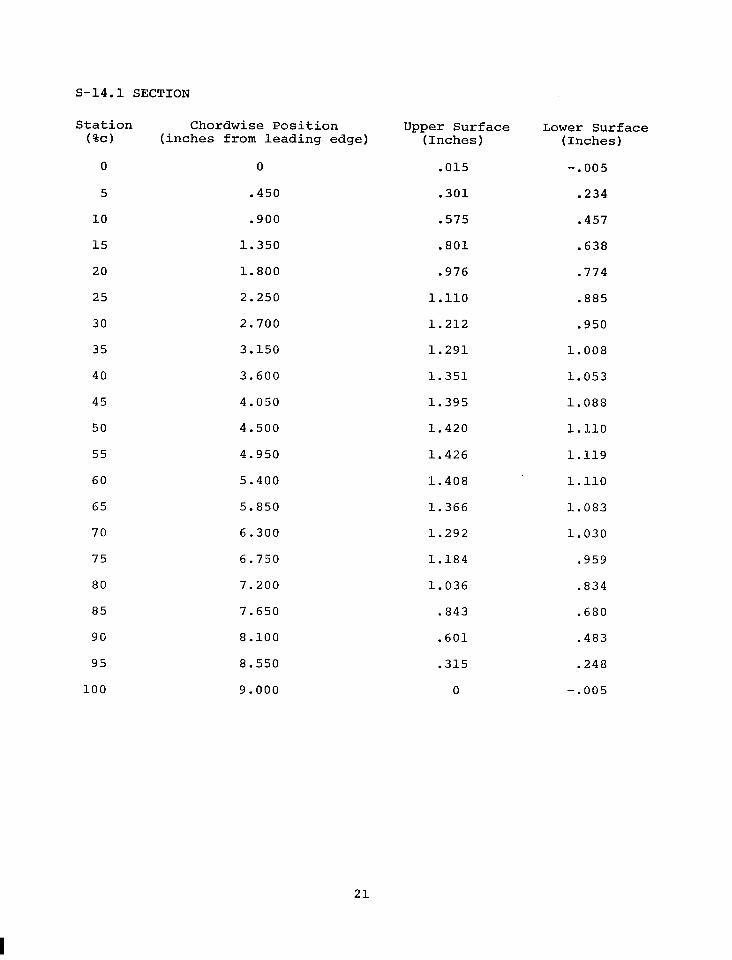
5-14.1 SECTION
Station ( % C )
0
5
10
15
20
25
30
35
40
45
50
55
60
65
70
75
80
85
90
95
100
Chordwise Position (inches from leading edge)
0
.450
.goo
1.350
1.800
2.250
2.700
3.150
3.600
4.050
4.500
4.950
5.400
5.850
6.300
6.750
7.200
7.650
8.100
8.550
9.000
Upper Surface (Inches)
.015
.301
.575
.801
-976
1.110
1.212
1.291
1.351
1.395
1.420
1.426
1.408
1.366
1.292
1.184
1.036
.843
.601
.315
0
Lower Surface (Inches)
-. 005 .234
.457
.638
.774
-885
.950
1.008
1.053
1.088
1.110
1.119
1.110
1.083
1.030
.959
.834
.680
.483
-248
-. 005
21

I I I I 0.2 0.4 0.6 0.8
Y/WIDTH 3
FIGURE 1. TEST SECTION TRANSVERSE VELOCITY SURVEY
2 2
4 tur
FLOW VELOCITY I
le1 wall tunnel wahl
FIGURE 2. THE A I R F O I L PLANFORM AS MOUNTED I N THE WATER TUNNEL
0.1
Y / C 0.0 - - - - "
0.0 0.2 0.4 0 .6 0.8 X/C
1.0
F I G U R E 3 . THE THICKNESS FORM FOR THE A I R F O I L S

1-
Y/C I
-I-
"
b- "
"
L-
"
s- "
"
"
L-
s-14.1
0.0 0.1 0.2 0.3 0.4 0.5 0.6 0.7 0.8 0.9 1.0 I . I
I I
010.8-18
x / c FIGURE 4 . THE EIGHT T H I N AIRFOIL SECTIONS THAT WERE TESTED
25

2.8
2 4
2.0
-4 0 - 1.6 I- z w 0 LL LL 1.2 W
0 0
5 0.8 I-
d
2
0.4 0 W m
C
- 0.4
-0. a
65 - 12 SECTION
NORMAL REVERSED UPSIDEDOWN
. - . . - -. . . . .. . .- . . ""_
-
I I I I -24 -20 -16 -12 -8 -4 0 4 8 12 16 20 24
cr,deg.
FIGURE 5a. c vs. a for t h e 65-12 SECTION IN
THREE ORIENTATIONS IN THE TUNNEL R
Re = 1 . 2 x 10 6
26

.88
- .84
-
65- 12 SECTION .80 - NORMAL .76
- UPSIDEDOWN .72
- """""_ "_. REVERSED ""_ .68
- 0 .52 w
- 5 .56
- v .60
- .64
-
0
w * -28 -
.20
.16
.12
.08
-
-
-
-
.04 -
-d4 -A0 -I6 -12 -!3 -4 0 4 8 12 16 20 24
a, deg . FIGURE 5b. cd VS. FOR THE 65-12 SECTION IN
THREE ORIENTATIONS IN THE TUNNEL
Re = 1.2 x 10 6
27

.ea
.84
.8C
.76
.72
.69
.64
,” .Eo
I-” w z .56
0 .52 L L LL w .4E 0
.44
-
c3 g .40 D
z .36 0 i= .32 0 W rn .28
.24
.20
.16
.12
.08
.04
C
SECTION
NORMAL REVERSED
UPSIDEDOWN
I I -0.8 -0.4 0 0.4 08 1.2 1.6 2.0 2.4 28
SECTION LIFT COEFFICIENT, ce
FIGURE 5c. Cd R VS. c FOR THE 65-12 SECTION IN
THREE ORIENTATIONS IN THE TUNNEL
Re = 1.2 x 1 0 6
28

.OB
.04
Q
-.04
9 E- 0 -.OB
0
+- -.12
w z 0
-.16 L L W
0" -.20
I-
w -.24 z
0 I
= -.28 0 z
-.32
v, w
-.36
-.40
-44
-.48
65-12 SECTION
NORMAL REVERSED
UPSIDEDOWN
.-."-.""" ""_
I I I I I I ~~ ~ ~ I I I I I ~- I -24 -20 -16 -12 -8 -4 0 4 8 12 16 20 24
a, deg.
FIGURE 5d. C m, c/4 VS. O! FOR THE 65-12 SECTION IN
THREE ORIENTATIONS IN THE TUNNEL
Re = 1.2 x 10 6
29
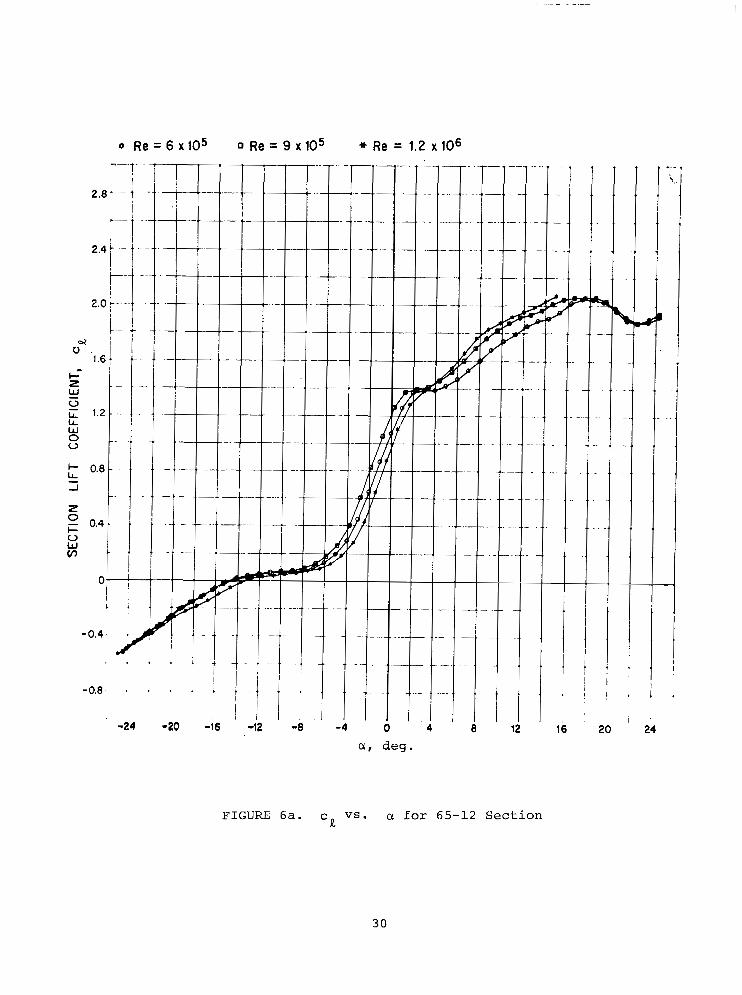
0 R e = 6 x IO5 0 Re = 9 x lo5 * Re = 1.2 X 10⁶
2.8
20 24 I
FIGURE 6a. cR vs. f o r 65-12 Section
30

!
a , deg.
FIGURE 6b. Cd vs. a for 65-12 Section
31

0 R e = 6 x 1 0 5 0 Re = 9 x l O 5 * R e = 1.2 x 10⁶ 1
0 - . .
-0.8
* - 4 .
1 "
- 0.4
I
&- . - I 1 ". . I 1 -1 1 1 0 0.4 0.8 1.2 1 .4 2.0
~ .. ".
SECTION LIFT COEFFICIENT,cg 2
FIGURE 6c. Cd VS. cg for 65-12 Section
32

o Re = 6 x IO5 0 Re = 9 x I O 5 * Re = 1.2 x IO6
a, deg.
20
F I G U R E 6d. Cm,c/4 vs. a fo r t h e 65-12 S e c t i o n
33

0 R e = 6 x lo5 0 Re = 9 x IO5 * Re = 1.2 x IO6 50' "
-
1- - 1 -
I
..
-l" I
- . I !
. ..
I
i
-0.8 -0.4 0 0.4 0.8
SECTION LIFT COEFFICIENT, Cg
FIGURE 6e. cR/cd VS.. CR f o r 65-12 Section
3 4

Q R e = 6 x 1 0 5 0 Re = 9 x10⁵ * Re = 1.2 K 106
- 0.4
F I G U R E 7a. CR vs. CL fo r the 65-15 Sect ion
35
I

.... .. .. ~
o Re = 6 x lo5 0 R e = 9 x lo5 * R e = 1.2 x lo6
F I G U R E 7b. cd V S . a for t h e 65-15 Section
36

0 Re = 6 x10⁵
.24
.20
.16
.I2
.08
-04
0- '
-0.8 - 0.4
0 Re = 9 x 10⁵ * R e = 1.2 x 10⁶
. _. " ." """ . "_ 0 0.4 0.8 1.2 1.6 2 .o
SECTION LIFT COEFFICIENT, cR
I
2..
2.4
F I G U R E 7c. cd V S . cR f o r the 65-15 Section
37

.08
.O 4
0
-.04
\ U -.08
- . l 2 L
z
0 I- -.32 W cn
0
-.36
-.40
-.44
- A 8 . , . . I . . . . . . I I , ; . a I
I . . . l . . . . . ' . . I . . . A -24 -20 -16 -12 -8 -4 0 4 8 12 16 20 24
a , deg.
F I G U R E 7d. c 'vs.. c1 for the 65-15 Section m , c/4
3 8

0 Re = 6 x lo5 0 Re = 9 x IO5 50
45
40
35 .
30
u \ 25
5
0 7 u
20
1 5 .
10
5 .
* Re = 1.2 x lo6
I
SECTION LIFT COEFFICIENT, cR
F I G U R E 7e. Cc/Cd Vs. CR for 65-15 Sect ion
39
4 0

o Re = 6 x lo5 0 Re = 9 x 1 0 5 Re = 1.2 x lo6 ... "_ - ~. . . . .
.20 - . . *
.16 . . . . . .
. 12 . . . . . . . .
I ! '
. . . I .
. . . . . . .
. . . . . . . .
20 24
....
I
U, deg.
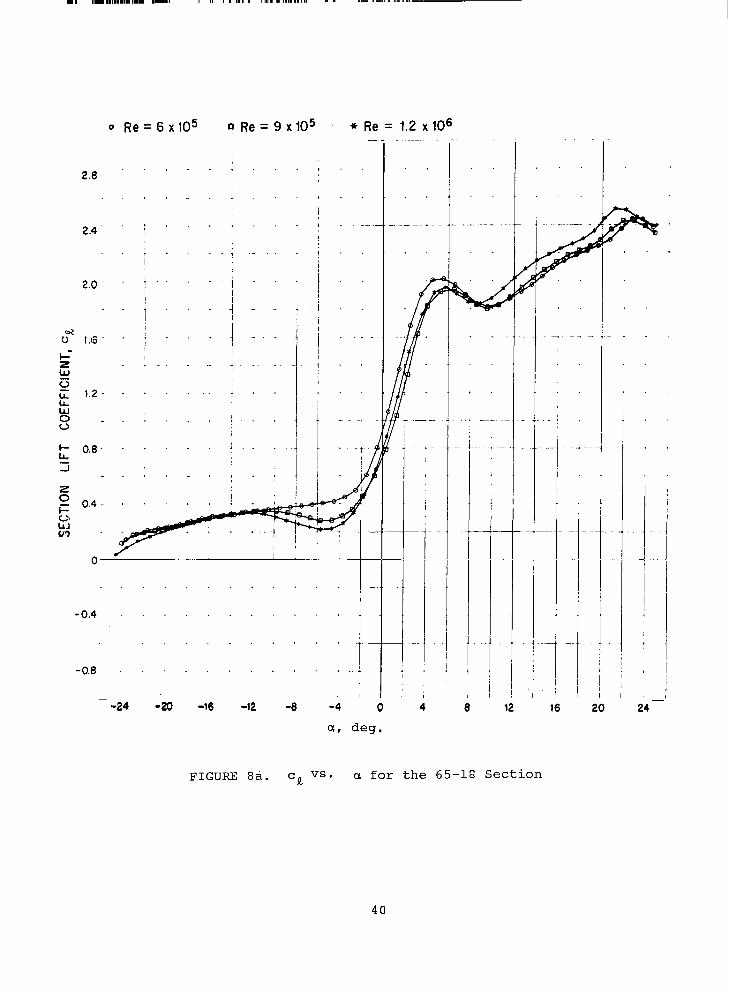
FIGURE 8b. cd VS. a for the 65-18 Section
41

0 Re = 6 x 10⁵ Re = 9 x 10⁵
i " -
"
. 4 , I
- t : . .I
.68
.64
u .60
5 6
.52
A8
a ..
W
LL
0 0 44 c3 2 .40 D
.36
0 V I" .x W v) .28
- " . . ""
. " I
". "
- ... . ~. "
"
. .
i
.. .
. ".
.24
.20,
.16
.12
.08
.04
I
0" ~- -0.8
- 0 0.4 0.8 1.2 1.6 2 .o
_ _ . .. - .
SECTION LIFT COEFFICIENT, cR - 0.4
FIGURE 8c. cd V S - cR for the 65-18 Section
42
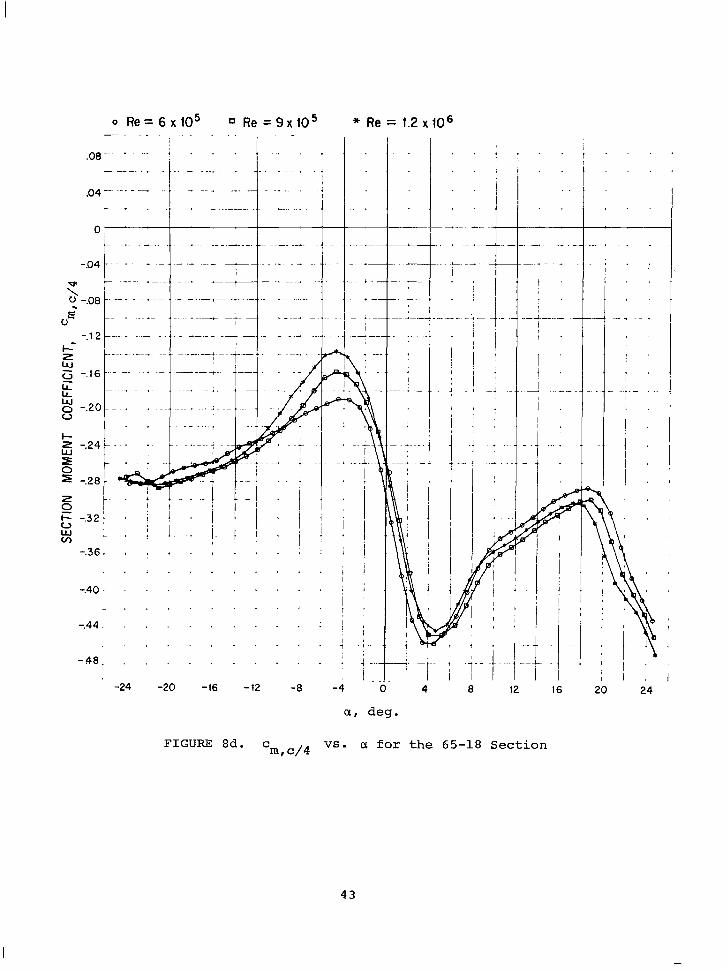
a, deg.
FIGURE 8d. c VS. a f o r the 65-18 S e c t i o n m? 4 4
4 3

"" I.. .-. I..,...-. . _I "-
o Re = 6 x lo5 0 Re = 9 x10⁵ . * Re = 1.2 x 1 0 6
SECTION LIFT COEFFICIENT, cR
FIGURE 8e. cR/cd v.0 cR €or 65-18 Section
4 4

I
0 Re = 6 x IO5 0 Re = 9 x lo5 * Re = 1.2 x 10⁶
a, deg.
FIGURE 9a. cR vs. a for the a = 0.8-12 S e c t i o n
45

o R e = 6 x 1 0 5 0 R e = 9 x 1 0 5 R e = 1.2 x lo6
F I G U R E 9b. cd vs. 0: for t h e a = 0.8-12 S e c t i o n
46

0 R e = 6 x l O 5 CI Re = 9 x 1 0 5 * R e = 1.2 x los
-0.8 - 0.4 0 0.4
SECTION LIFT COEFFICIENT, R -
FIGURE 9c. cd V S . ~ cR for the a = 0.8-12 Section
4 7

o R e = 6 x 1 0 5 0 Re =9x10⁵ . * R e = 1 . 2 ~ 1 0 ~
a, deg.
F I G U R E 9d. c ~ , ~ , ~ ys. cx f o r the a = 0.8-12 Section
48

0 Re = 6 x 10⁵
0- -0.8
0 Re = 9 x lo5 Re = 1.2 x lo6
SECTION LIFT COEFFICIENT, cL
F I G U R E 9e. cR/cd vs. cL for the a.= 0.8-12 Section
4 9
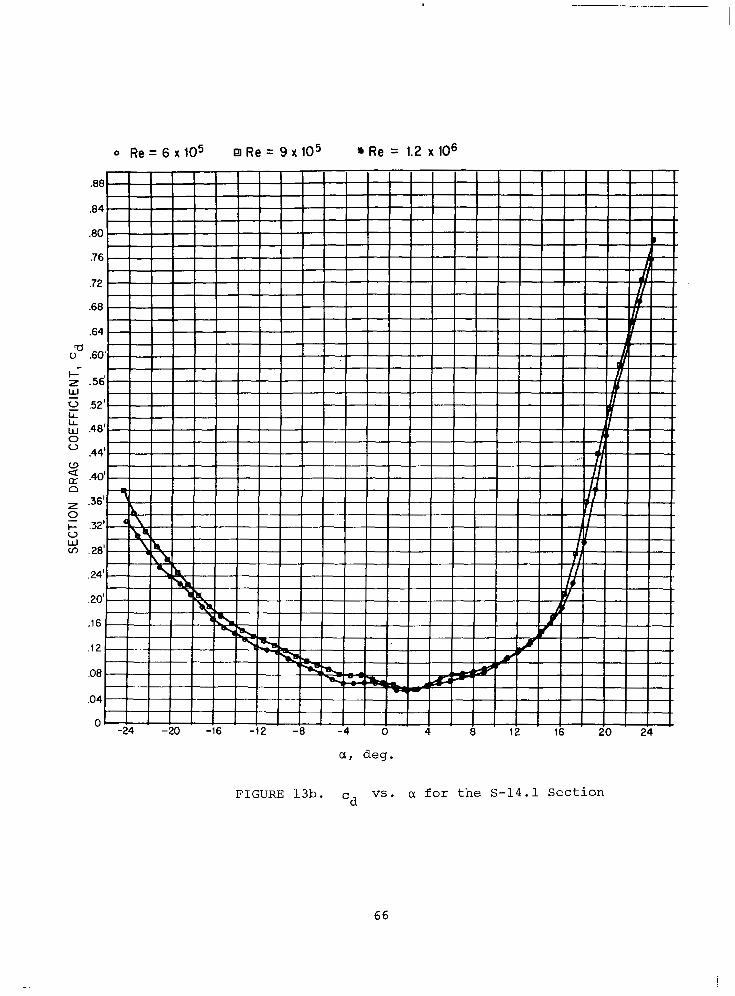
0 R e = 6 x IO5 0 Re = 9 x IO5 * Re = 1.2 x IO6
-24 -20 1 6 -12 -8 . . . . . . . . . . . I . . . . . . . . .
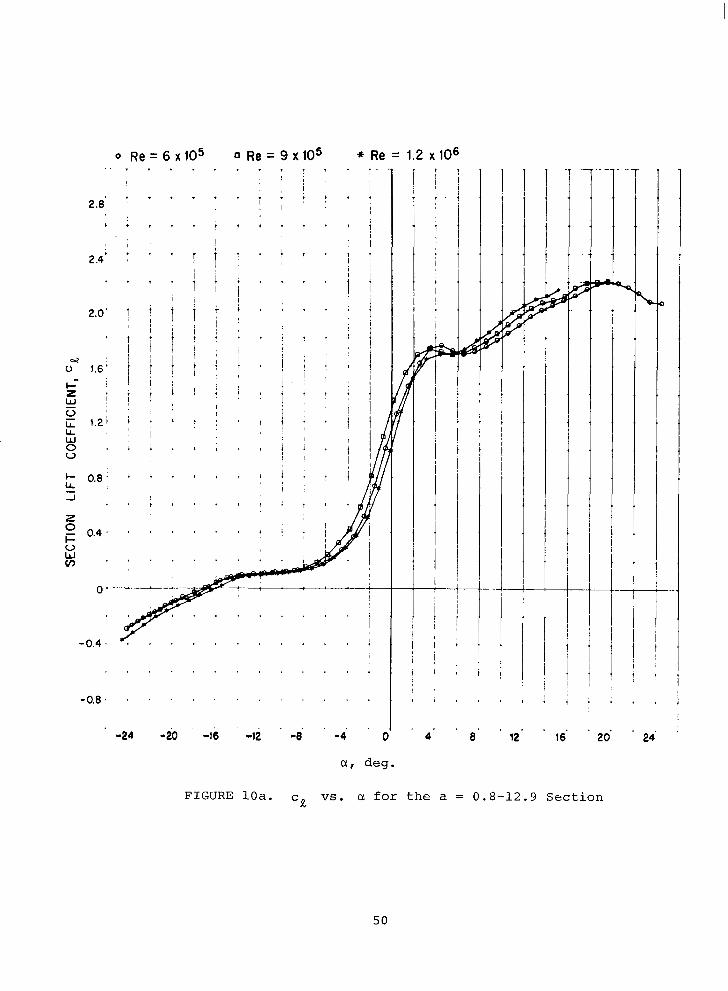
-4 0 4 8 12 16 20' 24' '
a , deg.
F I G U R E loa . cR vs. CY fo r the a = 0 .8 -12 .9 Sect ion
50

.BE
.84
BO.
.76
.24
.20
.I6
.I2
.08
.04
o R e = 6 x 1 0 5 R e = 9x10⁵ * Re = 1.2 x lo6 . . . . . . . . . . . . . . . . . . . . . . . . . . . . . . . . . . . . . . . . . . . . . . . . . . . . . . . . . . . . . . . . . . . . . . , . . . . . " + . . . . . . . . . . . . . . . . . . . . . . . . + . . . , . . . . . . l t . . . . t i l . . . I /
1
1
I
1
a , deg.
F I G U R E l o b . cd VS. a f o r the a = 0.8-12.9 Section
51

0 Re = 6
BO'
76'
.72'
.68 '
.64 *
e .
.24
.16
.12
.08
.04
0 " -0.8
SECTION LIFT COEFFICIENT, cR
FIGURE 1Oc. cd VS. cR f o r the a = 0.8-12.9 Section
52

I
o R e = 6 x 1 0 5 0 Re =9x10⁵ * R e = 1 . 2 x 1 0 6
a, deg.
FIGURE 1Qd. c ~ , ~ , ~ vs. c1 for the a = 0.8-12.9 Section
5 3

35 I
30
a - U \. 2 5 ' U
20
1 5 '
i o .
Re = 6 x IO5 , , ..
7 , .
. t
0 Re = 9 x IO5
5 -
" " - 1.2 x lo6 = ne = I
I
i t
i t
I I
I
I I i
I
! I i I i
0.4 0.8 1.2 "
1.6
SECTION LIFT COEFFICIENT, cR
- 2.0
I
2.4 2 . 8
FIGURE 10e. cR/cd Vs. cR for the a = 0.8-12.9 Section
5 4
.. .
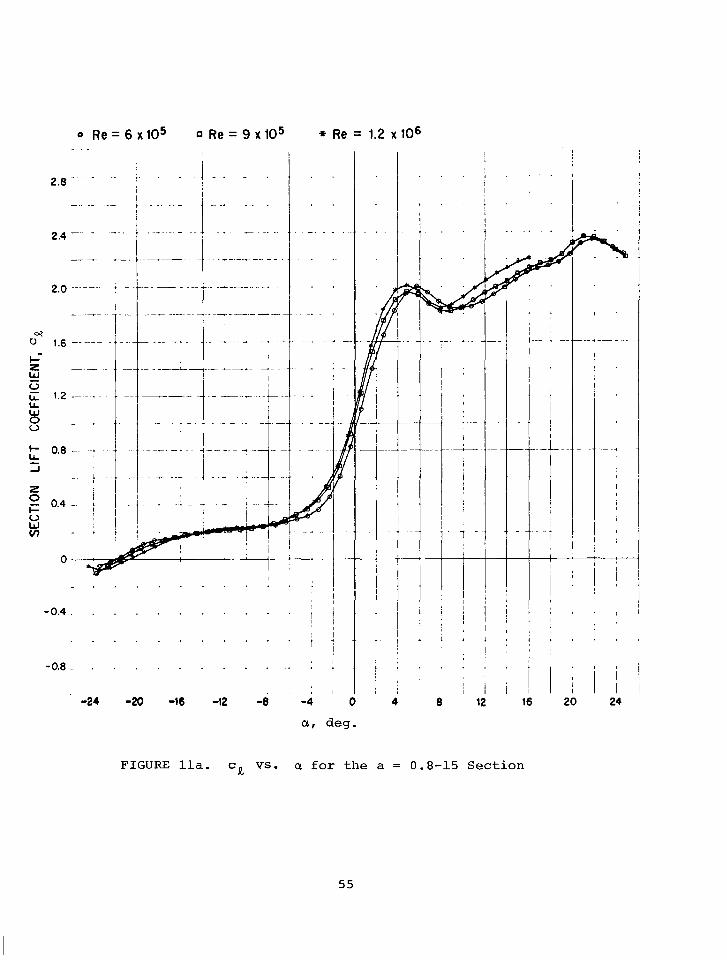
a , deg.
F I G U R E l l a . cR Vs. a fo r the a = 0.8-15 Section
55

o Re = 6 x 10⁵ El R e = 9 x lo5 * Re = 1.2 x IO6
U , deg.
F I G U R E llb. Cd VS. a for the a = 0.8-15 S e c t i o n
56
.I
.04 : I : 0 -. " I
-0.8 - 0.4 0 0.4 0.8 1.2 1.6 2.0 2.4 28 ____- - . . . I ,
SECTION LIFT COEFFICIENT, c R
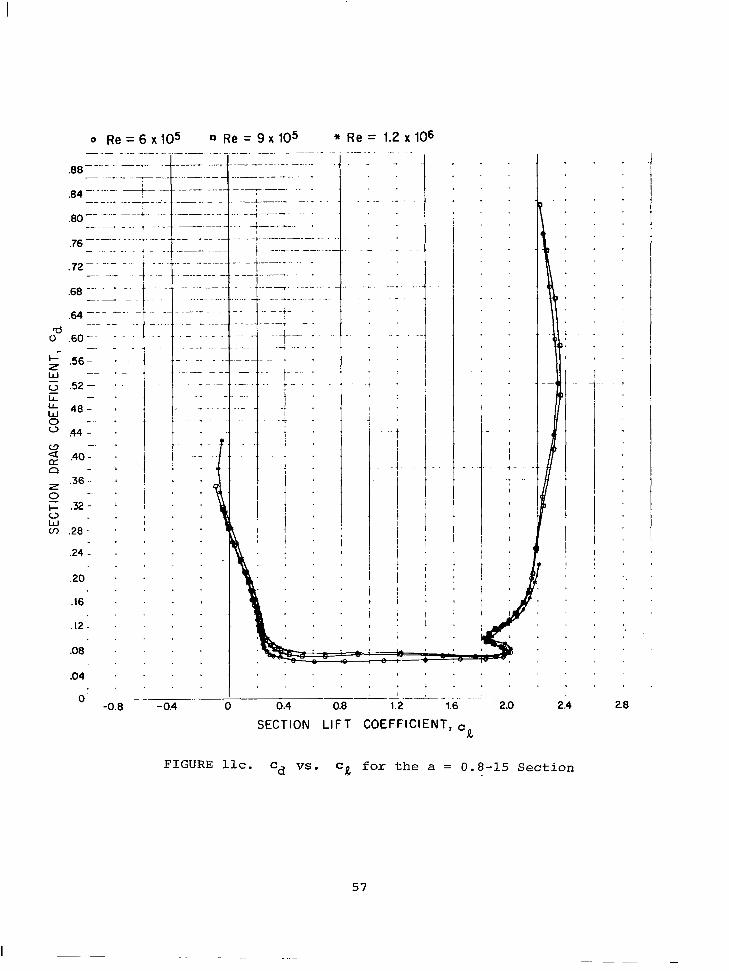
FIGURE llc. Cd vs. Cg f o r the a = 0.8-15 Section
57
. ..
o R e = 6 x 1 0 5 0 Re =9x10⁵ * R e = 1 . 2 x 1 0 6
a, deg.
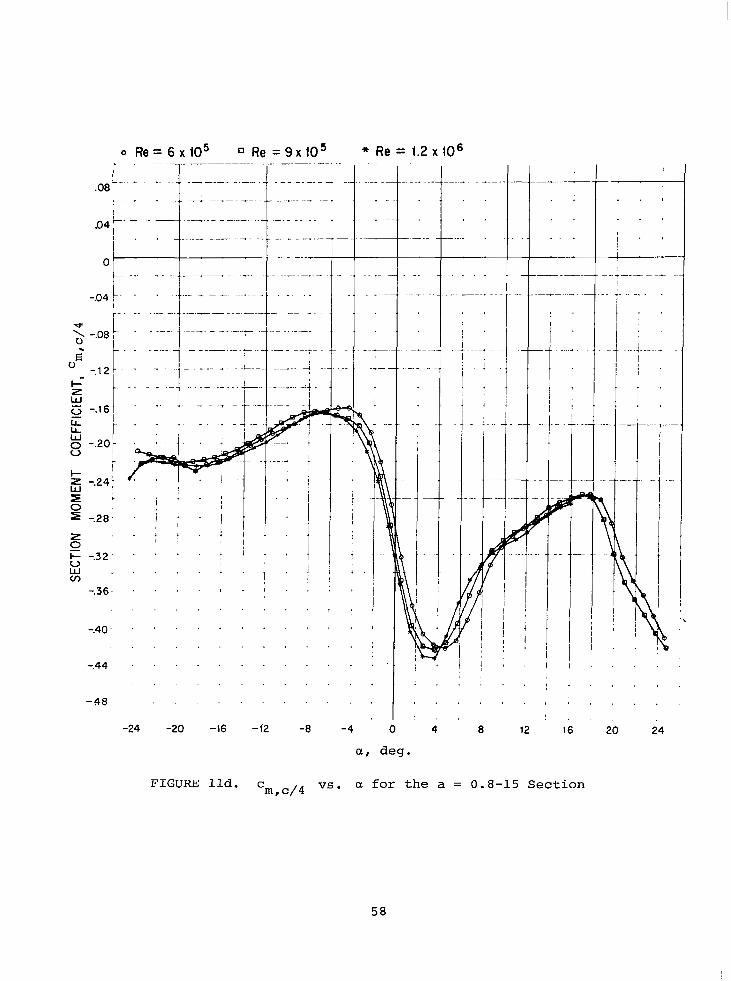
F I G U R E lld. c vs . c1 fo r t he a = 0.8-15 Sect ion m, 4 4
58

0
.. . 50
45 - .
40 -
35 -
30' -
a '* 25-
u
20 -
i s -
10.
5
R e = 6 x 1 0 5 0 R e = 9x10⁵
CI" - -0.8
i
, . i
. .
". . .
.. . "
. .
~.
1 !
i
1 j
.a " - 1.2 x 10⁶
. - .
i
"
0.4 0.8 1.2 1.6 2.0 2.4
SECTION LIFT COEFFICIENT, cR
f-
. ..
"_ .
2.8
FIGURE l l e . cR/cd VS- cR f o r t h e a = 0 .8 -15 Sec t ion
59

.. ...,, , ..
60

o R e = 6 x 1 0 5 o R e = 9 x 1 0 5 * R e = 1 . 2 ~ 1 0 ~
i
u, deg.
FIGURE 12b. cd Vs. a for the a = 0.8-18 Section
61

. I2 a .
.08
-04 . - .
0- '
-0.8 - 0.4
Re = 9 x 10⁵ * R e = 1.2 x 10⁶
. - . . . . - . .
SECTION LIFT COEFFICIENT, cR
F I G U R E 12c. Cd VS. Cg f o r the a = 0.8-18 Section
62
o Re = 6 x lo5 0 Re = 9 x lo5 * Re = 1.2 x lo6 . . . . . . . . - ... . . . " . . . . . . .
,OB ......,.. . + . . + .-.+- - I . . . . . . . . . . . . . . . . . . . . ! * . I
,-
.04 .. 1 I
...... - . - . . . . . . . . . . . . . . I
\
'0
i
+ I
I I
!
i
' 1 i
I I
i
I i
I
L
i
a
0
-.O 4
-J > -.08 . u E
-.l 2 I=
w z 9 -.16 LL IL W
0
I-
w 2 -.24 I 0
0 -.20
-.28 2
I- -.32 0 V W v,
-.36
-.40
-.44
i
ir B
0
a, deg.
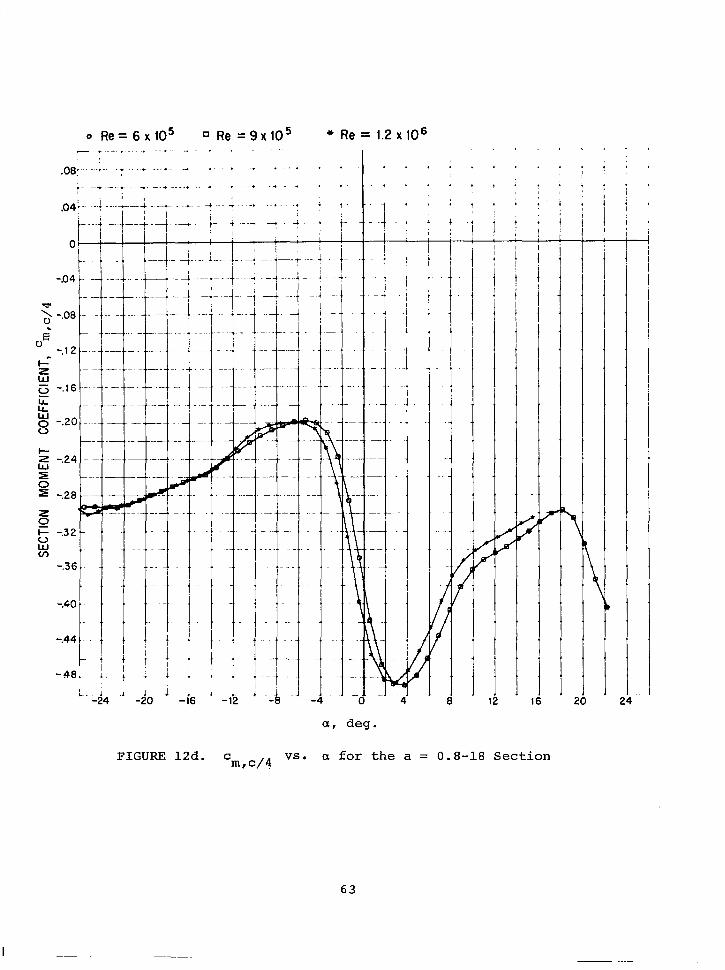
FIGURE 12d. c VS. a for t h e a = 0.8-18 S e c t i o n m, c/?
63
I

SECTION LIFT COEFFICIENT, cR
F I G U R E 12e. cR/cd V S - cR for the a = 0.8-18 Section
64

0 R e = 6 x lo5 0 Re = 9 x io5 * Re = 1.2 X 10⁶
2.8
2 A
2.0
d u 1.6
z i w u 1.2 LL W 0 0
I- 0.8 k J
z I- 2 0.4 0
v) W
C
- 0.4
- 0.8
65
o Re = 6 x IO5 R e = 9 x 1 0 5 Re = 1.2 x lo6
-24 -20 -16 -12 -8 -4 0 4 8 12 16 20 24
a, deg.
FIGURE 13b. cd vs. a for the S-14.1 Sec t ion
66

0 Re = 6 x 10⁵ 0 Re = 9 x 10⁵ * Re = 1.2 x 10⁶
-0.8 - 0.4 0 0.4 0.8 1.2 1.6 2.0 2.4 28
SECTION LIFT COEFFICIENT, ce
F I G U R E 13c. Cd vs- CR for the S-14.1 Section
67

a, deg.
FIGURE 13d. c VS. a f o r the S-14.1 Section m, c/4
68

o Re = 6 x IO5 50
45
40
35
30
Q U \ 25
U 4
2c
1:
i c
c
C -0.8 -0.4
Re = 1.2 x lo6
SECTION LIFT COEFFICIENT, cR
F I G U R E 13e. cR/cd VS- cR fo r the S-14.1 Section
69

r- '"
t
+ - i
t - i
-8 -4 0
a , deg.
4 8 12 16 20 ~i
F I G U R E 14. c R Vs. a €or t he 65-12 S e c t i o n . a s M,easured and a s P r e d i c t e d by Thin A i r f o i l Theory.
70

2 . 4
2.2-
0 0.1 0.2 0.3 0.4 0.5 0.6 0.7 0.8 0.9 1.0 0 0.1 0.2 0.3 0.4 0.5 0.6 0.7 0.8 0.9 1.0
X/C
FIGURE 15. THE THEORETICAL LOAD DISTRIBUTION FOR THE 5-14.1 MEAN LINE AT cRi = 1.9

a =0.8-12,
a = 0.8-12.9, S - 14.1 -
65- 12 a = 0.8-15
065-18
a = 0.8-18 0
~i AT MAXI MUM CY / ~ d
F I G U R E 16. Maximum cR/cd and c at Maximum c /c
for Each Section at Re = 9 x 10 R R d
5
7 2