section a Patents, utility models and microorganisms - … · Disclosure of an invention is a...
56
41 SECTION A PATENTS, UTILITY MODELS AND MICROORGANISMS SECTION A PATENTS, UTILITY MODELS AND MICROORGANISMS Over the past two decades, the patent system has undergone important changes worldwide. As a result, patent legislation and patenting behavior have become prominent public policy themes. Similarly, use of the utility model (UM) system for protecting inventions has risen in certain countries. This section provides an overview of patent and UM activ- ity worldwide to enable users to analyze and monitor the latest trends. It presents a wide range of indicators that offer insights into the functioning and use of the patent and UM systems. Disclosure of an invention is a generally recognized requirement for the granting of a patent. Where an in- vention involves microorganisms, national laws in most countries require that the applicant deposit a sample at a designated International Depositary Authority (IDA). This section also provides data on microorganisms. The first subsection on patents describes the trend in patent activity worldwide and provides analysis of filings by office and origin, patent families, PCT international applications, international collaboration, filings by field of technology, intensity of patent activity, patents in force, oppositions to patents granted, pending patents, pen- dency times, and use of patent prosecution highways. The second subsection on UMs explores trends and activity at certain offices. The microorganism subsection focuses on global deposits, followed by a breakdown of these at each IDA, where data are available. The Patent System A patent confers, by law, a set of exclusive rights to ap- plicants for inventions that meet the standards of novelty, non-obviousness and industrial applicability. It is valid for a limited period of time (generally 20 years), during which patent holders can commercially exploit their inventions on an exclusive basis. In return, applicants are obliged to disclose their inventions to the public so that others, skilled in the art, may replicate them. The patent system is designed to encourage innovation by providing innova- tors with time-limited exclusive legal rights, thus enabling them to appropriate the returns of their innovative activity. The procedures for acquiring patent rights are governed by the rules and regulations of national and regional patent offices. These offices are responsible for issuing patents, and the rights are limited to the jurisdiction of the issuing authority. To obtain patent rights, applicants must file an application describing the invention with a national or regional office. They can also file an “international application” through the Patent Cooperation Treaty (PCT), an international treaty administered by WIPO, that facilitates the acqui- sition of patent rights in multiple jurisdictions. The PCT system simplifies the process of multiple national patent filings by delaying the requirement to file a separate ap- plication in each jurisdiction in which protection is sought. However, the decision of whether or not to grant patents remains the prerogative of national or regional patent offices, and patent rights are limited to the jurisdiction of the patent granting authority.
Transcript of section a Patents, utility models and microorganisms - … · Disclosure of an invention is a...

41
Section A pAtentS, utility modelS And microorgAniSmS
section aPatents, utility models and microorganisms
Over the past two decades, the patent system has
undergone important changes worldwide. As a result,
patent legislation and patenting behavior have become
prominent public policy themes. Similarly, use of the utility
model (UM) system for protecting inventions has risen in
certain countries.
This section provides an overview of patent and UM activ-
ity worldwide to enable users to analyze and monitor the
latest trends. It presents a wide range of indicators that
offer insights into the functioning and use of the patent
and UM systems.
Disclosure of an invention is a generally recognized
requirement for the granting of a patent. Where an in-
vention involves microorganisms, national laws in most
countries require that the applicant deposit a sample at a
designated International Depositary Authority (IDA). This
section also provides data on microorganisms.
The first subsection on patents describes the trend in
patent activity worldwide and provides analysis of filings
by office and origin, patent families, PCT international
applications, international collaboration, filings by field of
technology, intensity of patent activity, patents in force,
oppositions to patents granted, pending patents, pen-
dency times, and use of patent prosecution highways.
The second subsection on UMs explores trends and
activity at certain offices. The microorganism subsection
focuses on global deposits, followed by a breakdown of
these at each IDA, where data are available.
the Patent system
A patent confers, by law, a set of exclusive rights to ap-
plicants for inventions that meet the standards of novelty,
non-obviousness and industrial applicability. It is valid for
a limited period of time (generally 20 years), during which
patent holders can commercially exploit their inventions
on an exclusive basis. In return, applicants are obliged
to disclose their inventions to the public so that others,
skilled in the art, may replicate them. The patent system
is designed to encourage innovation by providing innova-
tors with time-limited exclusive legal rights, thus enabling
them to appropriate the returns of their innovative activity.
The procedures for acquiring patent rights are governed
by the rules and regulations of national and regional
patent offices. These offices are responsible for issuing
patents, and the rights are limited to the jurisdiction of
the issuing authority. To obtain patent rights, applicants
must file an application describing the invention with a
national or regional office.
They can also file an “international application” through
the Patent Cooperation Treaty (PCT), an international
treaty administered by WIPO, that facilitates the acqui-
sition of patent rights in multiple jurisdictions. The PCT
system simplifies the process of multiple national patent
filings by delaying the requirement to file a separate ap-
plication in each jurisdiction in which protection is sought.
However, the decision of whether or not to grant patents
remains the prerogative of national or regional patent
offices, and patent rights are limited to the jurisdiction of
the patent granting authority.

42
Section A pAtentS, utility modelS And microorgAniSmS
The PCT international application process starts with the
international phase, during which an international search
and optional preliminary examination and supplementary
international search are performed, and concludes with
the national phase, during which national (or regional)
patent offices decide on the patentability of an invention
according to national law. For further details about the
PCT system, refer to: www.wipo.int/pct/en/.
the utility model system
Like a patent, a UM confers a set of rights for an inven-
tion for a limited period of time, during which UM holders
can commercially exploit their inventions on an exclusive
basis. The terms and conditions for granting UMs are dif-
ferent from those for “traditional” patents. For example,
UMs are issued for a shorter duration (7 to 10 years) and,
at most offices, applications are granted without substan-
tive examination. Like patents, the procedures for granting
UM rights are governed by the rules and regulations of
national intellectual property (IP) offices, and rights are
limited to the jurisdiction of the issuing authority.
Around 60 countries provide protection for UMs. In this
report, the UM terminology refers to UMs and other types
of protection similar to UMs. For example, “innovation
patents” in Australia and short-term patents in Ireland
are considered equivalent to UMs.
microorganisms under the budapest treaty
The Budapest Treaty on the International Recognition
of the Deposit of Microorganisms for the Purposes of
Patent Procedure plays an important role in the field of
biotechnological inventions. Disclosure of an invention
is a generally recognized requirement for the granting
of a patent.
To eliminate the need to deposit a microorganism in
each country in which patent protection is sought, the
Budapest Treaty provides that the deposit of a microor-
ganism with any IDA suffices for the purposes of patent
procedure at national patent offices of all contracting
states, and before any regional patent office that rec-
ognizes the effects of the treaty. An IDA is a scientific
institution – typically a “culture collection” – capable of
storing microorganisms. Presently, there are 40 such
authorities. Further details about the Budapest Treaty
are available at: www.wipo.int/treaties/en/registration/
budapest/.

43
Section A pAtentS, utility modelS And microorgAniSmS
a.1Patent applications and grants worldwide
A.1.1 Applications worldwide
Figures A.1.1.1 to A.1.1.3 depict the total number of patent
applications worldwide between 1995 and 2011.1 World
totals are WIPO estimates covering around 125 offices,
which include both direct national and regional applica-
tions and international applications filed through the PCT
that subsequently entered the national or regional phase.
For the first time, in 2011, the total number of patent
applications filed worldwide exceeded the two million
mark. Following a drop in 2009 (-3.6%), patent applica-
tions rebounded strongly in 2010 and 2011. For the first
time since 1995, the growth rate has exceeded seven
percent for two consecutive years (Figure A.1.1.1) – this is
noteworthy considering the fragility of the world economy.
The long-term trend shows continuous growth in ap-
plications, except for declines in 2002 and 2009. Patent
applications worldwide doubled from approximately 1.05
million in 1995 to around 2.14 million by 2011. This is
mostly due to rapid growth in applications filed in China
and the United States of America (US).
Figure A.1.1.1 Trend in patent applications worldwide
Note: World totals are WIPO estimates covering around 125 patent offices (see Data Description). These estimates include direct applications and PCT national phase entry data.
Source: WIPO Statistics Database, October 2012
. 3.6 6.6 4.6 4.5 8.6 5.9
-1.1
3.0 5.7 8.4 5.3 4.1 2.6
-3.6
7.5 7.8
1,000,000
1,500,000
2,000,000
2,500,000
Appl
icatio
ns
1995 1996 1997 1998 1999 2000 2001 2002 2003 2004 2005 2006 2007 2008 2009 2010 2011
Applications Growth rate (%)
Application year
1 Throughout this publication, “patents”
refers to patents for invention.
44
Section A pAtentS, utility modelS And microorgAniSmS
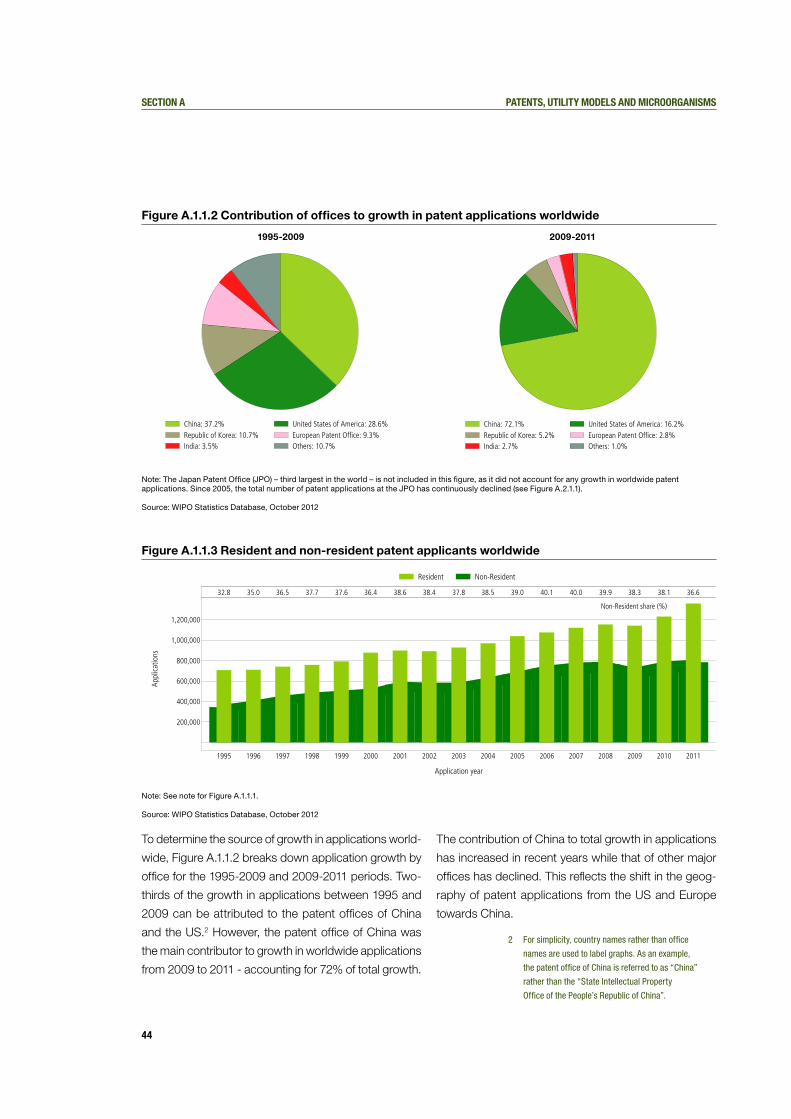
Figure A.1.1.2 Contribution of offices to growth in patent applications worldwide
1995-2009 2009-2011
Note: The Japan Patent Office (JPO) – third largest in the world – is not included in this figure, as it did not account for any growth in worldwide patent applications. Since 2005, the total number of patent applications at the JPO has continuously declined (see Figure A.2.1.1).
Source: WIPO Statistics Database, October 2012
Figure A.1.1.3 Resident and non-resident patent applicants worldwide
Note: See note for Figure A.1.1.1.
Source: WIPO Statistics Database, October 2012
To determine the source of growth in applications world-
wide, Figure A.1.1.2 breaks down application growth by
office for the 1995-2009 and 2009-2011 periods. Two-
thirds of the growth in applications between 1995 and
2009 can be attributed to the patent offices of China
and the US.2 However, the patent office of China was
the main contributor to growth in worldwide applications
from 2009 to 2011 - accounting for 72% of total growth.
The contribution of China to total growth in applications
has increased in recent years while that of other major
offices has declined. This reflects the shift in the geog-
raphy of patent applications from the US and Europe
towards China.
China: 37.2% United States of America: 28.6%Republic of Korea: 10.7% European Patent Office: 9.3%India: 3.5% Others: 10.7%
China: 72.1% United States of America: 16.2%Republic of Korea: 5.2% European Patent Office: 2.8%India: 2.7% Others: 1.0%
32.8 35.0 36.5 37.7 37.6 36.4 38.6 38.4 37.8 38.5 39.0 40.1 40.0 39.9 38.3 38.1 36.6
Non-Resident share (%)
200,000
400,000
600,000
800,000
1,000,000
1,200,000
Appl
icatio
ns
1995 1996 1997 1998 1999 2000 2001 2002 2003 2004 2005 2006 2007 2008 2009 2010 2011
Application year
Resident Non-Resident
2 For simplicity, country names rather than office
names are used to label graphs. As an example,
the patent office of China is referred to as “China”
rather than the “State Intellectual Property
Office of the People’s Republic of China”.

45
Section A pAtentS, utility modelS And microorgAniSmS
Figure A.1.1.3 provides a breakdown of patent applica-
tions worldwide by residency of the applicant. A resident
application is defined as an application filed with a patent
office by an applicant residing in the country in which that
office has jurisdiction. For example, a patent application
filed with the Japan Patent Office (JPO) by a resident of
Japan is considered a resident application for the JPO.
A non-resident application is an application filed with the
patent office of a given country by an applicant residing
in another country. For example, a patent application
filed with the United States Patent and Trademark Office
(USPTO) by an applicant residing in France is considered
a non-resident application for the USPTO. In this report,
regional patent office application data are divided into
resident and non-resident applications. An application
at a regional office is considered a resident application
if the applicant is a resident of one of its member states;
and it is considered a non-resident application if the
applicant is not a resident of one of its member states.3
The 2.14 million applications filed in 2011 consist of 1.36
million resident and 0.78 million non-resident applica-
tions (Figure A.1.1.3). Compared to 2010, both resident
and non-resident applications grew in 2011; however,
resident applications grew at a faster rate (10.4%) than
non-resident applications (3.7%). Growth in resident
applications in China accounted for around 96% of the
growth in resident applications worldwide. Growth in non-
resident applications in China and the US accounted for
70% of growth in non-resident applications worldwide.
In 2011, non-resident applications accounted for 36.6%
of applications worldwide. However, the non-resident
share in total applications has followed a downward trend
since its peak of 40.1% in 2006. This downward trend,
despite growth in non-resident applications, is due to
the substantial growth in resident applications in China.
Compared to other types of IP rights, patent applications
exhibited the highest non-resident share.4
A.1.2 Grants worldwide
The total numbers of patents granted worldwide have
recorded uninterrupted growth since 2001 (Figure A.1.2.1).
In 2011, grants worldwide approached the one million
mark, with 606,800 resident and 390,000 non-resident
grants.5 Patent grants grew by 12.3% in 2010 and 9.7% in
2011. For both years, growth in resident grants accounted
for around two-thirds of total growth.
Figure A.1.2.2 provides a breakdown of the growth of
patent grants worldwide for the periods 1995-2009 and
2009-2011. From 2009 to 2011, the number of grants is-
sued worldwide increased by 23.9%. The US accounted
for 30.4% of total growth, followed by Japan (23.9%),
China (23.3%) and the Republic of Korea (20.2%). This is
in contrast to patent application data, according to which
China accounted for 72.1% of the growth in applications
worldwide (Figure A.1.1.2). The substantial increase in the
number of grants combined with a drop in the number
of applications at the JPO has resulted in a significant
decrease in the number of pending applications undergo-
ing examination at the JPO (Figure A.11.3).
3 Resident and non-resident applications are also
known as domestic and foreign applications.
4 The non-resident share for patents was
36.6%, compared to 27.1% for trademarks
and 10.9% for industrial designs.
5 The distribution of resident and non-resident grants is
61% and 39%, respectively. The non-resident share
in total grants is slightly higher than the non-resident
share in total applications (see Figure A.1.1.3).

46
Section A pAtentS, utility modelS And microorgAniSmS
Figure A.1.2.1 Trend in patents granted worldwide
Note: World totals are WIPO estimates covering around 115 patent offices (see Data Description). These estimates include patent grants based on direct applications and PCT national phase entry data.
Source: WIPO Statistics Database, October 2012
Figure A.1.2.2 Contribution of offices to growth in patents granted worldwide
1995-2009 2009-2011
Source: WIPO Statistics Database, October 2012
. 24.2
-6.2
10.5 3.7
-9.8
3.9 4.4 10.6 0.5 1.5 19.2 2.6 0.2 4.8 12.3 9.7
200,000
400,000
600,000
800,000
1,000,000
Gra
nts
1995 1996 1997 1998 1999 2000 2001 2002 2003 2004 2005 2006 2007 2008 2009 2010 2011
Grants Growth rate (%)
Grant year
China: 32.8% Japan: 22.1%United States of America: 17.3% Republic of Korea: 11.6%Others: 16.2%
United States of America: 30.4% Japan: 23.9%China: 23.3% Republic of Korea: 20.2%Others: 2.1%

47
Section A pAtentS, utility modelS And microorgAniSmS
a.2Patent applications and grants by office
This subsection provides detailed data on patent ap-
plications and grants by office - national or regional. For
presentational purposes, country names (rather than
office names) are used to label graphs for national offices.
For example, patent data for China are labeled “China”
rather than the “State Intellectual Property Office of the
People’s Republic of China” (SIPO).
A.2.1 Applications by office
Figure A.2.1.1 shows the long-term trend in total number
of applications for the top five offices. These offices were
selected according to their 2011 totals.6 Application
numbers were stable until the early 1970s when the JPO
started seeing rapid growth in applications, a pattern
that was also observed for the USPTO from the 1980s
onwards. From 1883 to 1967, the USPTO was the lead-
ing office in the world by filings. The JPO surpassed the
USPTO in 1968 and maintained the top position until
2005. However, since 2005, the number of applications
received by the JPO has followed a downward trend
Both the European Patent Office (EPO) and the Korean
Intellectual Property Office (KIPO) have seen increases
in the numbers of applications received since the early
1980s. The volumes received by these offices are of
similar magnitude, but far below those of the JPO and
the USPTO.
SIPO has seen rapid growth in applications since 1985,
leading it to surpass both the EPO and KIPO in 2005.
Furthermore, in the past two years, SIPO has experienced
substantial growth in applications.7 As a result, SIPO
overtook the JPO in 2010 and the USPTO in 2011 to
become the largest patent office in the world.
Figure A.2.1.2 depicts the long-term trend of patent ap-
plications for five additional selected offices. Compared
to the top five offices mentioned earlier, these offices
received lower volumes of applications, but experienced
strong growth in applications over the past 10 years. For
example, the number of applications received by the pat-
ent office of India increased from approximately 11,000
in 2002 to around 42,000 in 2011. Similarly, the patent
office of the Russian Federation received around 8,000
more applications in 2011 than in 2002.
Figure A.2.1.1 Trend in patent applications for the top five offices
6 State Intellectual Property Office of China (SIPO),
United States Patent and Trademark Office (USPTO),
Japan Patent Office (JPO), Korean Intellectual Property
Office (KIPO) and European Patent Office (EPO).
7 Patent applications at SIPO grew by
24.3% in 2010 and 34.6% in 2011.
0
100,000
200,000
300,000
400,000
500,000
Appl
icatio
ns
1883 1890 1900 1910 1920 1930 1940 1950 1960 1970 1980 1990 2000 2010
year
China United States of America Japan Republic of Korea European Patent Office
Application year
Source: WIPO Statistics Database, October 2012

48
Section A pAtentS, utility modelS And microorgAniSmS
Figure A.2.1.2 Trend in patent applications for selected offices
Source: WIPO Statistics Database, October 2012
Figure A.2.1.3 shows the number of patent applications
broken down by resident and non-resident applications
for the top 20 offices. As mentioned above, SIPO (with
526,412 applications) overtook the USPTO (503,582) in
2011 to become the largest office in the world - in terms
of applications received. This is due to substantial growth
in resident applications over the past few years. The JPO
(with 342,610), KIPO (178,924) and the EPO (142,793) also
received considerable numbers of applications. Together,
the top five offices accounted for around four-fifths of the
world total, and their combined share has increased over
the last decade – from 69.5% in 1998 to 79% in 2011.8
The list of the top 20 offices consists mostly of those
located in high-income countries, but there are also a few
in middle-income countries (e.g., China and India). The
patent offices of India and the Russian Federation each
received more than 40,000 applications in 2011. Brazil
and Mexico also received a large number of applications,
the bulk of which were from non-resident applicants.
At the global level, the non-resident share of total appli-
cations filed was 36.6% (Figure A.1.1.3), but this differs
significantly among offices. The non-resident share
ranged from 98.7% (China, Hong Kong SAR) to 0.5%
(Democratic People’s Republic of Korea) in 2011. For
8 of the top 20 offices, non-resident applications ac-
counted for more than four-fifths of total applications.
The distribution of resident and non-resident applica-
tions was almost equal at the EPO and the USPTO. In
contrast, resident applications accounted for the bulk of
total applications received by KIPO, the JPO and SIPO.
Among the reported offices, SIPO had the largest drop
in its non-resident share in 2011 compared to 2010.9 The
Russian Federation and South Africa, however, had the
largest increases in non-resident shares.10
8 The 2011 shares held by the top five offices
are: SIPO (24.6%), the USPTO (23.5%), the JPO
(16%), KIPO (8.4%) and the EPO (6.7%).
9 SIPO saw growth in both resident and non-
resident applications, but growth in resident
applications outpaced growth in non-resident
applications, resulting in a decline in the non-
resident share of total applications for this office.
10 The patent offices of the Russian Federation and
South Africa saw drops in resident applications
and growth in non-resident applications,
resulting in an increase in the non-resident
share of total applications for these offices.
0
10,000
20,000
30,000
40,000
50,000
Appl
icatio
ns
1883 1890 1900 1910 1920 1930 1940 1950 1960 1970 1980 1990 2000 2010
year
India Russian Federation Canada Brazil Mexico
Application year

49
Section A pAtentS, utility modelS And microorgAniSmS
Figure A.2.1.3 Patent applications for the top 20 offices, 2011
Note: *2010 data; D.P.R. of Korea = Democratic People’s Republic of Korea
Source: WIPO Statistics Database, October 2012
Between 2010 and 2011, the majority of the offices
listed saw growth in applications. China had the largest
growth (34.6%), while the EPO (-5.4%) and Israel (-5.7%)
saw the largest declines in applications. To identify the
source of growth, Figure A.2.1.4 provides a breakdown
of total growth by resident and non-resident applica-
tions. Growth in resident applications is the main factor
behind the growth in total applications in China and the
Republic of Korea. For example, growth in resident ap-
plications accounted for 31.4 percentage points of the
34.6% increase in applications in China.
Growth in both resident and non-resident applications
contributed to the overall growth in the US. For a num-
ber of offices (e.g., Australia and South Africa), growth
in non-resident applications was the main contributor
to total growth.
Figure A.2.1.4 Contribution of resident and non-resident applications to total growth for the top 20 offices, 2010-11
Note: *Growth rate refers to 2009-2010; D.P.R. of Korea = Democratic People’s Republic of Korea
Source: WIPO Statistics Database, October 2012
Non-Resident share (%): 2011
21.0 50.8 16.1 22.9 49.6 21.0 79.1 36.0 86.5 90.7
526,412 503,582
342,610
178,924142,793
59,444 42,291 41,414 35,111 25,526
Appl
icatio
ns
China
United
State
s of A
merica
Japan
Repu
blic o
f Kore
a
Europ
ean P
atent
Office
German
yInd
ia
Russi
an Fe
derat
ion
Canad
a
Austral
ia
Office
Resident Non-Resident
Non-Resident share (%): 2011
88.1 31.1 12.5 92.4 98.7 89.2 9.5 0.5 90.9 80.2
22,686 22,259
16,754
14,055 13,493
9,794 9,7218,057 7,245 6,886
Appl
icatio
ns
.
Brazi
l *
United
King
dom
Franc
e
Mexico
China,
Hong K
ong S
AR
Singa
pore
Italy
D.P.R.
of Ko
rea *
South
Africa
Israe
l
Office
Resident Non-Resident
31.4
3.21.2 1.5
-0.7
0.13.7
1.5
-1.7-3.8
-0.1
0.4
-0.0
6.4
-5.2
2.70.6
-1.5 -0.1
2.7
-5.5
8.9
-0.7
2.2
-0.6
1.6 0.8
-4.4
0.4
14.9
1.6
-1.4 -0.9
0.8 0.8
-0.2-2.6
16.1
-1.2-4.5
Total growth rate (%): 2010 - 11
34.6 2.7 -0.6 5.2 -5.4 0.3 6.4 -2.6 -1.0 2.6 3.4 1.5 1.0 -3.6 15.3 0.2 -0.0 0.6 13.5 -5.7
0Cont
ribut
ion
to g
row
th
China
United
State
s of A
merica
Japan
Repu
blic o
f Kore
a
Europ
ean P
atent
Office
German
yInd
ia
Russi
an Fe
derat
ion
Canad
a
Austral
ia
Brazil
*
United
King
dom
Franc
e
Mexico
China,
Hong K
ong S
AR
Singa
pore
Italy
D.P.R.
of Ko
rea *
South
Africa
Israe
l
Office
Contribution by resident applications Contribution by non-resident applications

50
Section A pAtentS, utility modelS And microorgAniSmS
High-income countries are prominent in the list of top 20
offices (Figure A.2.1.3). However, a considerable amount
of IP activity also occurs in the offices of middle- and
low-income countries. Figure A.2.1.5 depicts patent
application data for selected middle- and low-income
countries.11 The patent offices of Indonesia and Ukraine
each received more than 5,200 applications in 2011. The
Eurasian Patent Organization (EAPO) and the offices of
Viet Nam and the Philippines also received large num-
bers of applications. In all offices listed, except Ukraine
and Romania, non-resident applications accounted for
the bulk of total applications. For example, non-resident
applications accounted for almost all applications filed
in Ecuador and Guatemala. However, for a number of
these offices, the contribution of resident applications to
overall growth outweighed that of non-resident applica-
tions (Figure A.2.1.6). For example, growth in resident
applications accounted for more than half of the 4.3%
overall growth in Colombia.
Figure A.2.1.5 Patent applications for offices of selected middle- and low-income countries, 2011
Note: *2010 data
Source: WIPO Statistics Database, October 2012
Figure A.2.1.6 Contribution of resident and non-resident applications to total growth for offices of selected middle- and low-income countries, 2010-11
Note: *Growth rate refers to 2009-2010.
Source: WIPO Statistics Database, October 2012
Non-Resident share (%): 201190.7 49.6 84.9 91.6 94.2 72.0 90.6 2.7 83.9 64.95,838
5,253
3,560 3,5603,196
2,209 1,9531,463
1,049 990
Appl
icatio
ns
Indon
esia
Ukraine
Euras
ian Pa
tent O
rganiz
ation
Viet N
am
Philip
pines
Egyp
t
Colombia
Roman
ia
Morocco
Saud
i Arab
ia
Office
Resident Non-Resident
Non-Resident share (%): 201190.3 89.5 99.4 51.1 90.0 98.8 89.5 60.9 82.3 95.1
953897
694
460400
331 306197
11361
Appl
icatio
ns
.
P
akist
an
Algeria
Ecuad
or *
Sri La
nka *
Jorda
n
Guatem
ala
Bang
ladesh
Keny
a *
Jamaic
a
Madag
ascar
Office
Resident Non-Resident
0.4 3.1 1.8
-2.9 -0.2-0.4
1.9 5.1 0.5
-6.3
0.6
-1.5
2.7 1.7 3.0 0.2 1.6
-0.2
6.30.0
-2.0-10.9
2.29.1
-0.3
3.3 5.7 8.7
-1.1
-14.6
-0.8-12.3 -9.9
-0.6
17.0
-1.8
3.8
-31.4
-14.0
55.8
Total growth rate (%): 2010 - 113.5 -1.1 -0.6 6.9 -5.8 -0.9 4.3 3.2 1.5 6.3 -12.9 11.3 3.0 14.4 -15.6 -13.1 -10.5 15.2 -27.6 41.9
0
Cont
ribut
ion
to g
row
th
Indon
esia
Ukraine
Viet N
am
Euras
ian Pa
tent O
rganiz
ation
Philip
pines
Egyp
t
Colombia
Roman
ia
Morocco
Saud
i Arab
ia
Pakis
tan
Algeria
Ecuad
or *
Sri La
nka *
Jorda
n
Guatem
ala
Bang
ladesh
Keny
a *
Jamaic
a
Madag
ascar
Office
Contribution by resident applications Contribution by non-resident applications
11 The selected offices are from different
world regions. Data for all available offices
are presented in the statistical annex.

51
Section A pAtentS, utility modelS And microorgAniSmS
Figure A.2.1.7 shows the distribution of patent applica-
tions worldwide and that of gross domestic product (GDP)
by income group.12 The share of high-income countries
in patent applications worldwide declined from 85.8% in
2001 to 67% in 2011. Despite the decline, they accounted
for two-thirds of the world total, which is substantially
higher than their GDP share (54.6%).
Over the past decade, China saw rapid growth in both pat-
ent applications and GDP. This resulted in a considerable
increase in the share of upper middle-income countries
in the world total for both patents and GDP. Furthermore,
patent applications grew more rapidly than did economic
output in China, so that the gap between patent ap-
plications and GDP shares of the upper middle-income
countries narrowed considerably between 2001 and 2011.
Figure A.2.1.7 Patent applications and GDP share by income group
Patent applications
2001 2011
GDP 2001 2011
Source: WIPO Statistics Database and World Bank, October 2012
High-income: 85.8% Upper middle-income: 11.7%Lower middle-income: 2.3% Low-income: 0.1%
High-income: 67.0% Upper middle-income: 29.8%Lower middle-income: 3.2% Low-income: 0.0%
High-income: 64.8% Upper middle-income: 24.8%Lower middle-income: 9.5% Low-income: 0.9%
High-income: 54.6% Upper middle-income: 32.2%Lower middle-income: 12.1% Low-income: 1.2%
12 The income groups correspond to those used by the
Word Bank. Economies are divided according to 2011
gross national income (GNI) per capita, calculated
using the World Bank Atlas method. The groups are:
low-income (US$1,025 or less); lower middle-income
(US$1,026-$4,035); upper middle-income (US$4,036-
$12,475); and high-income (US$12,476 or more).

52
Section A pAtentS, utility modelS And microorgAniSmS
Figure A.2.1.8 Resident and non-resident patent applications worldwide by income, 2011
Source: WIPO Statistics Database, October 2012
In both high-income and upper middle-income countries,
resident applications accounted for the majority of total
applications (Figure A.2.1.8). In contrast, resident applica-
tions accounted for around one-fifth of total applications
in lower middle-income countries. For high-income
countries, the non-resident share increased from around
35% in 2001 to 38% in 2011, while that of upper middle-
income countries declined from 60% to 26.8%. This is
due to the substantial growth in resident applications in
China. Excluding data for China, the non-resident share
for upper middle-income countries was around 65% in
2001 and 58% in 2011.
A.2.2 Grants by office
The JPO (238,323) issued the largest number of patents
in 2011, followed by the USPTO (224,505). The number of
patents granted by SIPO grew considerably in absolute
terms (+37,003) in 2011, but its rank in third position did
not change.13 Brazil, one of the top 20 offices in terms
of applications, does not, however, appear in the top 20
list for grants. Of the top 20 offices, India showed the
largest difference between its numbers of applications
and grants. In contrast, application and grant numbers
for Mexico were of similar magnitude.14
The combined shares of the top five offices for applica-
tions and grants worldwide were nearly equal (around
79%). However, when looking at the JPO’s and SIPO’s
shares in total applications and grants worldwide, large
differences emerge. SIPO accounted for 24.6% of appli-
cations but only 17.3% of grants worldwide, but the JPO
witnessed an opposite trend, with 16% of applications
and 24% of grants worldwide.
The non-resident share ranged from 0.7% in the
Democratic People’s Republic of Korea to 98.5% in
China, Hong Kong SAR. For a number of offices, the
non-resident share exceeded 80%. However, for most
offices, non-resident application and grant shares (Figure
A.2.1.3) were of similar magnitude. Exceptions include
China, Germany and the United Kingdom (UK), which
all have higher non-resident shares for grants than for
applications.
Non-Resident share: 2011
38.2 26.8 78.8 89.5
0
25
50
75
100
Dist
ribut
ion
of N
on-R
esid
ent a
pplic
atio
ns
High-income Upper middle-income Lower middle-income Low-incomeOffice
Resident Non-Resident
13 In absolute numbers, SIPO had the largest
increase in patent grants (+37,003), followed
by KIPO (+25,877) and the JPO (+15,630).
14 In 2011, the patent office of India received 42,291
applications and issued 5,168 patents, while the
patent office of Mexico received 14,055 applications
and issued 11,485 patents. However, care should
be exercised in making direct comparisons
between application and grant data, due to the
time lag between application and grant dates.

53
Section A pAtentS, utility modelS And microorgAniSmS
Figure A.2.2.1 Patent grants for the top 20 offices, 2011
Note: *2010 data; D.P.R. of Korea = Democratic People’s Republic of Korea
Source: WIPO Statistics Database, October 2012
Figure A.2.2.2 Contribution of resident and non-resident patent grants to total growth for the top 20 offices, 2010-11
Note: *2010 data
Source: WIPO Statistics Database, October 2012
The majority of the top 20 offices issued more patents in
2011 than in 2010 (Figure A.2.2.2). In percentage terms,
KIPO had the highest growth rate (37.6%), followed by
Israel (37.1%) and Singapore (33.9%).15
For all offices, except the JPO, KIPO and SIPO, the in-
crease in non-resident grants was the main contributor
to each office’s growth. For example, the increases in
Australia, Mexico and Singapore were almost entirely
driven by growth in non-resident grants. Italy saw a
substantial drop in patent grants (-60.4%) in 2011. India
also issued fewer patents in 2011 than in 2010 (-27.6%),
due to declines in both resident and non-resident grants.
Figure A.2.2.1 illustrates that high-income countries are
prominent in the list of top 20 offices for patent grants.
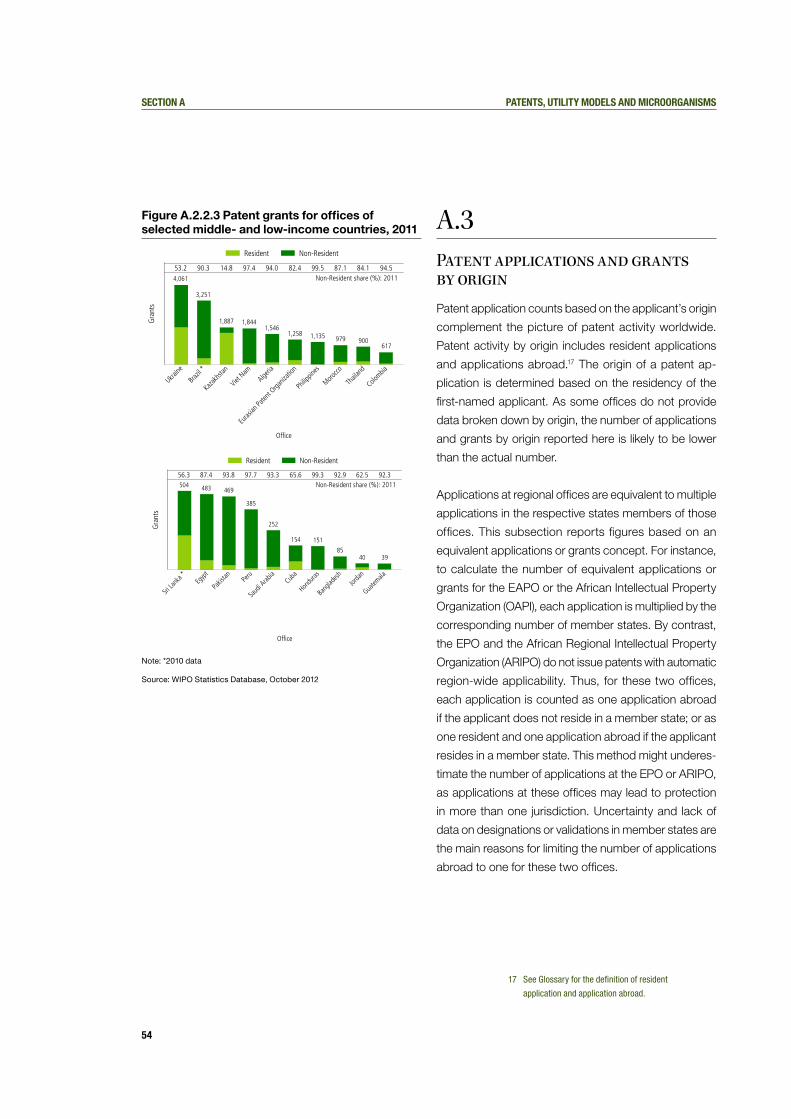
Figure A.2.2.3 presents grant data for offices of selected
middle- and low-income countries.16 Among these coun-
tries, Ukraine issued the largest number of patents, fol-
lowed by Brazil, Kazakhstan and Viet Nam. In all offices,
except Kazakhstan, non-resident grants accounted for
the largest share in total grants. The majority of reported
offices issued more patents in 2011 than in 2010.
Non-Resident share (%): 2011
17.1 51.6 34.7 23.7 47.5 32.2 89.6 92.9 30.0 97.9
238,323224,505
172,113
94,720
62,112
29,999 20,762 17,877 11,719 11,485
Gra
nts
Japan
United
State
s of A
merica
China
Repu
blic o
f Kore
a
Europ
ean P
atent
Office
Russi
an Fe
derat
ion
Canad
a
Austral
ia
German
y
Mexico
Office
Resident Non-Resident
Non-Resident share (%): 2011
13.7 58.3 11.0 0.7 91.9 89.3 85.0 85.6 98.5 93.1
10,213
7,1736,380 6,290 5,949
5,296 5,168 5,104 5,050 4,710Gra
nts
.
Fran
ce
United
King
dom
Italy
D.P.R.
of Ko
rea *
Singa
pore
South
Africa
India
Israe
l
China,
Hong K
ong S
AR
New Ze
aland
Office
Resident Non-Resident
4.7 2.4 0.4 1.8
24.1
3.3
30.3
7.3 3.2 3.6
-4.2
3.2 1.37.3
0.6
22.2
-10.4-3.9
0.2
22.0
0.4 2.812.0
16.3
-54.5
-5.9
1.9 0.5 2.6
31.3
-4.8
4.1
-6.1
-21.5
14.023.0
-0.3-5.3 -1.6
9.9
Total growth rate (%): 2010 - 117.0 2.2 27.4 37.6 6.9 -1.1 8.6 22.8 -14.3 22.2 3.2 28.2 -60.4 2.3 33.9 -0.7 -27.6 37.1 -5.7 8.4
0
Cont
ribut
ion
to g
row
th
Japan
United
State
s of A
merica
China
Repu
blic o
f Kore
a
Europ
ean P
atent
Office
Russi
an Fe
derat
ion
Canad
a
Austral
ia
German
y
Mexico
Franc
e
United
King
dom
Italy
D.P.R.
of Ko
rea *
Singa
pore
South
Africa
India
Israe
l
China,
Hong K
ong S
AR
New Ze
aland
Office
Contribution by resident applications Contribution by non-resident applications
15 For absolute numbers, see footnote 13.
16 The selected offices are from different
world regions. Data for all available offices
are presented in the statistical annex.
54
Section A pAtentS, utility modelS And microorgAniSmS
Figure A.2.2.3 Patent grants for offices of selected middle- and low-income countries, 2011
Note: *2010 data
Source: WIPO Statistics Database, October 2012
a.3 Patent applications and grants by origin
Patent application counts based on the applicant’s origin
complement the picture of patent activity worldwide.
Patent activity by origin includes resident applications
and applications abroad.17 The origin of a patent ap-
plication is determined based on the residency of the
first-named applicant. As some offices do not provide
data broken down by origin, the number of applications
and grants by origin reported here is likely to be lower
than the actual number.
Applications at regional offices are equivalent to multiple
applications in the respective states members of those
offices. This subsection reports figures based on an
equivalent applications or grants concept. For instance,
to calculate the number of equivalent applications or
grants for the EAPO or the African Intellectual Property
Organization (OAPI), each application is multiplied by the
corresponding number of member states. By contrast,
the EPO and the African Regional Intellectual Property
Organization (ARIPO) do not issue patents with automatic
region-wide applicability. Thus, for these two offices,
each application is counted as one application abroad
if the applicant does not reside in a member state; or as
one resident and one application abroad if the applicant
resides in a member state. This method might underes-
timate the number of applications at the EPO or ARIPO,
as applications at these offices may lead to protection
in more than one jurisdiction. Uncertainty and lack of
data on designations or validations in member states are
the main reasons for limiting the number of applications
abroad to one for these two offices.
Non-Resident share (%): 201153.2 90.3 14.8 97.4 94.0 82.4 99.5 87.1 84.1 94.54,061
3,251
1,887 1,8441,546
1,258 1,135 979 900617
Gra
nts
Ukraine
Brazil
*
Kazak
hstan
Viet N
amAlge
ria
Euras
ian Pa
tent O
rganiz
ation
Philip
pines
Morocco
Thail
and
Colombia
Office
Resident Non-Resident
Non-Resident share (%): 201156.3 87.4 93.8 97.7 93.3 65.6 99.3 92.9 62.5 92.3504 483 469
385
252
154 151
8540 39
Gra
nts
.
Sri L
anka
*Eg
ypt
Pakis
tan Peru
Saud
i Arab
iaCub
a
Hondu
ras
Bang
ladesh
Jorda
n
Guatem
ala
Office
Resident Non-Resident
17 See Glossary for the definition of resident
application and application abroad.

55
Section A pAtentS, utility modelS And microorgAniSmS
A.3.1 Applications and grants by origin
Figure A.3.1.1 presents equivalent patent application
data for the top 20 origins. Residents of Japan filed
the largest number of applications across the world
(472,417) in 2011.18 China, which saw a 41.3% increase
in 2011, overtook the US to become the second largest
country for origin counts.19 The ranking of the top three
origins is different than that for offices. In terms of of-
fices, China ranked first, but it ranked second for origin
data. In contrast, Japan ranked third for office data, but
first for origin data. Large differences in the numbers of
applications abroad for China and Japan partly explain
the differences in the ranking between office and origin
data (See Figure A.3.2.1). The majority of origins filed
fewer than 50,000 applications in 2011. China, India and
the Russian Federation are the only three middle-income
origins in the top 20 list.
Residents of China filed fewer than 20,000 applica-
tions abroad (i.e., 4.5% of all applications worldwide). In
contrast, Japan and the US each filed around 184,000
applications abroad. All European countries, Australia,
Canada, and Israel filed a high proportion of their total
applications abroad.20
Among the top 20 origins, most countries saw growth
in applications between 2010 and 2011. China was the
only country with double-digit growth, due mostly to
growth in resident applications. Finland and Switzerland
saw considerable declines in applications. In the case of
Finland, the drop in applications abroad was the main
contributor to the overall decline. As for Switzerland, the
fall in resident applications was the main factor for the
overall decrease.
18 The sum of resident applications
and applications abroad.
19 If the present trend continues, China will soon
overtake Japan to become the top origin.
20 For these offices, shares of applications filed abroad
ranged from 87% for Israel to 57% for Germany.
Figure A.3.1.1 Equivalent patent applications for the top 20 origins, 2011
Source: WIPO Statistics Database, October 2012
Growth rate (%): 2010-11
0.9 41.3 -0.1 4.9 -0.4 -0.4 -1.8 -4.9 -3.0 -4.3
472,417435,608 432,298
187,454 172,764
65,349 49,938 37,477 32,376 31,433
Appl
icatio
nsJap
anChin
a
United
State
s of A
merica
Repu
blic o
f Kore
a
German
yFra
nce
United
King
dom
Switz
erlan
d
Netherl
ands
Russi
an Fe
derat
ion
Origin
Resident Abroad
Growth rate (%): 2010-11
-0.8 1.3 -4.3 5.8 3.0 -11.7 -3.2 3.0 -1.8 -1.0
27,67924,528
21,480
15,717
11,565 11,516 11,427 11,393 11,348 10,821Appl
icatio
ns
.
It
aly
Canad
a
Swed
enInd
ia
Denmark
Finlan
d
Belgi
umAust
ria
Austral
iaIsr
ael
Origin
Resident Abroad

56
Section A pAtentS, utility modelS And microorgAniSmS
Figure A.3.1.2 Equivalent patent grants for the top 20 origins, 2011
Note: *2010 data; D.P.R. of Korea = Democratic People’s Republic of Korea
Source: WIPO Statistics Database, October 2012
For the majority of origins, equivalent patent grants
show similar trends to those for equivalent applications.
However, the applications and grants profiles of China
and the US differ significantly. These two origins had
similar numbers of applications (Figure A.3.1.1), but there
was a substantial difference in their numbers of grants
received. Residents of China received 118,185 equivalent
grants in 2011, compared to 201,158 for US residents.
However, care should be exercised when comparing
application and grant data as it takes time (several
years) to process applications. Furthermore, in recent
years there has been substantial growth in applications
filed by residents of China. Once those applications are
processed, China’s grant total will increase.
For all origins reported – except Finland, Italy and the
Russian Federation – the number of equivalent grants
increased between 2010 and 2011.21 Thirteen of these
20 origins were granted the majority of their patents
by foreign patent offices.22 Residents of Denmark and
Switzerland obtained more than four-fifths of their total
patents from offices other than their national patent office.
A.3.2 Applications abroad by origin
The volume of filings abroad reflects, to some extent,
the impact of globalization on IP protection strategies.
Companies that expand operations to foreign countries
might have a business need to seek IP protection in those
countries.23 Therefore, patent applications abroad provide
some indication of how companies are expanding their
businesses into overseas markets. Japan and the US, by
far, filed the largest number of applications abroad – each
filing more than 184,000 applications in 2011.
21 These three origins saw drops in equivalent
applications and grants in 2011.
22 Eleven of the 13 origins are members of the EPO – a
regional office. Patents granted by the EPO are
counted as grants abroad, hence EPO members
have a high share in total grants abroad.
23 It goes without saying that expanding operations
abroad does not necessarily mean that companies
will seek additional patent rights. For example,
companies might rely on other types of IP protection,
or IP protection might not be necessary at all
due to the nature of the business activity.
Growth rate (%): 2010-11
6.1 5.0 39.3 28.5 2.3 3.8 -6.2 8.6 6.1 -34.8
304,604
201,158
118,15897,714
72,346
34,766 22,177 18,275 17,564 16,212
Gra
nts
Japan
United
State
s of A
merica
China
Repu
blic o
f Kore
a
German
yFra
nce
Russi
an Fe
derat
ion
United
King
dom
Switz
erlan
dIta
ly
Origin
Resident Abroad
Growth rate (%): 2010-11
3.9 2.6 6.4 2.1 7.7 -9.8 3.5 6.2 5.6 7.9
14,924
10,905 10,617
6,263 6,162 5,827 5,217 5,068 4,855 4,260
Gra
nts
.
Neth
erlan
ds
Swed
en
Canad
a
D.P.R.
of Ko
rea *
Austral
ia
Finlan
d
Belgi
umSp
ain
Austria
Denmark
Origin
Resident Abroad

57
Section A pAtentS, utility modelS And microorgAniSmS
Figure A.3.2.1 Applications abroad for the top origins
Source: WIPO Statistics Database, October 2012
For the resident applications measure, China ranked first;
however, for the applications abroad measure it ranked
below Japan, the Republic of Korea, the US and several
larger European countries. All reported countries saw
substantial growth in applications abroad between 1995
and 2011. However, a closer look at the data for 2009
to 2011 reveals the negative impact of the economic
downturn. All top origins, except Austria and China,
saw decreases in applications abroad at the start of the
economic downturn in 2008. For example, between
2008 and 2009, applications abroad for Japan, the US
and Germany – the top three origins – declined by 6.4%,
12.3% and 6.9%, respectively. However, the 2011 data
show that there are signs of recovery. The top five origins,
except the US, filed more applications abroad in 2011
than in 2008 (2008 being the peak year).
A.3.3 Applications by office and origin
To provide a detailed picture of patent flows across coun-
tries, Tables A.3.3.1 and A.3.3.2 present a breakdown
of patent application data by origin (source) and office
(destination). Data are reported for top offices and top
origins.24 When deciding where to seek patent protection,
applicants consider factors such as market size and geo-
graphical proximity. At larger patent offices (e.g., China,
Germany, Japan and the Republic of Korea), resident
applicants accounted for more than three-quarters of
total applications. The US is an exception, where there
was an equal distribution between resident and non-
resident applications.
Excluding resident filings, applications of US origin ac-
counted for the largest shares of total patent applications
in all reported offices, except China, France and the
Republic of Korea. At the patent offices of China and
the Republic of Korea, the largest shares belonged to
residents of Japan, while in France, German residents
accounted for the largest share. In a number of offices,
residents of the US filed more applications than domestic
applicants. For example, at the patent office of India,
residents of the US accounted for a larger share of total
applications than residents of India. A similar profile is
visible at the offices of Australia, Canada, Mexico and
Singapore. Residents of Japan accounted for the largest
share of non-resident applications at the patent offices
of China, the Republic of Korea and the US. The share
of China at most offices was less than 2%, reflecting the
relatively small number of applications that residents of
China file abroad.
24 “Origin data” refers to simple application
count rather than equivalent application
count as presented in Figure A.3.1.1.
Growth rate (%): 2010-11
3.7 -3.3 0.4 5.5 -0.7 -0.5 -5.0 -2.9 29.7 0.6
184,837 184,548
99,548
49,42041,062
29,831 29,475 24,181 19,779 19,774
Appl
icatio
ns a
broa
d
Japan
United
State
s of A
merica
German
y
Repu
blic o
f Kore
aFra
nce
United
King
dom
Switz
erlan
d
Netherl
ands
China
Canad
a
Origin
1995 2011
Growth rate (%): 2010-11
-4.9 -0.3 -0.2 -2.0 -3.8 -14.3 5.5 8.6 14.4 -0.2
15,86614,903
9,461 8,965 8,797 8,295 8,193 7,505 6,8765,718
Appl
icatio
ns a
broa
d
.
Swed
en Italy
Israe
l
Austral
ia
Belgi
umFin
land
Denmark
Austria
India
Spain
Origin
1995 2011

58
Section A pAtentS, utility modelS And microorgAniSmS
Table A.3.3.1 Number of patent applications by office and origin: top offices and origins, 2011
OriginOffice
cn US JP Kr EP DE In rU cA AU Gb fr MX HK SG
Australia 621 3,767 464 167 837 16 341 70 462 2,383 109 8 123 172 188
Austria 598 1,849 288 190 1,734 836 269 195 243 212 35 17 62 54 34
Belgium 592 2,115 457 263 1,994 53 323 192 324 281 241 76 180 162 88
Canada 1,033 11,975 751 466 2,346 35 583 197 4,754 548 203 8 278 353 126
China 415,829 10,545 1,401 752 2,548 91 976 393 352 383 118 71 203 544 167
Denmark 781 1,974 418 187 1,798 24 411 149 312 287 76 8 169 124 75
Finland 964 2,551 319 334 1,571 116 451 225 273 172 52 4 62 75 40
France 3,973 10,563 3,447 1,753 9,632 230 1,669 1,033 1,793 806 127 14,655 546 312 422
Germany 11,422 27,935 6,773 3,598 26,230 46,986 4,097 2,302 2,723 1,698 372 590 1,252 931 667
India 202 4,548 170 109 473 12 8,841 56 141 169 24 2 80 50 55
Israel 532 5,436 413 212 1,053 15 330 97 308 240 96 3 88 118 83
Italy 1,245 4,282 753 358 3,982 109 700 409 498 298 29 61 241 196 99
Japan 39,231 85,184 287,580 15,234 20,568 3,001 5,048 1,931 1,794 1,691 616 128 759 1,729 1269
Netherlands 2,999 4,418 2,374 1,045 5,610 65 1,513 989 666 606 203 20 445 188 173
Republic of Korea 8,129 27,289 5,007 138,034 4,889 999 737 318 338 339 143 39 183 86 105
Russian Federation 120 719 38 31 168 39 55 26,495 47 16 4 18 13 23 8
Sweden 1,730 4,140 1,342 573 3,610 232 854 340 472 441 77 21 206 243 149
Switzerland 2,665 4,086 2,139 1,073 6,405 853 1,652 803 1,326 1,111 242 213 820 732 516
United Kingdom 1,876 11,279 1,739 737 4,764 111 1,142 404 1,286 1,214 15,343 69 403 450 388
United States of America
28,457 247,750 23,414 12,139 34,987 4,499 10,575 3,707 15,342 11,002 2,525 417 6,182 5,901 3594
Other / Unknown 3413 31177 3323 1669 7594 1122 1724 1109 1657 1629 1624 326 1760 1050 1548
Total 526,412 503,582 342,610 178,924 142,793 59,444 42,291 41,414 35,111 25,526 22,259 16,754 14,055 13,493 9,794
Note: CN (China), US (United States of America), JP (Japan), KR (Republic of Korea), EP (European Patent Office), DE (Germany), IN (India), RU (Russian Federation), CA (Canada), AU (Australia), GB (United Kingdom), FR (France), MX (Mexico), HK (China, Hong Kong (SAR)) and SG (Singapore)
Source: WIPO Statistics Database, October 2012
Table A.3.3.2 Distribution of patent applications by office and origin: top offices and top origins, 2011
OriginOffice
cn US JP Kr EP DE In rU cA AU Gb fr MX HK SG
Australia 0.1 0.7 0.1 0.1 0.6 0.0 0.8 0.2 1.3 9.3 0.5 0.0 0.9 1.3 1.9
Austria 0.1 0.4 0.1 0.1 1.2 1.4 0.6 0.5 0.7 0.8 0.2 0.1 0.4 0.4 0.3
Belgium 0.1 0.4 0.1 0.1 1.4 0.1 0.8 0.5 0.9 1.1 1.1 0.5 1.3 1.2 0.9
Canada 0.2 2.4 0.2 0.3 1.6 0.1 1.4 0.5 13.5 2.1 0.9 0.0 2.0 2.6 1.3
China 79.0 2.1 0.4 0.4 1.8 0.2 2.3 0.9 1.0 1.5 0.5 0.4 1.4 4.0 1.7
Denmark 0.1 0.4 0.1 0.1 1.3 0.0 1.0 0.4 0.9 1.1 0.3 0.0 1.2 0.9 0.8
Finland 0.2 0.5 0.1 0.2 1.1 0.2 1.1 0.5 0.8 0.7 0.2 0.0 0.4 0.6 0.4
France 0.8 2.1 1.0 1.0 6.7 0.4 3.9 2.5 5.1 3.2 0.6 87.5 3.9 2.3 4.3
Germany 2.2 5.5 2.0 2.0 18.4 79.0 9.7 5.6 7.8 6.7 1.7 3.5 8.9 6.9 6.8
India 0.0 0.9 0.0 0.1 0.3 0.0 20.9 0.1 0.4 0.7 0.1 0.0 0.6 0.4 0.6
Israel 0.1 1.1 0.1 0.1 0.7 0.0 0.8 0.2 0.9 0.9 0.4 0.0 0.6 0.9 0.8
Italy 0.2 0.9 0.2 0.2 2.8 0.2 1.7 1.0 1.4 1.2 0.1 0.4 1.7 1.5 1.0
Japan 7.5 16.9 83.9 8.5 14.4 5.0 11.9 4.7 5.1 6.6 2.8 0.8 5.4 12.8 13.0
Netherlands 0.6 0.9 0.7 0.6 3.9 0.1 3.6 2.4 1.9 2.4 0.9 0.1 3.2 1.4 1.8
Republic of Korea 1.5 5.4 1.5 77.1 3.4 1.7 1.7 0.8 1.0 1.3 0.6 0.2 1.3 0.6 1.1
Russian Federation 0.0 0.1 0.0 0.0 0.1 0.1 0.1 64.0 0.1 0.1 0.0 0.1 0.1 0.2 0.1
Sweden 0.3 0.8 0.4 0.3 2.5 0.4 2.0 0.8 1.3 1.7 0.3 0.1 1.5 1.8 1.5
Switzerland 0.5 0.8 0.6 0.6 4.5 1.4 3.9 1.9 3.8 4.4 1.1 1.3 5.8 5.4 5.3
United Kingdom 0.4 2.2 0.5 0.4 3.3 0.2 2.7 1.0 3.7 4.8 68.9 0.4 2.9 3.3 4.0
United States of America
5.4 49.2 6.8 6.8 24.5 7.6 25.0 9.0 43.7 43.1 11.3 2.5 44.0 43.7 36.7
Other / Unknown 0.6 6.2 1.0 0.9 5.3 1.9 4.1 2.7 4.7 6.4 7.3 1.9 12.5 7.8 15.8
Total 100.0 100.0 100.0 100.0 100.0 100.0 100.0 100.0 100.0 100.0 100.0 100.0 100.0 100.0 100.0
Note: See note for Table A.3.3.1
Source: WIPO Statistics Database, October 2012

59
Section A pAtentS, utility modelS And microorgAniSmS
a.4Patent Families
Applicants often file patent applications in multiple juris-
dictions, leading to some inventions being counted more
than once in patent counts. To account for this, WIPO has
developed indicators related to so-called patent families,
defined as a set of patent applications interlinked by – or
by a combination of – priority claim, PCT national phase
entry, continuation, continuation-in-part, internal priority,
addition or division.25 A special subset of patent families
consists of foreign-oriented patent families, which include
only patent families having at least one filing office that
is different from the office of the applicant’s country of
origin.26 By contrast, domestic patent families are patent
families having only one filing office that is the same as
the office of the first-named applicant’s country of origin.
A.4.1 Patent families
Figure A.4.1.1 shows the number of patent families
worldwide for 1995-2009.27 Between 1995 and 2008, the
total number of patent families continuously increased,
followed by a 4.7% drop in 2009. The drop in the total
number of patent families in 2009 coincided with the
economic downturn, and was consistent with the drop
in patent applications worldwide (Figure A.1.1.1).
Figure A.4.1.1 Trends in patent families
Note: The patent family dataset includes only published patent applications. Unpublished patent applications (e.g., patent applications withdrawn before publication) and provisional applications are not included in the patent family count. WIPO’s patent family dataset has the following features: (1) each “first-filed” patent application forms a patent family; all subsequent patent filings are added to that family; (2) one patent application may belong to more than one patent family due to the existence of multiple priority claims. “Patent family” is defined as a set of patent applications interlinked by – or by a combination of – priority claim, PCT national phase entry, continuation, continuation-in-part, addition or division. “Foreign-oriented patent family” is defined as a patent family having at least one filing office that is different from the office of the first-named applicant’s country of origin.
Sources: WIPO Statistics Database and EPO PATSTAT Database, October 201226 Some foreign-related patent families contain
only one filing office, as applicants may choose
to file directly with a foreign office. For example,
if a Canadian applicant files a patent application
directly with the USPTO (without previously filing
with the patent office of Canada), that application,
and applications filed subsequently with the
USPTO, form a foreign-oriented patent family.
27 Patent family data are based on published
applications. There is a minimum delay of 18
months between the application and publication
dates. For this reason, 2009 is the latest available
year for which complete patent family data exist.
4.2 4.1 5.8 6.2 4.5 10.7 4.6 1.5 4.7 2.3 4.8 2.7 2.4 2.8
-4.7
500,000
750,000
1,000,000
Pate
nt fa
mili
es
1995 1996 1997 1998 1999 2000 2001 2002 2003 2004 2005 2006 2007 2008 2009
Patent families Growth rate (%)
Application year
25 In this publication, patent families include
only those families associated with patent
applications for inventions and exclude families
associated with utility model applications.

60
Section A pAtentS, utility modelS And microorgAniSmS
Figure A.4.1.2 Domestic and foreign-oriented patent families for the top origins, 2005-09
Sources: WIPO Statistics Database and EPO PATSTAT Database, October 2012
Figure A.4.1.2 presents the number of domestic and
foreign-oriented patent families for the top origins for
2005-2009. Between 2005 and 2009, the largest number
of patent families originated in Japan – the only origin with
more than 1.2 million families – followed by the US, China
and the Republic of Korea. However, for these origins,
the distribution of domestic and foreign-oriented families
differed considerably. More than 40% of total patent
families originating in the US were foreign-oriented. In
contrast, less than 6% of all patent families originating in
China were foreign-oriented. Patent families originating
in Switzerland (91.5%), Sweden (89%) and Israel (85.3%)
were predominantly foreign-oriented.
A.4.2 Patent families by office and origin
Figure A.4.2.1 shows the distribution of total patent fami-
lies by number of offices for selected origins. The majority
of patent families contain only one office, most often the
national patent office of the applicant. On average, 22.6%
of patent families created worldwide between 2005 and
2009 included at least two patent offices. However, there
was considerable variation among the top origins. A small
fraction of total patent families originating in Brazil (1.7%),
China (4.8%) and the Russian Federation (8.5%) included
at least two patent offices. In contrast, large shares of
patent families originating in European countries, such
as France (49.5%) and Sweden (45.3%), included at least
two patent offices.
Figure A.4.2.1 Distribution of total patent families by number of offices, 2005-09
Note: The definition of a patent family is explained in the note for Figure A.4.1.1.
Sources: WIPO Statistics Database and EPO PATSTAT Database, October 2012
Foreign-oriented share (%): 2005 - 09
20.4 42.4 5.9 16.7 65.8 2.6 62.0 49.8 75.5 61.1
1,227,601
747,799
561,638 534,512
274,191
95,438 81,308 63,838 45,051 42,252
Pate
nt fa
mili
es
Japan
United
State
s of A
merica
China
Repu
blic o
f Kore
a
German
y
Russi
an Fe
derat
ionFra
nce
United
King
dom
Canad
aIta
ly
Origin
Domestic Foreign-oriented
Foreign-oriented share (%): 2005 - 09
91.5 79.6 89.0 11.4 71.8 74.2 51.4 85.3 79.8 8.3
33,357
28,984 28,833
20,122 20,114 20,10417,118 15,773
11,797 10,900Pate
nt fa
mili
es
.
Switz
erlan
d
Netherl
ands
Swed
enBra
zil
Finlan
d
Austral
iaSp
ainIsr
ael
Austria
Polan
d
Origin
Domestic Foreign-oriented
Average number of offices in foreign-oriented families: 2005-09
2.3 2.2 2.8 2.9 2.8 2.8 2.9 1.9 3.5 2.4 2.5 2.5 2.5 2.8 2.4 3.4
0
25
50
75
100
Dist
ribut
ion
of n
umbe
r of o
ffice
s
Russian
Fede
ration
China
Brazil
Repub
lic of
Korea
Japan
Total
United
State
s of A
merica
Canad
a
United
Kingdo
m
Netherl
ands Ita
ly
Finlan
d
German
y
Switz
erlan
d
Swed
enFra
nce
Origin
1 Office 2 Offices 3 Offices 4 Offices 5 Offices More than 5 offices

61
Section A pAtentS, utility modelS And microorgAniSmS
Table A.4.2.2 illustrates the flow of patent filings from
source countries to destination offices. Data reported
in this table give lower numbers than the applications
abroad data reported in subsection A.3 due to data
consolidation – that is, repeated filings at the same office
within the same patent family are counted only once.
The USPTO is the most popular destination for foreign-
oriented patent families – around 67% of foreign-oriented
patent families from non-US residents included at least
one filing at the USPTO. More than four-fifths of foreign-
oriented patent families originating in Japan and the
Republic of Korea included filings at the USPTO. About
38% of foreign-oriented families from non-EPC mem-
bers contained applications at the EPO, whereas 60%
of those owned by EPC members had EPO filings. The
percentage of foreign-oriented families by non-resident
applicants that had filings at SIPO was around 35%.
Japan and the Republic of Korea had a high tendency to
file at SIPO – more than two-fifths of total foreign-oriented
families from these origins included filings at SIPO. A
small proportion of foreign-oriented patent families by
non-resident applicants included filings at the patent
offices of Brazil, Israel and New Zealand.28
Table A.4.2.2 Foreign-oriented patent families for selected offices and origins, 2005-09
Origin
Office
Australia brazil canada china European
Patent Office
france Germany Israel Japan Mexico new Zealand
republic of Korea
russian federation
United Kingdom
United States of America
total families
Australia 5,080 442 2,741 4,146 4,434 14 96 354 2,448 512 2,349 1,749 435 573 8,077 14,909
Austria 590 189 864 1,709 5,899 97 3,256 123 1,170 230 109 690 640 85 3,432 9,415
Belgium 1,053 352 1,321 2,207 5,131 333 255 347 1,621 562 342 1,189 450 1,046 3,726 8,859
Canada 2,405 485 11,603 5,457 9,146 65 245 377 3,082 1,107 478 2,817 645 1,007 24,756 34,000
China 1,167 310 1,306 22,583 9,284 298 632 125 4,777 257 134 2,681 983 572 24,947 33,239
Finland 928 395 1,433 4,520 7,470 32 517 154 1,683 449 85 2,369 1,145 386 8,637 14,450
France 3,380 2,388 8,416 15,069 39,272 32,742 1,075 1,464 14,151 2,633 784 7,281 3,933 602 28,565 50,397
Germany 6,136 3,850 11,667 42,230 100,596 2,504 83,860 1,903 63,186 4,506 1,293 17,210 8,616 1,944 83,756 180,303
Israel 1,143 259 1,685 2,422 4,677 13 128 3,278 1,931 446 141 1,599 359 378 9,983 13,449
Italy 1,494 1,119 2,555 5,498 18,838 241 494 579 3,016 979 338 1,690 1,589 289 10,935 25,813
Japan 5,529 1,644 5,898 106,400 68,739 1,405 12,644 455 209,886 1,236 414 51,100 3,112 2,339 199,513 250,004
Netherlands 1,549 535 1,976 7,166 10,967 91 447 360 5,935 635 475 3,442 1,409 763 11,807 23,057
Republic of Korea
1,844 746 1,623 35,835 20,767 396 3,365 116 25,394 1,095 109 79,869 1,838 805 75,140 89,080
Singapore 373 47 203 1,650 1,276 4 504 66 1,190 72 58 773 68 334 4,632 6,774
Spain 702 383 1,091 1,485 5,635 257 179 294 974 750 153 473 570 193 3,413 8,797
Sweden 1,853 897 2,363 7,984 13,372 146 1,155 493 5,026 1,061 509 2,923 1,573 572 13,518 25,650
Switzerland 3,928 1,536 5,161 9,106 16,377 361 3,847 1,328 7,014 2,786 1,097 4,939 2,677 1,490 12,884 30,519
United Kingdom 5,788 1,059 6,348 7,998 20,904 158 418 1,293 8,158 1,874 1,501 3,489 1,601 20,450 22,886 31,808
United States of America
45,602 14,532 81,315 125,256 150,139 1,382 16,110 11,049 98,014 29,233 9,201 67,309 15,090 16,203 159,816 317,340
Others 21,116 7,140 26,568 104,719 128,128 2,614 9,218 6,268 140,048 10,501 6,223 64,138 15,554 7,146 201,762 268,189
Total families 111,660 38,308 176,137 513,440 641,051 43,153 138,445 30,426 598,704 60,924 25,793 317,730 62,287 57,177 912,185 1,436,052
Note: For the definition of a patent family, refer to the note for Figure A.4.1.1.
Sources: WIPO Statistics Database and EPO PATSTAT Database, October 2012
28 Similarly, a small proportion of foreign-oriented
families included filings at the patent offices of France,
Germany and the UK. This can be explained by the
fact that applicants have the option of filing at the
EPO, which later (after the granting process) reaches
the national patent offices of EPC member states.

62
Section A pAtentS, utility modelS And microorgAniSmS
a.5Patent applications filed through the patent cooperation treaty
The PCT, an international treaty administered by WIPO,
offers patent applicants an advantageous route for
seeking patent protection internationally. It serves as an
alternative to the Paris Convention for the Protection of
Industrial Property (the Paris Convention) for pursuing
the acquisition of patent rights in different countries.
The main advantages of the PCT are that applicants
and patent offices of PCT contracting states benefit from
uniform formality requirements, international search,
optional supplementary international search and prelimi-
nary examination reports, and centralized international
publication. This can lead to time and cost savings for
applicants. Starting with only 18 members in 1978, there
were 144 PCT members in 2011.
PCT application data presented in A.5.1 and A.5.2 refer to
the international phase of the PCT procedure, while data
presented in A.5.3 refer to PCT national phase entries.
A.5.1 PCT applications
Figure A.5.1.1 depicts the total number of PCT applica-
tions filed between 1995 and 2011. Despite difficult eco-
nomic conditions, PCT applications set a new record in
2011 with 182,354 applications. This represents an 11%
increase on 2010 and the fastest growth since 2005.
Patent applications originating in China, Japan and the
US accounted for 82% of total growth.
The long-term trend shows that the number of PCT ap-
plications grew at a double-digit rate until 2001, followed
by a slowdown in growth between 2002 and 2004.29
Since the system’s establishment, 2009 was the only
year in which there was a drop in applications; however,
PCT applications have rebounded strongly in the past
two years.
Figure A.5.1.1 Trend in PCT applications
Note: Data refer to the international phase of the PCT system. Counts are based on the international application date.
Source: WIPO Statistics Database, October 2012
17.0 20.5 18.3 17.5 13.9 22.1 16.1 2.0 4.4 6.4 11.5 9.4 6.9 2.1
-4.8
5.7 11.0
0
50,000
100,000
150,000
200,000
PCT
appl
icatio
ns
1995 1996 1997 1998 1999 2000 2001 2002 2003 2004 2005 2006 2007 2008 2009 2010 2011
PCT applications Growth rate (%)
Application year
29 The double-digit growth in PCT applications during this
period was partly due to an increase in the use of the
PCT system, as well as expanded PCT membership.

63
Section A pAtentS, utility modelS And microorgAniSmS
Figure A.5.1.2 provides a breakdown of PCT applications
by country of origin. The list of top 20 origins consists
mostly of high-income countries – China and India being
the exceptions.30 The US, with 49,051 applications, was the
largest user of the PCT system in 2011, followed by Japan
(38,874), Germany (18,852) and China (16,402). Among the
top four origins, the US and Japan each had more than
twice as many applications as Germany or China.
For the top 20 origins, China (+33.4%) saw the fastest
growth in applications in 2011, followed by Japan (+20.9%)
and Austria (+18%). Four countries – three of which are
European – saw decreases in applications in 2011, with
the Netherlands recording the largest drop.31 Following
three consecutive years of decline, applications filed by
the US grew by 8.9% in 2011. However, the number of
applications filed in 2011 was still below the pre-crisis
peak reached in 2007.
Figure A.5.1.2 PCT applications for the top 20 origins, 2011
Note: Data refer to the international phase of the PCT system. Counts are based on residency of the first-named applicant and the international application date.
Source: WIPO Statistics Database, October 2012
Figure A.5.1.3 Country share in total PCT applications
1995 2011
Note: See note for Figure A.5.1.2
Source: WIPO Statistics Database, October 2012
Growth rate (%): 2010-11
8.6 1.4 -2.8 -1.9 -2.4 -1.6 18.0 3.4 11.9 12.8
2,9292,695
2,079
1,739 1,7291,452 1,346 1,330 1,314
1,191
PCT
appl
icatio
ns
.
Canad
aIta
ly
Finlan
d
Austral
iaSp
ainIsr
ael
Austria
India
Denmark
Belgi
um
Origin
Growth rate (%): 2010-11
8.9 20.9 7.3 33.4 8.0 2.6 -0.9 7.5 -13.8 4.5
49,051
38,874
18,85216,402
10,4477,438
4,848 4,009 3,503 3,462
PCT
appl
icatio
ns
United
State
s of A
merica
Japan
German
yChin
a
Repu
blic o
f Kore
aFra
nce
United
King
dom
Switz
erlan
d
Netherl
ands
Swed
en
Origin
30 The share of high-income countries in total
PCT applications was around 88%.
31 Over the past two years, the Netherlands
saw a considerable drop in PCT applications
(-8.9% in 2010 and -13.8% in 2011).
United States of America: 42.8% Japan: 6.9%Germany: 12.8% China: 0.3%Republic of Korea: 0.5% France: 4.7%United Kingdom: 7.5% Switzerland: 2.2%Netherlands: 3.5% Sweden: 3.9%Others: 14.8%
United States of America: 26.9% Japan: 21.3%Germany: 10.3% China: 9.0%Republic of Korea: 5.7% France: 4.1%United Kingdom: 2.7% Switzerland: 2.2%Netherlands: 1.9% Sweden: 1.9%Others: 14.0%

64
Section A pAtentS, utility modelS And microorgAniSmS
Figure A.5.1.3 depicts the country share in total PCT
applications for the top 10 origins for 1995 and 2011.
The combined share of China, Japan and the Republic
of Korea in total PCT applications grew by 28 percent-
age points between 1995 and 2011. In contrast, the US
share declined by 16 percentage points. For all European
countries, except Switzerland, the 2011 share was lower
than the 1995 share. This reflects the shift in geography of
PCT applications from the US and Europe towards Asia.
A.5.2 PCT applications by type of applicant
Figure A.5.2.1 presents the distribution of PCT applica-
tions for the top 20 origins broken down by four types
of applicants – business, university, government and
research institution, and individual. Overall, the business
sector accounted for more than 80% of total applications.
However, the share of the business sector varied across
origins. For the top 20 origins, shares ranged from 54.7%
for Spain to 94.5% for Japan. For all origins, except China,
the business sector share remained more or less stable
between 2006 and 2011. For China, the share increased
from 58% to 78.7% over the same period. Universities
accounted for a large share of total applications for Spain
(16.3%), Israel (13.1%) and the Republic of Korea (10%).
France and Spain had a high share of applications from
government and research institutions – around 10%.
Figure A.5.2.1 PCT applications by type of applicant for the top 20 origins, 2011
Note: Data refer to the international phase of the PCT system. Due to confidentiality requirements, counts are based on publication date.
Source: WIPO Statistics Database, October 2012
Table A.5.2.2 lists the top 50 PCT applicants, based
on the residency of the first-named applicant and pub-
lication date. It shows that in 2011, ZTE Corporation
of China, with 2,826 published applications, overtook
Panasonic Corporation of Japan, which ranked first in
2010. Between 2009 and 2011, applications from ZTE
Corporation increased five-fold, leading the company to
surge from 20th position to the top spot. Sharp Kabushiki
Kaisha of Japan ranked fourth, also seeing considerable
growth in published applications over the same period.
The top five applicants saw considerable growth in
published applications in 2011. Qualcomm Incorporated,
the highest ranked US applicant, and Koninklijke Philips
Electronics of the Netherlands recorded the largest de-
clines in 2011. Japan, with 21 different applicants, had
the largest number of applicants ranked among the top
50. China, with the highest ranked applicants, has only
three different applicants in the top 50 list.
Business share: 2011
54.7 62.2 66.0 67.3 67.9 71.9 75.2 77.0 77.2 78.7 80.8 82.5 82.7 88.3 88.8 90.4 91.2 92.9 94.3 94.5
0
25
50
75
100
Dist
ribut
ion
of P
CT a
pplic
atio
nsby
type
of a
pplic
ant
Spain Ind
ia
Austral
ia
Repu
blic o
f Kore
aIsr
ael
Canad
a
United
King
dom
Italy
Austria
China
Franc
e
United
State
s of A
merica
Belgi
um
Denmark
German
y
Netherl
ands
Switz
erlan
d
Finlan
d
Swed
enJap
an
Origin
Business University Research/Government Individual

65
Section A pAtentS, utility modelS And microorgAniSmS
Table A.5.2.2 Top PCT applicants
rank Applicant's name OriginPct applications
change compared to 20102009 2010 2011
1 ZTE CORPORATION China 517 1,868 2,826 9582 PANASONIC CORPORATION Japan 1,891 2,153 2,463 3103 HUAWEI TECHNOLOGIES CO., LTD. China 1,847 1,527 1,831 3044 SHARP KABUSHIKI KAISHA Japan 997 1,286 1,755 4695 ROBERT BOSCH CORPORATION Germany 1,588 1,301 1,518 2176 QUALCOMM INCORPORATED United States of America 1,280 1,675 1,494 -1817 TOYOTA JIDOSHA KABUSHIKI KAISHA Japan 1,068 1,095 1,417 3228 LG ELECTRONICS INC. Republic of Korea 1,090 1,297 1,336 399 KONINKLIJKE PHILIPS ELECTRONICS N.V. Netherlands 1,295 1,433 1,148 -28510 TELEFONAKTIEBOLAGET LM ERICSSON (PUBL) Sweden 1,241 1,147 1,116 -3111 NEC CORPORATION Japan 1,069 1,106 1,056 -5012 SIEMENS AKTIENGESELLSCHAFT Germany 932 830 1,039 20913 MITSUBISHI ELECTRIC CORPORATION Japan 569 726 834 10814 BASF SE Germany 739 817 773 -4415 SAMSUNG ELECTRONICS CO., LTD. Republic of Korea 596 574 757 18316 NOKIA CORPORATION Finland 663 632 698 6617 INTERNATIONAL BUSINESS MACHINES CORPORATION United States of America 401 416 661 24518 HEWLETT-PACKARD DEVELOPMENT COMPANY, L.P. United States of America 554 564 591 2719 3M INNOVATIVE PROPERTIES COMPANY United States of America 688 586 563 -2320 HITACHI, LTD. Japan 190 372 547 17521 KABUSHIKI KAISHA TOSHIBA Japan 327 319 517 19822 CANON KABUSHIKI KAISHA Japan 401 379 499 12023 FUJITSU LIMITED Japan 817 475 494 1924 PROCTER & GAMBLE COMPANY United States of America 341 359 488 12925 MITSUBISHI HEAVY INDUSTRIES, LTD. Japan 373 391 480 8926 SONY CORPORATION Japan 328 347 471 12427 MICROSOFT CORPORATION United States of America 644 470 446 -2427 SUMITOMO CHEMICAL COMPANY, LIMITED Japan 353 323 446 12329 E.I. DUPONT DE NEMOURS AND COMPANY United States of America 509 452 424 -2830 SCHAEFFLER TECHNOLOGIES GMBH & CO. KG Germany 167 422 25531 BOSCH-SIEMENS HAUSGERATE GMBH Germany 413 371 421 5032 HONDA MOTOR CO., LTD. Japan 318 309 418 10933 FUJIFILM CORPORATION Japan 264 275 414 13934 DOW GLOBAL TECHNOLOGIES INC. United States of America 304 288 399 11135 SEMICONDUCTOR ENERGY LABORATORY CO., LTD. Japan 45 76 382 30636 KYOCERA CORPORATION Japan 362 279 356 7737 PANASONIC ELECTRIC WORKS CO., LTD. Japan 235 206 353 14738 BAKER HUGHES INCORPORATED United States of America 375 307 336 2939 NOKIA SIEMENS NETWORKS OY Finland 313 345 332 -1340 HUAWEI DEVICE CO., LTD. China 164 327 16341 NTT DOCOMO, INC. Japan 249 298 323 2542 MURATA MANUFACTURING CO., LTD. Japan 254 305 318 1343 INTEL CORPORATION United States of America 176 201 309 10844 APPLIED MATERIALS, INC. United States of America 296 313 308 -545 THOMSON LICENSING France 359 311 303 -846 ASAHI GLASS COMPANY, LIMITED Japan 177 180 291 11146 GENERAL ELECTRIC COMPANY United States of America 307 274 291 1748 ALCATEL LUCENT France 283 275 287 1249 SANYO ELECTRIC CO., LTD. Japan 142 129 285 15650 UNIVERSITY OF CALIFORNIA United States of America 321 304 277 -27
Note: Data refer to the international phase of the PCT system. Due to confidentiality requirements, counts are based on publication date. Top applicants are selected according to the 2011 total.
Source: WIPO Statistics Database, October 2012
A.5.3 PCT national phase entries
The PCT application process starts with the international
phase and concludes with the national phase. The nation-
al or regional patent office at which the applicant enters
the PCT national phase initiates the granting procedure
according to prevailing national law. PCT national phase
entry (NPE) statistics shed light on international patenting
strategies. The NPE data presented here refer only to
non-resident applications – that is, resident application
data for the national phase are excluded.32 For example,
if a PCT application filed by a resident of China enters the
national phase procedure at SIPO, it is excluded from
the statistics reported here.
32 The share of resident PCT NPEs out of total
NPEs stood at around 15% in 2011.

66
Section A pAtentS, utility modelS And microorgAniSmS
Figure A.5.3.1 Trend in non-resident PCT national phase entries
Note: WIPO estimates
Source: WIPO Statistics Database, October 2012
Table A.5.3.2 PCT national phase entries by office and origin for top offices and origins, 2011
OriginOffice
US EP cn JP Kr In cA AU rU MX SG ZA Il MY nZ
Australia 1,731 704 507 347 158 329 430 996 67 108 134 57 67 108 335
Austria 856 726 479 210 172 239 201 175 162 56 29 195 12 19 16
Belgium 1,165 704 481 361 256 316 298 249 139 155 75 108 3 58 66
Canada 1,642 1,206 801 562 403 516 1,506 422 185 229 88 117 55 47 92
China 3,455 2,008 2,289 954 585 915 307 342 369 184 147 120 61 109 40
Denmark 1,182 874 600 314 171 384 303 236 136 149 66 88 31 42 76
Finland 925 1,156 766 234 320 374 251 156 195 58 32 101 18 22 11
France 6,017 5,189 3,058 2,761 1,512 1,429 1,528 695 906 496 327 357 162 281 165
Germany 12,766 11,621 7,483 4,982 3,055 3,372 2,284 1,432 1,960 1,106 515 723 22 462 328
India 801 373 202 154 104 216 136 149 52 76 51 103 33 58 54
Israel 1,525 802 428 283 190 308 254 173 87 79 56 54 418 1 31
Italy 2,232 1,774 961 524 296 538 386 247 325 215 59 90 15 47 56
Japan 25,938 12,052 16,591 15,897 8,992 3,727 1,565 1,255 1,471 649 865 291 214 766 186
Netherlands 2,688 2,927 2,307 1,883 946 1,472 630 545 937 409 117 155 48 156 101
Republic of Korea 4,304 2,082 2,850 1,972 363 621 313 290 266 162 71 37 32 151 31
Spain 760 682 337 198 112 178 200 148 127 164 34 57 19 23 41
Sweden 2,470 2,489 1,434 1,076 492 828 458 399 329 186 114 154 51 99 112
Switzerland 1,899 2,622 1,786 1,524 931 1,359 1,233 920 696 743 444 419 12 288 212
United Kingdom 5,303 3,146 1,694 1,336 707 1,084 1,192 1,048 369 368 279 506 211 263 274
United States of America
16,120 23,903 17,324 14,627 10,526 9,120 12,129 7,950 3,040 4,883 2,651 1,905 2,345 1,375 1,550
Others / Unknown 3,782 3,235 2,108 1,320 748 1,131 1,155 1,020 469 525 572 503 1,696 312 268
Total 97,561 80,275 64,486 51,519 31,039 28,456 26,759 18,847 12,287 11,000 6,726 6,140 5,525 4,687 4,045
Note: Data include both resident and non-resident NPEs. US (United States of America), EP (European Patent Office), CN (China), JP (Japan), KR (Republic of Korea), IN (India), CA (Canada), AU (Australia), RU (Russian Federation), MX (Mexico), SG (Singapore), ZA (South Africa), IL (Israel), MY (Malaysia) and NZ (New Zealand)
Source: WIPO Statistics Database, October 2012
19.4 43.0 10.9 19.1 7.8 22.8 6.8
-1.1
9.8 10.1 12.9 6.9 7.1
-6.3
8.1 3.2
0
100,000
200,000
300,000
400,000
500,000
Non
-Res
iden
t PCT
nat
iona
l pha
se e
ntrie
s
1995 1996 1997 1998 1999 2000 2001 2002 2003 2004 2005 2006 2007 2008 2009 2010 2011
Non-resident PCT national phase entries Growth rate (%)
Year

67
Section A pAtentS, utility modelS And microorgAniSmS
Figure A.5.3.3 Share of PCT non-resident national phase entries in total non-resident applications for selected offices, 2011
Source: WIPO Statistics Database, October 2012
In 2011, the number of non-resident PCT NPEs totaled
424,800, representing a 3.2% increase on 2010 (Figure
A.5.3.1).33 The USPTO received the largest number of
PCT NPEs in 2011 (19% of the total), followed by SIPO
(14.6%) and the EPO (10.5%). Offices of middle-income
countries, such as India, Mexico and South Africa, also
received large numbers of NPEs.
The long-term trend shows strong year-on-year growth in
non-resident NPEs for all years, except 2003 and 2009.
Growth in NPEs partly reflects the increasing trend of
protecting inventions abroad, as well as increasing PCT
membership which has made the PCT system more
attractive to its users.
Table A.5.3.2 presents PCT NPE data broken down by
the top offices and top origins. It provides information
on the “flow of patent applications” across countries,
as facilitated by the PCT system. Note that this table
includes all PCT NPE data – that is, resident and non-
resident NPEs.
33 The total number of PCT NPEs – resident plus non-
resident – amounted to around 500,400 in 2011.
The USPTO was the most preferred office by destina-
tion in 2011, with 97,561 NPEs. Residents of Germany
and Japan accounted for around 40% of all NPEs at the
USPTO. The EPO, SIPO and JPO each received more
than 50,000 NPEs in 2011. At the EPO and SIPO, the
largest number of NPEs originated in the US, while at the
JPO, residents of Japan accounted for the largest share
of total NPEs. The US was the main source of NPEs at
all reported offices, except the JPO and the USPTO.
Figure A.5.3.3 depicts the distribution of total non-
resident applications by filing route (PCT NPEs and direct
applications, also known as the Paris route) for selected
offices. At the global level, the share of PCT NPEs in
total non-resident applications was around 54%, but it
varied across individual offices. Use of the PCT system is
popular for filing applications in offices of middle-income
countries. For example, the PCT NPE shares at the
patent offices of Indonesia, South Africa and Viet Nam
were above 90%.
Share of non-resident PCT national phase entries in total non-resident applications (%): 2011
93.0 92.4 91.4 90.5 90.3 86.6 85.1 84.4 84.1 83.2 82.1 77.1 75.0 73.4 64.7 63.0 56.2 31.8 23.3 18.1
0
25
50
75
100
Dist
ribut
ion
of a
pplic
atio
ns
Euras
ian Pa
tent O
rganiz
ation
Israe
l
Indon
esia
South
Africa
Viet N
am
Malaysi
a
New Ze
aland
India
Mexico
Canad
a
Russi
an Fe
derat
ion
Austral
ia
Repu
blic o
f Kore
a
Singa
pore
Japan
Europ
ean P
atent
Office
China
United
State
s of A
merica
United
King
dom
German
y
Office
Non-Resident PCT national phase entries Non-Resident Direct applications

68
Section A pAtentS, utility modelS And microorgAniSmS
Among the five largest offices, KIPO had the highest share
of PCT NPEs in total non-resident applications.34 In con-
trast, PCT NPEs accounted for less than one-third of all
non-resident applications at the USPTO.35 However, there
was a considerable increase in the share of PCT NPEs
at the USPTO – from 20% in 2007 to 31.8% in 2011.36
34 The EPO, the JPO, KIPO, SIPO and the USPTO
are the top five offices in terms of number of
non-resident PCT NPEs (Table A.5.3.2).
35 The low share of PCT NPEs at the USPTO does
not accurately reflect usage of the PCT system
at that office, as many PCT applicants took
advantage of a special legal provision in US patent
law allowing PCT applications to proceed directly
to the USPTO (the so-called “by-pass route”).
In such cases, the PCT application is converted
into a continuation or continuation-in-part
application, which is counted as a direct filing.
36 National offices in European countries exhibited low
shares of PCT NPEs, as PCT applicants often enter the
national phase at the EPO instead of at national offices.
a.6 international collaboration
Developing modern technology is an increasingly com-
plex undertaking. Very often, it requires collaboration
across countries. Such collaboration involves joint re-
search among institutions across countries, and em-
ploying scientists and engineers from foreign countries.
This subsection presents two indicators of cross-country
collaboration based on published PCT applications.
Figure A.6.1 illustrates the share of published PCT ap-
plications with foreign inventors (i.e., residency in a
foreign country) for the top 20 applicants’ countries of
origin. On average, 26% of PCT applications included
at least one foreign inventor in 2011. However, the level
of cross-border collaboration varied across countries.
In 2011, around four-fifths of applications filed by Swiss
companies included at least one foreign inventor. In
contrast, less than 10 percent of PCT applications origi-
nating in China, India, Japan and the Republic of Korea
included foreign inventors. Medium-sized European
countries (such as the Netherlands and Finland) and
North American countries had a high rate of collabora-
tion with foreign inventors, compared to larger European
countries. Between 2006 and 2011, all reported origins
except China saw increases in the share of PCT applica-
tions with at least one foreign inventor.
Another way to look at cross-border collaboration is to
ask how many inventors from around the world reside in
a country different from that of the PCT applicant. Figure
A.6.2 also depicts the percentage of PCT applications
having at least one foreign inventor, but here the data are
broken down by the top 20 inventors’ origins. Around
two-thirds of Indian inventors named in PCT applica-
tions were associated with foreign PCT applications.
The share of inventors associated with foreign PCT
applications was also high for Belgium, Canada and the
UK. In contrast, fewer than 10 percent of inventors from
Japan, the Republic of Korea and the US contributed to
foreign PCT applications.

69
Section A pAtentS, utility modelS And microorgAniSmS
Figure A.6.1 Share of PCT applications with at least one foreign inventor for the top 20, 2011
Note: Counts are based on corporate applicants only (thus excluding natural persons). Due to confidentiality requirements, PCT data are based on the publication date.
Source: WIPO Statistics Database, October 2012
Figure A.6.2 Inventors in foreign-owned PCT applications, 2011
Note: See note for Figure A.6.1
Source: WIPO Statistics Database, October 2012
79.3
57.253.9
46.343.2 42.4 42.1
37.633.1 32.4
29.2 26.3 26.1 24.618.1
10.3 10.1 8.6 6.8 6.5 4.1
Share (%): 2006
75.6 53.9 49.9 35.4 33.7 35.2 38.7 26.3 23.3 31.3 23.5 26.3 20.4 21.0 15.3 8.2 9.5 4.5 9.7 3.5 4.2
Filin
g w
ith fo
reig
n in
vent
ors
(%)
Switz
erlan
d
Netherl
ands
Belgi
umFin
land
Canad
a
United
State
s of A
merica
Swed
en
Denmark
Austria
United
King
dom
Austral
iaTo
tal
Franc
e
German
ySp
ainIsr
ael
Italy
India
China
Repu
blic o
f Kore
aJap
an
Country of companies
66.2
49.3 47.6 46.541.3
37.032.6
28.3 27.4 27.0 26.6 26.0 25.6 24.0 23.519.5 19.2
11.98.3
6.02.6
Share (%): 2006
66.9 45.9 43.5 47.8 48.7 30.6 30.2 21.1 31.4 27.1 21.2 59.5 20.6 27.3 25.2 19.5 15.7 8.4 7.5 9.4 3.2
Inve
ntor
s in
fore
ign
com
pani
es (%
)
India
Canad
a
United
King
dom
Belgi
umAust
ria Italy
Israe
l
Switz
erlan
dSp
ain
Austral
ia
Netherl
ands
China
Denmark
Franc
e
Swed
enTo
tal
German
y
Finlan
d
United
State
s of A
merica
Repu
blic o
f Kore
aJap
an
Country of inventors

70
Section A pAtentS, utility modelS And microorgAniSmS
a.7 Patents by field of technology
Patent applications span a wide range of technologies.
Furthermore, the tendency to file patent applications dif-
fers across technologies, as some technologies depend
more heavily on the patent system than others. To under-
stand activity patterns and trends across technologies,
this section presents data by field of technology.
Every patent application is assigned one or more
International Patent Classification (IPC) symbols. WIPO
has developed a concordance table to link these IPC
symbols to corresponding field(s) of technology (see
www.wipo.int/ipstats/en). The data presented here are
based on this concordance table. Where a patent ap-
plication relates to multiple fields of technology, it is
divided into equal shares, each representing one field of
technology (so-called “fractional counting”). Applications
with no IPC symbol are not considered. All the data
reported in this subsection relate to published patent
applications. There is a minimum delay of 18 months
between the application and publication dates. For this
reason, 2010 is the latest available year for statistics on
patents by technology field.
A.7.1 Applications by field of technology
Patent data can be broadly categorized as complex or
discrete technologies. Complex technologies are usu-
ally defined as those for which the resulting products or
processes consist of numerous separately patentable
elements and for which patent ownership is typically
widespread. Discrete technologies, in turn, describe
products or processes that consist of a single or relatively
few patentable elements and for which patent ownership
is more concentrated. For example, smartphones fall into
the category of complex technologies, whereas pharma-
ceuticals are considered a discrete technology.37 Figure
A.7.1.1 shows the application trends for these two catego-
ries for the world total and the top five origins. Data for
the latest available year, 2010, are partial and incomplete.
This could partly explain the downward trend for some
origins. Since 1995, growth in patent applications for
complex technologies has been consistently faster than
that for discrete technologies (since 2003 for China).38 At
the global level, the volume of applications for complex
technologies increased by 2.4-fold between 1995 and
2010, compared to 1.9-fold for discrete technologies. All
reported origins showed similar trends.
Table A.7.1.2 shows the number of patent applications
worldwide by field of technology. In 2010, computer
technology (126,897) and electrical machinery (112,896)
accounted for the largest numbers of applications.
Digital communication recorded the highest annual
growth rates between 2006 and 2010, while telecom-
munications and audio-visual technology both experi-
enced declines during the same period, reflecting the
shift towards widespread use of digital technologies.39
Pharmaceutical patent applications have continuously
declined since 2007.
37 For a definition of complex and discrete
technologies, refer to annex A of World Intellectual Property Indicators, 2011 edition,
available at: www.wipo.int/ipstats/en/wipi/38 The distribution of complex and discrete technologies
for the 1995-2009 period is: World (69% complex,
31% discrete), China (59%, 41%), Germany
(65%, 35%), Japan (77%, 23%), the Republic of
Korea (84%, 16%) and the US (65%, 35%).
39 The micro-structural and nano-technology field
saw the highest growth (11%) in 2011, but it
accounted for only a low number of applications. The
number of applications for digital communications
grew by 19,054 while that for micro-structural
and nano-technology grew by only 988.

71
Section A pAtentS, utility modelS And microorgAniSmS
Figure A.7.1.1 Trend in complex and discrete technology patent applications for the top five origins
Note: For a definition of complex and discrete technologies, refer to annex A of World Intellectual Property Indicators, 2011 edition, available at: www.wipo.int/ipstats/en/wipi/. The data refer to published patent applications. Data for the latest available year, 2010, are partial and incomplete. This could partly explain the downward trend for some origins.
Sources: WIPO Statistics Database and EPO PATSTAT Database, October 2012
1
1.5
2
2.5
Inde
x: 1
995
= 1
1995 2000 2005 2010
Year
Complex applications Discrete applications
World
0
10
20
30
Inde
x: 1
995
= 1
1995 2000 2005 2010
Year
Complex applications Discrete applications
China
1
1.5
2
2.5
Inde
x: 1
995
= 1
1995 2000 2005 2010
Year
Complex applications Discrete applications
Germany
0
5
10
15
Inde
x: 1
995
= 1
1995 2000 2005 2010
Year
Complex applications Discrete applications
Republic of Korea
1
1.2
1.4
1.6
Inde
x: 1
995
= 1
1995 2000 2005 2010
Year
Complex applications Discrete applications
Japan
1
1.5
2
2.5
3
Inde
x: 1
995
= 1
1995 2000 2005 2010
Year
Complex applications Discrete applications
United States of America

72
Section A pAtentS, utility modelS And microorgAniSmS
Table A.7.1.2 Patent applications worldwide by field of technology
field of technologyPublication Year
2006 2007 2008 2009 2010 Growth rate 2006-10 (%)
Electrical engineeringElectrical machinery, apparatus, energy 96,308 98,889 102,947 109,288 112,896 4.1Audio-visual technology 94,227 90,504 88,905 83,071 78,637 -4.4Telecommunications 69,290 67,506 68,419 59,161 54,416 -5.9Digital communication 52,445 55,471 61,604 66,167 71,499 8.1Basic communication processes 16,723 16,650 17,096 16,542 15,919 -1.2Computer technology 117,471 120,999 131,533 129,952 126,897 1.9IT methods for management 18,789 18,810 21,087 24,354 22,633 4.8Semiconductors 73,709 74,893 78,978 76,273 75,213 0.5
InstrumentsOptics 73,284 73,937 72,815 67,833 62,385 -3.9Measurement 61,089 63,950 69,242 73,627 73,905 4.9Analysis of biological materials 10,189 10,431 10,495 11,045 10,553 0.9Control 26,069 26,696 27,977 28,422 27,986 1.8Medical technology 65,841 70,779 72,560 73,353 72,630 2.5
chemistryOrganic fine chemistry 50,499 49,271 50,178 49,480 49,055 -0.7Biotechnology 32,311 32,242 33,564 35,802 36,362 3.0Pharmaceuticals 68,289 69,207 68,649 66,981 63,992 -1.6Macromolecular chemistry, polymers 25,516 26,323 26,820 27,284 27,309 1.7Food chemistry 20,003 21,137 22,807 26,587 26,840 7.6Basic materials chemistry 35,158 37,205 39,351 40,522 41,746 4.4Materials, metallurgy 27,650 29,313 32,568 33,904 35,651 6.6Surface technology, coating 27,972 28,437 29,777 31,871 32,222 3.6Micro-structural and nano-technology 1,893 2,147 2,281 2,648 2,881 11.1Chemical engineering 30,991 31,802 33,650 34,539 35,123 3.2Environmental technology 20,286 21,186 22,030 23,706 24,810 5.2
Mechanical engineeringHandling 41,295 41,624 41,515 41,464 41,099 -0.1Machine tools 35,472 35,653 37,264 39,662 42,165 4.4Engines, pumps, turbines 38,912 40,910 42,315 46,979 47,033 4.9Textile and paper machines 36,177 34,914 32,706 31,348 29,739 -4.8Other special machines 43,182 42,720 44,511 46,320 47,320 2.3Thermal processes and apparatus 24,298 24,797 25,213 26,829 28,875 4.4Mechanical elements 41,126 42,989 46,316 46,032 45,143 2.4Transport 62,678 63,876 66,049 68,948 65,305 1.0
Other fieldsFurniture, games 43,192 43,670 44,085 43,020 41,722 -0.9Other consumer goods 32,049 31,083 31,145 31,425 31,302 -0.6Civil engineering 51,645 52,089 51,722 54,228 55,049 1.6
Note: The IPC-technology concordance table (available at: www.wipo.int/ipstats/en) was used to convert IPC symbols into 35 corresponding fields of technology. The data refer to published patent applications.
Sources: WIPO Statistics Database and EPO PATSTAT Database, October 2012
The aggregate data reported in Table A.7.1.2 provide an
overview of applications by field of technology. However,
they do not provide any insight into the innovative strength
of countries in relation to different technology fields.
Table A.7.1.3 reports patent application data by field of
technology for the top origins.
For a number of origins, applications are concentrated
in the fields of computer technology, digital communica-
tions, and telecommunications. For example, telecom-
munications accounted for the largest share of all ap-
plications originating in Canada and the US. For Finland
and Sweden, digital telecommunications constituted the
largest share. Switzerland and the UK tended to file large
numbers of applications for pharmaceuticals.

73
Section A pAtentS, utility modelS And microorgAniSmS
Table A.7.1.3 Patent applications by field of technology and for the top origins, 2006-10
field of technologyOrigin
AU cA cH cn DE fI fr Gb It JP Kr nl rU SE US OthersElectrical engineering
Electrical machinery, apparatus, energy
1,016 3,723 7,214 39,158 59,646 1,805 15,832 7,455 4,661 192,766 61,066 8,061 3,860 2,243 75,511 63,718
Audio-visual technology 888 2,612 2,506 25,838 20,975 2,467 12,310 4,751 929 183,468 70,297 14,966 851 2,630 54,372 48,144
Telecommunications 905 4,967 1,249 29,921 14,447 6,530 9,152 4,431 1,163 91,761 57,046 3,779 1,413 8,353 68,690 26,082
Digital communication 657 8,228 1,554 60,273 16,598 11,655 15,300 5,609 1,755 50,637 31,782 5,460 430 13,933 81,701 20,539
Basic communication processes
122 817 654 4,116 6,276 726 2,463 1,206 396 26,357 7,644 2,544 894 1,088 20,743 10,278
Computer technology 2,891 9,799 4,110 40,283 33,565 6,255 14,444 9,915 2,315 156,855 58,339 11,579 1,325 5,490 223,694 64,031
IT methods for management 1,185 1,886 1,135 4,545 4,077 595 1,630 2,060 358 17,880 18,568 703 275 646 40,160 13,109
Semiconductors 444 683 1,298 14,638 24,102 464 5,541 1,950 1,065 147,908 77,636 6,414 775 471 61,347 41,582
InstrumentsOptics 708 1,178 1,721 14,793 15,173 586 5,271 2,823 1,049 191,867 46,079 7,475 879 973 38,123 29,349
Measurement 1,731 3,739 10,408 33,987 45,059 1,918 12,623 8,844 3,009 96,125 18,003 8,832 8,007 3,305 70,201 40,487
Analysis of biological materials 652 1,020 2,236 3,712 5,404 330 2,592 2,643 560 7,354 2,026 1,393 1,789 972 18,358 7,155
Control 1,064 1,571 2,288 11,725 16,023 572 4,513 3,479 1,612 38,090 9,223 1,756 1,587 1,335 32,693 18,756
Medical technology 4,225 4,399 15,805 13,206 35,251 996 10,485 11,095 4,661 50,829 13,215 7,698 9,374 6,335 145,420 47,403
chemistryOrganic fine chemistry 942 2,705 15,811 18,730 37,794 550 19,488 11,740 4,323 36,941 9,504 5,807 2,007 5,277 73,308 42,537
Biotechnology 2,413 3,225 6,586 16,163 16,232 769 7,208 6,661 2,161 20,210 8,229 4,903 1,754 1,713 62,881 27,269
Pharmaceuticals 3,485 6,137 21,478 43,967 30,781 909 16,911 14,854 7,069 27,743 8,654 5,904 5,344 7,433 118,744 67,124
Macromolecular chemistry, polymers 368 759 3,199 10,733 18,848 2,281 3,952 1,597 2,375 44,887 7,394 4,284 886 296 28,988 14,639
Food chemistry 906 1,056 4,243 20,180 5,144 393 2,459 2,283 1,074 13,267 11,028 6,058 13,484 332 19,211 23,926
Basic materials chemistry 985 1,888 6,385 24,854 33,583 786 5,568 6,450 1,494 41,648 10,433 6,738 3,234 643 45,944 26,595
Materials, metallurgy 1,764 1,562 1,928 29,455 15,966 1,601 5,995 2,227 1,461 43,091 11,047 1,703 7,430 1,421 18,639 25,735
Surface technology, coating 717 1,315 2,336 11,239 15,290 1,002 4,467 2,365 1,586 52,075 9,085 1,805 1,700 1,210 34,817 17,245
Micro-structural and nano-technology
100 92 132 1,375 1,291 105 550 129 89 2,401 2,168 198 367 110 2,066 1,296
Chemical engineering 1,392 2,138 4,064 16,148 24,386 1,792 6,816 5,207 2,810 32,561 11,855 4,630 4,220 2,165 37,869 25,297
Environmental technology 797 1,452 1,464 13,211 13,132 758 4,608 2,608 1,414 27,430 12,305 2,216 2,178 1,025 18,397 17,372
Mechanical engineering
Handling 1,745 2,316 9,830 9,219 27,487 2,751 8,695 6,043 7,299 58,572 11,481 4,534 1,639 2,267 40,821 31,484
Machine tools 1,136 1,980 3,401 17,622 32,113 1,022 5,262 2,747 3,706 48,140 13,147 1,490 4,280 3,550 31,695 32,449
Engines, pumps, turbines 1,038 2,511 3,017 11,859 43,358 498 12,093 5,375 3,135 67,864 13,194 1,211 4,773 2,214 37,580 24,789
Textile and paper machines 2,794 567 4,435 10,827 22,597 2,772 3,083 1,995 2,763 73,057 8,878 2,362 632 990 20,834 16,504
Other special machines 2,010 4,021 4,419 18,103 28,399 1,494 9,341 4,676 5,464 52,611 16,680 5,316 6,614 2,407 40,184 41,020
Thermal processes and apparatus 813 1,377 1,861 15,361 15,628 885 3,926 2,000 2,652 36,098 19,303 1,466 2,297 1,504 14,704 19,761
Mechanical elements 1,635 2,098 3,072 12,301 51,797 821 10,636 5,555 3,962 68,069 12,438 2,064 3,185 3,974 34,338 26,989
Transport 1,491 3,705 2,665 12,965 70,171 746 25,817 6,331 5,736 102,613 31,383 2,950 4,557 6,051 45,770 32,981
Other fieldsFurniture, games 2,440 3,032 3,733 10,512 15,602 409 5,923 6,729 4,204 52,539 20,112 2,996 1,037 1,783 46,017 50,137
Other consumer goods 1,301 1,833 4,158 11,340 18,393 407 6,810 5,284 3,892 30,176 24,954 2,128 1,572 1,135 29,254 27,089
Civil engineering 3,883 6,476 3,542 22,845 29,187 1,792 11,513 9,448 5,538 42,090 31,358 7,880 7,755 3,902 46,797 57,872
Note: The IPC-technology concordance table (available at: www.wipo.int/ipstats/en) was used to convert IPC symbols into 35 corresponding fields of technology. Assigning a field of technology to a patent family is done based on all applications associated with that family rather than just first applications. The data refer to published patent applications. AU (Australia), CA (Canada), CH (Switzerland), CN (China), DE (Germany), FI (Finland), FR (France), GB (United Kingdom), IT (Italy), JP (Japan), KR (Republic of Korea), NL (Netherlands), RU (Russian Federation), SE (Sweden) and US (United States of America)
Sources: WIPO Statistics Database and EPO PATSTAT Database, October 2012
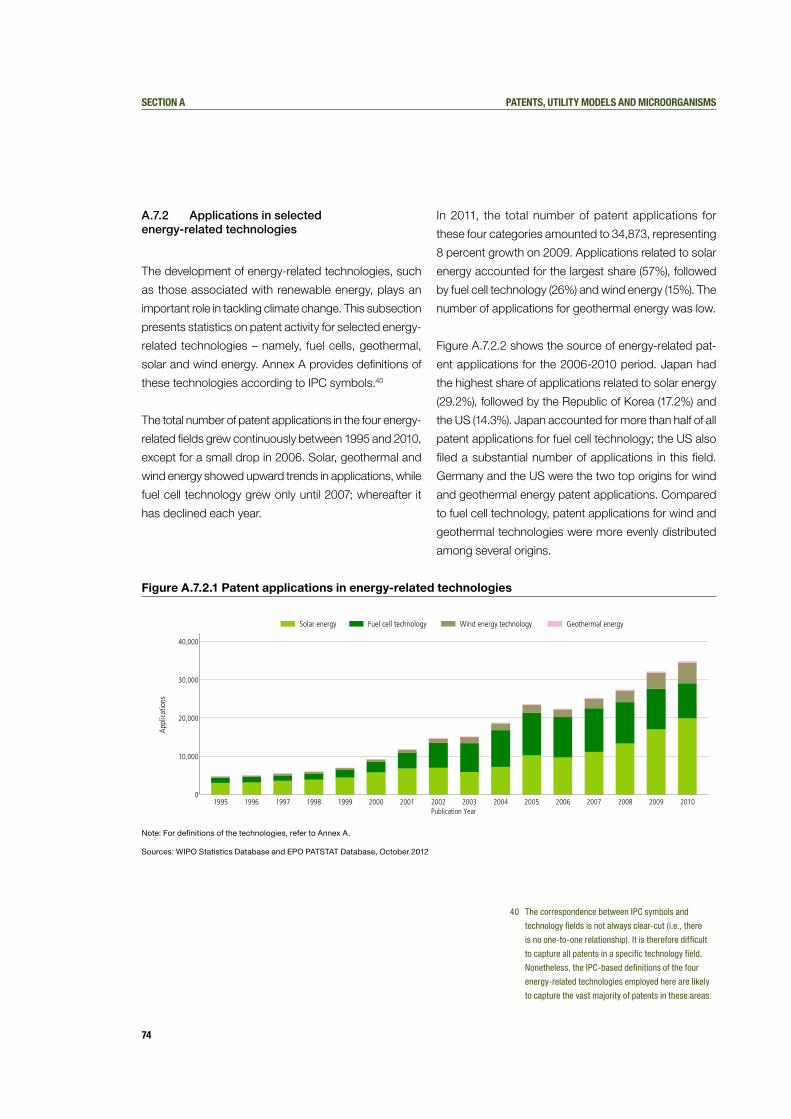
74
Section A pAtentS, utility modelS And microorgAniSmS
A.7.2 Applications in selected energy-related technologies
The development of energy-related technologies, such
as those associated with renewable energy, plays an
important role in tackling climate change. This subsection
presents statistics on patent activity for selected energy-
related technologies – namely, fuel cells, geothermal,
solar and wind energy. Annex A provides definitions of
these technologies according to IPC symbols.40
The total number of patent applications in the four energy-
related fields grew continuously between 1995 and 2010,
except for a small drop in 2006. Solar, geothermal and
wind energy showed upward trends in applications, while
fuel cell technology grew only until 2007; whereafter it
has declined each year.
In 2011, the total number of patent applications for
these four categories amounted to 34,873, representing
8 percent growth on 2009. Applications related to solar
energy accounted for the largest share (57%), followed
by fuel cell technology (26%) and wind energy (15%). The
number of applications for geothermal energy was low.
Figure A.7.2.2 shows the source of energy-related pat-
ent applications for the 2006-2010 period. Japan had
the highest share of applications related to solar energy
(29.2%), followed by the Republic of Korea (17.2%) and
the US (14.3%). Japan accounted for more than half of all
patent applications for fuel cell technology; the US also
filed a substantial number of applications in this field.
Germany and the US were the two top origins for wind
and geothermal energy patent applications. Compared
to fuel cell technology, patent applications for wind and
geothermal technologies were more evenly distributed
among several origins.
Figure A.7.2.1 Patent applications in energy-related technologies
Note: For definitions of the technologies, refer to Annex A.
Sources: WIPO Statistics Database and EPO PATSTAT Database, October 2012
0
10,000
20,000
30,000
40,000
Appl
icatio
ns
1995 1996 1997 1998 1999 2000 2001 2002 2003 2004 2005 2006 2007 2008 2009 2010Publication Year
Solar energy Fuel cell technology Wind energy technology Geothermal energy
40 The correspondence between IPC symbols and
technology fields is not always clear-cut (i.e., there
is no one-to-one relationship). It is therefore difficult
to capture all patents in a specific technology field.
Nonetheless, the IPC-based definitions of the four
energy-related technologies employed here are likely
to capture the vast majority of patents in these areas.

75
Section A pAtentS, utility modelS And microorgAniSmS
Figure A.7.2.2 Share of patent applications in energy-related technologies for the top origins, 2006-10
Solar energy Fuel cell technology
Wind energy Geothermal energy
Note: For definitions of the technologies, refer to Annex A. Country codes: CA (Canada), CH (Switzerland), CN (China), DE (Germany), DK (Denmark), ES (Spain), FR (France), GB (United Kingdom), IT (Italy), JP (Japan), KR (Republic of Korea), NL (Netherlands), RU (Russian Federation), SE (Sweden) and US (United States of America)
Sources: WIPO Statistics Database and EPO PATSTAT Database, October 2012
JP: 29.2% Others: 17.6% KR: 17.2% US: 14.3%CN: 10.2% DE: 6.5% FR: 1.6% NL: 1.2%GB: 0.8% CA: 0.7% ES: 0.7%
Others: 22.9% US: 17.1% DE: 14.9% CN: 11.0%JP: 9.4% DK: 7.2% KR: 6.5% ES: 3.8%GB: 3.2% FR: 2.0% RU: 2.0%
JP: 52.9% US: 14.5% KR: 9.7% DE: 7.8%Others: 5.8% CN: 3.4% FR: 2.1% GB: 1.4%CA: 1.4% DK: 0.6% IT: 0.5%
Others: 24.3% DE: 14.3% US: 13.9% KR: 12.7%JP: 10.5% CN: 9.5% CA: 4.4% FR: 3.4%GB: 2.9% SE: 2.2% CH: 1.9%

76
Section A pAtentS, utility modelS And microorgAniSmS
a.8 Patents per gdp and r&d expenditure
Differences in patent activity across economies reflect
their size and level of development. For purposes of
cross-country comparison, it is instructive to express
patent applications relative to GDP and business sector
research and development (R&D) expenditure.41 Both
indicators are frequently referred to as “patent activity
intensity” indicators.
Figure A.8.1 shows the trend in resident patent applica-
tions, GDP and R&D expenditure (left-hand graph) and
resident patents per GDP and per R&D (right-hand graph).
Since the mid-2000s, business sector R&D expenditure
has grown at a faster rate than have resident patents, with
the result that the number of resident applications per
R&D dollar (R&D productivity) has followed a downward
trend since 2007. Both resident applications and GDP
have increased at a similar rate; however, starting in
2009, resident patent growth has since outpaced GDP
growth. As a result, the patent application per GDP ratio
has increased for the past two years.
Figure A.8.2 shows R&D productivity for the top five
origins. For these origins, R&D productivity was more or
less stable until 2002, followed by a sharp upward trend
for China, the Republic of Korea (until 2006) and the US
(until 2007). In contrast, Germany and Japan have seen
persistent declines in R&D productivity.42
41 Both GDP and business sector R&D expenditure
are in constant 2005 PPP dollars.
42 Of the top five origins, China is the only origin
for which R&D productivity continuously
increased between 2003 and 2011.
The global patent applications per GDP and per R&D
expenditure ratios (20.3 and 1.7, respectively) mask con-
siderable variation across origins. For the top 20 origins,
patents per GDP varied from around 100 for the Republic
of Korea to 8 for Armenia (Figure A.8.3). The majority of
origins tended to file 20 or fewer resident patents per bil-
lion GDP. Switzerland (26.6) and Germany (26) were the
two highest ranked European countries. China recorded
the largest increase in patent application-to-GDP ratio
between 2006 and 2011 – jumping from 20.2 to 41.6. In
contrast, Japan saw a considerable decline during the
same period – from 87.7 to 73.4.43
The Republic of Korea, with 3.7 resident patents per
million R&D expenditure, had the highest patent-to-R&D
expenditure ratio (Figure A.8.4). China filed more patents
per R&D expenditure than Japan, which was not the
case for the patent-to-GDP ratio. For both indicators,
China, Japan and the Republic of Korea ranked higher
than European countries and the US. R&D expenditure
in the US was more than double that of China, but the
patent-to-R&D ratio of the US was considerably lower
than for China. Between 2006 and 2011, the patent-to-
R&D expenditure ratio for reported European countries
and the US remained more or less stable. The ratios
for China and Poland increased, while they declined for
Japan and the Republic of Korea.
43 Between 2006 and 2011, the patent-to-GDP
ratio for China increased from 20.2 to 41.8 due
to substantial growth in resident applications.
Japan saw a considerable drop in resident
applications which caused the patent-to-
GDP ratio to fall from 87.7 to 73.4.

77
Section A pAtentS, utility modelS And microorgAniSmS
Figure A.8.1 Trend in resident patent applications worldwide per GDP and R&D expenditure
Note: GDP and R&D expenditure are in constant 2005 purchasing power parity (PPP) dollars. R&D data are lagged by one year to derive the patent-to-R&D ratio. Patent-to-GDP and patent-to-R&D ratios are presented as a three-year moving average.
Sources: WIPO Statistics Database, UNESCO Institute for Statistics and World Bank, October 2012
Figure A.8.2 Trend in resident patent applications per R&D expenditure for the top five origins
Note: R&D expenditure is in constant 2005 PPP dollars. R&D data are lagged by one year to derive the patent-to-R&D ratio, which is presented as a three-year moving average.
Sources: WIPO Statistics Database and UNESCO Institute for Statistics, October 2012
1.0
1.2
1.4
1.6
1.8
2.0
1995
= 1
1995 2000 2005 2010
Year
Resident patent applications GDPBusiness sector R&D expenditure
1
2
3
Resid
ent p
aten
t per
R&D
10
12
14
16
18
20
Resid
ent p
aten
t per
GDP
2000 2001 2002 2003 2004 2005 2006 2007 2008 2009 2010 2011
Year
Resident patent applications per billion USD GDP (2005 PPP)Resident patent applications per million USD R&D expenditure (2005 PPP)
0.6
0.8
1.0
1.2
1.4
1.6
2000
= 1
2000 2001 2002 2003 2004 2005 2006 2007 2008 2009 2010 2011
Year
United States of America China Japan Republic of Korea Germany

78
Section A pAtentS, utility modelS And microorgAniSmS
Figure A.8.3 Resident patent applications per GDP for selected origins, 2011
Note: *2010 data. GDP data are in constant 2005 PPP dollars. For the resident patent-per-GDP indicator, countries were selected if they had a GDP greater than 15 billion PPP dollars and more than 100 resident patent applications. However, not all countries that fulfill these criteria are included in the graphs due to space constraints.
Sources: WIPO Statistics Database and World Bank, October 2012
Figure A.8.4 Resident patent applications per R&D expenditure for selected origins, 2011
Note: *2010 data; '..' not available; R&D expenditure is in constant 2005 PPP dollars. For the resident patent-per-R&D expenditure indicator, countries were selected if they had R&D expenditure greater than 500 million PPP dollars and more than 100 resident patents. R&D data are lagged by one year to derive the patent-to-R&D expenditure ratio. However, not all countries that fulfill these criteria are included in the graphs due to space constraints.
Sources: WIPO Statistics Database and UNESCO Institute for Statistics, October 2012
100.7
73.4
41.8
26.6 26.020.3 18.7 18.7 18.5 16.9 14.6 14.3 13.2 12.8 12.8 12.7 12.4 11.2 9.9 9.1 8.0
Resident applications per billion GDP: 2006
108.8 87.7 20.2 26.0 27.4 18.6 17.2 14.8 20.8 16.2 20.4 12.9 16.0 6.2 15.3 11.9 11.8 7.6 11.0 12.3 13.5
Resid
ent a
pplic
atio
nspe
r bill
ion
GDP
(200
5 PP
P $)
Repu
blic o
f Kore
aJap
anChin
a
Switz
erlan
d
German
yWorl
d
United
State
s of A
merica
Denmark
Finlan
d
Swed
en
New Ze
aland
*
Belar
us
Netherl
ands
Luxem
bourg
Russi
an Fe
derat
ionAust
riaFra
nce
Sloven
ia *
United
King
dom
Ukraine
Armen
ia
Origin
3.73.5
3.22.9
2.8
2.11.9
1.71.5 1.4 1.3
1.20.9 0.9 0.9 0.9 0.9 0.8 0.8 0.7 0.7
Resident applications per million R&D expenditure: 2006
5.3 2.5 2.4 3.5 4.3 1.7 2.3 1.7 1.6 1.6 0.8 .. 1.0 1.0 1.1 0.9 0.9 0.6 0.7 0.9 0.7
Resid
ent a
pplic
atio
nspe
r mill
ion
R&D
expe
nditu
re (2
005
PPP
$)
Repu
blic o
f Kore
aChin
a
Polan
dJap
an
New Ze
aland
*
Ukraine
*
Russi
an Fe
derat
ionWorl
d
Netherl
ands
German
yTu
rkey
Italy
Sloven
ia *
United
State
s of A
merica
*
United
King
dom
Franc
e
Denmark
Norway
Swed
en
Finlan
d
Austria
Origin

79
Section A pAtentS, utility modelS And microorgAniSmS
a.9Patents in force
Patent rights last for a limited period – generally 20 years
from the date of filing. Patents-in-force indicators provide
information on the volume of patents currently valid as
well as the historical “patent life cycle”.
The estimated number of patents in force worldwide
increased from 6.88 million in 2008 to 7.88 million in
2011.44 Figure A.9.1.1 depicts the number of patents in
force by office for the top 20 offices. The USPTO had
the largest number of patents in force – in excess of 2.1
million patents. The JPO also had a substantial number
of patents in force (1.54 million). The number of patents
in force at SIPO has increased rapidly over the past few
years and, in 2011, it surpassed that of the Republic of
Korea.45 Residents owned the bulk of patents in force
at the JPO (87%). In contrast, patents in force at SIPO
and the USPTO were almost equally distributed among
resident and non-resident holders.
Apart from China, Ireland and Switzerland were the only
two offices listed to see double-digit growth between
2010 and 2011. In contrast, India, Monaco and the
Russian Federation recorded declines in patents in force
for the same period.46
44 The global number of patents in force is a WIPO
estimate based on data from 81 offices. These
estimates, which cover data from the same offices,
are 7.18 million for 2009 and 7.37 million for 2010.
45 Between 2005 and 2011, patents in force
in China grew by around 25% a year, which
is far above the growth rates of Japan,
the Republic of Korea and the US.
46 The number of patents in force also fell in Brazil,
France and Sweden, but the data refer to 2009-2010.
Figure A.9.1.1 Patents in force by office for the top 20 offices, 2011
Note: *2010 data; '..' not available; Growth rate refers to 2009-2010.
Source: WIPO Statistics Database, October 2012
Growth rate (%): 2010-11
4.8 8.3 23.4 5.9 2.7 5.0 -0.2 -7.3 16.4 3.0
2,113,628
1,542,096
696,939 678,005527,917
445,380 435,915
168,558 143,253 137,368
Pate
nts
in fo
rce
United
State
s of A
merica
Japan
China
Repu
blic o
f Kore
a
German
y
United
King
dom
Franc
e *
Russi
an Fe
derat
ion
Switz
erlan
d
Canad
a
Office
Growth rate (%): 2010-11
9.5 9.7 11.4 -21.7 .. -5.3 -12.4 -7.1 3.7 ..
105,463
89,992 88,04480,132
52,527 51,00741,361 40,022 38,900 36,003Pa
tent
s in
forc
e
.
A
ustral
ia
Mexico
Irelan
d
Swed
en *
Philip
pines
*
Monaco Ind
ia
Brazil
*Ita
ly
Finlan
d
Office

80
Section A pAtentS, utility modelS And microorgAniSmS
Figure A.9.1.2 Patents in force in 2011 as a percentage of total applications
Note: Percentages are calculated as follows: number of patent applications filed in year t and in force in 2011 divided by the total number of patent applications filed in year t. The graph is based on data from 65 offices.
Source: WIPO Statistics Database, October 2012
Patent holders must pay maintenance fees to keep their
patents valid. Depending on technological and com-
mercial considerations, patent holders may opt to let a
patent lapse before the end of the full protection term.
Figure A.9.1.2 depicts the distribution of patents in force
in 2011 as a percentage of total applications in the year
of filing. Unfortunately, not all offices provide these data.
However, the data available show that more than half
of the applications for which patents were eventually
granted remained in force at least eight years after the
application date. Around 18% of these lasted the full
20-year patent term.
a.10 opposition and invalidation of patents granted
The purpose of opposition procedures is to provide
third parties with the possibility to oppose the grant of
a patent. This also provides an alternative to potentially
lengthy and costly judicial proceedings. Requests for
opposition provide an important avenue to ensure pat-
ent quality. The exact legal mechanism for achieving this
differs from office to office. For example, the USPTO
uses a re-examination system, whereby third parties
can present evidence of prior art and request that a
patent be re-examined by the office. The EPO utilizes
a post-grant opposition system whereby any party can
contest a patent granted not only on prior art grounds
of patentability but also on other substantive grounds.47
Differences in opposition procedures make it difficult
to directly compare opposition-related statistics across
patent offices, so data are comparable over time only
within a particular office.
47 According to Article 100 of the European Patent
Convention (EPC), grounds for opposition include:
the subject matter of the patent not being
patentable; the invention not being sufficiently
disclosed to allow a person skilled in the art to
carry it out; and the content of the patent extending
beyond the content of the application filed.
0.1 0.2 0.4 0.6 0.7
3.7
18.3
22.9
29.1 29.932.6
39.6
43.344.6
46.3
49.4
54.055.3
53.9
50.6
46.6
39.4
30.5
19.4
8.7
2.6
Perc
enta
ge o
f app
licat
ions
1986 1987 1988 1989 1990 1991 1992 1993 1994 1995 1996 1997 1998 1999 2000 2001 2002 2003 2004 2005 2006 2007 2008 2009 2010 2011Application year

81
Section A pAtentS, utility modelS And microorgAniSmS
Figure A.10.1 Opposition and invalidation of patents granted
Note: Different procedures exist across patent offices for opposing or invalidating patent granting decisions. At the EPO and the patent offices of Germany and India, the procedure is called “opposition”. At the USPTO, it is referred to as “re-examination”. At SIPO and the JPO, the procedures are called “invalidation requests” and “trials for invalidation”, respectively.
Source: WIPO Statistics Database, October 2012
10,000
12,000
14,000
16,000
18,000
Gran
t
80
100
120
140
160
180
Oppo
sitio
n / I
nval
idat
ion
2000 2005 2010
Year
Opposition Invalidation Grant
Australia
12,000
14,000
16,000
18,000
20,000
22,000
Gran
t
400
600
800
1,000
1,200
1,400
Oppo
sitio
n / I
nval
idat
ion
1995 2000 2005 2010
Year
Opposition Invalidation Grant
Germany
1,000
2,000
3,000
4,000
5,000
Gran
t
20
30
40
50
Oppo
sitio
n / I
nval
idat
ion
2000 2005 2010
Year
Opposition Invalidation Grant
Israel
40,000
60,000
80,000
100,000
120,000
Gran
t
200
300
400
500
600
700
Oppo
sitio
n / I
nval
idat
ion
2000 2005 2010
Year
Opposition Invalidation Grant
Republic of Korea
0
50,000
100,000
150,000
200,000
Gran
t
0
200
400
600
Oppo
sitio
n / I
nval
idat
ion
2000 2005 2010
Year
Opposition Invalidation Grant
China
30,000
40,000
50,000
60,000
70,000
Gran
t
1,500
2,000
2,500
3,000
3,500
Oppo
sitio
n / I
nval
idat
ion
1995 2000 2005 2010
Year
Opposition Invalidation Grant
European Patent Office
100,000
150,000
200,000
250,000
Gran
t
100
150
200
250
300
350
Oppo
sitio
n / I
nval
idat
ion
1995 2000 2005 2010
Year
Opposition Invalidation Grant
Japan
100,000
150,000
200,000
250,000
Gran
t
200
400
600
800
1,000
1,200
Oppo
sitio
n / I
nval
idat
ion
1995 2000 2005 2010
Year
Re-examination Invalidation Grant
United States of America

82
Section A pAtentS, utility modelS And microorgAniSmS
Figure A.10.1 presents data on opposition and invalidation
requests for selected offices and compares them to the
number of patents granted. The number of oppositions
or requests for re-examination (or invalidation) appears
small compared to total patents granted. For example,
at the EPO, 4.7% of patents granted were opposed in
2011. Similarly, at the USPTO, the re-examination ratio
– requests for re-examination divided by the number of
patents granted – stood at 0.5% in 2011.48 This ratio was
similar to that for SIPO, where the number of invalidation
requests to patents granted stood at around 0.3%.
The number of opposition and invalidation requests
usually correlates positively with the number of patents
granted. However, there are a few exceptions. At the
USPTO, there has been an upward trend in the re-ex-
aminations-to-patents granted ratio since 2002. Similarly,
the opposition-to-grant ratio at KIPO has increased since
2007.49 In other words, there has been an increase in the
tendency of third parties to challenge patents granted by
KIPO and the USPTO. JPO is another exception in that,
since 2004, it has witnessed a decline in patent invalida-
tion requests, while the number of patents granted has
been increasing.50
48 The opposition- and re-examination-to-grant ratios
presented here are rough approximations, because
the numerator and denominator do not cover the
same period. For example, the 4.7% opposition ratio
at the EPO was derived by dividing the number of
oppositions filed in 2011 by the number of patents
granted in 2011. Patents granted by the EPO can be
opposed within nine months of the publication of the
grant of the European patent in the European Patent
Bulletin. Therefore, the number of oppositions filed in
2011 could refer to patents granted in 2010 and 2011.
49 There was a change in the opposition procedure at
KIPO in 2006. Since July 2007, post-grant opposition
has been integrated into the invalidation procedure
and applies to all patents granted after June 2007.
50 From 1994 to 2004, the JPO had a dual opposition/
invalidation system in which only certain parties
could file an appeal. Since 2004, the JPO has
maintained a single opposition procedure that allows
anyone to file an appeal for revocation of a patent.
a.11Pending patent applications
The processing of patents is time- and resource-intensive.
Patent offices need to carefully assess whether the claims
described in patent applications meet the standards of
novelty, non-obviousness and industrial applicability as
set out in national laws. For operational planning and
to assess the effectiveness of the patent system more
broadly, it is important to know how many patent ap-
plications are pending.
Unfortunately, differences in procedures across pat-
ent offices complicate the measurement of pending
applications (see Box 1). In some offices, such as the
USPTO, patent applications automatically proceed to
the examination stage unless applicants withdraw them.
In contrast, patent applications filed at other offices do
not proceed to the examination stage unless applicants
file a separate request for examination. For example, in
the case of the JPO, applicants have up to three years
to file such a request.
For offices that automatically examine all patent ap-
plications, it seems appropriate to count as pending all
applications that await a final decision. However, where
offices require separate examination requests, it may
be more fitting to consider pending applications to be
those for which the applicant has requested examination.
To take account of this procedural difference, pending
application data for both definitions of pendency are
presented below. In particular, statistics on potentially
pending applications include all patent applications, at
any stage in the process, that await a final decision by
the patent office, including those applications for which
applicants have not filed a request for examination (where
applicable). Statistics on pending patent applications
undergoing examination include only those applications
for which the applicant has requested examination (where
such separate requests are necessary).

83
Section A pAtentS, utility modelS And microorgAniSmS
Since the early 2000s, a number of offices have seen
a rise in the number of pending applications. However,
growth in the number of pending applications has varied
across offices. Figure A.11.1 presents potentially pending
application data for the top five offices.51 The JPO saw a
dramatic increase until 2006, followed by a decline from
2008 onwards. The drop was due to decreases in the
number of new applications received and an increase
in the number of applications processed. The USPTO
saw a substantial increase until 2008, and the number
of potentially pending applications has since remained
more or less stable. The EPO, Germany and KIPO each
witnessed upward trends.
The total number of potentially pending applications
across the world declined from 5.1 million in 2010 to 4.8
million in 2011. Japan accounted for almost the entire
drop in backlogs. The world total is based on data from
76 patent offices, which include the top 20 offices except
those of China, the Democratic People’s Republic of
Korea and India.
In absolute terms, the US had the largest number of
potentially pending applications in 2011 (Figure A.11.2).
Japan saw a 19% drop in 2011, but still had a backlog
of more than 1.1 million applications. The majority of top
20 offices had fewer potentially pending applications in
2011 than in 2010, notable exceptions being Viet Nam
(+13%) and Germany (+4.9%).
Figure A.11.1 Trend in potentially pending applications for the top five offices
Note: Potential pending applications include all patent applications, at any stage in the process, awaiting a final decision by the patent office, including those applications for which applicants have not filed a request for examination (where applicable).
Source: WIPO Statistics Database, October 2012
500,000
1,000,000
1,500,000
2,000,000
2003 2004 2005 2006 2007 2008 2009 2010 2011
Year
United States of America Japan
200,000
300,000
400,000
500,000
600,000
2003 2004 2005 2006 2007 2008 2009 2010 2011
Year
European Patent Office Germany Republic of Korea
51 SIPO, the largest office in terms of patent applications,
is not included due to data unavailability.

84
Section A pAtentS, utility modelS And microorgAniSmS
Figure A.11.2 Potentially pending applications, 2011
Note: *2010 data; '..' not available; Growth rate refers to 2009-2010. Potentially pending applications include all patent applications, at any stage in the process, that await a final decision by the patent office, including those applications for which applicants have not filed a request for examination (where applicable). Source: WIPO Statistics Database, October 2012
Figure A.11.3 Pending applications undergoing examination, 2011
Note: *2010 data; '..' not available; Growth rate refers to 2009-2010.
Source: WIPO Statistics Database, October 2012
Figure A.11.4 Pending applications undergoing examination ratio, 2011
Note: The 2011 ratio is calculated using applications pending in 2011 divided by the average number of applications received by the office during 2009-2011. The average number of applications for Thailand refers to 2007-2009. This is due to its recent membership in the PCT, following which the number of applications received declined temporarily as non-resident applicants switched from using the Paris route to the PCT system. Source: WIPO Statistics Database, October 2012
Growth rate (%): 2010-11
-0.1 -19.3 2.1 -2.8 4.9 -1.0 5.7 .. -5.6 1.7
1,208,9011,122,433
620,124506,339
308,027
170,277 163,312100,738 88,877 68,233
Pote
ntia
lly p
endi
ng a
pplic
atio
ns
United
State
s of A
merica
Japan
Europ
ean P
atent
Office
Repub
lic of
Korea
German
y
Canad
a
Brazil *
India
*
Austral
ia
Russian
Fede
ration
Office
Growth rate (%): 2010-11
4.3 -7.3 -3.8 -10.0 -0.2 13.0 -2.5 11.9 -12.9 -12.3
55,611 55,38852,919
50,685
40,782 40,437
29,084 27,267
20,99416,274
Pote
ntia
lly p
endi
ng a
pplic
atio
ns
.
France
*
China,
Hong K
ong S
AR
Thaila
ndMexi
co
United
Kingdo
m
Viet Nam Isra
elIta
ly
Norway
Polan
d
Office
Growth rate (%): 2010-11
-0.1 3.2 -38.9 -0.6 7.9 -1.6 -6.5 1.3 -10.6 ..
1,208,901
385,738351,439284,101
161,92287,081 50,853 50,633 45,206 27,267
Pend
ing
appl
icatio
nsun
derg
oing
exa
min
atio
n
United
State
s of A
merica
Europ
ean P
atent
Office
Japan
Repu
blic o
f Kore
a
German
y
Canad
a
Austral
ia
Russi
an Fe
derat
ion
Mexico Ita
ly
Office
Growth rate (%): 2010-11
0.7 15.4 .. -5.2 4.5 -1.0 .. -14.2 174.1 -80.2
22,682
13,72112,791
9,802
5,3614,271 4,134 4,034 3,374
2,290
Pend
ing
appl
icatio
nsun
derg
oing
exa
min
atio
n
.
Thail
and
Viet Nam
India
*Chil
e * Israe
l
Austria
Hunga
ry
Ukraine
Egypt
New Ze
aland
*
Office
2.5
2.5 3.
3
1.0
4.3
2.7 3.0
1.7
5.2
2.7
4.7
2.4 3.
6
2.1
1.7
1.2
4.5
6.3
2.7 3.
5
3.2
1.8
11.8
4.0 4.2
0.8
2.8
2.8
8.8
4.6
2.0 2.
9
0.2
1.9
0.8
Pend
ing-
to-a
pplic
atio
n ra
tio
United
State
s of A
merica
Japan
Europ
ean P
atent
Office
Repu
blic o
f Kore
a
German
y
Canad
a
Austral
ia
Russi
an Fe
derat
ion
China,
Hong K
ong S
AR
Thail
and *
Mexico
United
King
dom
Viet Nam Isr
ael
Italy
Norway
Polan
d
New Ze
aland
Turke
y
Ukraine
Office
Potentially pending applications to patent applications ratioPending applications undergoing examination to patent application ratio

85
Section A pAtentS, utility modelS And microorgAniSmS
box 1: Measuring patent backlogs: A new framework for cross-country comparison53
National offices tend to think about patent backlogs differently, owing to different rules and processes employed in making pat-enting decisions. In the US, the backlog is typically defined as the quantity of unexamined applications, while in the UK the backlog is generally considered to be the number of applications that remain unexamined after a certain time period. Each of these definitions has its own reasonable logic but, to date, the lack of standardization in measurement has led to an inability to compare backlogs, as well as misunderstanding of their causes and consequences. Similar problems arise in comparing examination pendency across offices.
The UK Intellectual Property Office (UKIPO) and the USPTO have jointly conducted a study on patent application backlogs. As part of that study – and with input from WIPO’s Patent Economists Group54 – the offices have developed a framework to facilitate cross-country comparison of backlogs. The framework identifies four milestones in the examination process common to most patent systems. These milestones divide the overall patent application inventory into three distinct stocks, or inventories, of applications (see Figure A). Within each of these stocks, it is possible to further distinguish those applications awaiting a patent office action and those awaiting an applicant response.
This taxonomy not only facilitates cross-country comparison, but also aids in highlighting the relationship between application stocks and examination pendency. By utilizing detailed information on measured stocks, offices can more precisely estimate pendency at any phase of the examination process. Further, the joint UKIPO-USPTO study shows that changes in the different stocks have differential impacts on patent pendency and on abandonment rates. Understanding these relationships is critical for better evidence-based policymaking.
Results of the UKIPO-USPTO backlog study will be made available in early 2013 at: www.uspto.gov/ip/officechiefecon/index.jsp and www.ipo.gov.uk/pro-ipresearch.htm
figure A: Stocks of patent backlogs
Stock 1 Stock 2 Stock 3
1. Receipt 2. Ripened 3. Decision 4. Disposal
The number of pending applications undergoing exami-
nation shows a trend similar to that of potentially pending
applications. The majority of reported offices had fewer
applications undergoing examination in 2011 than in
2010. For example, applications undergoing examination
in Japan declined by around 224,000.
Figure A.11.4 depicts the number of pending applications
relative to incoming applications. The patent offices of
Thailand, Norway and Viet Nam showed small absolute
numbers of potentially pending applications. However,
these offices had a high ratio of potentially pending appli-
cations to total patent applications.52 For example, at the
patent office of Viet Nam, the number of potentially pend-
ing applications (40,437) was 11.8 times higher than the
average number of patent applications (3,428) received
between 2009 and 2011. The number of potentially pend-
ing applications in Germany was far below that of Japan
and the US, but of all of these offices, Germany had the
highest potential pending applications-to-patents ratio.
52 The potentially pending applications to patent
applications ratio is high for Norway. Norway became a
member of the EPO in January 2008, which prompted
a sharp fall in applications received by the national
patent office as users switched to using the EPO route.
The fall in application numbers resulted in a high ratio
for Norway. The total numbers of patent applications
filed at the patent office of Norway were: 5,430
(2008), 3,604 (2009), 1,813 (2010) and 1,776 (2011).
53 WIPO is grateful to the UKIPO and USPTO
for providing the content in Box 1.
54 See www.wipo.int/econ_stat/en/news/2010/news_0001.html.

86
Section A pAtentS, utility modelS And microorgAniSmS
a.12 Patent prosecution highway
As described earlier, there has been an increase in the
number of cross-border applications – i.e., a patent ap-
plication for the same invention filed in multiple jurisdic-
tions. In such situations, the same application is examined
multiple times by different patent offices. Although there
are substantial differences among national patent laws,
the criteria for granting patents are similar: novelty, inven-
tive step and industrial applicability. Therefore the same
set of questions – whether the invention is new, whether
it is obvious and whether one can make industrial use of
it – is asked multiple times.
With the increasing number of applications and limited
resources, patent offices may find it difficult to process
applications in a timely manner. This is reflected by the
large stock of pending applications across the world
(See A.11).
To avoid unnecessary duplication of work and improve
the efficiency of the examination process, patent of-
fices increasingly seek to make use of the search and
examination results of other offices. So-called Patent
Prosecution Highways (PPH) have institutionalized such
cooperation between offices. A PPH refers to a bilateral
agreement between two offices that enables applicants
to request a fast-track examination procedure whereby
patent examiners can make use of the work of the other
office. This includes positive search and examination
results from the office of first filing. It can also include the
positive results of a written opinion by the International
Searching Authority (ISA), the written opinion of the
International Preliminary Examining Authority (IPEA) or
the international preliminary examination report issued
within the framework of the PCT – a practice referred to
as PCT-PPH. Since offices handling subsequent filings
would use the work done earlier by other offices, they
can shorten processing time and contribute to better
examination quality.
This section presents statistics relating to the use of
the PPH system at several offices.55 Table A.12.1 shows
the number of PPH requests made up to the end of
December 2011 (cumulative total from the date on which
PPH became operational).
The largest number of PPH requests occurred between
the JPO and the USPTO. In particular, the JPO received
6,817 applications for which applicants subsequently filed
a PPH request; the USPTO received the largest number of
those requests (4,703 or 69%), followed by KIPO (1,025 or
15%). As for applications filed at the USPTO, the Canadian
patent office received the largest number of PPH requests
(44%), followed by the JPO (33%). The Canadian office,
the JPO, KIPO and the USPTO accounted for 88% of total
PPH requests (13,272). The majority of offices received
a low number of PPH requests (Table A.12.1). PCT-PPH
requests showed a similar trend. The JPO and the USPTO
received 95% of all PCT-PPH requests (Table A.12.2).
55 For further information and a definition of
PPH statistics refer to: www.jpo.go.jp/cgi/cgi-bin/ppph-portal/statistics/statistics.cgi

87
Section A pAtentS, utility modelS And microorgAniSmS
Statistics on examination procedures can shed some
light on how PPHs affect office performance. Table
A.12.3 presents grant percentage and average pen-
dency time figures. Due to significant differences in
examination procedures and legislation across of-
fices, the data presented here do not allow for direct
cross-office comparisons. The grant percentages for
applications having made use of PPH and PCT-PPH
procedures were higher than for those using the nor-
mal examination procedure. This may be at least partly
due to the requirement that, in order to benefit from
PPH acceleration, applications filed at the office of
second filing may only contain claims that correspond
to those claims which have already been found to be
patentable by the office of first filing. For example, the
grant percentage when requesting the PPH procedure
is 87% (excluding PCT-PPH) at the USPTO, compared
to 49% for all applications (PPH and non-PPH). For all
reported offices, the grant rate for PCT-PPH applications
is higher than “regular” PPH applications. Similarly, and
for related reasons, the average pendency – both first
office action and final decision – for applications using
PPH and PCT-PPH procedures is significantly shorter
than average pendency for all applications.
Table A.12.1 Number of PPH requests, cumulative total up to the end of December 2011
Office of subsequent filing
Aust
ralia
Aust
ria
cana
da
chin
a
Denm
ark
Euro
pean
Pat
ent O
ffice
finl
and
Germ
any
Hung
ary
Icel
and
Isra
el
Japa
n
Mex
ico
norw
ay
Othe
rs
Port
ugal
repu
blic
of K
orea
russ
ian
fede
ratio
n
Sing
apor
e
Spai
n
Unite
d Ki
ngdo
m
Unite
d St
ates
of A
mer
ica
total
Offi
ce o
f firs
t filin
g
Australia n/a 109 109
Austria n/a 0 0 1 0 1
Canada n/a 0 1 0 2 1 0 107 111
China n/a 1 0 1
Denmark 1 n/a 7 4 90 102
European Patent Office n/a 40 191 231
Finland 0 1 n/a 0 5 0 0 0 19 25
Germany 11 n/a 80 13 65 169
Hungary 0 0 n/a 2 3 5
Iceland n/a 0 0 0
Israel n/a 1 1
Japan 0 73 53 2 394 1 495 0 0 n/a 1 0 1,025 42 8 0 20 4,703 6,817
Mexico 0 n/a 0 0 0
Norway 0 n/a 0 0
Others n/a 0 0
Portugal n/a 0 0
Republic of Korea 5 0 0 1 160 n/a 0 1 4 851 1,022
Russian Federation 0 3 0 n/a 0 8 11
Singapore 0 n/a 2 2
Spain 0 0 0 0 0 0 n/a 0 0
United Kingdom 52 19 1 n/a 205 277
United States of America 146 0 1,922 0 1 254 1 40 1 0 0 1,438 15 2 39 475 9 9 0 36 n/a 4,388
Total 146 0 2,013 53 3 648 3 536 1 0 0 1,791 16 2 39 0 1,537 52 17 1 60 6,354 13,272
Note: For a definition of PPH statistics refer to: www.jpo.go.jp/cgi/cgi-bin/ppph-portal/statistics/statistics.cgi
Source: WIPO, based on data from the JPO, October 2012
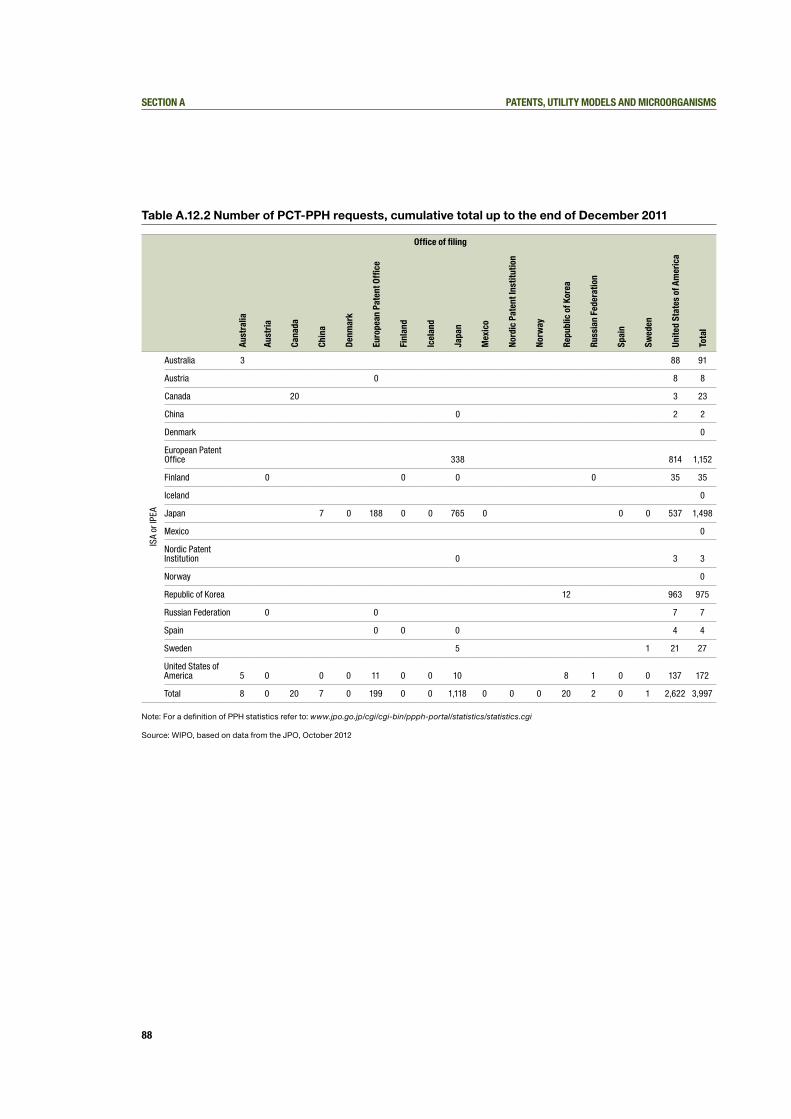
88
Section A pAtentS, utility modelS And microorgAniSmS
Table A.12.2 Number of PCT-PPH requests, cumulative total up to the end of December 2011
Office of filingAu
stra
lia
Aust
ria
Cana
da
Chin
a
Denm
ark
Euro
pean
Pat
ent O
ffice
Finl
and
Icel
and
Japa
n
Mex
ico
Nord
ic P
aten
t Ins
titut
ion
Norw
ay
Repu
blic
of K
orea
Russ
ian
Fede
ratio
n
Spai
n
Swed
en
Unite
d St
ates
of A
mer
ica
Tota
l
ISA
or IP
EA
Australia 3 88 91
Austria 0 8 8
Canada 20 3 23
China 0 2 2
Denmark 0
European Patent Office 338 814 1,152
Finland 0 0 0 0 35 35
Iceland 0
Japan 7 0 188 0 0 765 0 0 0 537 1,498
Mexico 0
Nordic Patent Institution 0 3 3
Norway 0
Republic of Korea 12 963 975
Russian Federation 0 0 7 7
Spain 0 0 0 4 4
Sweden 5 1 21 27
United States of America 5 0 0 0 11 0 0 10 8 1 0 0 137 172
Total 8 0 20 7 0 199 0 0 1,118 0 0 0 20 2 0 1 2,622 3,997
Note: For a definition of PPH statistics refer to: www.jpo.go.jp/cgi/cgi-bin/ppph-portal/statistics/statistics.cgi
Source: WIPO, based on data from the JPO, October 2012

89
Section A pAtentS, utility modelS And microorgAniSmS
Table A.12.3 Grant rate and pendency time for patents filed using the PPH procedure, July – December 2011
PPH procedure, excluding PCT-PPH PCT-PPH
Note: For a definition of PPH statistics refer to: www.jpo.go.jp/cgi/cgi-bin/ppph-portal/statistics/statistics.cgi. The numbers in brackets refer to all applications (i.e., PPH and non-PPH data).
Source: WIPO, based on data from the JPO, October 2012
Office of subsequent filing
Office of subsequent filing
Aust
ralia
Cana
da
Finl
and
Germ
any
Hung
ary
Japa
n
Mex
ico
Othe
rs
Repu
blic
of K
orea
Russ
ian
Fede
ratio
n
Sing
apor
e
Spai
n
Unite
d Ki
ngdo
m
Unite
d St
ates
of A
mer
ica
Aust
ralia
Cana
da
Japa
n
Repu
blic
of K
orea
Russ
ian
Fede
ratio
n
Unite
d St
ates
of A
mer
ica
Grant Rate {%} 100 91 100 76.6 81.8 100 90.3 95 100 97.6 87 100 100 95.4 91
( - ) -64 ( - ) ( - ) -24.4 -58.9 ( - ) -57 -66.3 -80.2 ( - ) ( - ) ( - ) -49 ( - ) -64 -58.9 -66.3 -74 -49
First Action Allowance Rate {%}
44.4 42 66 0 22.9 81.8 87.5 27.1 50 100 100 4.8 26 33.3 75 58 19
( - ) -4.9 ( - ) ( - ) -9.7 -11.2 ( - ) -9.2 -10.1 -12.3 ( - ) -35 ( - ) -14 ( - ) -4.9 -11.2 -10.1 -8.5 -14
Average Pendency from PPH Requestto First Office Action {months}
0.5 1.6 1 5.6 1 1.8 0.83 1.1 1.8 1.7 3.5 1.8 6.1 0.5 1 1.9 2.2 1.3 4.3
( - ) -22.2 -8.5 ( - ) -76.1 -26.3 ( - ) -41.1 -16.8 -10.9 ( - ) -23 ( - ) -23.6 ( - ) -22.2 -26.3 -16.8 -11 -23.6
Average Pendency from PPH Requestto Final Decision {months}
1.5 5.5 6 7.1 0.83 1.2 4.9 6.8 4.8 11.6 1.7 2.5 3.5 7
( - ) -40.5 -60 ( - ) -71.7 -32.4 ( - ) -45.7 -22.8 -18 ( - ) -33 ( - ) -33.8 ( - ) -40.5 -32.4 -22.8 -25 -33.8
Average Number of Office Actions
0.55 0.7 1 1.06 0 0.13 0.6 0.17 1.14 2.3 0.66 0.3 0.46 1.6( - ) -1.6 ( - ) ( - ) -0.7 -1.1 ( - ) -0.94 ( - ) -1.65 ( - ) -2 ( - ) -2.6 ( - ) -1.6 -1.1 ( - ) -2.6 -2.6
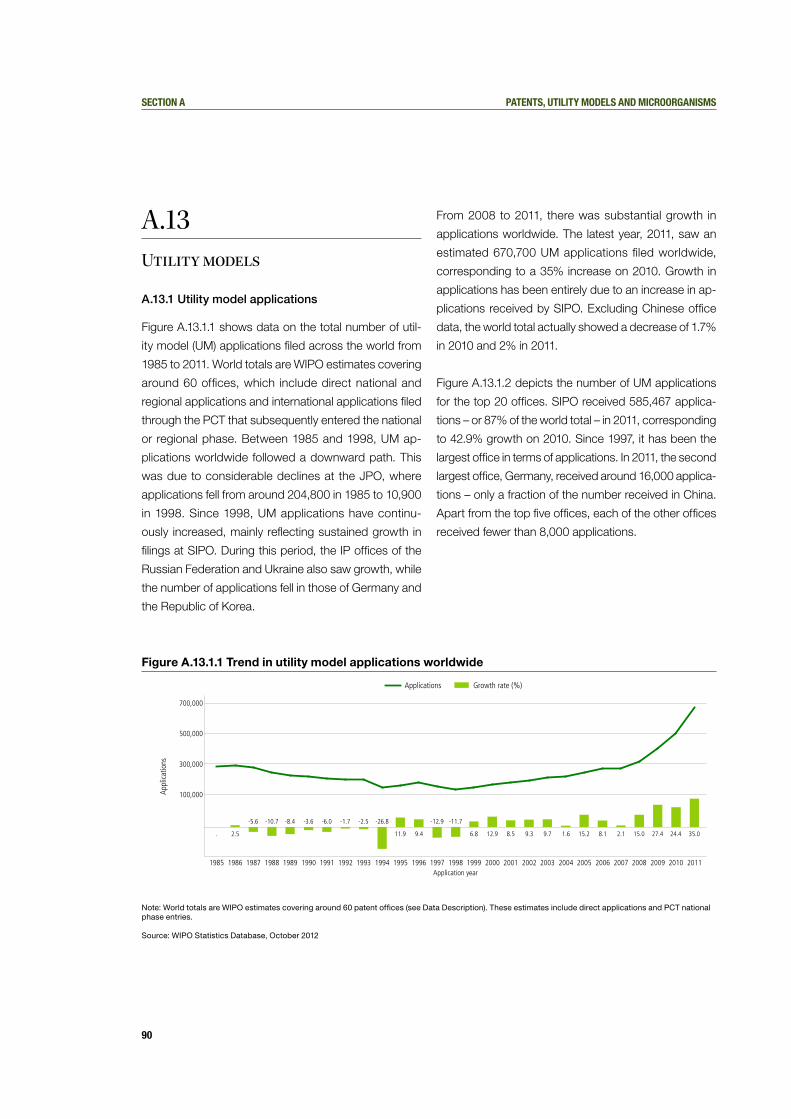
90
Section A pAtentS, utility modelS And microorgAniSmS
a.13utility models
A.13.1 Utility model applications
Figure A.13.1.1 shows data on the total number of util-
ity model (UM) applications filed across the world from
1985 to 2011. World totals are WIPO estimates covering
around 60 offices, which include direct national and
regional applications and international applications filed
through the PCT that subsequently entered the national
or regional phase. Between 1985 and 1998, UM ap-
plications worldwide followed a downward path. This
was due to considerable declines at the JPO, where
applications fell from around 204,800 in 1985 to 10,900
in 1998. Since 1998, UM applications have continu-
ously increased, mainly reflecting sustained growth in
filings at SIPO. During this period, the IP offices of the
Russian Federation and Ukraine also saw growth, while
the number of applications fell in those of Germany and
the Republic of Korea.
From 2008 to 2011, there was substantial growth in
applications worldwide. The latest year, 2011, saw an
estimated 670,700 UM applications filed worldwide,
corresponding to a 35% increase on 2010. Growth in
applications has been entirely due to an increase in ap-
plications received by SIPO. Excluding Chinese office
data, the world total actually showed a decrease of 1.7%
in 2010 and 2% in 2011.
Figure A.13.1.2 depicts the number of UM applications
for the top 20 offices. SIPO received 585,467 applica-
tions – or 87% of the world total – in 2011, corresponding
to 42.9% growth on 2010. Since 1997, it has been the
largest office in terms of applications. In 2011, the second
largest office, Germany, received around 16,000 applica-
tions – only a fraction of the number received in China.
Apart from the top five offices, each of the other offices
received fewer than 8,000 applications.
. 2.5
-5.6 -10.7 -8.4 -3.6 -6.0 -1.7 -2.5 -26.8
11.9 9.4
-12.9 -11.7
6.8 12.9 8.5 9.3 9.7 1.6 15.2 8.1 2.1 15.0 27.4 24.4 35.0
100,000
300,000
500,000
700,000
Appl
icatio
ns
1985 1986 1987 1988 1989 1990 1991 1992 1993 1994 1995 1996 1997 1998 1999 2000 2001 2002 2003 2004 2005 2006 2007 2008 2009 2010 2011
Applications Growth rate (%)
Application year
Figure A.13.1.1 Trend in utility model applications worldwide
Note: World totals are WIPO estimates covering around 60 patent offices (see Data Description). These estimates include direct applications and PCT national phase entries.
Source: WIPO Statistics Database, October 2012

91
Section A pAtentS, utility modelS And microorgAniSmS
Figure A.13.1.2 Utility model applications for the top 20 offices, 2011
Note: *2010 data; Growth rate refers to 2009-2010.
Source: WIPO Statistics Database, October 2012
Figure A.13.1.3 Utility model applications for offices of selected middle- and low-income countries, 2011
Source: WIPO Statistics Database, October 2012
Unlike patents, UMs are primarily used by resident ap-
plicants to protect inventions at their respective national
patent offices. In 2011, resident applicants accounted for
98% of the world total, a share that has remained relatively
constant over the past 25 years. For the top 20 offices,
France is the only one where non-resident applicants ac-
counted for the majority of applications. The non-resident
share in total applications at SIPO was less than one
percent in 2011. However, in absolute terms, SIPO (with
4,164) received the largest number of non-resident UM
applications in 2011, considerably higher than the 1995
level (354 applications). The majority of non-resident ap-
plications filed at SIPO originated in Japan and the US.
SIPO is the only office with considerable growth in UM
applications in 2011. It received 175,631 more applica-
tions than in 2010. This exceeds twice the amount of ap-
plications received by all other offices combined in 2011.
Between 2010 and 2011, the IP offices of Australia, the
Russian Federation, the Philippines and Turkey recorded
high growth, while Austria, the Republic of Korea and
Japan experienced considerable declines.
Growth rate (%): 2010-11
42.9 -5.8 8.0 -13.2 -2.4 -8.0 8.1 -1.6 0.3 -36.3
585,467
16,024 13,241 11,854 10,431 7,9843,280 2,598 2,470 1,988
Appl
icatio
ns
.
Chin
a
German
y
Russi
an Fe
derat
ion
Repu
blic o
f Kore
a
Ukraine
Japan
Turke
ySp
ain Italy
Brazil
*
Office
Resident Non-Resident
Growth rate (%): 2010-11
-54.5 -3.1 23.9 25.8 -13.7 7.5 -6.7 32.1 -43.4 24.6
292
247233 224
182
143 140
107 9986
Appl
icatio
ns
Indon
esia
Viet N
am
Colombia
Bulga
ria
Repu
blic o
f Mold
ova
Kazak
hstan
Tajik
istan
Malaysi
a
Uzbek
istan
Chile
Office
Resident Non-Resident
Growth rate (%): 2010-11
15.4 2.4 1.1 0.1 6.1 -7.9 8.5 0.2 -4.8 4.5
1,690 1,646
1,342
1,0901,003
812674 615 581 506
Appl
icatio
nsAust
ralia
Czech R
epub
lic
Thail
and
Belar
us
Polan
dAust
ria
Philip
pines
China,
Hong K
ong S
AR
Mexico
Franc
e
Office
Resident Non-Resident
Growth rate (%): 2010-11
-1.3 19.0 -29.7 -12.3 6.7 -20.8 -30.0 40.0 -13.3 -37.579
7571
64
4842
2114 13 10
Appl
icatio
ns
.
P
eru
Georgi
aSe
rbia
Roman
ia
Armen
ia
Urugua
y
Azerba
ijan
Guatem
ala
Costa R
ica
Kyrgy
zstan
Office
Resident Non-Resident

92
Section A pAtentS, utility modelS And microorgAniSmS
Figure A.13.1.3 shows the numbers of UM applications
received by offices of selected middle- and low- income
countries. Similar to the trend observed for the top 20
offices (Figure A.13.1.2), resident applications accounted
for the largest share of total applications. Resident shares
varied from 55% in Kazakhstan to 100% in Kyrgyzstan
and Tajikistan. The majority of these offices received
fewer applications in 2011 than in 2010.
Even though the UM system is mostly used by local
residents, some applicants seek UM protection abroad.
Figure A.13.1.4 presents the total number of applications
filed abroad for selected origins. Residents of the US
(1,703) and Japan (1,646) filed the largest numbers of UM
applications abroad, a large proportion of which were
destined for SIPO. Table A.13.1.5 shows the breakdown
of Japanese and US applications abroad at SIPO and
at other IP offices. The use of UMs by Japanese and US
applicants to seek protection in China has considerably
increased. In 2000, residents of the US filed 128 UM
applications (or 23.7% all applications abroad) at SIPO;
by 2011, this number stood at 1,076, constituting 63%
of all US applications abroad. Applications abroad data
for Japan exhibit a similar trend.
China had the largest number of resident applications
(582,140) by origin, of which 581,303 were filed at SIPO
and only 837 were filed abroad.
Figure A.13.1.4 Utility model applications filed abroad for selected origins, 2011
Note: The actual numbers of UM applications by origin might be higher than those reported due to incomplete data, and/or because a detailed breakdown by origin is not supplied by some offices.
Source: WIPO Statistics Database, October 2012
Table A.13.1.5 Utility model applications filed abroad by residents of Japan and the US
Source: WIPO Statistics Database, October 2012
Growth rate (%): 2010-11
25.7 133.8 11.9 33.1 9.9 -5.9 4.7 9.2
1,703 1,646
837
643511
432310 286
Appl
icatio
ns a
broa
d
United
State
s of A
merica
Japan
China
German
y
Switz
erlan
d
Austria
Repu
blic o
f Kore
aIta
ly
Origin
Growth rate (%): 2010-11
94.7 -0.4 30.8 22.2 -4.0 8.2 12.3 -4.3
255238
208193
145 145 137 134
Appl
icatio
ns a
broa
d
.
Fran
ce
Ukraine
Czech R
epub
licSp
ain
China,
Hong K
ong S
AR
United
King
dom
Belar
us
Finlan
d
Origin
Office
Origin: Japan Origin: United States of America
UM applications UM applications (%) UM applications UM applications (%)
2000 2005 2011 2000 2005 2011 2000 2005 2011 2000 2005 2011
China 87 566 1,465 46.8 95.4 89.0 128 360 1,076 23.7 49.0 63.2
Others 99 27 181 53.2 4.6 11.0 412 374 627 76.3 51.0 36.8
Total 186 593 1,646 100.0 100.0 100.0 540 734 1,703 100.0 100.0 100.0

93
Section A pAtentS, utility modelS And microorgAniSmS
Figure A.13.1.6 Resident utility model applications as a percentage of resident patent applications, 2011
Source: WIPO Statistics Database, October 2012
To illustrate the use of the UM system, Figure A.13.1.6
shows resident UM applications relative to resident patent
applications. Compared to the patent system, the UM
system is used intensively by residents of Ukraine, the
Philippines, China Hong Kong (SAR), the Czech Republic,
Slovakia, China and Thailand. For example, Ukrainian
residents filed about four times more UM applications
than patent applications in 2011. Residents of middle-
income countries tend to use the UM system more
intensively than the patent system. In contrast, residents
of high-income countries, such as Germany and Japan,
use the patent system more frequently.
A.13.2 Utility model grants
Contrary to applications, UM grants worldwide showed a
slight upward trend from the mid-1980s to the mid-2000s,
followed by a steep increase from 2006 onwards. UM
grants worldwide grew substantially in 1992 (44.6%) and
2010 (55.1%). The 1992 growth was mainly due to the
large number of grants issued by the JPO, while the high
growth in 2010 resulted from the many grants issued by
SIPO. Indeed, the fast growth in grants worldwide since
2006 was almost entirely due to SIPO. The total number of
grants worldwide is estimated at around 477,100 in 2011,
corresponding to 16.3% growth on 2010. The world total,
excluding SIPO data, shows more modest growth over
the past two years (+8.2% in 2010 and +5.1% in 2011).
SIPO issued by far the largest number of grants (408,110)
in 2011. It accounted for 85% of the world total which,
however, is two percentage points below its share in
applications worldwide. The IP offices of Germany, the
Russian Federation and Ukraine each issued more than
10,000 grants in 2011. The resident and non-resident grant
distribution for all reported offices is similar to that of the
application distribution, with resident applicants receiving
the bulk of total grants in 2011. The majority of the listed
offices exhibited growth in grants between 2010 and 2011.
However, Austria, Germany and Japan recorded falls in
both applications (Figure A.13.1.2) and grants (A.13.2.2).
0
100
200
300
400
(%)
Ukraine
Philip
pines
China,
Hong K
ong S
AR
Czech R
epub
lic
Slova
kiaChin
a
Thail
and
Turke
ySp
ain
Belar
us
Austral
ia
Mexico
Russi
an Fe
derat
ionAust
ria
Finlan
d
German
yIta
ly
Polan
d
Repu
blic o
f Kore
aJap
an
Office

94
Section A pAtentS, utility modelS And microorgAniSmS
Figure A.13.2.1 Trend in utility model grants worldwide
Note: World totals are WIPO estimates covering around 60 patent offices (see Data Description). These estimates include UM grants based on direct applications and PCT national phase entries.
Source: WIPO Statistics Database, October 2012
Figure A.13.2.2 Utility model grants by office for the top 20 offices, 2011
Note: '..' not available; *2010 data; Growth rate refers to 2009-2010.
Source: WIPO Statistics Database, October 2012
. 6.3 10.8
-4.2
16.2
-3.3 -4.9
44.6 10.5
-7.9
7.6 22.4
-23.5
2.0 15.6
-0.2 -0.7
0.0 6.2
-0.9
7.6 18.5 7.3 13.6 10.9 55.1 16.3
100,000
200,000
300,000
400,000
500,000
Gra
nts
1985 1986 1987 1988 1989 1990 1991 1992 1993 1994 1995 1996 1997 1998 1999 2000 2001 2002 2003 2004 2005 2006 2007 2008 2009 2010 2011
Grants Growth rate (%)
Grant year
Growth rate (%): 2010-11
18.5 -8.1 4.7 9.4 -11.4 166.8 36.1 17.8 .. 29.4
408,110
14,23011,079 10,291
7,595 6,486 5,8532,549 1,977 1,545
Gra
nts
.
China
German
y
Russi
an Fe
derat
ion
Ukraine
Japan Ita
ly
Repu
blic o
f Kore
aSp
ainTu
rkey
Czech R
epub
lic
Office
Resident Non-Resident
Growth rate (%): 2010-11
-5.9 35.5 -7.6 8.3 -1.0 30.4 33.2 1.1 15.0 15.6
952 928
605524 517
395 377 360315
207
Gra
nts
Belar
us
Thail
and
Austria
Polan
d
China,
Hong K
ong S
AR
Philip
pines
Slova
kia
Brazil
*
Austral
ia
Mexico
Office
Resident Non-Resident

95
Section A pAtentS, utility modelS And microorgAniSmS
a.14 microorganisms
In 2011, there were a total of 75 contracting parties to
the Budapest Treaty, hosting 40 International Depository
Authorities (IDAs). Therefore, not all contracting parties
have an IDA within their borders. In 2011, Chile and
Morocco signed the treaty, and the Microbial Culture
Collection (MCC) of India became an IDA.
Figure A.14.1 shows the long-term trend of total deposits
made with all IDAs that receive and store microorganisms.
As can be seen, deposits fell from about 3,300 in 2001
to around 2,700 in 2005. They then gradually increased
until 2010. The high growth of 19.5% in 2010 can be at-
tributed to increases in the numbers of deposits made
in both IDAs located in China and in one located in the
US. Together, these three IDAs accounted for 76% of
the increase from 2009 to 2010. The 3,866 deposits in
2011 remained relatively unchanged from the previous
year’s level of 3,857.
Figure A.14.1.2 shows deposit activity from 2001 to
2011 for the top five IDAs, which were selected on the
basis of total deposits made at IDAs since the Budapest
Treaty became operational in 1981. The top five include
authorities from China, Germany, Japan and the US.
China’s two IDAs included in this list – the China General
Microbiological Culture Collection Center (CGMCC) and
the China Center for Type Culture Collection (CCTCC) –
had the highest five-year average annual growth rates
from 2007 to 2011 with 32.8% and 25.6%, respectively.
Germany’s DSMZ saw more or less stable deposit activity
over the same period. By contrast, deposits fell by 12%
at Japan’s International Patent Organism Depositary
(IPOD) and by 1.6% at the US-based American Type
Culture Collection (ATCC). Despite year-on-year growth
of 7 to 17% from 2008 to 2010, the ATCC experienced
a sharp decline in deposits (-30.6%) from 2010 to 2011.
Figure A.14.1.3 presents the shares of the top 10 IDAs in
the total number of deposits received in 2001 and 2011.
Many of the same IDAs are listed for both years, but
Japan’s National Institute of Technology and Evaluation,
Patent Microorganisms Depositary (NPMD) and the
UK-based National Collections of Industrial, Food and
Marine Bacteria (NCIMB) were new to the 2011 ranking,
replacing the Korean Culture Center of Microorganisms
(KCCM) and the European Collection of Cell Cultures
(ECACC) of the UK.
Figure A.14.1 Trend in microorganism deposits worldwide
Source: WIPO Statistics Database, October 2012
.
-12.5 -7.7
1.4
-0.7
5.7
-2.3
13.2 3.5 19.5 0.2
2,000
3,000
4,000
Depo
sits
2001 2002 2003 2004 2005 2006 2007 2008 2009 2010 2011
Deposits Growth rate (%)
Deposit year

96
Section A pAtentS, utility modelS And microorgAniSmS
The two pie charts show that ATCC received 33.1% of
all microorganism deposits worldwide in 2001; however,
its share in 2011 decreased by roughly half to 16.2%.
The China-based CGMCC and CCTCC each increased
their shares from 4.5% and 2.1%, respectively, in 2001
to 29.5% and 16.4% in 2011, thus becoming the top
two IDAs in terms of deposits received for that year.
Combined, they received 45.9% of all deposits in 2011
in contrast with the 20% received by the two US-based
IDAs (ATCC and NRRL) and the 5.3% received by the
two IDAs of Japan (IPOD and NPMD).
Figure A.14.2 Deposits for the top five IDAs
Note: ATCC (American Type Culture Collection, United States of America), CCTCC (China Center for Type Culture Collection), CGMCC (China General Microbiological Culture Collection Center), DSMZ (Deutsche Sammlung von Mikroorganismen und Zellkulturen GmbH, Germany), IPOD (International Patent Organism Depositary, Japan)
Source: WIPO Statistics Database, October 2012
Figure A.14.3 Share of IDAs in total deposits
2001
2011
Note: ATCC (American Type Culture Collection, United States of America), CCTCC (China Center for Type Culture Collection), CGMCC (China General Microbiological Culture Collection Center), CNCM (Collection nationale de cultures de micro-organismes, France), DSMZ (Deutsche Sammlung von Mikroorganismen und Zellkulturen GmbH, Germany), ECACC (European Collection of Cell Cultures, United Kingdom), IPOD (International Patent Organism Depositary, Japan), KCCM (Korean Culture Center of Microorganisms, Republic of Korea), KCTC (Korean Collection for Type Cultures, Republic of Korea), NCIMB (National Collections of Industrial, Food and Marine Bacteria, United Kingdom), NPMD (National Institute of Technology and Evaluation, Patent Microorganisms Depositary, Japan) and NRRL (Agricultural Research Service Culture Collection, United States of America)
Source: WIPO Statistics Database, October 2012
0
500
1,000
1,500
Depo
sits
2001 2002 2003 2004 2005 2006 2007 2008 2009 2010 2011
Deposit year
ATCC IPOD DSMZ CGMCC CCTCC
ATCC: 33.1% IPOD: 12.8% DSMZ: 11.3% KCTC: 8.2%CNCM: 4.9% CGMCC: 4.5% NRRL: 4.0% KCCM: 3.4%ECACC: 2.3% CCTCC: 2.1% Others: 13.4%
CGMCC: 29.5% CCTCC: 16.4% ATCC: 16.2% KCTC: 7.1%DSMZ: 6.1% CNCM: 4.4% NRRL: 3.9% IPOD: 3.0%NCIMB: 3.0% NPMD: 2.3% Others: 8.1%