
SECTION 5 Wastewater Sources &...
67
Wastewater Sources ............................................................................................................. (5-1) Sewage .................................................................................................................................. (5-1) Other establishments ............................................................................................................ (5-5) Hydraulics – Flow rates ...................................................................................................... (5-10) 7080 Versus 7081 ............................................................................................................... (5-10) General hydraulic considerations ........................................................................................ (5-11) Estimates of flow for dwelling design .................................................................................. (5-12) Measuring flow for design and management ....................................................................... (5-17) Waste characteristics: waste strength components ........................................................... (5-26) Biochemical oxygen demands (BOD 5 ), dissolved oxygen, and total suspended solids (TSS) ... (5-27) Biological treatment processes .......................................................................................... (5-34) Wastewater oxygen states .................................................................................................... (5-34) Pathogens ............................................................................................................................ (5-38) Nutrients ............................................................................................................................ (5-40) Monitoring wastewater characteristics ............................................................................. (5-56) References .......................................................................................................................... (5-57) Appendix 1: Biological hazards in wastewater: FAQs for septic system professionals ...................................................................................................................... (5-61) SECTION 5: Wastewater Sources & Flows
Transcript of SECTION 5 Wastewater Sources &...
Wastewater Sources ............................................................................................................. (5-1) Sewage .................................................................................................................................. (5-1) Other establishments ............................................................................................................ (5-5)
Hydraulics – Flow rates ...................................................................................................... (5-10) 7080 Versus 7081 ............................................................................................................... (5-10) General hydraulic considerations ........................................................................................ (5-11) Estimates of flow for dwelling design .................................................................................. (5-12) Measuring flow for design and management ....................................................................... (5-17)
Waste characteristics: waste strength components ........................................................... (5-26) Biochemical oxygen demands (BOD
5), dissolved oxygen, and total suspended solids (TSS) ... (5-27)
Biological treatment processes .......................................................................................... (5-34) Wastewater oxygen states .................................................................................................... (5-34) Pathogens ............................................................................................................................ (5-38) Nutrients ............................................................................................................................ (5-40)
Monitoring wastewater characteristics ............................................................................. (5-56) References .......................................................................................................................... (5-57)
Appendix 1: Biological hazards in wastewater: FAQs for septic system professionals ...................................................................................................................... (5-61)
SECTION 5: Wastewater Sources & Flows

Section 5: Wastewater Sources and Flows n 5-1
WaSteWater SourceS and FloWSWastewater SourcesTo start this section, it is first important to define these two terms:
1. Wastewater: clear water, stormwater, industrial, sewage (domestic or commercial), or any combination thereof, carried by water.
2. Source: location at which wastewater is generated.
This manual will focus on the sewage components of wastewater, but we need to assess the other components if they will interact and affect the onsite sewage treatment system in any way.
SewageDefinition Sewage is waste produced by toilets, bathing, laundry, or culinary operations or the floor drains associated with these sources, and includes household cleaners, medica‑tions, and other constituents in sewage restricted to amounts normally used for do‑mestic purposes (MN Rules Chapter 7080.1100, Subp. 73). Sewage does not include “clear” water such as swimming pool water, roof drainage, water softener recharge water, or water used to irrigate lawns or gardens.
There are several types or categories of sewage that have been nationally defined by the Consortium of Institutes for Decentralized Wastewater Treatment (CIDWT, 2009):
1. Blackwater: portion of the wastewater stream that originates from toilet fixtures, dish-washers and food preparation sinks.
2. Graywater: water captured from non-food preparation sinks, showers, baths, spa baths, clothes washing machines, and laundry tubs. Graywater is defined in MN Rules Chapter 7080.1100, Subp. 37 as sewage that does not contain toilet wastes. A Graywater system is one that receives, treats, and disperses only graywater or other similar system as designated by the commissioner (MN Rules Chapter 7080.1100, Subp. 38). Toilet wastes from the residence or other establishment have to be treated in some other system, or the residence has to have a privy. To prevent hooking up a flush toilet onto a graywater system, the plumbing of the system must have two-inch diameter pipe, rather than four-inch. Even the floor drains have to use two-inch pipe. The exception is for a graywater system being installed for an existing building. There is no need to re-plumb the entire structure. Graywater systems cannot accept garbage disposal waste. Graywater must be fully treated and is further discussed in Section 7.
3. Yellow water: an isolated waste stream consisting of urine collected from specific fixtures and not contaminated by feces or diluted by graywater sources; see also urine separating device.
© 2009 Regents of the University of Minnesota. All rights reserved.
5-2 n Section 5: Wastewater Sources and Flows
The amount and type of water discharged to an onsite sewage treatment system is one of the factors used in sizing that system. Other factors that influence sizing include soil properties such as texture, structure, and percolation rate.
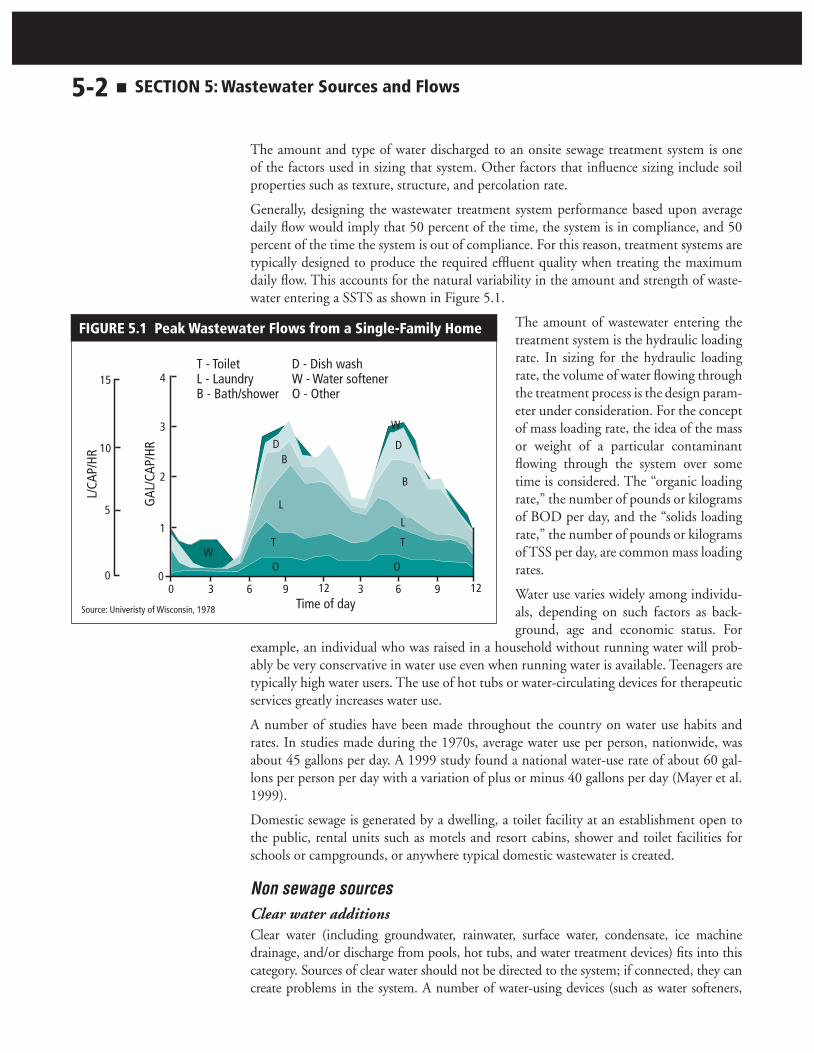
Generally, designing the wastewater treatment system performance based upon average daily flow would imply that 50 percent of the time, the system is in compliance, and 50 percent of the time the system is out of compliance. For this reason, treatment systems are typically designed to produce the required effluent quality when treating the maximum daily flow. This accounts for the natural variability in the amount and strength of waste-water entering a SSTS as shown in Figure 5.1.
The amount of wastewater entering the treatment system is the hydraulic loading rate. In sizing for the hydraulic loading rate, the volume of water flowing through the treatment process is the design param-eter under consideration. For the concept of mass loading rate, the idea of the mass or weight of a particular contaminant flowing through the system over some time is considered. The “organic loading rate,” the number of pounds or kilograms of BOD per day, and the “solids loading rate,” the number of pounds or kilograms of TSS per day, are common mass loading rates.
Water use varies widely among individu-als, depending on such factors as back-ground, age and economic status. For
example, an individual who was raised in a household without running water will prob-ably be very conservative in water use even when running water is available. Teenagers are typically high water users. The use of hot tubs or water-circulating devices for therapeutic services greatly increases water use.
A number of studies have been made throughout the country on water use habits and rates. In studies made during the 1970s, average water use per person, nationwide, was about 45 gallons per day. A 1999 study found a national water-use rate of about 60 gal-lons per person per day with a variation of plus or minus 40 gallons per day (Mayer et al. 1999).
Domestic sewage is generated by a dwelling, a toilet facility at an establishment open to the public, rental units such as motels and resort cabins, shower and toilet facilities for schools or campgrounds, or anywhere typical domestic wastewater is created.
Non sewage sources Clear water additionsClear water (including groundwater, rainwater, surface water, condensate, ice machine drainage, and/or discharge from pools, hot tubs, and water treatment devices) fits into this category. Sources of clear water should not be directed to the system; if connected, they can create problems in the system. A number of water-using devices (such as water softeners,
Figure 5.1 Peak Wastewater Flows from a Single-Family Home

Section 5: Wastewater Sources and Flows n 5-3
iron filters and water treatment devices) do not produce sewage as defined in MN Rules Chapter 7080. These devices do produce effluent, but that effluent has not come in contact with humans or laundry to create contamination that needs to be treated or removed. Water treatment discharge is defined by CIDWT as the by-product from a water treatment device, such as regeneration water from an ion-exchange unit, reject water from a reverse-osmosis unit, or the backwash from an iron filter and does not need to be directed to a SSTS.
Water softeners reduce the number of or remove calcium and magnesium ions, which are the principal causes of hardness in water. Cation exchange resin method is most com-monly used for residential and commercial water treatment. Water softener and iron filter recharge water adds a large volume of water to the system – typically 30 to 80 gallons per cycle. This is water that does not require treating.
A growing concern with water softener recharge water is that it may cause an increase in the amount of solid material that remains suspended in the liquid layer (effluent) in the septic tank and ends up in the drain field trenches or a mound. These solids may shorten the life of the soil treatment system, increasing the chance of drainfield or mound failure. Water softener discharge has conflicting results in research studies, but it does appear that scum lay-ers are often absent in tanks where the water softener recharge water enters the septic tank.
Iron filters are similar to water softeners in that the effluent is not sewage, but the dis-charge does have different characteristics. The two choices for iron removal are ion ex-change (water softener) and oxidation filtration. Water softener is applied to water where the iron concretions are in the 2-5 ppm range. If the iron concentrations are higher (> 5ppm) or the natural pH is high (> 8) then applying an oxidation filtration system may be more effective. These systems physically filter the iron and then are back-flushed, remov-ing the iron as a solid. These systems will need to be discharged into a settling component before being discharged to the soil to remove the solids that would plug the soil surface.
Reverse osmosis is a separation process that uses pressure to force water through a mem-brane that retains the solute on one side and allows the pure solvent to pass to the other side. More specifically, it is the process of forcing a liquid from a region of high solute concentration through a membrane to a region of low solute concentration by applying a pressure in excess of the osmotic pressure. This is the reverse of the normal osmosis pro-cess, which is the natural movement of solvent from an area of low solute concentration, through a membrane, to an area of high solute concentration when no external pressure is applied. The membrane here is semi-permeable, meaning it allows the passage of liquid but not of solute or particles.
The membranes used for reverse osmosis have a dense barrier layer in the polymer matrix where most separation occurs. In most cases, the membrane is designed to allow only water to pass through this dense layer while preventing the passage of solutes (such as salt ions). This process requires that a high pressure be exerted on the high concentration side of the membrane, usually 2–17 bar (30–250 psi) for fresh and brackish water, and 40–70 bar (600–1000 psi) for seawater, which has around 24 bar (350 psi) natural osmotic pres-sure which must be overcome.
Reverse osmosis units sold for residential purposes offer water filtration at the cost of large quantities of waste water. For every five gallons of output, a typical residential reverse osmosis filter will send around ten to 20 gallons of water down the drain (although many people capture it and use it for watering plants and lawns). In some states this water is used for irrigation.

5-4 n Section 5: Wastewater Sources and Flows
High-efficiency furnaces operate at a high efficiency and therefore save on energy use. One of the results of the heating process is that condensation occurs in the unit. When this condensation builds up, water slowly trickles out of the unit and into the plumbing that is often connected to an onsite system. This water can cause freezing problems in the onsite system because of the slow, steady flow. In addition, this water is clean and therefore does not need to be treated. When the furnace is in operation, this water typically trickles out of the unit at a volume of five to ten gallons on a cold day.
In high-efficiency furnaces, the recharge water from water softeners and iron filters has the potential to cause problems with onsite sewage treatment systems.
Industrial wastewater Industrial wastewater is the water or liquid-carried waste from an industrial process result-ing from industry, manufacture, trade, automotive repair, vehicle wash, business or medi-cal, activity that may contain toxic or hazardous constituents.
Garage floor drain liquid wastes from garages serving single and multi-family homes can consist of the following:
n Precipitation draining from vehicles and liquids from vehicle washing
n Spills from materials stored or used in the garage such as: Thinners, solvents, paints, pesticides, cleaners, etc.
n Liquids from vehicle repair such as: gasoline, used oil, antifreeze, other.
Therefore, there is a potential for hazardous waste and other damaging waste entering the floor drain system.
Always check with local units of government for specific requirements. The following list is provided in preferential order of how to handle liquid wastes from private garages:
Preference #1: Do not install floor drains in new constructions of private garages; in-stead, slope the floor to the doors. For existing garages, seal the drain to prevent further discharge.
Preference #2: If a floor drain is desired, the floor drain may discharge to the hom-eowner’s lawn surface if approved by the administrative authority (MN R. Chapter 4715.1300, subp. 6). The discharge area must be visible, and cannot drain or convey runoff directly to storm drains or ditches. The good housekeeping practices described below must be followed.
Preference #3: If a floor drain is desired and the home is connected to the municipal sanitary sewer, connect floor drain to the home’s building sewer for sanitary wastes. Connection must be in compliance with the Plumbing Code (MN Rules Chapter 4715.1300). The hookup should comply with the local sewer use ordinance, and may be subject to local approval. The good housekeeping practices described below must be followed.
DO NOT:
n Direct the floor drain waste to a street, ditch or water body (MN Rules Chapter 7050.0210, sub 2).
n Connect to building sewer of homes served by individual sewage treatment systems (ISTS) (MN Rules Chapter 7080.0065).
n Allow the floor drain to “deadhead” into the soil (MN Rules Chapter 4715.1300).

Section 5: Wastewater Sources and Flows n 5-5
Good Housekeeping:
n Care should be taken that hazardous or other damaging waste does not come in contact with the garage floor. Any hazardous or other damaging waste reaching the garage floor must be absorbed and disposed of at a household hazardous waste facility. No hazardous or other damaging waste should be discharged to daylight via a floor drain or sloped floor, or to a floor drain connected to sanitary sewer (MN Rule Chapter 7060, subp 2). All used oil must be recycled (MN Statute 115A.916).
n Homeowners have the duty to avoid and mitigate pollution from any of the pre-ferred disposal options (MN Statutes 115.061). Any non-hazardous/non-damaging liquid waste discharged to daylight via a floor drain or sloped floor must not cre-ate a nuisance condition or contaminate storm water runoff (MN Rule Chapter 7050.0210).
n If a floor drain remains in the garage, it is recommended that a permanent sign or plate be placed on or within view of the drain stating, “WARNING - Water Only! Floor drain leads to our water supplies”.
other establishmentsDomestic sewage is also generated by Other Establishments. Under Chapter 7081, an “other establishment” is any public or private structure, other than a dwelling, that generates sewage and discharges it to an MSTS (7081.0020, Subp. 6). Other estab-lishments may have large flows and/or high-strength waste, so Chapter 7081 has special regulations for them. These systems are also regulated by the EPA Class V Rules and must complete an inventory form (see Section 13: Forms).
Non-domestic waste is generated by many sources, such as restaurants, laundromats, bar-ber shops, car washes and other light industrial establishments. If any of these parameters exceed MN Chapter 7081 limits, system design must include pre-treatment.
A range of systems can be designed for Other Establishments.
a. Type I – if domestic levels of wastewater can be achieved with septic tanks alone the system is classified as at Type I system.
b. Type II or III - if site or soil conditions are limiting.
c. Type IV – if the system uses a registered product (Treatment Level C) to reduce waste strength the system is considered to be a Type IV system.
d. Type V – if the system uses a non-registered product to reduce the waste strength the system is consider to be a Type V system.
Some “other establishments” include the following:
Apartment buildingsRental situations have been known to have overuse of the system. The renter may not un-derstand the impacts of their usage habits on the system and may have little concern about over using water. Multiple families can also impact the loading to the system. Low-flow fixtures and appliances along with education can assist in the management of the system.
Day caresDay cares are always going to have higher flows associated with their use. The other con-cern here will the cleaners that are used and the type of food that is available. In-home

5-6 n Section 5: Wastewater Sources and Flows
daycares will have higher flows than are typical for the number of bedrooms in the house due to the amount of people that are in the home and the amount of time they are there. The kitchen or waste strength will be similar to a normal home. The use of cleaners must be watched in these systems. Excessive cleaning, which is common in day cares, can lead to the killing of the bacteria and lower efficiency in the treatment tanks.
Commercial kitchenA commercial kitchen is a food preparation center that prepares multiple meals or food products and typically generates high-strength wastewater. The food service wastewater from these facilities is non-toxic, non-hazardous wastewater and is similar in composition to domestic wastewater, but which may occasionally have one or more of its constituents exceed typical domestic ranges. It includes all the sewage wastes from commercial food preparation, food processing or food production sources.
Restaurants and bars almost always have high-strength waste that makes sewage treatment difficult. For this reason, a number of best management practices can be taken to facilitate treatment:
n Limit food particles and alcohol going down the drain.
n Limit the use of chemicals going down the drain: chemicals can kill the treatment system’s good bacteria.
n Limit use of degreasers, even in cleaning supplies.
n A grease interceptor, a watertight device designed to intercept, congeal and retain or remove fats, oils, and grease (FOGs) from food-service wastewaters; may be located inside (grease separator) or outside (grease tank or grease trap) of a facility that generates commercial food service wastewater.
n Isolate kitchen waste from other sewage production
n Design tanks for a minimum of four to seven times the daily flow.
n Be aware that high water temperatures (140F) do not allow grease to solidify, add-ing to treatment concerns.
n More tanks in series can help cool effluent
n Be aware that septic tanks alone usually will not get the job done.
When available the Designer or Service Provider should test the effluent from the last septic tank or pump tank to determine BOD/TSS/FOG levels.
Design considerations include:
1. Provide and maintain internal grease interceptor.
2. Place clean out outside structure in the lines. Schedule regular line cleaning to avoid emergency services.
3. Keep the first outside tank close to the establishment (i.e. a short building sewer) to keep the sewage from cooling and grease solidifying.
4. If fat and grease are excessive, more and smaller tanks are better for cooling as there is more surface area contact with the soil. However an individual tank in series must still not be less than 25% of the total liquid capacity (MN Rules Chapter 7080.1940 B).
5. Tanks must be sized on retention time to promote adequate cooling, floatation and settling. Typical retention time for domestic wastes is 3 to 4 days. (flow x 3, or flow

Section 5: Wastewater Sources and Flows n 5-7
x 4). More retention time is likely needed for high strength wastes. Tank sizing also need to consider the frequency of solids removal.
6. If fat and grease are excessive, more capacity above the liquid level and higher baffles may be advisable. Effluent filters should (must for MSTS) be used on the final tank in series.
7. For high strength waste situations, it is recommended that the orifice size for pressure dis-tribution system be no smaller than 1/4 and the distal head should be no less than 5 feet. Cleanouts must be provided (MN Rules Chapter 7080.2050 sub. 4J). More frequent doses are preferable (min of 4 doses/day is required by rule), as long as the dose volume equals or exceeds five distribution pipe volumes plus the volume of the supply pipe.
8. The size of the absorption area should be sized on the greater of the maximum hy-draulic load or the maximum organic load. See Table 5.1 below and calculations to determine organic loading. It may be advisable to oversize the absorption area by 50% and divide the system into 3 zones for dosing and resting cycles if secondary treatment is not employed (a must for MSTS – MN Rules Chapter 7081.0270, Subp. 5 B 3).
table 5.1 Maximum Waste Strength loading rates—bottom area onlySoil texture group (see column one
of table)
lbs of bod/100 ft2/day of total absorption
area
lbs of tSS/100 ft2/day of total absorption area
lbs of Fog/100 ft2/day of total absorption area
1 and 2 0.13 0.049 0.019
4 0.086 0.032 0.012
3, 5, and 6 0.066 0.024 0.009
7 and 9 0.055 0.020 0.008
8, 10, and 12 0.050 0.018 0.007
11 and 13 0.036 0.014 0.005
15 0.026 0.010 0.004
To calculate:
1. BOD Loading -
_________ x (8.34 ÷ 1,000,000) x _________ = ___________ BOD conc. Hydraulic Waste strength from treatment loading rate loading rate device (mg/l) (gal/ft2/day) (lbs/ft2/day)
2. TSS Loading -
_________ x (8.34 ÷ 1,000,000) x __________ = ___________ TSS conc. Hydraulic Waste strength from treatment loading rate loading rate device (mg/l) (gal/ft2/day) (lbs/ft2/day)
3. Oil and Grease Loading -
_________ x (8.34 ÷ 1,000,000) x ___________ = _____________ O & G conc. Hydraulic Waste strength from treatment loading rate loading rate device (mg/l) (gal/ft2/day) (lbs/ft2/day)

5-8 n Section 5: Wastewater Sources and Flows
CampgroundsAt campgrounds, it is likely that users unfamiliar with onsite treatment systems will be adding waste to the systems. Peak flows are often very high; for this reason, consider extra tank capacity, commercial-size effluent filters, and the use of timers. Pretreatment may also be needed to get the levels of the effluent down to domestic levels.
Priviesn Pit Privies must have three feet of separation below the point where sewage enters
soil
n Vault Privies must meet all requirements of holding tanks
n Minimum size = 25 ft3
n More information on Privies is detailed in Section 7
RV Dump Stationsn At RV dump stations, there is the potential for odor-control chemicals (OCC) that
may be harmful to the system, including:
n Formaldehyde (OCC): the organic strength is so high that the resulting mixture in a holding tank is fifteen to twenty times stronger.
n Quats (OCC) are not biodegradable and deodorize by killing the odor-causing microorganisms.
n Enzyme-based products employ natural organic chemicals. Because they are less effective, they are not used much.
Consider operating the dump station as a holding tank, pretreating the RV waste or slowly time-dosing the RV waste to the rest of the treatment system, which should be designed with excessive tank capacity. UMN recommends a 3 or 4 day retention time for holding tank sizing based on the maximum number of trailers using the facility per day (40 gallons per day)
LaundromatsThe treatment of wastewater from laundromats is often compromised by their high use of soap, chemicals, and water. Steps can be taken to mitigate these factors, including:
n Use liquid soaps only; some cheap powders have excessive fillers
n Sell only liquid soaps which do not have a bleach additive
n Consider doubling tank capacity
n Use of low water use washing machines
n Use of lint filters in facility
n Use of a commercial-size effluent filter on septic tank
n Increase outlet baffle size to 50-60% of tank depth
Office BuildingsFlow varies greatly from one office building site to the next. In general, there is the po-tential for high-strength waste due to low graywater content. There is also the potential that users will be unfamiliar with onsite treatment systems. System designers should be aware of any cooking facilities that may be present in the building, and should consider a commercial-size effluent filter when there is the potential for high-strength waste.

Section 5: Wastewater Sources and Flows n 5-9
Schools and ChurchesBecause of the potential for high-attendance events to be held at schools and churches, peak flows can be quite high at times, and it is likely that users will be unfamiliar with on-site systems. Consider extra tanks, timers and dual fields so one can be rested. System de-signers should ask if a cooking facility is present. If so, the waste will be high strength and will require additional design considerations. Consider commercial-size effluent filters.
Hotels and MotelsAgain, there is the potential that users at hotels and motels will be unfamiliar with onsites. System designers should ask if a cooking facility is present. Consider commercial-size effluent filters. If the facility is seasonal, consider dual fields to rest and help with freeze protection.
Medical FacilitiesThere is the potential for users unfamiliar with onsites. There is also the potential for harmful chemicals to enter the system, including left-over medicine and cleaning chemi-cals. Leftover medications should not be flushed down the toilet and janitorial staff should be educated about the appropriate use of cleaning chemicals to ensure a sanitary environ-ment while minimizing product use. Sharps/red bag waste must not go into system. Con-sider commercial-size effluent filters. The well setback for is increased to 150’ for systems serving this type of waste.
Beauty Salons and BarbersHair and other chemicals should not be allowed to enter the system. Good catch basins/screens should be placed in sinks. Have one sink for rinsing out perms/hair color that drains to a holding tank, as the chemicals used in these processes can be hazardous. Con-sider a commercial-size effluent filter.
Automotive GaragesNo floor drains where vehicle maintenance is being performed should drain to a SSTS. Instead, these drains should go to a holding tank. Flammable waste traps are a good idea in case of spills or misuse. Hazardous waste can not be allowed to enter the system. If a thick layer of oil/grease forms on the on top of the tank, laboratory analysis should be conducted to determine what the layer is composed of and should be checked for hazard-ous waste. If there is no hazardous waste, the wastewater may be thinly land applied or brought to a permitted waste treatment facility.
Filling Stations, Service Stations, Car WashesThe oil and grease wastes from a filling station or car wash can not be allowed to flow into a septic system. Such wastes, including floor washing wastes from the service bay should be discharged into a holding tank which is pumped and cleaned when full. EPA prohibits floor drain waste from a service station from entering an onsite system. Only the toilet wastes from a service station should flow into a septic tank and subsurface soil absorption system. See Section 13 Forms: Underground Discharge System (Class V) Inventory for more information about systems for these establishments.
All of these facilities have a high potential for hazardous waste. As a Designer, be sure to com-municate the care of these chemicals and the responsibility to control their discharge. As a pro-fessional developing a simple care plan is also important for the proper operation of the facility.

5-10 n Section 5: Wastewater Sources and Flows
When a single onsite system is designed to treat an average design flow greater than 10,000 gallons per day, the owner or owners must apply for a state disposal system (SDS) permit from the Minnesota Pollution Control Agency. A professional engineer (PE) must be involved in the design of any SSTS that requires a SDS permit. According to MN Rules Chapter 7081.0040:
a. When a single SSTS, or group of SSTS under single ownership within one‑half mile of each other, are designed to treat a design flow greater than 10,000 gal‑lons per day, the owner or owners shall make application for and obtain an SDS permit from the agency in accordance with chapter 7001. If the measured daily flows for a consecutive seven‑day period exceed 10,000 gallons per day, an SDS permit is required.
b. An SDS permit is required for any subsurface sewage treatment system or group of subsurface sewage treatment systems that the commissioner de‑termines has the potential or an increased potential to cause adverse public health or environmental impacts if not regulated under a state permit. Condi‑tions for these permits include systems in environmentally sensitive areas, un‑substantiated or unexpected flow volumes, and systems requiring exceptional operation, monitoring, and management.
c. Flow amounts to calculate whether an SDS permit is required must be de‑termined according to part 7081.0110. The highest calculated value of the various methods in Table I under part 7081.0130, subpart 1, must be used to make this determination, with no reduction allowed. An SDS permit is not required if a factor of safety is added to the design flow that results in a design flow that is in excess of the SDS permit threshold.
Class V Inventory Form (EPA regulations)These forms are required for all facilities that meet the following requirements:
n On-site sewage treatment systems serving 20 or more people,
n Facilities that generate waste other than domestic waste, and
n Inventory form must be completed and copies sent to the EPA (address listed on the form).
Hydraulics – Flow rates7080 Versus 70817080 is the rule reference for determining design flows for domestic systems from dwell-ings with flows less under 5,000 gpd. However, 7080.1880 states that design sewage flow and waste concentration levels for other establishments with a flow of 5,000 gallons per day or less shall be determined by part 7081.0130.
Chapter 7081 applies to MSTS cluster systems which have flows from 5,000 to 10,000 gpd. There are many terms that apply to cluster systems that are commonly used.
n Cluster system is the sewage collection, treatment, and dispersal system designed to serve two or more sewage-generating dwellings or facilities. This implies a planning concept incorporating green space and common wastewater treatment.

Section 5: Wastewater Sources and Flows n 5-11
n Collector system is typically an older development that needs to treat the wastewa-ter offsite incorporating a collection system.
n Decentralized system includes the collection, treatment, and dispersal/reuse of wastewater from individual homes, clusters of homes, isolated communities, indus-tries, or institutional facilities, at or near the point of waste generation.
n Distributed sewer system is an area-wide system of individual, community, and cluster wastewater treatment systems that is managed by one or more management entities. Systems may include all forms of treatment, dispersal, discharge, reuse or recycle alternatives.
In both Chapter 7080 and 7081 the design flows calculated are flow maximums, meaning that the systems should not actually receive this amount of wastewater daily to ensure long term performance. It is recommended that the average flow to the system be less then 70% of the design flow.
general Hydraulic considerationsThere are numerous terms used to apply to hydraulics and flow that professional needs to understand in the design and operation of a SSTS:
n flow rate, average daily: average volume of wastewater in a 24-hour period; calcu-lated from values measured over a period of time.
n flow rate, daily: measured volume of wastewater generated from a facility in a 24-hour period; expressed as a volume per day.
n flow rate, daily design: estimated peak volume of wastewater for any 24-hour pe-riod; parameter used to size non-residential systems.
n flow rate, design: estimated volume of wastewater per unit of time for which a component or system is designed; commonly called ‘design flow’; see flow, design.
n flow rate, peak hourly: highest flows measured for a one-hour period.
n flow rate, peak instantaneous: highest recorded flow rate occurring within a given period of time.
n flow, surge: flow of effluent greater than average and occurring for short periods of time.
n flow equalization: system configuration that includes sufficient effluent storage capacity to allow for uniform flow to a subsequent component despite variable flow from the source.
Figure 5.2 charts the flow entering a system over the course of a week and graphically identifies many of the above terms.

5-12 n Section 5: Wastewater Sources and Flows
Figure 5.2 Flow rates Vary Significantly
Design Process for Flow Equalization1. The tank capacity is determined by adding:
a. the minimum volume required to keep the pump submerged,
b. a surge volume equal to the flow generated during the designated storage period, and
c. the reserve volume above the alarm activation level.
2. It is recommended that the equalization tank be designed to hold at least twice the average daily flow of the facility and dose it over the course of more than a single day.
3. The flow from a surge or flow equalization tank is controlled by a timer that controls pump operation according to fixed on (dose) and off (rest) cycles. Effluent delivery can then be spread out over several days.
estimates of Flow for dwelling design The estimates of flow used in Minnesota to size sewage treatment systems allow for a safety factor so that systems will function properly even when serving a residence or other es-tablishment with higher than average rates of water use. Chapter 7080 specifies estimated sewage flow rates depending upon the size of residence and the number of water-using appliances.
From 7080.1850, Subp.1 & 2, if construction of additional dwellings or bedrooms, the installation of water‑using devices, or other factors likely to affect the operation of the ISTS can be reasonably anticipated, the system must be designed to accom‑modate these factors.

Section 5: Wastewater Sources and Flows n 5-13
The estimated design flow for any dwelling must provide for at least two bedrooms. For multiple or multifamily dwellings, the design flow consists of the sum of the design flows for each individual unit. A bedroom is defined in 7080.1100, Subp. 9, is an area that is:
a. a room designed or used for sleeping; orb. a room or area of a dwelling that has a minimum floor area of 70 square feet
with access gained from the living area or living area hallway. Architectural features that affect the use as a bedroom under this item may be considered in making the bedroom determination.
The estimated sewage flows presented in Table 5.1 are based on the number of bedrooms in a residence. Because the individuals who occupy a residence use the water, the number of bedrooms is considered a good index of the potential water use. For a Class I residence, the estimated water use is equal to 150 gallons per day (gpd) per bedroom. This assumes occupancy of two people per bedroom, each using 75 gpd. This is a conservative estimate for many residences, although it may be low for large and high-value residences. The notes in Figure A-1 suggest a classification for the various types of residences according to home size and number of water-using appliances.
Dwelling does not include a single-family or multifamily residence that serves both as a domicile and a place of business. If the business increases the volume of sewage above what is normal for a dwelling, a designer should add the additional flow from the busi-ness to the values in Table 5.2. If the liquid waste generated from business operations no longer qualifies as domestic sewage, additional design considerations must accommodate the waste strength.
table 5.2 estimated Sewage Flows in gallons per day (from Mn rules chapter 7080.1860 table iV)
number of bedrooms class i class ii class iii class iV
2 or less 300 225 180 *
3 450 300 218 *
4 600 375 256 *
5 750 450 294 *
6 900 525 332 *
* Flows for Classification IV dwellings are 60 percent of the values as determined for Classification I, II, or III systems. For more than six bedrooms, the design flow is determined by the following formulas:
Classification I: Classification I dwellings are those with more than 800 square feet per bedroom, when the dwelling’s total finished floor area is divided by the number of bedrooms, or where more than two of the following water-use appliances are installed or anticipated: clothes washing machine, dishwasher, water conditioning unit, bathtub greater than 40 gallons, garbage disposal, or self-cleaning humidifier in furnace. The design flow for Classification I dwellings is determined by multiplying 150 gallons by the number of bedrooms.
Classification II: Classification II dwellings are those with 500 to 800 square feet per bedroom, when the dwelling’s total finished floor area is divided by the number of bedrooms, and where no more than two of the water-use appliances listed in Classification I are installed or anticipated. The design flow for Classification II dwellings is determined by adding one to the number of bedrooms and multiplying this result by 75 gallons.
Classification III: Classification III dwellings are those with less than 500 square feet per bedroom, when the dwelling’s total finished floor area is divided by the number of bedrooms, and where no more than two of the water-use appliances listed in Classification I are installed or anticipated. The design flow for Classification III dwellings is determined by adding one to the number of bedrooms, multiplying this result by 38 gallons, then adding 66 gallons.
Classification IV: Classification IV dwellings are dwellings designed under part 7080.2240.
5-14 n Section 5: Wastewater Sources and Flows
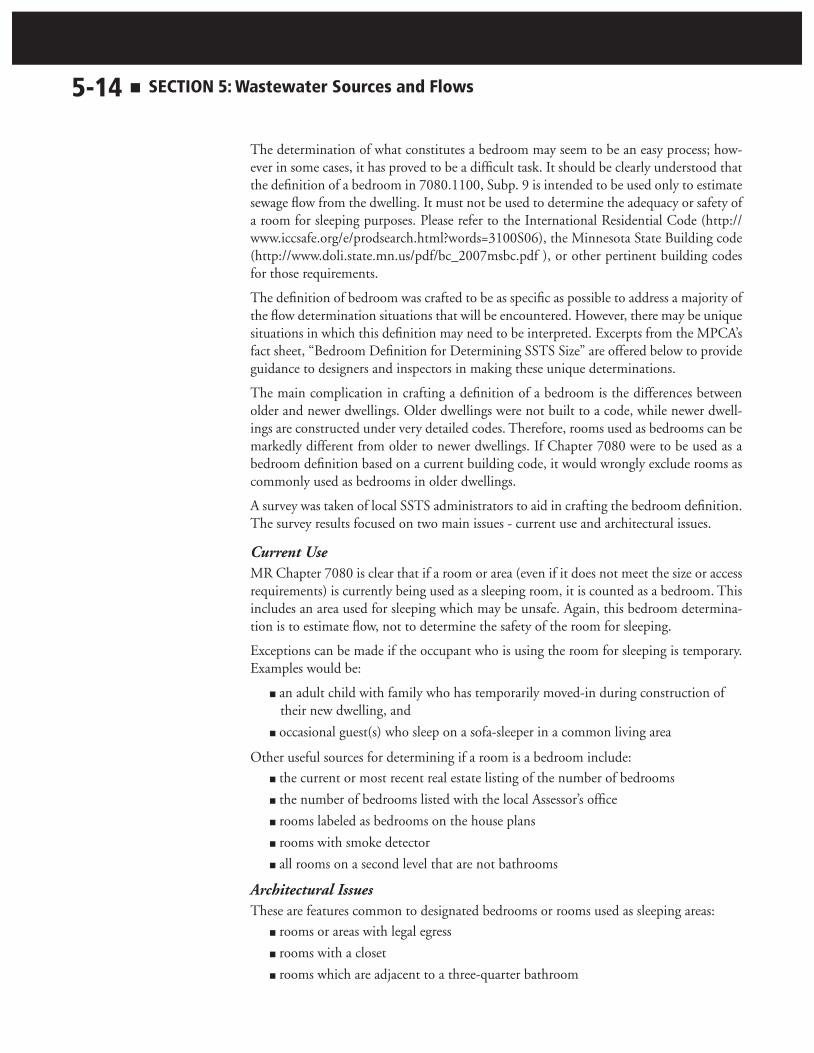
The determination of what constitutes a bedroom may seem to be an easy process; how-ever in some cases, it has proved to be a difficult task. It should be clearly understood that the definition of a bedroom in 7080.1100, Subp. 9 is intended to be used only to estimate sewage flow from the dwelling. It must not be used to determine the adequacy or safety of a room for sleeping purposes. Please refer to the International Residential Code (http://www.iccsafe.org/e/prodsearch.html?words=3100S06), the Minnesota State Building code (http://www.doli.state.mn.us/pdf/bc_2007msbc.pdf ), or other pertinent building codes for those requirements.
The definition of bedroom was crafted to be as specific as possible to address a majority of the flow determination situations that will be encountered. However, there may be unique situations in which this definition may need to be interpreted. Excerpts from the MPCA’s fact sheet, “Bedroom Definition for Determining SSTS Size” are offered below to provide guidance to designers and inspectors in making these unique determinations.
The main complication in crafting a definition of a bedroom is the differences between older and newer dwellings. Older dwellings were not built to a code, while newer dwell-ings are constructed under very detailed codes. Therefore, rooms used as bedrooms can be markedly different from older to newer dwellings. If Chapter 7080 were to be used as a bedroom definition based on a current building code, it would wrongly exclude rooms as commonly used as bedrooms in older dwellings.
A survey was taken of local SSTS administrators to aid in crafting the bedroom definition. The survey results focused on two main issues - current use and architectural issues.
Current Use MR Chapter 7080 is clear that if a room or area (even if it does not meet the size or access requirements) is currently being used as a sleeping room, it is counted as a bedroom. This includes an area used for sleeping which may be unsafe. Again, this bedroom determina-tion is to estimate flow, not to determine the safety of the room for sleeping.
Exceptions can be made if the occupant who is using the room for sleeping is temporary. Examples would be:
n an adult child with family who has temporarily moved-in during construction of their new dwelling, and
n occasional guest(s) who sleep on a sofa-sleeper in a common living area
Other useful sources for determining if a room is a bedroom include:
n the current or most recent real estate listing of the number of bedrooms
n the number of bedrooms listed with the local Assessor’s office
n rooms labeled as bedrooms on the house plans
n rooms with smoke detector
n all rooms on a second level that are not bathrooms
Architectural IssuesThese are features common to designated bedrooms or rooms used as sleeping areas:
n rooms or areas with legal egress
n rooms with a closet
n rooms which are adjacent to a three-quarter bathroom

Section 5: Wastewater Sources and Flows n 5-15
Rooms such as dens, sewing rooms, exercise rooms and home theaters should also be given serious consideration as a bedroom as they have the potential to be easily converted.
Architectural features that are obstacles to the use of a room as a bedroom include:
n rooms that are obviously a kitchen, bathroom, living room, dining room, laundry room, storage room (without windows) or family room
n rooms and areas with low ceilings
n rooms with arched doorways that lack a door
n rooms and areas with half walls
n rooms and areas with no privacy
n rooms and areas without egress to the outside
n rooms and areas with no source of light and ventilation to the outside
n rooms and areas that are used as a passage to other rooms, stairs, or bathrooms un-less this is the only sleeping area in the dwelling
n “open” lofts
A minimum ceiling height is seven feet for basements and seven feet, six inches for upper floors; for attic areas having downward-tapering ceilings a minimum height of five feet is allowed. Areas less than five feet in height are not included in the 70 sq. ft. minimum floor area calculation.
LGU ordinance considerations The following are examples of ordinance amendments being used by some LGUs to ad-dress whether or not a questionable room is counted as a bedroom. These may not be applicable to all LGUs.
1. requiring documentation from builder/owner of a permanent feature that precludes the use of the room as a bedroom
2. limiting the number of bedrooms for a typical single family dwelling
3. requiring a minimum number of bedrooms for a typical single family dwelling
4. requiring techniques to insulate the system if freezing is a concern for a dwelling with a large number of bedrooms but a water use well below the design volume
Financial considerations Typically, the increase in cost of adding an additional bedroom to a system design is not exorbitant. A larger system size adds longevity and often recaptures the additional cost over the life of the system.
Sample bedroom determinations Table 5.3 below offers some common situations, suggestions on the bedroom determina-tion, and reasons supporting suggested determination. Always remember to check with the LGU to see whether they have stricter provisions in their ordinance.

5-16 n Section 5: Wastewater Sources and Flows
table 5.3 bedroom determination
room description bedroom? Supporting reasoning
Den, exercise room or sewing room on house plan that is > 70 ft2
Yes Meets minimum size requirements and has no precluding architectural features
Room used as bedroom in an existing dwelling that is < 70 ft2 and has no egress
Yes Currently being used as a bedroom
Laundry room in existing dwelling is > 70 ft2 No Plumbing, sinks, and washer/dryer are obstacles to use a bedroom
Open loft in existing dwelling used as a bedroom Yes Currently being used as a bedroom
Open loft on house plan No “Open” is a an obstacle to use as a bedroom
Open loft in existing dwelling currently used as a play room
No Not being used as a bedroom, and “Open” is an obstacle to use as a bedroom
Basement room >70 ft2 with egress Yes Meets Rule requirements of size and architectural features
Basement >70 ft2 without egress No Lack of egress is an obstacle to use as a bedroom
Use the Design Flow and Soil worksheet in the Forms Section with every design.
Estimated Flow- Class II – IV DwellingsIf flows estimates less than Type I are going to be used for design, water conservation is critical. Water conservation is defined by CIDWT as the management of water resources so as to eliminate waste or maximize efficiency utilizing such methods as using the same water again before it is wasted (becomes wastewater), installing water-efficient plumbing, or wastewater recycling and reuse. MN Rules Chapter 7080.1860 defines flow estimates for a variety of dwelling classifications.
Class IIA study on water use from the 1970’s indicated that, on average, there was one more oc-cupant in a house than the number of bedrooms. Using this information, the MPCA de-veloped a reduced flow estimate for SSTS sizing if the dwellings contain 500 to 800 square feet per bedroom, when the dwelling’s total finished floor area is divided by the number of bedrooms, and where no more than two of the water-use appliances listed in Classification I are installed or anticipated. The design flow for Classification II dwellings is determined by adding one to the number of bedrooms and multiplying this result by 75 gallons.
Class IIIClassification III dwellings are those with less than 500 square feet per bedroom, when the dwelling’s total finished floor area is divided by the number of bedrooms, and where no more than two of the water-use appliances listed in Classification I are installed or anticipated. The design flow for Classification III dwellings is determined by adding one to the number of bedrooms, multiplying this result by 38 gallons, then adding 66 gal-lons. These flow estimates are extremely conservative compared to more recent water use research (Mayer, 1999).
Class IV A Class IV residence has no flush toilet, so the value for Class I, II, or III is reduced by 40 percent: flow x .6.

Section 5: Wastewater Sources and Flows n 5-17
If a dwelling has a graywater system, it is a Class IV residence, and average daily flow is estimated as 60 percent of a similar house as shown in Table 5.2. Effluent from a graywa-ter tank has to enter a soil treatment system for final treatment. It cannot be discharged to the surface. Proper sizing of the soil absorption system is based on Class IV flows and the appropriate soil hydraulic loading rate. See Section 7 for the discussion of the products available for the removal of the flush toilets from the source.
Measuring Flow for design and ManagementFlow measurement is any method used to accurately quantify the flow of liquid. From MN Rules Chapter 7080.1100, Subp. 35, flow measurement means any method to accurately measure water or sewage flow, including, but not limited to, water meters, event counters, running time clocks, or electronically controlled dosing. These meth-ods are discussed below.
Water MetersSeptic systems are becoming more expensive both to install and to repair, so one goal is to design them to treat the actual amount of flow rather than an estimated amount, which may be high or low. Another goal is to get optimum use over the longest possible time from existing systems. In order to achieve these goals, it is helpful to know actual flow rates, which the water meter provides. While it is often necessary to use the values in Table 5.2 to estimate sewage flows, more accurate data should be obtained if possible. For example, if a chain restaurant is to be located beyond the reach of municipal sewer, then data should be obtained from the parent company on water use rates of comparable facilities. A water meter can help ensure successful septic system operation.
To get keep track of the amount of water entering the septic system, include a water meter in the design of the system, or add one to an existing system.
All systems with pump and MSTS (MN Rules Chapter 7081.0230 D) must have a water meter installed, or they must have some other means of measuring flow - such as a run-ning time clock or event counter on a pump.
Water meters come in many different shapes and sizes. Most water meters are designed to deal with clean water, which means that they may not function properly if they are used to measure the flow of sewage. For example, many water meters have small paddles or wheels that move to measure flow. These moving parts can be easily plugged by solids in sewage. One way to avoid this problem is to measure the flow of clean water before it is used in the house.
These meters should measure the water used inside the house, but not the water used outside for watering lawns and gardens, filling swimming pools, or washing cars, since this water does not enter the septic system. A filter to catch small particles should be installed to protect the water meter. Placing the meter after the water softener is common. If it’s difficult to install a water meter so that it does not include the water to be used outdoors, try to estimate outside use, or use only data from December to March, when there is typi-cally no outdoor use of water.
5-18 n Section 5: Wastewater Sources and Flows
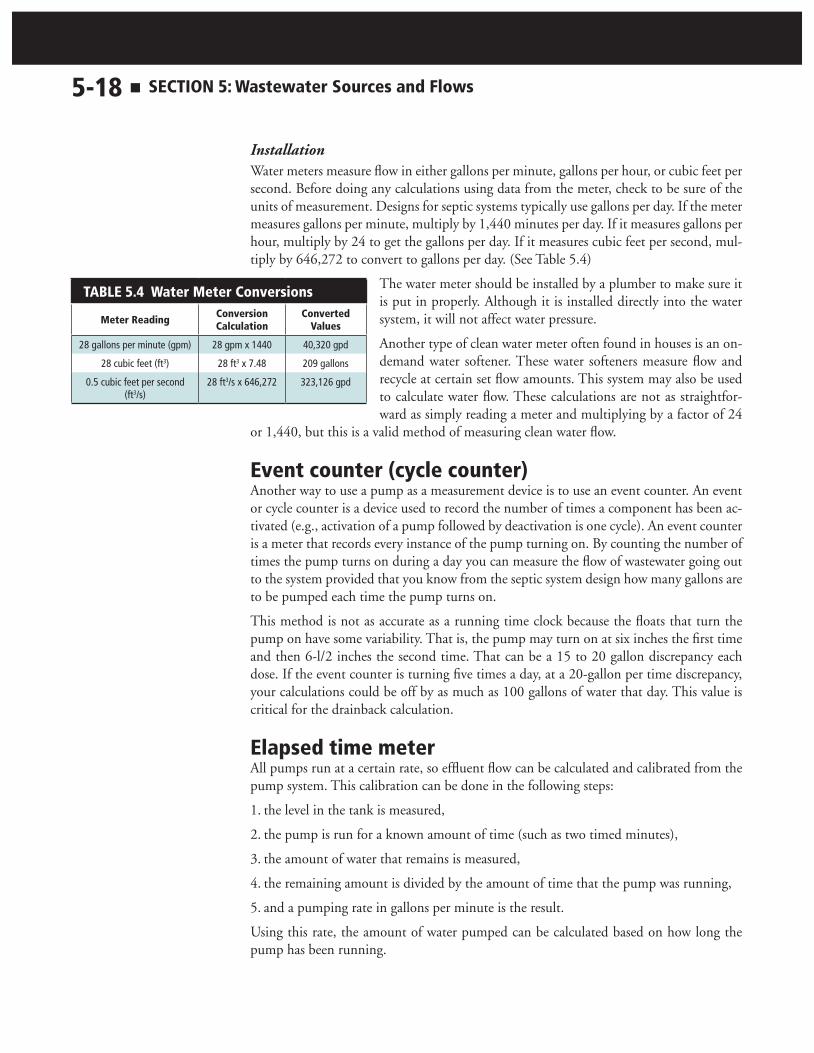
InstallationWater meters measure flow in either gallons per minute, gallons per hour, or cubic feet per second. Before doing any calculations using data from the meter, check to be sure of the units of measurement. Designs for septic systems typically use gallons per day. If the meter measures gallons per minute, multiply by 1,440 minutes per day. If it measures gallons per hour, multiply by 24 to get the gallons per day. If it measures cubic feet per second, mul-tiply by 646,272 to convert to gallons per day. (See Table 5.4)
The water meter should be installed by a plumber to make sure it is put in properly. Although it is installed directly into the water system, it will not affect water pressure.
Another type of clean water meter often found in houses is an on-demand water softener. These water softeners measure flow and recycle at certain set flow amounts. This system may also be used to calculate water flow. These calculations are not as straightfor-ward as simply reading a meter and multiplying by a factor of 24
or 1,440, but this is a valid method of measuring clean water flow.
event counter (cycle counter)Another way to use a pump as a measurement device is to use an event counter. An event or cycle counter is a device used to record the number of times a component has been ac-tivated (e.g., activation of a pump followed by deactivation is one cycle). An event counter is a meter that records every instance of the pump turning on. By counting the number of times the pump turns on during a day you can measure the flow of wastewater going out to the system provided that you know from the septic system design how many gallons are to be pumped each time the pump turns on.
This method is not as accurate as a running time clock because the floats that turn the pump on have some variability. That is, the pump may turn on at six inches the first time and then 6-l/2 inches the second time. That can be a 15 to 20 gallon discrepancy each dose. If the event counter is turning five times a day, at a 20-gallon per time discrepancy, your calculations could be off by as much as 100 gallons of water that day. This value is critical for the drainback calculation.
elapsed time meterAll pumps run at a certain rate, so effluent flow can be calculated and calibrated from the pump system. This calibration can be done in the following steps:
1. the level in the tank is measured,
2. the pump is run for a known amount of time (such as two timed minutes),
3. the amount of water that remains is measured,
4. the remaining amount is divided by the amount of time that the pump was running,
5. and a pumping rate in gallons per minute is the result.
Using this rate, the amount of water pumped can be calculated based on how long the pump has been running.
table 5.4 Water Meter conversions
Meter reading conversion calculation
converted Values
28 gallons per minute (gpm) 28 gpm x 1440 40,320 gpd
28 cubic feet (ft3) 28 ft3 x 7.48 209 gallons
0.5 cubic feet per second (ft3/s)
28 ft3/s x 646,272 323,126 gpd

Section 5: Wastewater Sources and Flows n 5-19
For example, you know that a tank contains 10 gallons per inch of water depth, and the depth of wastewater is three feet. (For information on determining the volume per unit depth of a tank, see page Section 7). A pump is run for two minutes, and now the wastewater is measured as two feet deep. 12 x 10 / 2 = 60 gallons have been pumped in two minutes, so the rate was 30 gallons per minute. Now find out how many minutes the pump runs in the course of a day. If the same pump ran for ten minutes, then during that day it pumped ten times 30 or 300 gallons. This is a quick way to use a pump and a clock to calculate how much water is being used.
Once you know the pump’s rate, check it regularly (annually at a minimum). The rate may slow to the point where it is not evenly distributing wastewater to the soil treatment system, or it may be failing. It is good to know before the pump stops working that there is a problem.
However it is measured, rate of flow is critical data that will allow the best design and operation of the septic system. Flow estimation is a great design tool. It allows for a safety factor and peace of mind. Measured flow is used both to design systems and to verify per-formance. By using both flow figures appropriately, you give the system the best chance of good long-term performance.
other establishments and MStS Hydraulic determinationsThere are three components when determining flow from a non-dwelling. The three com-ponents are dwellings, other establishments and infiltration from the collection system.
1. DwellingsFrom 7081.0120, Subp 1, the design flow for MSTS serving existing dwellings is de‑termined by the following calculation in conjunction with part 7080.1850: the total flow from the ten highest flow dwellings + (total flow from the remaining dwellings * 0.45).
For new housing developments, the developer shall determine and restrict the total number of bedrooms for the development and determine the design flow by multi‑plying the total number of bedrooms by 110 gallons per bedroom. If the ultimate development of phased or segmented growth meets or exceeds the thresholds in part 7081.0040, subpart 1, item B, the initial system or systems and all subsequent sys‑tems require a state disposal system permit (7081.0120, Subp 2).
These methods are allowed due to less variability in flows and typically the number of residents averages out and the peaks flows are lower.
If construction of additional dwellings or bedrooms, installation of additional water‑using devices, or other factors likely to increase the flow volumes can be reasonably anticipated, the MSTS must be designed to accommodate the additional capacity as determined by the local unit of government (7081.01200, Subp 3).

5-20 n Section 5: Wastewater Sources and Flows
Per capita applicabilityFor systems that are operating, an estimate for actual use can be based the people that are currently inhabiting the dwelling. For residential systems, an estimate between 50-75 gal-lons per person can be used for real flows. This is not a design flow but a check against the reading on the flow meters. For example, in a four-bedroom Type I home, the design flow would be 600 gpd; however, when four people are actually living in the home, the real flow should be closer to 4 x 50 gpd= 200 gpd to 4 x 75 gpd = 300 gpd. A measured flow of 500 gpd would point to higher risk due to high use or leaky fixture or components.
Even though size of a residence is used to estimate sewage flow, a sewage treatment system is designed for a certain number of gallons per day, not for a certain size of residence. For example, if a system is sized for 450 gallons a day (a Class I, three-bedroom home), and the home actually discharges 600 or 700 gallons per day, hydraulic failure is likely to oc-cur. The pretreatment unit will be overloaded, and each soil treatment unit has a finite capacity, which, if consistently exceeded, will lead to hydraulic overload of that system.
Table 5.5, from the US EPA 2002 Onsite Wastewater Treatment Systems Manual provides information on typical residential wastewater flows.
table 5.5 residential Wastewater Flows
Study number of residences
Study duration (months)
Study average (gal/person/day)
Study range (gal/person/day)
Brown & Caldwell (1984)
210 66.2 (250.6)a 57.3 – 73.0 (216.9 – 276.3)b
Anderson & Siegrist (1989) 90 3 70.8 (268.0) 65.9 – 75.6 (249.4 – 289.9)
Anderson, et al. (1983) 25 2 50.7 (191.9) 26.1 – 85.2 (98.9 – 322.5)
Mayer et al. (1999) 1188 1c 69.3 (252.3) 57.1 – 83.5 (216.1 – 316.1)
Weighted Average 153 68.6 (259.7)a Based on indoor water use monitoring and not wastewater flow monitoringb Liters per person per day in parenthesesc Based on two weeks of continuous monitoring in each of two seasons at each home(3) From US EPA Onsite Wastewater Treatment Systems Manual, EPA/625/R-00/008, US EPA Office of Water, 2002
In addition to the daily flow variation, seasonal variations may also occur. Typically, waste-water treatment processes are sized to treat the maximum daily flow rather than simply having the capacity to treat the average daily flow. The maximum daily flow is the maxi-mum flow that occurs over the course of a single day, perhaps 450 gallons per day for a typical 3-bedroom home. The average daily flow is the average of the flows that occur during single days over the course of some period of time – perhaps years. This may be 160 gallons per day.

Section 5: Wastewater Sources and Flows n 5-21
2. Other EstablishmentsAccording to MN Rules Chapter 7081.0130 design flows for other establishments are determined by methods A (flow estimates as shown in Table 5.6) or B (using measured flow from a seven‑day period in which the establishment is at maximum capacity or use).
table 5.6 estimated design Sewage Flow from other establishmentsdwelling units (also see outdoor recreation) unit design flow
(gal/ day/unit)
Hotel or luxury hotelguest
square foot55
0.28
Motelguest
square foot38
0.33
Rooming houseresident
add for each nonresident meal45 3.3
Daycare (no meals) child 19
Daycare (with meals) child 23
Dormitory person 43
Labor camp person 18
Labor camp, semipermanent employee 50
commercial/industrial unit design flow (gal/ day/unit)
Retail storesquare foot customer
toilet
0.13 3.8 590
Shopping centeremployee
square foot parking space
11.5 0.15 2.5
Officeemployee/8-hour shift
square foot18
0.18
Medical office*square footpractitioner
patient
1.1275
8
Industrial building*employee/8-hour shift
employee/8-hour shift with showers17.525
Laundromatmachine
loadsquare foot
63552.52.6
Barber shop* chair 68
Beauty salon* station 285
Flea marketnonfood vendor/space
limited food vendor/spacewith food vendor/space
152550

5-22 n Section 5: Wastewater Sources and Flows
table 5.6 estimated design Sewage Flow from other establishments (cont’d)
eating and drinking establishments unit design flow (gal/ day/unit)
Restaurant (does not include bar or lounge)
meal without alcoholic drinksmeal with alcoholic drinks
seat (open 16 hours or less)seat (open more than 16 hours)
seat (open 16 hours or less, single service articles)
seat (open more than 16 hours, single service articles)
3.5830502035
Restaurant (short order) customer 7
Restaurant (drive-in) car space 30
Restaurant (carry out, including caterers) square foot 0.5
Institutional meals meal 5.0
Food outlet square foot 0.2
Dining hall meal 8.5
Coffee shop customer 7
Cafeteria customer 2.5
Bar or lounge (no meals)customer
seat4.536
entertainment establishments unit design flow (gal/ day/unit)
Drive-in theater car stall 5
Theater/auditorium seat 4.5
Bowling alley alley 185
Country clubmember (no meals)
member (with meals and showers)member (resident)
2211886
Fairground and other similar gatherings visitor 1.5
Stadium seat 5
Dance hall person 6
Health club/gym member 35
outdoor recreation and related lodging facilities unit design flow
(gal/ day/unit)
Campground
person with hook-upsite with hook-up
site without hook-up, with central bathsite to be served by dump station
3610062
14.5
Permanent mobile home mobile home 225
Camp, day without meals person 20
Camp, day with meals person 25
Camp, day and night with meals person 45
Resort/lodge hotel person 62
Cabin, resort person 50
Retail resort store customer 4
Park or swimming pool guest 10
Visitor center visitor 13

Section 5: Wastewater Sources and Flows n 5-23
table 5.6 estimated design Sewage Flow from other establishments (cont’d)
transportation unit design flow (gal/ day/unit)
Gas station/convenience store customer 3.5
Service station*
customerservice bay
toiletsquare foot
11502500.25
Car wash* (does not include car wash water) square foot 5
Airport, bus station, rail depotpassenger
square footrestroom
55
565
institutional unit design flow (gal/ day/unit)
Hospital* bed 220
Mental health hospital* bed 147
Prison or jail inmate 140
Nursing home, other adult congregate living resident 125
Other public institution person 105
School (no gym, no cafeteria, and no showers) student 14
School (with cafeteria, no gym and no showers) student 18
School (with cafeteria, gym, and showers) student 27.5
School (boarding) student 95
Churchseat
add for each meal prepared45
Assembly hall seat 4
Miscellaneous
Public lavatory user 5
Public shower shower taken 11
* Waste other than sewage is only allowed to be discharged into the system if the waste is suitable to be discharged to groundwater.
Unless otherwise noted in Table 5.6, the flow values do not include flows generated by employees. A flow value of 15 gallons per employee per eight‑hour shift must be added to the flow amount. Design flow determination for establishments not listed in Table I shall be determined by the best available information and approved by the local unit of government.
For these establishments the waste concentration of the effluent needs to be considered if concentrations of biochemical oxygen demands, total suspended solids, and oil and grease from the sewage are expected to be higher than 175 mg/1, 65 mg/1, or 25 mg/1 respectively. An estimated or measured average concentration must be determined and be acceptable to the local unit of government. System design must account for concentra-tions of these constituents so as not to cause internal system malfunction, such as, but not limited to, clogging of pipes, orifices, treatment devices, or media (7081.0130, Subp. 1).
Measured FlowFrom 7081.0130, Subp. 1(B) the measured design flow of sewage for MSTS serving other establishments is determined by averaging the measured daily flows for a consecutive sev-en-day period in which the establishment is at maximum capacity or use.

5-24 n Section 5: Wastewater Sources and Flows
To calculate the measured design flow, you will need two sets of data:
1. daily flow data, and
2. capacity of the establishment for each day.
A minimum of 90 days of flow during the busiest time of the year is the minimum recom-mended amount of data, but one full year of data is recommended (the more data you have, the greater the confidence you will have). The worksheet “Measured Flow: Other Establishments” in the Forms section of this manual provides a location to calculate these values.
Daily flow should be in gallons per day (gpd). Some water meters give cumulative readings (so that one day the meter may measure 400 gallons, the next day 850 gallons, and the next day 1,200 gallons). If this is the case, make sure to convert the gallons into a per-day unit. In this example, 400 gallons are discharged on day 1; 850 - 450 = 400 gallons for day 2; and 1200 - 850 = 350 gallons for day 3. Make sure you are using the correct units when you use the information to design a system (see Table 5.4).
Capacity of the other establishment should be in the form of percentage full or percentage use. For example, a typical campground may estimate that 60 percent of its campground sites are in use. Remember that percentage is converted to a decimal format by dividing by 100. (60% ÷ 100 = 0.60)
Organize the data by day number, date, flow, and capacity, with additional columns for measured maximum design flow and measured average design flow.
The measured maximum design flow is calculated assuming the facility is at 100 percent capacity; therefore, the daily flows need to be converted to design flows by using the per-centage capacity on that day. Calculate the measured design flow by dividing the percent capacity into the daily flow rate. Let’s say for day 1 the measured flow is calculated as 2,000 ÷ 0.60 = 3,333 gpd. Calculate the measured maximum design flow for each day at 100 percent capacity for each day.
Measured design flow is calculated assuming the facility is at 100 percent capacity; there-fore, the converted flows are used. To calculate measured average design flow, average the seven highest consecutive flows at 100 percent capacity. Calculate the average from days 1-7, then days 2-8, then days 3-9, etc. Select the highest value.
Design Process for Determining FlowThe worksheet “Final Flow Total” in the Forms section should be completed with the fol-lowing information:
1. Calculate flows from dwellings, enter into number 1.
2. Calculate flows from other establishments:
a. If existing establishment: install flow measuring device if one is not present, col-lect daily flow data during the time of peak facility use. A minimum of 90 days is recommended. Calculate flow characteristics from measured flow data (worksheet “Measured Flow: Other Establishments”)
b. Use Table 5.6 (7081.0130) to determine estimated flow. This value must be used for permitting purposes. If measured flow data is not available this value will also be used for design flow. Refer to worksheet “Measured Flow – OE” in the forms section.

Section 5: Wastewater Sources and Flows n 5-25
c. Compare calculated flow to measured flow data. Based on best professional judg-ment on consultation with facility owner regarding current and future use provide documentation and LGU enter the appropriate value into number 2.
3. Add in I & I under number 3. According to MN Rules Chapter 7081.0140, the design flow must also include 200 gallons of infiltration and inflow per inch of col-lection pipe diameter per mile per day with a minimum pipe diameter of two inches to be used for the calculation. Flow values are allowed to be further increased if the system employs treatment devices that are exposed to atmospheric conditions that will infiltrate precipitation. Flow estimates as calculated in this chapter shall not be relied upon for the design of collection systems.
4. Refer to code and design guidance and consult with LGU as to required design flow rate for various components in the system include grease traps, septic tanks, surge tanks, pretreatment unit and soil treatment area.
5. It is recommended that the operating permit have a mitigation trigger at 70% of design flow.
Design best-practices checklistn Be sure to check with the local government unit before any changes are made to
the onsite system.
n Route your furnace, water softener and iron filter discharge out of the onsite system.
n This water can be day-lighted to the surface as long as it does not directly discharge into a water body. Alternatively, it can go into an existing drywell or abandoned drain field. If it is day lighted, remember that this water contains salt and can be hard on vegetation.
n Install a small separate section of drainfield to deal with this water (no tank is needed). In most cases 20-50 feet should be sufficient.
n If only the furnace water is being added, this can go into the onsite system, but a sump or other device to collect the water must be used so water is not trickling out, causing freezing problems.
n If rerouting is not an option, a good solution for everyone is to minimize the amount of salt and water used by the softener or iron filter.
n Reduce the total volume of water used in the home
n Adjust the water softener or iron filter to recharge less frequently. Adjusting the frequency can be done by lengthening the time between recharges on a timed unit or increasing the volume of water passing through the unit before recharging on a metered unit.
3. Infiltration from the Collection SystemAccording to MN Rules Chapter 7081.0140, the design flow must also include 200 gal-lons of infiltration and inflow per inch of collection pipe diameter per mile per day with a minimum pipe diameter of two inches to be used for the calculation. Flow values are allowed to be further increased if the system employs treatment devices that are exposed to atmospheric conditions that will infiltrate precipitation. Flow estimates as calculated in this chapter shall not be relied upon for the design of collection systems.

5-26 n Section 5: Wastewater Sources and Flows
Waste characteristics: Waste Strength componentscomponents of WastewaterEffluent quality is the physical, biological, and chemical characteristics of a liquid flowing from a component or device. The components of wastewater may be divided into four categories:
n Biochemical oxygen demand, total suspended solids and fats, oils and grease (BOD
5 , TSS, FOG),
n Pathogens (fecal coliform, viruses),
n Nutrients (nitrogen, phosphorus), and
n Other chemicals.
Table 5.7 shows typical concentrations of these components in raw waste, septic tank ef-fluent, and soil.
table 5.7 unsaturated Flow during Soil treatment of Septic tank effluent
parameter raw waste septic tank effluent
one foot below trench bottom
three feet below trench bottom
BOD5 (mg/L) 270-400 140-220 B BTSS (mg/L) 300-400 45-65 B B
fecal coliform (MPN/100ml)
1,000,000-100,000,000
100,000-1,000,000,000
B-100 B
viruses (PFU/ml) unknown 1,000-1,000,000,000 B-1,000 BNitrogen (mg/L)
total NH4NO3
100-150 60-120
<1
50-60 30-60
<1
—
*B-60 *B-40
— *B
*B-40total phosphorus
(mg/L)10-40 10-30 *B-10 *B-1
* B = backgroundMagdorf et al., 1974
The waste strength of sewage and effluent as it passes through a treatment system can in-dicate the performance of a septic system. Understanding how these components enter the waste stream and are removed through the treatment process is critical for system designers and service providers. This section will describe these wastewater components.
Waste StrengthResidential strength effluent is defined as septic tank effluent or other treatment device with a BOD
5 less than or equal to 170 mg/L; TSS less than or equal to 60 mg/L; and fats,
oils, and grease less than or equal to 25 mg/L.
High-strength wastewater is defined as:
1. influent having BOD5 greater than 300 mg/L; and/or TSS greater than 200 mg/L;
and/or fats, oils, and grease greater than 50 mg/L entering a pretreatment component (as defined by NSF Standard 40 testing protocol);
2. effluent from a septic tank or other pretreatment component that has BOD5 greater
than 170 mg/L; and/or TSS greater than 60 mg/L; and/or fats, oils, and grease greater than 25 mg/L and is applied to an infiltrative surface.

Section 5: Wastewater Sources and Flows n 5-27
biochemical oxygen demands (bod5), dissolved oxygen, and total Suspended Solids (tSS)Biochemical oxygen demand (BOD
5) is the most widely used parameter applied to waste-
water. BOD5 is a measure of the dissolved oxygen required by microorganisms to oxidize or
decompose the organic matter in wastewater. A typical BOD5 value for septic tank effluent
is 150 milligrams per liter. For a Type I system, the BOD5 limit is 175 milligrams per liter.
When the dissolved oxygen (DO) contained in septic tank effluent is measured, it is usu-ally very low, typically one milligram per liter. While DO in water can be as high as 12 milligrams per liter, the microorganisms in the septic tank normally use up any available oxygen to break down organic matter.
Total suspended solids (TSS) is a measure of the solids that remain in the wastewater after settling has occurred in the tank. A typical TSS value is 65 milligrams per liter. BOD and total suspended solids together measure the strength of the wastewater. They can serve as an indicator of system performance. Table 5.8 identifies estimated BOD for other estab-lishments. The data is taken from a CIDWT Publication entitled, Analyzing Wastewater Treatment Systems Serving Residential and Commercial Facilities for High Strength and Hydraulic Loading, 2008. You can calculate the estimated concentration of BOD
5 by using
the following equation:
Concentration (mg/L) = # lbs BOD5 ÷ Q(gpd) ÷ 8.35 X 1,000,000
table 5.8 estimate of Waste Strengths from other establishments
type of Facility bod (lbs/unit/day)
Airports Per passenger Per employee
.02 .05
Apartment houses– multiple family .175/unitBoarding houses .14/personBowling alley (no kitchen) .15/laneCamps Construction (Semi-permanent) Day (no meals) Luxury Resort - night & day/limited plumbing
.140/person
.031/person
.208/person
.140/personChurch (no kitchen) .02/seatCountry club .208/memberDwelling– single family .17/personEmployee/personnel addition .04/employeeFactory No showers With showers
.073/employee
.083/employee
Hospital .518/bed
Hotel0.125 per room/
two personMobile home park .140/personMotel per bed space Per room w/ bath, toilet & kitchen wastes
0.083/bed
0.14/person

5-28 n Section 5: Wastewater Sources and Flows
table 5.8 estimate of Waste Strengths from other establishments (cont’d)Nursing home .26/personOffice building (no food) .05/employeePark toilet wastes only bathhouses, showers and flush toilets
0.01/person 0.021/person
Restaurant Kitchen waste Toilet and kitchen waste Additional for bars and cocktail lounges
0.015/meal
0.021/customer 0.01/customer
School, day Add for gym/showers Add for cafeteria
0.031/student 0.011/student 0.011/student
School, boarding 0.208/studentService station 0.021/vehicle servedShopping center (no food service or laundry) 0.050/employeeSports stadiums 0.20/personStores 0.832/toilet roomSwimming pools and bathhouses 0.021/personTheaters Drive-in Indoor
.010/car space
.010/seatTrailer Park 0.35/trailer
types of bodBiochemical Oxygen DemandBOD or Biochemical Oxygen Demand is the quantity of dissolved oxygen consumed by microorganisms during the microbial and chemical oxidation of the constituents con-tained in a wastewater sample during an incubation period at a given temperature. The biochemical oxygen demand represents the oxygen utilized during the oxidation of both carbon and nitrogenous compounds.
Biochemical Oxygen Demand (BOD5) BOD
5 or Biochemical Oxygen Demand – 5-day is the quantity of dissolved oxygen con-
sumed by microorganisms during the breakdown of organic matter in a wastewater sample during a 5-day incubation period and measured in mg/L at 20oC. It is used as a means to describe the amount of organic matter present in the water.
Biodegradable organic matter is provided in terms of pounds of BOD5 per person (capita)
per day by using the BOD5 concentration and daily flow. Biochemical oxygen demand
is a measure of the oxygen required by bacteria, chemicals, and other organisms to break down organic matter over a five day period. It is an indicator of the overall strength of the wastewater. Most designs assume that all residential sources generate a concentration of 300 mg/L of BOD
5, and after pretreatment in a properly sized septic tank the BOD
5 is
reduced to approximately 170 mg/L (Table 5.7). However, these concentrations can vary from site to site.
Carbonaceous Biochemical Oxygen Demand (CBOD)CBOD or Carbonaceous Biochemical Oxygen Demand is the quantity of dissolved oxy-gen consumed by microorganisms during the breakdown of organic carbon in a wastewa-ter sample during an incubation period of 5 days at 20°C. An inhibitor is placed in the sample to prevent growth of nitrogenous oxidizing microbial populations. It is used as a

Section 5: Wastewater Sources and Flows n 5-29
means to describe the amount of organic carbon present in the water that can be broken down with microbial processes.
Nitrogenous Biochemical Oxygen Demand (NBOD)NBOD or Nitrogenous Biochemical Oxygen Demand is the quantity of dissolved oxygen consumed by microorganisms during the oxidation of nitrogenous compounds such as protein and ammonium in a wastewater sample during an incubation period of 5 days at 20°C. It is used as a means to describe the amount of organic nitrogen (such as urea, proteins, etc.) present in the water. It is not usually used in typical wastewater analysis.
Ultimate Biochemical Oxygen Demand (UBOD)Ultimate Biochemical Oxygen Demand is the measure of the oxygen required to com-plete the breakdown of the organic matter. The UBOD consists of summing the oxygen demand required to oxidize the organic matter in the wastewater, synthesize the organic matter into new cell tissue, and the endogenous respiration where cell tissue is consumed by other microbes to obtain energy for cell maintenance. The UBOD is not typically a value measured in lab analysis.
impact of bod5 on SystemsA high BOD
5 (> 175 mg/L) can cause the growth of excessive biomass that can clog and
shorten the lifespan of the components in the system. High BOD5 levels are caused by
high organic loading to the system. In a residential system, the number of people in the house could be greater than that for which the system was designed and originally con-structed. In this situation it is also possible that the concentration might not be elevated, but the overall organic mass loading could be significantly higher. An elevated BOD
5
concentration could also be influenced by the activities that are happening at the source. In homes or restaurants, the presence of a garbage disposal, the types of foods prepared and methods to prepare them can increase the BOD
5 levels. In a home, a large portion of
BOD5 is produced from toilet water. Toilet water also produces a large part of the natural
microorganisms.
High BOD5 in the effluent moving to the downstream components of the treatment
train could be caused by reduced biological activity in the onsite wastewater treatment system. Chemicals used by the source may play a large role in inhibiting the reduction of the BOD
5, therefore causing a high effluent BOD
5 concentration. Onsite wastewater
treatment systems use naturally existing microorganisms to reduce the contaminants and treat wastewater. During treatment, the microorganisms feed on constituents in the waste-water, reducing their concentration and resulting in cleaner wastewater. Harsh chemicals, such as bleach, detergents, cleaners, and disinfectants, can kill these microorganisms and reduce their ability to breakdown contaminants such as BOD
5.
Low BOD5 from a home may be due to a low occupancy or a low number of meals pre-
pared at home. A low BOD5 concentration may also be created through dilution from
higher than normal hydraulic flows into the wastewater treatment system. This dilution effect could be due to the extra use of appliances, such as laundry machines, Jacuzzis, or long showers. Leaking fixtures can also add extra water. If clear water sources such as water treatment systems or condensate drains are plumbed into the system, the increase in carriage water volume will dilute the constituents in the wastewater and decrease the concentration of food supply. Commercial systems may have a low BOD
5 if a low percent-

5-30 n Section 5: Wastewater Sources and Flows
age of the wastewater comes from the bathroom and the rest comes from sources with low BOD
5 contributions with significant carriage water volume.
In typical wastewater treatment trains, your senses may assist in estimating relative BOD5
concentrations. You can recognize BOD5 levels that are not average by the clarity of the
water. Clear water is an indication of a low BOD5 level. The cloudier the wastewater is, the
higher the organic loading. This assumes suspended clays are not part of the waste stream. If the wastewater odor is sour and rancid or if it smells like a detergent or a cleaner, this may be a sign that chemicals are present that can inhibit biological treatment, resulting in a high BOD
5.
Chemical Oxygen Demand (COD)Chemical Oxygen Demand (COD) is a measure of the amount of organic matter oxidized by a strong chemical oxidant. COD is used to measure organic matter in commercial, industrial, and municipal wastes that contain compounds toxic to biological life where the BOD
5 test would not work. The COD levels in a wastewater sample are almost al-
ways greater than BOD5 levels because more compounds can be chemically oxidized in
the COD test than can be biologically oxidized in the BOD test. In most cases, once the COD/BOD
5 relationship is known for a particular facility, the COD concentration of a
sample can be used to approximate the BOD5 concentration. The COD test can generally
be done within 2.5 hours, whereas a BOD5 test takes five days. A COD test is performed
when a quick determination of oxygen demand is needed.
total Suspended Solids (tSS) Total suspended solids or TSS is the most common measure of the amount of solids in wastewater effluent. TSS) is the measure of all suspended solids in a liquid, typically ex-pressed in mg/L. It is measured by filtering a well-mixed sample through a standard glass fiber filter and drying the residue retained on the filter at 217 to 221 degrees F (103 to 105 degrees C). The increase in the weight of the filter represents the amount of total suspended solids.
Other terms and measurements of solids in wastewater treatment systems are:
n solids, settleable: suspended solids that will settle out of suspension within a speci-fied period of time, expressed in milliliters per liter (mL/L).
n solids, total (TS): mineral, cells, etc. left in wastewater after evaporation of the water fraction at 103 degrees C, typically expressed in mg/L.
n solids, total dissolved (TDS): material that passes a standard glass fiber filter, and remains after evaporation at 103 degrees C, typically expressed in mg/L.
n solids, volatile: weight loss on ignition of total, solids, not distinguishing between inorganic and organic matter and including loss due to decomposition or volatiliza-tion of some mineral salts at 550 degrees C.
TSS and BOD5 are typically the two parameters used to measure wastewater strength and
treatment performance relating to organic/inorganic matter. TSS (as stated earlier) is mea-sured by performing a solids analysis but can also be estimated by a turbidity test. Turbid-ity is the physical clarity of the water and is an indicator of the presence of suspended mat-ter in wastewater. A “quick and dirty” TSS test can be determined with an Imhoff Cone. A visual test will determine if TSS levels are high or low when a sample of wastewater is placed in a cone against a light background.

Section 5: Wastewater Sources and Flows n 5-31
Impact of TSS on systemsHigh TSS can place a great demand on the downstream devices and could lead to clogged components and orifices in distribution manifolds. High TSS can result from:
n The system being under-designed for the source supply
n Use of low flow fixtures—although they conserve water, they do not reduce the constituent mass loading and result in higher concentrations
n Use of a garbage disposal
n Kitchen practices—e.g., kitchen clean-up, food preparation, or cuisine
n Above average use of toilet paper, which can be broken down biologically but only by fungus, which needs air to function. Microbes present in septic tanks typically do not break down paper products which are wood-based.
n Laundry machines—due to clothing fibers, clay, or soils present on the clothes.
The volume of dirt or grime present in the laundry will directly relate to the habits, hob-bies, and occupation of the residents.
Although low TSS is not a problem for the system, it could indicate that something else is wrong with the system. Low TSS could be due to:
n Fewer users on the system than considered in the original design.
n Higher flows from low TSS sources.
n Clear water inflows.
Fats, oils and grease (Fog)FOG (fats, oils, and grease) is a constituent of sewage typically originating from food stuffs (animal fats or vegetable oils) or consisting of compounds of alcohol or glycerol with fatty acids (soaps and lotions), typically measured in mg/L.
Sources of FOGFat found in onsite wastewater treatment systems is animal fat, oil is from vegetable and cooking oils, and grease is from petroleum based soaps. FOG are generally treated in on-site wastewater treatment systems by separating them from the wastewater stream. At high temperatures FOG are in a liquid state, but as the temperature cools, the fats component will solidify (Table 5.9). FOG can be trapped in pretreatment components, such as septic tanks and grease traps, where they typically float to the top of tanks. They are less dense and lighter than water. It is important to try to contain FOG early in the system, because they can accumulate inside pipes and lead to clogging of downstream components. FOG also contribute to BOD
5 and TSS concentrations. FOG in excessive amounts interfere
with aerobic biological processes and lead to decreased treatment efficiency. The expected levels of FOG concentration must be considered during wastewater treatment design.

5-32 n Section 5: Wastewater Sources and Flows
table 5.9 characteristics of fats, oils and grease in wastewater.
constituent State at room temperature1 derived From comments2
Fats Solid Animal fat Non-toxic to the system
Oils Liquid Vegetable and cooking oils Non-toxic to the system
Grease Liquid Petroleum based products: soaps, hair conditioners,
tanning oils, oil/grease on hands/clothes, bath oils, etc.
Residual material on appliances; solid material attached to pans/equip-ment; may potentially be
toxic to microbes commonly present in the wastewater
treatment system.1 Room temperature assumes 80°F.2 Warning: the use of a degreaser will move all of these components through the wastewater system
FOG in domestic wastewater will generally originate in the kitchen or bathroom. Kitchen FOG usually come from disposing animal- or vegetable-based food scraps and liquids down the sink. Households using garbage disposals will have 30-40 percent more FOG than households not using garbage disposals. Bath oils, sun tan lotions, hair conditioners, and moisturizing creams are bathroom sources of FOG that enter the wastewater stream. An increased use in cooking oils, lotions, and hair conditioners will directly increase the FOG concentration in the wastewater.
Low FOG, although it is not considered a problem, could be the result of not using the kitchen or of higher than normal flows entering the system. Low FOG can also be attrib-uted to the use of bar soap instead of liquid soaps.
Impact of FOG on systemsFatAnimal fat is relatively easy to hold in a tank because it’s quite sensitive to temperature. It becomes a solid at 80°F, and wastewater temperature is usually less than 80°F. Animal fat will break down in the soil, but it takes four times more energy to break down than the organic matter typically measured by BOD
5. Fat is added to the system from cooking,
clean up, and dish washing, so commercial systems will typically have higher levels of fat than residential systems. If a system is supplied with a lot of animal fat, it will typically stay in the septic tank. If it is contained in the septic tank, it may not be observed in FOG measurements in downstream components.
OilsVegetable oil is not as sensitive to temperature as fat and can pass through the system. Oil can also be broken down through a biological process, but it takes 12 times more energy to break down oil than the organic matter typically measured by BOD
5. There are many
different types of oils used, but vegetable is the most common. Vegetable oil is often used in the liquid form, but it can also be solid shortening. The liquid form is harder to hold in a tank. Table 5.10 lists several different types of fats and oils that are commonly used and lists their physical properties.

Section 5: Wastewater Sources and Flows n 5-33
table 5.10 cooking fat and oil physical properties (adapted from cia, 1996)
50 Substance Melting Point (oF) density (g/ml) @ 59-68 (oF)
Corn Oil 12 0.923
Olive Oil 32 0.918
Vegetable Oil n/a 0.910
Canola Oil 14 0.92
Soy-bean Oil 3.2 0.92
Sunflower Oil 2 0.919
Cottonseed Oil 55 0.926
Shortening 115 n/a
Lard (Fat) 86 0.919
The ability of the oil to separate is influenced not only by temperature, but also by how the oil was generated and used. Free oil will rise to the wastewater surface and be easily separated when the mixture is allowed to become quiescent. Emulsified oil has been bro-ken up into very small droplets and occurs either by mechanical or chemical action. An example of mechanical emulsification is when extremely hot water from a dishwasher is mixed with the oil. Given time and a decrease in temperature, this oil can be separated. Chemical emulsification occurs when detergents or cleaners produce a mix of oil and wa-ter. Degreasing compounds can generate dissolved oils, in which discrete oil particles are no longer present. Chemically emulsified oil will take a longer time to separate, increasing the risk of carrying it to downstream components unless long quiescent periods are avail-able to allow separation.
GreaseGrease is petroleum-based and can be toxic to a system. Because grease is petroleum-based, it cannot be broken down, but it can be separated. Grease comes from lotions, hair products, and soaps. Typically, there will be a higher percentage of grease in the FOG from residential systems when compared to most commercial systems. Grease can build up over time, coating components and inhibiting treatment of other constituents in the wastewater.
Design Process for HSWa. Evaluate reference documents for potential of generating HSW.
b. Evaluate other establishment sources using Facility Use Survey. See attachment.
c. Sample effluent from the existing system, if possible.
i. When. The system should be sampled within 18 hours of known peak usage. It is optimum if the tank is not in need of pumping (worst case) and not pumped recently (best case) to get a representative sample.
ii. Where. It is best to sample from the outlet of the last septic tank or pump tank.
iii. How. Samples can be either pumped from the wastewater surface inside the baffle of the tank or a bottle can be lowered into the gap taking the sample as near to the wastewater surface as possible. The sides of the baffle should be avoided so that the FOG buildup on the baffle wall is not added into the sample. If a sample is taken from a pump tank be sure to move aside a scum layer if it exists.

5-34 n Section 5: Wastewater Sources and Flows
d. Either with estimates or measurements determine if the design must account for high strength wastewater.
e. Calculate the projected loading to the downstream components in lbs of BOD5 per day.
biological treatment ProcessesWastewater oxygen StatesTo fully understand the biological treatment process the oxidation states in a system are critical. Oxidation is:
1. the chemical reaction in which a loss of electrons results in an increase in oxidation number (valence) of an element; occurs concurrently with reduction of the associated reactant;
2. the chemical or biological conversion of organic matter to simpler, more stable forms in the presence of oxygen with a concurrent release of energy and
3. the process of a substance combining with oxygen.
These treatment process can either occur under aerobic, anaerobic or anoxic conditions.
1. aerobic: having molecular oxygen (O2) as a part of the environment, or a biologi-
cal process that occurs only in the presence of molecular oxygen. Typically aerobic bacteria demoninate in this environment that can metabolize only in the presence of molecular oxygen.
2. anaerobic: absence of molecular oxygen (O2) as a part of the environment, or a
biological process that occurs in the absence of molecular oxygen; bound oxygen is present in other molecules, such as nitrate (NO
3-) sulfate (SO
42-) and carbon dioxide
CO2. Anaerobic bacteria dominate in this state because they are able to metabolize in
the absence of molecular oxygen
3. anoxic: condition in which all constituents are in their reduced form (no oxidants present); conditions in a septic tank are generally anaerobic, but not anoxic; see also aerobic and anaerobic.
Biological processes for treatment take many different forms, including die-off, preda-tion, oxidation, and mineralization. Natural die-off occurs when pathogens are held in nutrient-poor aerobic conditions. Predation occurs when microorganisms attack and de-stroy pathogenic bacteria and viruses. Biological oxidation occurs when bacteria break down organic matter into water and carbon dioxide (CO
2). Oxidation reduces BOD
5,
removes pathogens, and works best under aerobic conditions. Mineralization transforms organic nitrogen into inorganic forms of nitrogen that can become part of other biologi-cally driven treatment processes, such as nitrification and denitrification.
The microbes that are used for biological treatment require food (which is the constituents in the wastewater) and an environment consisting of optimal conditions. The following parameters can influence the effectiveness of treatment by influencing the performance of the microbes:
n Dissolved oxygen (DO)
n pH
n Temperature

Section 5: Wastewater Sources and Flows n 5-35
These parameters are used as indicators for the presence of other constituents in the waste-water. If one of these parameters is not in the expected range, then it can be assumed that the wastewater is not being properly treated, because the microbes cannot function properly. All of these parameters can be evaluated in the field. If one of them is out of the expected range, lab tests evaluating other constituents and system performance should be run.
Dissolved Oxygen (DO)Dissolved Oxygen (DO) is the amount of oxygen dissolved in water. It is influenced mainly by temperature, barometric pressure (altitude), and water salinity. As temperature decreases, the amount of dissolved oxygen that can be accepted by water increases until it becomes saturated.
The three oxygen states are aerobic, anaerobic, and anoxic conditions. The term aerobic is defined as having molecular oxygen (free oxygen, O
2) as a part of the environment or a bio-
logical process that occurs only in the presence of molecular oxygen. An anaerobic condition is the absence of molecular oxygen as a part of the environment or a biological process that occurs in the absence of molecular oxygen but can utilize oxygen bound in other molecules, such as nitrate (NO
3-). Anoxic is the condition in which all wastewater and/or effluent con-
stituents are in their reduced form, meaning there are no oxidants present.
The microorganisms (bugs) that are used for biological treatment can be categorized by the state of oxidation in which they operate. These categories of microorganisms include:
n Aerobes – thrive in aerobic conditions
n Anaerobes – thrive in anaerobic conditions
n Facultative – thrive in both aerobic and anaerobic conditions
Free oxygen (O2) is needed for aerobic treatment to take place, and aerobic
bacteria need oxygen to grow and live. Aerobic organisms respire dissolved oxygen contained in the water. Anaerobic bacteria grow and live in the ab-sence of free oxygen. Facultative organisms have the ability to respire free oxy-gen when it is available and shut down the respiration process when dissolved oxygen is lacking. Table 5.11 gives the desired ranges of DO in wastewater.
Anaerobic bacteria are significantly slower at oxidation and smaller in size than aerobic bacteria (Figure 5.3), but they are much more resilient to environmental changes. Aerobic microorganisms are more sensitive to wastewater parameters (such as DO, pH and temperature), but in optimal conditions, they digest or-ganic matter and pathogens more rapidly than do anaerobic organisms.
table 5.11 ideal dissolved oxygen range in Wastewater
Microbes anaerobe Facultative aerobe
Low DO (mg/L) 0 0 0.5
High DO (mg/L) 0.5 5 5
Typical (mg/L) 0-0.3 0-1 1-3
The septic tank is typically considered an anaer obic treatment component, although there can be aerobic zones. For the most part, septic tank microbes assimilate the waste con-stituents in the absence of a respiration process and are commonly referred to as anaerobic microbes. Facultative microbes utilize free oxygen or assimilate waste without respiration. During assimilation of waste, the bonds holding the oxygen are broken and allow the
Figure 5.3 relative Size of anaerobic and aerobic bacteria

5-36 n Section 5: Wastewater Sources and Flows
compounds to react with other components (i.e., SO4 H
2S). Therefore, septic tanks can
have both anaerobic and facultative bacteria treating the wastewater.
The anaerobic bacteria do not thrive in environments with free oxygen. Water entering the septic tank has dissolved free oxygen which must be removed by the oxygen requirements of the wastewater so the anaerobic bacteria can survive. As the system matures, the anaero-bic bacteria become more efficient. The oxygen demand in the system rapidly removes free oxygen entering with the influent and maintains the anaerobic environment. The greater removal rates of BOD and TSS are achieved under this fully anaerobic environment.
If the water source has low DO, then the amount of DO entering the onsite wastewater treatment system will be low. Low DO in the wastewater could also be caused by a high organic load. In aerobic treatment processes, high concentrations of BOD
5, FOG, and
nutrients will exhaust the oxygen in the wastewater. This is because the microbes present in the system require more oxygen to break down the increase in food.
High DO can be attributed to the water source and/or dilution due to leaking fixtures or infiltration. Also, if there is a significant amount of dead microbes in the system due to a chemical upset, a high DO may result. The microbes are not robust and are not depleting the oxygen supply.
Although high or low DO is not a contaminant, it can be used as an indicator. Low DO is expected in the septic tank, but should be greater than 1.0 mg/L in the aeration com-ponent. Be cautious when sampling for DO not to add oxygen. In addition, the sampling method may be faulty and give inaccurate readings.
pHpH is a term used to describe the relative amount of acidity or basicity in the wastewater. Low pH values indicate a high concentration of hydrogen ions (acids) in solution, and high pH values indicate a low concentration of hydrogen ions (basic). The pH value can range from 1 to 14 with a value of 7 being neutral. The ideal pH in wastewater will typi-cally be around the neutral range (Table 5.12).
High pH (basic conditions) can be caused by certain laundry detergents, cleaning agents, chemicals, and low alkalinity source water. Photo developing labs and laundromats are common sources of wastewater that cause high pH. As the pH rises, the microbial popula-tion changes to organisms less efficient in the breakdown of wastewater.
Low pH (acidic conditions) can be influenced by cooking habits, low alkalinity in the water supply or acid-based cleaners. If there is an above normal use of dairy products, cof-
fee, excessive baking, or home canning, lower pH levels in the wastewater stream are likely. Just like high pH levels, low pH levels will only allow certain microbes to survive, adversely influencing wastewater treatment. The microbes at low or high pH are not as efficient as the microbes that can survive at an average pH level.
The pH level can be easily identified by the odor of the system. Low pH has a very acidic smell that absorbs readily into clothing and is hard to get
rid of. High pH often smells like the chemical or cleaner that was used at the wastewater source that is causing the high pH. Over a relatively short period of time, our olfactory sensors become accustomed to an odor. As a result, the odor test can only be used at the very start of a testing or inspection before our senses get used to the odor.
table 5.12 ideal range for pH in wastewater
ideal range in Wastewater
Low pH < 6.5
Ideal 7
High pH >7.2
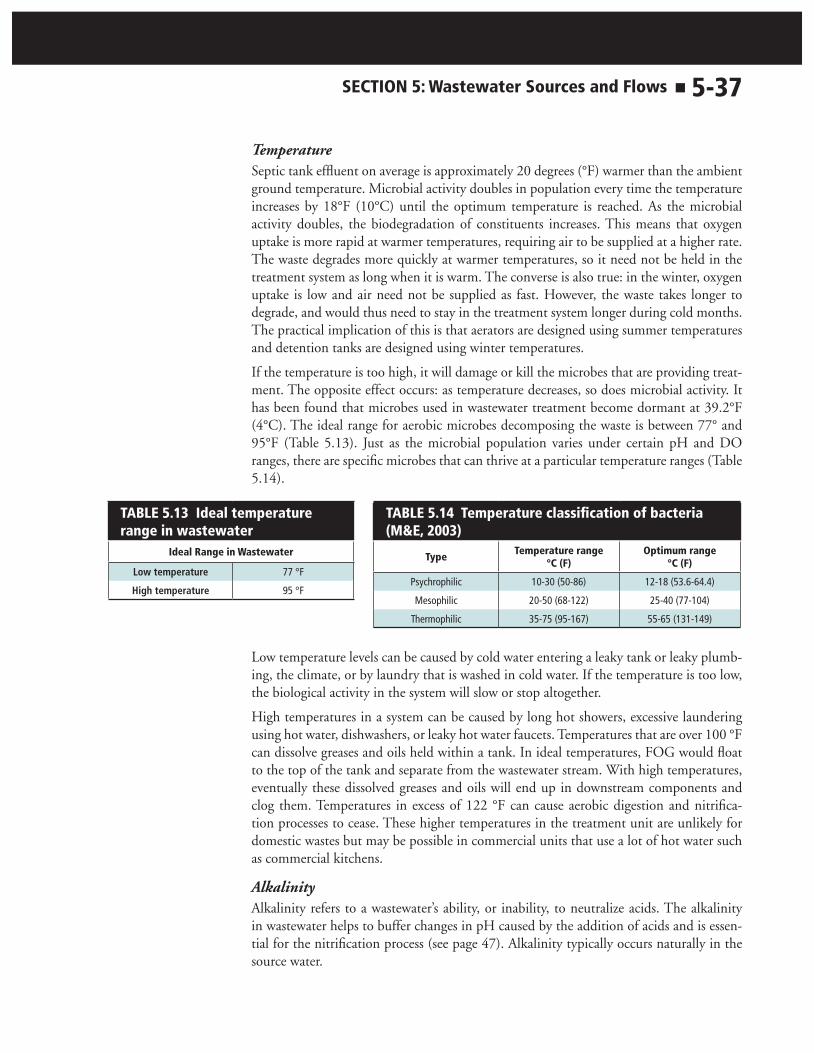
Section 5: Wastewater Sources and Flows n 5-37
TemperatureSeptic tank effluent on average is approximately 20 degrees (°F) warmer than the ambient ground temperature. Microbial activity doubles in population every time the temperature increases by 18°F (10°C) until the optimum temperature is reached. As the microbial activity doubles, the biodegradation of constituents increases. This means that oxygen uptake is more rapid at warmer temperatures, requiring air to be supplied at a higher rate. The waste degrades more quickly at warmer temperatures, so it need not be held in the treatment system as long when it is warm. The converse is also true: in the winter, oxygen uptake is low and air need not be supplied as fast. However, the waste takes longer to degrade, and would thus need to stay in the treatment system longer during cold months. The practical implication of this is that aerators are designed using summer temperatures and detention tanks are designed using winter temperatures.
If the temperature is too high, it will damage or kill the microbes that are providing treat-ment. The opposite effect occurs: as temperature decreases, so does microbial activity. It has been found that microbes used in wastewater treatment become dormant at 39.2°F (4°C). The ideal range for aerobic microbes decomposing the waste is between 77° and 95°F (Table 5.13). Just as the microbial population varies under certain pH and DO ranges, there are specific microbes that can thrive at a particular temperature ranges (Table 5.14).
table 5.13 ideal temperature range in wastewater
ideal range in Wastewater
Low temperature 77 °F
High temperature 95 °F
table 5.14 temperature classification of bacteria (M&e, 2003)
type temperature range °c (F)
optimum range °c (F)
Psychrophilic 10-30 (50-86) 12-18 (53.6-64.4)
Mesophilic 20-50 (68-122) 25-40 (77-104)
Thermophilic 35-75 (95-167) 55-65 (131-149)
Low temperature levels can be caused by cold water entering a leaky tank or leaky plumb-ing, the climate, or by laundry that is washed in cold water. If the temperature is too low, the biological activity in the system will slow or stop altogether.
High temperatures in a system can be caused by long hot showers, excessive laundering using hot water, dishwashers, or leaky hot water faucets. Temperatures that are over 100 °F can dissolve greases and oils held within a tank. In ideal temperatures, FOG would float to the top of the tank and separate from the wastewater stream. With high temperatures, eventually these dissolved greases and oils will end up in downstream components and clog them. Temperatures in excess of 122 °F can cause aerobic digestion and nitrifica-tion processes to cease. These higher temperatures in the treatment unit are unlikely for domestic wastes but may be possible in commercial units that use a lot of hot water such as commercial kitchens.
AlkalinityAlkalinity refers to a wastewater’s ability, or inability, to neutralize acids. The alkalinity in wastewater helps to buffer changes in pH caused by the addition of acids and is essen-tial for the nitrification process (see page 47). Alkalinity typically occurs naturally in the source water.

5-38 n Section 5: Wastewater Sources and Flows
PathogensThe most critical component, in terms of what must be removed from wastewater, is pathogens. Pathogens are organisms that cause disease; they include viruses, protozoa, and bacteria. Examples in wastewater include Salmonella, Vibrio cholera, Entamoeba his-tolytica, and Cryptosporidium although almost all disease organisms could be present in wastewater. Viruses are organism too small to be seen by light microscopy. They are an obligate parasite dependent on a host cell for its metabolic and reproductive needs. Patho-gens may be found in wastewater generated anywhere in the house. Any human contact with water results in the potential to add pathogens to the environment. Because of their role in spreading disease, pathogens in wastewater make wastewater treatment a public health issue.
Fecal Coliform (FC)Some of the microorganisms found in wastewater can cause disease while others are harm-less. It is nearly impossible to identify all the pathogenic organisms in wastewater. Fecal co-liform bacteria is an indicator bacteria common to the digestive systems of warm-blooded animals that is cultured in standard tests to indicate either contamination from sewage or the level of disinfection generally measured as number of colonies/100 mL or Most Prob-able Number (MPN). It is the most common test for pathogens because it is a relatively easy and inexpensive test. MN Rules Chapter 7080.1100, Subp. 30, defines fecal co‑liform as the bacteria common to the digestive systems of humans that are cultured in standard tests. Counts of these organisms are typically used to indicate potential contamination from sewage or to describe a level of disinfection, generally expressed in colonies per 100 mL. A colony-forming unit (cfu) is the term used to report the esti-mated number of bacteria in a water sample. Fecal coliform bacteria are fairly easy to test for, and their presence is an indication that other pathogens, which are more difficult to isolate and identify, may also be present. An average MPN for fecal coliform bacteria in septic tank effluent is 1,000,000 cells per 100 milliliters.
Sometimes total coliform bacteria is measured instead of fecal. Total coliform is a broader group of bacteria that constitute most of the intestinal flora of warm blooded animals (including the genera Klebsiella sp., Enterobacter sp., Citrobacter sp., or Escherichia sp.)
The removal of these organisms through the soil treatment process is the key design fac-tor for systems, although E-coli is becoming the preferred indicator organism because of their known pathogenic effects. The requirement of soil separation found in MN Rules Chapter 7080 comes from the removal of fecal coliform organisms.
Minn. R. 7080.1100 defines vertical separation as the vertical measurement of un‑saturated soil or sand between the bottom of the distribution medium and the pe‑riodically saturated soil level or bedrock. For a SSTS to properly treat wastewater, this zone of unsaturated soil must be present in order for beneficial bacteria and microbes in the soil to remove harmful bacteria and viruses from the wastewater. The periodically saturated soil level is commonly identified by the presence of redoximorphic features. For SSTS constructed after March 31, 1996, or in a Shoreland area/Wellhead protection area/serving food, beverage, or lodging establishments (SWF area), at least three feet of vertical separation distance is required. The LGU may allow up to a 15 percent reduction in this distance; this reduction must be specified in the local ordinance.
This amount of separation is allowed to be decreased according the table because the ef-fluent is treated to either level A or B before reaching the soil.

Section 5: Wastewater Sources and Flows n 5-39
Treatment products are registered in Minnesota as products that either: 1) treat residential strength sewage or 2) treat commercial or high-strength sewage as follows:
n Category A – treatment products for residential strength sewage
n Category B – treatment products for commercial or high-strength sewage
table 5.15 treatment component Performance levels and Method of distribution by texture group1
Vertical Separation (inches) Soil group Found in table Xii
1-5 6-9 10-11
12 to 17 Treatment Level A Pressure Distribution Timed Dosing
Treatment Level A Pressure Distribution Timed Dosing
Treatment Level A Pressure Distribution Timed Dosing
18 to 23 Treatment Level B Pressure Distribution Timed Dosing
Treatment Level B Pressure Distribution Timed Dosing
Treatment Level B Pressure Distribution
24 to 36 Treatment Level B Pressure Distribution Timed Dosing
Treatment Level B Pressure Distribution
Treatment Level B Pressure Distribution
1The treatment component performance levels correspond with those established for treatment components under the product testing requirements in Table III in part 7083.4030.
Category A Products and Treatment LevelsWithin Category A, proprietary treatment products are listed by their ability to treat residential sewage to a specific treatment level. There are five ‘Treatment Levels’ at which treatment products can be registered (Table 5.16). Products that meet the requirements of Treatment Level A meet the highest treatment standard in removing organic matter (15 mg/L CBOD
5), total suspended solids (15 mg/L TSS), and pathogenic indicator organ-
isms (1,000 cfu/100 ml fecal coliform bacteria).
table 5.16 the five treatment levels for proprietary treatment products in Minnesota
treatment level cbod5(mg/l)
tSS (mg/l)
Fecal coliform (#/100ml)
nutrient (mg/l)
A 15 15 1,000 —
B 25 30 10,000 —
C 125 80 — —
Total Nitrogen — — — 20
Total Phosphorus — — — 2
Products that meet Treatment Level B standards have been tested to reduce organic matter to 25 mg/L CBOD
5, total suspended solids to 30 mg/L TSS, and fecal coliform bacteria
to 10,000 cfu/100 ml. Higher quality effluents produced using products that meet Treat-ment Levels A and B can be dispersed into suitable soils with reduced vertical separation and increased loading rates, depending upon soil characteristics. Soil dispersal require-

5-40 n Section 5: Wastewater Sources and Flows
ments using treatment products that meet Treatment Levels A and B are specified in Min-nesota Rules Chapter 7080.2350, Tables XI and XII. For a residential treatment product (Category A) listed under Treatment Level A, the product would also meet treatment standards for Treatment Level B and Treatment Level C.
Category B Products and Treatment LevelsWithin Category B, products can be registered for treating high strength or commercial wastewater (i.e. restaurants, grocery stores). These products have been tested to specifically reduce wastewater from high strength to typical residential strength wastewater. These products would be listed as Treatment Level C products, or products tested to reduce wastewater to ‘typical’ residential strength (125 mg/L CBOD
5, 80 mg/L TSS, and 20
mg/L oil and grease).
Nutrient ListingThe List also identifies those products registered for use in Minnesota that have been shown to reduce nitrogen and/or phosphorus. In order to be listed for nitrogen and phos-phorus removal, independent third party testing has been completed and shown to meet a total nitrogen of 20 mg/L and a total phosphorus of 2 mg/L.
nutrientsNutrients are element or compound essential as a raw material for growth and develop-ment of an organism; nitrogen, phosphorus and potassium are primary nutrients. Two nu-trients are of concern in wastewater treatment: phosphorus and nitrogen. These nutrients have different chemical characteristics: phosphorus tends to bind to soil particles, while nitrogen is more mobile in the soil.
MN Rule Treatment Requirements for NutrientsIn MN Rules Chapter 7080.2210, Subp. 4, for systems from 2,500 – 5,000 gpd if the system will impact the water quality of an aquifer, as defined in part 4725.0100, Subp. 21, it must employ best management practices for nitrogen reduction devel‑oped by the commissioner to mitigate water quality impacts to groundwater.
For MSTS with design flows from 5,000 – 10,000 gpd there are additional nitrogen re-moval requirements.
1. if the discharge from an MSTS will impact water quality of an aquifer, as defined in part 4725.0100, subpart 21, the effluent from an MSTS, in combination with the effective recharge to the groundwater, must not exceed a concentration of total nitrogen greater than 10 mg/l at the property boundary or nearest receptor, whichever is closest; and
2. if the discharge from an MSTS will not impact water quality of an aquifer, as defined in part 4725.0100, subpart 21, best management practices developed by the commissioner to mitigate water quality impacts to groundwater must be employed; and not exceed a groundwater discharge
With MSTS, P must also be considered. According to MR 7081.0070, Subp 4 (E) dis‑charge from the system can not exceed a groundwater discharge of phosphorus to a surface water that exceeds the phosphorus standard to the receiving water. During the Preliminary Evaluation the Designer must consider whether the ordinary high

Section 5: Wastewater Sources and Flows n 5-41
water level of public waters will be within 500 feet of the proposed soil treatment and dispersal area and if so, a preliminary assessment of phosphorus impacts to the surface water must be performed.
SSTS may have additional nutrient compliance criteria when their design flow exceeds 2,500 gpd. From MN Rules Chapter 7080.1550, Subp. 5 ‑the compliance criteria for systems with a flow of greater than 2,500 gallons per day ‑ systems designed under part 7080.2150, subpart 4, item A or B, must demonstrate that the additional nutri‑ent reduction component required under those items is in place and functioning.
nitrogenNitrogen is an essential nutrient for the growth of plants and microorganisms. Nitrogen (N) is an essential chemical ele-ment and nutrient for all life forms. N constitutes 78 percent of the atmosphere by volume and is present in surface water and groundwater as ammonia (NH
3), nitrite (NO
2-), nitrate
(NO3-), and organic nitrogen. Total nitrogen is the measure
of the complete nitrogen content in wastewater including nitrate (NO
3-), nitrite (NO
2-), ammonia (NH
3), ammoni-
um (NH4+), and organic nitrogen, expressed as mg/L of N;
all these forms of nitrogen, as well as nitrogen gas (N2), can
be converted from one form to another biochemically and are components of the nitrogen cycle.
n NH3 is the non-ionized form of reduced nitrogen.
n NH4 is the ionized form of reduced nitrogen usable by plants.
n NO3-: stable oxidized form of nitrogen usable by plants and usually not degraded
in groundwater; nitrifying bacteria can convert nitrite (NO2-) to nitrate (NO
3-) in
the nitrogen cycle;
n TKN (total Kjeldahl nitrogen is the measure of the total concentration of organic nitrogen, ammonia, and ammonium nitrogen.
n NO2-: unstable oxidized form of nitrogen.
n Organic N is the nitrogen bound in plant and animal matter, primarily amino acids and proteins; the amount of organic nitrogen can be obtained by separately measuring the ammonia nitrogen and subtracting that value from the total Kjel-dahl nitrogen.
As nitrogen moves through the treatment system, it changes from ammonia to nitrate. While it is possible for nitrate to change into nitrogen gas in some systems, standard trench and bed systems do not facilitate this change, so the nitrate may move into ground-water. A typical level of nitrogen in septic tank effluent is 40 milligrams per liter.
In drinking water, which is often from groundwater, high levels of nitrogen can be toxic to infants, causing methemaglobinemia, “blue baby syndrome.” Ammonia in surface waters can be toxic to fish.
Advanced pretreatment may be required to minimize the release of nitrogen to the envi-ronment.
Portions of the following nitrogen section were taken directly from the following reference: Oakley, S. 2005. Onsite Nitrogen Removal Text. in (M.A. Gross and N.E. Deal, eds.) Uni-versity Curriculum Development for Decentral-ized Wastewater Management. National Decen-tralized Water Resources Capacity Development Project. University of Arkansas, Fayetteville, AR.
Full text and Figures available Online at: http://www.onsiteconsortium.org/files/nitrogen.htm

5-42 n Section 5: Wastewater Sources and Flows
The principal forms of nitrogen of concern in onsite wastewater treatment and soil-groundwater interactions are Organic-N, NH
3/NH
4+, N
2, NO
2-, and NO
3-(Rittman &
McCarty, 2001; Sawyer et al., 1994; US EPA, 1993). Because these forms still represent four possible oxidation states that can change in the environment, it is customary to ex-press the various forms of nitrogen in terms of nitrogen rather than the specific chemical compound: Organic-N, NH
3-N, NH
4+-N, N
2-N, NO
2--N, and NO
3--N. Thus, for ex-
ample, 10 mg/L of NO3--N is equivalent to 45 mg/L of NO
3- ion.
The Nitrogen Cycle in Soil-Groundwater Systems Transformation of the principal nitrogen compounds (Organic-N, NH
3-N, NH
4+-N, N
2-
N, NO2--N, and NO
3--N) can occur through several key mechanisms in the environment:
fixation, ammonification, synthesis, nitrification, and denitrification (US EPA, 1993).
1. Nitrogen Fixation Nitrogen fixation is the conversion of nitrogen gas into nitrogen compounds that can be assimilated by plants. Biological fixation is the most common, but fixation can also occur by lightning and through industrial processes:
Biological: N2 ➝ Organic-N
Lightning: N2 ➝ NO
3-
Industrial: N2 ➝ NO
3-; NH
3/ NH
4+
2. Ammonification Ammonification is the biochemical degradation of organic-N into NH
3 or NH
4+ by het-
erotrophic bacteria under aerobic or anaerobic conditions.
Organic-N + Microorganisms ➝ NH3/ NH
4+
Some organic-N cannot be degraded and becomes part of the humus in soils.
3. Synthesis Synthesis is the biochemical mechanism in which NH
4+-N or NO
3--N is converted into
plant protein (Organic-N):
NH4
+ + CO2 + green plants + sunlight ➝ Organic-N
NO3- + CO2 + green plants + sunlight ➝ Organic-N
Nitrogen fixation is also a unique form of synthesis that can only be performed by nitro-gen-fixing bacteria and algae (WEF, 1998):
N-Fixing Bacteria/Algae
N2 ➝ Organic-N
4. NitrificationNitrification is the biological oxidation of NH4+ to NO3- through a two-step autotro-phic process by the bacteria Nitrosomonas and Nitrobacter (Rittman and McCarty, 2001; Sawyer, et al., 1994):
Nitrosomonas
Step 1: NH4
+ + 3/2O2 ➝ NO
2- + 2H+ + H
2O
Nitrobacter Step 2: NO
2- + 1/2O
2 ➝ NO
3-

Section 5: Wastewater Sources and Flows n 5-43
The two-step reactions are usually very rapid and hence it is rare to find nitrite levels higher than 1.0 mg/L in water (Sawyer, et al., 1994). The nitrate formed by nitrification is, in the nitrogen cycle, used by plants as a nitrogen source (synthesis) or reduced to N
2
gas through the process of denitrification. Nitrate can, however, contaminate groundwater if it is not used for synthesis or reduced through denitrification as shown in Figure 1.
5. DenitrificationNO
3- can be reduced, under anoxic conditions, to N
2 gas through heterotrophic biological
denitrification as shown in the following unbalanced equation (US EPA, 1993):
Heterotrophic Bacteria
NO3
- + Organic Matter ➝ N2 + CO
2 + OH- + H
2O
The above equation is identical to the equation for the biological oxidation of organic matter with the exception that NO3- is used as an electron acceptor instead of O
2:
Heterotrophic Bacteria
O2 + Organic Matter ➝ CO
2 + OH- + H
2O
A large variety of heterotrophic bacteria can use nitrate in lieu of oxygen for the degrada-tion of organic matter under anoxic conditions. If O
2 is present, however, the bacteria will
preferentially select it instead of NO3
- (US EPA, 1993). Thus it is very important that anoxic conditions exist in order that NO
3- will be used as the electron acceptor. A carbon
source is required as the electron donor in the above equation for denitrification to occur.
Autotrophic denitrification is also possible with either elemental sulfur or hydrogen gas used as the electron donor by autotrophic bacteria as shown in the following unbalanced equation (Rittman and McCarty, 2001):
NO3
- + CO2 + Inorganic Electron Donor ➝ N
2 + Oxidized Electron Donor
(Elemental Sulfur or H2 gas)
Health Effects from Groundwater Contamination with Nitrates Contamination of groundwater with nitrates is a problem in many parts of the U.S. and has been widely documented (Bouchard, et al., 1992). Potential health concerns where contaminated groundwater is used as a drinking water source include methemoglobin-emia, carcinogenesis, and birth defects.
Methemoglobinemia High nitrate levels in drinking water supplies can cause methemoglobinemia in infants, especially those less than six months old (Bouchard, et al., 1992). After ingestion, nitrate is reduced to nitrite in the gut of the infant. The absorbed nitrite reacts with hemoglobin in the blood, forming methemoglobin. Methemoglobin, unlike hemoglobin, cannot carry oxygen. As more of the blood hemoglobin is converted to methemoglobin, the oxygen-carrying capacity of the blood is significantly reduced. Oxygen starvation of the blood can result in a bluish discoloration of the body, which is called “blue-baby” syndrome or methemoglobinemia. To prevent methemoglobinemia, the maximum contaminant level of nitrate in drinking water has been set at 10 mg/L as NO
3--N by the US EPA (Bouchard,
et al., 1992).

5-44 n Section 5: Wastewater Sources and Flows
Carcinogenesis High nitrate levels in drinking water could potentially have carcinogenic effects through the formation of nitrosamines. Nitrates in the human body can be converted to nitrites and then to nitrosamines, several forms of which have been classified as potential human carcinogens (Bouchard, et al., 1992). While several scientific studies have shown a posi-tive correlation between some types of cancers and nitrate intake in animals, a cause-effect relationship for risk of cancer has not yet been demonstrated conclusively.
Birth Defects Epidemiological studies in Canada and South Australia have shown a statistically signifi-cant increase in congenital malformations associated with nitrate-rich well water (Boucha-rd, et al., 1992). These studies, however, are considered to be too limited in scope to de-duce a causal association between birth defects and nitrate ingestion. Experimental animal studies have not shown significant effects from elevated nitrate ingestion.
Surface Water Pollution with Nitrogen When excess nitrogen concentrations are discharged to surface waters, several deleterious effects may occur, depending on the environmental conditions.
Eutrophication Phosphorus is oftentimes the limiting nutrient for the growth of algae and aquatic plants in surface waters. Thus, any phosphorus can cause the stimulation of growth, resulting in algal blooms or overgrowth of aquatic plants, which can have serious consequences for the receiving water such as odors, accumulation of unsightly biomass, dissolved oxygen depletion due to biomass decay, and loss of fish and shellfish. In some cases, nitrogen is the limiting nutrient and excess nitrogen is the cause for excessive plant growth.
Oxygen Demand through Nitrification The oxidation of Organic-N and NH
3-N/NH
4+-N to NO
3--N through the process of
nitrification can exert a significant oxygen demand on the receiving water, which is known as the nitrogenous biochemical oxygen demand (NBOD) (Metcalf and Eddy, 1991). The NBOD of a wastewater can even be greater than the carbonaceous biochemical oxygen demand (CBOD), although it may not be exerted as rapidly. The rate of nitrification is dependent on several environmental factors, which include the population of nitrifying bacteria, temperature, alkalinity, and availability of dissolved oxygen.
Ammonia Toxicity to Aquatic Organisms Nitrogen in the form of NH
3-N can cause acute toxicity to several species of fish. Because
the concentration of NH3-N as opposed to NH
4+-N is pH dependent, criteria for ambient
water quality have been set for unionized ammonia as a function of pH and temperature (Sawyer, et al., 1994). Many municipal wastewater treatment plants in the US are required to nitrify their effluent in order to avoid ammonia toxicity in receiving waters.
Biological NitrificationAs mentioned above, nitrification is a two-step autotrophic process (nitrifiers use CO
2 in-
stead of organic carbon as their carbon source for cell synthesis) for the conversion of NH4+
to NO3--N. During this energy yielding reaction some of the NH
4+ is synthesized into cell
tissue giving the following overall oxidation and synthesis reaction (US EPA, 1993):
1.00NH4+ + 1.89O
2 + 0.08CO ➝ 0.98NO
3- + 0.016C
5H
7O
2N + 0.95H
2O + 1.98H+
Section 5: Wastewater Sources and Flows n 5-45
The above equation poses several key design constraints on nitrification systems. For each mole of NH
4+ oxidized, 1.89 moles of oxygen are required and 1.98 moles of hydrogen
ions will be produced. Or, in mass terms, 4.32 mg of O2 are required for each mg of
NH4+-N oxidized, with the subsequent loss of 7.1 mg of alkalinity as CaCO
3 in the
wastewater, and the synthesis of 0.1 mg of new bacterial cells. Stated yet another way, the oxidation of, for example, 20 mg/L of NH
4+-N would require the consumption of
86.4 mg/L of dissolved oxygen, the destruction of 141.4 mg/L of alkalinity as CaCO3,
and the production of 2.6 mg/L of nitrifying organisms (US EPA, 1993).
Nitrification can thus exert a very high nitrogenous biochemical oxygen demand (NBOD) in addition to the carbonaceous BOD (CBOD) as shown in Figure 3-3. MN Rules Chap-ter 7080.1100, Subp. 12 defines CBOD
5 as the measure of the amount of oxygen required
by bacteria while stabilizing, digesting, or treating the organic matter under aerobic con-ditions over a five-day incubation period while in the presence of a chemical inhibitor to block nitrification. CBOD is commonly expressed in milligrams per liter (mg/L).
Using the above equation, a septic tank effluent of 40 mg/L NH4+-N would have a NBOD
of about 184 mg/L in addition to the CBOD. This factor must be included in the design of nitrification systems to be sure there is sufficient dissolved oxygen (DO) within the system for nitrification to occur. To process 40 mg/L of NH
4,you must add 184 mg/L of
DO. Nitrification can also cause a significant drop in pH if there is not adequate buffering capacity (alkalinity) in the wastewater.
Process Microbiology Nitrifying organisms exhibit growth rates that are much lower than those for heterotro-phic bacteria. As a result, the rate of nitrification is controlled first by concurrent hetero-trophic oxidation of CBOD; as long as there is a high organic (CBOD) loading to the system, the heterotrophic bacteria will dominate. Nitrification systems must thus be de-signed to allow sufficient detention time within the system for nitrifying bacteria to grow. Heterotrophic organisms can also play a key role in limiting oxygen transfer to nitrifying bacteria, especially in attached-growth systems (Rittman and McCarty, 2001; US EPA, 1993). After competition with heterotrophs, the rate of nitrification will be limited by the concentration of available NH
4+-N in the system. Temperature, pH, and chemical inhibi-
tors can also play a key role as discussed below.
At low BOD5/TKN ratios (0.5 to 3) the population of nitrifying bacteria is high and
nitrification should not be influenced by heterotrophic oxidation of CBOD (Metcalf & Eddy, 1991); this type of nitrification process is termed separate-stage nitrification. At higher BOD
5/TKN ratios, the fraction of nitrifying organisms in the system is much
lower due to heterotrophic competition from oxidation of CBOD; this process is termed single-stage nitrification.
Separate-stage nitrification is highly desirable from the standpoint of process control and operation. Many onsite systems presently used or proposed for nitrogen removal, however, because of the interest in reducing size and system footprint, employ single-stage nitrifica-tion; examples include aerobic treatment units with short hydraulic detention times and sand filters or media filters that are heavily loaded organically. Single-stage systems may require more rigorous process control to ensure adequate nitrification rates.

5-46 n Section 5: Wastewater Sources and Flows
Dissolved Oxygen Requirements and Organic Loading Rates Suspended Growth Systems The concentration of DO has a significant effect on nitrification in wastewater treatment. Although much research has been performed, practical experience has shown that DO levels must be maintained at approximately 2.0 mg/L in suspended-growth (aerobic) sys-tems, especially when NH
4+-N loadings are expected to fluctuate widely (US EPA, 1993);
this may or may not be the case in domestic onsite wastewater systems.
Attached-Growth SystemsFor attached-growth systems, which include both submerged and nonsubmerged pro-cesses (Crites and Tchobanoglous, 1998), DO levels must be maintained at levels that are at least 2.7 times greater than the NH
4+-N concentrations in order to prevent oxygen
transfer through the
biofilm from limiting nitrification rates (US EPA, 1993). This is usually overcome in practice by using lower organic surface loadings than what would be normally applied for CBOD removal to allow for growth of nitrifying organisms; otherwise the heterotro-phic organisms will dominate the bacterial film within the attached-growth media. For trickling filters, for example, the organic loading rate for nitrification is only about 1/5 to 1/8 of the CBOD loading for CBOD removal (Metcalf & Eddy, 1991; US EPA, 1993). Recirculation of effluent through the attached growth media, and use of special media, such as trickling filter plastic media with high specific surface areas, is also used to lower organic surface loadings and to promote high oxygen transfer rates.
Table 5.17 shows design organic loading rates for various attached-growth systems to achieve nitrification. Unfortunately, organic loading rates for onsite attached-growth sys-tems are not well defined even for CBOD removal, let alone nitrification (Crites and Tchobanoglous, 1998). The more commonly used hydraulic loading rates as cited in the literature show mixed results for nitrification. This is no doubt due, at least in part, to varying organic loading rates that were not taken into consideration since the CBOD
5 of
septic tank effluent can vary greatly, ranging from less than 100 to 480 mg/L (Ayres As-sociates, 1993).

Section 5: Wastewater Sources and Flows n 5-47
table 5.17 design loading rates for attached growth Systems to achieve >85% nitrification
Process Hydraulic loading rate, gpd/ft2
organic loading rate, lbs. bod/ft2-day
State of Knowledge for design
Trickling Filters1
Rock Media Plastic Media
30-900
288-1700
0.04-0.12 (0.04-0.64)0.10-0.25 (0.50-2.00)
Well Known Well Known
Sand Filters Single-Pass Recirculating
0.4-1.2
3-5
0.000135-0.002
0.002-0.008
Lesser Known2
Lesser Known2
Textile Filters Single-Pass Multi-Pass3
(Partial Nitrification)
10 30
0.01 0.03
Lesser Known2
Lesser Known2
1 The values for trickling filters given for both hydraulic and organic loadings are the ranges for low rate and high rate filters. Rock filters were assumed to have a depth of 8 ft. and plastic filters a depth of 10 ft. The numbers in parentheses for organic loadings are the values for CBOD removal only without nitrification.
2 These systems have not traditionally been designed using organic loading rates to achieve nitrification. High strength wastes thus could affect nitrification performance.
3 At this organic loading rate only 59-76% nitrification was achieved (Leverenz, et al., 2001). Adapted from Converse (1999); Crites and Tchobanaglous (1998); Leverenz, et al. (2001); Metcalf & Eddy (1991); and US EPA (1993).
pH and Alkalinity Effects on NitrificationThe optimum pH range for nitrification is 6.5 to 8.0 (US EPA, 1993). Because nitrification consumes about 7.1 mg of alkalinity (as CaCO
3) for every mg of NH
4+-N oxidized, in low
alkalinity wastewaters there is a risk that nitrification will lower the pH to inhibitory levels. If, for example, it were desired to nitrify 40 mg/L of NH
4+-N, approximately 284 mg/L as
CaCO3 would be required to maintain pH levels; this may be beyond the capabilities of
some wastewaters derived from water sources that do not contain relatively high alkalinity.
Temperature Effects Temperature has a significant effect on nitrification that must be taken into consideration for design (US EPA, 1993). In general, colder temperatures require longer cell residence times in suspended-growth systems and lower hydraulic loading rates in attached-growth systems due to slower growth rates of nitrifying bacteria.
Effect of Inhibitors Nitrifying bacteria are much more sensitive than heterotrophic bacteria and are suscepti-ble to a wide range of organic and inorganic inhibitors as shown in Table 5.18. As has
occurred in centralized wastewater treatment (US EPA, 1993), there is a need to establish a methodol-ogy for onsite wastewater systems for assessing the potential for, and occurrence of, nitrification inhibi-tion. Figure 9 illustrates the effect of an inhibitor on nitrification in a septic tank/recirculating trickling fil-ter system; in this particular case a carpet cleaning solvent that was flushed down the toilet contaminat-ed the septic tank and destroyed the nitrifying bacte-rial population in the attached-growth media (Oak-ley, et al., 1996). If this system had not been continuously monitored, the effects of the inhibitor on nitrification would have passed unnoticed.
table 5.18 examples of nitrification inhibitorsinorganic compounds organic compounds
Zinc Free Cyanide Perchlorate
CopperMercury
ChromiumNickelSilverCobalt
Thiocyanate Sodium cyanide
Sodium azide Hydrazine
Sodium cyanate Potassium chromate
Cadmium Arsenic Fluoride
Lead Free ammonia
Free nitrous acid
AcetoneCarbon Disulfide
ChloroformEthanolPhenol
EthylenediamineHexamethylene diamine
AnilineMonoethanolamine

5-48 n Section 5: Wastewater Sources and Flows
Since heterotrophic bacteria are much more resilient than nitrifying bacteria, and because many of the inhibitory compounds are biodegradable organics, inhibitory effects can of-tentimes be controlled by designing separate-stage nitrification systems (US EPA, 1993). In separate-stage systems the CBOD is first removed along with any biodegradable in-hibitory compounds; the nitrifying organisms, which are in effect protected in the second stage, are then used to nitrify the low--CBOD, high-NH
4+-N effluent (Figure 5).
Example: Calculation of alkalinity and oxygen requirements for nitrificationDetermine the alkalinity requirements for complete nitrification for a septic tank efflu-ent that has a CBOD of 150 mg/L and an Organic-N and NH
4+-N concentration of 40
mg/L. What would the NBOD of this wastewater be?
Solution
1. Write a balanced equation for the nitrification reaction and include mass relationships:
Autotrophic
1.00NH4+ + 1.89O
2 + 0.08CO
2 ➝ 0.98NO
3- + 0.016C
5H
7O
2N + 0.95H
2O + 1.98H+
Bacteria bacterial cells
18 GMW 32 GMW 113 GMW 1 GMW
14 mg as N 60.48 mg 1.81 mg 1.98 mg 1.98meq
1 mg as N 4.32 mg 0.13 mg 0.14 meq 7.1 mg as CaCO
3
GMW = gram molecular weight Milliequivalent mass of CaCO
3 = 50 mg/meq
0.14 meq as H+ in terms of equivalent CaCO3 = 0.14 meq (50 mg CaCO
3/meq) = 7.1
mg as CaCO3 mg as CaCO
3
2. Determine alkalinity requirements.
Alkalinity required = 40 mg/L Total-N (7.1 mg/L CaCO3/mg N) = 284 mg/L as CaCO
3
3. Determine the NBOD.
NBOD = 40 mg/L total-N (4.32 mg O2/ mg N) = 173 mg/L
Comment: The alkalinity requirements here exceed the 200 mg/L as CaCO3 that has
been reported to be a typical alkalinity concentration in strong, untreated domestic waste-water (Metcalf & Eddy, 1991). Alkalinity does increase as a result of water use, and the incremental range for septic tank effluent has been reported from 60-120 mg/L as CaCO
3
(Crites and Tchobanoglous, 1998). In areas with low-alkalinity source waters, however, nitrification could be limited. Note that the NBOD exceeds the CBOD of the septic tank effluent, which underscores the oxygen requirements for nitrification.
Summary of Nitrification Processes Table 5.19 summarizes the various onsite technologies and their advantages and disadvan-tages for effective nitrification based on the factors discussed above. The available informa-tion suggests that an effective design strategy for nitrification in onsite systems would be to use attached-growth processes with relatively low organic loadings (compared to CBOD
Section 5: Wastewater Sources and Flows n 5-49
removal only) and deep, well-aerated media (such as a 2 ft. deep SPSF). This type of sys-tem would approach a separate-stage nitrification with its advantages while maintaining the cost and simplicity of a single-stage system. In this design the heterotrophic bacteria would grow in the upper levels and remove CBOD and inhibitory compounds; nitrifying bacteria would grow in the lower levels and would be protected both from shock loadings and temperature extremes. A single pass sand filter, which is well known for its nitrifica-tion reliability, is an example of this design.
table 5.19 onsite technologies for > 85% nitrification
Process effectiveness onsite status
Suspended growth: aerobic units Insufficient design and performance data
Operation and maintenance unknown
Attached Growth: Single-Pass Sand Filters (SPSF)
Need more design data for organic loadings for nitrification
Fair to good performance in cold climates.
Recirculating Sand Filters (RSF) Need more design data for organic loadings for nitrification
Poorer performance in cold climates than SPSFs.
Single-Pass Textile Filters Limited data to date. Probably similar to SPSF
Need design data for organic loadings for nitrification
Multi-Pass Textile Filters Limited data to date. Probably similar to RSF.
Need design data for organic loadings for nitrification and per-
formance in cold climates
Biological Dentrification Denitrification is a biological process that uses NO
3- as the electron acceptor (hence nitri-
fication must precede denitrification) instead of O2 to oxidize organic matter (heterotro-
phic denitrification) or inorganic matter such as sulfur or hydrogen (autotrophic denitri-fication) under anoxic conditions (Rittmann and McCarty, 2001). In the process NO
3- is
reduced to N2 gas. Because the principal biochemical pathway is a modification of aerobic
pathways (i.e., NO3- is used as the electron acceptor instead of O
2), the denitrification pro-
cess is said to occur under anoxic conditions as opposed to anaerobic conditions (where obligate anaerobic organisms would be present). Denitrifying bacteria, whether heterotro-phic or autotrophic, are facultative aerobes and can shift between oxygen respiration and nitrate respiration. For heterotrophic denitrification, the carbon source can come from the original wastewater, bacterial cell material, or an external source such as methanol or acetate. For autotrophic denitrification, which is common in water treatment but not wastewater treatment, the electron donor can come from elemental sulfur or hydrogen gas (Rittmann and McCarty, 2001).
Heterotrophic Dentrification Wastewater as Carbon SourceThe following unbalanced equation illustrates the process when wastewater or bacterial cell material is used as the carbon source (US EPA, 1993):
Heterotrophic aCOHNS + bNO
3- ➝ cN
2 + dCO
2 + eC
5H
7O
2N + f OH- + gH
2O + end products
As is shown in the following example, the reduction of 1 mg of NO3- is equivalent to
2.86 mg of O2. Thus, for example, a wastewater with an ultimate BOD (BODL) of 200
mg/L could potentially reduce almost 70 mg/L of NO3--N if the wastewater were used as
the carbon source (US EPA, 1993). This does not happen in practice, however, because

5-50 n Section 5: Wastewater Sources and Flows
a portion of the organic carbon in the wastewater must be used for cell synthesis and not nitrate reduction.
Example: Calculation of stoichiometric equations for nitrate REDUCTION USING THE WASTEWATER AS THE CARBON SOURCE. Deter-mine the theoretical amount of NO3-N that could be removed if septic tank effluent, which has a BOD
5 of 120 mg/L, is used as the carbon source. What quantity could be
removed if the raw wastewater influent to the septic tank, with a BOD5 of 220 mg/L, were
used as the carbon source? -
Solution
1. Write the half-reactions for oxygen and nitrate as electron acceptors (Rittmann and McCarty, 2001):
Oxygen: 0.25O
2 + H+ + e- ➝ 0.5 H
2O
32 GMW 8 g [0.25(32) = 8] 8 mg Nitrate: 0.2NO
3- + 1.2H+ + e- ➝ 0.1N
2 + 0.6H
2O
62 GMW 14 GMW as N 2.8 g [0.2(14) = 2.8] 2.8 mg
2. Determine the stoichiometric equivalency of oxygen and nitrate.
For the acceptance of one electron, the above equations show that 8 mg of O2 is equiva-
lent to 2.8 mg of NO3-
-N, or that 1.0 mg of NO
3- -N is equivalent to 2.86 mg of O
2.
8 mg O
2/e- equiv. = 2.86 mg O
2/ mg NO
3-
-N
2.8 mg NO3-
-N/e- equiv.
3. Determine the BODL of the wastewater.
The stoichiometric equations must be based on the ultimate BOD (BODL) rather then
the more commonly used BOD5. The BOD
5 of wastewater can range between 68% to
94% of the BODL, depending on the value of the BOD reaction rate constant, k (Saw-
yer, et al., 1994). It will be assumed here that k (base e) is 0.23 d-1 at 20 ¡C, a typical value for domestic wastewater (Metcalf & Eddy, 1991).
Septic Tank Effluent:
BODL = BOD5 = 120__ = 120 = 176 mg/L
(1 – e-kt) (1 – e-0.23(5)) 0.68
Septic Tank Influent:
BODL = BOD5 = 220___ = 220 = 323 mg/L
(1 – e-kt) (1 – e-0.23(5)) 0.68

Section 5: Wastewater Sources and Flows n 5-51
4. Determine the quantity of NO3- -N that could theoretically be reduced.
Septic Tank Effluent:
NO3-N Reduction = 176 mg O
2 demand/L = 61.5 mg/L
2.86 mg O2/ mg NO
3-
-N
Septic Tank Influent:
NO3-N Reduction = 323 mg O
2 demand/L = 113 mg/L
2.86 mg O2/ mg NO
3-
-N
Comment: In practice the equivalency of 2.86 mg O2/ mg NO
3-N is not achievable be-
cause a portion of the electron donor (i.e., the wastewater) must be used to provide carbon for cell synthesis; thus more electron donor will be needed to reduce a given amount of NO
3-N than is predicted by the half-reactions alone. For complex organic matter such
as wastewater, the stoichiometric equivalency can range from 3.46-5.07 mg BODL/mg
NO3-
-N, with 4.0 mg BOD
L/ mg NO
3-
-N used as a rule of thumb (Rittmann and Mc-
Carty, 2001). In terms of BOD5, this amounts to 2.72 mg BOD
5/ mg NO
3-
-N for k
(base e) = 0.23 d-1.
Example: Recalculation of stoichiometric equations for nitrate reduction using the wastewater as the carbon sourceRecalculate the amount of NO
3-N that could be removed in Example 5 using the “rule of
thumb” stoichiometric equivalency.
Solution
1. Express the stoichiometric equivalency in terms of the commonly used BOD5.
BOD
5 = 0.68BOD
L for k = 0.23 d-1 (base e)
4.0 mg BODL
= 0.68(4.0) = 2.72 mg BOD5
mg NO3-
-N mg NO
3-
-N
2. Determine the quantity of NO
3-
-N that could theoretically be reduced.
Septic Tank Effluent:
NO3-N Reduction = 120 mg BOD5/L ____ = 44 mg/L
2.72 mg BOD5/ mg NO
3-
-N
Septic Tank Influent:
NO3-N Reduction = 220 mg BOD5/L ____ = 81 mg/L
2.72 mg BOD5/ mg NO
3-
-N
Comment: To achieve the maximum nitrate reduction potential, the wastewater should be used at the point of highest CBOD. This may not occur if septic tank effluent, for example, or a recirculation tank from a packed bed filter system, is used as the point of application of the carbon source. Imperfect mixing of the wastewater carbon source with the nitrified effluent, and the absence of anoxic conditions, can also cause a reduction in denitrification.

5-52 n Section 5: Wastewater Sources and Flows
External Carbon SourceIn cases where there is insufficient CBOD left in the wastewater to serve as an electron donor for denitrification, an external carbon source must be supplied. Although there are many possibilities, methanol and acetate have been studied the most and their stoichiom-etry is shown below (Rittmann and McCarty, 2001; US EPA, 1993):
Methanol: Heterotrophic
NO3- + 1.08CH
3OH + 0.24H
2CO
3 ➝ 0.47N
2 +
0.056C
5H
7O
2N + HCO
3- +
1.68H2O
methanol Bacteria bacterial cells
Acetate:
Heterotrophic
NO3- + 0.87CH
3COO- + H+ ➝ 0.46N
2 +
0.08C
5H
7O
2N + 0.87HCO
3- + H
2O + 0.44CO
2
acetate Bacteria bacterial cells
There are few examples in the literature of an external carbon source being used for onsite denitrification. Although methanol has been studied extensively in centralized wastewater treatment plants, it is probably not a good choice for onsite systems because of its toxicity and potential for contaminating groundwater supplies. Gold, et al., (1989) reported on the use of both methanol and ethanol as an external carbon source in a recirculating sand filter system with an anoxic rock filter for denitrification. They noted that although the total nitrogen removal rate was as high as 80%, the use of the chemicals required operation and maintenance of the carbon source supply system, including an on-site storage facil-ity, a metering pump mechanism, and supplying a diluted carbon source solution. They concluded that the external carbon source could probably best be handled by a wastewater management district or a private O & M contractor (Gold, et al., 1989).
Example: Design of dentrification system using methanol as the carbon sourceDetermine the methanol requirements for an onsite denitrification system using a recircu-lating sand filter. The following conditions apply:
1. Household flowrate = 192 gpd. 2. The concentration of NO
3-N to be removed is 40 mg/L.
3. Characteristics of Methanol: 99.90% Solution = 0.7913 g CH
3OH/ml
10.00% Solution = 0.08 g CH3OH/ml
Solution
1. Write the balanced equation for denitrification and include mass relationships:
Heterotrophic
NO3- + 1.08CH
3OH + 0.24H
2CO
3 ➝ 0.47N
2 + 0.056C
5H
7O
2N + HCO
3- + 1.68H
2O
methanol Bacteria bacterial cells
62 GMW 32 GMW 113 GMW 61 GMW 14 mg as N 34.6 mg 6.3 mg 1 meq 1 mg as N 2.47 mg 0.45 mg 0.07 meq 3.57 mg as
CaCO3
Section 5: Wastewater Sources and Flows n 5-53
2. Determine the required concentration of methanol. Required concentration of CH
3OH = 2.47 mg (40 mg/L NO
3-
-N) = 98.8 mg/L ≈ 100 mg/L
mg NO3- -N
3. Determine the methanol requirement.
CH3OH requirement = (100 mg/L)(150 gpd)(3.78 L/gal)(1 g/1000 mg) = 56.7 g/day
10% Solution:
56.7 g/day = 709 ml/day = 21.3 L/month = 5.6 gallons/month ≈ one 55 gallon drum/10 mos. 0.08 g/ml
4. Determine the BODL of methanol.
CH
3OH + 1.5O
2 ➝ CO
2 + 2H
2O
32 GMW 32 GMW 32 mg 48 mg 1 mg 1.5 mg 5. Determine the ratio of BOD
L/NO
3-
-N reduced.
150 mg/L BODL = 3.75 mg BOD
L/mg NO
3-
-N reduced.
40 mg/L NO3-
-N
Comment. This example shows that the required BODL of methanol is higher than that predicted by half-reactions alone (2.86 mg BODL/mg NO3-N) because a portion of the methanol was used for cell synthesis as can be seen in the balanced equation. Note that 3.57 mg of alkalinity as CaCO3 was produced per mg of NO3-N reduced. Thus approxi-mately half of the alkalinity lost during nitrification can be recovered through denitrifica-tion with methanol or wastewater as the carbon source.
Example: Design of dentrification system using acetic acid as the carbon sourceDetermine the acetic acid requirements for an onsite denitrification system using a re-circulating sand filter. Assume the acetic acid could be used in the form of vinegar (5% solution). The following conditions from Example 6 apply:
1. Household flowrate = 192 gpd. 2. The concentration of NO
3-
-N to be removed is 40 mg/L.
3. Characteristics of acetic acid: 99.5% Solution = 1.05 g CH
3COOH/ml
5.0% Solution = 0.05 g CH3COOH/ml

5-54 n Section 5: Wastewater Sources and Flows
Solution
1. Write the balanced equation for denitrification and include mass relationships (Rit-tmann and McCarty, 2001):
Heterotrophic
NO3- + 0.87CH
3COOH + H+ ➝ 0.46N
2 +
0.08C
5H
7O
2N + 0.87HCO
3- + H
2O + 0.44CO
2
acetic acid Bacteria bacterial cells 62 GMW 60 GMW 113 GMW 61 GMW 14 mg as N 52.2 mg 9.0 mg 0.87 meq 1 mg as N 3.73 mg 0.65 mg 0.06 meq 3.0 mg as CaCO
3
2. Determine the required concentration of acetic acid. Required concentration of CH
3COOH = 3.73 mg (40 mg/L NO
3-
-N) = 149 mg/L
mg NO3-
-N
3. Determine the acetic acid requirement. CH
3COOH requirement = (149 mg/L)(150 gpd)(3.78 L/gal)(1 g/1000 mg) = 84.5 g/day
5% Solution: 84.5 g/day = 1690 ml/day = 50.7 L/month = 13.4 gallons/month ≈ one 55 gallon drum/4 mos. 0.05 g/ml 4. Determine the BOD
L of acetic acid.
CH
3COOH + 2O
2 ➝ 2CO
2 + 2H
2O
60 GMW 32 GMW 60 mg 64 mg 1 mg 1.07 mg 1 mg of CH
3COOH ➝ 1.07 mg BOD
L
149 mg/L CH3COOH ➝ 159 mg/L BOD
L
5. Determine the ratio of BODL/NO
3-
-N reduced.
159 mg/L BODL = 3.97 mg BOD
L/mg NO
3-
-N reduced.
40 mg/L NO3-
-N
Comment: In this example, unlike methanol or wastewater, acetic acid adds acid to the system, which is neutralized by the production of alkalinity through denitrification (0.87 meq of H+ from acetic acid would be neutralized by the 0.87 meq of HCO
3- produced by denitrification). Thus there would not
be a 50% recovery of the alkalinity lost through nitrification if acetic acid were used as the carbon source (Rittmann and McCarty, 2001).
Portions of the preceding nitrogen section were taken directly from the following reference: Oakley, S. 2005. Onsite Nitrogen Removal Text. in (M.A. Gross and N.E. Deal, eds.) Uni-versity Curriculum Development for Decentral-ized Wastewater Management. National Decen-tralized Water Resources Capacity Development Project. University of Arkansas, Fayetteville, AR.
Full text and Figures available Online at: http://www.onsiteconsortium.org/files/nitrogen.htm

Section 5: Wastewater Sources and Flows n 5-55
Phosphorus Phosphorus (P) is the chemical element and nutrient essential for all life forms, occur-ring as orthophosphate, pyrophosphate (P
2O
7-4), tripolyphosphate (P
3O
105−), and organic
phosphate forms. phosphorus, inorganic: forms of phosphorus from mineral sources, such as orthophosphate, pyrophosphate, (P
2O
7-4), and tripolyphosphate (P
3O
105−). Organic
phosphorus is formed primarily by biological processes and the sources of organic phos-phorus in sewage include bodily wastes, food residues, and the conversion of orthophos-phates in biological treatment processes. Total phosphorus (TP) is the sum of all forms of phosphorus in effluent.
Each of these forms is expressed in terms of milligrams per liter (mg/L). Elemental phos-phorus occurs in natural waters and wastewater almost solely as phosphate (group of phosphorus and oxygen atoms with an electric charge, in varying formations). Phospho-rus is a nutrient essential to the growth of plants and microorganisms. A typical value for phosphorus in septic tank effluent is seven - ten milligrams per liter.
The concern with phosphorus in Minnesota is its impact on surface waters. Most surface water in Minnesota is phosphorus-limited, meaning that any additional phosphorus will result in the growth of more plant life. Growth of algae and weeds dramatically affects lake ecosystems, lowering their oxygen levels, aesthetic appeal and recreational value.
Phosphorus is found in body wastes, food residues, fertilizers, and detergents. Primary and secondary orthophosphates (H
2PO
4- and HPO
42-) are the forms available to plants.
Phosphorus moves with the soil absorption plume but at a retarded rate. Phosphorus re-tardation in soil absorption areas is dependent upon sorption and precipitation reactions. Precipitation occurs as the phosphorus reacts with calcium, aluminum, magnesium, or iron in the soil. It can also move in surface water or in groundwater, during erosion epi-sodes, or under anaerobic soil conditions.
other components of WastewaterPharmaceuticalsPharmaceutical and personal care product (PPCP) are of growing concern in wastewa-ter treatment systems. They are chemical substances such as a prescription or over-the-counter therapeutic drug, fragrance, cosmetic, sunscreen agent, diagnostic agent, among others; widespread use is increasing their prevalence in the environment; their effects, even in trace amounts are being studied.
Other chemicals are of concern in systems include other trace organic contaminants which originating from residential and non-residential sources, such as ingredients in drugs, pesticides, consumer products, and industrial process agents, usually present in concentrations much lower than one mg/L, which may have adverse ecological and/or human health effects.
Chemicals and hazardous wasteHazardous waste should not be added to a treatment system. Nonhazardous wastes, in-cluding detergents, shampoos, antibacterial soap, and salt from water softeners, have not been shown to cause detrimental effects at normal household loading. Excessive loading of any of these chemicals, however, can cause problems with the treatment process.
Of particular concern are continuous toilet cleaners and formaldehyde. Because the toilet
5-56 n Section 5: Wastewater Sources and Flows
flow represents nearly 40 percent of total wastewater, continuous use of a sanitizer can cause problems and should be avoided. Formaldehyde typically used in chemical toilets, also causes major system problems and should be avoided.
If a residence or any other facility plans to dispose of hazardous waste into an onsite sys-tem, the Minnesota Pollution Control Agency (MPCA) must be contacted. These systems would be considered Class V injection wells and are subject to regulations other than those of Chapter 7080. Hair salons, photography businesses and taxidermists, for example, may generate hazardous waste. A Class V inventory form for any such system, as well as for any system serving 20 or more people, must be submitted to the Environmental Protection Agency and the MPCA. (See Section 13: Forms Underground Disposal System (Class V) Inventory Form.)
In the case of filling station wastes, oil, grease and floor washing wastes from the service bay should be discharged to a holding tank separate from the sewage system treating the toilet wastes. Any liquid waste containing petroleum products should not be discharged into a subsurface treatment system. A car wash area should be evaluated for hazardous waste problems, and may also need a holding tank for wastes. There is a potential for vola-tile compounds in these systems which are capable of being evaporated at relatively low temperatures. These are typically measured as volatile organic compound (VOC) which is the class of organic compounds that readily evaporate; includes liquids and solids at natural environmental temperature.
Monitoring Wastewater characteristicsMany techniques can be used to monitor an onsite wastewater treatment system’s perfor-mance. Monitoring is the action of verifying performance for a regulatory authority or a manufacturer (e.g., qualitative monitoring as part of service visit). It varies from some-thing as simple as checking for sewage on the soil surface, to complicated laboratory analy-sis. Costs vary from lab to lab. Be sure to contact the lab prior to dropping off samples.
There are several types of samples that can be obtained form a system:
Composite Combination of individual samples collected from the same point at differ-ent times; samples may be of equal volume or may be proportional to the flow at time of sampling.
Grab Discrete sample collected at a particular time and location.
Integrated Combination of grab samples collected at a similar time but at different loca-tions.
certified labsWhen choosing a lab to perform analysis of wastewater characteristics, a certified lab is always the best choice, because these labs use standard procedures. The Minnesota Department of Health maintains a list of labs across Minnesota that are certified. This can be found on their website at http://www.health.state.mn.us/divs/phl/cert/alllabs_co.html under Certified Minnesota Contact Labs and Certified Minnesota Non-Contact Labs. If you do not have access to the internet call (612)676-5200 and a hard copy of the list can be sent to you.

Section 5: Wastewater Sources and Flows n 5-57
SamplingThere are many locations where samples can be taken. It is best if the sample locations are determined when the system is being designed, and then built in. Effluent chambers, pump tanks and sampling ports are suggested locations at which to obtain samples. A sampling port is a part or device at a particular location in a component that allows a sample to be collected for analysis.
Chapter 7081.0240 (E) requires that MSTS must be designed with sufficient access and ports to monitor the system as applicable.
Some obvious locations where the wastewater characteristics are of interest are:
n as it leaves the home
n as it leaves the tank
n at the system’s “end-of-pipe”
n in groundwater (lysimeter, sampling wells)
n in soil (dry gram soil/microgram fecal)
Piezometers can be used to determine the amount of separation but are not to be used to sample groundwater. Lysimeters or soil access ports can be used to determine the amount of fecal coliform bacteria under system.
referencesAdolfson Associates, Inc., Burnett Consolidated On-Site Demonstration Project, Final Report, Tacoma-Pierce County Health Department, Washington, 1999.
Ayres Associates, Florida Keys Onsite Wastewater Nutrient Reduction Systems Demon-stration Project, Final Report, Submitted to Florida Department of Health, Onsite Sew-age Program, March, 1998.
Ayres Associates, Onsite Sewage Disposal System Research in Florida, Report Prepared for Environmental Health Program, Department of Health and Rehabilitative Services, State of Florida, March 1993.
Bohrer, R. M. and Converse, J. C., Soil Treatment Performance and Cold Weather Op-eration of Drip Distribution Systems, Proceedings of the Ninth National Symposium on Individual and Small Community Sewage Systems, ASAE, Fort Worth, Texas, pp. 561-583, 2001.
Bouchard, D. C., et al., Nitrate Contamination of Groundwater: Sources and Potential Health Effects, Journal of AWWA, Vol. 84, no, 9, pp.85-90, 1992.
Brooks, M., Alternative On-Site Wastewater Treatment Systems, Department of Civil and Agricultural Engineering, Montana State University, June, 1996.
California Regional Water Quality Control Board, Evaluation of Alternative Onsite Treat-ment Systems for the Removal of Nitrogen from Wastewater, Central Coast Region, No-vember 25, 1997.
CIDWT Decentralized Wastewater Glossary. Available online at: http://www.onsiteconsortium.org/files/Glossary.pdf (verified 4/29/2009)
Converse, M. M., A Field Evaluation of Single Pass Sand filters in a Northern Climate, Master’s Thesis, Agricultural Engineering, University of Wisconsin-Madison, 1999.

5-58 n Section 5: Wastewater Sources and Flows
County of Butte, Chico Urban Area Nitrate Compliance Plan, Program Report and Pro-posed Implementation Plan, Butte County Administrative Office, Oroville, California, March, 1998.
County of Suffolk, Standards for Construction of Modified Sewage Disposal Systems, Department of Health Services, Division of Environmental Quality, Farmingville, New York, March 8, 1989.
Carducci, A., Tozzi, E., Rubulotta, E., Casini, B., Cantiani, L., Rovini, E., Muscillo, M. and Pacini, R. (2000). Assessing Airborne Biological Hazard from Urban Wastewater Treatment. Wat. Res. 34, 4, 1173-1178.
Centers for Disease Control. (2005). Hepatitis A Fact Sheet. Retrieved August 11, 2008 from http://hawaii.gov/health/healthy-lifestyles/std-aids/pdfs/hepatitis/hepa-factsheet-CDC.pdf.
The Center to Protect Workers’ Rights. (2004). Biological Hazards in Sewage and Waste-water Treatment Plants. Retrieved August 9, 2008 from http://www.cpwr.com/pdfs/pubs/hazard_alerts/hazsludge.pdf.
Crites, R., and Tchobanoglous, G., Small and Decentralized Wastewater Management Systems, McGraw-Hill, New York, 1998.
Douwes, J., Mannetje, A., Heederik, D. (2001). Work-related Symptoms in Sewage Treatment Workers. Ann. Agric. Environ. Med., 8, 39-45.
Department of Environmental Quality, Nondegradation of Water Quality, Administrative Rules of Montana, Water Quality Division, December 1995.
EPCOR. Okotoks Wastewater Treatment Plant. Retrieved August 9, 2008 from http://www.epcor.ca/Communities/Alberta/Operations/Water+Treatment+Plants/Okotoks/wtp.htm.
Frequently Asked Questions & Answers about Wastewater and Biosolids Worker Health & Safety. Retrieved August 9, 2008 from http://www.biosolids.org/docs/17880.PDF.
Geerts, S. M., et al., Performance of Pre-engineered Modular Peat Filters for the Treat-ment of Domestic Wastewater at the Northeast Regional Correction Center, NRRI Tech-nical Report TR-01/35, Natural Resources Research Institute, University of Minnesota – Duluth, November 2001.
Gold, A. J. and Sims, J. T., Research Needs in Decentralized Wastewater Treatment and Management: A Risk-Based Approach to Nutrient Contamination, National Research Needs Conference Proceedings: Risk-Based Decision Making for Onsite Wastewater Treatment, EPRI, US EPA, National Decentralized Water Resources Capacity Develop-ment Project 2001.1001446, Palo Alto, CA, 2000.
Gold, A., et al., Wastewater Renovation in Buried and Recirculating Sand Filters, J. Envi-ronmental Quality, Vol. 21, pp.720-725, 1992.
Gold, A., et al., Nitrogen Removal Systems for On-Site Wastewater Treatment, Proceed-ings of the 6th Northwest On-Site Wastewater Treatment Short Course, University of Washington, Seattle, September, 1989.
Graydon, J., et al., Onsite Biological Nitrogen Removal Using Recirculating Trickling Filters, In R. E. Hinchee et al., Eds., Bioremediation of Inorganics, pp. 133-139, Batelle Press, Columbus, Ohio, 1995.

Section 5: Wastewater Sources and Flows n 5-59
Hallberg, G. R., Nitrate in Ground Water in the United States, in Nitrogen Management and Groundwater Protection, (Edited by R. F. Follett) Elsevier Sci. Publ., Amsterdam, 1989.
Hantzsche, N. and Finnemore, E., Predicting Ground-Water Nitrate-Nitrogen Impacts, Ground Water, Vol. 30, No. 4, pp. 490-499, 1992.
Health and Safety Executive. (2004). Working with sewage: The health hazards. Re-trieved August 9, 2008 from http://www.hse.gov.uk/pubns/indg197.pdf.
Health and Safety Executive. (2004). Working with sewage: The health hazards – A guide for employers. Retrieved August 9, 2008 from http://www.hse.gov.uk/pubns/indg198.
Khuder, Sadik A., Arthur, Tammy, Bisesi, Michael S. and Schaub, Eric A. (1998). Preva-lence of Infectious Diseases and Associated Symptoms in Wastewater Treatment Workers. American Journal of Industrial Medicine, 33, 571-577.
Laak, R., Wastewater Engineering Design for Unsewered Areas, 2nd Edition, Technomic Publishing, Lancaster, Pennsylvania, 1986.
Laitinen, S., Kangas, J., Kotimaa, M., Liesivuori, J., Martikainen, Pertti J., Nevalainen, A., Sarantila, R., and Husman, Kaj. (1994). Workers’ Exposure to Airborne Bacteria and Endotoxins at Industrial Wastewater Treatment Plants. Am. Ind. Hyg. Assoc., 55, 11, 1055-1060.
Leverenz, H., et al., Evaluation of High-Porosity Medium in Intermittently Dosed, Multi-Pass Packed Bed Filters for the Treatment of Wastewater, Small Flows Quarterly, Vol. 2, No. 2, pp. 28-35, 2001.
Loomis, G., Department of Natural Resources Science, University of Rhode Island, per-sonal communication, 2002.
Loomis, G. et al., Performance Evaluation of Innovative Treatment Technologies Used to Remediate Failed Septic Systems, Proceedings of the Ninth National Symposium on Individual and Small Community Sewage Systems, ASAE, Fort Worth, Texas, pp. 52-61, 2001.
Loudon, T., et al., Cold Climate Performance of Recirculating Sand Filters, Proceedings of the Fourth National Symposium on Individual and Small Community Sewage Sys-tems, ASAE, pp. 333-342, 1985.
Magdorf, F.R., D.R. Keeney, J. Bouma, W.A. Ziebell. 1974. Columns representing mound type disposal systems for septic tank effl uent: II. nutrient transformations and bacterial populations. Journal of Environmental Quality. 3(3) p .228-234.
Mayer, PW, DeOreo, WB, et al. Residential End Uses of Water. American Water Works Association. 1999
Miller, Patricia. Inspections of Onsite Systems Health and Safety. Small Flows Quarterly, 2, 1, 33-36. 2001.
Maloney, J. C., Principal Public Health Engineer, County of Suffolk, Department of Health Services, Farmingville, New York, personal communication, March 7, 1995.
Metcalf & Eddy, Wastewater Engineering: Treatment, Disposal, and Reuse, 3rd. Edition, McGraw-Hill, New York, 1991.

5-60 n Section 5: Wastewater Sources and Flows
Nolte and Associates, Literature Review of Recirculating and Intermittent Sand Filter Operation and Performance, Prepared for the California Regional Water Quality Control Board, Central Valley Region, Redding, California, June, 1992.
Nowak, P., R. Shepard and F. Madison, Farmers and Manure Management: A Critical Analysis, In J. L. Hatfield and B. A. Stewart, Eds., Waste Utilization: Effective Use of Manure as a Soil Resource, Ann Arbor Press, 1997.
Oakley, S. 2005. Onsite Nitrogen Removal Text. in (M.A. Gross and N.E. Deal, eds.) University Curriculum Development for Decentralized Wastewater Management. Na-tional Decentralized Water Resources Capacity Development Project. University of Ar-kansas, Fayetteville, AR.
Oakley, S., et al., Recirculating Trickling Filter Systems for Onsite Nitrogen Removal: Final Report to Butte County, CSUC Environmental Laboratory, Department of Civil Engineering, California State University, Chico, California, May, 1996.
Oakley, S., et al., Septic Tank and Recirculating Gravel Filter Effluent Treatment and Disposal with Subsurface Absorption Trenches, Final Report for the Town of Paradise, National Demonstration Project for Small Communities, CSUC Environmental Labora-tory, Department of Civil Engineering, California State University, Chico, California, September, 1998.
Oakley, S., et al., Monitoring Nitrogen and Viruses in the Vadose Zone with Suction Lysimeters, Proceedings of the 10th Northwest On-Site Wastewater Treatment Short Course, University of Washington, Seattle, pp. 211-231, September 20-21, 1999.
Olson, K.; Gustafson, D., Liukonnen, B. and Cook, V. (2005). Septic System Owner’s Guide. St. Paul, MN: University of Minnesota Extension Service.
Pascual, L., Perez-Luz, S., Yanez, M. Adela., Santamaría, A., Gibert, K., Salgot, M., Apraiz, D. and Catalan, V. (2003). Bioaerosol emission from wastewater treatment plants. Aero-biologia, 19, 261-270
Piluk, R. J. and Peters, E. C., Small Recirculating Sand Filters for Individual Homes, Proceedings 7th International Symposium on Individual and Small Community Sewage Systems, ASAE, Atlanta, 1994.
Power, J. F. and Schepers, J. S., Nitrate Contamination of Groundwater in North Amer-ica, Agriculture, Ecosystems, and Environment, Elsevier Sci. Publ., Amsterdam, 1989.
Prazmo, Z., Krysinska-Traczyk, E., Skorska, C., Sitkowska, J., Cholewa, G. and Dutkie-wicz, J. (2003). Exposure to Bioaerosols in a Municipal Sewage Treatment Plant. Ann. Agric. Environ. Med., 10, 241-248.
Rittmann, B. E. and McCarty, P. L., Environmental Biotechnology: Principles and Ap-plications, McGraw-Hill, New York, 2001.
Robertson, W. D., and Cherry, J. A., In Situ Denitrification of Septic-System Nitrate Us-ing Reactive Porous Media Barriers: Field Trials, Groundwater, Vol. 33, No. 1, pp. 99-111, 1995.
Ronayne, M. P., et al., Final Report: Oregon On-Site Experimental Systems Program, State of Oregon, Department of Environmental Quality, December 1982.
Sandy, A. T., et al., Enhanced Nitrogen Removal Using a Modified Recirculating Sand Filter, Proceedings of the Fifth National Symposium on Individual and Small Community

Section 5: Wastewater Sources and Flows n 5-61
Sewage Systems, ASAE, Chicago, pp. 161-170, 1988.
Sawyer, C., et al., Chemistry for Environmental Engineering, 4th Edition, McGraw-Hill, New York, 1994.
Suffolk County, New York, Standards for Approval of Plans and Construction for Sewage Dis-posal Systems, Appendix A, Standards for Construction of Modified Sewage Disposal Systems, Department of Health Services, Division of Environmental Quality, March 8, 1989.
US EPA, Manual: Nitrogen Control, EPA/625/R-93/010, Office of Water, Washington, D.C., September, 1993.
US EPA, Design Manual: Onsite Wastewater Treatment and Disposal Systems, EPA 625/1-80-012, Office of Water Program Operations, Washington, D.C., October 1980.
State of Victoria Department of Education and Early Childhood Development. (2007). Plumbing module: Biological hazards. Retrieved August 9, 2008 from http://www.educa-tion.vic.gov.au/safe@work/modules/plumbing/05_biological.asp.
Water Environment Federation, Biological and Chemical Systems for Nutrient Removal, Special Publication, Alexandria, Virginia, 1998.
Water Environment Federation, Natural Systems for Wastewater Treatment, 2nd Edition, Manual of Practice FD-16, Alexandria, Virginia, 2001.
Whitmeyer, R. W., et al., Overview of Individual Onsite Nitrogen Removal Systems, Proceedings of the Sixth National Symposium of Individual and Small Community Sew-age Systems, American Society of Agricultural Engineers, ASAE Publication 10-91, pp. 143-154, 1991.
Zimmerman, Bill and Maurer, Hillary. (2007). Mounds and At-Grades the Easy Way. Earthview Environmental LLC. Retrieved August 14, 2008 from http://www.earth-viewenvironmental.com/at_grade_mound_constr.pdf
appendix 1biological Hazards in Wastewater: FaQs for Septic System ProfessionalsBufford A. Ang; Sara Heger Christopherson; John M. Shutske
Q: What microorganisms are present in wastewater that can be hazardous to health?A: Microorganisms that cause disease are known as pathogens. A variety of pathogens are
present in wastewater, including (The Center to Protect Worker’s Rights, 2004):
n Bacteria, such as E. coli, Shigella, Salmonella, Vibrio cholerae, and Leptospira. Bacte-ria are small, single-celled life-forms that can reproduce quickly. These bacteria can cause diarrhea, fever, cramps, vomiting, headache, weakness, or loss of appetite.
n Parasites. These use other organisms such as humans for food or a place to live and reproduce. One type of parasite is the protozoa. These are single-celled, micro-scopic organisms that live primarily in water. Some protozoans that cause disease include Giardia lambia, Cryptosporidum parvum and Amoeba. Another type of

5-62 n Section 5: Wastewater Sources and Flows
parasite includes helminths, which are worms. Roundworms, for example, can cause ascariasis. A lot of roundworms in your stomach will make you cough, and cause breathing difficulties, abdominal pain, and intestinal blockage.
n Viruses are small particles that infect cells in other organisms. A virus cannot reproduce on its own, but requires other living cells to replicate. Viruses such as Norwalk-like viruses and hepatitis A are passed through feces of infected people. Hepatitis A is the most common virus present in wastewater.
Q: What are signs of hepatitis A?A: One obvious sign of the hepatitis A virus (HAV) is jaundice - yellowing of the skin
or whites of the eyes. Other signs include tiredness, abdominal pain, nausea, and diarrhea. About 15% of people infected with HAV will have prolonged or relapsing symptoms over a 6-9 month period (Centers for Disease Control, 2005).
Q: What health risks are present in wastewater?A: All wastewater will contain fecal coliforms. These bacteria are present in the intestines
of all warm-blooded animals, including humans. Although they are important in di-gestion (and also help with some treatment of wastewater in septic tanks), they may cause varying degrees of illness if introduced to someone through any of the pathways listed later in this paper. Pathogens like Giardia, Cryptosporidia, Salmonella, Shigella, Vibrio cholerae, etc., will be present only if those using the wastewater treatment system are infected. However, since it is unlikely you will ever know the health conditions of those using a particular system, always assume that health risks exist. Exposure to wastewater may result in a number of illnesses, some of which include (Health & Safety Executive, 2004):
n Gastroenteritis (cramping stomach pains, diarrhea, and vomiting), caused by E. coli and other bacteria; protozoans such as Giardia and Cryptosporidia; and some viruses.
n Cholera (extreme diarrhea and dehydration), caused by the bacteria Vibrio chol-erae.
n Leptospirosis (flu-like symptoms, accompanied by a persistent and severe head-ache), caused by the bacteria Leptospira. Leptospirosis may result in damage to liver, kidneys and blood, and may be fatal.
n Infectious hepatitis (jaundice and fever) due to the virus Hepatitis A. It causes liver inflammation.
n Legionellosis (lung inflammation with fever, dry cough, and aching muscles and joints) caused by a bacteria.
n Skin and eye infections.
Q: How can workers come in contact with pathogens?A: There are four main routes that explain how pathogens can enter the body. These
include (Health & Safety Executive, 2004):
n Oral Ingestion via hand-to-mouth contact during eating, drinking, and smoking; and by wiping your face with contaminated hands or gloves. Ingestion is the major route of infection.
n Dermal Skin contact from wastewater splashes. Having cuts, scratches, and wounds raises the risk of infection.

Section 5: Wastewater Sources and Flows n 5-63
n Eyes Pathogens can enter the body through the eye.
n Lungs Inhaling airborne microbes carried by dust, mist, or fumes.
Q. What are likely points of microbial contamination?A. The following are common sites contaminated with pathogens:
n Air in the vicinity of wastewater can lead to respiratory exposure.
n Tools, vehicle door handles, radio knobs, and gear shifters result in dermal expo-sure.
n Lunch, cigarettes, gum, etc. can lead to ingestion of pathogens.
Q: Where are pathogens found in wastewater treatment systems?A: Pathogens are present in wastewater, and can be found anywhere and on anything
that is in contact with wastewater. This means they will be found in the septic tank, distribution pipes, and effluent treatment components such as a drainfield, mound, recirculating sand filter, etc. Highest populations are present in the septic tank, and are reduced as wastewater receives treatment while traveling through the system (see image below). In properly designed, installed, and maintained systems, research has shown there are no pathogens found in wastewater once it has traveled through soil three feet below the bottom of the drainfield (Zimmerman and Maurer, 2007). Please see table below.
table a-1 numbers of pathogens found in wastewater at various stages of treatment in an onsite system (Zimmerman and Maurer, 2007)
Microorganism raw wastewater Septic tank effluent 1 ft below trench 3 ft below trench
Fecal coliforms (MPN/100 ml)
1,000,000 – 100,000,000
1,000 – 1,000,000,000
0 - 100 0
Viruses (CFU/ml) unknown 1,000 – 1,000,000,000
0 - 1000 0
In wastewater treatment plants, pathogens have been found in the following components and processes:
n Pre-treatment
n Thickening, dewatering, primary and secondary sludge treatment
n Primary clarifiers and settlers
n Aeration (biological oxidation) tank
n Sludge processing unit
n Belt press machines (belt press area)
n Sludge collection hoppers
n Sludge dewatering area
n Incoming water tunnels
n Inflow chambers
n Aerated basins with sprinkler systems
n Trickling filters
n Grit collection

5-64 n Section 5: Wastewater Sources and Flows
n Biofilter tower interior
n Servicing and cleaning equipment
n Washing stations
Q: What can septic system workers and wastewater treatment plant employees do to protect themselves from pathogens?
A: Since pathogens are naturally found in wastewater, they CANNOT be removed. The risk of contracting a disease decreases if you practice good personal hygiene and use personal protective equipment on the job. Some pointers to keep in mind and to practice are:
n Make sure you understand the risks these microbes pose to your health, and ways that you can pick up infections.
n Always have a first aid kit handy. Clean and disinfect all exposed wounds, and cover with a sterile waterproof dressing.
n Report any injuries suffered at the work site to your supervisor right away.
n Use waterless hand cleaners, anti-bacterial soaps, and anti-bacterial handwipes on the job.
n DO NOT eat or drink in a wastewater handling area.
n Do not touch your nose, mouth, eyes, or ears with your hands unless you have just washed your hands.
n Wash your hands well with soap and clean hot water before you eat or smoke, periodically throughout the day, and at the end of your workday. Assume anything coming in contact with wastewater is contaminated!
n Clean any part of you that comes in contact with wastewater or sludge immedi-ately.
n Keep your fingernails short and clean them frequently.
n Wear waterproof gloves when cleaning pumps or screens, or when handling wastewater, sludge, or grit. Whenever possible, wear heavy-duty gloves (double glove) and boots that are waterproof and puncture resistant (The Center to Protect Worker’s Rights, 2004).
n Wear a surgical-type mask, goggle, face shield, or visor if there is a chance that you will be splashed with wastewater.
n Wear rubber boots or those that can be disinfected if you should step in wastewa-ter.
n Report any damaged equipment right away for replacement or repair.
n Handle sharp items with extra care to prevent accidental injuries.
n Clean contaminated equipment/tools on site with a bleach solution (Miller, 2001) (1 tablespoon of bleach to 1 gallon of water). Bleach loses its effectiveness after exposure to sunlight or dirt, so keep a fresh supply handy.
n Shower and change your work clothes before leaving work for the day. Do not take contaminated clothing home for washing. Use two different lockers to separate your work and street clothes. If you must launder your clothing at home, launder your work clothing separately from family clothing.
n Wash work clothing in hot water with chlorine bleach.

Section 5: Wastewater Sources and Flows n 5-65
n Discuss your occupation with your health care providers so they know what poten-tial exposures you have due to your work.
n Be sure your vaccine shots are up-to-date, especially for tetanus and diphtheria. Vaccination against hepatitis A is highly recommended.
n Consult your healthcare provider for any flu-like symptoms, such as fever or severe headache, or any skin infections. Seek medical help if chest symptoms consistent with asthma appear.
Q: So, do professionals really need to worry about airborne droplets and dust that carry pathogens (bioaerosols)?
A: Yes! In 2003, Prazmo and her colleagues studied Polish sewer workers who were ex-posed to droplet aerosols containing infectious biological agents. These aerosols im-paired the immune system and had the potential to produce allergies in susceptible individuals. Prazmo and her colleagues listed the infectious agents present, which included viruses (polioviruses, coxsackieviruses, echoviruses, rotaviruses, adenovirus-es, Norwalk virus), and bacteria (Leptospira, Salmonella spp., Shigella spp., Campylo-bacter jejuni, Yersinia enterocolitica, Legionella pneumophila, Helicobacter pylori, Listeria monocytogenes, Mycobacterium xenopi). Another risk that they cited was microbial al-lergens and endotoxins. They stated that endotoxins, produced by bacteria, can cause respiratory and intestinal inflammation, diarrhea, fatigue, and nose irritation among sewer workers.
Q: When, what type, and how should a professional wear a respirator?A: A respirator should be worn whenever you might come in contact with airborne
pathogens, such as spray from a treatment device, or a humid atmosphere. The N-95 Respirator is recommended by the National Institute for Occupational Safety and Health (NIOSH). Fit of respirator is always important to make sure that there is a tight seal between the face and mask. A leak would result in the inhalation of contami-nated air. Facial hair is discouraged, since this can interfere with proper respirator fit. To make sure respirators are fitted, worn, and used properly, a respiratory protection program for the facility is highly recommended.
Q: Just what is the level of risk for an ordinary individual to get exposed to pathogens in wastewater?
A. The answer is “It depends.” The risk for an ordinary individual getting exposed to pathogens depends upon how well the septic system was designed, installed, and maintained. If there is wastewater draining to or surfacing in the yard, there is greater risk than if the system is working properly. If the septic system was installed in an area with high groundwater levels, and/or close to a drinking water well, the risk is higher. If a homeowner maintains his/her own system and cleans the effluent screen, the risk is higher for that person than if a professional is hired. However, if that homeowner follows safety precautions, the risk will be reduced.
All in all, if a system is designed considering the strength and volume of wastewater, the soil and site specifics; installed using best management practices; and maintained properly, risk to an ordinary individual is minimal.