Section 5 Wastewater Collection System Analysis
38
Section 5 Wastewater Collection System Analysis
Transcript of Section 5 Wastewater Collection System Analysis
Section 5 Wastewater Collection
System Analysis
April 2015
2014 Comprehensive Wastewater Management Plan 5-1 Section 5 – Wastewater Collection System Analysis
5.0 Wastewater Collection System Analysis
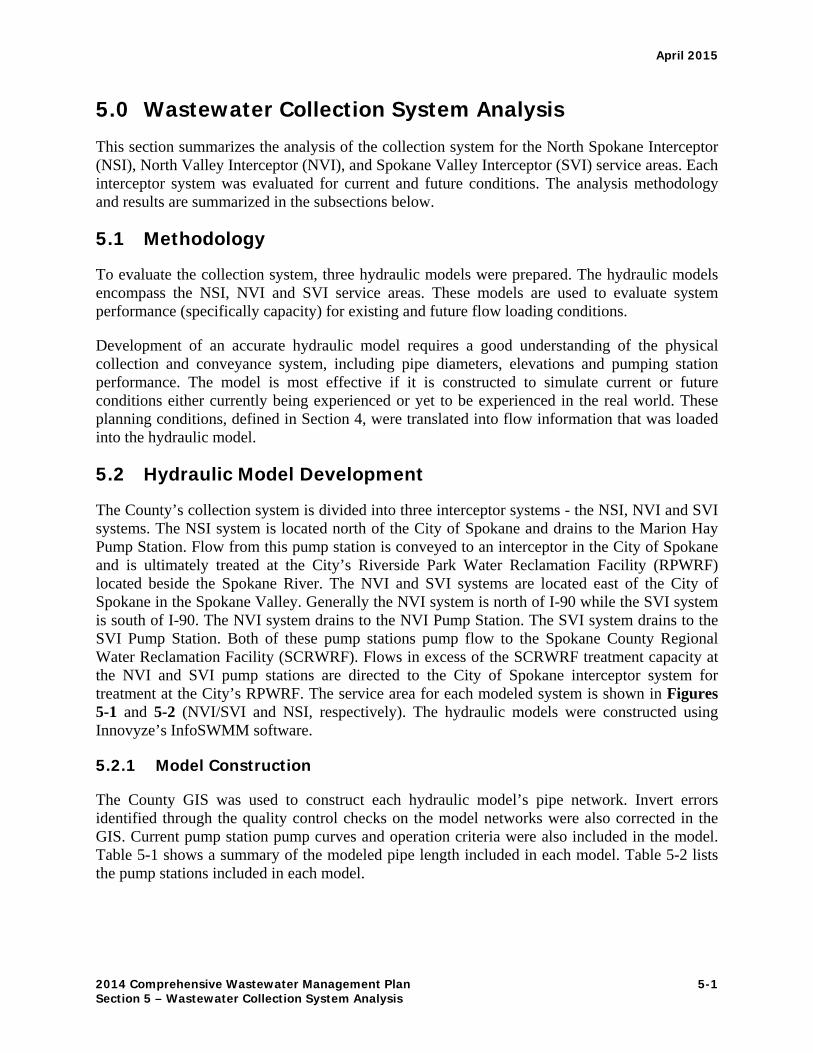
This section summarizes the analysis of the collection system for the North Spokane Interceptor (NSI), North Valley Interceptor (NVI), and Spokane Valley Interceptor (SVI) service areas. Each interceptor system was evaluated for current and future conditions. The analysis methodology and results are summarized in the subsections below.
5.1 Methodology
To evaluate the collection system, three hydraulic models were prepared. The hydraulic models encompass the NSI, NVI and SVI service areas. These models are used to evaluate system performance (specifically capacity) for existing and future flow loading conditions.
Development of an accurate hydraulic model requires a good understanding of the physical collection and conveyance system, including pipe diameters, elevations and pumping station performance. The model is most effective if it is constructed to simulate current or future conditions either currently being experienced or yet to be experienced in the real world. These planning conditions, defined in Section 4, were translated into flow information that was loaded into the hydraulic model.
5.2 Hydraulic Model Development
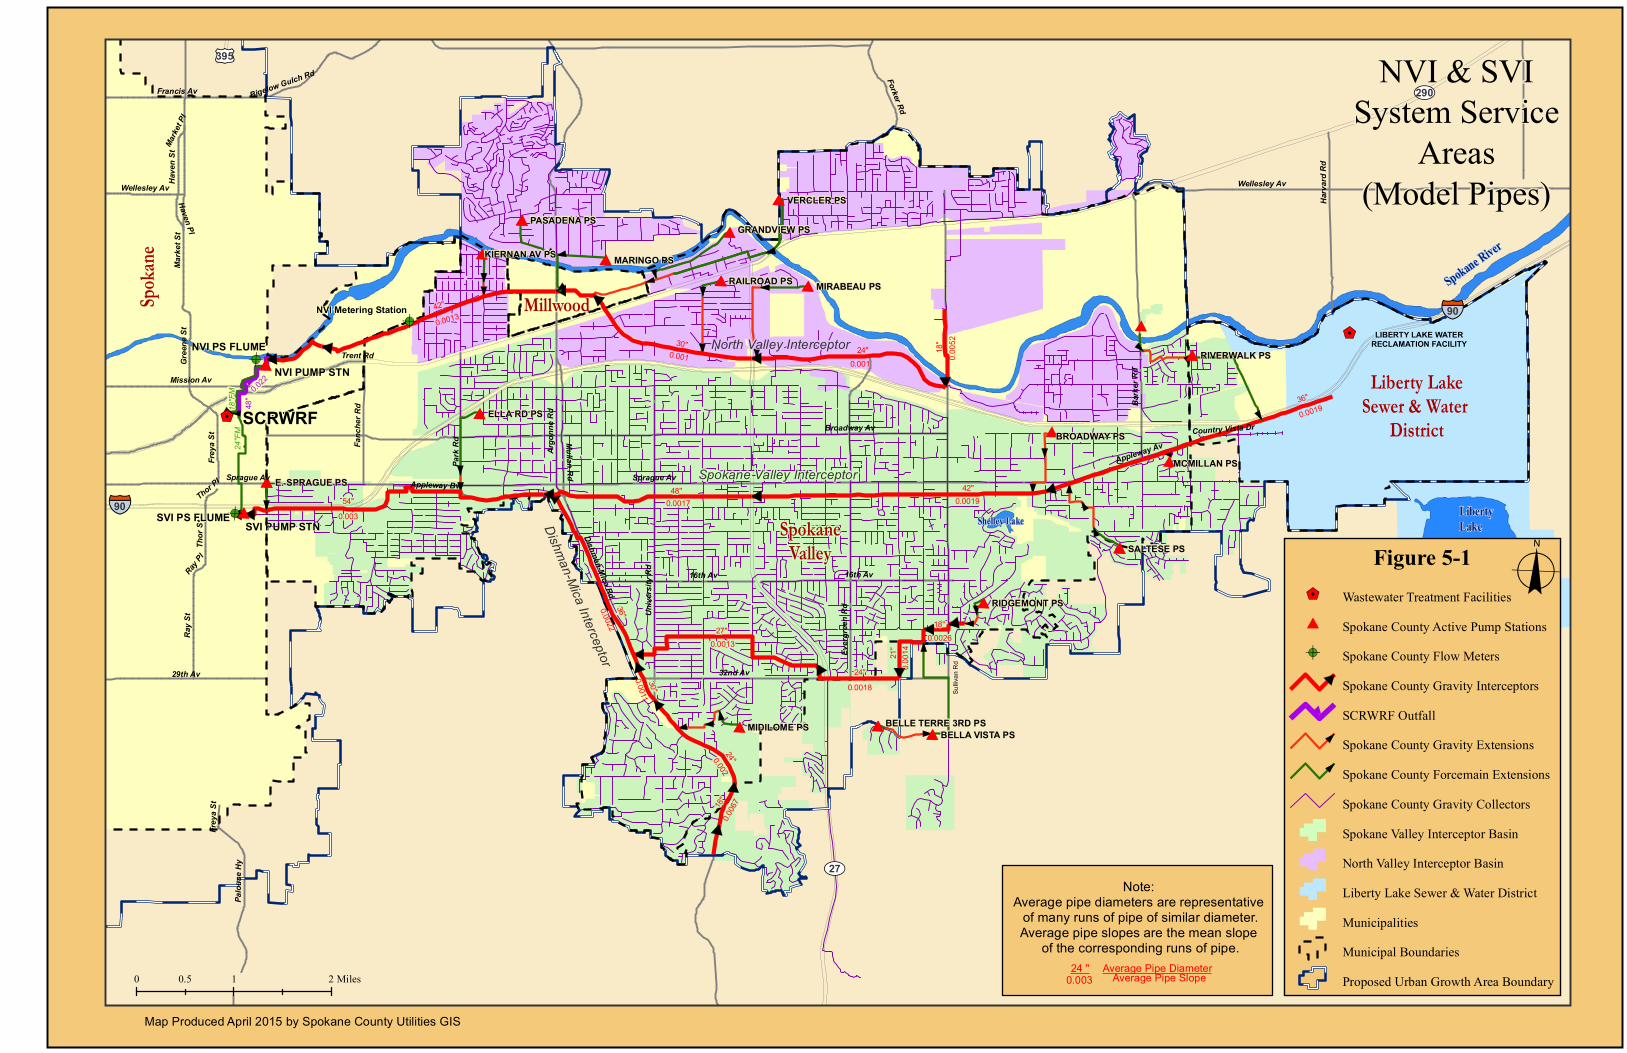
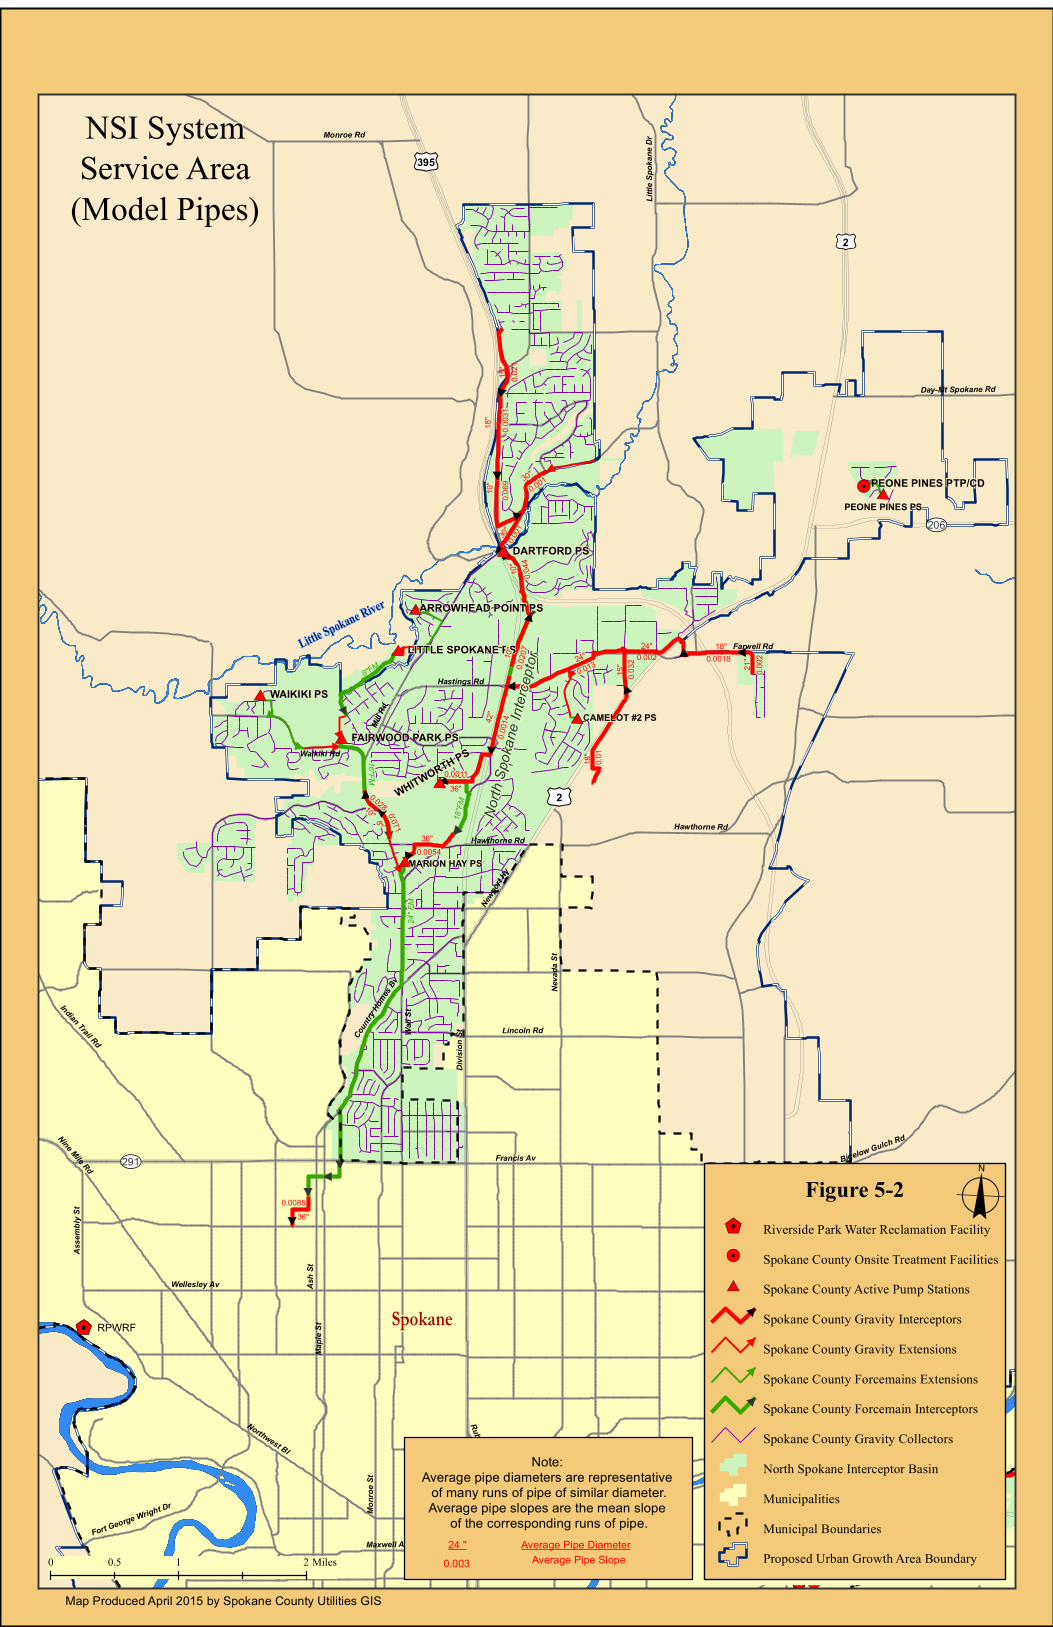
The County’s collection system is divided into three interceptor systems - the NSI, NVI and SVI systems. The NSI system is located north of the City of Spokane and drains to the Marion Hay Pump Station. Flow from this pump station is conveyed to an interceptor in the City of Spokane and is ultimately treated at the City’s Riverside Park Water Reclamation Facility (RPWRF) located beside the Spokane River. The NVI and SVI systems are located east of the City of Spokane in the Spokane Valley. Generally the NVI system is north of I-90 while the SVI system is south of I-90. The NVI system drains to the NVI Pump Station. The SVI system drains to the SVI Pump Station. Both of these pump stations pump flow to the Spokane County Regional Water Reclamation Facility (SCRWRF). Flows in excess of the SCRWRF treatment capacity at the NVI and SVI pump stations are directed to the City of Spokane interceptor system for treatment at the City’s RPWRF. The service area for each modeled system is shown in Figures 5-1 and 5-2 (NVI/SVI and NSI, respectively). The hydraulic models were constructed using Innovyze’s InfoSWMM software.
5.2.1 Model Construction
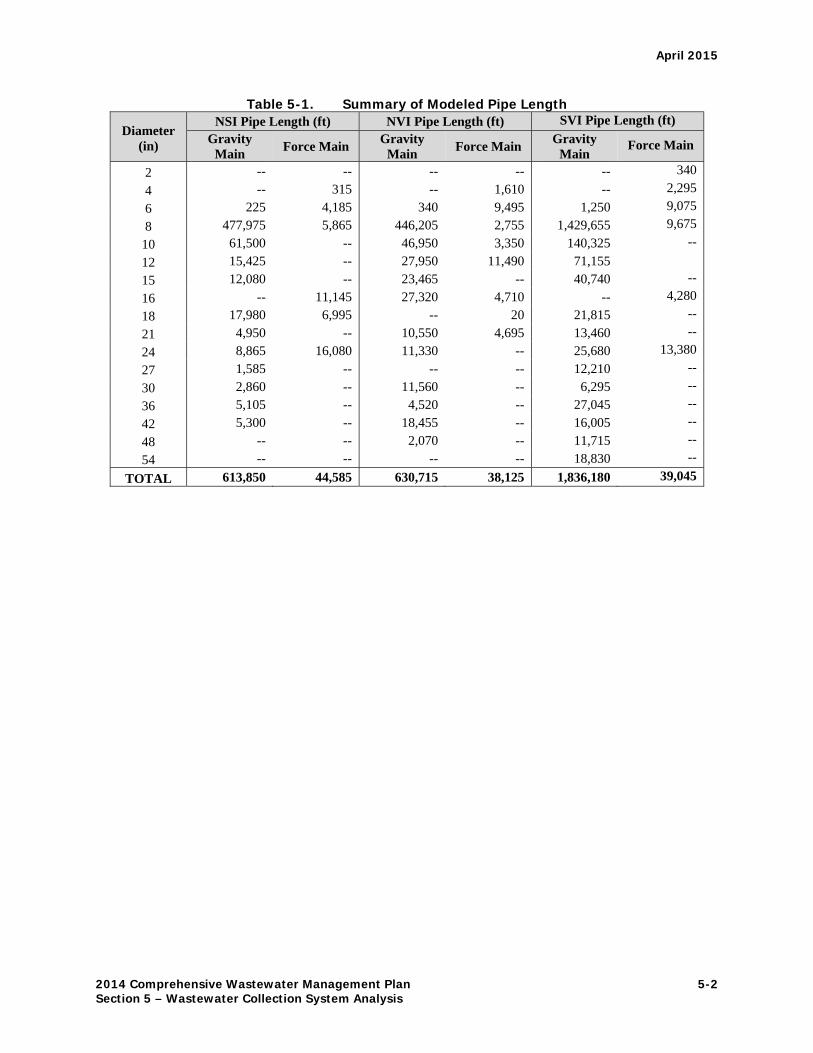
The County GIS was used to construct each hydraulic model’s pipe network. Invert errors identified through the quality control checks on the model networks were also corrected in the GIS. Current pump station pump curves and operation criteria were also included in the model. Table 5-1 shows a summary of the modeled pipe length included in each model. Table 5-2 lists the pump stations included in each model.
April 2015
2014 Comprehensive Wastewater Management Plan 5-2 Section 5 – Wastewater Collection System Analysis
Table 5-1. Summary of Modeled Pipe Length
Diameter (in)
NSI Pipe Length (ft) NVI Pipe Length (ft) SVI Pipe Length (ft)
Gravity Main
Force Main Gravity
Main Force Main
Gravity Main
Force Main
2 -- -- -- -- -- 340
4 -- 315 -- 1,610 -- 2,295
6 225 4,185 340 9,495 1,250 9,075
8 477,975 5,865 446,205 2,755 1,429,655 9,675
10 61,500 -- 46,950 3,350 140,325 --
12 15,425 -- 27,950 11,490 71,155
15 12,080 -- 23,465 -- 40,740 --
16 -- 11,145 27,320 4,710 -- 4,280
18 17,980 6,995 -- 20 21,815 --
21 4,950 -- 10,550 4,695 13,460 --
24 8,865 16,080 11,330 -- 25,680 13,380
27 1,585 -- -- -- 12,210 --
30 2,860 -- 11,560 -- 6,295 --
36 5,105 -- 4,520 -- 27,045 --
42 5,300 -- 18,455 -- 16,005 --
48 -- -- 2,070 -- 11,715 --
54 -- -- -- -- 18,830 --
TOTAL 613,850 44,585 630,715 38,125 1,836,180 39,045
April 2015
2014 Comprehensive Wastewater Management Plan 5-3 Section 5 – Wastewater Collection System Analysis
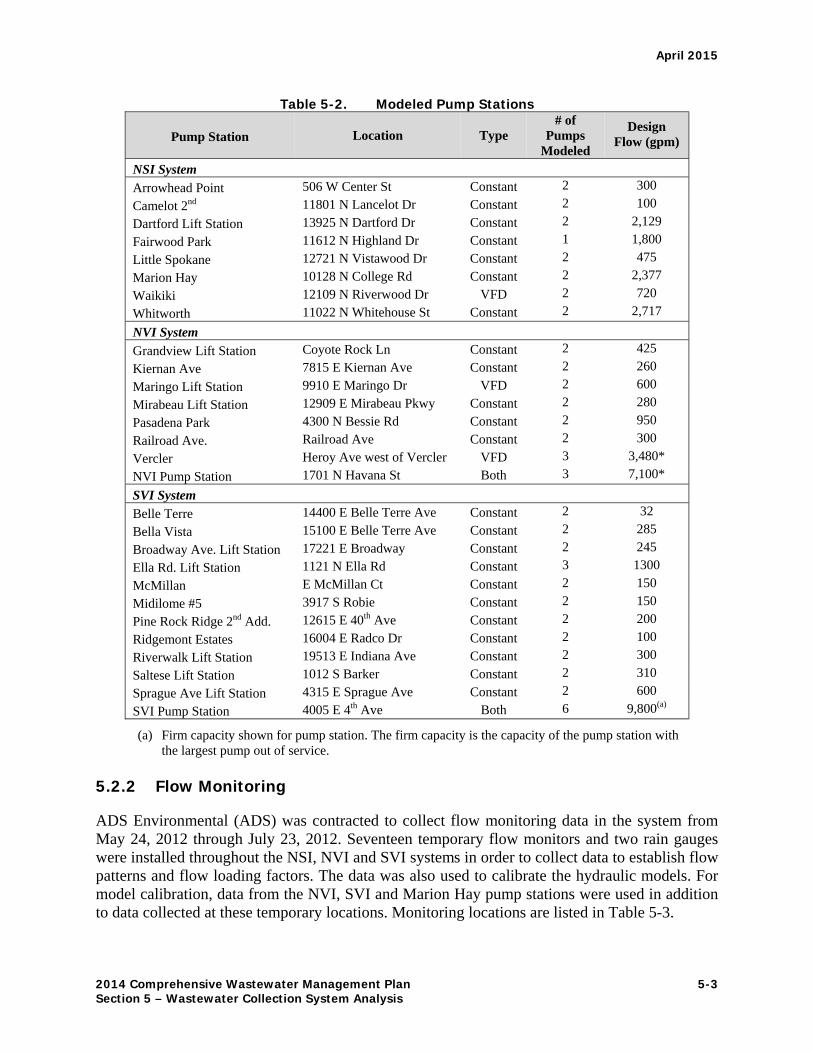
Table 5-2. Modeled Pump Stations
Pump Station Location Type # of
Pumps Modeled
Design Flow (gpm)
NSI System
Arrowhead Point 506 W Center St Constant 2 300
Camelot 2nd 11801 N Lancelot Dr Constant 2 100
Dartford Lift Station 13925 N Dartford Dr Constant 2 2,129
Fairwood Park 11612 N Highland Dr Constant 1 1,800
Little Spokane 12721 N Vistawood Dr Constant 2 475
Marion Hay 10128 N College Rd Constant 2 2,377
Waikiki 12109 N Riverwood Dr VFD 2 720
Whitworth 11022 N Whitehouse St Constant 2 2,717
NVI System
Grandview Lift Station Coyote Rock Ln Constant 2 425
Kiernan Ave 7815 E Kiernan Ave Constant 2 260
Maringo Lift Station 9910 E Maringo Dr VFD 2 600
Mirabeau Lift Station 12909 E Mirabeau Pkwy Constant 2 280
Pasadena Park 4300 N Bessie Rd Constant 2 950
Railroad Ave. Railroad Ave Constant 2 300
Vercler Heroy Ave west of Vercler VFD 3 3,480*
NVI Pump Station 1701 N Havana St Both 3 7,100*
SVI System
Belle Terre 14400 E Belle Terre Ave Constant 2 32
Bella Vista 15100 E Belle Terre Ave Constant 2 285
Broadway Ave. Lift Station 17221 E Broadway Constant 2 245
Ella Rd. Lift Station 1121 N Ella Rd Constant 3 1300
McMillan E McMillan Ct Constant 2 150
Midilome #5 3917 S Robie Constant 2 150
Pine Rock Ridge 2nd Add. 12615 E 40th Ave Constant 2 200
Ridgemont Estates 16004 E Radco Dr Constant 2 100
Riverwalk Lift Station 19513 E Indiana Ave Constant 2 300
Saltese Lift Station 1012 S Barker Constant 2 310
Sprague Ave Lift Station 4315 E Sprague Ave Constant 2 600
SVI Pump Station 4005 E 4th Ave Both 6 9,800(a)
(a) Firm capacity shown for pump station. The firm capacity is the capacity of the pump station with the largest pump out of service.
5.2.2 Flow Monitoring
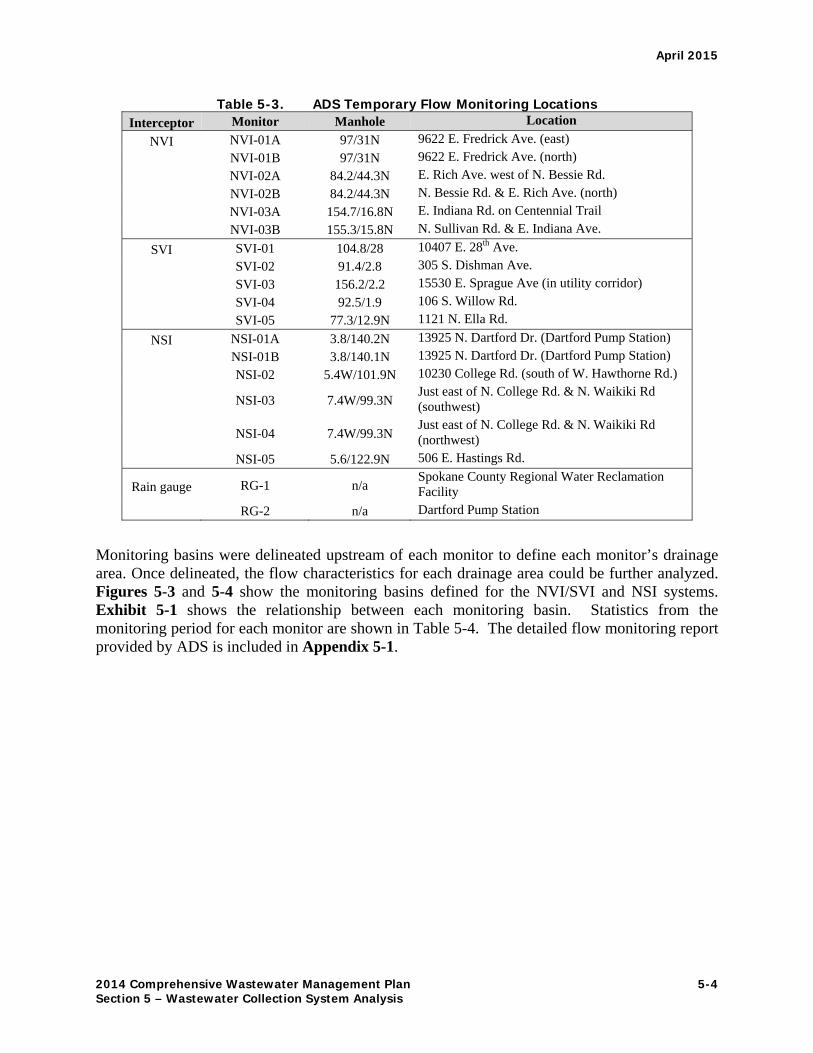
ADS Environmental (ADS) was contracted to collect flow monitoring data in the system from May 24, 2012 through July 23, 2012. Seventeen temporary flow monitors and two rain gauges were installed throughout the NSI, NVI and SVI systems in order to collect data to establish flow patterns and flow loading factors. The data was also used to calibrate the hydraulic models. For model calibration, data from the NVI, SVI and Marion Hay pump stations were used in addition to data collected at these temporary locations. Monitoring locations are listed in Table 5-3.
April 2015
2014 Comprehensive Wastewater Management Plan 5-4 Section 5 – Wastewater Collection System Analysis
Table 5-3. ADS Temporary Flow Monitoring Locations Interceptor Monitor Manhole Location
NVI NVI-01A 97/31N 9622 E. Fredrick Ave. (east)
NVI-01B 97/31N 9622 E. Fredrick Ave. (north)
NVI-02A 84.2/44.3N E. Rich Ave. west of N. Bessie Rd.
NVI-02B 84.2/44.3N N. Bessie Rd. & E. Rich Ave. (north)
NVI-03A 154.7/16.8N E. Indiana Rd. on Centennial Trail
NVI-03B 155.3/15.8N N. Sullivan Rd. & E. Indiana Ave.
SVI SVI-01 104.8/28 10407 E. 28th Ave.
SVI-02 91.4/2.8 305 S. Dishman Ave.
SVI-03 156.2/2.2 15530 E. Sprague Ave (in utility corridor)
SVI-04 92.5/1.9 106 S. Willow Rd.
SVI-05 77.3/12.9N 1121 N. Ella Rd.
NSI NSI-01A 3.8/140.2N 13925 N. Dartford Dr. (Dartford Pump Station)
NSI-01B 3.8/140.1N 13925 N. Dartford Dr. (Dartford Pump Station)
NSI-02 5.4W/101.9N 10230 College Rd. (south of W. Hawthorne Rd.)
NSI-03 7.4W/99.3N Just east of N. College Rd. & N. Waikiki Rd (southwest)
NSI-04 7.4W/99.3N Just east of N. College Rd. & N. Waikiki Rd (northwest)
NSI-05 5.6/122.9N 506 E. Hastings Rd.
Rain gauge RG-1 n/a Spokane County Regional Water Reclamation Facility
RG-2 n/a Dartford Pump Station
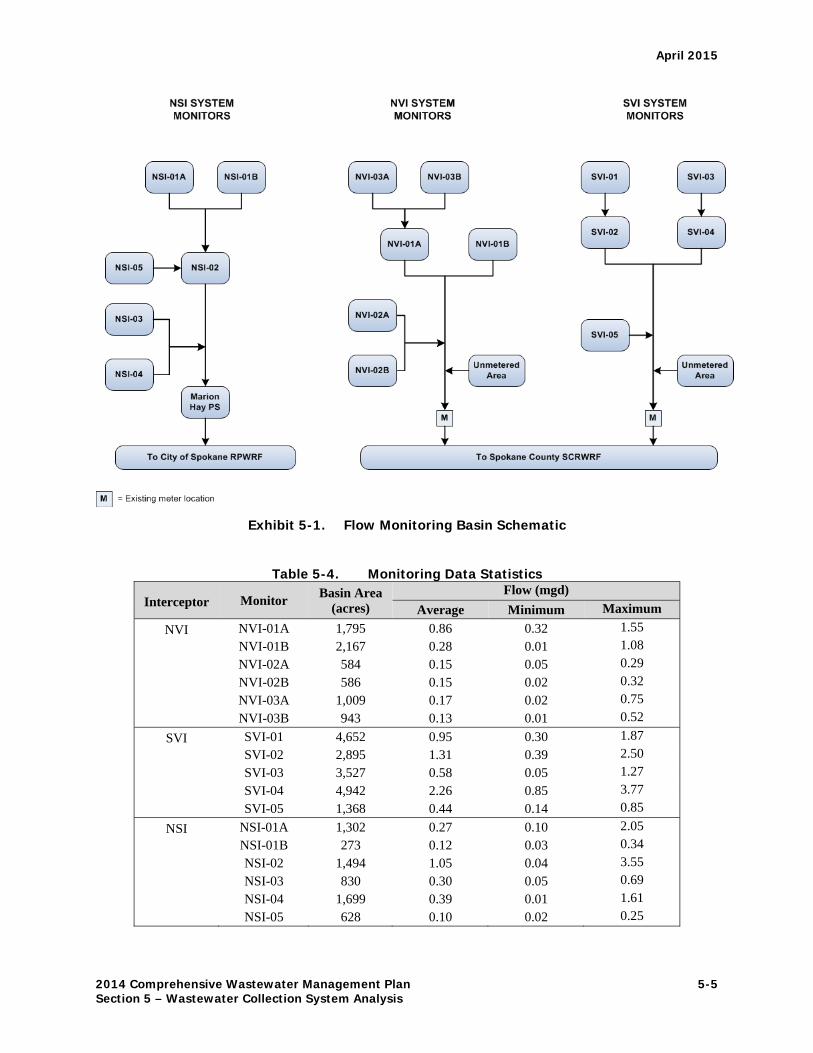
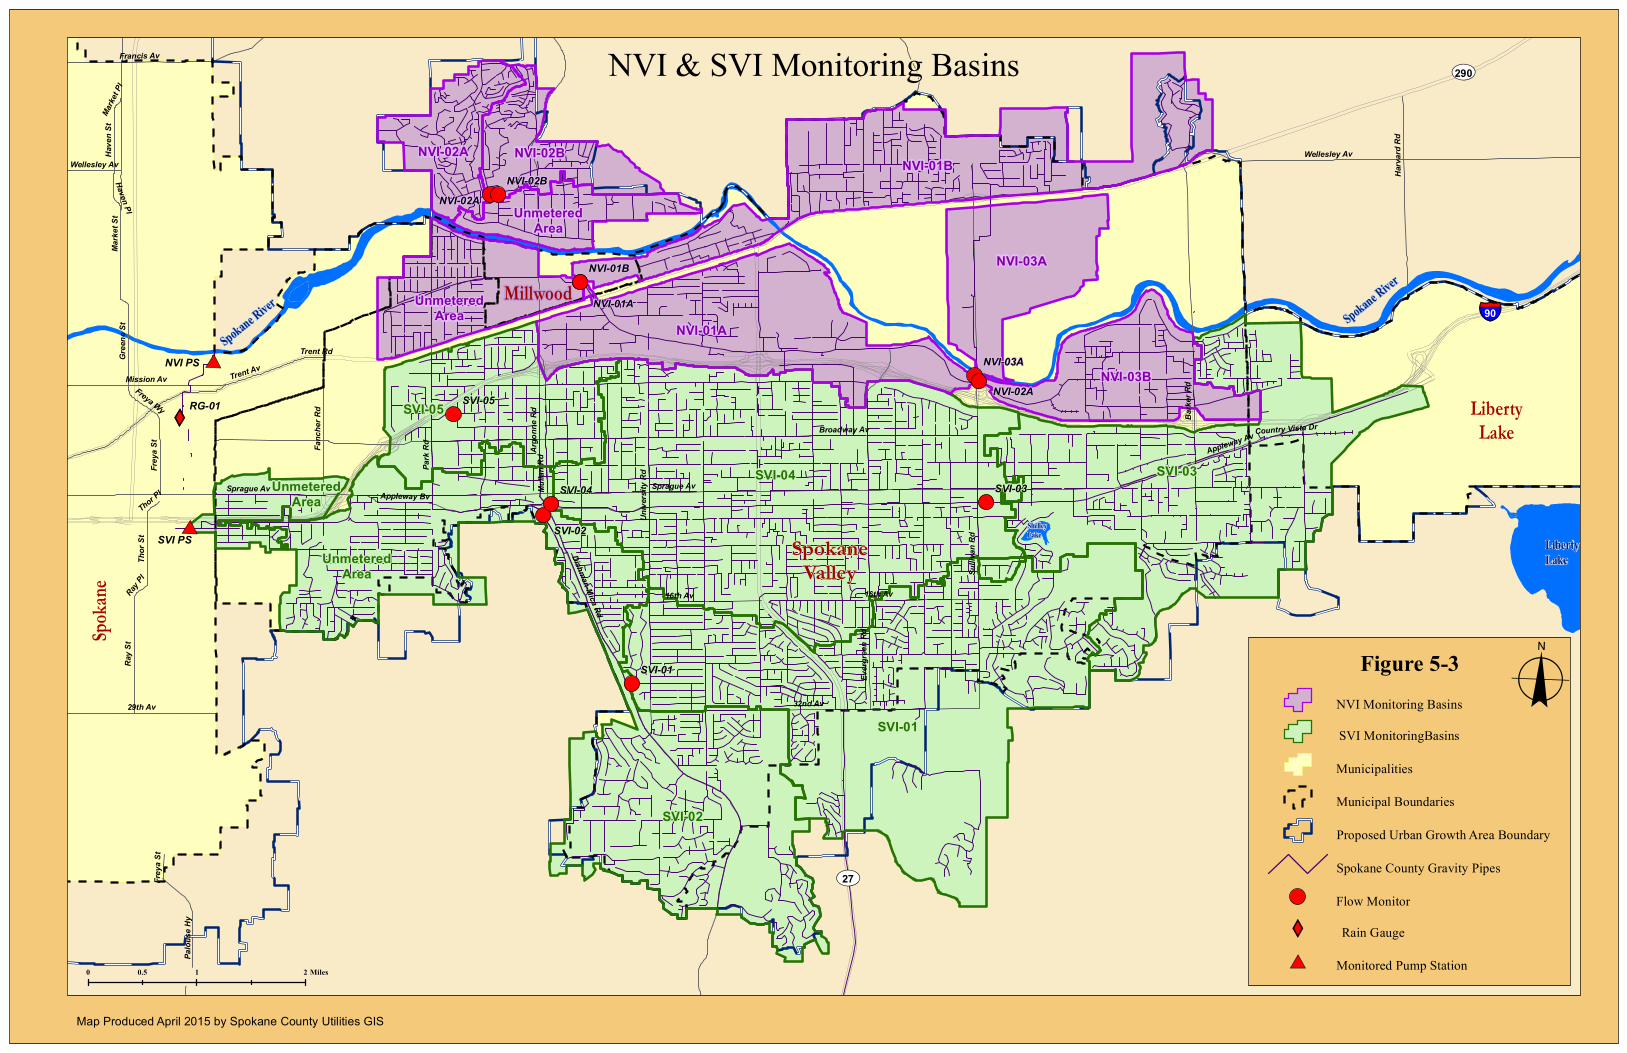
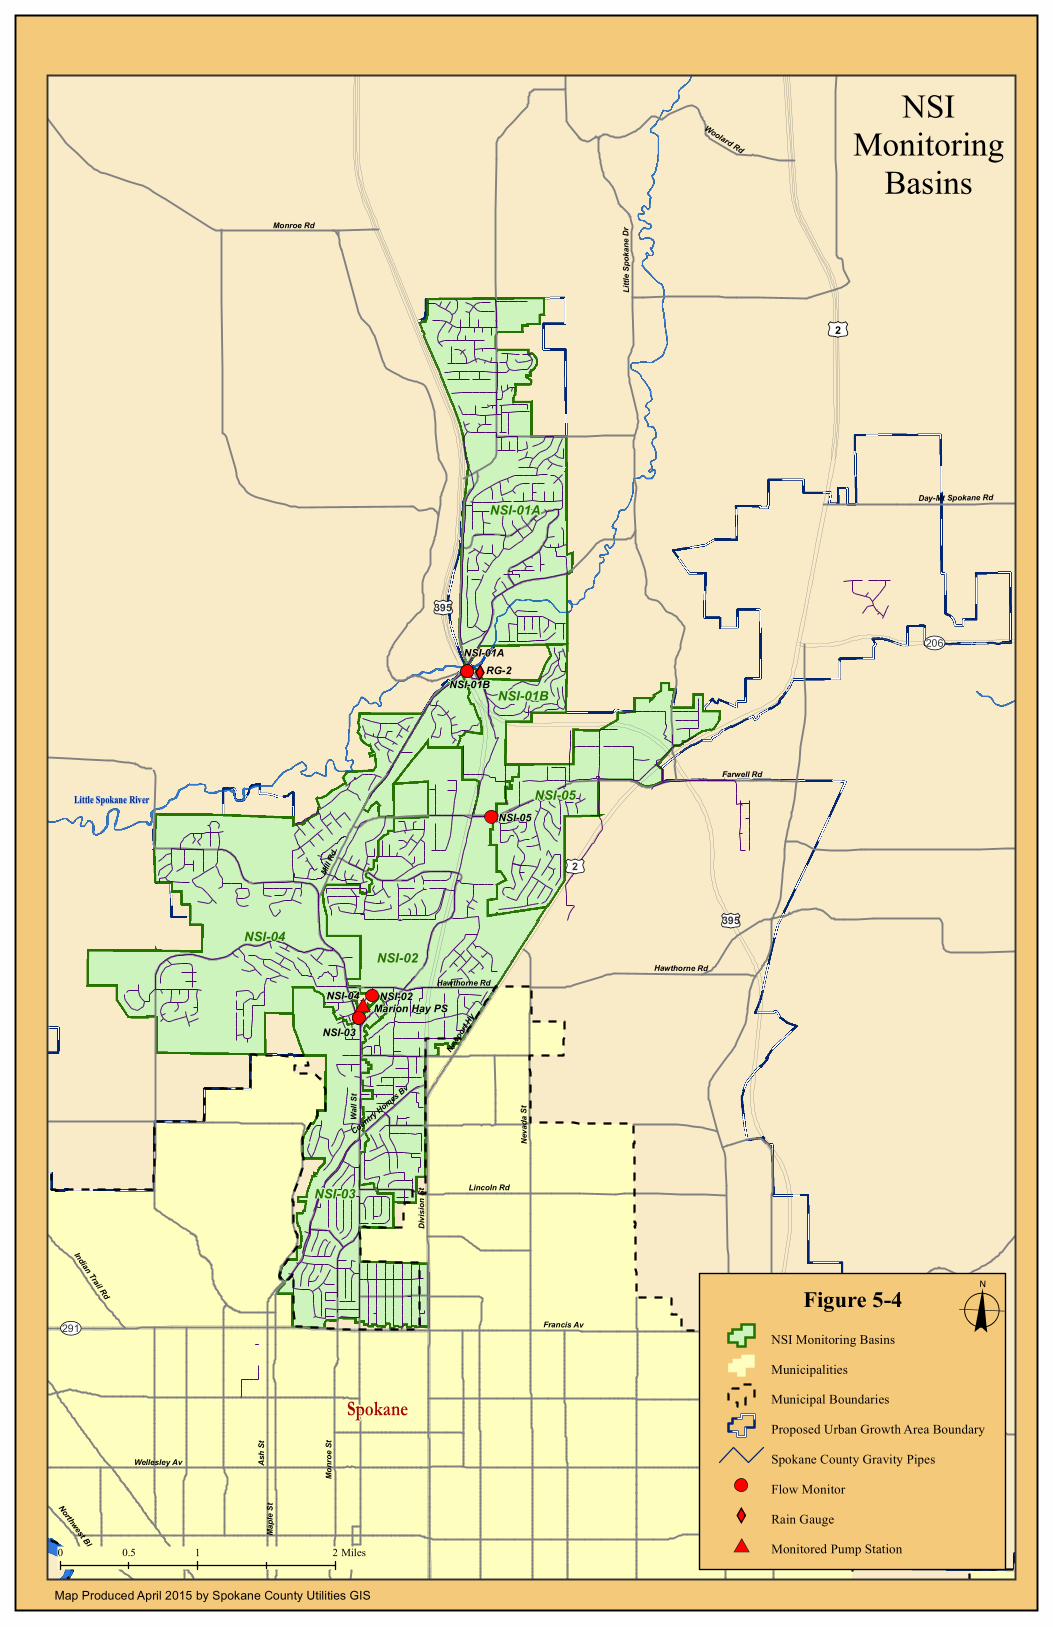
Monitoring basins were delineated upstream of each monitor to define each monitor’s drainage area. Once delineated, the flow characteristics for each drainage area could be further analyzed. Figures 5-3 and 5-4 show the monitoring basins defined for the NVI/SVI and NSI systems. Exhibit 5-1 shows the relationship between each monitoring basin. Statistics from the monitoring period for each monitor are shown in Table 5-4. The detailed flow monitoring report provided by ADS is included in Appendix 5-1.
April 2015
2014 Comprehensive Wastewater Management Plan 5-5 Section 5 – Wastewater Collection System Analysis
Exhibit 5-1. Flow Monitoring Basin Schematic
Table 5-4. Monitoring Data Statistics
Interceptor Monitor Basin Area
(acres) Flow (mgd)
Average Minimum Maximum
NVI NVI-01A 1,795 0.86 0.32 1.55
NVI-01B 2,167 0.28 0.01 1.08
NVI-02A 584 0.15 0.05 0.29
NVI-02B 586 0.15 0.02 0.32
NVI-03A 1,009 0.17 0.02 0.75
NVI-03B 943 0.13 0.01 0.52
SVI SVI-01 4,652 0.95 0.30 1.87
SVI-02 2,895 1.31 0.39 2.50
SVI-03 3,527 0.58 0.05 1.27
SVI-04 4,942 2.26 0.85 3.77
SVI-05 1,368 0.44 0.14 0.85
NSI NSI-01A 1,302 0.27 0.10 2.05
NSI-01B 273 0.12 0.03 0.34
NSI-02 1,494 1.05 0.04 3.55
NSI-03 830 0.30 0.05 0.69
NSI-04 1,699 0.39 0.01 1.61
NSI-05 628 0.10 0.02 0.25
April 2015
2014 Comprehensive Wastewater Management Plan 5-6 Section 5 – Wastewater Collection System Analysis
5.2.3 Flow Loading
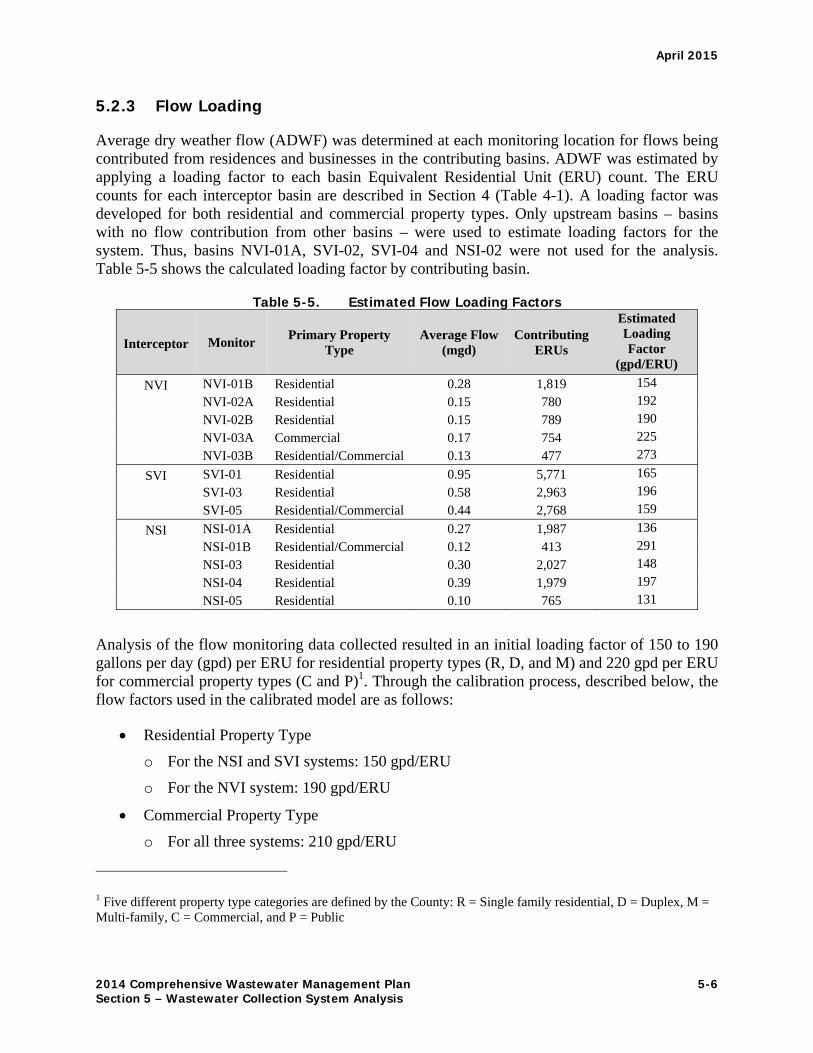
Average dry weather flow (ADWF) was determined at each monitoring location for flows being contributed from residences and businesses in the contributing basins. ADWF was estimated by applying a loading factor to each basin Equivalent Residential Unit (ERU) count. The ERU counts for each interceptor basin are described in Section 4 (Table 4-1). A loading factor was developed for both residential and commercial property types. Only upstream basins – basins with no flow contribution from other basins – were used to estimate loading factors for the system. Thus, basins NVI-01A, SVI-02, SVI-04 and NSI-02 were not used for the analysis. Table 5-5 shows the calculated loading factor by contributing basin.
Table 5-5. Estimated Flow Loading Factors
Interceptor Monitor Primary Property
Type Average Flow
(mgd) Contributing
ERUs
Estimated Loading Factor
(gpd/ERU)
NVI NVI-01B Residential 0.28 1,819 154
NVI-02A Residential 0.15 780 192
NVI-02B Residential 0.15 789 190
NVI-03A Commercial 0.17 754 225
NVI-03B Residential/Commercial 0.13 477 273
SVI SVI-01 Residential 0.95 5,771 165
SVI-03 Residential 0.58 2,963 196
SVI-05 Residential/Commercial 0.44 2,768 159
NSI NSI-01A Residential 0.27 1,987 136
NSI-01B Residential/Commercial 0.12 413 291
NSI-03 Residential 0.30 2,027 148
NSI-04 Residential 0.39 1,979 197
NSI-05 Residential 0.10 765 131
Analysis of the flow monitoring data collected resulted in an initial loading factor of 150 to 190 gallons per day (gpd) per ERU for residential property types (R, D, and M) and 220 gpd per ERU for commercial property types (C and P)1. Through the calibration process, described below, the flow factors used in the calibrated model are as follows:
Residential Property Type
o For the NSI and SVI systems: 150 gpd/ERU
o For the NVI system: 190 gpd/ERU
Commercial Property Type
o For all three systems: 210 gpd/ERU
1 Five different property type categories are defined by the County: R = Single family residential, D = Duplex, M = Multi-family, C = Commercial, and P = Public
April 2015
2014 Comprehensive Wastewater Management Plan 5-7 Section 5 – Wastewater Collection System Analysis
The calibrated residential flow factors for connected ERUs are less than the flow factor of 200 gpd per ERU defined for non-connected parcels described in Section 4. By using the lower, calibrated factors the hydraulic model results better match measured results for the calibration period.
5.2.4 Diurnal Patterns and Peaking Factors
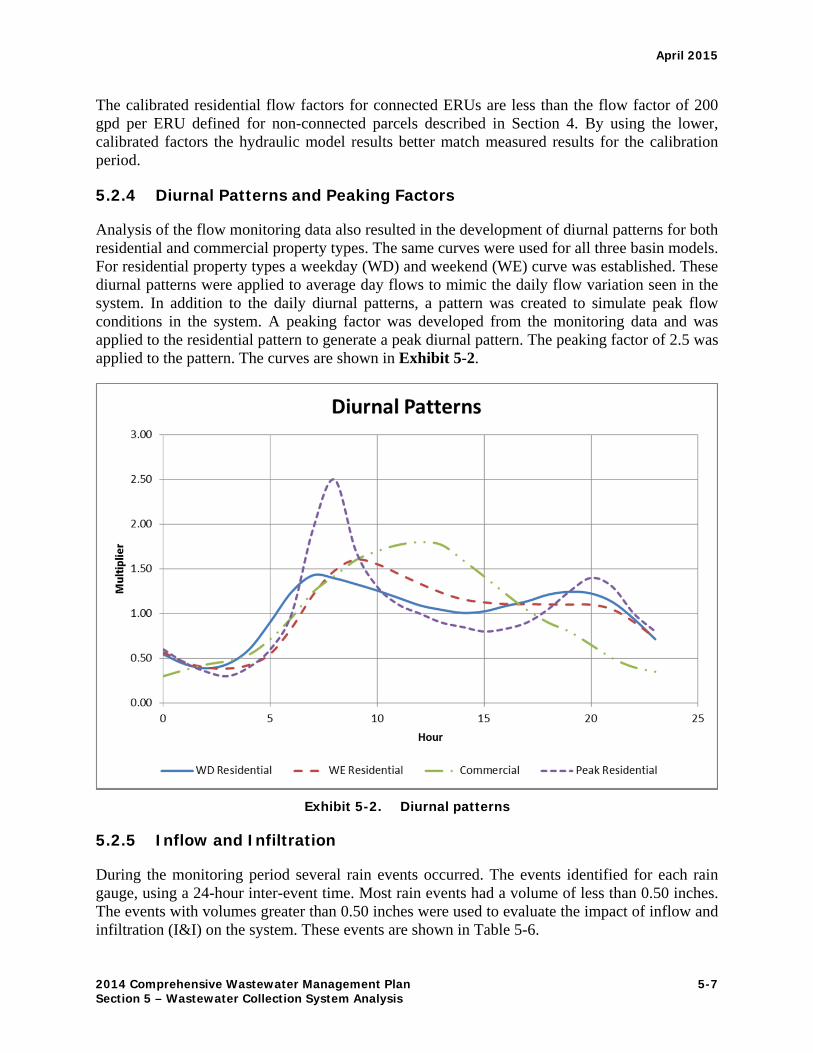
Analysis of the flow monitoring data also resulted in the development of diurnal patterns for both residential and commercial property types. The same curves were used for all three basin models. For residential property types a weekday (WD) and weekend (WE) curve was established. These diurnal patterns were applied to average day flows to mimic the daily flow variation seen in the system. In addition to the daily diurnal patterns, a pattern was created to simulate peak flow conditions in the system. A peaking factor was developed from the monitoring data and was applied to the residential pattern to generate a peak diurnal pattern. The peaking factor of 2.5 was applied to the pattern. The curves are shown in Exhibit 5-2.
Exhibit 5-2. Diurnal patterns
5.2.5 Inflow and Infiltration
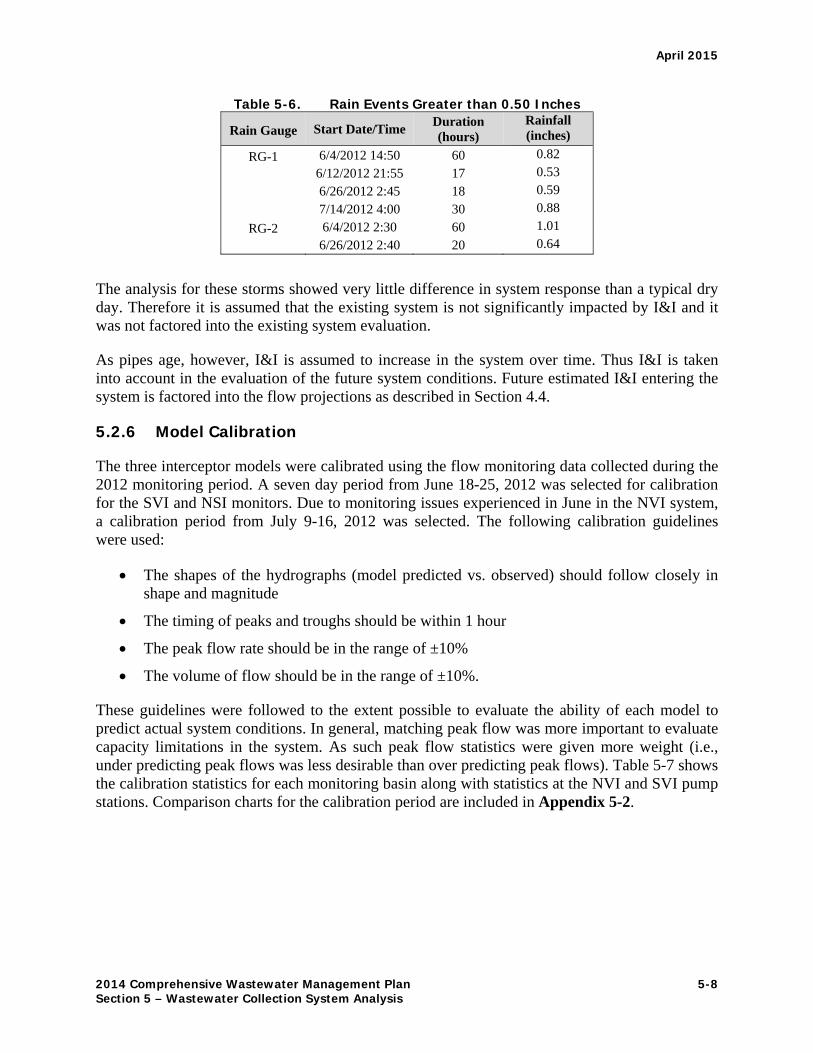
During the monitoring period several rain events occurred. The events identified for each rain gauge, using a 24-hour inter-event time. Most rain events had a volume of less than 0.50 inches. The events with volumes greater than 0.50 inches were used to evaluate the impact of inflow and infiltration (I&I) on the system. These events are shown in Table 5-6.
April 2015
2014 Comprehensive Wastewater Management Plan 5-8 Section 5 – Wastewater Collection System Analysis
Table 5-6. Rain Events Greater than 0.50 Inches
Rain Gauge Start Date/Time Duration (hours)
Rainfall (inches)
RG-1 6/4/2012 14:50 60 0.82
6/12/2012 21:55 17 0.53
6/26/2012 2:45 18 0.59
7/14/2012 4:00 30 0.88
RG-2 6/4/2012 2:30 60 1.01
6/26/2012 2:40 20 0.64
The analysis for these storms showed very little difference in system response than a typical dry day. Therefore it is assumed that the existing system is not significantly impacted by I&I and it was not factored into the existing system evaluation.
As pipes age, however, I&I is assumed to increase in the system over time. Thus I&I is taken into account in the evaluation of the future system conditions. Future estimated I&I entering the system is factored into the flow projections as described in Section 4.4.
5.2.6 Model Calibration
The three interceptor models were calibrated using the flow monitoring data collected during the 2012 monitoring period. A seven day period from June 18-25, 2012 was selected for calibration for the SVI and NSI monitors. Due to monitoring issues experienced in June in the NVI system, a calibration period from July 9-16, 2012 was selected. The following calibration guidelines were used:
The shapes of the hydrographs (model predicted vs. observed) should follow closely in shape and magnitude
The timing of peaks and troughs should be within 1 hour
The peak flow rate should be in the range of ±10%
The volume of flow should be in the range of ±10%.
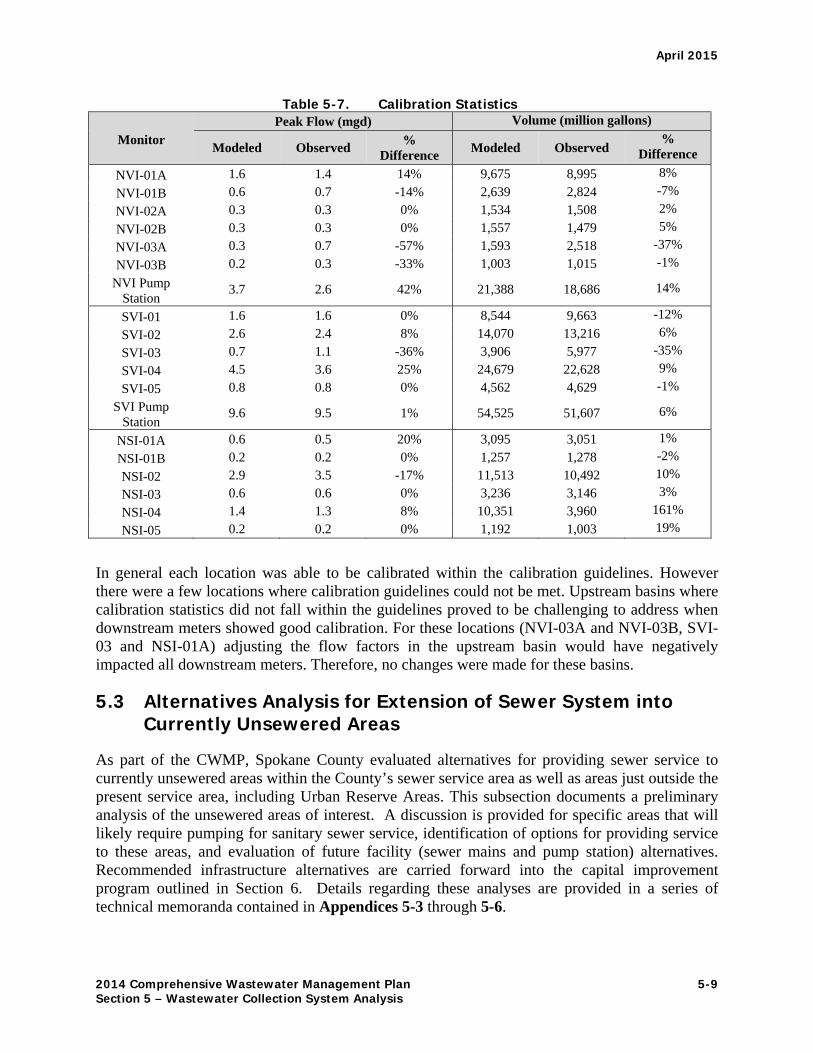
These guidelines were followed to the extent possible to evaluate the ability of each model to predict actual system conditions. In general, matching peak flow was more important to evaluate capacity limitations in the system. As such peak flow statistics were given more weight (i.e., under predicting peak flows was less desirable than over predicting peak flows). Table 5-7 shows the calibration statistics for each monitoring basin along with statistics at the NVI and SVI pump stations. Comparison charts for the calibration period are included in Appendix 5-2.
April 2015
2014 Comprehensive Wastewater Management Plan 5-9 Section 5 – Wastewater Collection System Analysis
Table 5-7. Calibration Statistics
Monitor Peak Flow (mgd) Volume (million gallons)
Modeled Observed %
Difference Modeled Observed
% Difference
NVI-01A 1.6 1.4 14% 9,675 8,995 8%
NVI-01B 0.6 0.7 -14% 2,639 2,824 -7%
NVI-02A 0.3 0.3 0% 1,534 1,508 2%
NVI-02B 0.3 0.3 0% 1,557 1,479 5%
NVI-03A 0.3 0.7 -57% 1,593 2,518 -37%
NVI-03B 0.2 0.3 -33% 1,003 1,015 -1%
NVI Pump Station
3.7 2.6 42% 21,388 18,686 14%
SVI-01 1.6 1.6 0% 8,544 9,663 -12%
SVI-02 2.6 2.4 8% 14,070 13,216 6%
SVI-03 0.7 1.1 -36% 3,906 5,977 -35%
SVI-04 4.5 3.6 25% 24,679 22,628 9%
SVI-05 0.8 0.8 0% 4,562 4,629 -1%
SVI Pump Station
9.6 9.5 1% 54,525 51,607 6%
NSI-01A 0.6 0.5 20% 3,095 3,051 1%
NSI-01B 0.2 0.2 0% 1,257 1,278 -2%
NSI-02 2.9 3.5 -17% 11,513 10,492 10%
NSI-03 0.6 0.6 0% 3,236 3,146 3%
NSI-04 1.4 1.3 8% 10,351 3,960 161%
NSI-05 0.2 0.2 0% 1,192 1,003 19%
In general each location was able to be calibrated within the calibration guidelines. However there were a few locations where calibration guidelines could not be met. Upstream basins where calibration statistics did not fall within the guidelines proved to be challenging to address when downstream meters showed good calibration. For these locations (NVI-03A and NVI-03B, SVI-03 and NSI-01A) adjusting the flow factors in the upstream basin would have negatively impacted all downstream meters. Therefore, no changes were made for these basins.
5.3 Alternatives Analysis for Extension of Sewer System into Currently Unsewered Areas
As part of the CWMP, Spokane County evaluated alternatives for providing sewer service to currently unsewered areas within the County’s sewer service area as well as areas just outside the present service area, including Urban Reserve Areas. This subsection documents a preliminary analysis of the unsewered areas of interest. A discussion is provided for specific areas that will likely require pumping for sanitary sewer service, identification of options for providing service to these areas, and evaluation of future facility (sewer mains and pump station) alternatives. Recommended infrastructure alternatives are carried forward into the capital improvement program outlined in Section 6. Details regarding these analyses are provided in a series of technical memoranda contained in Appendices 5-3 through 5-6.
April 2015
2014 Comprehensive Wastewater Management Plan 5-10 Section 5 – Wastewater Collection System Analysis
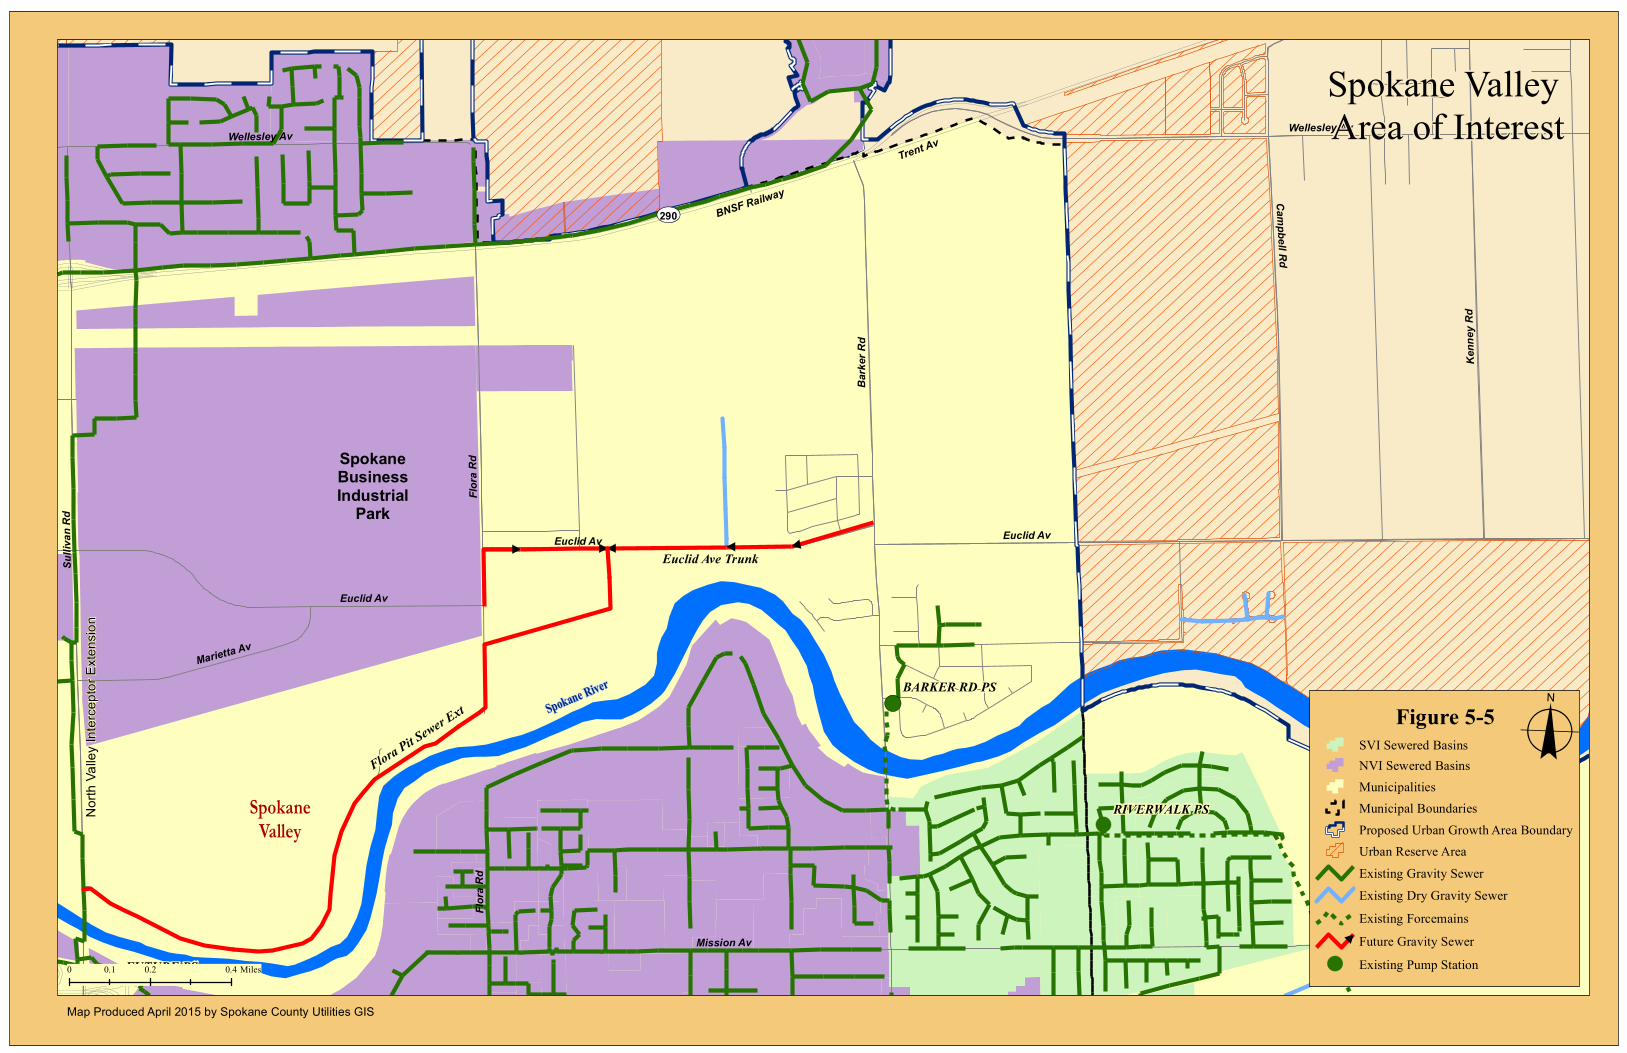
5.3.1 Spokane Valley Areas of Interest
In general, this area drains south from Trent Avenue to Euclid Avenue to the Spokane River, and east to west from Urban Growth Area (UGA) boundary to Flora Road (see Figure 5-5). Within this general area, there is a specific location that requires a pump station to be constructed to support provision of sanitary sewer service. This area will ultimately flow south across the Spokane River through future/proposed and existing infrastructure.
As part of the analysis in this area of interest, it was recommended that the Barker Road Pump Station be constructed. The proposed Barker Road Pump Station was constructed in 2014, and will ultimately pump sewer flows generated in the area bounded by the Spokane River, Euclid Avenue, and Campbell Road. The Barker Road Pump Station will convey sewer flows south across the Barker Road bridge to the existing Spokane County Riverwalk Pump Station. The Euclid Avenue Sewer Main is a recommended gravity sewer line that extends west from Barker Road to Flora Road. The Flora Road Pump Station was originally recommended to pump flow west to the existing NVI Extension. After further engineering analysis it was determined that a gravity solution is feasible in lieu of constructing a pump station, which was depicted in the Spokane Valley Alternatives Analysis (Technical Memorandum) provided in Appendix 5-3.
5.3.2 North Spokane Areas of Interest
Mead/Mt. Spokane
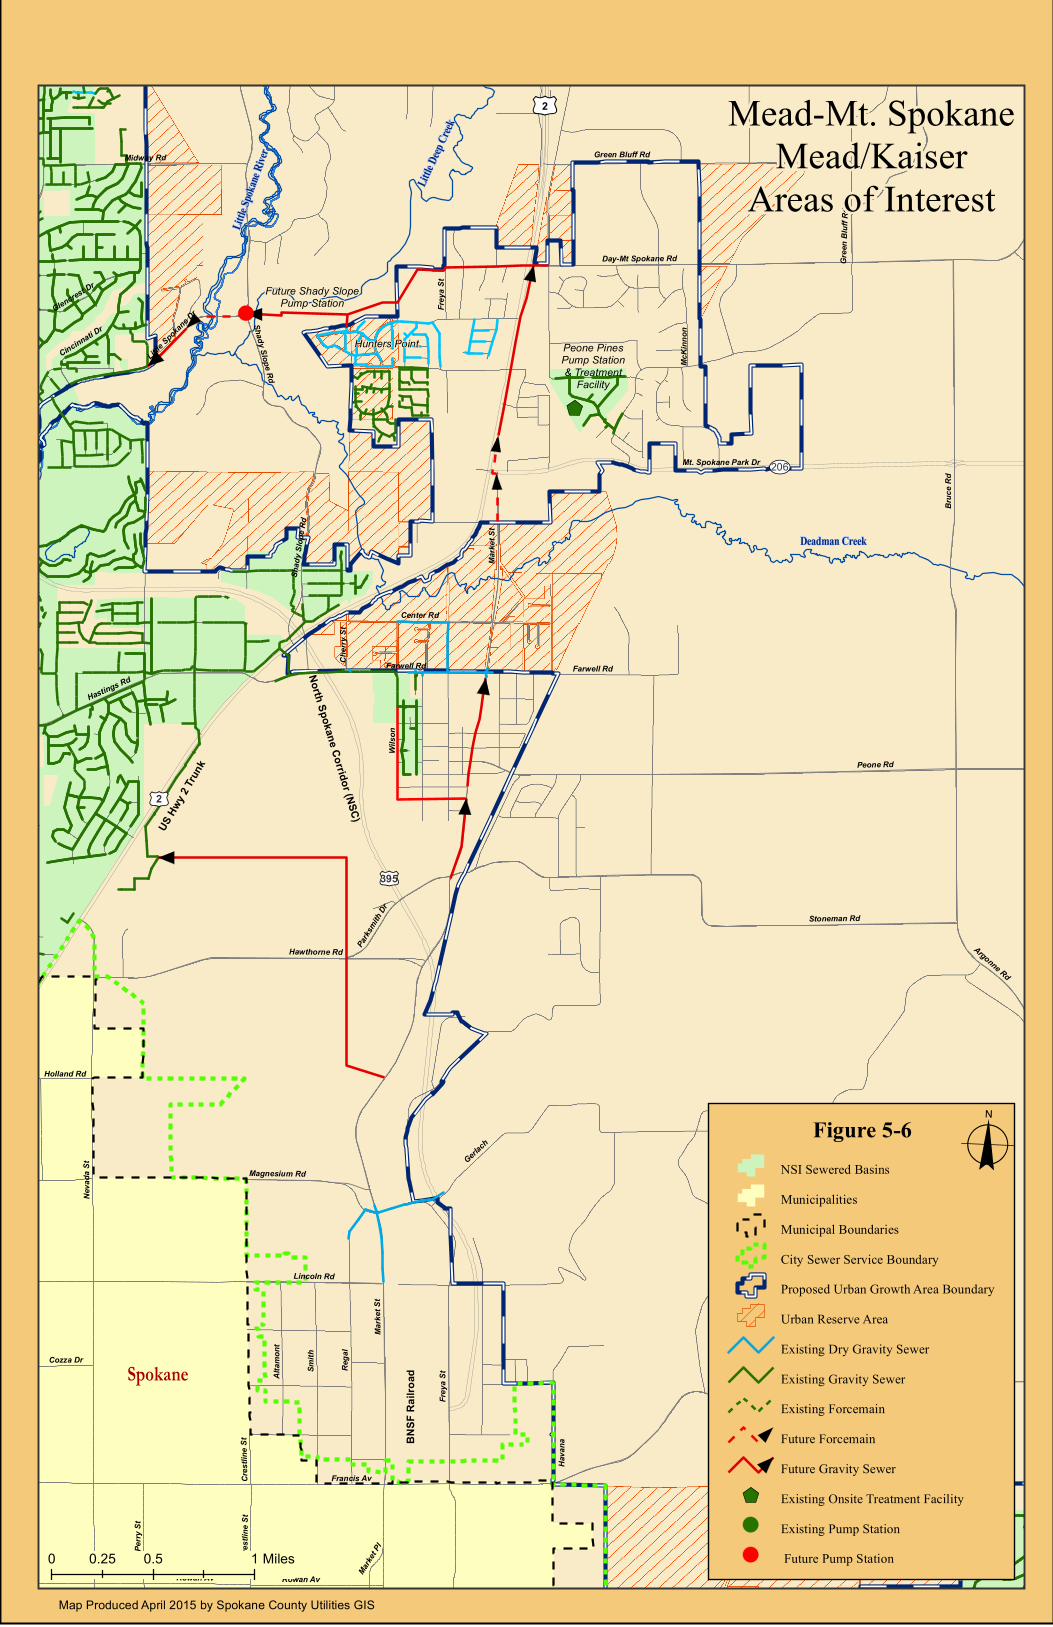
The Mead/Mt. Spokane sewer service area extends between Farwell Road and Green Bluff Road in the north/south direction and between the existing developments east of Little Spokane Drive across U.S. Highway 2, to McKinnon Road and includes Mt. Spokane High School on Mt. Spokane Park Drive in the east/west direction (see Figure 5-6). The existing terrain along U.S. Highway 2 has a high point north of Mt. Spokane Park Drive. Based on the existing terrain from this high point, flows would drain by gravity north towards Green Bluff Road and west from McKinnon Road across U.S. Highway 2 towards the Little Spokane Drive and Shady Slope Road intersection. The area south of the high point in U.S. Highway 2 drains south (based on existing topography) toward Mt. Spokane Park Drive, then continues to a low point in Market Street (Deadman Creek). The area north of Farwell Road between Market Street and US Hwy 2 drains to the north. The existing terrain would also drain future gravity sewers north from Farwell Road towards Deadman Creek. Due to the drainage patterns in the Mead/Mt Spokane Area, combinations of pump stations and possibly inverted siphons are necessary to serve this area.
There were generally three options that were analyzed for the Mead-Mt. Spokane Area. The options include the following:
Option #1 – Sewer flows north of Deadman Creek would be pumped or flow by gravity to Little Spokane Drive. Two new pump stations (possibly three) would be required for this option.
Option #2 – Sewer flows would be pumped or flow by gravity south to Center Road. Four new pump stations would be required.
April 2015
2014 Comprehensive Wastewater Management Plan 5-11 Section 5 – Wastewater Collection System Analysis
Option #3 – Sewer flows would flow by gravity from the high point in U.S. Highway 2 to the north and south and then pumped to either Little Spokane Drive or Center Road. Two new pump stations (possibly three) would be required for this option.
Option #1 is the recommended alternative as indicated in Appendix 5-4.
Three sewer service alternatives were identified for Center Road that includes the following:
Alternative #1 - Recommends a gravity sewer line installed in a trenchless casing pipe for the proposed gravity sewer line south of Center Road to Cherry Street.
Alterative #2 - This alternative includes a proposed siphon and gravity sewer line in Center Road.
Alternative #3 - This alternative proposes a pump station adjacent to Center Road.
Alternative #3 is recommended as indicated in Appendix 5-4.
Mead/Kaiser
The Mead/Kaiser Area extends south from Farwell Road to Francis Avenue and east from Nevada Street and Crestline Street to Market Street and Havana Street (see Figure 5-6). This area also includes Spokane County’s U.S. Highway 2 Sewer Trunk and the Havana/Lyons Study Area, just north of Francis Avenue. Based on topography this area generally drains south to north, with the exception of a relatively small area north of Francis Avenue and west of Havana Street and east of Crestline Street that drains south towards the City’s sewer service area. Spokane County and the City of Spokane are currently discussing revisions to their respective sewer service boundaries in this area. The remainder of the basin drains east from Crestline Street and Nevada Street toward Market Street and the North Spokane Corridor (NSC). Havana Street, located in the southeast portion of the Mead/Kaiser unsewered area, generally drains west towards Market Street and the NSC. The one exception is the Spokane Humane Society parcel which is recommended to drain south in Havana Street to an existing City gravity sewer south of Francis Avenue.
The drainage areas recommending future improvements include the following:
Southeast Drainage Basin
Southwest Drainage Basin
Middle Drainage Basin
Northeast Drainage Basin.
The Southeast Drainage Basin encompasses the area north of Francis Avenue to Gerlach Road and west of Havana Street to the BNSF Railroad west right-of-way. It is recommended that a sewer line be constructed from this drainage basin and extend north. The Southwest Drainage Basin encompasses the area north of Francis Avenue to Magnesium Road and east from Crestline Street to the BNSF Railroad right-of-way. Recommendations include constructing gravity sewer lines in the north/south streets (Altamont, Smith, Regal, Market) extending north.
April 2015
2014 Comprehensive Wastewater Management Plan 5-12 Section 5 – Wastewater Collection System Analysis
The Middle Drainage Basin encompasses all the area north from Magnesium Road to Hawthorne Road and from Nevada Street east to Market Street and the NSC. Constructing gravity sewers north to the U.S. Highway 2 Sewer Trunk is recommended. The Northeast Drainage Basin encompasses the area west of the BNSF railroad, south of Farwell Road, east of Wilson Street, and north of Stoneman Road. Constructing Sewers north to the existing Farwell Road sewer main is recommended. Further detail regarding the analysis that led to these recommendations is provided in Appendix 5-5.
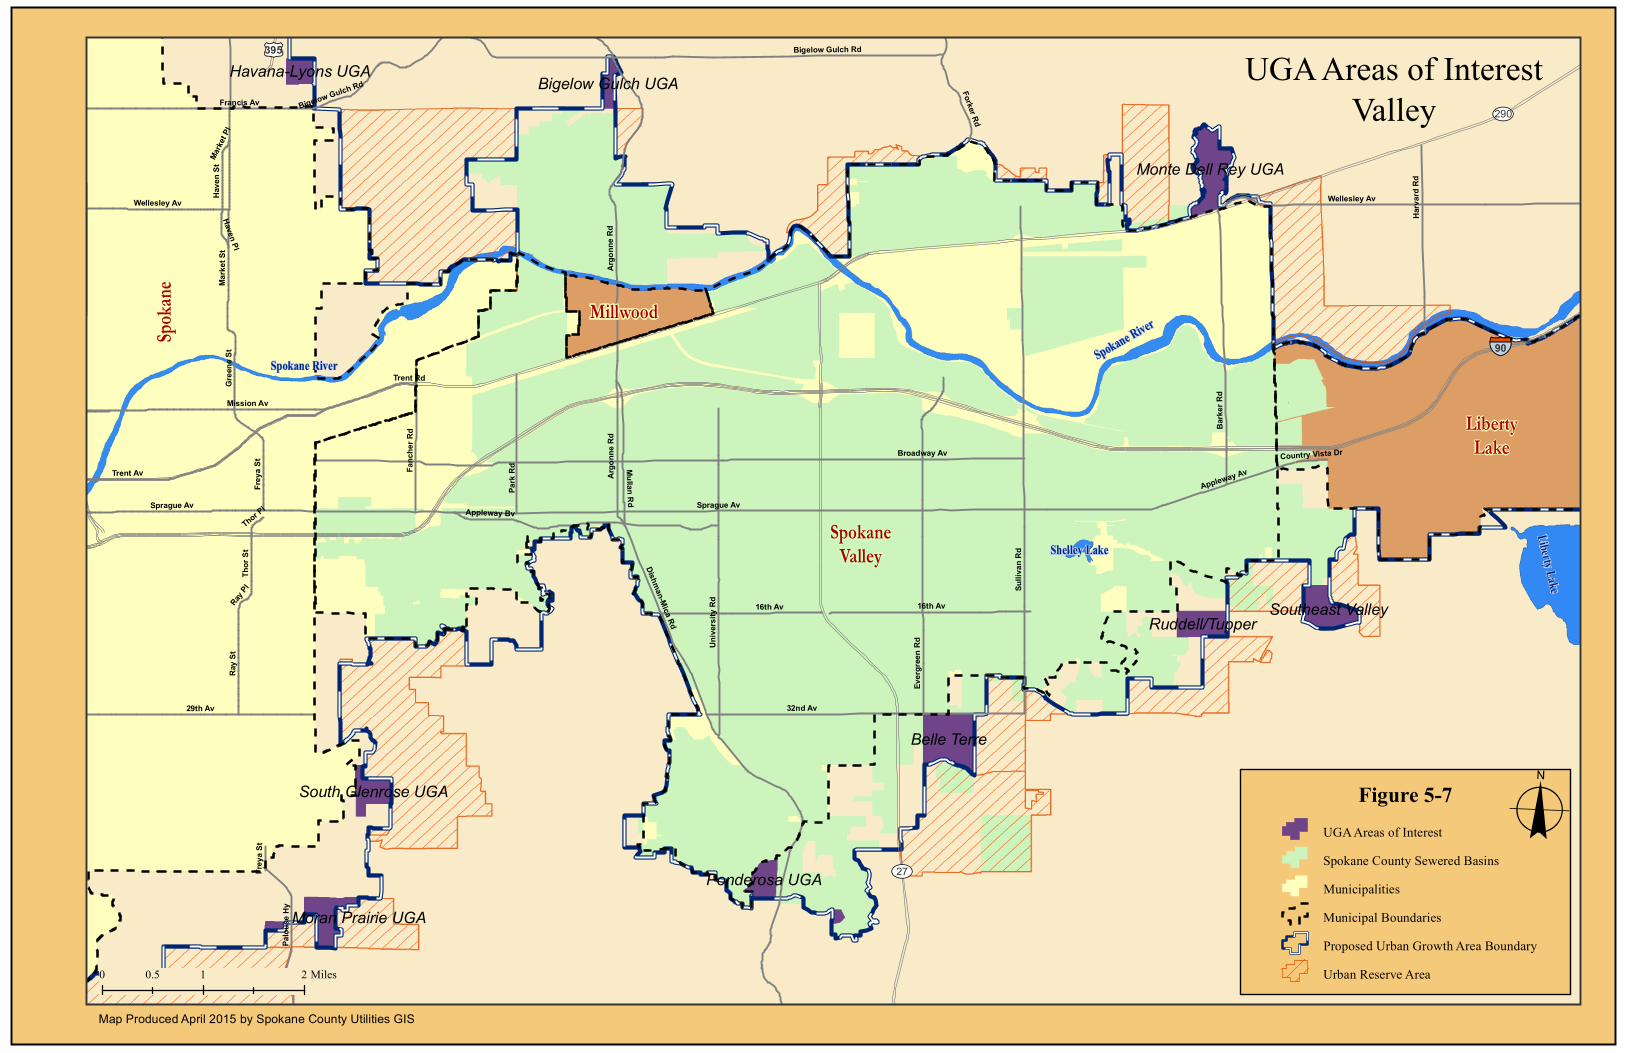
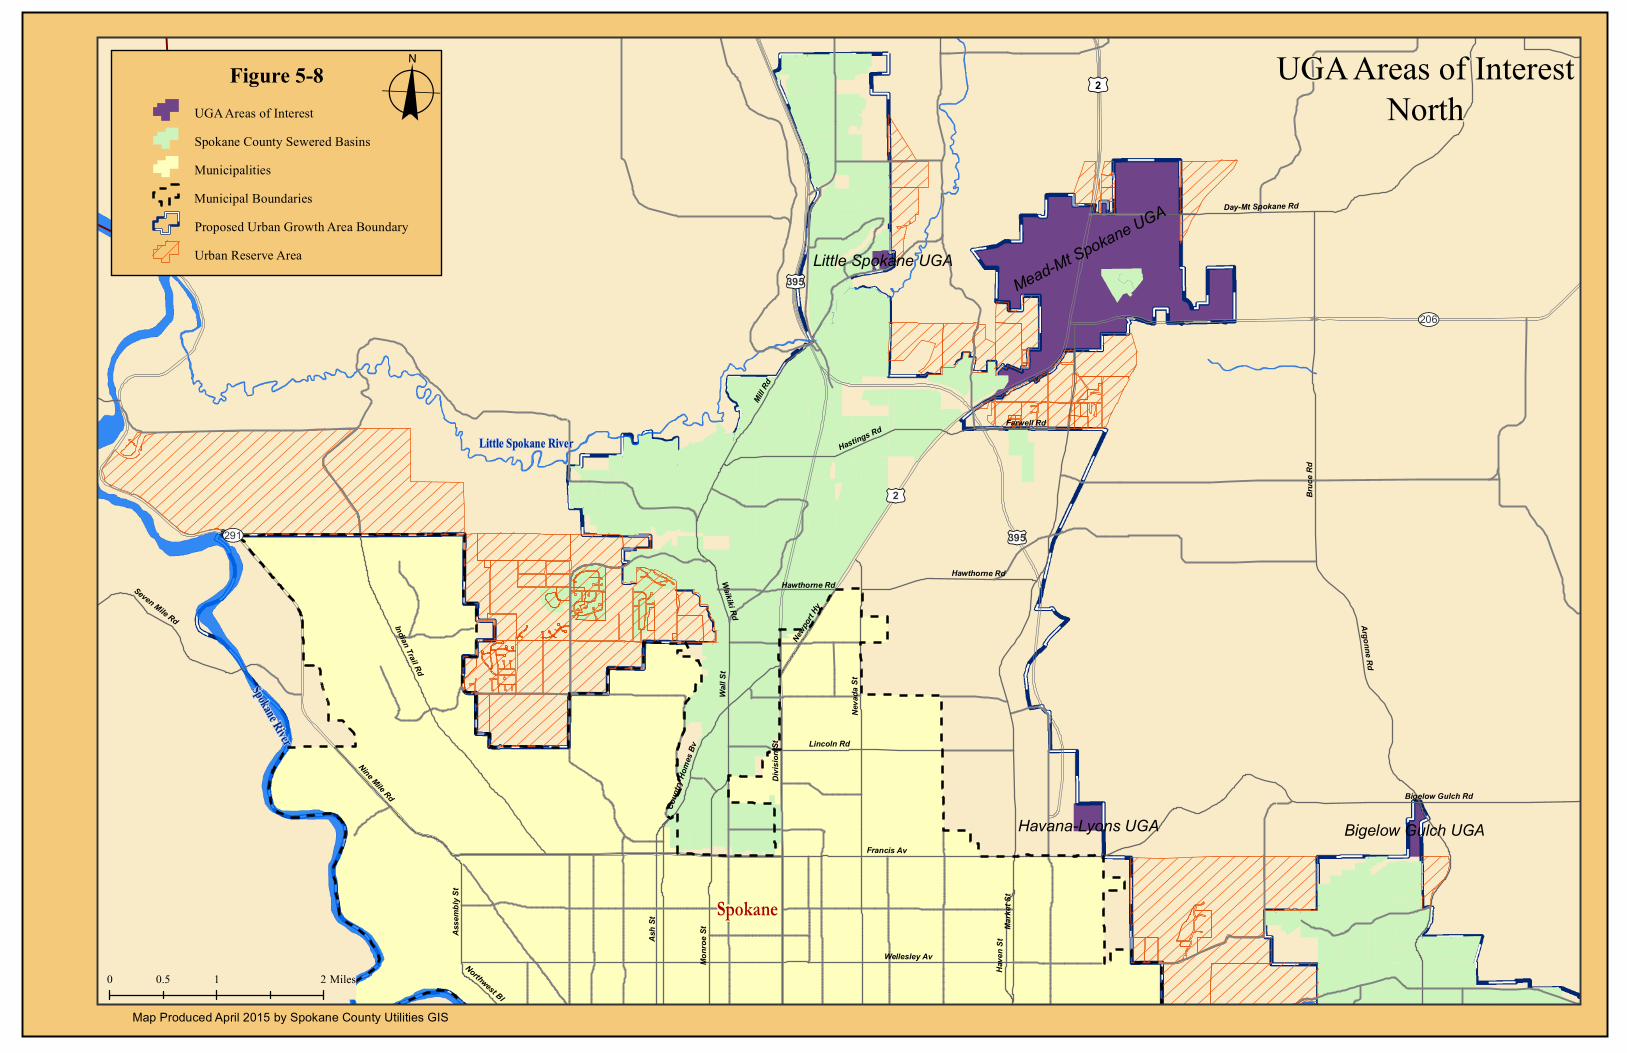
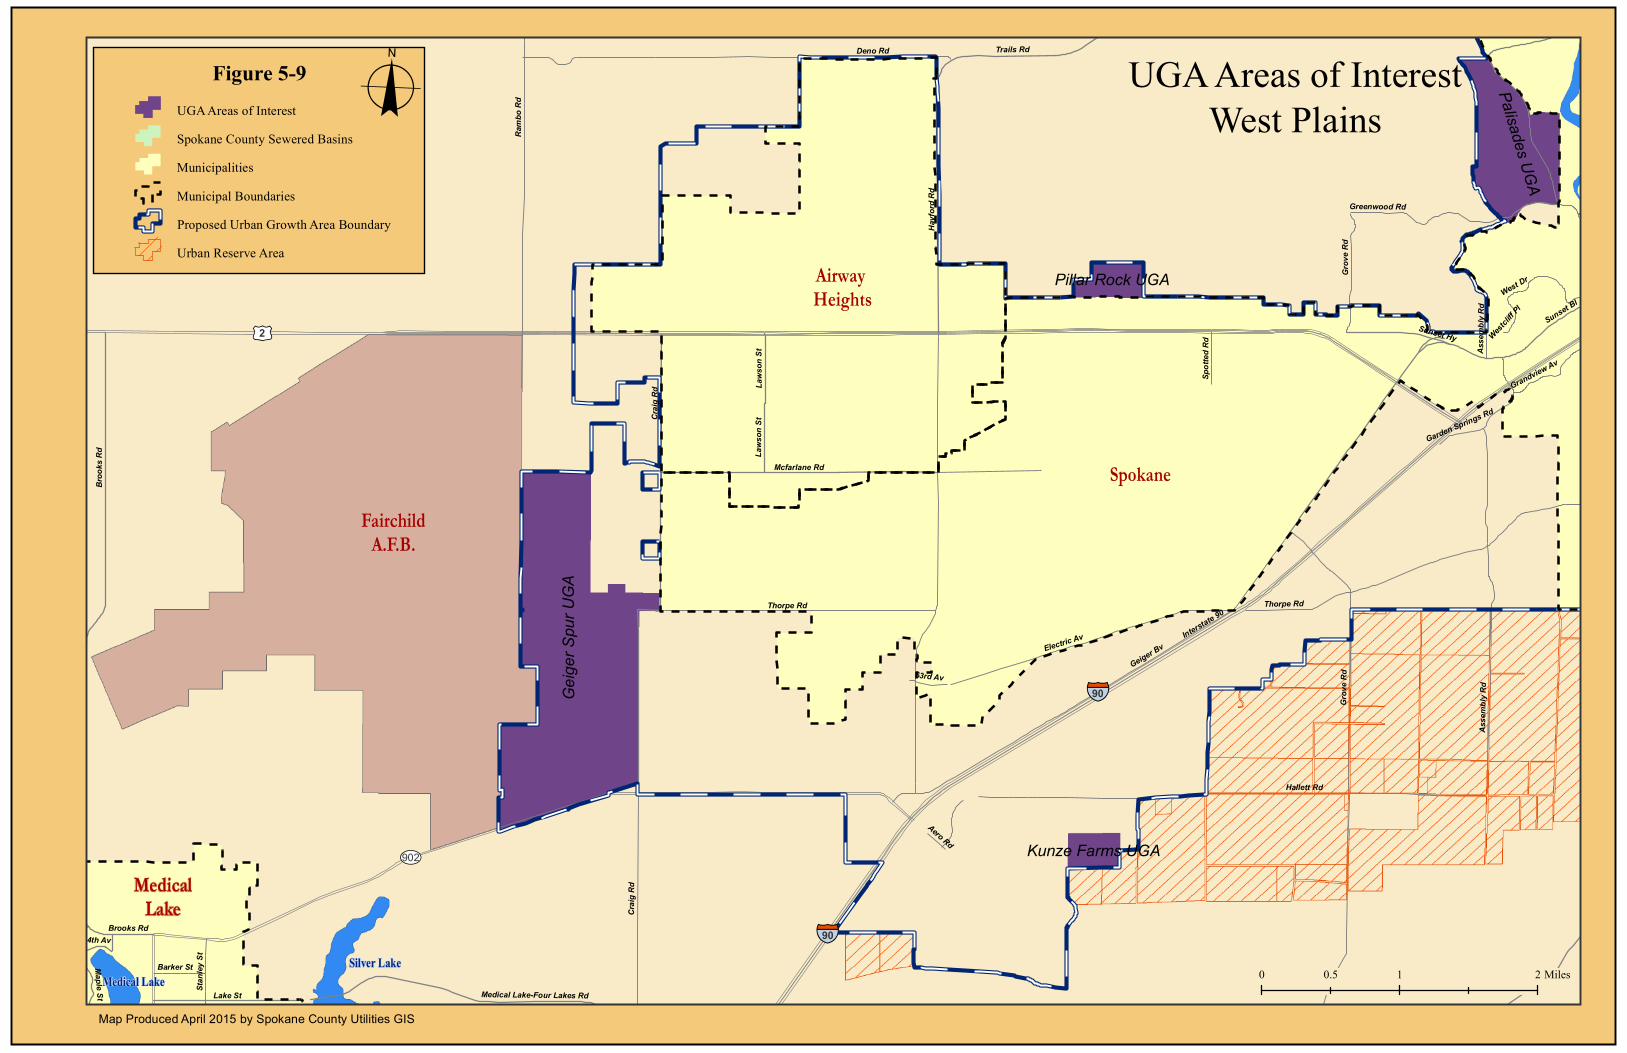
5.3.3 Urban Growth Area Update Areas of Interest
The Board of County Commissioners (BOCC) proposed a new UGA on July 18, 2013. As described in detail in Section 2, the Growth Management Hearings Board concluded that Spokane County needed to comply with public participation requirements when enacted a new growth target of 121,112, together with associated changes in the UGA boundary and zoning. The Growth Management Hearings Board required Spokane County to take further actions to come into compliance with the Growth Management Act. The BOCC held a Public Hearing on June 3, 2014, regarding the proposed revisions to the Spokane County Urban Growth Area Boundary including concurrent Comprehensive Plan map and Zoning Map amendments.
The proposed UGA establishes a boundary around developing areas, with areas outside the boundary intended for rural land use and areas inside the boundary intended for urban land use. The BOCC decision expands the UGA in some areas and reduces it in other areas. The BOCC decision also included consideration of environmental studies, collaboration with other jurisdictions and years of public input.
Fifteen areas of interest depicted on Figures 5-7, 5-8, and 5-9 were analyzed and are zoned as low density residential, mineral lands, light industrial, community commercial, rural-5, and rural traditional. The areas range in size and location with some located in the West Plains, North Spokane, and Spokane Valley. Pump stations and associated piping are recommended as a part of providing sewer service to the new areas included in the UGA. Construction of new gravity sewer mains to connect to existing facilities is recommended for the remainder of the areas. Further detail regarding the analysis that led to these recommendations is provided in Appendix 5-6. Note that the Mead-Mt. Spokane area is included as one of the fifteen areas within the proposed UGA. Recommendations are provided for this specific area in Section 5.3.2. If the new areas of interest are ultimately not included as part of a UGA expansion as proposed by the BOCC, sewer service will not be extended to these areas. Therefore, new pump stations, force mains and gravity sewer piping will not be recommended for those areas of interest residing outside the UGA.
5.4 Summary of Identified Deficiencies and Improvements
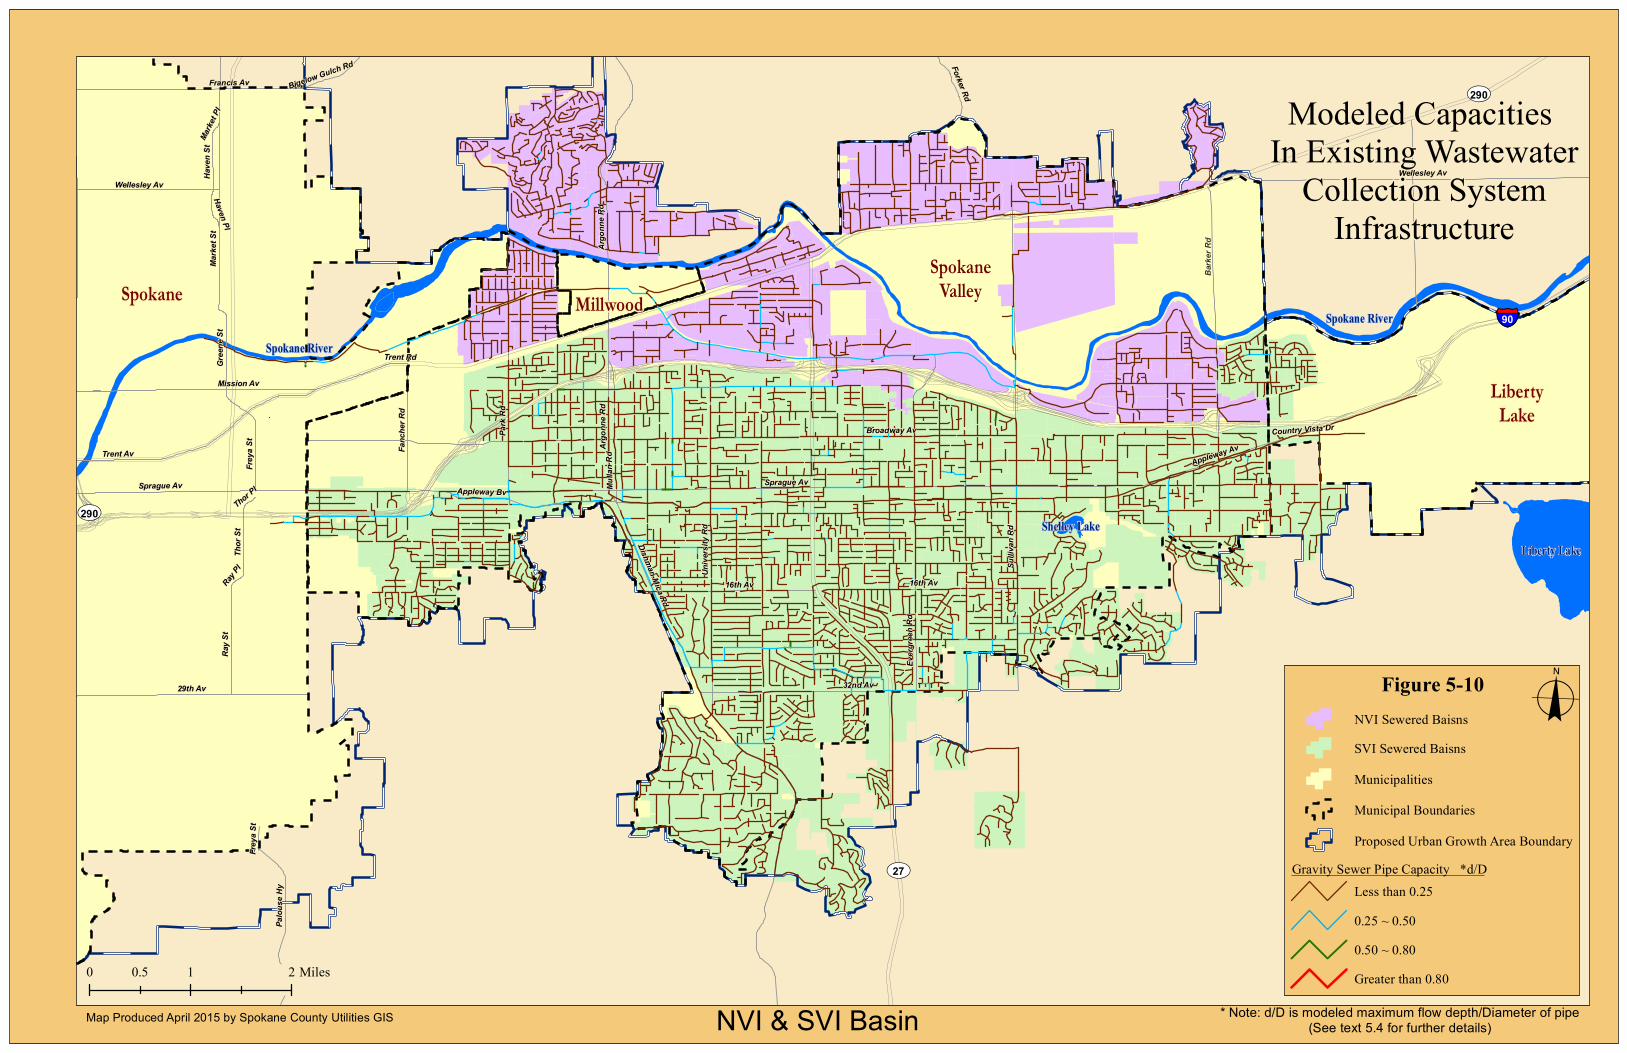
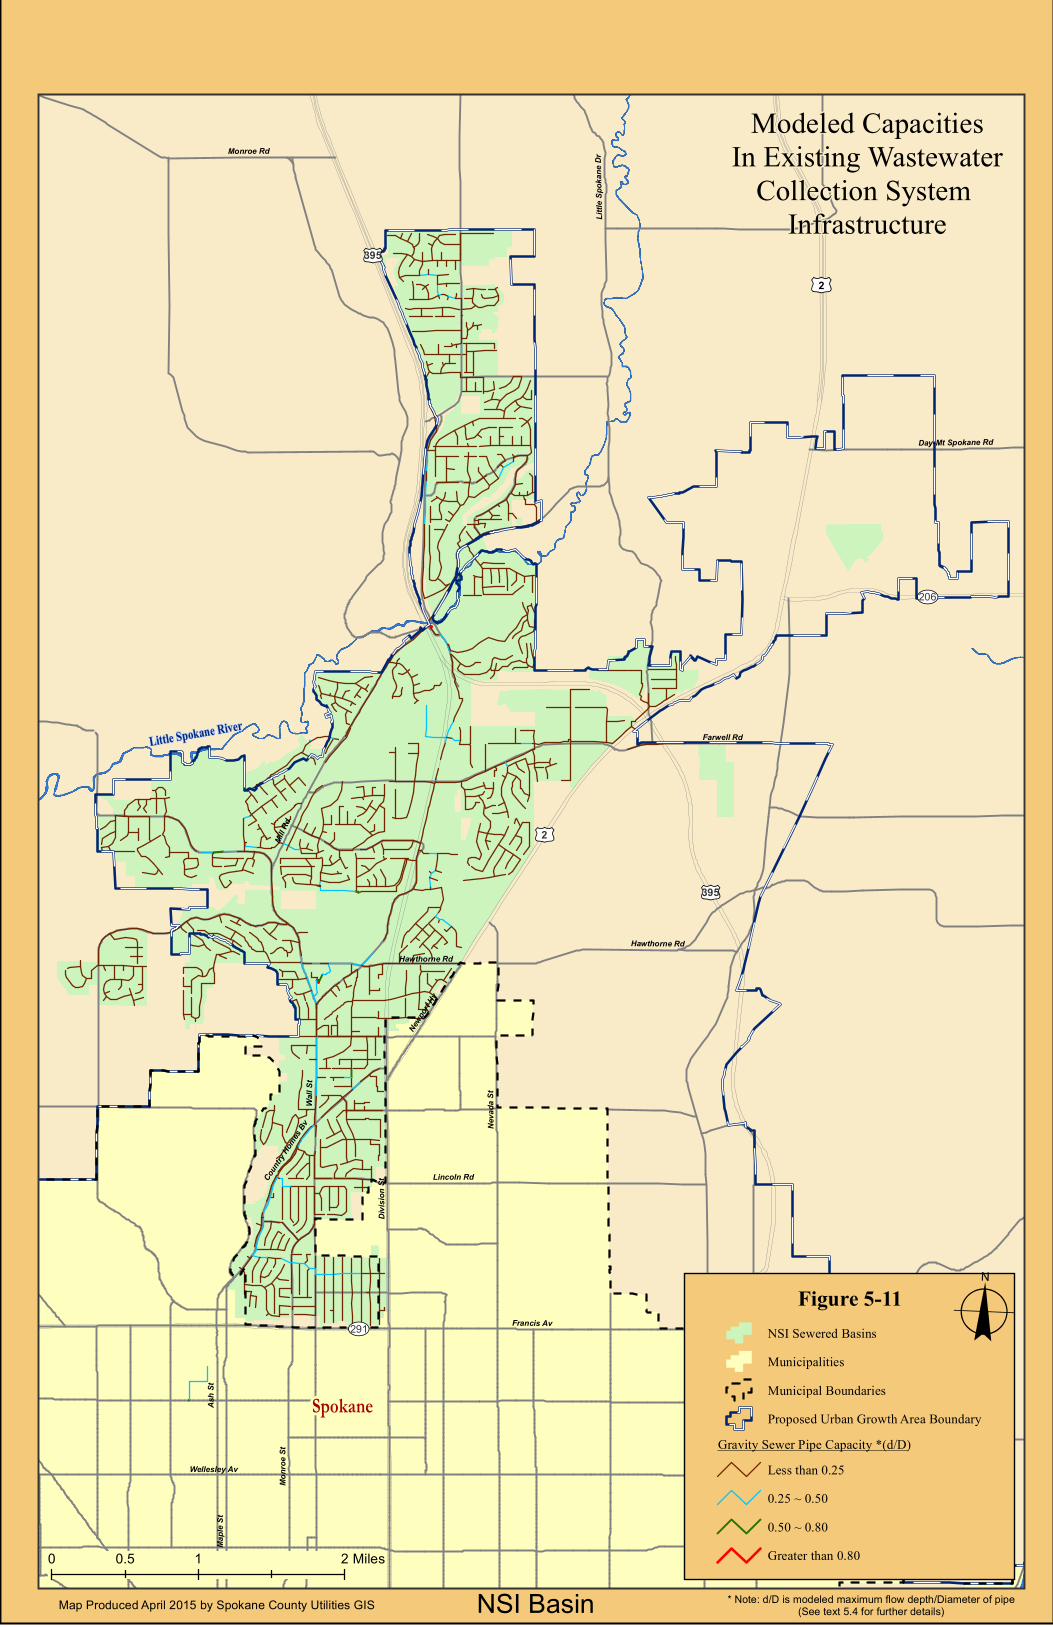
The following sections summarize the results of the hydraulic modeling performed for the existing, 6-year, 20-year, and buildout conditions for the NSI, NVI and SVI systems. For the purposes of analysis, the high-flow projections described in Section 4 were used. Pipe capacity issues have been identified by using a maximum depth over diameter (d/D) criterion of 0.8. That is, if the pipe was more than 80% full at maximum depth then the pipe was identified as having limited capacity. Pump station limitations were also identified. In the model pump stations that
April 2015
2014 Comprehensive Wastewater Management Plan 5-13 Section 5 – Wastewater Collection System Analysis
caused backwater effects upstream of the pump station were identified as having limited capacity. Specific recommended solutions to address each identified capacity limited area are defined in Section 6, with the exception of select areas where localized development (and the related increase in flow) is unlikely to occur at the rate reflected in the broad, system-wide flow projections. As described in the subsections that follow, in such cases the County will continue to track development and flows in these areas and revisit the hydraulic models periodically to determine with more certainty when improvements may be needed.
5.4.1 Existing Flow Analysis
For all three interceptor systems no capacity limitations were identified for either pipelines or pump stations, under current flows. The model was run using flow generated by the number of ERUs in each interceptor network. Model results for the three systems are shown in Figures 5-10 and 5-11.
5.4.2 Future Flow Analysis
Three different future flow scenarios were evaluated for each interceptor system: 6-year, 20-year and buildout. Each flow scenario was evaluated assuming the existing pipe network (i.e., no new pipes were added to the model). The goal of this analysis is to identify where capacity limitations might occur within the existing system in the future as well as the timing of those limitations. The higher system flow projections described in Section 4.3 were distributed in the model for analysis. The loading based on existing ERUs was maintained, and future loadings were added based on land use characteristics and the planning flow loading factors described in Section 4.1. Diurnal patterns described in Section 5.2.4 were applied to residential and commercial flows.
North Valley Interceptor
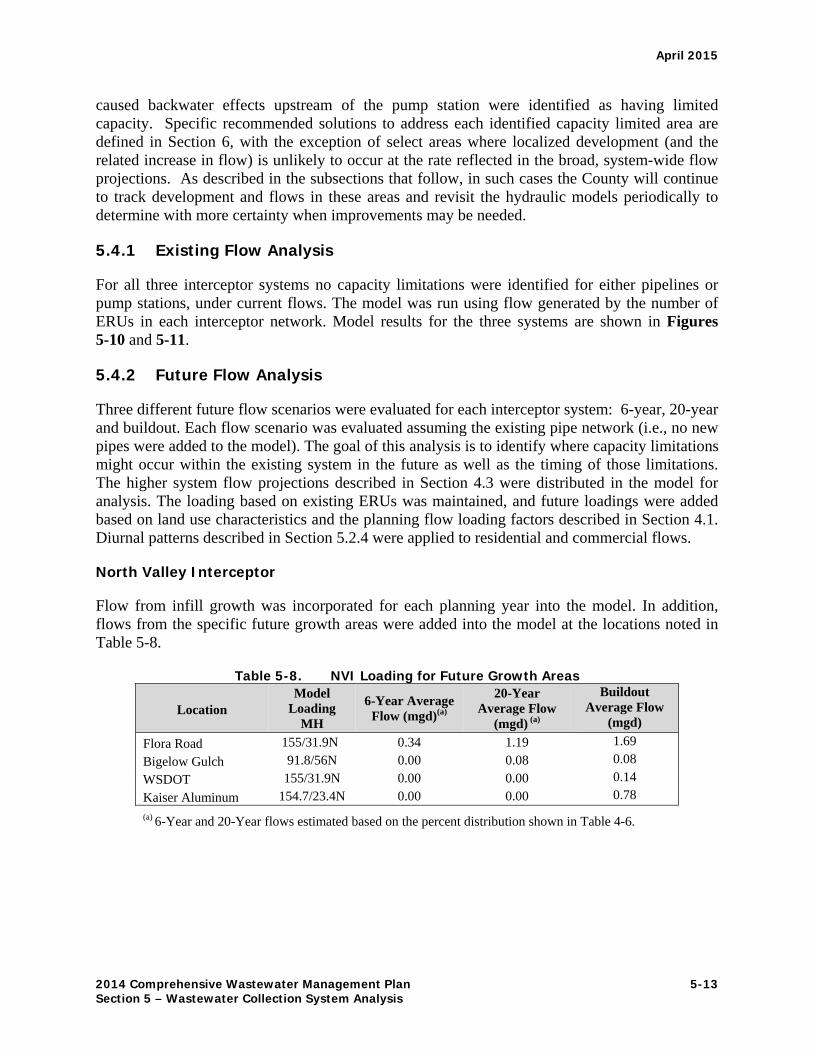
Flow from infill growth was incorporated for each planning year into the model. In addition, flows from the specific future growth areas were added into the model at the locations noted in Table 5-8.
Table 5-8. NVI Loading for Future Growth Areas
Location Model
Loading MH
6-Year Average Flow (mgd)(a)
20-Year Average Flow
(mgd) (a)
Buildout Average Flow
(mgd)
Flora Road 155/31.9N 0.34 1.19 1.69
Bigelow Gulch 91.8/56N 0.00 0.08 0.08
WSDOT 155/31.9N 0.00 0.00 0.14
Kaiser Aluminum 154.7/23.4N 0.00 0.00 0.78
(a) 6-Year and 20-Year flows estimated based on the percent distribution shown in Table 4-6.
April 2015
2014 Comprehensive Wastewater Management Plan 5-14 Section 5 – Wastewater Collection System Analysis
Results from the hydraulic model analysis are shown in the following figures:
Figure 5-12: 6-year planning horizon
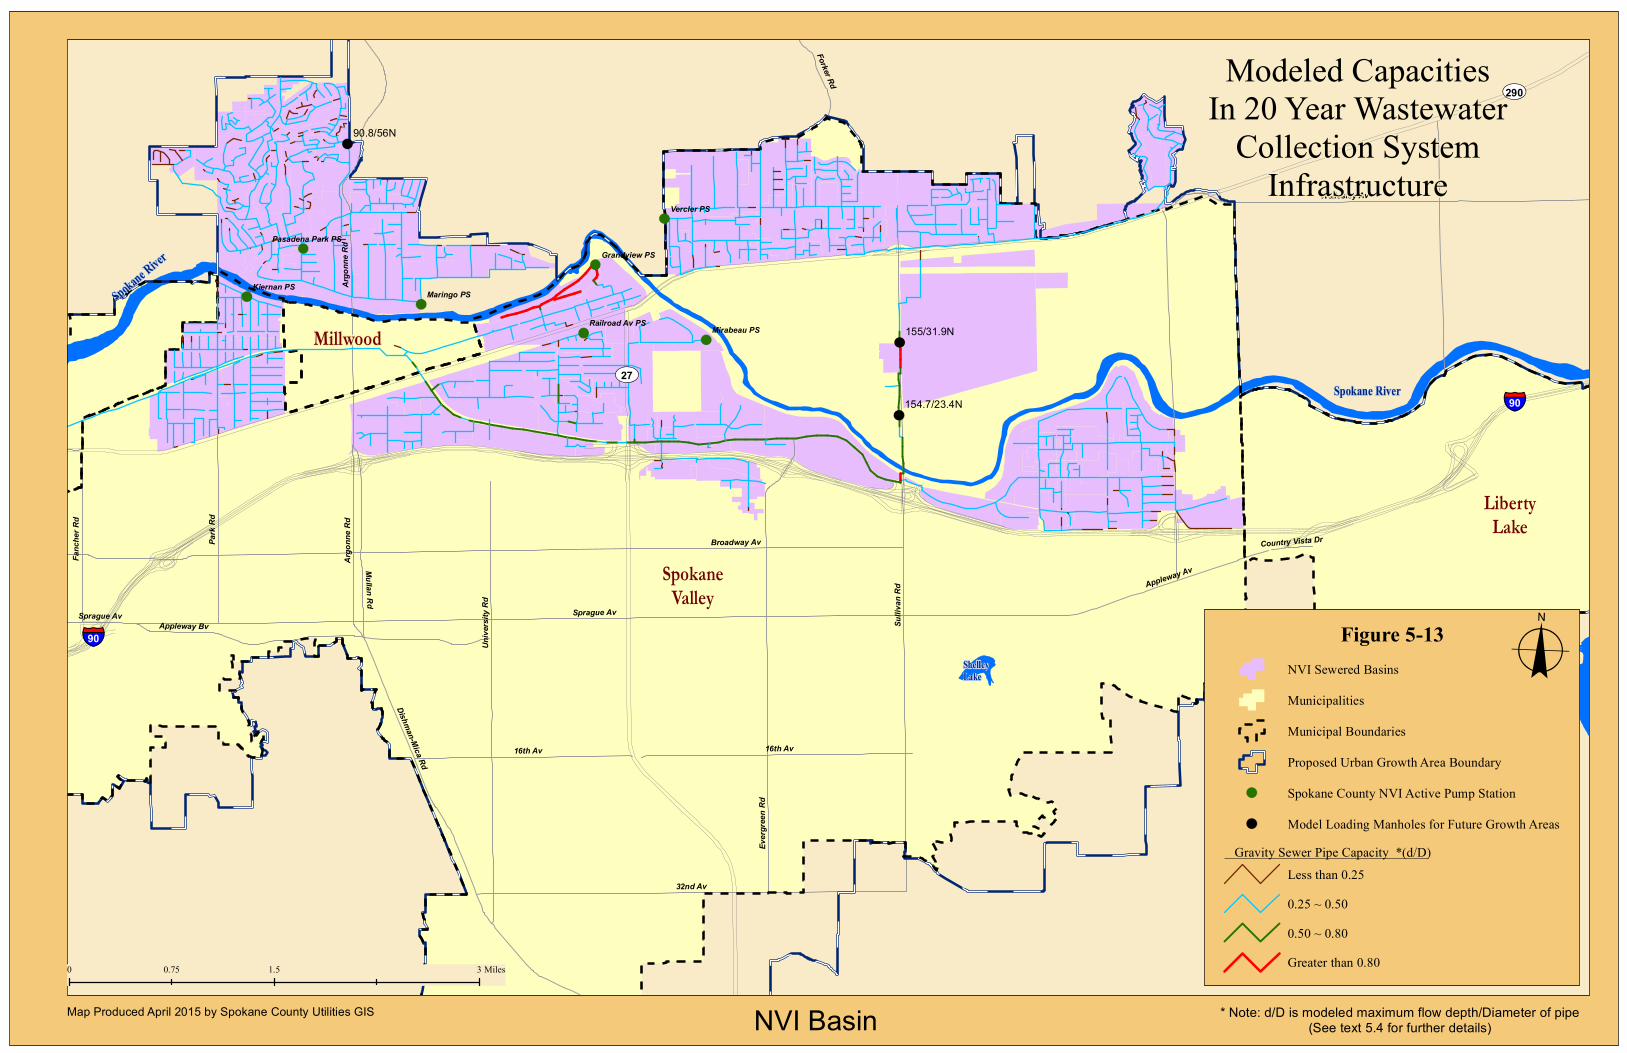
Figure 5-13: 20-year planning horizon
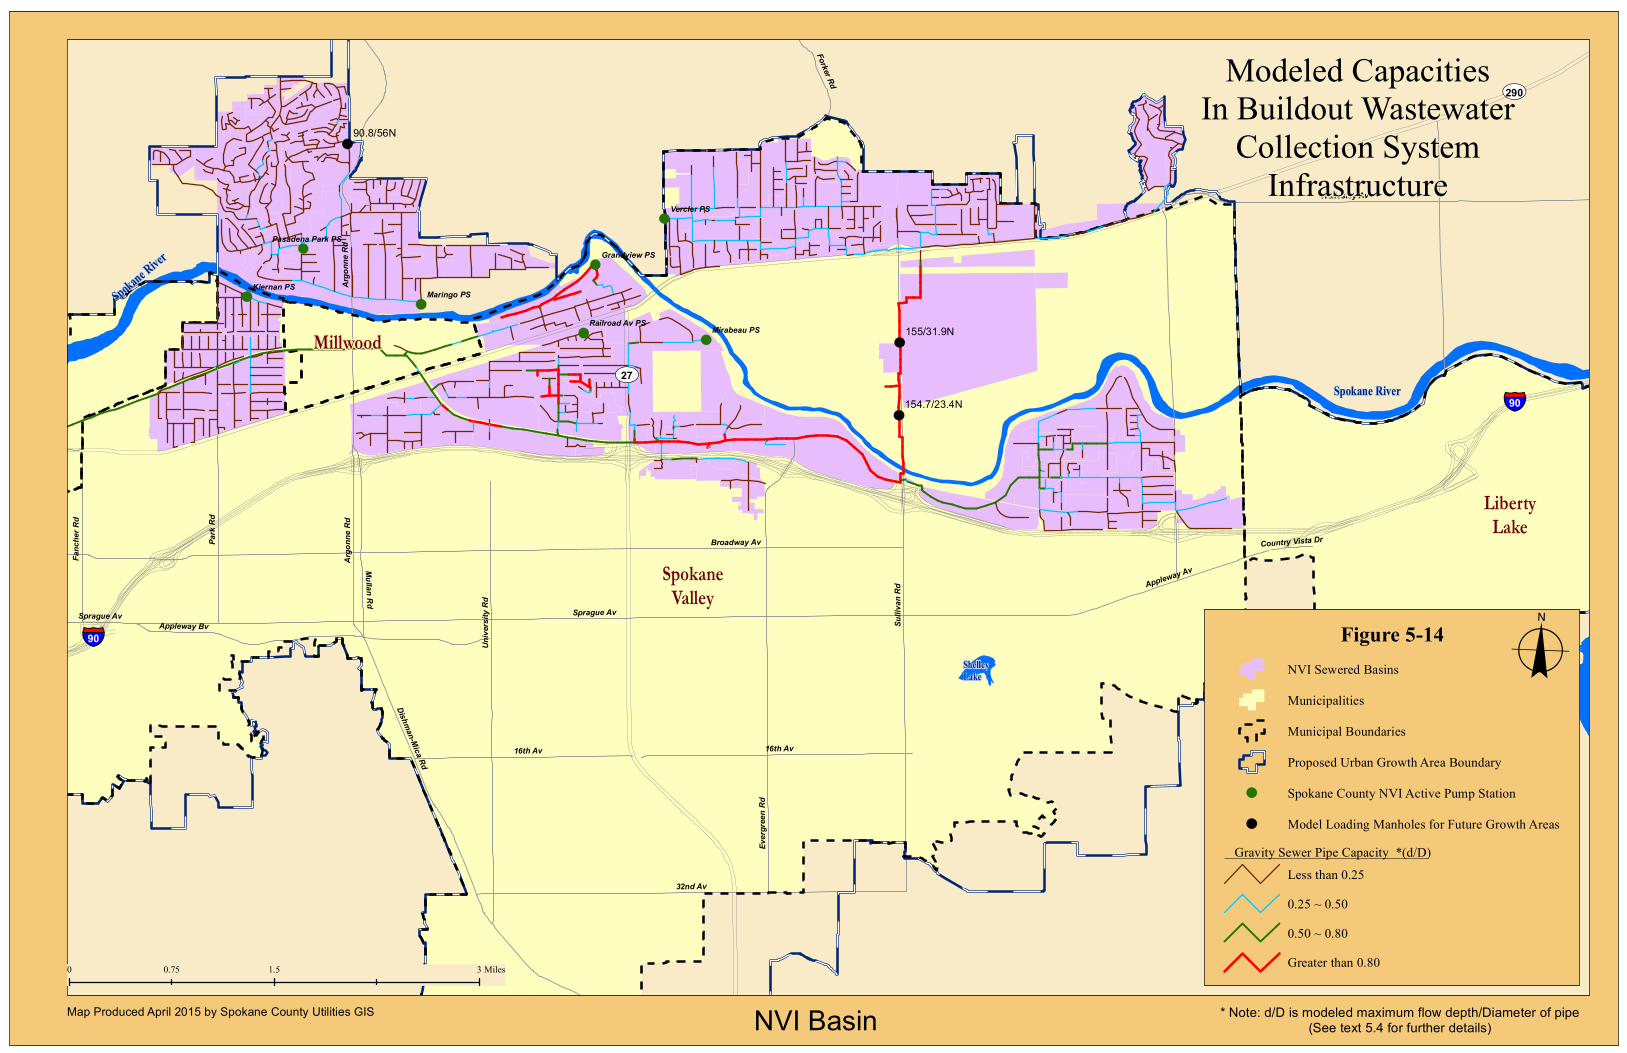
Figure 5-14: Buildout planning horizon.
Analysis shows that capacity limitations begin to appear in the NVI interceptor system in the 20-year planning period in and around the Spokane Business and Industrial Park (SBIP). Capacity-limited pipes are projected to cause backwater effects to upstream locations and the maximum Hydraulic Grade Line (HGL) approaches the crown of the pipe. In particular, capacity is limited by sections of 15-inch diameter pipe along N. Sullivan Road. As the County conducts pre-design analysis regarding the Flora Pit Sewer Extension, the potential future capacity limitations in this pipe will be further analyzed. It is possible that a portion of the flows modeled to be conveyed to this point by the Flora Pit Sewer Extension may instead be routed to the Vercler Pump Station, which would thereby reduce the total future flow in this pipe and alleviate the capacity concern. As such options have yet to be explored in detail by the County, no specific capacity related improvements have been identified at this time for this segment of pipe.
In addition to the capacity limitations in the SBIP area, the Grandview Pump Station shows signs of being under capacity in the 20-year horizon. The lack of currently installed pumping capacity at this location is projected to cause backwater effects upstream. This pump station was constructed to allow for future upsizing if needed. As such, the County will continue to evaluate its performance as growth continues in this area, to determine more precisely when capacity upgrades may be needed. As this is not expected to occur for quite some time, no specific improvements related to this facility are included in the capital improvement program (CIP) described in Section 6.
In the buildout scenario, the problem areas described above continue to have capacity limitations. Capacity constraints also emerge in the pipeline along N Bowdish Road between E Grace Avenue and E Jackson Avenue, and along the NVI itself between E Montgomery Drive and N University Road, and from N Pines Road to the SBIP area at N Sullivan Road.
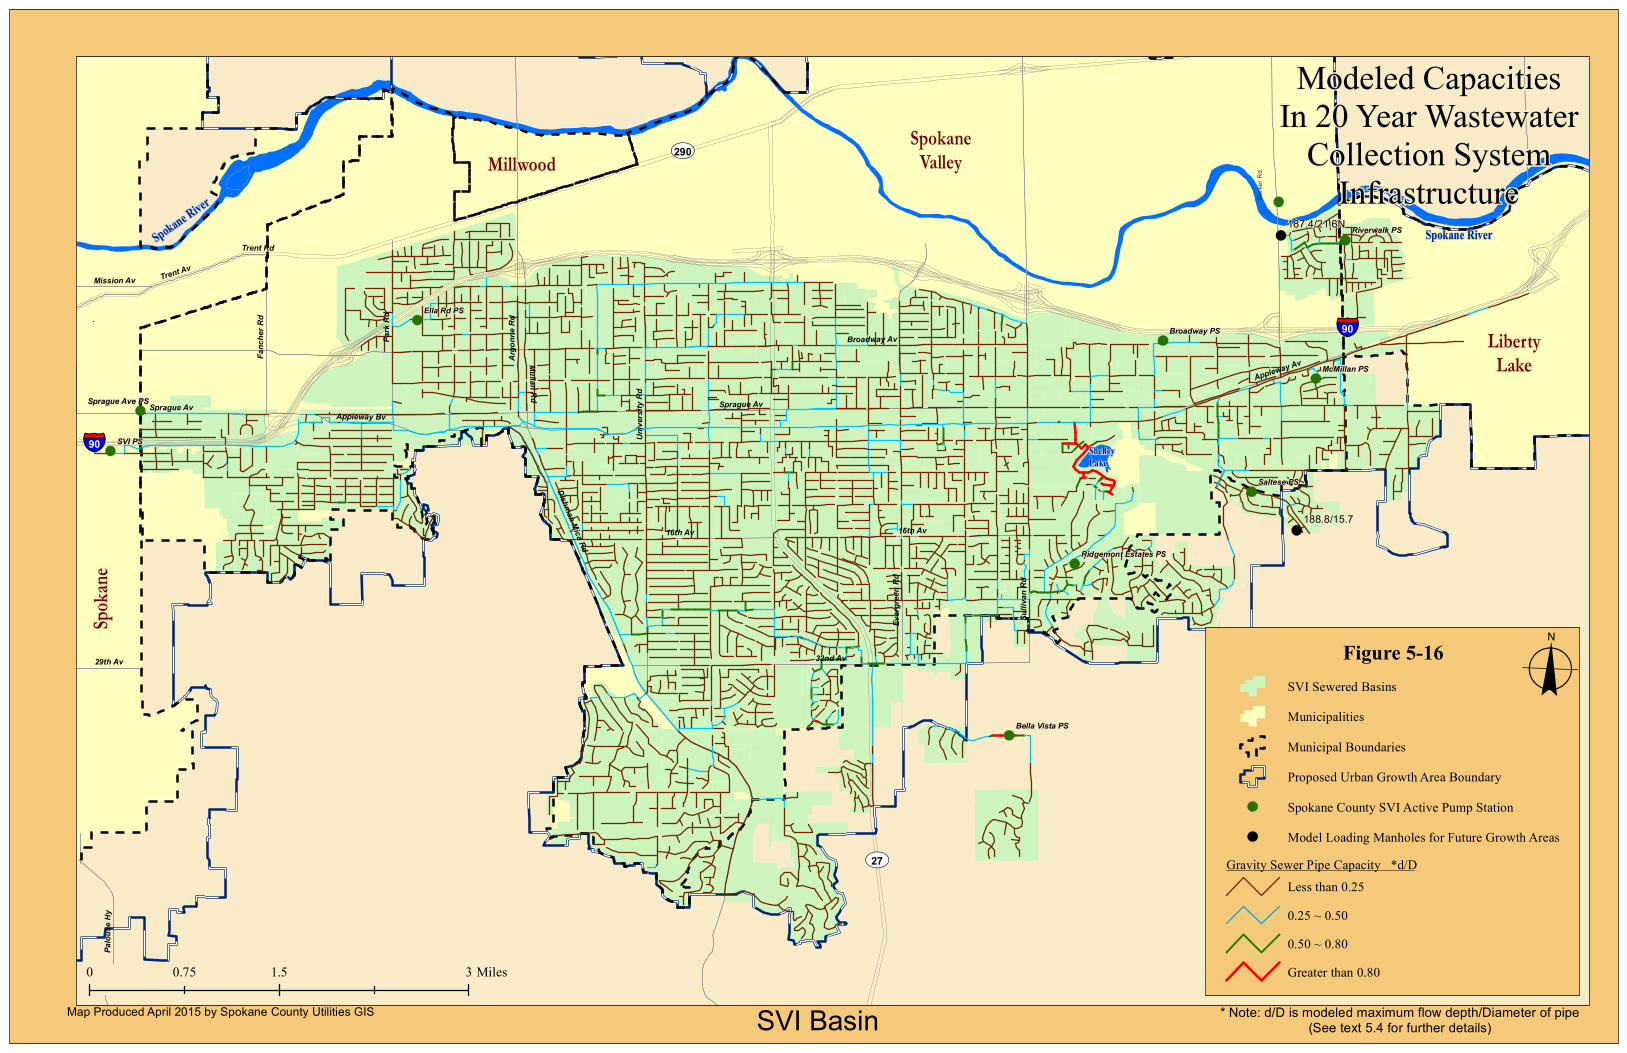
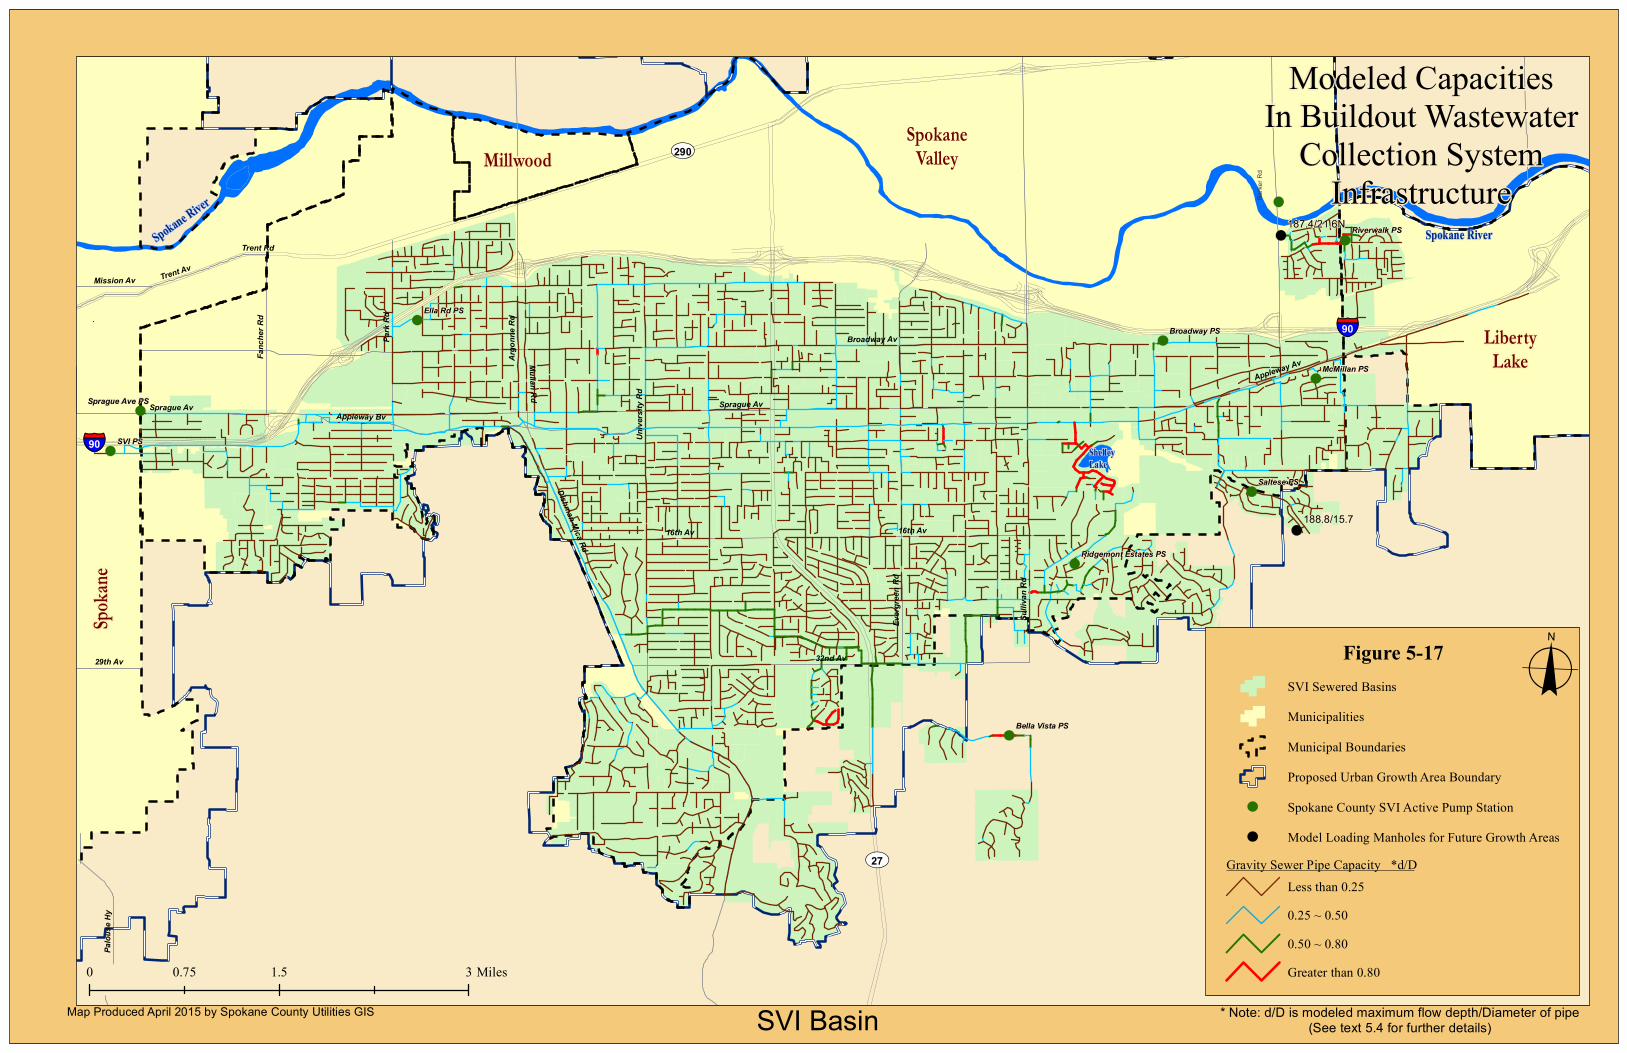
Spokane Valley Interceptor
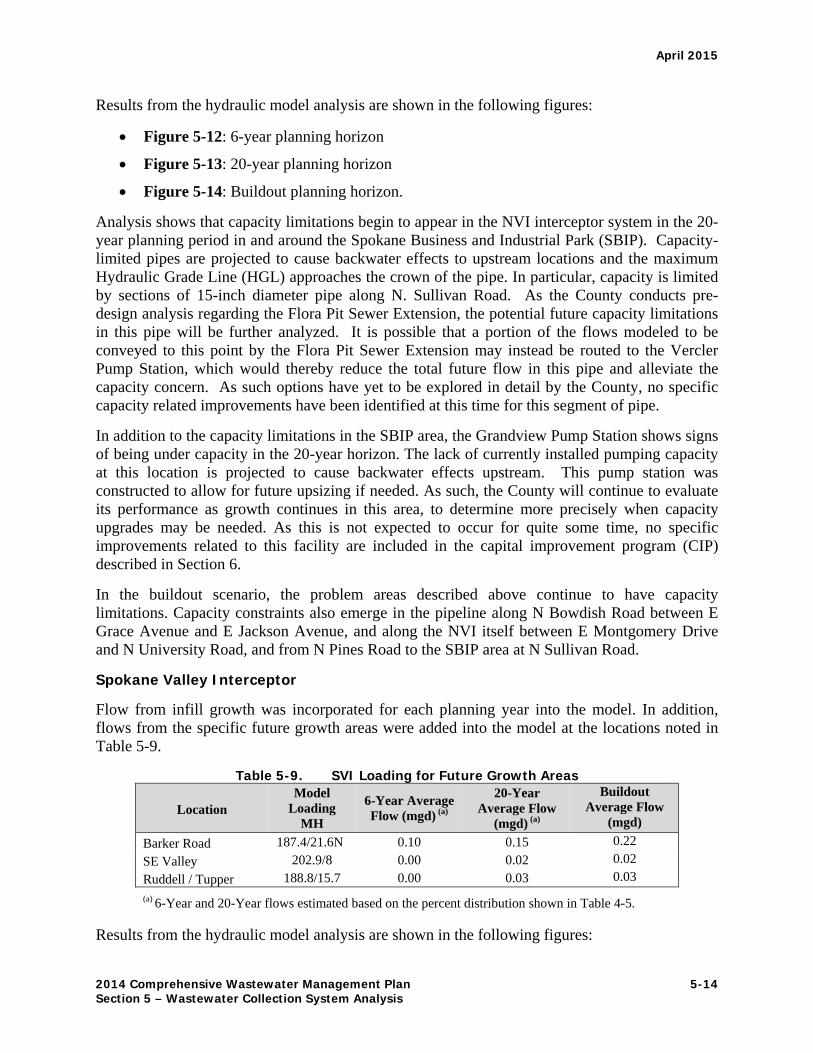
Flow from infill growth was incorporated for each planning year into the model. In addition, flows from the specific future growth areas were added into the model at the locations noted in Table 5-9.
Table 5-9. SVI Loading for Future Growth Areas
Location Model
Loading MH
6-Year Average Flow (mgd) (a)
20-Year Average Flow
(mgd) (a)
Buildout Average Flow
(mgd)
Barker Road 187.4/21.6N 0.10 0.15 0.22
SE Valley 202.9/8 0.00 0.02 0.02
Ruddell / Tupper 188.8/15.7 0.00 0.03 0.03
(a) 6-Year and 20-Year flows estimated based on the percent distribution shown in Table 4-5.
Results from the hydraulic model analysis are shown in the following figures:
April 2015
2014 Comprehensive Wastewater Management Plan 5-15 Section 5 – Wastewater Collection System Analysis
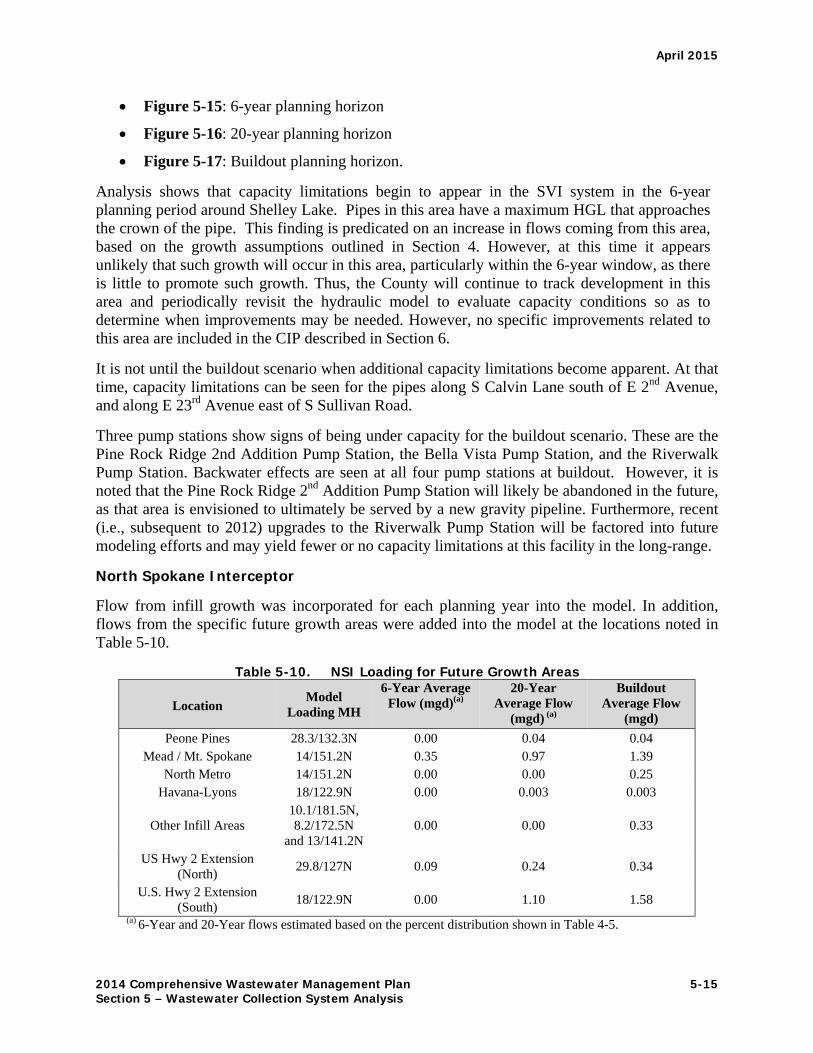
Figure 5-15: 6-year planning horizon
Figure 5-16: 20-year planning horizon
Figure 5-17: Buildout planning horizon.
Analysis shows that capacity limitations begin to appear in the SVI system in the 6-year planning period around Shelley Lake. Pipes in this area have a maximum HGL that approaches the crown of the pipe. This finding is predicated on an increase in flows coming from this area, based on the growth assumptions outlined in Section 4. However, at this time it appears unlikely that such growth will occur in this area, particularly within the 6-year window, as there is little to promote such growth. Thus, the County will continue to track development in this area and periodically revisit the hydraulic model to evaluate capacity conditions so as to determine when improvements may be needed. However, no specific improvements related to this area are included in the CIP described in Section 6.
It is not until the buildout scenario when additional capacity limitations become apparent. At that time, capacity limitations can be seen for the pipes along S Calvin Lane south of E 2nd Avenue, and along E 23rd Avenue east of S Sullivan Road.
Three pump stations show signs of being under capacity for the buildout scenario. These are the Pine Rock Ridge 2nd Addition Pump Station, the Bella Vista Pump Station, and the Riverwalk Pump Station. Backwater effects are seen at all four pump stations at buildout. However, it is noted that the Pine Rock Ridge 2nd Addition Pump Station will likely be abandoned in the future, as that area is envisioned to ultimately be served by a new gravity pipeline. Furthermore, recent (i.e., subsequent to 2012) upgrades to the Riverwalk Pump Station will be factored into future modeling efforts and may yield fewer or no capacity limitations at this facility in the long-range.
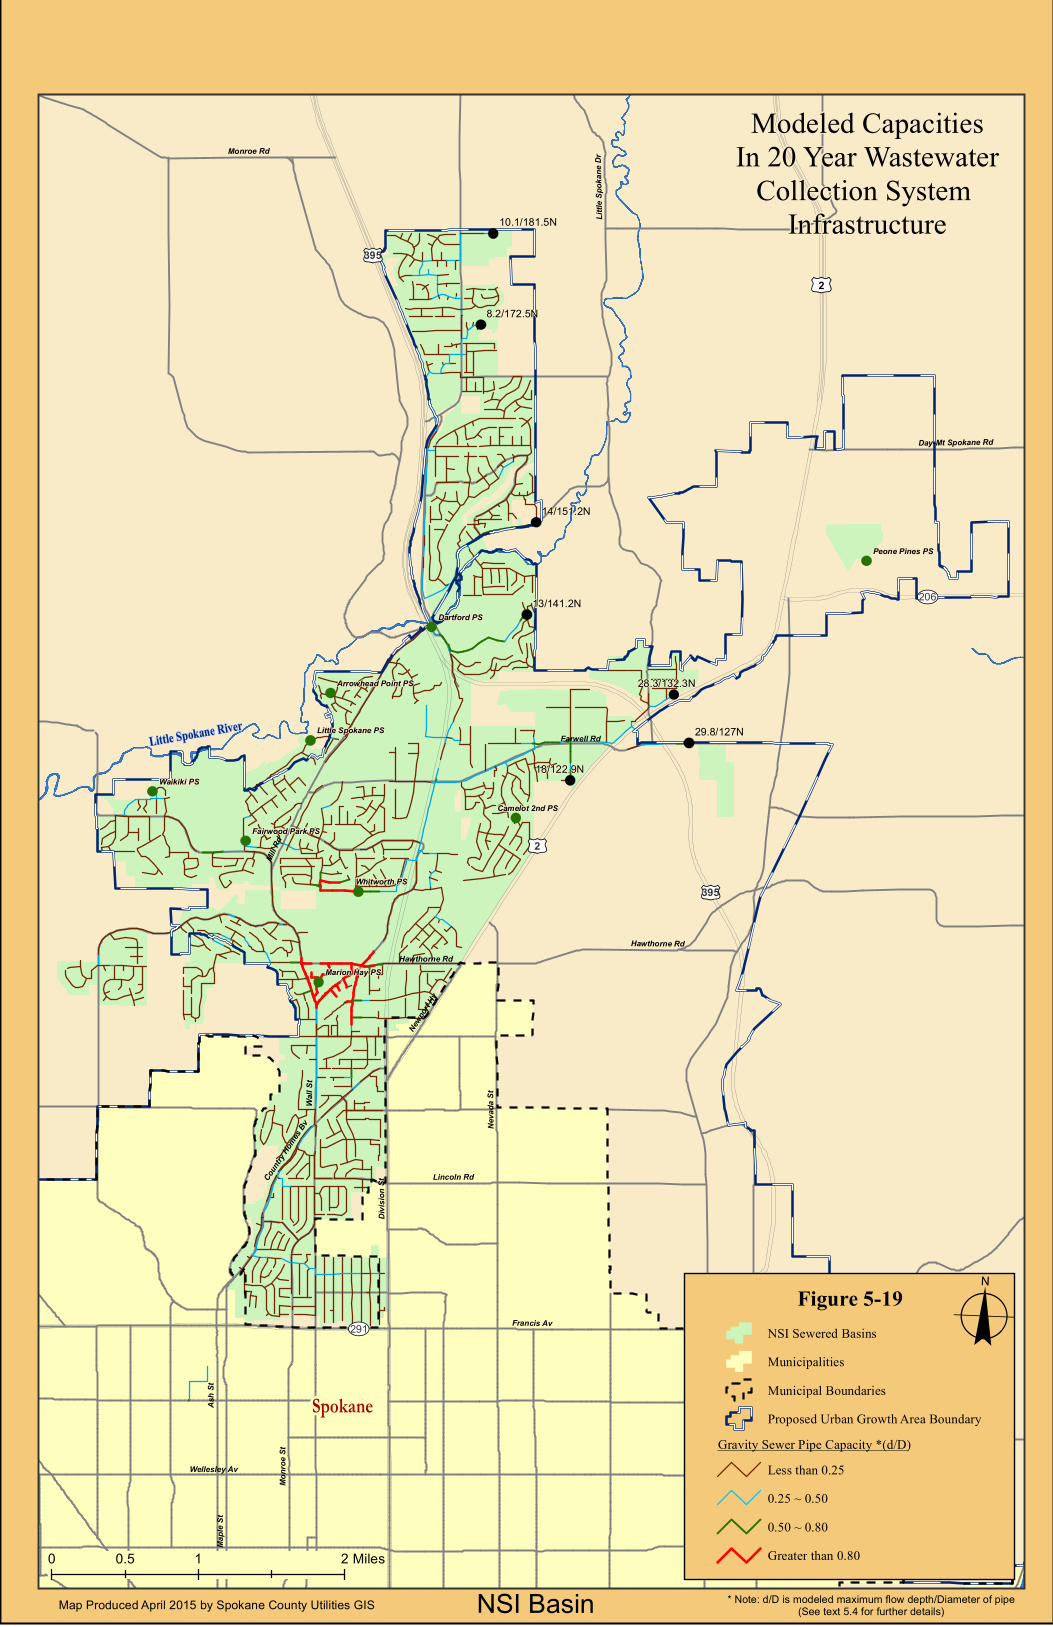
North Spokane Interceptor
Flow from infill growth was incorporated for each planning year into the model. In addition, flows from the specific future growth areas were added into the model at the locations noted in Table 5-10.
Table 5-10. NSI Loading for Future Growth Areas
Location Model
Loading MH
6-Year Average Flow (mgd)(a)
20-Year Average Flow
(mgd) (a)
Buildout Average Flow
(mgd)
Peone Pines 28.3/132.3N 0.00 0.04 0.04 Mead / Mt. Spokane 14/151.2N 0.35 0.97 1.39
North Metro 14/151.2N 0.00 0.00 0.25 Havana-Lyons 18/122.9N 0.00 0.003 0.003
Other Infill Areas 10.1/181.5N, 8.2/172.5N
and 13/141.2N 0.00 0.00 0.33
US Hwy 2 Extension (North)
29.8/127N 0.09 0.24 0.34
U.S. Hwy 2 Extension (South)
18/122.9N 0.00 1.10 1.58
(a) 6-Year and 20-Year flows estimated based on the percent distribution shown in Table 4-5.
April 2015
2014 Comprehensive Wastewater Management Plan 5-16 Section 5 – Wastewater Collection System Analysis
Results from the hydraulic model analysis are shown in the following figures:
Figure 5-18: 6-year planning horizon
Figure 5-19: 20-year planning horizon
Figure 5-20: Buildout planning horizon.
Analysis shows that capacity limitations begin to appear in the NSI interceptor system in the 20-year planning period at the Marion Hay and Whitworth Pump Stations. The pump stations are under capacity, causing backwater to be observed upstream of the pump station. Both pump stations were constructed to allow for future upsizing if needed. As such, the County will continue to evaluate their performance as growth continues in these areas, to determine more precisely when capacity upgrades may be needed. As this is not expected to occur for quite some time, no specific improvements related to these facilities are included in the capital improvement program (CIP) described in Section 6.
In addition, in the buildout condition, pipes along Pittsburg Street, Farwell Road and Little Spokane Drive show indications of being under capacity. The maximum HGL in this area does not exceed the crown of the pipe but the capacity criterion of 0.8 is exceeded.
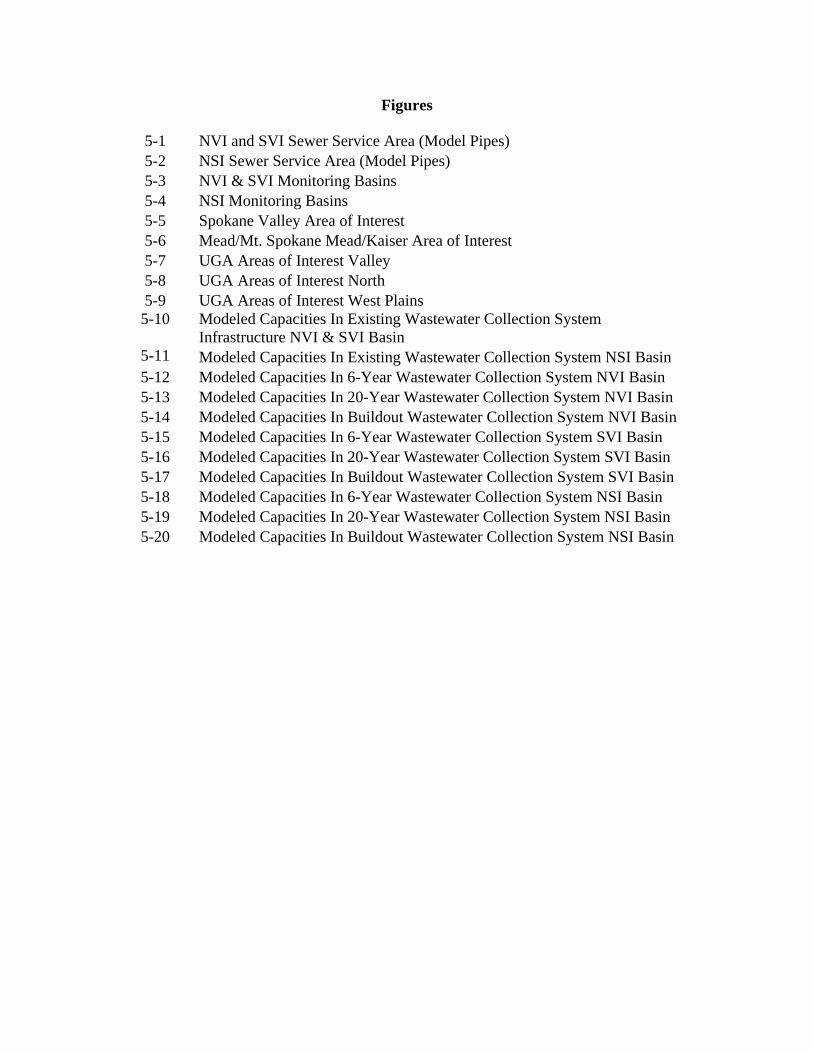
Figures
5-1 NVI and SVI Sewer Service Area (Model Pipes) 5-2 NSI Sewer Service Area (Model Pipes) 5-3 NVI & SVI Monitoring Basins 5-4 NSI Monitoring Basins 5-5 Spokane Valley Area of Interest 5-6 Mead/Mt. Spokane Mead/Kaiser Area of Interest 5-7 UGA Areas of Interest Valley 5-8 UGA Areas of Interest North 5-9 UGA Areas of Interest West Plains 5-10 Modeled Capacities In Existing Wastewater Collection System
Infrastructure NVI & SVI Basin 5-11 Modeled Capacities In Existing Wastewater Collection System NSI Basin 5-12 Modeled Capacities In 6-Year Wastewater Collection System NVI Basin 5-13 Modeled Capacities In 20-Year Wastewater Collection System NVI Basin 5-14 Modeled Capacities In Buildout Wastewater Collection System NVI Basin 5-15 Modeled Capacities In 6-Year Wastewater Collection System SVI Basin 5-16 Modeled Capacities In 20-Year Wastewater Collection System SVI Basin 5-17 Modeled Capacities In Buildout Wastewater Collection System SVI Basin 5-18 Modeled Capacities In 6-Year Wastewater Collection System NSI Basin 5-19 Modeled Capacities In 20-Year Wastewater Collection System NSI Basin 5-20 Modeled Capacities In Buildout Wastewater Collection System NSI Basin
#
#
#
#
#
#
#
#
#
## #
#
#
#
#
#
#
#
#
#
#
$1
#
#
#
#
#
#
#
#
#
#
#
#
$1
#
#
!A
!A
!A
ELLA RD PS
SALTESE PS
VERCLER PS
MARINGO PS
PASADENA PS
MIDILOME PS
MIRABEAU PSRAILROAD PS
RIDGEMONT PS
RIVERWALK PS
GRANDVIEW PS
E. SPRAGUE PS
KIERNAN AV PS
BELLA VISTA PSBELLE TERRE 3RD PS
NVI Metering Station
Sprague Av
Broadway Av
Argo
nne R
d
32nd Av
Wellesley Av
Dishman-Mica Rd
Marke
t St
Barke
r Rd
16th Av
Bigelow Gulch Rd
Everg
reen R
dUnive
rsity
Rd
29th Av
Appleway Bv
Park
Rd
Palou
se H
y
Harva
rd R
d
Mission Av
Francis Av
Ray S
t
Mullan Rd
Appleway AvFanc
her R
d
Forker Rd
Thor
StGr
eene
StHa
ven S
tRay
PlFre
ya St
Haven Pl
Thor Pl
Country Vista Dr
Trent Rd
Marke
t Pl
Wellesley Av
16th Av
Sprague Av
Freya
St
§̈¦90
§̈¦90
¿À27
¿À290
£¤395
L ib e r ty L a k e
S h e ll e y L a k e
NVI & SVISystem Service
Areas(Model Pipes)
0 1 20.5 Miles
F ig u re 5 -1$1 Wastewater Treatment Facilities# Spokane County Active Pump Stations!A Spokane County Flow Meters
Spokane County Gravity InterceptorsSCRWRF OutfallSpokane County Gravity ExtensionsSpokane County Forcemain ExtensionsSpokane County Gravity CollectorsSpokane Valley Interceptor BasinNorth Valley Interceptor BasinLiberty Lake Sewer & Water DistrictMunicipalitiesMunicipal BoundariesProposed Urban Growth Area Boundary
Map Produced April 2015 by Spokane County Utilities GIS
o
Spokan
e
L ib e r ty L a k eS e w e r & W a te r
D is tric t
S p o k a n eVa lle y
Sp ok an e R iv e r
M illw o o dNorth Valley Interceptor
Spokane Valley Interceptor
Dishman-Mica Interceptor
LIBERTY LAKE WATERRECLAMATION FACILITY
BROADWAY PS
MCMILLAN PS
48"
0.022
18"F
M24
"FM
54"0.003
42"0.0013
36"0.0022
48"0.0017
27"0.0013
30"0.001 0.001
24"
24"
42"
0.0018
0.0019
18"0.0
067
24"0.002
30"0.0011
21"
0.001
4
18"0.0026
18"
0.005
2
36"0.0019SCRWRF
SVI PUMP STNSVI PS FLUME
NVI PUMP STN
NVI PS FLUME
Note: Average pipe diameters are representative
of many runs of pipe of similar diameter.Average pipe slopes are the mean slope
of the corresponding runs of pipe.24 "
0.003Average Pipe DiameterAverage Pipe Slope
Sulliv
an R
d
L ib e r tyL a k e
#*
#*
#*
#*
#*
#*
#*
#*
#*
#*
!H
!H
#
#
#
#
#
#
#
!.
!.
$1
WAIKIKI PS
DARTFORD PS
NVI Pump Stn
FAIRWOOD PARK PS
LITTLE SPOKANE PS
PEONE PINES PTP/CD
ARROWHEAD POINT PS
Marke
t St
Ash S
t
Divisi
on St
Neva
da St
Maple
St
Wellesley Av
Monr
oe St
Mill R
d
Northwest Bl
Trent AvMission Av
Monroe Rd
Farwell Rd
Lincoln Rd
Ruby
St
Indian Trail Rd
Hawthorne Rd
Hami
lton S
t
Coun
try Ho
mes Bv
Gree
ne St
Bigelow Gulch Rd
Have
n St
Maxwell Av
Newpo
rt Hy
Asse
mbly
St
Wash
ington
St
Fort George Wright Dr
Little
Spok
ane D
r
Fanc
her R
d
Day-Mt Spokane Rd
Freya Wy
Nine Mile Rd
Haven Pl
Ruby Pl
Trent Rd
Marke
t Pl
Mission Av
Hawthorne Rd
¿À206
¿À291
"
NSI SystemService Area
(Model Pipes)
0 1 20.5 Miles
Map Produced April 2015 by Spokane County Utilities GIS
L ittle S p ok an e R iv er
S p o k a n e
North
Spok
ane I
nterce
ptor
36"0.0085
36"0.0054
8"0.071
10"
36"0.028
0.0011
42"
0.001
410
"0.0
207
10"
0.044
30" 0.001
30"0.001
10"
0.069
18"
0.003
115
"0.0
21
Hastings Rd
WHITWORTH PS
MARION HAY PS
Waikiki Rd
CAMELOT #2 PS
24" F
M
18"FM
16"FM8"FM
PEONE PINES PS
Francis Av
Wall S
t
18"
15"
0.01
0.032 0.0
0221"
18"0.0018
24"0.00224"
0.013
RPWRF
£¤395
£¤2
ZZZZZZZZZZZZZZZZZZZZZZZZZZZZZZZZZZZZZZZ
F ig u re 5 -2$1 Riverside Park Water Reclamation Facility!. Spokane County Onsite Treatment Facilities#* Spokane County Active Pump Stations
Spokane County Gravity InterceptorsSpokane County Gravity ExtensionsSpokane County Forcemains ExtensionsSpokane County Forcemain InterceptorsSpokane County Gravity CollectorsNorth Spokane Interceptor BasinMunicipalitiesMunicipal BoundariesProposed Urban Growth Area Boundary
o
£¤2
Note: Average pipe diameters are representative
of many runs of pipe of similar diameter.Average pipe slopes are the mean slope
of the corresponding runs of pipe.24 "
0.003Average Pipe Diameter
Average Pipe Slope
#*
#*
XY
NVI-02B
NVI-03A
NVI-01B
SVI-05
SVI-04 SVI-03
SVI-01
RG-01
NVI-01B
NVI-01A
NVI-03A
NVI-03B
NVI-02BNVI-02A
SVI-04
SVI-01
SVI-03
SVI-02
SVI-05
UV27
UV290
§̈¦90
Sprague Av
Broadway Av
Sulliv
an R
d
32nd Av
Argo
nne R
d
Trent Av
Wellesley Av
Dishman-Mica Rd
Barke
r Rd
16th Av
Marke
t St
Everg
reen R
d
Unive
rsity
Rd
Appleway Bv
29th Av
Park
Rd
Harva
rd R
d
Ray S
t
Mission Av
Mulla
n Rd
Francis Av
Appleway Av
Fanc
her R
d
Palou
se H
y
Thor
StGr
eene
StHa
ven S
t
Freya Wy
Ray Pl
Freya
St
Haven Pl
Thor Pl
Country Vista Dr
Trent Rd
Marke
t Pl
Wellesley Av
16th Av
Sprague Av
Freya
St
Spokan
e
L ib e r tyL a k e
NVI & SVI Monitoring Basins
M illw o o d
Sp o k a n eVa lle y
Sp ok an e R iv er
0 1 20 .5 M ile s
Map Produced April 2015 by Spokane County Utilities GIS
F ig u re 5 -3NVI Monitoring Basins
SVI MonitoringBasins
Municipalities
Municipal Boundaries
Proposed Urban Growth Area Boundary
Spokane County Gravity Pipes
Flow Monitor
XY Rain Gauge
#* Monitored Pump Station
o
L ib e r tyL ak e
Sp ok an e R iv er
ShelleyLake
NVI PS
SVI PS
UnmeteredArea
UnmeteredArea
UnmeteredArea
UnmeteredArea
SVI-02
NVI-02A
NVI-01A
NVI-02A
XY
#*
NSI-04NSI-02
NSI-01A
NSI-03
NSI-05
NSI-01B
NSI-05
NSI-02
Marke
t St
Francis Av
Neva
da St
Wellesley Av
Divisi
on St
Ash S
t
Mill R
dMo
nroe
St
Maple
St
Monroe Rd
Wall S
t
Farwell Rd
Lincoln Rd
Hawthorne Rd
Country Homes Bv
Have
n St
Newpo
rt Hy
Little
Spok
ane D
r
Bigelow Gulch Rd
Northwest Bl
Woolard Rd
Indian Trail Rd
Day-Mt Spokane Rd
Haven Pl
Hawthorne Rd
¿À206
¿À291
£¤395
£¤2
£¤395
"
NSIMonitoring
Basins
0 1 20.5 Miles
Figure 5-4NSI Monitoring BasinsMunicipalitiesMunicipal BoundariesProposed Urban Growth Area BoundarySpokane County Gravity PipesFlow Monitor
XY Rain Gauge#* Monitored Pump Station
Map Produced April 2015 by Spokane County Utilities GIS
o
Little Spokane River
S p o k a n e
Marion Hay PSNSI-04
NSI-03
NSI-01BRG-2
NSI-01A
£¤2
!(
FUTURE PS
BARKER RD PS
RIVERWALK PS
UV290
Mission Av
Euclid Av
Sulliv
an R
d
Wellesley Av
Flora
Rd
Kenn
ey R
d
Campbell Rd
Marietta Av
Euclid Av
Wellesley Av
Euclid Av
Flora
Rd
Spokane Valley Area of Interest
S p o k a n eVa lle y
Sp ok an e R iv er
0 0.2 0.40.1 Miles
Map Produced April 2015 by Spokane County Utilities GIS
F ig u re 5 -5SVI Sewered BasinsNVI Sewered BasinsMunicipalitiesMunicipal BoundariesProposed Urban Growth Area BoundaryUrban Reserve AreaExisting Gravity SewerExisting Dry Gravity SewerExisting ForcemainsFuture Gravity SewerExisting Pump Station
o
BNSF Railway
SpokaneBusinessIndustrial
Park
North
Valle
y Inte
rcepto
r Exte
nsion
Euclid Ave Trunk
Trent Av
Bark
er Rd
Flora Pit Sewer Ext
"
Identified DeficienciesIn Build-Out Wastewater
Collection System Infrastructure
Map Produced April 2015 by Spokane County Utilities GIS
Little Spokane River
C ity o f S p o k a n e
North
Spok
ane I
nterce
ptor
36"0.0085
36"0.0054
8"0.071
10"
36"0.028
0.0011
42"
0.001
410
"0.0
207
10"
0.044
30" 0.001
30"0.001
10"
0.069
18"
0.003
115
"0.0
21
Hastings Rd
WHITWORTH PS
MARION HAY PS
Waikiki Rd
CAMELOT #2 PS
24" F
M
18"FM
16"FM8"FM
PEONE PINES PS
Francis Av
Wall S
t
18"
15"
0.01
0.032 0.0
0221"
18"0.0018
24"0.00224"
0.013
RPWRF
£¤395
£¤2
$+
Gerlach
Marke
t St
Bruc
e Rd
Neva
da St
Peone Rd
Francis Av
Freya
St
Stoneman Rd
Lincoln Rd
Farwell Rd
Bigelow Gulch Rd
Day-Mt Spokane Rd
Shad
y Slop
e Rd
Hawthorne Rd
Little Spokan
e Dr
Rowan Av
Midway Rd
Thier
man R
d
Perry
St
Gree
n Bluf
f Rd
Parks
mith Dr
Hastings Rd
Cincinnati Dr
Argonne Rd
Magnesium Rd
Glencrest Dr
Cozza Dr
Holland Rd
Cres
tline S
t
Weile Av
Market
Pl
Rowan Av
Cres
tline S
t
¿À206
£¤395
£¤2
Figure 5-6NSI Sewered BasinsMunicipalitiesMunicipal BoundariesCity Sewer Service BoundaryProposed Urban Growth Area BoundaryUrban Reserve AreaExisting Dry Gravity SewerExisting Gravity SewerExisting ForcemainFuture ForcemainFuture Gravity Sewer
$+ Existing Onsite Treatment FacilityExisting Pump Station Future Pump Station0 0.5 10.25 Miles
"
Mead-Mt. SpokaneMead/Kaiser
Areas of InterestLit
tle Spo
kane R
iver
S p o k a n e
Little
Deep C
reek
Deadman Creek
o
US Hw
y 2 Tr
unk
BNSF
Rail
road
North Spokane Corridor (NSC)
Altam
ont
Smith
Rega
l
Wilso
n
Hava
na
Farwell Rd
Green Bluff Rd
£¤2
McKi
nnon
Shady Slope Rd
Marke
t St
Center Rd
Mt. Spokane Park Dr
Freya
St
Cherr
y St
Future Shady SlopePump Station
Peone PinesPump Station& Treatment
Facility
Hunters Point
Sprague Av
Broadway Av
Sulliv
an R
d
Trent Av
32nd Av
Marke
t St
29th Av
Dishman-Mica Rd
Wellesley Av
Barke
r Rd
16th Av
Bigelow Gulch Rd
Everg
reen R
dUnive
rsity
Rd
Francis Av
Appleway Bv
Argo
nne R
d
Mission Av
Park
Rd
Harva
rd R
d
Ray S
t
Mullan Rd
Palou
se H
y
Appleway Av
Forker Rd
Fanc
her R
d
Thor
StGr
eene
StHa
ven S
tRay
PlFre
ya St
Haven Pl
Thor Pl
Country Vista Dr
Trent Rd
Marke
t Pl
Bigelow Gulch Rd
Sprague Av
Argo
nne R
d
Wellesley Av
16th Av
Freya
St
Belle Terre
Monte Dell Rey UGA
Southeast ValleyRuddell/Tupper
Moran Prairie UGAPonderosa UGA
South Glenrose UGA
Havana-Lyons UGA Bigelow Gulch UGA
§̈¦90
¿À27
¿À290
£¤395
L iber ty L ake
S h el le y L ak e
0 1 20.5 Miles
Map Produced April 2015 by Spokane County Utilities GIS
Spokan
e
L ib e rtyL a k e
S p o k a n eVa lle y
M illw o o d
UGA Areas of InterestValley
Sp ok an e R iv er
F ig u re 5 -7UGA Areas of InterestSpokane County Sewered BasinsMunicipalitiesMunicipal BoundariesProposed Urban Growth Area BoundaryUrban Reserve Area
o
S p ok an e R iv e r
Marke
t St
Francis AvNe
vada
St
Wellesley Av
Argonne Rd
Bruc
e Rd
Divisi
on St
Mill R
d
Bigelow Gulch Rd
Ash S
t
Indian Trail Rd
Wall S
t
Monr
oe St
Day-Mt Spokane Rd
Farwell Rd
Lincoln Rd
Hastings Rd
Nine Mile Rd
Hawthorne RdSeven Mile Rd
Waikiki Rd
Coun
try Ho
mes B
v
Have
n St
Newpo
rt Hy
Asse
mbly
St
Northwest Bl
Hawthorne Rd
Mead-Mt Spokane UGA
Havana-Lyons UGA Bigelow Gulch UGA
Little Spokane UGA
¿À291
¿À206
£¤395
£¤2
£¤395
0 1 20.5 Miles
Map Produced April 2015 by Spokane County Utilities GIS
S p o k a n e
UGA Areas of InterestNorth
Figure 5-8UGA Areas of InterestSpokane County Sewered BasinsMunicipalitiesMunicipal BoundariesProposed Urban Growth Area BoundaryUrban Reserve Area
o
Little Spokane River
Spokane River
£¤2
Geiger Bv
Hayfo
rd R
d
Hallett Rd
Grov
e Rd
Deno Rd
Interstate 90
Ramb
o Rd
Craig
Rd
Thorpe Rd
Broo
ks R
d
Mcfarlane Rd
Asse
mbly
Rd
Electric Av
Lake St
Trails Rd
Sunset Hy
Greenwood Rd
Sunset Bl
Medical Lake-Four Lakes Rd
West Dr
Laws
on St
Stanle
y St
Barker St
53rd Av
Spott
ed R
d
Maple St
4th Av
Grandview Av
Garden Springs Rd
Westclif
f Pl
Aero Rd
Brooks Rd
Thorpe Rd
Asse
mbly
Rd
Grov
e Rd
Craig
Rd
Laws
on St
Geige
r Spu
r UGA
Palisades UGA
Pillar Rock UGA
Kunze Farms UGA
§̈¦90
§̈¦90
¿À902
£¤2
S ilve r L ak eM e d ic a l L ak e 0 1 20.5 Miles
Map Produced April 2015 by Spokane County Utilities GIS
S p o k a n e
A irw a y H e ig h ts
UGA Areas of InterestWest Plains
M e d ic a lL a k e
Fa irc h ildA .F.B .
F ig u re 5 -9UGA Areas of InterestSpokane County Sewered BasinsMunicipalitiesMunicipal BoundariesProposed Urban Growth Area BoundaryUrban Reserve Area
o
UV27
UV290
UV290
§̈¦90
L ib e r ty L a k eS h el le y L ak e
Sprague Av
Broadway Av
Sulliv
an R
d
Trent Av
32nd Av
Dishman-Mica Rd
29th Av
Wellesley Av
Marke
t St
16th Av
Everg
reen R
d
Unive
rsity
Rd
Francis Av
Appleway Bv
Argo
nne R
d
Mission Av
Park
Rd
Ray S
t
Palou
se H
y
Mulla
n Rd
Appleway AvFanc
her R
d
Thor
StGr
eene
StHa
ven S
t
Forker Rd
Ray Pl
Bigelow Gulch Rd
Freya
St
Haven Pl
Country Vista Dr
Thor Pl
Marke
t Pl
Trent Rd
16th Av
Freya
St
Argo
nne R
d
Sprague Av
Wellesley Av
S p o k a n e
L ib e r tyL a k e
Modeled Capacities In Existing Wastewater
Collection SystemInfrastructure
M illw o o dS p o k a n e
Va lle yS p ok an e R iv e r
0 1 20.5 Miles
Map Produced April 2015 by Spokane County Utilities GIS
F ig u re 5 -1 0NVI Sewered BaisnsSVI Sewered BaisnsMunicipalitiesMunicipal BoundariesProposed Urban Growth Area Boundary
Gravity Sewer Pipe Capacity *d/DLess than 0.250.25 ~ 0.500.50 ~ 0.80Greater than 0.80
o
Barke
r Rd
NVI & SVI Basin * Note: d/D is modeled maximum flow depth/Diameter of pipe(See text 5.4 for further details)
S p ok an e R iv e r
"
Identified DeficienciesIn Build-Out Wastewater
Collection System Infrastructure
Map Produced April 2015 by Spokane County Utilities GIS
Little Spokane River
C ity o f S p o k a n e
North
Spok
ane I
nterce
ptor
36"0.0085
36"0.0054
8"0.071
10"
36"0.028
0.0011
42"
0.001
410
"0.0
207
10"
0.044
30" 0.001
30"0.001
10"
0.069
18"
0.003
115
"0.0
21
Hastings Rd
WHITWORTH PS
MARION HAY PS
Waikiki Rd
CAMELOT #2 PS
24" F
M
18"FM
16"FM8"FM
PEONE PINES PS
Francis Av
Wall S
t
18"
15"
0.01
0.032 0.0
0221"
18"0.0018
24"0.00224"
0.013
RPWRF
£¤395
£¤2
Marke
t St
Francis Av
Neva
da St
Divisi
on St
Wellesley Av
Ash S
t
Mill R
dMo
nroe
St
Maple
St
Wall S
t
Monroe Rd
Farwell Rd
Lincoln Rd
Hawthorne Rd
Coun
try Ho
mes Bv
Bigelow Gulch Rd
Have
n St
Newpo
rt Hy
Little
Spok
ane D
r
Day-Mt Spokane Rd
Haven Pl
Hawthorne Rd
¿À206
¿À291
£¤395
£¤2
£¤395
Figure 5-11NSI Sewered BasinsMunicipalitiesMunicipal BoundariesProposed Urban Growth Area Boundary
Gravity Sewer Pipe Capacity *(d/D)Less than 0.250.25 ~ 0.500.50 ~ 0.80Greater than 0.80
* Note: d/D is modeled maximum flow depth/Diameter of pipe(See text 5.4 for further details)NSI Basin
0 1 20.5 Miles
"
Modeled CapacitiesIn Existing Wastewater
Collection System Infrastructure
Little Spokane River
S p o k a n e
o
£¤2

UV290
UV27
§̈¦90
§̈¦90
Sprague Av
Broadway Av
Sulliv
an R
d32nd Av
16th AvEv
ergree
n Rd
Unive
rsity
Rd
Wellesley Av
Appleway Bv
Argo
nne R
d
Dishman-Mica Rd
Park
Rd
Mullan Rd
Appleway Av
Fanc
her R
d
Forker Rd
Country Vista Dr
16th Av
Sprague Av
Argo
nne R
d
90.8/56N
155/31.9N
154.7/23.4N
Vercler PS
Maringo PSKiernan PS
Mirabeau PS
Grandview PS
Railroad Av PS
Pasadena Park PS
Modeled CapacitiesIn 6 Year Wastewater
Collection SystemInfrastructure
M illw o o d
S p o k a n eVa lle y
S p ok an e R iv e r
0 1.5 30.75 Miles
Map Produced April 2015 by Spokane County Utilities GIS
F igu re 5 -12NVI Sewered Basins
Municipalities
Municipal Boundaries
Proposed Urban Growth Area Boundary
Spokane County NVI Active Pump Station
Model Loading Manholes for Future Growth Areas Gravity Sewer Pipe Capacity *(d/D)
Less than 0.250.25 ~ 0.500.50 ~ 0.80Greater than 0.80
o
NVI Basin * Note: d/D is modeled maximum flow depth/Diameter of pipe(See text 5.4 for further details)
Sp ok an e R iv er
Sh e lle yL a ke
L ib e r tyL a k e
UV290
UV27
§̈¦90
§̈¦90
Sprague Av
Broadway Av
Sulliv
an R
d32nd Av
16th AvEv
ergree
n Rd
Unive
rsity
Rd
Wellesley Av
Appleway Bv
Argo
nne R
d
Dishman-Mica Rd
Park
Rd
Mullan Rd
Appleway Av
Fanc
her R
d
Forker Rd
Country Vista Dr
16th Av
Sprague Av
Argo
nne R
d
90.8/56N
155/31.9N
154.7/23.4N
Vercler PS
Maringo PSKiernan PS
Mirabeau PS
Grandview PS
Railroad Av PS
Pasadena Park PS
Modeled CapacitiesIn 20 Year Wastewater
Collection SystemInfrastructure
M illw o o d
S p o k a n eVa lle y
S p ok an e R iv e r
0 1.5 30.75 Miles
Map Produced April 2015 by Spokane County Utilities GIS
F igu re 5 -13NVI Sewered Basins
Municipalities
Municipal Boundaries
Proposed Urban Growth Area Boundary
Spokane County NVI Active Pump Station
Model Loading Manholes for Future Growth Areas Gravity Sewer Pipe Capacity *(d/D)
Less than 0.250.25 ~ 0.500.50 ~ 0.80Greater than 0.80
o
NVI Basin * Note: d/D is modeled maximum flow depth/Diameter of pipe(See text 5.4 for further details)
Sp ok an e R iv er
Sh e lle yL a ke
L ib e r tyL a k e
UV290
UV27
§̈¦90
§̈¦90
Sprague Av
Broadway Av
Sulliv
an R
d32nd Av
16th AvEv
ergree
n Rd
Unive
rsity
Rd
Wellesley Av
Appleway Bv
Argo
nne R
d
Dishman-Mica Rd
Park
Rd
Mullan Rd
Appleway Av
Fanc
her R
d
Forker Rd
Country Vista Dr
16th Av
Sprague Av
Argo
nne R
d
90.8/56N
155/31.9N
154.7/23.4N
Vercler PS
Maringo PSKiernan PS
Mirabeau PS
Grandview PS
Railroad Av PS
Pasadena Park PS
Modeled CapacitiesIn Buildout Wastewater
Collection SystemInfrastructure
M illw o o d
S p o k a n eVa lle y
S p ok an e R iv e r
0 1.5 30.75 Miles
Map Produced April 2015 by Spokane County Utilities GIS
F igu re 5 -14NVI Sewered Basins
Municipalities
Municipal Boundaries
Proposed Urban Growth Area Boundary
Spokane County NVI Active Pump Station
Model Loading Manholes for Future Growth Areas Gravity Sewer Pipe Capacity *(d/D)
Less than 0.250.25 ~ 0.500.50 ~ 0.80Greater than 0.80
o
NVI Basin * Note: d/D is modeled maximum flow depth/Diameter of pipe(See text 5.4 for further details)
Sp ok an e R iv er
Sh e lle yL a ke
L ib e r tyL a k e

UV27
UV290
§̈¦90
§̈¦90
Sprague Av
Broadway Av
Sulliv
an R
d
32nd Av
Dishman-Mica Rd
16th Av
Argo
nne R
d
Everg
reen R
d
Unive
rsity
Rd
Appleway Bv
Park
Rd
Trent Av
Mullan Rd
Appleway AvFanc
her R
d
Palou
se H
y
29th Av
Mission Av
Trent Rd
Sprague Av
16th Av188.8/15.7
187.4/21.6N
SVI PS
Saltese PS
Ella Rd PS
Broadway PS
McMillan PS
Riverwalk PS
Bella Vista PS
Sprague Ave PS
Ridgemont Estates PS
Spokan
e
L ib e r tyL a k e
Modeled CapacitiesIn 6 Year Wastewater
Collection SystemInfrastructure
M illw o o dS p o k a n e
Va lle y
S p ok an e R iv e r
0 1.5 30.75 Miles
Map Produced April 2015 by Spokane County Utilities GIS
F igu re 5 -15SVI Sewered BasinsMunicipalitiesMunicipal BoundariesProposed Urban Growth Area BoundarySpokane County SVI Active Pump StationModel Loading Manholes for Future Growth Areas
Gravity Sewer Pipe Capacity *d/DLess than 0.250.25 ~ 0.500.50 ~ 0.80Greater than 0.80
o
Barke
r Rd
SVI Basin * Note: d/D is modeled maximum flow depth/Diameter of pipe(See text 5.4 for further details)
Sp ok an e R iv er
Sh e lle yL a ke
UV27
UV290
§̈¦90
§̈¦90
Sprague Av
Broadway Av
Sulliv
an R
d
32nd Av
Dishman-Mica Rd
16th AvAr
gonn
e Rd
Everg
reen R
d
Unive
rsity
Rd
Appleway Bv
Park
Rd
Trent Av
Mullan Rd
Appleway AvFanc
her R
d
Palou
se H
y
29th Av
Mission Av
Trent Rd
Sprague Av
16th Av188.8/15.7
187.4/21.6N
SVI PS
Saltese PS
Ella Rd PS
Broadway PS
McMillan PS
Riverwalk PS
Bella Vista PS
Sprague Ave PS
Ridgemont Estates PS
Spokan
e
L ib e r tyL a k e
Modeled CapacitiesIn 20 Year Wastewater
Collection SystemInfrastructure
M illw o o dS p o k a n e
Va lle y
S p ok an e R iv e r
0 1.5 30.75 Miles
Map Produced April 2015 by Spokane County Utilities GIS
F igu re 5 -16SVI Sewered BasinsMunicipalitiesMunicipal BoundariesProposed Urban Growth Area BoundarySpokane County SVI Active Pump StationModel Loading Manholes for Future Growth Areas
Gravity Sewer Pipe Capacity *d/DLess than 0.250.25 ~ 0.500.50 ~ 0.80Greater than 0.80
o
Barke
r Rd
SVI Basin * Note: d/D is modeled maximum flow depth/Diameter of pipe(See text 5.4 for further details)
Sp ok an e R iv er
Sh e lle yL a ke
UV27
UV290
§̈¦90
§̈¦90
Sprague Av
Broadway Av
Sulliv
an R
d
32nd Av
Dishman-Mica Rd
16th AvAr
gonn
e Rd
Everg
reen R
d
Unive
rsity
Rd
Appleway Bv
Park
Rd
Trent Av
Mullan Rd
Appleway AvFanc
her R
d
Palou
se H
y
29th Av
Mission Av
Trent Rd
Sprague Av
16th Av188.8/15.7
187.4/21.6N
SVI PS
Saltese PS
Ella Rd PS
Broadway PS
McMillan PS
Riverwalk PS
Bella Vista PS
Sprague Ave PS
Ridgemont Estates PS
Spokan
e
L ib e r tyL a k e
Modeled CapacitiesIn Buildout Wastewater
Collection SystemInfrastructure
M illw o o dS p o k a n e
Va lle y
S p ok an e R iv e r
0 1.5 30.75 Miles
Map Produced April 2015 by Spokane County Utilities GIS
F igu re 5 -17SVI Sewered BasinsMunicipalitiesMunicipal BoundariesProposed Urban Growth Area BoundarySpokane County SVI Active Pump StationModel Loading Manholes for Future Growth Areas
Gravity Sewer Pipe Capacity *d/DLess than 0.250.25 ~ 0.500.50 ~ 0.80Greater than 0.80
o
Barke
r Rd
SVI Basin * Note: d/D is modeled maximum flow depth/Diameter of pipe(See text 5.4 for further details)
Sp ok an e R iv er
Sh e lle yL a ke

"
Identified DeficienciesIn Build-Out Wastewater
Collection System Infrastructure
Map Produced April 2015 by Spokane County Utilities GIS
Little Spokane River
C ity o f S p o k a n e
North
Spok
ane I
nterce
ptor
36"0.0085
36"0.0054
8"0.071
10"
36"0.028
0.0011
42"
0.001
410
"0.0
207
10"
0.044
30" 0.001
30"0.001
10"
0.069
18"
0.003
115
"0.0
21
Hastings Rd
WHITWORTH PS
MARION HAY PS
Waikiki Rd
CAMELOT #2 PS
24" F
M
18"FM
16"FM8"FM
PEONE PINES PS
Francis Av
Wall S
t
18"
15"
0.01
0.032 0.0
0221"
18"0.0018
24"0.00224"
0.013
RPWRF
£¤395
£¤2
29.8/127N
18/122.9N
13/141.2N
14/151.2N
8.2/172.5N
28.3/132.3N
10.1/181.5N
Waikiki PS
Dartford PS
Whitworth PS
Marion Hay PS
Camelot 2nd PS
Peone Pines PS
Fairwood Park PS
Little Spokane PS
Arrowhead Point PSMa
rket S
t
Francis Av
Neva
da St
Divisi
on St
Wellesley Av
Ash S
t
Mill R
dMo
nroe
St
Maple
St
Wall S
t
Monroe Rd
Farwell Rd
Lincoln Rd
Hawthorne Rd
Coun
try Ho
mes Bv
Bigelow Gulch Rd
Have
n St
Newpo
rt Hy
Little
Spok
ane D
r
Day-Mt Spokane Rd
Haven Pl
Hawthorne Rd
¿À206
¿À291
£¤395
£¤2
£¤395
Figure 5-18NSI Sewered BasinsMunicipalitiesMunicipal BoundariesProposed Urban Growth Area Boundary
Gravity Sewer Pipe Capacity *(d/D)Less than 0.250.25 ~ 0.500.50 ~ 0.80Greater than 0.80
* Note: d/D is modeled maximum flow depth/Diameter of pipe(See text 5.4 for further details)NSI Basin
0 1 20.5 Miles
"
Modeled CapacitiesIn 6 Year WastewaterCollection System
Infrastructure
Little Spokane River
S p o k a n e
o
£¤2
"
Identified DeficienciesIn Build-Out Wastewater
Collection System Infrastructure
Map Produced April 2015 by Spokane County Utilities GIS
Little Spokane River
C ity o f S p o k a n e
North
Spok
ane I
nterce
ptor
36"0.0085
36"0.0054
8"0.071
10"
36"0.028
0.0011
42"
0.001
410
"0.0
207
10"
0.044
30" 0.001
30"0.001
10"
0.069
18"
0.003
115
"0.0
21
Hastings Rd
WHITWORTH PS
MARION HAY PS
Waikiki Rd
CAMELOT #2 PS
24" F
M
18"FM
16"FM8"FM
PEONE PINES PS
Francis Av
Wall S
t
18"
15"
0.01
0.032 0.0
0221"
18"0.0018
24"0.00224"
0.013
RPWRF
£¤395
£¤2
29.8/127N
18/122.9N
13/141.2N
14/151.2N
8.2/172.5N
28.3/132.3N
10.1/181.5N
Waikiki PS
Dartford PS
Whitworth PS
Marion Hay PS
Camelot 2nd PS
Peone Pines PS
Fairwood Park PS
Little Spokane PS
Arrowhead Point PSMa
rket S
t
Francis Av
Neva
da St
Divisi
on St
Wellesley Av
Ash S
t
Mill R
dMo
nroe
St
Maple
St
Wall S
t
Monroe Rd
Farwell Rd
Lincoln Rd
Hawthorne Rd
Coun
try Ho
mes Bv
Bigelow Gulch Rd
Have
n St
Newpo
rt Hy
Little
Spok
ane D
r
Day-Mt Spokane Rd
Haven Pl
Hawthorne Rd
¿À206
¿À291
£¤395
£¤2
£¤395
Figure 5-19NSI Sewered BasinsMunicipalitiesMunicipal BoundariesProposed Urban Growth Area Boundary
Gravity Sewer Pipe Capacity *(d/D)Less than 0.250.25 ~ 0.500.50 ~ 0.80Greater than 0.80
* Note: d/D is modeled maximum flow depth/Diameter of pipe(See text 5.4 for further details)NSI Basin
0 1 20.5 Miles
"
Modeled CapacitiesIn 20 Year Wastewater
Collection System Infrastructure
Little Spokane River
S p o k a n e
o
£¤2

"
Identified DeficienciesIn Build-Out Wastewater
Collection System Infrastructure
Map Produced April 2015 by Spokane County Utilities GIS
Little Spokane River
C ity o f S p o k a n e
North
Spok
ane I
nterce
ptor
36"0.0085
36"0.0054
8"0.071
10"
36"0.028
0.0011
42"
0.001
410
"0.0
207
10"
0.044
30" 0.001
30"0.001
10"
0.069
18"
0.003
115
"0.0
21
Hastings Rd
WHITWORTH PS
MARION HAY PS
Waikiki Rd
CAMELOT #2 PS
24" F
M
18"FM
16"FM8"FM
PEONE PINES PS
Francis Av
Wall S
t
18"
15"
0.01
0.032 0.0
0221"
18"0.0018
24"0.00224"
0.013
RPWRF
£¤395
£¤2
29.8/127N
18/122.9N
13/141.2N
14/151.2N
8.2/172.5N
28.3/132.3N
10.1/181.5N
Waikiki PS
Dartford PS
Whitworth PS
Marion Hay PS
Camelot 2nd PS
Peone Pines PS
Fairwood Park PS
Little Spokane PS
Arrowhead Point PSMa
rket S
t
Francis Av
Neva
da St
Divisi
on St
Wellesley Av
Ash S
t
Mill R
dMo
nroe
St
Maple
St
Wall S
t
Monroe Rd
Farwell Rd
Lincoln Rd
Hawthorne Rd
Coun
try Ho
mes Bv
Bigelow Gulch Rd
Have
n St
Newpo
rt Hy
Little
Spok
ane D
r
Day-Mt Spokane Rd
Haven Pl
Hawthorne Rd
¿À206
¿À291
£¤395
£¤2
£¤395
Figure 5-20NSI Sewered BasinsMunicipalitiesMunicipal BoundariesProposed Urban Growth Area Boundary
Gravity Sewer Pipe Capacity *(d/D)Less than 0.250.25 ~ 0.500.50 ~ 0.80Greater than 0.80
* Note: d/D is modeled maximum flow depth/Diameter of pipe(See text 5.4 for further details)NSI Basin
0 1 20.5 Miles
"
Modeled CapacitiesIn Buildout Wastewater
Collection System Infrastructure
Little Spokane River
S p o k a n e
o
£¤2