Section 5 - Primary Care. August 2014 Needs Assessments... · Section(5(*(Primary(Care(! ......
32
1 Section 5 * Primary Care Primary Care is that care which would normally represent a patient’s first point of contact with healthcare services in the community. In the UK it is generally considered to be general practices and the services they provide. Usually, primary care services refer on to secondary care services provided by hospital trusts. Since April 2013, Clinical Commissioning Groups (CCGs) overseen by the newly formed NHS England, have been act as statutory NHS bodies responsible for commissioning healthcare services for their local population across a range of services which will include elective hospital care and community services. CCGs have a duty to promote the involvement of individual patients, and their carers and representatives in their care and treatment and to ensure that health services are provided in an integrated way with social care services, where this will improve quality of services or reduce inequalities. The Bradford and Airedale locality consists of three CCGs; 1. Airedale, Wharfedale and Craven CCG (AWCCCG) 2. Bradford City CCG (BCCCG) 3. Bradford Districts CCG (BDCCG) Dementia in Primary Care It is important to realise that as well as commissioning services, CCGs are organisations made up of the general practices that provide dayQtoQday primary care in the community. And so, alongside this familiar role, as commissioners of dementia services, CCGs are in a position to work with people with dementia, their families and carers, health and social care organisations and the community sector to develop a new dementia landscape in which services are able to meet the needs of local communities whilst remaining fair and equitable. General Practitioners (GPs/family doctors) provide the majority of medical care for people with dementia (1) , and an adequate primary care response is essential to quality of life for people with dementia and their families (2) . The roles they undertake in Bradford and Airedale include: • Initial diagnosis Q Use of brief cognitive assessment tools such as the MiniQMental State Examination (MMSE) allow GPs to identify possible cases of dementia in primary care • Basic dementia screens performed at the time of presentation, usually within primary care. This generally comprises blood tests designed to exclude any other causes of cognitive impairment, and to assist the GP and colleagues in best managing the patient • Ensuring that the palliative care needs of people with dementia who are close to death are assessed and that the resulting information is communicated within the primary care team and with other health and social care staff. • General ongoing support for both patient and carer
Transcript of Section 5 - Primary Care. August 2014 Needs Assessments... · Section(5(*(Primary(Care(! ......

1
Section(5(*(Primary(Care(
!
Primary!Care!is!that!care!which!would!normally!represent!a!patient’s!first!point!of!contact!with!healthcare!
services!in!the!community.!In!the!UK!it!is!generally!considered!to!be!general!practices!and!the!services!they!
provide.!!Usually,!primary!care!services!refer!on!to!secondary!care!services!provided!by!hospital!trusts.!
Since!April!2013,!Clinical!Commissioning!Groups!(CCGs)!overseen!by!the!newly!formed!NHS!England,!have!
been! act! as! statutory! NHS! bodies! responsible* for* commissioning* healthcare* services* for* their* local*
population! across! a! range! of! services!which!will! include! elective!hospital( care! and! community( services.!!
CCGs!have!a!duty!to!promote!the!involvement!of!individual!patients,!and!their!carers!and!representatives!in!
their!care!and!treatment!and!to!ensure!that!health!services!are!provided!in!an!integrated!way!with!social!
care!services,!where!this!will!improve!quality!of!services!or!reduce!inequalities.!
!The!Bradford!and!Airedale!locality!consists!of!three!CCGs;!
1. Airedale,!Wharfedale!and!Craven!CCG!(AWCCCG)!
2. Bradford!City!CCG!(BCCCG)!
3. Bradford!Districts!CCG!(BDCCG)!
(Dementia(in(Primary(Care(
It! is! important! to! realise! that! as!well! as! commissioning! services,! CCGs! are!organisations!made!up!of! the!
general! practices! that!provide!dayQtoQday!primary! care! in! the! community.!And! so,! alongside! this! familiar!
role,! as! commissioners!of!dementia! services,!CCGs!are! in!a!position! to!work!with!people!with!dementia,!
their!families!and!carers,!health!and!social!care!organisations!and!the!community!sector!to!develop!a!new!
dementia!landscape!in!which!services!are!able!to!meet!the!needs!of!local!communities!whilst!remaining!fair!
and!equitable.!
General!Practitioners!(GPs/family!doctors)!provide!the!majority!of!medical!care!for!people!with!dementia!(1),!and!an!adequate!primary!care!response!is!essential!to!quality!of!life!for!people!with!dementia!and!their!
families!(2).!The!roles!they!undertake!in!Bradford!and!Airedale!include:!
• Initial!diagnosis!Q!Use!of!brief!cognitive!assessment!tools!such!as!the!MiniQMental!State!Examination!
(MMSE)!allow!GPs!to!identify!possible!cases!of!dementia!in!primary!care!
• Basic! dementia! screens! performed! at! the! time!of! presentation,! usually!within! primary! care.! This!
generally!comprises!blood!tests!designed!to!exclude!any!other!causes!of!cognitive!impairment,!and!
to!assist!the!GP!and!colleagues!in!best!managing!the!patient!
• Ensuring! that! the! palliative! care! needs! of! people! with! dementia! who! are! close! to! death! are!
assessed! and! that! the! resulting! information! is! communicated!within! the! primary! care! team! and!
with!other!health!and!social!care!staff.!
• General!ongoing!support!for!both!patient!and!carer!

2
The!point!at!which!a!diagnosis!is!made!in!primary!care!is!likely!to!be!the!start!of!a!period!in!which!greater!
demands!are!made!on! the!primary!and!secondary!healthcare! teams!and!also!on!social! care! (Rait),! and! the!
relationship!with!the!GP!and!GP!practice/staff!will!be!very!important!in!respect!of!both!dementia!and!the!
comorbidities!which!become!more!common!as!people!get!older.!
Research!has! identified! some!of! the! things! that! get! in! the!way!of!effective!primary! care! for!people!with!
dementia.! These! include! professionals! simply! not! understanding! the! importance! of! diagnosing! the!
condition!or!the!need!for!onQgoing!support!as!well!as!a!lack!of! information!for!people!with!dementia!and!
their!carers!about!the!condition!and!any!services!that!might!be!available!(2).!
!
Note:( *! The! CCGs! are! presented! here! in! turn,! outlining! key! demographic! information! and! dementia!
statistics!based!on!QoF!register!data!and!MATS!activity!figures.!Each!CCG!section!is!intended!to!be!viewed!
as!a!discrete!section!and!as!such!there!is!repetition!in!each.!
!
Note(*(Craven(
A!significant!issue!in!respect!of!the!geographical!area!covered!by!this!report!is!that!of!the!Craven!area,!and!
the! fact! that,! although! it! forms! part! of! AWCCCG,! it! is! not! part! of! the! BMDC! area.! As! such,! Craven! falls!
outside!of!the!responsibility!of!BMDC!and!the!Public!Health!Department,!being!covered!by!North!Yorkshire!
County!Council!and!the!Public!Health!Department!contained!therein.!
Following!discussions!with! the!AWCCCG!GP!Mental!Health! lead!and! the!Public!Health!Consultant!Mental!
Health!lead!in!North!Yorkshire!County!Council,!it!was!agreed!that:!
• It!was!felt!appropriate!to!limit!this!work!to!the!Bradford!Local!Authority!area!
• When!the!report!is!completed!it!will!be!discussed!with!the!Public!Health!Consultant!Mental!Health!
lead!in!North!Yorkshire!county!Council!to!facilitate!its!development!in!the!Craven!area.!
• In! instances!where!Craven!data!are!provided! in!the!same!packet!as!BMDC!area!data,!they!will!be!
included!alongside!given!no!further!data!sourcing!was!undertaken!
!
For!the!purposes!of!this!report,!the!following!annotation!will!be!used!
!
AWCCCG:!! Airedale,!Wharfedale!and!Craven!CCG,!encompassing!the!entire!CCG!
AWCCG:( The!proportion!of!the!CCG!lying!within!Local!Authority!boundaries( (
(
Note( *( Further( analyses( based( on( separation( of( the( two( elements( of( the( CCG( will( be( undertaken(
according(to(the(wishes(of(partners.(

3
Airedale,(Wharfedale(and(Craven(Clinical(Commissioning(Group!
!
Key(Statistics(
• The! CCG’s! total! primary! care! registered! population! (taken! from! the!Attribution!Data! Set! in! April!
2011)!is!156,000!
• The! CCG's! registered! patients! live! in! 2! different! Local! Authorities,! Bradford! and! Craven! district!
Council!!
• The!CCG's!main!Local!Authority!is!Bradford.!67%!of!the!CCG's!population!live!there.!
• For!the!CCG's!main!Local!Authority,!Bradford,!the!CCG!accounts!for!104,500!(19%)!of!its!population.!
• This!CCG's!main!provider!is!Airedale!NHS!Foundation!Trust,!which!accounts!for!44,322!(79%)!of!its!
admissions.!These!represent!73%!of!that!provider's!total!admissions.!!
• 9%!of!admissions!go!to!BTHFT!and!5%!to!LTHT!
!
Dementia(
• The!CCG!has!1106! registered!patients!with!a!diagnosis!of!dementia,!0.71%!of!the!total!registered!
population!
• The! Airedale! &! Wharfedale! part! of! the! CCG! has! 672! registered! patients! with! a! diagnosis! of!
dementia,!0.64%!of!its!total!registered!population!
• Table! 1! below! set! out! age! stratified! population! projections! for! AWCCCG! up! to! 2021.! There! is! a!
projected!rise!in!the!60+!population!of!almost!6,000!from!2013!to!2021.(
(
Table(1((Age(Stratified((Population(Projections,(Airedale,(Wharfedale(and(Craven(CCG,(2011*2021(
Age 2011 2012 2013 2014 2015 2016 2017 2018 2019 2020 2021 Rise 2013-20210%9 18,887 19,256 19,611 19,990 20,318 20,555 20,795 20,960 21,145 21,312 21,537 1,92610%19 19,502 19,483 19,495 19,473 19,526 19,613 19,709 19,870 19,988 20,188 20,363 86820%29 15,687 15,901 16,109 16,328 16,514 16,765 16,974 17,108 17,236 17,268 17,196 1,08730%39 18,226 18,148 18,203 18,316 18,460 18,646 18,846 19,090 19,216 19,301 19,471 1,26740%49 23,326 23,421 23,389 23,267 23,144 22,970 22,696 22,495 22,415 22,376 22,266 ,1,12350%59 21,181 21,516 21,793 22,077 22,406 22,610 22,851 22,970 23,155 23,316 23,500 1,70660%69 19,469 19,970 20,387 20,715 21,069 21,448 21,204 21,245 21,425 21,682 22,034 1,64770%79 12,817 12,753 12,823 12,947 12,984 13,082 13,736 14,223 14,651 14,990 15,387 2,56480%89 7,636 7,672 7,676 7,772 7,915 8,042 8,228 8,432 8,551 8,683 8,705 1,029 60+0Rise90+ 1,597 1,708 1,821 1,922 1,993 2,073 2,146 2,211 2,300 2,406 2,523 702 5,942Total 158,328 159,828 161,309 162,807 164,328 165,803 167,185 168,605 170,081 171,522 172,982 11,673
!
Note:(
The!CCG's! geographical! area! is!made!up!of! 97! LSOAs.! The! total! population!of! these! LSOAs! is!162,737! of!
which!153,797!are!registered!with!this!CCG's!practices.!The!total!registered!population!of!the!CCG!practices!
is!155,565.!
Therefore,!there!are!8,941!people!who!are!registered!with!other!CCG's!practices!but!live!in!this!CCG's!area.!
But! there! are! 1,768! of! this! CCG's! registered! population! who! live! in! other! CCG's! area! of! geographical!

4
responsibility.! This! gives! a! ‘containment! rate’! (i.e.! percentage! of! registered! patients!who! live!within! the!
geographical!boundary!of!the!CCG)!of!98.9%!
(
Primary(Care(Services(for(Dementia(
• The!CCG!has!17!general!practices,!based!on!those!with!a!registered!population!in!April!2011!
• The!Airedale!&!Wharfedale!part!of!the!CCG!has!12!general!practices!
• All!patents!receive!general!medical!services!as!specified! in!the!General!Medical!Services/Personal!
Medical!Services!contracts!
• Dementia!Diagnoses!and!Reviews!are!provided!under!the!Quality!and!Outcomes!Framework!
• The! CCG! has! appointed! a! Clinical! Lead! for! Mental! Health,! Dr! Brendan! Kennedy,! who! provides!
leadership,! expertise! and! advocacy! for! patients!with! dementia! through! partnership!working! and!
representation!at!strategic!committees!
• CCG!practices! use! the! SystmOne!electronic!medical! record! system! to! record! information! in! both!
people!with!dementia!and!their!carers!as!part!of!ongoing!work!to!secure!effective!integrated!care!
for!these!people.!
!
Figure! 1! below! shows! AWCCCG! within! its! geographical! boundary,! with! the! changing! containment! rates!
shown!across!various!geographical!areas!both!within!and!without!this!boundary.!This!gives!an!indication!of!
the! “bleed”!of! registered!patients! across! the!CCG!boundaries! (as! set! out! in! the! legend!below).! The! gold!
stars!within!the!CCG!boundary!indicate!the!geographical!location!of!the!CCG’s!general!practices.!
(
(
(
(
(
(
(
(
(
(
(
(
(
(
(
(

5
Figure(1(((((((Geographical(Location(of(Airedale,(Wharfedale(and(Craven(CCG(and(Practices,(2013(
(
Practice(Level(Prevalence(Rates(for(Dementia(
This!section!sets!out,!by!general!practice,!the!numbers!of!patients!who!are!on!the!QoF!register!as!having!a!
diagnosis! of! dementia.! These! numbers! are! also! represented! as! a! prevalence/proportion! of! the! overall!
practice!population,!with!95%!confidence!intervals!added.!The!confidence!intervals!are!included!in!order!to!
allow! for! the!variation!and!chance! that! can!occur!according! to!practice! size,!where! smaller!practices!are!
more!prone! to! the! impact! of! chance.! It! is! reasonable! to! assume! that! there! is! a! 19/20!probability! that! a!
‘true’! or! reasonable!estimate!of! each!practice!prevalence! lies! somewhere!between! the!upper! and! lower!
confidence!limits!shown.!

6
Numbers!of!patients!with!dementia!are!presented!as!a!proportion!of!the!overall!practice!population!as!this!
reflects!the!national!approach!to!measuring!prevalence!as!in!the!recently!published!Department!of!Health!
Dementia!Map!(3).!
It! is! important!to!recognise!that!this!section! is!not!a!performance!management!tool!and!as!such!practice!
identities! are! anonymised.! ! It! is! intended! that! this! section!will! inform! those! involved! in! primary! care! in!
respect! of! heterogeneity! of! diagnosis! rates,! it! is! not! intended! to! be! used! to! facilitate! interQpractice!
comparisons.! Given! this! important! note,! it! was! decided! not! to! age! standardise! the! practices! as! the!
intention! is! to! present! the! reality! of! diagnostic! activity,! and! age! standardising! in! smaller! practice!
populations!would!have!presented!methodological!difficulties.!!
!
There!are!a!number!of!important!caveats!to!bear!in!mind!at!this!point:!
• Cannot!include!mortalities!who!will!be!taken!off!the!list!
• This!analysis!represents!a!snapshot!May!have!already!picked!up!most!
• Likely!to!generate!other!analytical!pieces!of!work!
• Recommend!clinical!audit!
!
Table!2!and!Figure!2!below!set!out!the!diagnostic!prevalence!of!dementia,!at!practice!level,!for!the!Airedale!
and! Wharfedale! component! of! AWCCCG,! with! Table! 3! and! Figure! 3! providing! the! same! for! AWCCG!
Diagnostic!prevalence!here! is! represented!by!diagnoses!recorded!on!the!Primary!Care!QoF!Register!as!at!
November!2013,!with!the!total!practice!population!as!denominator.!95%!confidence!limits!are!calculated!in!
addition,!as!explained!above.!!
!
Key(Observations(
• The!overall!prevalence!of!dementia!in!AWCCCG!is!0.71%,!with!95%!limits!from!0.67%!to!0.75%!
• The!overall! prevalence!of! dementia! in! the!AWCCG!area! is!0.64%,!with!95%! limits! from!0.59%! to!
0.69%!!
• The!prevalence!for!both!AWCCCG!and!the!AWCCG!area!is!higher!than!in!the!three!comparators!of!
England,!UK!and!North!of!England!Commissioning!Group,!with!confidence!limits!suggesting!that!this!
is!a!statistically!significant!increase!for!both!
• There! is!notable!heterogeneity!across!practices!for!both!AWCCCG!and!AWCCG!with!suggestion!of!
statistically!significant!difference!between!many!practices!
• There!is!one!notable!outlier!at!the!lower!diagnostic!extremity!for!both!AWCCCG!and!AWCCG!

7
Table(2(((Prevalence(of(Dementia(Diagnosis(as(%,(Airedale,(Wharfedale(and(Craven(CCG,(2013(
Organisation ID Numerator Denominator % 95% LCL 95% UCL Centile
AWCCCG 1106 155635 0.71% 0.67% 0.75% 90
England N/A 291677 55068625 0.53% N/A N/A N/A
UK N/A 358577 65266344 0.55% N/A N/A N/A
North of England Commissioning Group N/A 91314 15694547 0.58% N/A N/A 100
1 51 4098 1.24% 0.94% 1.63% 96
2 54 4525 1.19% 0.91% 1.55% 95
3 129 12169 1.06% 0.89% 1.26% 93
4 132 13061 1.01% 0.85% 1.20% 91
5 78 9225 0.85% 0.68% 1.06% 85
6 89 10644 0.84% 0.68% 1.03% 85
7 91 11663 0.78% 0.64% 0.96% 82
8 49 6539 0.75% 0.57% 0.99% 80
9 84 13254 0.63% 0.51% 0.78% 69
10 20 3209 0.62% 0.40% 0.96% 68
11 85 13918 0.61% 0.49% 0.75% 67
12 67 11229 0.60% 0.47% 0.76% 65
13 57 9788 0.58% 0.45% 0.75% 63
14 65 12614 0.52% 0.41% 0.66% 55
15 12 2928 0.41% 0.23% 0.72% 40
16 37 9330 0.40% 0.29% 0.55% 38
17 6 7441 0.08% 0.04% 0.17% 3 !

8
Table(3((((((((Prevalence(of(Dementia(Diagnosis(as(%,(Airedale(and(Wharfedale(CCG(Area,(2013(
Organisation ID Numerator Denominator % 95% LCL 95% UCL Centile
AWCCG N/A 672 104562 0.64% 0.59% 0.69% N/A
England N/A 291677 55068625 0.53% 0.53% 0.53% N/A
UK N/A 358577 65266344 0.55% 0.55% 0.55% N/A
North of England Commissioning Group N/A 91314 15694547 0.58% 0.58% 0.58% 100
1 54 4525 1.19% 0.91% 1.55% 95
2 132 13061 1.01% 0.85% 1.20% 91
3 89 10644 0.84% 0.68% 1.03% 85
4 49 6539 0.75% 0.57% 0.99% 80
5 84 13254 0.63% 0.51% 0.78% 69
6 20 3209 0.62% 0.40% 0.96% 68
7 67 11229 0.60% 0.47% 0.76% 65
8 57 9788 0.58% 0.45% 0.75% 63
9 65 12614 0.52% 0.41% 0.66% 55
10 12 2928 0.41% 0.23% 0.72% 40
11 37 9330 0.40% 0.29% 0.55% 38
12 6 7441 0.08% 0.04% 0.17% 3 !!
!

9
!
Figure'2''''''''''''''''''''''''''''''''''''''Prevalence'of'Dementia'Diagnosis'as'%,'with'95%'C.I.,'Airedale,'Wharfedale'and'Craven'CCG,'2013'
0.00%
0.20%
0.40%
0.60%
0.80%
1.00%
1.20%
1.40%
1.60%
1.80%
1 2 3 4 5 6 7 8 9 10 11 12 13 14 15 16 17
Practice
% w
ith
Dem
enti
a D
iagn
osis
!

10
Figure'3'''''''''''''''''''''''''''''''''''''Prevalence'of'Dementia'Diagnosis'as'%,'with'95%'C.I.,'Airedale'and'Wharfedale'CCG'Area,'2013'
0.00%
0.20%
0.40%
0.60%
0.80%
1.00%
1.20%
1.40%
1.60%
1.80%
1 2 3 4 5 6 7 8 9 10 11 12
Practice
% w
ith
Dem
entia
Dia
gnos
is
!!
!

Memory'Assessment'and'Treatment'Services'Referral'Rates'
This%section%provides%an%over%view%of%the%extent%to%which%people%in%the%CCG%area%who%have%dementia%are%
referred%to%a%Memory%Assessment%and%Treatment%Services%(MATS).%
%
Note:%
• Section%6b%covers%Memory%Assessment%and%treatment%Services%in%detail%
• Comparison%with%other%CCGs%in%the%District%is%provided%in%Section%6b%
• MATS%data%are%not%currently%available%for%Craven%so%what%is%presented%here%is%for%AWCCG%only%
%
Tables%4%and%5%and%Figures%4%and%5%demonstrate%how%both%numbers%of%referrals%and%the%rate%of%referral%per%
1,000%registered%people%have%changed%since%2005.%
'
Key'Observations'
• Both%numbers%and%rates%of%referral%have%risen%steadily%from%2005%up%to%2012.%%
• There%is%a%notable%drop%off%in%2013%
• There%was%a%sharp%upturn%in%2010%which%may%reflect%changes%to%data%recording%processes%relating%to%
the%introduction%of%the%SystmOne%patient%database%in%primary%care%
%
Table'4'''''''''Referrals'to'Memory'Assessment'and'Treatment'Services,'AWCCG'2005A2013'
Referrals to MATS
2005-2006 5
2006-2007 9
2007-2008 13
2008-2009 27
2009-2010 38
2010-2011 47
2011-2011 106
2012-2013 104
Grand Total 349%
%
%
%
%

12
%
Figure'4''''Referrals'to'Memory'Assessment'and'Treatment'Services,'AWCCG'2005A2013'
%
0
20
40
60
80
100
120
2005-2006 2006-2007 2007-2008 2008-2009 2009-2010 2010-2011 2011-2011 2012-2013
Num
ber
Year %
%
%
Table'5''''Rates'of'Referrals'to'Memory'Assessment'and'Treatment'Services,'AWCCG'2005A2013'
Referrals to MATS - Rate/1,000
2005-2006 0.0
2006-2007 0.1
2007-2008 0.1
2008-2009 0.3
2009-2010 0.4
2010-2011 0.5
2011-2012 1.1
2012-2013 1.0%
%
%
%
%
%
%

13
%
Figure'5''Rates'of'Referrals'to'Memory'Assessment'and'Treatment'Services,'AWCCG'2005A2013'
%
0.0
0.2
0.4
0.6
0.8
1.0
1.2
2005-2006 2006-2007 2007-2008 2008-2009 2009-2010 2010-2011 2011-2012 2012-2013
Rat
e pe
r 1,0
00
Year
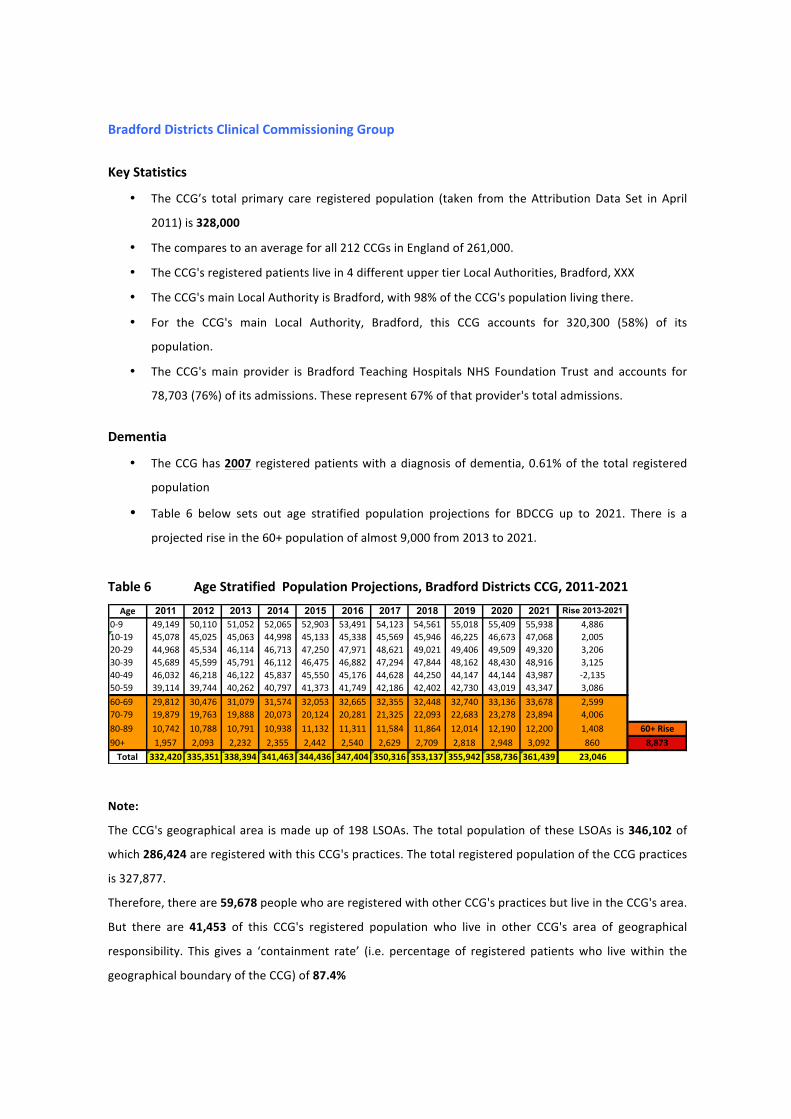
Bradford'Districts'Clinical'Commissioning'Group'
%Key'Statistics'
• The% CCG’s% total% primary% care% registered% population% (taken% from% the%Attribution%Data% Set% in% April%
2011)%is%328,000%
• The%compares%to%an%average%for%all%212%CCGs%in%England%of%261,000.%
• The%CCG's%registered%patients%live%in%4%different%upper%tier%Local%Authorities,%Bradford,%XXX%
• The%CCG's%main%Local%Authority%is%Bradford,%with%98%%of%the%CCG's%population%living%there.%
• For% the% CCG's% main% Local% Authority,% Bradford,% this% CCG% accounts% for% 320,300% (58%)% of% its%
population.%
• The% CCG's%main% provider% is% Bradford% Teaching% Hospitals% NHS% Foundation% Trust% and% accounts% for%
78,703%(76%)%of%its%admissions.%These%represent%67%%of%that%provider's%total%admissions.%
'Dementia'
• The%CCG%has%2007% registered%patients%with%a%diagnosis%of%dementia,%0.61%%of%the%total%registered%
population%
• Table% 6% below% sets% out% age% stratified% population% projections% for% BDCCG% up% to% 2021.% There% is% a%
projected%rise%in%the%60+%population%of%almost%9,000%from%2013%to%2021.'
%
Table'6'''''''''''''Age'Stratified''Population'Projections,'Bradford'Districts'CCG,'2011A2021'
Age 2011 2012 2013 2014 2015 2016 2017 2018 2019 2020 2021 Rise 2013-20210"9 49,149 50,110 51,052 52,065 52,903 53,491 54,123 54,561 55,018 55,409 55,938 4,88610"19 45,078 45,025 45,063 44,998 45,133 45,338 45,569 45,946 46,225 46,673 47,068 2,00520"29 44,968 45,534 46,114 46,713 47,250 47,971 48,621 49,021 49,406 49,509 49,320 3,20630"39 45,689 45,599 45,791 46,112 46,475 46,882 47,294 47,844 48,162 48,430 48,916 3,12540"49 46,032 46,218 46,122 45,837 45,550 45,176 44,628 44,250 44,147 44,144 43,987 "2,13550"59 39,114 39,744 40,262 40,797 41,373 41,749 42,186 42,402 42,730 43,019 43,347 3,08660"69 29,812 30,476 31,079 31,574 32,053 32,665 32,355 32,448 32,740 33,136 33,678 2,59970"79 19,879 19,763 19,888 20,073 20,124 20,281 21,325 22,093 22,683 23,278 23,894 4,00680"89 10,742 10,788 10,791 10,938 11,132 11,311 11,584 11,864 12,014 12,190 12,200 1,408 60+'Rise90+ 1,957 2,093 2,232 2,355 2,442 2,540 2,629 2,709 2,818 2,948 3,092 860 8,873Total 332,420 335,351 338,394 341,463 344,436 347,404 350,316 353,137 355,942 358,736 361,439 23,046
'
Note:'
The%CCG's%geographical%area% is%made%up%of%198%LSOAs.%The%total%population%of% these%LSOAs% is%346,102%of%
which%286,424%are%registered%with%this%CCG's%practices.%The%total%registered%population%of%the%CCG%practices%
is%327,877.%%
Therefore,%there%are%59,678%people%who%are%registered%with%other%CCG's%practices%but%live%in%the%CCG's%area.%
But% there% are% 41,453% of% this% CCG's% registered% population% who% live% in% other% CCG's% area% of% geographical%
responsibility.% This% gives% a% ‘containment% rate’% (i.e.% percentage% of% registered% patients%who% live%within% the%
geographical%boundary%of%the%CCG)%of%87.4%%

15
Primary'Care'Services'for'Dementia'
• The%CCG%has%42%practices,%based%on%those%with%a%registered%population%in%April%2011.%
• All%patents%receive%general%medical%services%as%specified% in%the%General%Medical%Services/Personal%
Medical%Services%contracts%
• Dementia%Diagnoses%and%Reviews%are%provided%under%the%Quality%and%Outcomes%Framework%
• The% CCG% has% appointed% a% Clinical% Lead% for% Mental% Health,% Dr% Sara% Humphrey,% who% provides%
leadership,% expertise% and% advocacy% for% patients%with% dementia% through% partnership%working% and%
representation%at%strategic%committees%
• The% CCG% has% a% clinical% board%member% responsible% for% mental% health% and% dementia,% Dr%Waheed%
Hussain,%and%have%also%appointed%a%GP%with%special%interest%in%older%people%to%be%a%'clinical%specialty%
lead,%again%Dr%Sara%Humphrey%
• CCG%practices% use% the% SystmOne%electronic%medical% record% system% to% record% information% in% both%
people%with%dementia%and%their%carers%as%part%of%ongoing%work%to%secure%effective%integrated%care%
for%these%people.%
%
Figure%6%below%shows%BDCCG%within%its%geographical%boundary,%with%the%changing%containment%rates%shown%
across% various% geographical% areas%both%within% and%without% this% boundary.% This% gives% an% indication%of% the%
“bleed”% of% registered% patients% across% the% CCG% boundaries% (as% set% out% in% the% legend% below).% The% silver%
inverted% triangles% within% the% CCG% boundary% indicate% the% geographical% location% of% the% CCG’s% general%
practices.%
'
'
'
'
'
'
'
'
'
'
'
'
'
'
'
'

16
Figure'6'''''''''''''''Geographical'Location'of'Bradford'Districts'CCG'and'Practices,'2013'
%%
Practice'Level'Prevalence'Rates'for'Dementia'
This%section%sets%out,%by%general%practice,%the%numbers%of%patients%who%are%on%the%QoF%register%as%having%a%
diagnosis% of% dementia.% These% numbers% are% also% represented% as% a% prevalence/proportion% of% the% overall%
practice%population,%with%95%%confidence%intervals%added.%The%confidence%intervals%are%included%in%order%to%
allow% for% the%variation%and%chance% that% can%occur%according% to%practice% size,%where% smaller%practices%are%
more%prone% to% the% impact% of% chance.% It% is% reasonable% to% assume% that% there% is% a% 19/20%probability% that% a%
‘true’% or% reasonable%estimate%of% each%practice%prevalence% lies% somewhere%between% the%upper% and% lower%
confidence%limits%shown.%

17
Numbers%of%patients%with%dementia%are%presented%as%a%proportion%of%the%overall%practice%population%as%this%
reflects%the%national%approach%to%measuring%prevalence%as%in%the%recently%published%Department%of%Health%
Dementia%Map%(3).%
It% is% important%to%recognise%that%this%section% is%not%a%performance%management%tool%and%as%such%practice%
identities% are% anonymised.% % It% is% intended% that% this% section%will% inform% those% involved% in% primary% care% in%
respect% of% heterogeneity% of% diagnosis% rates,% it% is% not% intended% to% be% used% to% facilitate% interfpractice%
comparisons.% Given% this% important% note,% it% was% decided% not% to% age% standardise% the% practices% as% the%
intention% is% to% present% the% reality% of% diagnostic% activity,% and% age% standardising% in% smaller% practice%
populations%would%have%presented%methodological%difficulties.%%
%
There%are%a%number%of%important%caveats%to%bear%in%mind%at%this%point:%
• Cannot%include%mortalities%who%will%be%taken%off%the%list%
• This%analysis%represents%a%snapshot%May%have%already%picked%up%most%
• Likely%to%generate%other%analytical%pieces%of%work%
• Recommend%clinical%audit%
%
Table% 7% and% Figure% 7% below% set% out% the%diagnostic% prevalence%of% dementia,% at% practice% level,% for% BDCCG.%
Diagnostic%prevalence%here% is% represented%by%diagnoses%recorded%on%the%Primary%Care%QoF%Register%as%at%
November%2013,%with%the%total%practice%population%as%denominator.%95%%confidence%limits%are%calculated%in%
addition,%as%explained%above.%%
%
Key'Observations'
• The%overall%prevalence%of%dementia%in%BDCCG%is%0.61%,%with%95%%limits%from%0.58%%to%0.64%%
• The% prevalence% is% higher% than% in% the% three% comparators% of% England,% UK% and% North% of% England%
Commissioning% Group,% with% confidence% limits% suggesting% that% this% is% a% statistically% significant%
increase%
• There% is% moderate% heterogeneity% across% practices% with% suggestion% of% statistically% significant%
difference%between%some%practices%at%the%extremes%of%variation%
• Much%of%the%observed%variation%between%practices%is%not%statistically%significant%
• There%is%one%notable%outlier%at%the%upper%diagnostic%extremity%

18
Table'7''''''''''''''''''Prevalence'of'Dementia'Diagnosis'as'%,'Bradford'Districts'CCG','2013'
Organisation ID Numerator Denominator % 95% LCL 95% UCL Centile
Bradford Districts CCG N/A 2007 330270 0.61% 0.58% 0.64% 2
England N/A 291677 55068625 0.53% N/A N/A N/A
UK N/A 358577 65266344 0.55% N/A N/A N/A
North of England Commissioning Group N/A 91314 15694547 0.58% N/A N/A 100
West Yorkshire Local Area Team N/A 12006 2259773 0.53% N/A N/A 37
1 103 3342 3.08% 2.53% 3.74% 99
2 48 3765 1.27% 0.96% 1.68% 96
3 85 7562 1.12% 0.91% 1.38% 94
4 60 6799 0.88% 0.68% 1.13% 87
5 76 9081 0.84% 0.68% 1.06% 85
6 63 8059 0.78% 0.61% 1.00% 82
7 51 6579 0.78% 0.59% 1.02% 81
8 37 4923 0.75% 0.54% 1.03% 80
9 77 10721 0.72% 0.58% 0.90% 77
10 63 8783 0.72% 0.56% 0.92% 77
11 83 11612 0.71% 0.57% 0.88% 77
12 77 10825 0.71% 0.57% 0.89% 76
13 69 9848 0.70% 0.55% 0.88% 75
14 56 8035 0.70% 0.54% 0.91% 75
15 38 5497 0.69% 0.50% 0.95% 75
16 72 10496 0.69% 0.55% 0.87% 74
17 82 12111 0.68% 0.55% 0.84% 73
18 50 8125 0.62% 0.47% 0.82% 67
19 60 9814 0.61% 0.47% 0.78% 67
20 18 3021 0.60% 0.38% 0.95% 65
21 22 3898 0.56% 0.37% 0.85% 61
22 40 7200 0.56% 0.41% 0.76% 60
23 134 25090 0.53% 0.45% 0.63% 58
24 34 6535 0.52% 0.37% 0.73% 56
25 36 7057 0.51% 0.37% 0.71% 54
26 34 6841 0.50% 0.36% 0.70% 53
27 55 11072 0.50% 0.38% 0.65% 52
28 39 8046 0.48% 0.35% 0.66% 51
29 56 12155 0.46% 0.35% 0.60% 47
30 41 9191 0.45% 0.33% 0.61% 45
31 37 8346 0.44% 0.32% 0.61% 45
32 29 6619 0.44% 0.31% 0.63% 44
33 31 7179 0.43% 0.30% 0.61% 43
34 32 7752 0.41% 0.29% 0.58% 41
35 30 8231 0.36% 0.25% 0.51% 34
36 12 3735 0.32% 0.18% 0.56% 28
37 32 11066 0.29% 0.21% 0.41% 24
38 15 5614 0.27% 0.16% 0.44% 21
39 12 4758 0.25% 0.14% 0.44% 19
40 14 7582 0.18% 0.11% 0.30% 11
41 <5 3305 #VALUE! 0.05% 0.33% 6 %

Figure'7''''''''''''''''''''''''''''''''''''''''''''''''''''''''''''''''''''''Prevalence'of'Dementia'Diagnosis'as'%,'Bradford'Districts'CCG,'2013'
'
0.00%
0.50%
1.00%
1.50%
2.00%
2.50%
3.00%
3.50%
4.00%
1 2 3 4 5 6 7 8 9 10 11 12 13 14 15 16 17 18 19 20 21 22 23 24 25 26 27 28 29 30 31 32 33 34 35 36 37 38 39 40 41
Practice
% w
ith
Dem
entia
Dia
gnos
is

Memory'Assessment'and'Treatment'Services'Referral'Rates'
This%section%provides%an%over%view%of%the%extent%to%which%people%in%the%CCG%area%who%have%dementia%are%
referred%to%a%Memory%Assessment%and%Treatment%Services%(MATS).%
%
Note:%
• Section%6b%covers%Memory%Assessment%and%treatment%Services%in%detail%
• Comparison%with%other%CCGs%in%the%District%is%provided%in%Section%6b%
%
Tables%8%and%8%and%Figures%9%and%9%demonstrate%how%both%numbers%of%referrals%and%the%rate%of%referral%per%
1,000%registered%people%have%changed%since%2005.%
'
Key'Observations'
• Both%numbers%and%rates%of%referral%have%risen%steadily%from%2005%up%to%2013.%%
• There%is%a%suggestion%that%the%rate%of%rise%has%tailed%off%slightly%in%2012O13%%
• There%was%an%upturn%in%2010%which%may%reflect%changes%to%data%recording%processes%relating%to%the%
introduction%of%the%SystmOne%patient%database%in%primary%care%
%
%
Table'8''''''''Referrals'to'Memory'Assessment'and'Treatment'Services,'BDCCG'2005B2013'
Referrals to MATS
2005-2006 18
2006-2007 41
2007-2008 81
2008-2009 140
2009-2010 194
2010-2011 330
2011-2011 493
2012-2013 592
Grand Total 1889%
%
%
%
%
%

21
Figure'8'''''''Numbers'of'Referrals'to'Memory'Assessment'and'Treatment'Services,'BDCCG'2013'
0
100
200
300
400
500
600
700
2005-2006 2006-2007 2007-2008 2008-2009 2009-2010 2010-2011 2011-2011 2012-2013
Year
Number
%
%
%
Table'9''''''''''''Rates'of'Referrals'to'Memory'Assessment'and'Treatment'Services,'BDCCG'2013'
Referrals to MATS - Rate/1,000
2005-2006 0.1
2006-2007 0.1
2007-2008 0.2
2008-2009 0.4
2009-2010 0.6
2010-2011 1.0
2011-2012 1.5
2012-2013 1.8%
%
%
%
%
%
%
%
%
%

22
Figure'9''''''''''Rates'of'Referrals'to'Memory'Assessment'and'Treatment'Services,'BDCCG'2013'
0.0
0.2
0.4
0.6
0.8
1.0
1.2
1.4
1.6
1.8
2.0
2005-2006 2006-2007 2007-2008 2008-2009 2009-2010 2010-2011 2011-2012 2012-2013
Year
Rate
per
1,0
00

23
Bradford'City'Clinical'Commissioning'Group'
%
Key'Statistics'
• The%CCG’s% total% registered%population% (taken% from%the%Attribution%Data%Set% in%April%
2011)%is%118,000%
• This%compares%to%an%average%for%all%212%CCGs%in%England%of%261,000%
• This% CCG's% registered% patients% all% live% in% one% upper% tier% Local% Authority,% this% Local%
Authority%is%Bradford%
• For%the%CCG's%main%Local%Authority,%Bradford,%the%CCG%accounts%for%117,300%(21%)%of%
its%population.%
• The%CCG's%main%provider% is%Bradford%Teaching%Hospitals%NHS%Foundation%Trust%and%
accounts%for%25,338%89%)%of% its%admissions.%These%represent%22%%of%that%provider's%
total%admissions.%
'
Dementia'
• The%CCG%has%281%registered%patients%with%a%diagnosis%of%dementia,%0.24%%of%the%total%
registered%population%
• Table%x%below%sets%out%age%stratified%population%projections%for%BCCCG%up%to%2021.%
There%is%a%projected%rise%in%the%60+%population%of%1,153%from%2013%to%2021.'
'
Table'10''''''''Age'Stratified''Population'Projections,'Bradford'City'CCG,'2011B2021'Age 2011 2012 2013 2014 2015 2016 2017 2018 2019 2020 2021 Rise 2013-2021
0%9 15,409 15,719 16,017 16,339 16,595 16,788 16,978 17,111 17,241 17,362 17,522 1,50510%19 13,081 13,057 13,078 13,060 13,120 13,158 13,231 13,349 13,392 13,499 13,604 52620%29 17,749 18,016 18,265 18,511 18,713 18,985 19,205 19,337 19,468 19,487 19,385 1,12030%39 13,281 13,282 13,350 13,448 13,559 13,676 13,776 13,912 14,003 14,090 14,245 89540%49 8,270 8,306 8,278 8,211 8,144 8,061 7,947 7,870 7,864 7,898 7,903 ,37550%59 6,164 6,262 6,343 6,427 6,522 6,582 6,651 6,686 6,737 6,784 6,836 49360%69 3,564 3,638 3,711 3,759 3,832 3,920 3,881 3,895 3,927 3,973 4,037 32670%79 2,658 2,640 2,655 2,684 2,695 2,711 2,859 2,977 3,060 3,126 3,203 54880%89 1,316 1,321 1,321 1,337 1,363 1,386 1,419 1,454 1,470 1,487 1,491 170 60+0Rise90+ 249 266 284 300 311 323 335 345 359 375 393 109 1,153Total 81,741 82,508 83,302 84,075 84,854 85,591 86,283 86,935 87,522 88,081 88,619 5,317 '
'
Note:'
This%CCG's%geographical%area%is%made%up%of%41%LSOAs.%The%total%population%of%these%LSOAs%is%
91,891% of% which% 60,676% are% registered% with% this% CCG's% practices.% The% total% registered%
population%of%the%CCG%practices%is%117,990.%

24
Therefore,%there%are%31,215%people%who%are%registered%with%other%CCG's%practices%but%live%in%
this%CCG's%area.%But% there%are%57,314%of% this%CCG's% registered%population%who% live% in%other%
CCG's%area%of%geographical%responsibility.%
This% gives% a% ‘containment% rate’% (i.e.% percentage% of% registered% patients%who% live%within% the%
geographical%boundary%of%the%CCG)%of%51.4%.%
'
Primary'Care'Services'for'Dementia'
• This%CCG%has%29%practices,%based%on%those%with%a%registered%population%in%April%2011.%
• All% patents% receive% general% medical% services% as% specified% in% the% General% Medical%
Services/Personal%Medical%Services%contracts%
• Dementia% Diagnoses% and% Reviews% are% provided% under% the% Quality% and% Outcomes%
Framework%
• The%CCG%has%appointed%a%Clinical% Lead% for%Mental%Health,%Dr%Sara%Humphrey,%who%
provides% leadership,% expertise% and% advocacy% for% patients% with% dementia% through%
partnership%working%and%representation%at%strategic%committees%
• The%CCG%has%a%clinical%board%member%responsible% for%mental%health%and%dementia,%
Dr%Waheed% Hussain,% and% have% also% appointed% a% GP% with% special% interest% in% older%
people%to%be%a%'clinical%specialty%lead,%again%Dr%Sara%Humphrey%
• CCG% practices% use% the% SystmOne% electronic% medical% record% system% to% record%
information%in%both%people%with%dementia%and%their%carers%as%part%of%ongoing%work%
to%secure%effective%integrated%care%for%these%people.%
%
Figure% 10% below% shows% BDCCG% within% its% geographical% boundary,% with% the% changing%
containment% rates% shown% across% various% geographical% areas% both% within% and% without% this%
boundary.% This% gives% an% indication% of% the% “bleed”% of% registered% patients% across% the% CCG%
boundaries% (as% set% out% in% the% legend% below).% The% green% stars% within% the% CCG% boundary%
indicate%the%geographical%location%of%the%CCG’s%general%practices.%
'
%
%
'
'
'
'

25
Figure'10''''''''''Geographical'Location'of'Bradford'City'CCG'and'Practices,'2013'
%
'
Practice'Level'Prevalence'Rates'for'Dementia'
This% section% sets% out,% by% general% practice,% the% numbers% of% patients% who% are% on% the% QoF%
register% as% having% a% diagnosis% of% dementia.% These% numbers% are% also% represented% as% a%
prevalence/proportion% of% the% overall% practice% population,% with% 95%% confidence% intervals%
added.%The%confidence%intervals%are%included%in%order%to%allow%for%the%variation%and%chance%
that% can% occur% according% to% practice% size,% where% smaller% practices% are%more% prone% to% the%
impact%of%chance.%It%is%reasonable%to%assume%that%there%is%a%19/20%probability%that%a%‘true’%or%
reasonable% estimate% of% each% practice% prevalence% lies% somewhere% between% the% upper% and%
lower%confidence%limits%shown.%

26
Numbers% of% patients%with% dementia% are% presented% as% a% proportion% of% the% overall% practice%
population%as%this%reflects%the%national%approach%to%measuring%prevalence%as%in%the%recently%
published%Department%of%Health%Dementia%Map%(3).%
It%is%important%to%recognise%that%this%section%is%not%a%performance%management%tool%and%as%
such% practice% identities% are% anonymised.% % It% is% intended% that% this% section%will% inform% those%
involved%in%primary%care%in%respect%of%heterogeneity%of%diagnosis%rates,%it%is%not%intended%to%
be%used% to% facilitate% interOpractice% comparisons.%Given% this% important%note,% it%was%decided%
not% to%age%standardise% the%practices%as% the% intention% is% to%present% the%reality%of%diagnostic%
activity,% and% age% standardising% in% smaller% practice% populations% would% have% presented%
methodological%difficulties.%%
%
There%are%a%number%of%important%caveats%to%bear%in%mind%at%this%point:%
• We%cannot%include%mortalities%who%will%be%taken%off%the%list%
• This% analysis% represents% a% snapshot% –% some% practices%may% have% “mopped% up”% the%
majority%of%their%cases%%%
%
Table% 11% and% Figure% 11% below% set% out% the% diagnostic% prevalence% of% dementia,% at% practice%
level,% for%BCCCG.%Diagnostic%prevalence%here% is% represented%by%diagnoses% recorded%on% the%
Primary% Care% QoF% Register% as% at% November% 2013,% with% the% total% practice% population% as%
denominator.%95%%confidence%limits%are%calculated%in%addition,%as%explained%above.%%
%
Key'Observations'
• The%overall%prevalence%of%dementia%in%BDCCG%is%0.24%,%with%95%%limits%from%0.21%%
to%0.27%%
• The%prevalence%is%markedly%lower%than%in%the%three%comparators%of%England,%UK%and%
North% of% England% Commissioning% Group,% with% confidence% limits% clearly% indicating%
that%this%is%a%statistically%significant%difference%
• There% is%moderate% heterogeneity% across% practices%with% little% statistically% significant%
difference%between%practices%
• There%is%one%notable%outlier%at%the%upper%diagnostic%extremity%and%two%at%the%lower%
extremity%

27
Table'11''''Prevalence'of'Dementia'Diagnosis'as'%,'Bradford'Districts'CCG','2013'
Organisation ID Numerator Denominator % 95% LCL 95% UCL Centile
Bradford City CCG N/A 281 118636 0.24% 0.21% 0.27% 75
England N/A 291677 55068625 0.53% N/A N/A N/A
UK N/A 358577 65266344 0.55% N/A N/A N/A
North of England Commissioning Group N/A 91314 15694547 0.58% N/A N/A 100
1 52 5334 0.97% 0.74% 0.97% 99
2 51 8776 0.58% 0.44% 0.76% 96
3 13 2578 0.50% 0.29% 0.86% 94
4 23 6072 0.38% 0.23% 0.57% 87
5 8 2581 0.31% 0.16% 0.61% 85
6 7 2454 0.29% 0.14% 0.59% 82
7 5 1807 0.28% 0.12% 0.65% 81
8 6 2250 0.27% 0.12% 0.59% 80
9 11 4132 0.27% 0.15% 0.48% 77
10 6 2394 0.25% 0.11% 0.54% 77
11 11 4646 0.24% 0.13% 0.43% 77
12 8 3474 0.23% 0.12% 0.45% 76
13 11 4827 0.23% 0.13% 0.41% 75
14 6 2963 0.20% 0.09% 0.44% 75
15 7 3868 0.18% 0.09% 0.37% 75
16 11 6160 0.18% 0.10% 0.32% 74
17 7 4317 0.16% 0.08% 0.33% 73
18 6 3923 0.15% 0.07% 0.33% 67
19 7 5166 0.14% 0.07% 0.29% 67
20 2 1523 0.13% 0.04% 0.48% 65
21 8 6429 0.12% 0.06% 0.24% 61
22 4 3327 0.12% 0.05% 0.31% 60
23 2 1760 0.11% 0.03% 0.41% 58
24 3 2970 0.10% 0.03% 0.30% 56
25 5 7647 0.07% 0.03% 0.16% 54
26 1 4813 0.02% 0.00% 0.12% 53
27 0 10846 0.00% N/A N/A 52
28 0 1599 0.00% N/A N/A 51

28
Figure'11''''''''''''''''''''''''''''''''''''''''''''''''''''''''''''''''''''''''''''''''Prevalence'of'Dementia'Diagnosis'as'%,'Bradford'Districts'CCG','2013'
'
0.00%
0.20%
0.40%
0.60%
0.80%
1.00%
1.20%
1 2 3 4 5 6 7 8 9 10 11 12 13 14 15 16 17 18 19 20 21 22 23 24 25 26 27 28
Practice
% w
ith D
emen
tia D
iagn
osis
'

Memory'Assessment'and'Treatment'Services'Referral'Rates'
This%section%provides%an%over%view%of%the%extent%to%which%people%in%the%CCG%area%who%have%dementia%are%
referred%to%a%Memory%Assessment%and%Treatment%Services%(MATS).%
%
Note:%
• Section%6b%covers%Memory%Assessment%and%treatment%Services%in%detail%
• Comparison%with%other%CCGs%in%the%District%is%provided%in%Section%6b%
%
Tables%12%and%12%and%Figures%13%and%13%demonstrate%how%both%numbers%of%referrals%and%the%rate%of%referral%
per%1,000%registered%people%have%changed%since%2005.%
'
Key'Observations'
• Both%numbers%and%rates%of%referral%rose%steadily%up%to%2009N10%when%there%was%a%marked%drop%off%
in%both%
• This%was%followed%by%a%steep% increase% in%numbers%and%rates%up%to%2012N2013%where%this% increase%
tailed%off%but%numbers%and%rates%continued%to%rise%%
• There%was%a%sharp%upturn%in%2010%which%may%reflect%changes%to%data%recording%processes%relating%to%
the%introduction%of%the%SystmOne%patient%database%in%primary%care%
%
Table'12''''''Referrals'to'Memory'Assessment'and'Treatment'Services,'BCCCG'2005A2013'
Referrals to MATS
2005-2006 3
2006-2007 6
2007-2008 8
2008-2009 30
2009-2010 35
2010-2011 24
2011-2011 83
2012-2013 95
Grand Total 284%
%
%
%
%

30
Figure'12'''''Numbers'of'Referrals'to'Memory'Assessment'and'Treatment'Services,'BDCCG'2013'
0
10
20
30
40
50
60
70
80
90
100
2005-2006 2006-2007 2007-2008 2008-2009 2009-2010 2010-2011 2011-2011 2012-2013
Year
Number
%%
%
Table'13'''''''Rates'of'Referrals'to'Memory'Assessment'and'Treatment'Services,'BCCCG'2013'
Referrals to MATS - Rate/1,000
2005-2006 0.0
2006-2007 0.1
2007-2008 0.1
2008-2009 0.3
2009-2010 0.3
2010-2011 0.2
2011-2012 0.8
2012-2013 0.9%
%
%
%
%
%
%
%
%

31
Figure'13'''''''''Rates'of'Referrals'to'Memory'Assessment'and'Treatment'Services,'BCCCG'2013'
0.0
0.1
0.2
0.3
0.4
0.5
0.6
0.7
0.8
0.9
1.0
2005-2006
2006-2007
2007-2008
2008-2009
2009-2010
2010-2011
2011-2012
2012-2013
Year
Rate
per
1,0
00
32
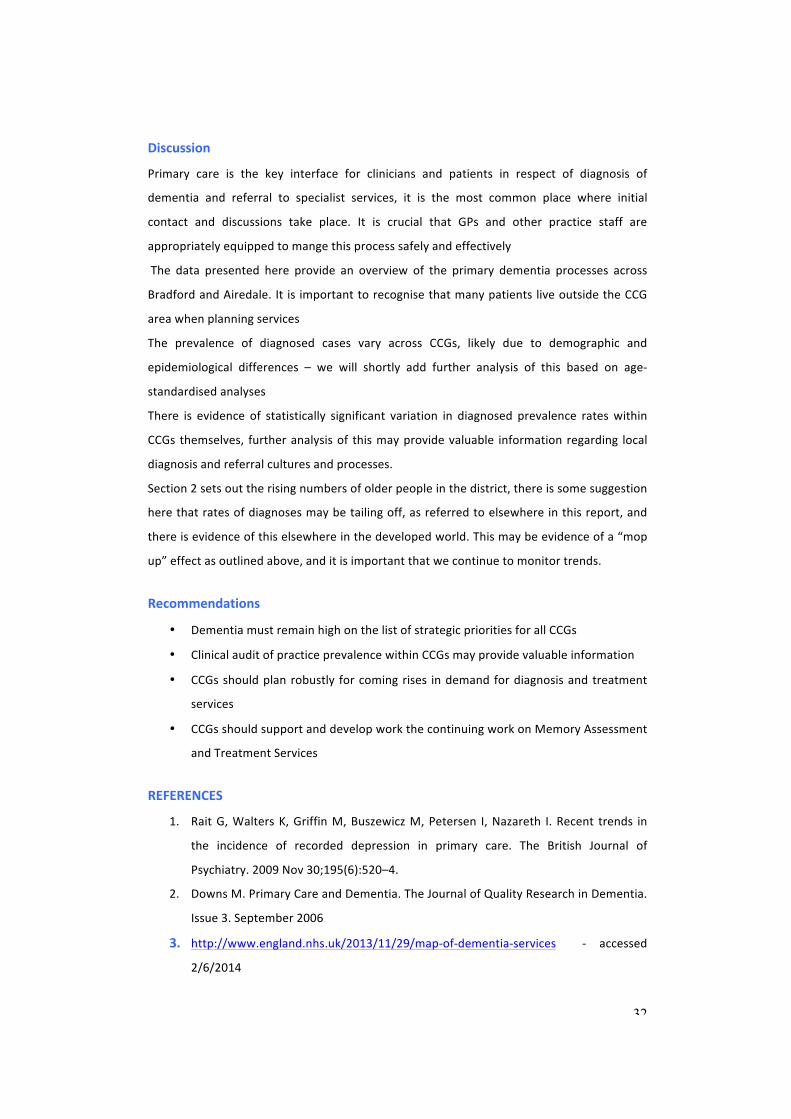
Discussion'
Primary% care% is% the% key% interface% for% clinicians% and% patients% in% respect% of% diagnosis% of%
dementia% and% referral% to% specialist% services,% it% is% the% most% common% place% where% initial%
contact% and% discussions% take% place.% It% is% crucial% that% GPs% and% other% practice% staff% are%
appropriately%equipped%to%mange%this%process%safely%and%effectively%
%The% data% presented% here% provide% an% overview% of% the% primary% dementia% processes% across%
Bradford%and%Airedale.%It% is% important%to%recognise%that%many%patients%live%outside%the%CCG%
area%when%planning%services%
The% prevalence% of% diagnosed% cases% vary% across% CCGs,% likely% due% to% demographic% and%
epidemiological% differences% –% we% will% shortly% add% further% analysis% of% this% based% on% ageN
standardised%analyses%
There% is% evidence% of% statistically% significant% variation% in% diagnosed% prevalence% rates%within%
CCGs% themselves,% further%analysis%of% this%may%provide%valuable% information% regarding% local%
diagnosis%and%referral%cultures%and%processes.%
Section%2%sets%out%the%rising%numbers%of%older%people%in%the%district,%there%is%some%suggestion%
here%that%rates%of%diagnoses%may%be%tailing%off,%as%referred%to%elsewhere%in%this%report,%and%
there%is%evidence%of%this%elsewhere%in%the%developed%world.%This%may%be%evidence%of%a%“mop%
up”%effect%as%outlined%above,%and%it%is%important%that%we%continue%to%monitor%trends.%
'
Recommendations'
• Dementia%must%remain%high%on%the%list%of%strategic%priorities%for%all%CCGs%
• Clinical%audit%of%practice%prevalence%within%CCGs%may%provide%valuable%information%
• CCGs%should%plan%robustly% for%coming%rises% in%demand%for%diagnosis%and%treatment%
services%
• CCGs%should%support%and%develop%work%the%continuing%work%on%Memory%Assessment%
and%Treatment%Services%
'
REFERENCES'
1. Rait%G,%Walters%K,%Griffin%M,%Buszewicz%M,%Petersen% I,%Nazareth% I.%Recent% trends% in%
the% incidence% of% recorded% depression% in% primary% care.% The% British% Journal% of%
Psychiatry.%2009%Nov%30;195(6):520–4.%
2. Downs%M.%Primary%Care%and%Dementia.%The%Journal%of%Quality%Research%in%Dementia.%
Issue%3.%September%2006%
3. http://www.england.nhs.uk/2013/11/29/mapNofNdementiaNservices% % N% accessed%
2/6/2014'