SECTION 5. HETEROGENEOUS CHEMISTRY Table of Contents … · SECTION 5. HETEROGENEOUS CHEMISTRY...
77
5-1 SECTION 5. HETEROGENEOUS CHEMISTRY Table of Contents SECTION 5. HETEROGENEOUS CHEMISTRY ................................................................................................... 5-1 5.1 Introduction .................................................................................................................................................... 5-1 5.2 Surface Types—Acid/Water, Liquids and Solids ........................................................................................... 5-2 5.3 Surface Types—Soot and Alumina ................................................................................................................ 5-2 5.4 Surface Types—Solid Alkali Halide Salts and Aqueous Salt Solutions ......................................................... 5-3 5.5 Surface Composition and Morphology ........................................................................................................... 5-4 5.6 Surface Porosity .............................................................................................................................................. 5-4 5.7 Temperature Dependences of Parameters ....................................................................................................... 5-5 5.8 Solubility Limitations ..................................................................................................................................... 5-5 5.9 Data Organization ........................................................................................................................................... 5-5 5.10 Parameter Definitions ..................................................................................................................................... 5-5 5.11 Mass Accommodation Coefficients for Surfaces Other Than Soot ................................................................ 5-9 5.12 Notes to Table 5-1 ........................................................................................................................................ 5-12 5.13 Gas/Surface Reaction Probabilities for Surfaces Other Than Soot ............................................................... 5-21 5.14 Notes to Table 5-2 ........................................................................................................................................ 5-26 5.15 Soot Surface Uptake Coefficients ................................................................................................................. 5-50 5.16 Notes to Table 5-3 ........................................................................................................................................ 5-50 5.17 Henry’s Law Constants for Pure Water ........................................................................................................ 5-53 5.18 Notes to Table 5-4 ........................................................................................................................................ 5-56 5.19 Ion-Specific Schumpe Parameters ................................................................................................................ 5-61 5.20 Henry’s Law Constants for Acids ................................................................................................................. 5-62 5.21 Notes to Table 5-6 ........................................................................................................................................ 5-63 5.22 References .................................................................................................................................................... 5-66 Tables Table 5-1. Mass Accommodation Coefficients (α) for Surfaces Other Than Soot ................................................... 5-9 Table 5-2. Gas/Surface Reaction Probabilities (γ) for Surfaces Other Than Soot .................................................. 5-21 Table 5-3. Soot Surface Uptake Coefficients ......................................................................................................... 5-50 Table 5-4. Henry’s Law Constants for Pure Water ................................................................................................ 5-53 Table 5-5. Ion-Specific Schumpe Parameters......................................................................................................... 5-61 Table 5-6. Henry’s Law Constants for Acids ......................................................................................................... 5-62 Figures Figure 5-1. Recommended reactive uptake coefficients as a function of temperature for key stratospheric heterogeneous processes on sulfuric acid aerosols. ......................................................................................... 5-9 5.1 Introduction We have evaluated and tabulated the currently available information on heterogeneous stratospheric processes. In addition, because of the increasing level of interest in tropospheric processes with a direct bearing on the fluxes of reactive species into the stratosphere, such as heterogeneous loss processes for partially oxidized degradation products of hydrohalocarbons and heterogeneous contrail and cloud processing of exhaust species from aircraft, we have included kinetic data for selected heterogeneous interactions relevant to modeling cloud droplet and aqueous aerosol chemistry in the free troposphere. However, both stratospheric and tropospheric heterogeneous chemistry are relatively new and rapidly developing fields, and further results can be expected to change our quantitative and even our qualitative understanding on a regular basis. The complexity is compounded by the difficulty of characterizing the chemical and physical properties of atmospheric heterogeneous surfaces and then reproducing suitable simulations in the laboratory [288]. New and/or updated heterogeneous kinetics evaluations in this document have focused on processes on liquid water, on water ice, on alumina, and on solid alkali halide salts and and their aqueous solutions. Uptake studies of volatile organic species (VOCs) on water ice surfaces have not been included in this evaluation. Several groups have investigated the interaction of small oxygenated organic compounds (alcohols, aldehydes, acids, and ketones) with ice surfaces, measuring equilibrium uptakes at
Transcript of SECTION 5. HETEROGENEOUS CHEMISTRY Table of Contents … · SECTION 5. HETEROGENEOUS CHEMISTRY...

5-1
SECTION 5. HETEROGENEOUS CHEMISTRY
Table of Contents SECTION 5. HETEROGENEOUS CHEMISTRY................................................................................................... 5-1 5.1 Introduction .................................................................................................................................................... 5-1 5.2 Surface Types—Acid/Water, Liquids and Solids ........................................................................................... 5-2 5.3 Surface Types—Soot and Alumina ................................................................................................................ 5-2 5.4 Surface Types—Solid Alkali Halide Salts and Aqueous Salt Solutions......................................................... 5-3 5.5 Surface Composition and Morphology........................................................................................................... 5-4 5.6 Surface Porosity.............................................................................................................................................. 5-4 5.7 Temperature Dependences of Parameters....................................................................................................... 5-5 5.8 Solubility Limitations ..................................................................................................................................... 5-5 5.9 Data Organization........................................................................................................................................... 5-5 5.10 Parameter Definitions ..................................................................................................................................... 5-5 5.11 Mass Accommodation Coefficients for Surfaces Other Than Soot ................................................................ 5-9 5.12 Notes to Table 5-1 ........................................................................................................................................ 5-12 5.13 Gas/Surface Reaction Probabilities for Surfaces Other Than Soot............................................................... 5-21 5.14 Notes to Table 5-2 ........................................................................................................................................ 5-26 5.15 Soot Surface Uptake Coefficients................................................................................................................. 5-50 5.16 Notes to Table 5-3 ........................................................................................................................................ 5-50 5.17 Henry’s Law Constants for Pure Water ........................................................................................................ 5-53 5.18 Notes to Table 5-4 ........................................................................................................................................ 5-56 5.19 Ion-Specific Schumpe Parameters ................................................................................................................ 5-61 5.20 Henry’s Law Constants for Acids................................................................................................................. 5-62 5.21 Notes to Table 5-6 ........................................................................................................................................ 5-63 5.22 References .................................................................................................................................................... 5-66
Tables
Table 5-1. Mass Accommodation Coefficients (α) for Surfaces Other Than Soot ................................................... 5-9 Table 5-2. Gas/Surface Reaction Probabilities (γ) for Surfaces Other Than Soot .................................................. 5-21 Table 5-3. Soot Surface Uptake Coefficients ......................................................................................................... 5-50 Table 5-4. Henry’s Law Constants for Pure Water ................................................................................................ 5-53 Table 5-5. Ion-Specific Schumpe Parameters......................................................................................................... 5-61 Table 5-6. Henry’s Law Constants for Acids ......................................................................................................... 5-62
Figures Figure 5-1. Recommended reactive uptake coefficients as a function of temperature for key stratospheric
heterogeneous processes on sulfuric acid aerosols. ......................................................................................... 5-9
5.1 Introduction We have evaluated and tabulated the currently available information on heterogeneous stratospheric
processes. In addition, because of the increasing level of interest in tropospheric processes with a direct bearing on the fluxes of reactive species into the stratosphere, such as heterogeneous loss processes for partially oxidized degradation products of hydrohalocarbons and heterogeneous contrail and cloud processing of exhaust species from aircraft, we have included kinetic data for selected heterogeneous interactions relevant to modeling cloud droplet and aqueous aerosol chemistry in the free troposphere. However, both stratospheric and tropospheric heterogeneous chemistry are relatively new and rapidly developing fields, and further results can be expected to change our quantitative and even our qualitative understanding on a regular basis. The complexity is compounded by the difficulty of characterizing the chemical and physical properties of atmospheric heterogeneous surfaces and then reproducing suitable simulations in the laboratory [288]. New and/or updated heterogeneous kinetics evaluations in this document have focused on processes on liquid water, on water ice, on alumina, and on solid alkali halide salts and and their aqueous solutions. Uptake studies of volatile organic species (VOCs) on water ice surfaces have not been included in this evaluation. Several groups have investigated the interaction of small oxygenated organic compounds (alcohols, aldehydes, acids, and ketones) with ice surfaces, measuring equilibrium uptakes at

5-2
temperatures relevant to the upper troposphere (see e.g., review by Abbatt [5]). The amounts taken up are relatively small compared to inorganic acids. The uptake process is fully reversible on the time scale of the experiments, and thus has little consequences for upper tropospheric chemistry. A few important uptake processes occurring on liquid sulfuric acid surfaces have also been added or updated. The compilation of Henry’s law parameters for pure water has been extended and a procedure for estimating the effective Henry’s law parameters for aqueous salt solutions has been added.
5.2 Surface Types—Acid/Water, Liquids and Solids To a first approximation there are three major types of surfaces believed to be present at significant
levels in the stratosphere. They are: (1) Type I polar stratospheric clouds (PSCs), nominally composed of nitric acid trihydrate (HNO3 • 3H2O); (2) crystals of relatively pure water ice, designated as Type II PSCs because they form at lower temperatures than Type I and are believed to be nucleated by Type I (similar surfaces may form as contrails behind high-altitude aircraft under some stratospheric conditions); and (3) sulfuric acid aerosol, which is nominally a liquid phase surface generally composed of 60–80 weight percent H2SO4 and, concomitantly, 40–20 weight percent H2O. While PSCs, as their name suggests, are formed primarily in the cold winter stratosphere at high latitudes, sulfuric acid aerosol is present year round at all latitudes and may influence stratospheric chemistry on a global basis, particularly after large injections of volcanic sulfur episodically increase their abundance and surface area. There is also increasing evidence that ternary H2SO4/HNO3/H2O liquid solutions may play a significant role in PSC formation.
In addition to the major stratospheric surface types noted above, several other types of heterogeneous surfaces are found in the stratosphere and may play a significant role in some stratospheric processes. For instance, laboratory work has indicated that nitric acid dihydrate (NAD) may play an important role in the nucleation of Type I PSCs (Worsnop et al. [481], Fox et al. [150]) and that mixtures of solid nitric acid hydrates and sulfuric acid tetrahydrate (SAT) (Molina et al. [336], Zhang et al. [502]) and/or a more complex sulfuric acid/nitric acid hydrate (Fox et al. [150]) may also be key to understanding Type I PSC nucleation and evolution. Analyses of the range of atmospheric conditions possible in the polar stratosphere have also led to interest in solid SAT surfaces and possibly other forms of frozen sulfuric acid aerosols (Toon et al. [446], Middlebrook et al. [327]), as well as liquid sulfuric acid aerosols significantly more dilute than the 60–80 weight percent normally present at lower latitudes (Wolff and Mulvaney [479], Hofmann and Oltmans [222], Toon et al. [446]).
In the free troposphere the heterogeneous surfaces of interest include liquid or solid water (cloud droplets, contrails), and aqueous sulfate solutions. Uptake data are compiled for liquid water for several reasons. First this surface is one asymptote of the aqueous acid aerosol continuum; second, the interactions of some trace species with liquid water and water ice (Type II PSC) surfaces are often similar, and third, the uptake of some trace species by liquid water surfaces in the troposphere can play a key role in understanding their tropospheric chemical lifetimes and thus, the fraction that may be transported into the stratosphere.
5.3 Surface Types—Soot and Alumina Aircraft at cruise altitudes and rocket exhausts contribute small but measurable amounts of carbonaceous
“soot” (Pueschel et al. [362]) and aluminized solid propellant rocket exhausts and spacecraft debris produce increasing levels of alumina (Al2O3) and similar metal oxide particles (Zolensky et al. [505]) in the stratosphere and upper troposphere. Soot lofted above from surface combustion sources may also be present in the upper troposphere, and to a lesser extent in the lower stratosphere. Alumina from rocket exhausts is generally emitted as liquid droplets from the rocket nozzle and deposited in the alpha or metastable gamma phases as it quickly solidifies in the exhaust plume. “Soot” refers to a material that is a combination of elemental and organic carbon, with proportions varying depending on the source material and the combustion conditions. In studies of soot directed to understanding the interaction with atmospheric gases, two types of soot have been used: carbon blacks having relatively small hydrogen and oxygen contents (e.g. Degussa FW2, Cabot Monarch 1000, ground charcoal and spark-generated soot) and organic combustion soots having higher hydrogen, oxygen and nitrogen content (e.g. soots from the combustion of n-hexane, methane, propane, decane, ethylene, acetylene, toluene, stearic candles). In the case of organic combustion soots, even different fuels used to generate the soot have been reported to affect the chemistry; for example, the yields of HONO from the reaction of NO2 with acetylene, toluene, ethylene and decane soots were observed to vary with the fuel used [19, 162].
Polycyclic aromatic hydrocarbons (PAH) and oxygenated polycyclic aromatic compounds (O-PAC) are major constituents of soots formed from the combustion of liquid fuels [14-16, 71, 146, 172, 418]. The bulk composition of soot can have varying amounts of C, H, and O. For example, Chughtai et al. [91] report that the
5-3
composition (in weight %) of n-hexane soot varies from 87 to 92 % C, 1.2 to 1.6 % H, and 11 to 6% oxygen. Stadler and Rossi [424] showed that the elemental composition of the soot as well as its surface area depended on whether the flame was rich or lean; in the case of the rich flame giving a grey-colored soot, the composition (weight %) was 97.3% C, 0.83% H, 1.65% O, and 0.20% N while the lean flame gave a black soot comprised of 96.4% C, 0.19% H, 3.2% O, and 0.27% N.
The functional groups on the soot surface are expected to be important in terms of the uptake and reaction of gases on the surface. XPS studies of n-hexane soot show surface carbon and oxygen, although the specific nature of the bonding could not be determined (Akhter et al. [16]). The surface functional groups on soot vary, depending on the fuel composition, method of generation and the post-treatment of the soot. For example, Degussa FW2 carbon black, which has been used in a number of studies of uptake and reactions of gases on soots, is post-treated with NO2 by the manufacturer and Cabot Monarch 1000 is post-treated with aqueous HNO3. There may be sufficient NO and NO2 concentrations generated under some conditions during the formation of soots by spark generators that these may also have been reacted with these gases prior to collection and uptake studies. Studies of a number of gases interacting with soot surfaces suggest there are at least two and likely more, types of reactive surface sites; one type reacts very rapidly, e.g. with O3, while others react more slowly. The first type may be most relevant to the reactions of soot particles in exhaust plumes from combustion sources, while the latter is most relevant to soot diluted in air.
Fourier transform infrared (FTIR), Raman and electron paramagentic resonance (EPR) spectroscopic studies of n-hexane soot show C–O functionalities assigned to anhydrides and aryl ethers, alkyl ketones, as well as =C–H, highly substituted aromatics and conjugated carbonyl-aromatic groups [14, 418]. Kirchner et al. [277] measured the FTIR spectra of soots from the combustion of diesel fuel and n-hexane (described as “flame deposited”) and soots collected from a commercial spark generator in Ar, from the emissions of a diesel automobile and Degussa FW2 soot (described as “filter deposited”). In all cases, absorption peaks due to –C–C–, –C=C–, –C–O, aromatic –C=O, and carboxylic –C=O groups (both aromatic and aliphatic) were observed. However, the flame-deposited soot showed bands due to substituted aromatics while the filter-collected samples did not. The filter-deposited samples had bands due to aliphatic –C–H groups that were not observed for the flame-deposited soots. Only the spark-generated soot showed bands due to both –C=C–H and to –O–H.
For soot formed from the combustion of liquid fuels, the location in the flame at which the soot is collected also changes the surface enough to alter its reactions. For example, Akhter et al. [14] showed that the functional groups as well as particle size depend on the height of collection of soot from the base of the flame. Such changes appear to also alter the reactions of soot; for example, Gerecke et al. [162] measured HONO and NO yields from the reaction of NO2 with ethylene soot and found that the HONO yield decreased with distance from the bottom of the flame that the soot was collected from, while the yield of NO increased. Kirchner et al. [277] reported much stronger infrared absorption bands due to substituted aromatics in soot samples collected from the combustion of n-hexane near the bottom of the flame compared to the top; in addition, absorption bands due to the –O–H group were only observed in samples collected at the bottom of the flame.
Not only can the surface groups directly affect its interaction with gases, but they determine the hygroscopic properties of the soot surface. Chughtai et al. [97, 100] have shown that the hydration of soot surfaces depends on the fuel composition (particularly sulfur and trace metal content) and combustion conditions, as well as the extent of surface oxidation. A highly hygroscopic surface holding significant amounts of water may behave differently than a “dry” surface with respect to the interaction with gases; for example, black carbon suspended in aqueous solutions with ozone and irradiated to generate OH has been shown to help assist in the initiation of bulk solution phase OH chemistry [244]. There are also free radical sites on soot surfaces whose EPR signals are strongly affected by the adsorption of paramagnetic species such as NO2 (e.g. see Chughtai et al. [91]). These unpaired electrons in soot may contribute to the surface reactivity.
The International Steering Committee for Black Carbon Reference Materials (http://www.du.edu/~dwismith/bcsteer.html) has issued preliminary recommendations for representative black carbon reference materials. They recommend that soot formed from the combustion of saturated hydrocarbons, preferably n-hexane, be used for soot black carbon. For aerosol black carbon, they recommend the use of Urban Dust Reference Material (SRM) 1649a, which is a sample collected in Washington, D.C. in a baghouse in 1976–1977. However, for studies of the uptake and reactions of gases in the atmosphere with combustion-generated soots, organic combustion generated soots, particularly n-hexane soot, appear to be the most reasonable surrogate.
5.4 Surface Types—Solid Alkali Halide Salts and Aqueous Salt Solutions

5-4
Some modeling studies also suggest that certain types of major volcanic eruptions transport significant levels of sodium chloride and associated alkali halide salts into the stratosphere (Michelangeli et al. [326]), so studies of stratospheric trace species interacting with solid NaCl or similar alkali halide salts, as well as salt solutions, have also been included. Sea salt aerosols are, of course, much more abundant in the troposphere, and have their largest influence on the chemistry of the marine boundary layer.
The heterogeneous chemistry of salt surfaces is very complex. For example; the uptake and reaction of gases with NaCl and NaBr have been shown to be very sensitive to the presence of small amounts of strongly adsorbed water (SAW) on the salt surface. Because water is not taken up on the 100 crystal surface of NaCl at room temperature, the SAW is thought to be concentrated at steps and edges where one water molecule can interact with two ions, resulting in a larger enthalpy of adsorption. This means that powders of salt, which have a larger surface-to-volume than single crystals, also have more SAW because of the relatively larger numbers of steps and edges. In addition, the amount of SAW on sprayed films is affected by the solvent used, with more SAW when water is used as the solvent. This SAW plays a key role in facilitating the reorganization of the surface during the reaction; thus, it appears to mobilize the product ions and allow them to recrystallize into 3-D microcrystallites of product on the surface, exposing fresh salt and allowing the reaction to continue well beyond the point that the surface would normally passivate. While the overall features of this process are reasonably well understood, the exact nature of the SAW and the molecular level interactions and processes are not. The overall effect, however, is a time-dependent uptake coefficient.
5.5 Surface Composition and Morphology The detailed composition and morphology of each surface type are uncertain and probably subject to a
significant range of natural variability. Certain chemical and physical properties of these surfaces, such as their ability to absorb and/or solvate HCl and HNO3, are known to be strongly dependent on their detailed chemical composition. Moreover, most heterogeneous processes studied under laboratory conditions (and in some cases proceeding under stratospheric conditions) can change the chemical composition of the surface in ways that significantly affect the kinetic or thermodynamic processes of interest. Thus, a careful analysis of the time-dependent nature of the active surface is required in the evaluation of measured uptake kinetics experiments. Experimental techniques which allow the measurement of mass accommodation or surface reaction kinetics with high time resolution and/or with low trace gas fluxes are often more credible in establishing that measured kinetic parameters are not seriously compromised by surface saturation or changing surface chemical composition.
The relevant kinetic uptake parameters: mass accommodation coefficients and surface reaction probabilities, are separately documented for relevant atmospheric trace gas species for the major and, where available, the minor stratospheric and upper tropospheric surfaces noted above. Since these parameters can vary significantly with surface composition (e.g., the H2SO4/H2O ratio for sulfate aerosol or the HNO3/H2O ratio for Type I PSC) the dependence of these parameters on surface composition is reviewed where sufficient data are available. Due to its chemical and morphological complexity, uptake values for soot are documented in a separate table.
5.6 Surface Porosity The experimental techniques utilized to measure mass accommodation, heterogeneous reaction, and
other uptake coefficients generally require knowledge of the surface area under study. For solid surfaces, and most particularly for water and acid ice surfaces formed in situ, the determination of how the molecular scale ice surface differs from the geometrical surface of the supporting substrate is not easy. Keyser, Leu, and coworkers have investigated the structure of water and nitric acid ice films prepared under conditions similar to those used in their flow reactor for uptake studies [272, 273, 275]. They have demonstrated that ice films grown in situ from the vapor can have a considerably larger available surface than that represented by the geometry of the substrate; they have also developed a simple model to attempt to correct measured uptake rates for this effect [274, 275]. This model predicts that correction factors are largest for small uptake coefficients and thick films. The application of the model to experimental uptake data remains controversial (Keyser et al. [274], Hanson and Ravishakara [205], Kolb et al. [288]). Some experimenters prefer to attempt growing ice surfaces as smooth as possible and to demonstrate that their measured uptake coefficients are only weakly dependent on surface thickness (Hanson and Ravishankara [204]).
Similar issues arise for uptake experiments performed on powered, fused and single crystal salt or oxide surfaces (Fenter et al. [137]; Hanning-Lee et al. [187]). There are two issues here. First, the molecular level (BET) surface area that is commonly measured by determining the mass of a gas such as N2 adsorbed by a given sample mass is for many atmospheric solids, larger than the geometric surface area. However, determining the BET surface

5-5
area of porous materials does not necessarily reflect the available surface area for molecules larger than that used in the BET measurement. Second, many experimental studies have used samples consisting of multiple layers of particles in order to increase the amount of gas that is taken up and hence improve the accuracy of the measurement. However, there is considerable uncertainty in how to accurately assess the fraction of the total sample that is available for reaction. When recommendations are made for uptake coefficients on solid alkali salts in this assessment, the values have generally been obtained using at least two different sample types (e.g., powders, single crystals and spray-deposited films) and/or two different techniques (e.g., flow tubes and Knudsen cells).
The issue of surface area available for uptake is also important for interpreting uptake measurements on soot and soot surrogate surfaces. The degree to which measured uptake parameters must be corrected for porosity effects will remain in some doubt until a method is devised for accurately determining the effective surface area for the surfaces actually used in uptake studies.
Some studies evaluated in this review assume that the effective ice or salt surface area is the geometrical area, but more recent studies on solid surfaces generally attempt to assess the available surface area by employing BET measurements and porosity models. However, uncertainty in true reactive surface area for heterogeneous uptake on solids is often the dominate systematic error in reporting uptake coefficient values for these systems and makes evaluation of these data across laboratories and techniques difficult.
5.7 Temperature Dependences of Parameters A number of laboratory studies have shown that mass accommodation coefficients and, to some extent,
surface reaction probabilities can be temperature dependent. While these dependencies have not been characterized for many systems of interest, temperature effects on kinetic data are noted where available. More work that fully separates heterogeneous kinetic temperature effects from temperature controlled surface composition is obviously needed.
5.8 Solubility Limitations The uptake of certain trace gases by atmospherically relevant surfaces is usually governed by solubility
limitations rather than kinetic processes. In these cases properly analyzed data can yield measurements of trace gas solubility parameters relevant to stratospheric conditions. In general, such parameters can be strongly dependent on both condensed phase composition and temperature. Such parameters may be very important in stratospheric models, since they can govern the availability of a reactant for a bimolecular heterogeneous process (e.g., the concentration of HCl available for the HCl + ClONO2 reaction on sulfuric acid aerosols) or the gas/condensed phase partitioning of a heterogeneous reaction product (e.g., the HNO3 formed by the reaction of N2O5 on sulfuric acid aerosols). Surface saturation limitations have also been observed in experimental uptake studies on solid surfaces, including water and water/acid ice surfaces.
5.9 Data Organization Data for trace-gas heterogeneous interactions with relevant condensed-phase surfaces are tabulated in
Tables 5-1 through 5-5. These are organized into:
Table 5-1—Mass Accommodation Coefficients for Surfaces Other Than Soot
Table 5-2—Surface Reaction Probabilities for Surfaces Other Than Soot
Table 5-3—Soot-Surface Uptake Coefficients
Table 5-4—Solubility Data for Pure Water
Table 5-5—Ion Specific Schumpe Parameters
Table 5-6—Solubility Data for Acids
5.10 Parameter Definitions Mass accommodation coefficients (α), represent the probability of reversible uptake of a gaseous species
colliding with the condensed surface of interest. For liquid surfaces this process is associated with interfacial (gas-to-liquid) transport and is generally followed by bulk liquid phase solvation. Examples include: simple surface absorption, absorption followed by ionic dissociation and solvation (e.g., HCl + nH2O ↔ H+(aq) + Cl– (aq)), and
5-6
absorption followed by a reversible chemical reaction with a condensed phase substituent (e.g., SO2 + H2O ↔H+ + HSO3
– or CH2O + H2O ↔ CH2(OH)2).
The term “sticking coefficient” is often used for mass accommodation on solid surfaces where physisorption or chemisorption takes the place of true interfacial mass transport.
Processes involving liquid surfaces are subject to Henry’s law, which limits the fractional uptake of a gas phase species into a liquid. The distribution of a substance between the gas and liquid phase is controlled, at equilibrium, by the Henry’s Law constant for that substance, which relates the concentration of the substance in solution to the partial pressure of the substance in the gas phase:
H = [solution]/P(gas) This is a limiting law, strictly valid only at the limit of zero concentration. For most gasses at concentrations of interest, deviations from this law are not significant. The value of the Henry’s Law constant, H, depends strongly upon temperature. For a typical gas, it decreases with increasing temperature at lower temperatures. At higher temperatures, typically well above 298 K, the value will increase with temperature. Over limited temperature ranges, the value is well represented by a linear relationship between the logarithm of H and the reciprocal of temperature.
Ln(H) = A + B/T For a number of gasses, the experimental data are sufficient to display the expected curvature in a plot of Ln H vs. 1/T. In this review, where sufficient data are available, we have represented these results by the three-parameter equation
Ln(H) = A + B/T + C Ln(T)
If the gas phase species is simply solvated, a physical Henry’s law constraint holds; if the gas phase species reacts with a condensed phase substituent, as in the sulfur dioxide or formaldehyde hydrolysis cases noted above, a “chemically modified” or “effective” Henry’s law constraint holds (Clegg and Brimblecombe [101], Schwartz [403], Watson et al. [469]). Henry's law constants relate the equilibrium concentration of a species in the gas phase to the concentration of the same species in a liquid phase, and they have, in this report, units of M atm–1.
The solubility of a gas also depends upon the presence of other substances in the solution. The best known effect is that of an added salt. In most cases, the addition of a salt to the solution results in a lowering of the solubility of the gas. This effect is usually described by the Sechenov equation:
Log(co/c) = Log(Ho/H) = KS cs
which relates the relates the ratio of the concentrations of gas dissolved for a given pressure in the absence, co, and presence, c, of a given concentration of salt, cS. The proportionality constant is the Sechenov coefficient, KS. The Sechenov coefficient is specific to both the gas and the specific salt. Thus, in general, one needs a new value for any particular gas-salt combination, a tremendous amount of data. For this reason, models have been developed to extend measurements of KS to systems for which no measurements have been made. Schumpe and co-workers [398, 472] developed the particular procedure adopted in this review. It assumes that KS is composed of ion- and gas-specific constants:
KS = Σ (hi + hG) ni Where hi is the ion-specific constant, hG is the gas-specific constant, and ni is the ion index. For a mixed electrolyte solution,
Log(Ho/H) = Σ (hi + hG) ci
The small temperature dependence of KS is assumed to lie completely in hG. Thus
hG = hG,0 + hT (T – 298.15 K)

5-7
Weisenberger and Schumpe [472] analyzed 892 Sechenov constants for various gases in salt solutions over the temperature range 273 K to 363 K. They derived an optimum set of hi, hG,0, and hT parameters for a diverse set of ions and gases. Values for O2 and H+ were set to zero to make the set unique. The standard deviation in the predicted Sechenov constants is 0.026. We have included their values for the ion-specific parameters in Table 5--5.
Available gas-specific constants, hG,0 and hT, are included in Table 5-4, along with the Henry’s law constants for pure water. In Table 5-4, we present those “salting out” parameters included in the optimum set derived by Weisenberger and Schumpe, along with some parameters derived from other studies. In the latter cases, the ion parameters are considered fixed and we solve for the gas-specific parameters.
Available Henry’s law parameters for sulfuric acid/water, and in a few cases, sulfuric acid/nitric acid/water solutions are presented in Table 5-6. Effective Henry’s law constants are designated H*, while simple physical Henry’s law constants are represented by H. Effective Henry’s law constants are also employed to represent decreased trace gas solubilities in moderate ionic strength acid solutions via a Sechenov coefficient formulation which relates H* to the concentration of the acid [233]. Available Henry’s law constants for reactive upper tropospheric/stratospheric species in binary sulfuric acid/water solutions, and for a few cases of ternary sulfuric acid/nitric acid/water solutions, are tabulated as a function of acid weight percent and temperature. It is presently unclear whether “surface solubility” effects govern the uptake on nominally solid water ice or HNO3/H2O ice surfaces in a manner analogous to bulk solubility effects for liquid substrates and no solubility parameters for these “ice” systems are presented.
For some trace species on some surfaces, experimental data suggest that mass accommodation coefficients untainted by experimental saturation limitations have been obtained. These are tabulated in Table 5-1. In other cases experimental data can be shown to be subject to Henry’s law constraints, and Henry’s law constants, or at least their upper limits, can be determined. Some experimental data sets are insufficient to determine if measured “uptake” coefficients are true mass accommodation coefficients or if the measurement values are lower limits compromised by saturation effects. These are currently tabulated, with suitable caveats, in Table 5-1.
Surface reaction probabilities (γ) are kinetic values for generally irreversible reactive uptake of trace gas species on condensed surfaces. The rates of such processes may not be limited by Henry’s law constraints; however, the fate of the uptake reaction products may be subject to saturation limitations. For example, N2O5 has been shown to react with sulfuric acid aerosol surfaces. However, if the H2SO4/H2O ratio is too high, the product HNO3 will be insoluble, and a large fraction will be expelled back into the gas phase. Surface reaction probabilities for substantially irreversible processes are presented in Table 5-2. Reaction products are identified where known.
Surface reaction probabilities on crystalline and non-ice amorphous solid surfaces, such as alumina and alkali salts are particularly susceptible to surface saturation effects, especially when exposed to the relatively high trace gas concentrations sometimes employed in laboratory experiments. In the case of gaseous HNO3 reacting with NaCl for example, there is a rapid initial uptake of HNO3 and formation of nitrate on the surface, followed by a decrease to a relatively constant (but slowly declining) value. When they are available, we tabulate the initial uptake coefficient, γ0, in Table 5-2, since that value often sets the upper limit for atmospheric uptake. In the corresponding note we may also site the reactive uptake coefficient appropriate to longer time exposure when the uptake appears to have reached an approximate steady-state, γss.
The total experimental uptake coefficient measured in laboratory heterogeneous kinetic experiments are also often represented by the symbol γ. In those cases where surface and/or bulk reaction dominate the uptake, the total uptake coefficient (γtotal) and reactive uptake coefficient (γrxn) may well be identical. More formally, for cases where bulk liquid phase reaction is facile and there are no gas phase diffusion constraints, the total uptake coefficient for aerosol or cloud droplets can be approximated in terms of γrxn and γsol as [288]:
1 1 1
total sol rxnγ α γ γ= +
+
where 1/ 2
1/ 2
8sol
HRT Dc t
γπ
⎛ ⎞= ⎜ ⎟⎝ ⎠
and
5-8
( )1/ 24rxn rxn
HRT Dkc
γ =
where t is the time integrated exposure of the trace gas to the liquid surface, R is the gas constant, D is the liquid phase diffusion coefficient, and c is the mean trace gas molecular speed. In the limit of low solubility or long exposure time γsol becomes negligible and
1 1 1
total rxnγ α γ= +
Discussion of how to use this approach to model chemical reactions in liquid stratospheric aerosols can be found in Hanson et al. [210] and Kolb et al. [288]. Note that these formulations are approximate. In cases where separate terms are competitive, more rigorous solution of the kinetic differential equations may be appropriate.
For solid surfaces, bulk diffusion is generally too slow to allow bulk solubility or bulk kinetic processes to dominate uptake. For solids, reactive uptake is driven by chemisorption/chemical reaction at the interface, a process that can also influence trace gas uptake on liquids. For liquids, surface reaction (γsurf) occurs in parallel, rather than in series with mass accommodation, thus:
11 1
total surfsol rxn
γ γα γ γ
−⎡ ⎤
= + +⎢ ⎥+⎣ ⎦
Examples where this more complex situation holds for liquid surfaces can be found in Hu et al. [226] and Jayne et al. [249]. In such cases γ may be significantly larger than α.
Uptake of gases on soot may occur due to three different processes: (1) physisorption (e.g. SO2 or HNO3 at room temperature and low nitric acid pressures); (2) reaction with the surface (e.g. NO2), and (3) catalytic decomposition/reactions of the gas on the surface. All three processes may occur in parallel, and the relative contributions of each of these three may vary during the course of the reaction as the surface “ages.” As discussed above, there are different types of reactive sites on soot, leading in some cases to a rapid initial uptake followed by a slower uptake; these are often characterized as reactions on “fresh” and “aged” surfaces respectively. Another complexity is that in some cases the geometric surface areas were used to calculate the uptake coefficients from the experimental data while in others, the available reactive surface area was estimated and used.
Because of these complexities with soot heterogeneous chemistry, uptake coefficients for soot interactions with gases have been broken out into a separate Table 5-3 rather than being included with the other surfaces in Table 5-1 and Table 5-2. When the uncertainty is more than an order of magnitude, a recommendation is not given in Table 5-3 and the range of reported values is given in the Notes. In most cases, the available reactive surface area rather than the geometric areas have been used in obtaining the uptake coefficients; in those cases where the geometric area was used but a higher available surface area was involved in the measured uptake, the uptake coefficient is given as an upper limit. Data are most commonly available for room temperature or there are very limited data at lower temperatures characteristic of the upper troposphere.
The data in Table 5-1 and Table 5-2 for uptake on non-soot surfaces are organized by trace gas species, since some systematic variation may be expected for surface accommodation or reaction as the surface composition and/or phase is varied. Data presented for one surface may be judged for “reasonableness” by comparing with data for a “similar” surface. In some cases it is not yet clear if surface uptake is truly reversible (accommodation) or irreversibly reactive in nature. In such cases the available uptake coefficients are generally tabulated in Table 5-1 as accommodation coefficients, a judgment that will be subject to change if more definitive data become available.
Where a specific evaluated value for an accommodation coefficient or reaction probability has been obtained, an estimated uncertainty factor is also tabulated. However, when the data evaluation yielded only a lower or upper limit, no uncertainty factor can be reliably estimated and none is presented.
Description of and reference citations to many of the laboratory techniques used to obtain the data in the following tables can be found in Kolb et al. [288].
Reactions of N2O5, ClONO2, HOCl and BrONO2 on/in sulfuric acid are generally dependent on the species’ Henry's law solubility and liquid phase diffusion coefficient in the liquid acid as well as the surface and/or liquid phase reaction rate parameters. All of these processes are generally functions of the acid composition and temperature (Hanson et al. [210], Robinson et al. [376] Shi et al. [414]. Thus, these reactions’ reactive uptake

5-9
coefficients must be represented by a complex phenomenological or empirical models that defy simple entry into Table 5-2. The notes in Table 5-2 for these reactions discuss and present the models adopted.
To aid in visualizing the resulting reactive uptake parameters the results for several reactions have been plotted in Figure 5.1 as a function of temperature for a background pressure of 50 mbar and background water vapor and HCl mixing ratios of 5 ppmv and 2 ppbv, respectively. These calculations are presented for monodisperse background sulfate aerosol particles with a radius of 1 × 10⁻⁵ cm (0.1 μm).
10-5
10-4
10-3
10-2
10-1
100
γ o
230220210200190
T (K)
50 mbar5 ppm H2O2 ppb HCl0.1 ppb ClONO2
50 60 70 80
H2SO4 wt%
N2O5 + H2O
BrONO2 + H2O
ClONO2 + HCl
ClONO2 + H2O
HOCl + HCl
Figure 5-1. Recommended reactive uptake coefficients as a function of temperature for key stratospheric heterogeneous processes on sulfuric acid aerosols. For ClONO2 and HOCl species, the aerosol radius used in the calculation is 10–5 cm, a typical value in the stratosphere. Because the current uptake models for N2O5 and BrONO2 hydrolysis do not provide the information about the reacto-diffusive length ( ), the aerosol radius used in the
calculation is assumed to be much larger than their reacto-diffusive length (i.e. for N2O5 and BrONO2 are set to zero.)
5.11 Mass Accommodation Coefficients for Surfaces Other Than Soot
Table 5-1. Mass Accommodation Coefficients (α) for Surfaces Other Than Soot
Gaseous Species Surface Type Surface Composition T(K) α Uncertainty
Factor Notes
O Water Ice Sulfuric Acid
H2O(s) H2SO4 • nH2O(l) (97 wt.% H2SO4)
See Note 298
See Note See Note
1 2

5-10
Gaseous Species Surface Type Surface Composition T(K) α Uncertainty
Factor Notes
O3 Water Ice Liquid Water Nitric Acid Ice Sulfuric Acid
H2O(s) H2O(l) HNO3 • 3H2O(s) H2SO4 • nH2O(l) (50–98 wt.% H2SO4)
195–262 275-300
195 193–295
>0.04 ≥1 × 10–2* 2.5 × 10–4‡ See Note
3
3 4 3 5
OH Water Ice Liquid Water
H2O(s) H2O(l)
205–253 275-300
>0.1 ≥1 × 10–2*
6 7
HO2 Liquid Water Aqueous Salts
H2O(l) NH4HSO4(aq) and LiNO3(aq)
275 293
> 0.02 > 0.2
8 8
H2O Water Ice Liquid Water Liquid Nitric Acid Nitric Acid Ice Sulfuric Acid Sodium Chloride
H2O(s) H2O(l) HNO3•nH2O(l) HNO3• 3H2O(s) H2SO4 • nH2O (96 wt.% H2SO4) (50 wt.% H2SO4) (70 wt.% H2SO4) (82 wt.% H2SO4) NaCl(s) NaCl(aq)
200 250-290
278 197 298
250-280 250-295 270-300
~298 ~299
0.5 ≥0.1* >0.3
See Note > 2 × 10⁻³‡
0.5 0.6 0.85
See Note See Note
2
1.3 1.3 1.3
9 10 11 12 13 13 13 13 14 15
H2O2 Liquid Water Sulfuric Acid
H2O(l) H2SO4 • nH2O(l) (96 wt.% H2SO4)
273 298
0.18* > 8 × 10⁻⁴‡
2 16 17
NO Water Ice Sulfuric Acid
H2O(s) H2SO4 • nH2O (70 wt.% H2SO4) (97 wt.% H2SO4)
195
193–243 298
See Note See Note See Note See Note
18
19 19
NO2 Water Ice H2O(s) 195 See Note 21 NO3 Liquid Water H2O(l) 273 See Note 20 HONO Water Ice H2O(s) 180–200 See Note 22 HNO3 Water Ice
Liquid Water Nitric Acid Ice Liquid Nitric Acid Sulfuric Acid Sulfuric Acid Tetrahydrate
H2O(s) H2O(l) HNO3 • 3H2O(s) HNO3 • nH2O(l) H2SO4 • nH2O(l) (57.7 wt.% H2SO4) (73 wt.% H2SO4) (75 wt.% H2SO4) (97 wt.% H2SO4) H2SO4 • 4 H2O(s)
200 250-300 191–200
278
191–200 283 230 295
~192
See Note ≥0.05*
0.4 0.6
>0.3 0.1
>2 × 10⁻³
>2.4 × 10⁻³
>0.02*
3 2 2 2
23 24 25 26
27 27 27 27 27
HO2NO2 Water Ice Sulfuric Acid
H2O(s) H2SO4 • nH2O(l) (97 wt.% H2SO4)
ª200 298
0.1‡ See Note
3 28 29
NH3 Liquid Water H2O(l) 260-300 ≥0.05* 30 CO2 Liquid Water H2O(l) 290-300 ≥5 x 10⁻⁵ 31 CH3OH Liquid Water H2O(l) 260–291 0.12–0.02* 2 32 CH3CH2OH Liquid Water H2O(l) 260–292 ≥2 x 10-2* 33 CH3CH2CH2OH Liquid Water H2O(l) 260–291 0.08–0.02* 2 34 CH3CH(OH)CH3 Liquid Water H2O(l) 260–291 0.10–0.02* 2 34 HOCH2CH2OH Liquid Water H2O(l) 260–291 0.13–0.04* 2 35 CH3O2 Sodium Chloride NaCl(s) 296 >4 × 10⁻³ 36 CH3OOH Liquid Water H2O(l) 260-282 ≥7 x 10-3* 37 CH2O Liquid Water
Sulfuric Acid H2O(l) H2O•mHNO3•nH2O(l)
260–270 235–300
0.04 0.04
3 3
38 38
CH3CHO Liquid Water H2O(l) 267 >0.03* 39 CH(O)CH(O) Liquid Water H2O(l) 260-285 ≥1 x 10-2* 40 CH3C(O)CH3 Liquid Water H2O(l) 260–292 ≥2 x 10-2* 41 CH3C(O)CHO Liquid Water H2O(l) 260-293 ≥1 x 10-4* 42 CH3OC(O)OCH3 Liquid Water H2O(l) 270-278 ≥2 x 10-2* 43 HC(O)OH Liquid Water H2O(l) 260–291 0.10–0.02* 2 44 CH3C(O)OH Liquid Water H2O(l) 258-292 ≥2 x 10-2* 45 Cl2 Water Ice H2O(s) 200 See Note 46 OClO Water Ice H2O(s) 100,189, 200 See Note 47

5-11
Gaseous Species Surface Type Surface Composition T(K) α Uncertainty
Factor Notes
HCl Water Ice Liquid Water Nitric Acid Ice Sulfuric Acid Sulfuric Acid Tetrahydrate
H2O(s) H2O(l) HNO3 • 3H2O(s) H2SO4 • nH2O(l) (n≥8, ≤40 wt.% H2SO4) (n<8, >40 wt.% H2SO4) H2SO4 • 4H2O(s)
191– 211 260-295 191– 211
283 218 †
192–201
0.3 ≥0.05*
0.3 0.15*
>0.005* †
See Note
3 3 2 †
48 49 50 51 51 51 52
ClONO2 Liquid Water H2O(l) 260-280 ≥0.05* 53 CCl2O Liquid Water H2O(l) 260–290 See Note 54 CCl3CClO Liquid Water H2O(l) 260–290 See Note 54 HBr Water Ice
Liquid Water Nitric Acid Ice
H2O(s) H2O(l) HNO3 • 3H2O(s)
200 260-295
200
> 0.2 ≥0.05* > 0.3
55 56 55
HOBr Water Ice Liquid Water Sulfuric Acid
H2O(s) H2O(l) H2SO4 in H2O(l) (58 wt.% H2SO4)
190–239 298 228
See Note 0.6
>0.05‡
1.5
57 58 59
BrONO2 Liquid Water Sulfuric Acid
H2O(l) H2SO4 in H2O(l) (45-83 wt.% H2SO4)
260-280 230-300
≥0.03* 0.8
1.5
60 61
CHBr3 Water Ice Sulfuric Acid
H2O(l) H2SO4 • nH2O(l) (97 wt.% H2SO4)
220 220
See Note >3 × 10⁻³‡
62 62
BrCl Liquid Water H2O(l) 270-285 ≥0.15* 63 I2 Liquid Water H2O(l) 270-293 ≥0.01* 64 HI Liquid Water H2O(l) 260-280 ≥0.05* 65 HOI Sulfuric Acid H2SO4 • nH2O(l)
(40 wt.% H2SO4) (40 wt.% H2SO4) (40 wt.% H2SO4) (50 wt.% H2SO4) (70 wt.% H2SO4) (70 wt.% H2SO4)
195 205 212
222–224 230–232
252
0.07 0.03 0.04 0.02 0.02 0.02
3 3 3 3 3 3
66
HF Water Ice Nitric Acid Ice
H2O(s) HNO3 • 3H2O(s)
200 200
See Note See Note
67 67
CF2O Water Ice Liquid Water Nitric Acid Ice Sulfuric Acid
H2O(s) H2O(l) HNO3 • 3H2O(s) H2SO4 • nH2O(l) (40 wt.% H2SO4) (60 wt.% H2SO4)
192 260–290
192 215–230
See Note See Note See Note
>3 × 10⁻⁶‡ >6 × 10⁻⁵‡
68 54 68
68 68
CF3CFO Liquid Water H2O(l) 260–290 See Note 54 CF3COOH Liquid Water H2O(l) 263–288 0.2–0.1* 2 69 CF3CClO Liquid Water H2O(l) 260–290 See Note 54 SO2 Liquid Water
Sulfuric Acid H2O(l) H2SO4 • nH2O(l) (97 wt.% H2SO4)
260–298 298
≥0.12* See Note
2
70 71
H2S Liquid Water H2O(l) 260-298 ≥0.05* 72 H2SO4 Sulfuric Acid H2SO4 • nH2O(l) (50–98 wt.% H2SO4) 200–300 0.7 1.4 73 CH3S(O)CH3 Liquid Water H2O(l) 262–281 0.16–0.08* 2 74 CH3S(O2)CH3 Liquid Water H2O(l) 262–281 0.27–0.08* 2 74 CH3S(O2)OH Liquid Water H2O(l) 260-283 ≥0.1* 74 * Varies with T, see Notes † No data—all measurements; limited by HCl solubility ‡ May be affected by surface saturation γo is an experimental initial reactive uptake coefficient, indicating a reactive uptake that decreases with measurement time.

5-12
5.12 Notes to Table 5-1 1. O on H2O(s). Murray and Plane [346] measured the uptake of O atoms on water ice at temperatures relevant
to the upper mesosphere (112 -151 K), where noctilucent clouds are present. Their results indicate that in the absence of oxygen molecules the uptake coefficient α is small (7 × 10⁻⁶). They recommend the following expression: α = 7 × 10⁻⁶ + 1.5 × 10⁻¹⁰ exp (11.4 kJ/mol/RT), with an uncertainty of ± 24%. Back to Table
2. O on H2SO4 • nH2O. Knudsen cell experiment of Baldwin and Golden [34] measured an uptake coefficient limit of <10–6, this result probably cannot be equated with an accommodation coefficient due to surface saturation. Back to Table
3. O3 on H2O(s) and HNO3 • nH2O. Undoped ice surfaces saturate too quickly for reliable measurements. When ice is doped with Na2SO3 to chemically remove absorbed O3 the apparent α increases to 1 × 10⁻² (0.1M) or up to 4 × 10⁻² (1M) (Dlugokencky and Ravishankara [122]). Limit of γ < 10–6 for undoped ice is consistent with earlier measurement by Leu [294] of ≥1 × 10⁻⁴ and with < 6 × 10⁻⁵ obtained by Kenner et al. [271]. Dlugokencky and Ravishankara also measured the tabulated value of an uptake coefficient for O3 on a NAT “like” surface, but the data were difficult to reproduce and the surfaces were not well characterized. Kenner et al. also measured a lower limit for an uptake coefficient of 8 × 10⁻⁵ on NAT at 183 K, but this measurement is also certainly limited by surface saturation. Back to Table
4. O3 on H2O(l). Utter et al. [453] used a wetted wall flow tube technique with various chemical scavengers to measure a lower limit for α of 2 × 10⁻³. The stopped flow measurement technique using an SO3
2- scavenger (Tang and Lee [437]) is subject to saturation effects, so their quoted α of 5.3 × 10⁻⁴ is also taken as a lower limit. Using a droplet train flow reactor Hu et al. [226] measured a value of ~0.1 at 277 K with I- as a reactive scavenger, consistent with a more extensive droplet train flow reactor measurement by Magi et al. [314] yielding a value of ≥0.1 also using I- as a reactive scavenger. Schurath et al. [399] used a coaxial flow liquid jet to obtain a value of 4.5 × 10⁻³ at 298 K, probably limited by surface saturation although they also used I-as a reactive scavenger. Müller and Heal [344] obtained a value of 4 × 10⁻² at 293 K in a wetted wall flow tube with S2O3
2- as a reactive scavenger. Schütze and Herrmann [400] measured a lower limit of 2 × 10-
2 at 298 K using a suspended droplet flow reactor method that also employed I- as a reactive scavenger. It is highly likely that the mass accommodation coefficent for ozone on liquid water is ≥0.01 between ~275 and 300 K and may be significantly higher, although it is possible that interfacial reactions with near surface I- bias some mass accommodation evaluations high because surface reactive uptake occurs in parallel with mass accommodation. Molecular dynamic simulations of O3
uptake on water by Roeselováet al. [380] indicate a mass accommodation coefficent of order 0.1. Back to Table
5. O3 on H2SO4 • nH2O. Flow tube measurements (Dlugokencky and Ravishankara [122]) of an uptake coefficient limit of <10–6 on both 50 and 97 wt.% H2SO4 surfaces are consistent with earlier, but probably less quantitative, static systems measurements of Olszyna et al. [350] and aerosol chamber measurements of Harker and Ho [211], who report uptake coefficients of the order 10–8 or less for a variety of sulfuric acid concentrations and temperatures. In these earlier experiments, doping the H2SO4 with Ni2+, Cr2+, Al3+, Fe3+, and NH4
+ (Olszyna et al. [350]) or Al2O3 or Fe2O3 (Harker and Ho [211]) did not significantly increase measured O3 loss. An upper limit of 1 × 10⁻⁶ was also reported by Baldwin and Golden [33] for 97 wt.% H2SO4 at 295 K. Il’in et al. [236] performed static tube reactor measurements on 98 wt.% sulfuric acid at 239, 258, 273 K measuring uptake coefficients between 1.2 and 1.75 × 10⁻⁶. Although these measurements are slightly larger than the limits in the other studies, uptake values this small are extremely hard to quantify and these measurements are not seen to be in serious disagreement with other studies finding slightly lower upper limits. All measurements are subject to solubility limitations and probably do not reflect true limits on mass accommodation. Back to Table
6. OH on H2O(s). Cooper and Abbatt [104] analyzed uptake rates in a wall-coated flow tube to determine an initial γ ~ 0.1 over the temperature range of 205 – 230 K. Uptake coefficients decreased at longer exposure times, indicating surface saturation. These data indicate that α is at least 0.1 and possibly much larger. This is confirmed by an earlier experiment using a coated insert/flow tube technique by Gershenzon et al. [166], which yielded α > 0.4 at 253 K. Back to Table
7. OH on H2O(l). A lower limit of α on pure water of 3.5 × 10⁻³ at 275 K was determined by Hanson et al. [194]) using a liquid-wall flow tube. Takami et al. [435] using a gas/liquid impinging flow technique obtained a pure water value near pH 7 at 293 K of (4.2 ± 2.8) × 10-3 while values 2 to 3 times higher where

5-13
obtained for acid (pH=1) and basic (pH=10-13) aqueous solutions; a value of (1.1 ± 0.4) × 10-2 was obtained when benzoic acid was added as a radical scavenger. Takami et al. also observed that uptake for pure water solutions decreased with gas/liquid contact times, indicating a saturation limitation and explaining the higher uptake values observed for solutions with H+, OH-, or benzoic acid reactive scavengers. Based on these experimental results a value of α≥0.1 is suggested. This recommendation is consistent with molecular dynamics calculations by Roeselováet al. [380, 381] who first published simulation values at room temperature 0.2 to 0.3, but later reported a value of 0.83 at 300 K using revised intermolecular potentials. Back to Table
8. HO2 on H2O(l). Determination of α in liquid-wall flow tube (Hanson et al. [194]) is dependent on gas-phase diffusion corrections; measured limit (α >0.02) is consistent with α = 1. In the aqueous salt aerosol measurements of Mozurkewich et al. [340], HO2 was chemically scavenged by Cu++ from added CuSO4 to avoid Henry’s law constraints; the measured limit of >0.2 is also consistent with α = 1. Back to Table
9. H2O on H2O(s). Measurements are available from Leu [293] giving 0.3 (+0.7, –0.1) at 200 K and Haynes et al. [215] (1.06 ± 0.1 to 0.65 ± 0.08) from 20 to 185 K. Brown et al. [66] used molecular beam reflection techniques to measure a value of α = 0.99 ± 0.03 between 85 and 150 K and optical interference methods to obtain α = 0.97 ± 0.10 between 97 and 145 K. Back to Table
10. H2O on H2O(l). Because the uptake of water vapor on liquid water is a fundamental process and plays an extremely important role in cloud physics, it has been the subject of over 40 published experimental studies spanning over eight decades. Many of these studies were reviewed by Marek and Staub [316], who note values of α deduced from these experiments range from ~0.001 to 1.0, with experiments involving growing water drops tending to higher values. Recently several new experiments have been published supporting values nearer the higher end of the range. Shaw and Lamb [413] used an electrodynamic droplet levilation cell to make simultaneous ice nucleation/water droplet evaporation rate observations to deduce a range of 0.04 < α < 0.1, at ~237K. Li et al. [300] used a droplet train flow reactor to measure the uptake of small excesses of H2
17O on water droplets that were in equilibrium with the surrounding normal water vapor, deducing a value of 0.17±0.03 at 280K which increased to 0.32±0.04 at 258K. Winkler et al. [477] used precise Mie scattering analyses of the growth of freshly nucleated droplets in an expansion chamber to deduce 0.4<α<1.0 over a temperature range of 250 to 290 K. Given the precision of these latter two experiments, it seems clear that mass accommodation values of water vapor on liquid water for temperatures below 290 K must exceed 0.1. The Li et al. and Winkler et al. experiments are further discussed in Davidovits et al. [112] which notes that the differences in their deduced values may reflect the different state of the water surface in equilibrium versus supersaturated vapor regimes. Back to Table
11. H2O on HNO3/H2O(l). Rudolf and Wagner[390] used aerosol expansion chamber techniques to illustrate that on liquid water/nitric acid aerosols α is greater than 0.3 and is consistent with 1.0 at 278 K. Experiments are similar to those at Winkler et al. [477]; supersaturated vapor may lead to a larger value of α than found for near equibrium conditions. Back to Table
12. H2O on HNO3•nH2O(s). Middlebrook et al. [328] measured an uptake coefficient of 0.002 for water vapor co-depositing with nitric acid over NAT at 197 K. Back to Table
13. H2O on H2SO4 • nH2O. Baldwin and Golden [33] using a Knudsen cell measured α ~ 2 × 10⁻³ at 96 wt.%, which is strongly affected by surface saturation (see Note for H2O2 on H2SO4 • nH2O). Gershenzon et al. [163] used a droplet train flow reactor to measure the uptake of H2
17O on 50 wt.% sulfuric acid from 250 to 278 K, on 70 wt.% from 250 to 295 K, and on 82 wt.% from 272 to 298 K. Measured mass accommodation coefficients range from 0.4 to 0.9, increasing with acid wt.% and decreasing temperature. Back to Table
14. H2O on NaCl(s). Fenter et al. [135] used Knudsen cell/mass spectrometry methods to measure γ < 2 × 10⁴ for H2O(g) uptake on NaCl powders, an observation confirmed by Beichert and Finlayson-Pitts [53], who found γ < 1 × 10⁻⁵. However, Dai et al. [107] used FTIR spectroscopy on NaCl crystallite films at 240 and 296 K to determine that a water adlayer does adhere to dry salt and that a small fraction of surface sites (<1%) cause H2O dissociation. It is likely that the measurements of Fenter et al. and Beichert and Finlayson-Pitts were affected by surface saturation. Back to Table
15. H2O on NaCl(aq). Fung et al. [155] used Mie resonance scattering techniques to quantify aqueous NaCl droplet growth (5.8 to 7.8 µm), yielding fitted values of α > 0.5 and consistent with 1.0. Such droplet growth measurements require modeling of heat and mass transfer and may not correspond to atmospheric conditions near vapor/liquid equilibrium. Back to Table

5-14
16. H2O2 on H2O(l). Measured accommodation coefficient (Worsnop et al. [483]) has a strong negative temperature dependence over the measured range of 260–292 K, with α = 0.3 at 260 K decreasing to 0.1 at 292 K. Back to Table
17. H2O2 on H2SO4•nH2O. Knudsen cell uptake measurements are subject to surface saturation, thus uptake coefficient value of 7.8 × 10⁻⁴ quoted by Baldwin and Golden [33] is almost certainly a lower limit for α. This effect is probably also responsible for the lack of measured uptake (γ <10–6) for NO, NO2, SO2, Cl2, and other species reported in this reference and Baldwin and Golden [34]. Back to Table
18. NO on H2O(s). NO data (Leu [294], Saastad et al. [391]) subject to same concerns as NO2. See Note for NO2 on H2O(s). Back to Table
19. NO on H2SO4•nH2O. See Notes for H2O2 on H2SO4 • nH2SO4 and NO2 on H2SO4 • nH2O. NO is subject to the same concerns as NO2 for both reported measurements (Saastad et al. [391]; Baldwin and Golden [33]). Back to Table
20. NO2 on H2O(s). In the absence of a chemical sink, Leu [294] measured no sustained uptake of NO2 on ice yielding an apparent α ≤1 × 10⁻⁴. Saastad et al. [391] measured a lower limit of 5 × 10⁻⁵ for temperatures between 193 and 243 K. However these values are probably influenced by surface saturation. Back to Table
21. NO3 on H2O(l). Rudich et al. [388] analyzed uptake on KI solutions as a function of [I-] at 273 K. This work suggested that α > 0.04, but this result may be biased due to reactive uptake by interfacial I-. Back to Table
22. HONO on H2O(s). Fenter and Rossi [137] measured reversible uptake on water ice between 180 and 200 K using a Knudsen cell technique. An initial uptake coefficient of 1 × 10– 3 suggests that α equals or exceeds this value. Chu et al. [86] used a cylindrical flow reactor to measure the uptake coefficient as a function of temperature, obtaining values ranging from 3.7 × 10⁻³ at 178 K to 6.4 × 10⁻⁴ at 200 K, in good agreement with the results of Fenter and Rossi. On the other hand, Chu et al. report significantly lower values after correction for the effects of surface porosity, i.e. 1.4 × 10⁻⁴ at 178 K and 1.3 × 10⁻⁵ at 200 K (see Keyser et al. [275]). Back to Table
23. HNO3 on H2O(s). Leu [293] reports α = 0.3 (+0.7, -0.1). Some additional uncertainty is introduced by effective ice surface area in fast-flow measurement (see Keyser et al. [275]). Hanson [191] measured an uptake coefficient of > 0.3 at 191.5 and 200 K. Aguzzi and Rossi [12] measured an uptake coefficient of 0.3 over the temperature range from 180 to 190 K, the value decreasing at T >195 with an exponential temperature dependence of -(3400 ± 500)/T. They attributed this change to an increasing evaporation rate, concluding that the accommodation coefficient most likely remains large. Abbatt [4] measured equilibrium uptake values at 208 – 248 K on the order of 1 to 3 x 10¹⁴ molecule cm-2. Zondlo et al. [506] report the formation of a supercooled H2O/HNO3 liquid layer at 185 K, forming NAT or NAD only after decreasing the relative humidity below the ice frost point. Hynes et al. [235] measured uptake coefficients as a function of temperature decreasing from 0.03 at 215 K to 0.006 at 235 K. Hudson et al. [229] report initial uptake coefficients ranging from 0.007 at 209 K to 0.003 at 220 K. It appears, thus, that the uptake coefficient is large below 200 K and decreases rapidly as the temperature increases. Back to Table
24. HNO3 on H2O(l). Measurements using a droplet train flow reactor show that α has a strong negative temperature dependence varying from 0.19 ± 0.02 at 268 K to 0.07 ± 0.02 at 293 K (Van Doren et al. [456]). Ponche et al. [357] measured a very consistent mass accommodation coefficient of 0.05 ± 0.01 at 297 K using the same technique. Schütze and Herrmann [400] measured a lower limit of 3 x 10⁻² at 298 K using a suspended droplet flow reactor method, consistent with the droplet train flow reactor measurements. Back to Table
25. HNO3 on HNO3 • nH2O(s). Hanson [191] measured uptake coefficients of >0.3 and >0.2 on NAT surfaces at 191 K and 200 K, respectively. Middlebrook et al. [328] measured an uptake coefficient of 0.7 on NAT at 197 K under conditions where both nitric acid and water vapor were co-depositing. Back to Table
26. HNO3 on HNO3 • nH2O(l). Rudolf and Wagner [390] used aerosol expansion chamber techniques to deduce that α for HNO3 on 278 K H2O/HNO3 droplets is > 0.3 and probably close to 1. The consistency of this value with smaller (~0.2) values measured for uptake on pure water by Van Doren et al. [456] is unclear, since the mechanism of co-condensation is unknown and the composition of the surface in the aerosol expansion chamber experiments may be kinetically controlled and has not been well determined. Back to Table
27. HNO3 on H2SO4•nH2O and H2SO4 • 4H2O(s). Initial uptake at 73 wt.% H2SO4 allows a measurement of α = 0.11 ± 0.01 at 283 K (Van Doren et al. [456]). This value is expected to increase at lower temperatures,

5-15
in a manner similar to H2O(1) uptake (Van Doren et al. [455]). Total HNO3 uptake is subject to Henry’s law solubility constraints, even at stratospheric temperatures (Reihs et al. [365]). Solubility limitations also affected the earlier “sticking coefficient” measurements of Tolbert et al. [443] for 75 wt.% H2SO4 at 230 K. Hanson [191] measured an uptake coefficient of >0.3 for frozen 57.7 wt.% sulfuric acid at 191.5 and 200 K. Baldwin and Golden [33] reported a lower limit of 2.4 × 10⁻⁴ on 97 wt.% H2SO4 at 295 K, also reflecting solubility limits. Iraci et al. [240] monitored nitric acid trihydrate growth on sulfuric acid tetrahydrate with infrared techniques, measuring HNO3 uptake coefficient limits of >0.03 at 192.5 K and >0.08 at 192 K. These measurements involved co-deposition of water vapor. Back to Table
28. HO2NO2 on H2O(s). Li et al. [302] measured an uptake coefficient of 0.15 ±0.10; uptake may be limited by surface saturation. Back to Table
29. HO2NO2 on H2SO4•nH2O(l). Baldwin and Golden [33] measured γ = 2.7 × 10⁻⁵, which is probably solubility limited; see Note for H2O2 on H2SO4 • nH2O. Back to Table
30. NH3 on H2O(l). Ponche et al. [357] used a droplet train technique to obtain α = (9.7 ±0.9) × 10–2 at 290 K, and Bongartz et al.[62] used a liquid jet technique to obtain α = 4.0 (+3.0, –0.05) × 10–2 at the same temperature. These experiments where extended to other temperatures by Carstens et al. [80], demonstrating a negative temperature dependence. Ammonia uptake on liquid water as a function of both pH and temperature was investigated by Shi et al. [415] using a droplet train apparatus, yielding values that also demonstrated negative temperature dependence, varying between 0.08 at 290 K to 0.35 at 260 K. The data from these four studies are all in reasonable agreement and a temperature dependent data plot with a non-linear least squares fit to all of these measurements has been published by Worsnop et al. [482]. Earlier levitated droplet evaporation experiments [438] on NH4Cl obtained a larger evaporation coefficient of α = 0.29 ± 0.03, which is discounted because of the indirect nature of the experiment. Back to Table
31. CO2 on H2O(l). Noyes et al. [348] used a dynamic stirring technique to monitor pressure decreases in a closed cylinder. They inferred α = (5.5 ± 0.5) × 10– 8 at 293 K. This technique is uncalibrated against more widely used procedures and probably suffers from severe surface saturation effects. Schurath et al. [399] employed a coaxial jet flow technique to measure a 298K value of α of 1-2 × 10⁻⁴, noting that its low Henry’s law solubility in water made the measurement very difficult. For this reason the measurement probably also suffered from surface saturation even at their shortest gas/liquid contact times, so this value is most likely a lower limit. Boniface et al. [63] used a bubble train reactor to study the uptake by water as a function of pH. At high pH the reaction of CO2 with OH- partially relieves surface saturation allowing determination that the uptake coefficient, and therefore α, is ≥ 1 × 10⁻⁵, consistent with the value measured by Schurath et al. and completely inconsistent with the much lower value obtained by Noyes et al. [348]. Back to Table
32. CH3OH on H2O(l). Jayne et al. [246] measured uptake from 260–291 K and derived accommodation coefficients fitting α/(1–α) = exp(–ΔG‡
obs/RT), where ΔG‡obs = –8.0 kcal/mol + 34.9 cal mol–1 K–1 T(K). Back
to Table
33. CH3CH2OH on H2O(l). Jayne et al. [246] measured uptake from 260–291 K with a droplet train flow reactor and derived mass accommodation coefficients fitting α/(1–α) = exp(–ΔG‡
obs/RT), where ΔG‡obs = –
11.0 kcal/mol + 46.2 cal mol–1 K–1 T(K). Similar, but somewhat larger values were reported for chloro-, bromo-, and iodo-ethanols. Shi et al. [416] used the same technique to measure the uptake of both normal and deuterated ethanol over the temperature range of 263-291 K as a function of pH. Normal ethanol uptake was not dependent on pH, while the uptake of the deuterated species was enhanced by surface isotopic exchange, especially at high and low pH. The mass accommodation values obtained for normal ethanol obtained by Shi et al. ranged from 0.128±0.023 at 263 K to 0.057±0.005 are consistent, within experimental error, with the lowest temperature value measured by Jayne et al., but are significantly higher above ~275 K. Katrib et al. [269] also used the droplet train technique to measure the ethanol mass accommodation coefficient between ~266 and 281 K, obtaining lower values than those measured by Shi et al., [416] but agreeing with the higher temperature data of Jayne et al. [246]. Katrib et al. obtained mass accommodation coefficients fitting α/(1–α) = exp(–ΔG‡
obs/RT), where ΔG‡obs = –(5.6 ± 1.5) kcal/mol + (27.4 ± 5.5) cal mol–1
K–1 T(K). While the data of Shi et al. and Katrib et al. are off-set by about a factor of three, the negative temperature dependencies measure by the two groups are very similar. The differences between the three data sets are difficult to explain, given that all three used essentially the experimental same technique; the recommended lower limit is consistent with the lower values measured by Katrib et al. [269]. Back to Table

5-16
34. CH3CH2CH2OH and CH3CH(OH)CH3 on H2O(l). Jayne et al. [246] measured uptake coefficients between 260 and 291 K and derived accommodation coefficients fitting α/(1–α) = exp (–ΔG‡
obs/RT), where ΔG‡obs = –9.2 kcal mol–1 + 40.9 cal mol–1 K–1 T(K) for 1-propanol and –9.1 kcal mol–1 +
43.0 cal mol–1 K–1 T(K) for 2-propanol. Similar data for t-butanol were also reported. Back to Table
35. HOCH2CH2OH on H2O(l). Jayne et al. [246] measured uptake coefficients for ethylene gycol between 260 and 291 K and derived accommodation coefficients fitting α/(1 – α) = exp(–ΔG‡
obs/RT), where ΔG‡
obs = –5.3 kcal mol–1 + 24.5 cal mol–1 K–1 T(K). Back to Table
36. CH3O2 on NaCl(s). Gershenzon et al. [165] measured the uptake of CH3O2 on crystalline NaCl(s) in a central rod flow apparatus. They determined a value of γ = (4 ±1) × 10–3 at 296 K, suggesting that α ≥ 4 × 10⁻³. Back to Table
37. CH3OOH on H2O(l). Magi et al. [314] used a droplet train flow reactor to measure α over a temperature range of 261-281 K, showing a negative temperature dependence with values ranging from 9.2 × 10⁻³ at 281 to 20.8 × 10⁻³ at 261 K. Allowing for measurement uncertainty produces a recommendation that α ≥ 7 × 10⁻³ from 260 to 282 K. Back to Table
38. CH2O on H2O(l) and H2SO4 • mHNO3 • nH2O(l). Jayne et al.[249] report uptake measurements for 0 – 85 wt.% H2SO4 and 0 – 54 wt.% HNO3 over a temperature range of 241–300 K. Measured uptake coefficients vary from 0.0027–0.027, increasing with H+ activity (Jayne et al ([249]; Tolbert et al., [441]), and with increasing pH above 7 (Jayne et al., [247]). Reversible uptake is solubility limited through reactions to form H2C(OH)2 and CH3O+. A model of uptake kinetics (Jayne et al., [249]) is consistent with γ = 0.04 ± 0.01 for all compositions. A chemisorbed surface complex dominates uptake at 10 – 20 wt.% H2SO4, and CH3O+ formation dominates above 20 wt.% (Tolbert et al., [441]; Jayne et al. [249], Iraci and Tolbert [241]). Low temperature (197–214 K) uptake studies by Iraci and Tolbert [241] confirm that uptake is solubility limited for uptake coefficients in the 10–3 to 10–2 range even at low temperatures. These chemical mechanisms allow γ to greatly exceed α for strong acidic and basic solutions. A full uptake model for acid solutions is presented in Jayne et al. [249], and for basic solutions in Jayne et al. [247]. XPS surface analysis by Fairbrother and Somorjai [132] failed to see CH3O+ surface species reported by Jayne et al.; however, their sensitivity of 1% of surface coverage is too poor to see the predicted amounts of the surface species. Back to Table
39. CH3CHO on H2O(l). Jayne et al. [247] measured a lower accommodation coefficient limit of > 0.03 at 267 K. Uptake can be limited by Henry's law and hydrolysis kinetics effects—see reference. Back to Table
40. CH(O)CH(O) on H2O (l). Schweitzer et al. [406] used a droplet train flow reactor to investigate the uptake of glyoxyl by water droplets over a temperature range of 263-283 K; measured uptake was near their detection limit. They reported an average α over their experimental temperature range of 2.3 (+1.1/-0.7) × 10-2. Back to Table
41. CH3C(O)CH3 on H2O(l). Duan et al. [125] measured uptake between 260 and 285 K, deriving α = 0.066 at the lower temperature and 0.013 at the higher, with several values measured in between. Measured values fit α /(1–α) = exp(–ΔG‡
obs/RT), where ΔG‡obs = –12.7 kcal/mol + 53.6 cal mol–1 K–1 T(K). Schütze, M. and H.
Herrmann [401] used a single suspended droplet flow reactor to measure the uptake of acetone and several larger carbonyl compounds at 293 K; their value for acetone of α = 5.4(+4.5/-2.6) × 10-3 agrees well with the values of Duan et al. extrapolated to 293 K. Back to Table
42. CH3C(O)CHO on H2O(l). Schütze and Herrmann [401] used a single suspended droplet flow reactor to measure the uptake of 2-oxypropynal at 293 K, their value of α = (1.5±0.5) × 10-4 is lower than those measured for acetone and acetaldehyde. Back to Table
43. CH3OC(O)OCH3 on H2O(l). Katrib et al. [268] measured the uptake of dimethyl carbonate on pure water and 0.1M aqueous NaOH over a temperature range of 270-278 K using a droplet train flow reactor. Uptake was not obviously dependent on [OH-] and displayed a negative temperature dependence with individual measurements varying from (11±2) x 10-2 at 270 K to (1.2±0.9) × 10-2 at 276 K. Although the data are fairly noisy the authors derived a mass accommodation coefficient fitting of α/(1–α) = exp (–ΔG‡
obs/RT), where ΔG‡obs = –(26± 9)kcal mol–1 + (99±35) cal mol–1 K–1 T(K). Similar mass
accommodation data for diethyl carbonate are also presented. Back to Table

5-17
44. HC(O)OH on H2O(l). Jayne et al. [246] measured uptake coefficients for formic acid between 260 and 291 K and derived accommodation coefficients fitting α/(1 – α) = exp(–ΔG‡
obs/RT), where ΔG‡
obs = –7.9 kcal mol–1 + 34.9 cal mol–1 K–1 T(K). Back to Table 45. CH3C(O)OH on H2O(l). Jayne et al. [246] using a droplet train flow reactor measured uptake coefficients for
acetic acid between 260 and 291 K and derived a mass accommodation coefficient fitting α/(1–α) = exp(–ΔG‡
obs/RT), where ΔG‡obs = –8.1 kcal mol–1 + 34.9 cal mol–1 K–1 T(K). Shi et al. [416] used the same
technique to measure the uptake of both normal and deuterated acetic acid at 258 K and pH=7. They obtained α= 0.19 (± 0.03) for normal acetic acid, while the uptake coefficient of the deuterated species was enhanced by surface isotopic exchange, equaling 0.96 (± 0.21). Back to Table
46. Cl2 on H2O(s). Measurement of Leu [293] yielded a limit of <1 × 10⁻⁴ for Cl2 and is subject to same concern as NO2 (see note). A similar limit of <5 × 10⁻⁵ has been measured by Kenner et al. [271], which is also probably limited by surface saturation. Back to Table
47. OClO + H2O(s). Brown et al. [67] and Graham et al. [177] used complementary ultra high-vacuum (UHV) and coated-wall flow tube techniques to show sub-monolayer reversible absorption of OClO on water ice at 100 K (UHV) and 189 and 200 K (flow tube). No kinetic data are available at stratospheric temperatures but the mass accommodation coefficient for 100 K ice surfaces is near unity, with values of 0.8 ± 0.2 reported for amorphous ice and 0.6 ±0.2 for crystalline ice [177]. Back to Table
48. HCl on H2O(s). Leu [293] (0.4; +0.6, –0.2) and Hanson and Ravishankara, [202] (α ≥ 0.3) are in reasonable agreement at stratospheric ice temperatures. More recently, a great deal of experimental effort (Abbatt et al. [6], Koehler et al. [286], Chu et al. [89], Graham and Roberts [175], Graham and Roberts [176]; Rieley et al. [369]) has gone into understanding the uptake of HCl by ice surfaces. Rieley et al. measured α = 0.95 ± 0.05 at 80–120 K. Water ice at stratospheric temperatures can take up a large fraction of a monolayer even at HCl partial pressures typical of the stratosphere. Both the thermodynamic and spectroscopic properties of this absorbed HCl indicate that it has dissociated to ions, forms ionic hydrates, and is highly reactive. These experimental results contrast with initial theoretical calculations that predicted undissociated HCl hydrogen bonded to the ice surface and a very small adsorption probability at stratospheric temperatures (Kroes and Clary [289]); more recent simulations result in higher adsorption energies and theoretical accommodation coefficients of one for 190-K surfaces (Wang and Clary [466]). Recent molecular dynamics calculations by Gertner and Hynes [168] also show that ionic absorption is thermodynamically favorable by about 5 kcal/mole. At HCl partial pressures significantly above those typical of the stratosphere, a liquid surface layer forms on the ice, greatly enhancing the total amount of HCl that the surface can absorb. Back to Table
49. HCl on H2O(1). Recommendation is based on Van Doren et al. [455] and Schweitzer et al. [409]. Using a droplet train flow reactor, Van Doren et al. [455] measured α’s decrease from 0.18 ± 0.02 at 274 K to 0.064 ± 0.01 at 294 K, demonstrating strong negative temperature dependence. Schweitzer et al. [409] used the same technique over a temperature range of 262 to 281 K obtaining values decreasing from 0.24 to 0.13 that agree very well with the Van Doren et al. data. Tang and Munkelwitz [438] have measured a larger (0.45 ±0.4) HCl evaporation coefficient for an aqueous NH4Cl droplet at 299 K. Back to Table
50. HCl on HNO3 • nH2O. There was previously severe disagreement between Hanson and Ravishankara [202] (α ≥ 0.3) for NAT (54 wt.% HNO3), and Leu and coworkers (Moore et al. [337], Leu et al. [295]). However, subsequent experiments at lower HCl concentrations by Leu and coworkers (Chu et al. [89]) as well as Abbatt and Molina [8] are generally consistent with Hanson and Ravishankara. In particular, Abbatt and Molina [8] report a large uptake coefficient (α > 0.2). The measurements of Hanson and Ravishankara are consistent with α = 1. The experiments at stratospherically representative HCl concentrations show that HNO3-rich NAT surfaces adsorb significantly less HCl than H2O-rich surfaces. Back to Table
51. HCl on H2SO4•nH2O. Measurements by Watson et al. [469] at 284 K show α = 0.15±0.01 independent of n for n ≥ 8. Experimental uptake and, therefore, apparent α falls off for n ≤ 8 (≥40 wt.% H2SO4). This behavior is also observed at stratospheric temperature (218 K) by Hanson and Ravishankara [202]. More recent measurements by Robinson et al. [377] extend mass accommodation measurements to lower temperatures, yielding significantly higher values. Solubility constraints also controlled earlier low temperature uptake measurements of Tolbert et al. [443]. A review of the most recent solubility data is presented in Table 5-6. Back to Table
52. HCl on H2SO4 • 4H2O(s). Uptake is a strong function of temperature and water vapor partial pressure (relative humidity) (Zhang et al. [502]), both of which affect adsorbed surface water. Back to Table

5-18
53. ClONO2 on H2O(1). Dieber et al. [119] used a droplet train apparatus to measure the uptake of ClONO2 on NaBr aqueous solutions to deduce the mass accommodation coefficient of 0.108±0.011 at 274.5 K. This value may be affected by the reaction with interfacial Br-. Back to Table
54. Halocarbonyls on H2O(l). Uptake is limited by Henry's law solubility and hydrolysis rate constants (De Bruyn et al. [114, 116] and Georg et al. [159, 161]. Back to Table
55. HBr on H2O(s) and HNO3 • nH2O. Hanson and Ravishankara [201, 203] have reported large uptake coefficients for HBr on 200-K ice and NAT. Lower limits of >0.3 and >0.2 for ice are reported in the two referenced publications, respectively, and a limit of >0.3 is reported for NAT. No surface saturation was observed, leading to the supposition that HBr, like HCl, dissociates to ions on ice surfaces at stratospheric temperatures. Abbatt [1] measured an uptake coefficient lower limit of >0.03 on water ice at 228 K consistent with Hanson and Ravishankara. Rieley et al. [369] measured an α of 1.0 ± 0.05 for water ice at 80–120 K. Flückiger et al. [148] report α values of ~0.2 at 210 K, increasing to ~0.3 at 190 K, while Percival et al. [355] measured an α of 0.03 ± 0.005 for water ice at T > 212 K, and α > 0.1 at T< 212 K, attributing the apparent increase in the uptake coefficient to an increase in the surface area of the ice. More definitive experiments will need to be carried out to resolve the discrepancy. Hudson et al. [228] report α = 0.61 ± 0.06 at 140 K, and α = 0.24 ± 0.05 at 100 K, for HBr pressures ranging from 3 × 10⁻⁸ to 1.4 × 10⁻⁷ Torr. Equilibrium HBr coverages for ice are reported by Chu and Heron [88] at 188 and 195 K, and by Chu and Chu [84] at 180–220 K. The latter authors also report the formation of various solid HBr hydrates. Back to Table
56. HBr on H2O(1). Schweitzer et al. [409] used the droplet train flow reactor technique over a temperature range of 262 to 281 K obtaining values decreasing from 0.16 to 0.0.68. Li et al. [301] and Zhang et al. [494] used the same technique to measure higher values of 0.14±0.02 at 283 K and 0.21± 0.3 at 273 K, respectively. Given the good agreement between the two groups for HCl mass accommodation coefficients on water, there is no obvious reason for the discrepancy of a factor of 2-3 for HBr. Back to Table
57. HOBr on H2O(s). Abbatt [1] measured an uptake coefficient for water ice of 2 × 10⁻³ at 228 K. Chu and Chu [84] report an uptake coefficient corrected for porosity effects in the range 0.11 to 0.007 at 190–218 K, with an exponential temperature dependence of (3809 ± 76)/T, and in the range 2 × 10⁻³ to 6 × 10⁻⁴ at 223-239 K, with an exponential temperature dependence of (4658 ± 456)/T. Chaix et al. [81] measured the uptake coefficient as a function of temperature on three different types of water-ice, obtaining values ranging from ~0.3 at 185 K to ~0.03 at 205 K, with an exponential temperature dependence of (4900 ± 500)/T. Mössinger et al. [338] report an uptake coefficient value of 0.003 at 227 K increasing to 0.040 at 205 K. The four sets of results are in reasonable agreement with each other, and the temperature dependence of the uptake coefficient is attributed predominantly to changes in the evaporation rate. The results indicate that the uptake of HOBr on ice cannot be explained with Langmuir-type adsorption isotherms and that the process is not reversible, possibly involving the formation of hydrates. Using a common precursor model, Flückiger and Rossi [147] have estimated accommodation coefficients α which are considerably larger than the measured uptake coefficients, with α values ranging from 0.18 at 215 K to 0.46 at 190 K. Back to Table
58. HOBr on H2O(l). See Note on HOBr + KBr and NaBr in reactive uptake table. Back to Table
59. HOBr on H2SO4 • nH2O(l). Abbatt [1] measured an uptake coefficient of 0.06 ± 0.02 by measuring HOBr gas phase loss at 228 K. This result may well be a lower limit due to surface saturation effects. Back to Table
60. BrONO2 on H2O(1). Dieber et al. [119] used a droplet train apparatus to measure the uptake of BrONO2 on NaBr aqueous solutions to deduce the mass accommodation coefficient of 0.063±0.021 at 274.5 K. This value may be affected by the reaction with interfacial Br-. Back to Table
61. BrONO2 on H2SO4 • nH2O. Hanson [188] modeled wetted-wall flow reactor data and aerosol flow reactor data to estimate α = 0.80 over a wide range of temperatures and acid concentrations. Back to Table
62. CHBr3 on H2O(s) and H2SO4•nH2O(l). Hanson and Ravishankara [203] investigated the uptake of bromoform on ice and 58 wt.% sulfuric acid at 220 K. No uptake on ice was observed, with a measured uptake coefficient of <6 × 10⁻⁵. Reversible uptake by the sulfuric acid surface was observed with an initial uptake coefficient of >3 × 10⁻³; both measurements are probably limited by surface saturation. Back to Table
63. BrCl on H2O(1). Katrib et al. [267] used a droplet train flow reactor to measure the uptake of BrCl as a function of NaOH concentration over the temperature range of 270-285 K. Data were too noisy to assign a clear temperature dependence, but an average over measurements at 270, 274, 280 and 285 K for higher

5-19
[NaOH} where reactive scavenging relieved solubility constraints yielded α = 0.33±0.18. The recommended lower limit is consistent with this value. Back to Table
64. I2 on H2O(1). Takami et al. [436] used the impinging flow techique to investigate the uptake of I2 at 293 K as a function of pH. While solubility constraints prevented a clear measure of mass accommodation, they modeled high pH data where solubility constraints were relaxed by reactive scavenging by OH- to determine that α≥0.1. Back to Table
65. HI on H2O(1). Schweitzer et al. [409] used the droplet train flow reactor technique over a temperature range of 262 to 281 K, obtaining values decreasing from 0.19 to 0.079. Zhang et al. [494] used the same technique to obtain a value of 0.17±0.02 at 273 K, which is a little less than a factor of two higher than indicated by the Schweitzer et al. measurements for that temperature. Back to Table
66. HOI on H2SO4•nH2O. Knudsen cell studies by Allanic and Rossi [24] measured uptake at several temperatures for 40, 50, and 70 acid wt.%. Time dependent studies show no sign of saturation, so uptake coefficients should correspond to mass accommodation coefficients. Some acid concentration data in the table have been averaged for similar temperatures and rounded to one significant figure. An uncertainty factor of three has been assigned due to the relatively small number of temperature/concentration points studied and a lack of confirming studies from other laboratories. The authors note evidence of HOI disproportionation to form I2, however, this second order reaction is unlikely to occur under atmospheric conditions. Back to Table
67. HF on H2O(s) and HNO3 • nH2O(s). Hanson and Ravishankara [201] attempted to measure the uptake of HF by 200 K water ice and NAT surfaces but were unable to observe measurable adsorption. They surmise that, unlike HCl and HBr, HF does not dissociate to ions on ice or NAT surfaces at 200 K. Lack of measurable uptake is probably due to surface saturation. Back to Table
68. CF2O on H2O(s), HNO3 • nH2O and H2SO4 • nH2O. Uptake coefficient measurements by Hanson and Ravishankara [199] on stratospheric surfaces are probably subject to surface and/or bulk saturation effects and may not represent accommodation coefficient measurements, particularly the lower limits of >3 × 10⁻⁶ reported for water and nitric acid ices. Back to Table
69. CF3COOH on H2O(l). Hu et al. [227] measured mass accommodation coefficients for five haloacetic acids, including trifluoroacetic acid (TFA); the others were mono-, di-, trichloro-, and chlorodifluoro-acetic acids. All displayed negative temperature dependence and values for α of about 0.1 at 273 K. Back to Table
70. SO2 on H2O(1). Using a droplet train flow reactor Worsnop et al.measured an α of 0.11 ± 0.02 with no significant temperature variation over a temperature range of 260–292 K (Worsnop et al. [483]). Ponche et al. [357] measured 0.13 ± 0.01 at 298 K, in agreement with the earlier measurement. Shimono and Koda [417] estimated an α of 0.2 at 293.5 K from analysis of pH-dependent uptake coefficients in a liquid impingement technique. Schurath et al. [399] used a coaxial flow liquid jet to obtain a value of 0.1 at 298 K. Boniface et al. [63] performed more extensive droplet train flow reactor measurements at high pH to relieve solubility constraints, obtaining a negative temperature dependence with α values ranging from 0.43±0.4 at 264 K to 0.175± 0.015 at 291 K, their data can be fit to α/(1–α) = exp(–ΔG‡
obs/RT), where ΔG‡obs=–(7.6 ±
0.6) kcal/mol + (29.2 ± 2.1) cal mol–1 K–1 T(K). Donaldson et al. [123] have used second harmonic generation spectroscopy to detect a chemisorbed SO2 surface species which was predicted from earlier uptake measurements by Jayne et al. [245]; this surface complex may play a role in SO2 heterogeneous reactions on aqueous surfaces. Back to Table
71. SO2 on H2SO4 • nH2O. See Note for H2O2 on H2SO4 • nH2O. Back to Table 72. H2S on H2O(1). Boniface et al. [63] performed droplet train flow reactor measurements over at 260-298 K at
high pH to relieve solubility constraints, measured uptake coefficients were consistent with α≥0.05. Back to Table
73. H2SO4 on H2SO4•nH2O. Poschl et al. [358] measured 0.43< α < 1.0 for 73–98 wt.% H2SO4 at 303 K in a wetted wall flow tube. Lower temperatures and acid concentrations would be expected to lead to larger values of α. As discussed in Poschl et al. [358] this contradicts an indirect measurement of 0.02 < α < 0.09 at 42.5 wt.% at 298 K by Van Dingenen and Raes [454] in a photochemical aerosol reactor. The Poschl et al. [358] result is consistent with room temperature α values very near that measured for (NH4)2SO4 particles in an aerosol flow reactor by Jefferson et al. [250]. Back to Table
5-20
74. CH3S(O)CH3, CH3S(O2)CH3 and CH3S(O2)OH on H2O(l). De Bruyn et al. [115] measured uptake over the temperature range ~262–281 K and derived accommodation coefficients fitting α / (1 – α) = exp(–ΔG‡
obs/RT), where ΔG‡obs =
• –0.12 kcal molecule–1 + 23.1 cal molecule–1 K–1 T(K) for dimethylsulfoxide
• –10.7 kcal molecule–1 + 43.0 cal molecule–1 K–1 T(K) for dimethylsulfone
• –3.50 kcal molecule–1 + 16.7 cal molecule–1 K–1 T(K) for methanesulfonic acid.
Schweitzer et al. [406] used a droplet train flow reactor to investigate the uptake of CH3S(O2)OH by water over a temperature range of 262-281 K, obtaining mass accommodation coefficient values decreasing from 0.17 to 0.11, in excellent agreement with those obtained by De Bruyn et al. [115]. Back to Table

5-21
5.13 Gas/Surface Reaction Probabilities for Surfaces Other Than Soot
Table 5-2. Gas/Surface Reaction Probabilities (γ) for Surfaces Other Than Soot
Gaseous Species Surface Type Surface Composition T(K) γ Uncertainty
Factor Notes
O3 + Surface → Products O3 Alumina Al2O3(s) 210–300 γo<2×10⁻⁴ 1 Sodium Chloride
Sodium Bromide Potaassium Bromide Sea Salt
NaCl(s) NaCl(aq) NaBr(s) NaBr(aq) KBr(s) See Note
223-300 298 300 298 300 300
γo<10-4 γo<10-4 γo<10-4
See Note γo<10-4
γo<2 x 10⁻²
2 2 3 3 3 4
OH + Surface →Products OH Water Ice
Hydrochloric Acid Nitric Acid Ice Sulfuric Acid Sodium Chloride Alumina
H2O(s) HCl • nH2O(l) HNO3 • 3HzO(s) H2SO4 • nH2O(l)
NaCl(s) NaCl(aq) Al2O3(s)
205–230 220
200–228 200–298 245–300
298 250-300
>0.01 >0.2 >0.2 >0.2
γo~10-2
See Note γo<0.1
3
5 6 7 7 8 9 10
HO2 + Surface →Products Water Ice
Sulfuric Acid Sodium Chloride Potassium Chloride
H2O(s) H2SO4 • nH2O(l) (28 wt.%) (55 wt.%) (80–96 wt.%) NaCl(s) KCl(s)
223
275 223 243
245-300 295
0.025
>0.07 >0.05 >0.2
See Note See Note
3
11 11
12 12
H2O + Surface →Products H2O Alumina αAl2O3 295-300 γo<0.2 13 2NO2 + H2O(l) →HONO + HNO3 NO2 Liquid Water
Sulfuric Acid H2O(l) H2SO4 • nH2O (40–98 wt.%) γAl2O3 αAl2O3
270-295 250–325
298 298
<1 x 10⁻³ 5 × 10⁻⁷
γo <1x10⁻⁷ γo <5x10⁻⁵
3
14 15 16 16
2NO2 (N2O4) + MX →Products NO2/N2O4 Sodium Chloride
Sodium Bromide Sea Salt
NaCl(s) NaCl(aq) NaBr(s) See Note for O3 + Sea Salt
298 298 298 298
See Note <1 x 10⁻⁴
See Note See Note
17 17 18 19
NO3 + H2O →HNO3 + OH NO3
Water Ice Liquid Water
H2O(s) H2O(l)
170–200 273
<10–3 2 × 10⁻⁴
20
20 21
NO3 + NaX →Products NO3 Sodium Chloride
Sodium Bromide Sodium Iodide
NaCl(s) NaCl(aq) NaBr(s) NaBr(aq) NaI(aq)
293 273-293
293 273 273
γo <6x10⁻² See Note
γo=0.2±0.1 See Note See Note
2
22 22 23 23 23
N2O5 + H2O →2HNO3 N2O5 Water Ice
Liquid Water Nitric Acid Ice Sulfuric Acid Sulfuric Acid Monohydrate Sulfuric Acid Tetrahydrate Ternary Acid
H2O(s) H2O(l) HNO3 • 3H2O(s) H2SO4 • nH2O(l) H2SO4 • H2O(s) H2SO4 • 4H2O(s) H2SO4 • nHNO3 •nH2O(l)
188–195 260–295
200 195–300 200–300 195–207 195–218
0.02 See Note 4 × 10⁻⁴
See Note*
See Note 0.006
See Note
2 See Note
3 See Note
3 2
24 25 26 27 28 29 27
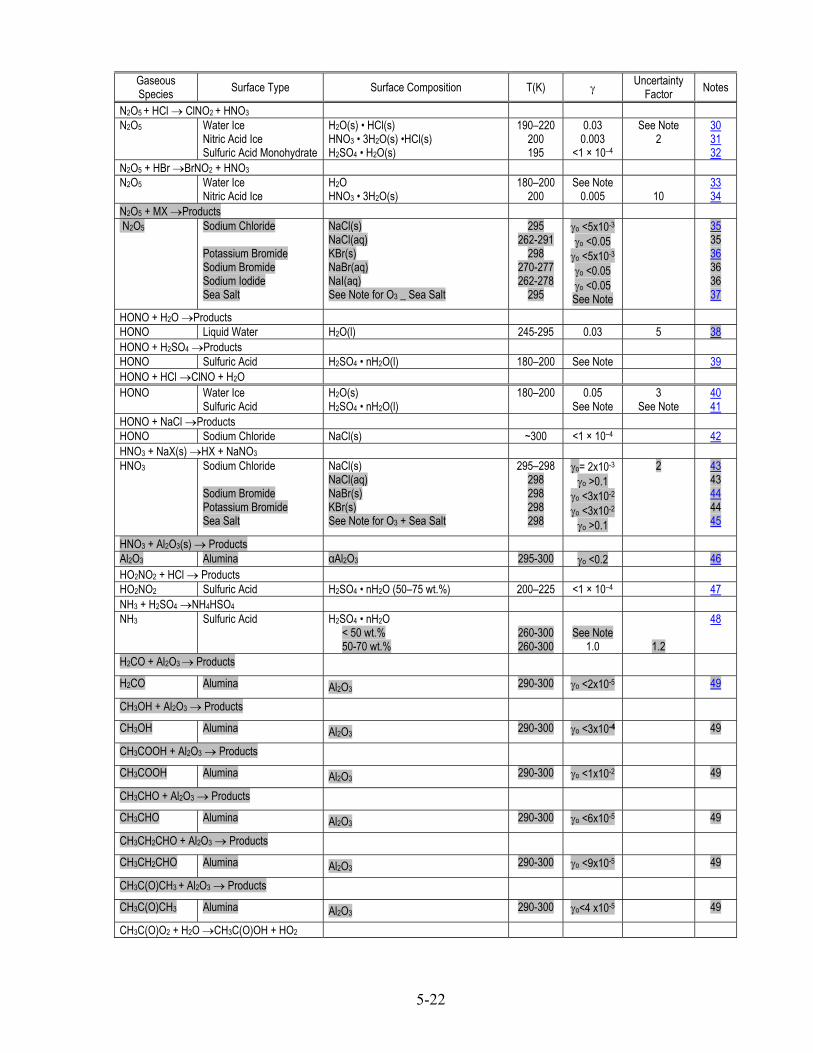
5-22
Gaseous Species Surface Type Surface Composition T(K) γ Uncertainty
Factor Notes
N2O5 + HCl → ClNO2 + HNO3 N2O5 Water Ice
Nitric Acid Ice Sulfuric Acid Monohydrate
H2O(s) • HCl(s) HNO3 • 3H2O(s) •HCl(s) H2SO4 • H2O(s)
190–220 200 195
0.03 0.003
<1 × 10⁻⁴
See Note 2
30 31 32
N2O5 + HBr →BrNO2 + HNO3 N2O5 Water Ice
Nitric Acid Ice H2O HNO3 • 3H2O(s)
180–200 200
See Note 0.005
10
33 34
N2O5 + MX →Products N2O5 Sodium Chloride
Potassium Bromide Sodium Bromide Sodium Iodide Sea Salt
NaCl(s) NaCl(aq) KBr(s) NaBr(aq) NaI(aq) See Note for O3 _ Sea Salt
295 262-291
298 270-277 262-278
295
γo <5x10⁻³ γo <0.05
γo <5x10⁻³ γo <0.05 γo <0.05 See Note
35 35 36 36 36 37
HONO + H2O →Products HONO Liquid Water H2O(l) 245-295 0.03 5 38 HONO + H2SO4 →Products HONO Sulfuric Acid H2SO4 • nH2O(l) 180–200 See Note 39 HONO + HCl →ClNO + H2O HONO Water Ice
Sulfuric Acid H2O(s) H2SO4 • nH2O(l)
180–200
0.05 See Note
3 See Note
40 41
HONO + NaCl →Products HONO Sodium Chloride NaCl(s) ~300 <1 × 10⁻⁴ 42 HNO3 + NaX(s) →HX + NaNO3 HNO3 Sodium Chloride
Sodium Bromide Potassium Bromide Sea Salt
NaCl(s) NaCl(aq) NaBr(s) KBr(s) See Note for O3 + Sea Salt
295–298 298 298 298 298
γo= 2x10⁻³ γo >0.1
γo <3x10⁻² γo <3x10⁻²
γo >0.1
2
43 43 44 44 45
HNO3 + Al2O3(s) → Products Al2O3 Alumina αAl2O3 295-300 γo <0.2 46 HO2NO2 + HCl → Products HO2NO2 Sulfuric Acid H2SO4 • nH2O (50–75 wt.%) 200–225 <1 × 10⁻⁴ 47 NH3 + H2SO4 →NH4HSO4 NH3 Sulfuric Acid H2SO4 • nH2O
< 50 wt.% 50-70 wt.%
260-300 260-300
See Note
1.0
1.2
48
H2CO + Al2O3 → Products
H2CO Alumina Al2O3 290-300 γo <2x10⁻⁵ 49
CH3OH + Al2O3 → Products
CH3OH Alumina Al2O3 290-300 γo <3x10⁻⁴ 49
CH3COOH + Al2O3 → Products
CH3COOH Alumina Al2O3 290-300 γo <1x10⁻² 49
CH3CHO + Al2O3 → Products
CH3CHO Alumina Al2O3 290-300 γo <6x10⁻⁵ 49
CH3CH2CHO + Al2O3 → Products
CH3CH2CHO Alumina Al2O3 290-300 γo <9x10⁻⁵ 49
CH3C(O)CH3 + Al2O3 → Products
CH3C(O)CH3 Alumina Al2O3 290-300 γo<4 x10⁻⁵ 49
CH3C(O)O2 + H2O →CH3C(O)OH + HO2
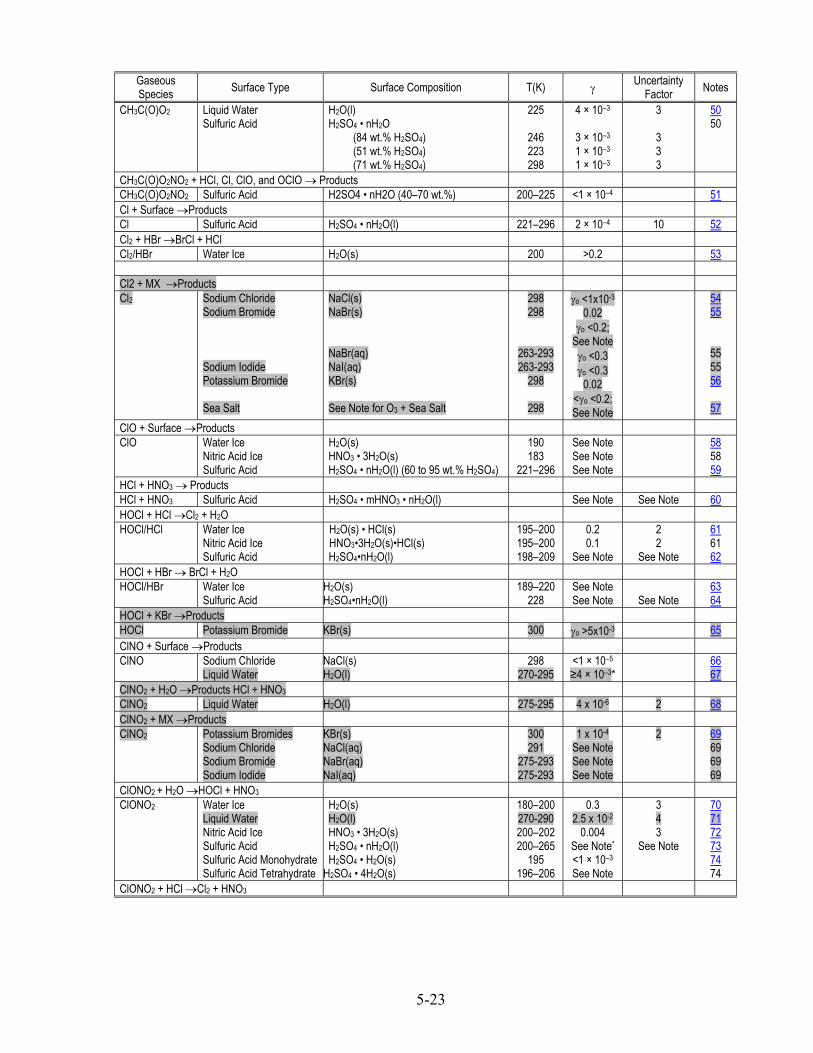
5-23
Gaseous Species Surface Type Surface Composition T(K) γ Uncertainty
Factor Notes
CH3C(O)O2 Liquid Water Sulfuric Acid
H2O(l) H2SO4 • nH2O (84 wt.% H2SO4) (51 wt.% H2SO4) (71 wt.% H2SO4)
225
246 223 298
4 × 10⁻³
3 × 10⁻³ 1 × 10⁻³ 1 × 10⁻³
3 3 3 3
50 50
CH3C(O)O2NO2 + HCl, Cl, ClO, and OClO → Products CH3C(O)O2NO2 Sulfuric Acid H2SO4 • nH2O (40–70 wt.%) 200–225 <1 × 10⁻⁴ 51 Cl + Surface →Products Cl Sulfuric Acid H2SO4 • nH2O(l) 221–296 2 × 10⁻⁴ 10 52 Cl2 + HBr →BrCl + HCl Cl2/HBr Water Ice H2O(s) 200 >0.2 53 Cl2 + MX →Products Cl2 Sodium Chloride
Sodium Bromide Sodium Iodide Potassium Bromide Sea Salt
NaCl(s) NaBr(s) NaBr(aq) NaI(aq) KBr(s) See Note for O3 + Sea Salt
298 298
263-293 263-293
298
298
γo <1x10⁻³ 0.02
γo <0.2; See Note γo <0.3 γo <0.3
0.02 <γo <0.2; See Note
54 55
55 55 56
57 ClO + Surface →Products ClO Water Ice
Nitric Acid Ice Sulfuric Acid
H2O(s) HNO3 • 3H2O(s) H2SO4 • nH2O(l) (60 to 95 wt.% H2SO4)
190 183
221–296
See Note See Note See Note
58 58 59
HCl + HNO3 → Products HCl + HNO3 Sulfuric Acid H2SO4 • mHNO3 • nH2O(l) See Note See Note 60 HOCl + HCl →Cl2 + H2O HOCl/HCl Water Ice
Nitric Acid Ice Sulfuric Acid
H2O(s) • HCl(s) HNO3•3H2O(s)•HCl(s) H2SO4•nH2O(l)
195–200 195–200 198–209
0.2 0.1
See Note
2 2
See Note
61 61 62
HOCl + HBr → BrCl + H2O HOCl/HBr Water Ice
Sulfuric Acid H2O(s) H2SO4•nH2O(l)
189–220 228
See Note See Note
See Note
63 64
HOCl + KBr →Products HOCl Potassium Bromide KBr(s) 300 γo >5x10⁻³ 65 ClNO + Surface →Products ClNO Sodium Chloride
Liquid Water NaCl(s) H2O(l)
298 270-295
<1 × 10⁻⁵
≥4 × 10–3*
66 67
ClNO2 + H2O →Products HCl + HNO3 ClNO2 Liquid Water H2O(l) 275-295 4 x 10⁻⁶ 2 68 ClNO2 + MX →Products ClNO2 Potassium Bromides
Sodium Chloride Sodium Bromide Sodium Iodide
KBr(s) NaCl(aq) NaBr(aq) NaI(aq)
300 291
275-293 275-293
1 x 10⁻⁴ See Note See Note See Note
2 69 69 69 69
ClONO2 + H2O →HOCl + HNO3 ClONO2 Water Ice
Liquid Water Nitric Acid Ice Sulfuric Acid Sulfuric Acid Monohydrate Sulfuric Acid Tetrahydrate
H2O(s) H2O(l) HNO3 • 3H2O(s) H2SO4 • nH2O(l) H2SO4 • H2O(s)
H2SO4 • 4H2O(s)
180–200 270-290 200–202 200–265
195 196–206
0.3 2.5 x 10⁻²
0.004 See Note*
<1 × 10⁻³ See Note
3 4 3
See Note
70 71 72 73 74 74
ClONO2 + HCl →Cl2 + HNO3

5-24
Gaseous Species Surface Type Surface Composition T(K) γ Uncertainty
Factor Notes
ClONO2/HCl Water Ice Nitric Acid Ice Sulfuric Acid Sulfuric Acid
Monohydrate Sulfuric Acid Tetrahydrate Alumina
H2O(s) HNO3•3H2O•HCl H2SO4•nH2O(l)•HCl(l) H2SO4•H2O(s) H2SO4 • 4H2O(s) Al2O3
180–200 185–210 195–235
195
195–206 180–200
0.3 0.2
See Note <1 × 10⁻⁴
See Note
0.3
3 2
See Note 3
75 76 77 78
78 79
ClONO2 + MX →Products ClONO2 Sodium Chloride
Potassium Bromide Sodium Bromide Sea Salt
NaCl(s) NaCl(aq) KBr(s) NaBr(aq) See Note for O3 + Sea Salt
295
272-280 298
272-280 298
0.005 <γo <0.2: See Note
>0.1 See Note
>0.1
80
80 81 81 82
ClONO2 + HBr →BrCl + HNO3 ClONO2/HBr Water Ice
Nitric Acid Ice H2O(s) • HBr(s) HNO3•3H2O(s)•HBr(s)
200 200
>0.3 >0.3
83 83
ClONO2 + HF →Products ClONO2/HF Water Ice
Nitric Acid Ice H2O(s) • HF(s) H2O(s)•HNO3(s)•HF(s)
200 200
See Note See Note
84 84
CF×Cly + Al2O3 → Products CCl4 CFCl3 CF2Cl2 CF3Cl
Alumina Alumina Alumina Alumina
Al2O3(s) Al2O3(s) Al2O3(s) Al2O3(s)
120–300 120–300 120–300 120–300
1 × 10⁻⁵
1 × 10⁻⁵ 1 × 10⁻⁵ 1 × 10⁻⁵
10 10 10 10
85 85 85 85
BrCl + MX → Products BrCl Sodium Chloride
Potassium Bromide Sodium Iodide
NaCl(s) KBr(s) NaI(aq)
298 298
273-288
See Note See Note See Note
86 86 86
Br2 + MX → Products Br2 Sodium Chloride
Potassium Bromide Sodium Iodide
NaCl(s) KBr(s) NaI(aq)
298 298
263-293
See Note See Note γo <0.5
87 87 87
2BrO → Br2 + O2 BrO Water Ice
Sulfuric Acid Aqueous Sodium Chloride
H2O(s) H2SO4 • nH2O (60 wt.% H2SO4) (70 wt.% H2SO4) NaCl(aq) (23 wt.% NaCl)
213
213 213 53
See Note
See Note See Note See Note
88
88 88 88
HOBr + HCl → BrCl + H2O HOBr/HCl Water Ice
Sulfuric Acid H2O(s) • HBr(s) H2SO4 • nH2O (60–69 wt.% H2SO4)
180–228 198–218
0.3 See Note
3
89 90
HOBr + HBr → Br2 + H2O HOBr/HBr Water Ice
Sulfuric Acid H2O(s) • HBr(s) H2SO4 • nH2O
180-228 228
>0.1 See Note
91 91
HOBr + MX → Products HOBr Sodium Chloride
Alkali Bromides Potassium Bromide Sodium Bromide
NaCl(s) NaCl(aq) KBr(s) NaBr(s) NaBr(aq)
298 298 298 250 298
γo <10-2
γo >0.2 γo ≤0.2
See Note γo = 0.6
1.5
92 92 93 93 93
BrNO2 + H2O → Products BrNO2 Liquid Water H2O(l) 275-300 2 x 10⁻⁶ 2 94 BrNO2 + MX → Products
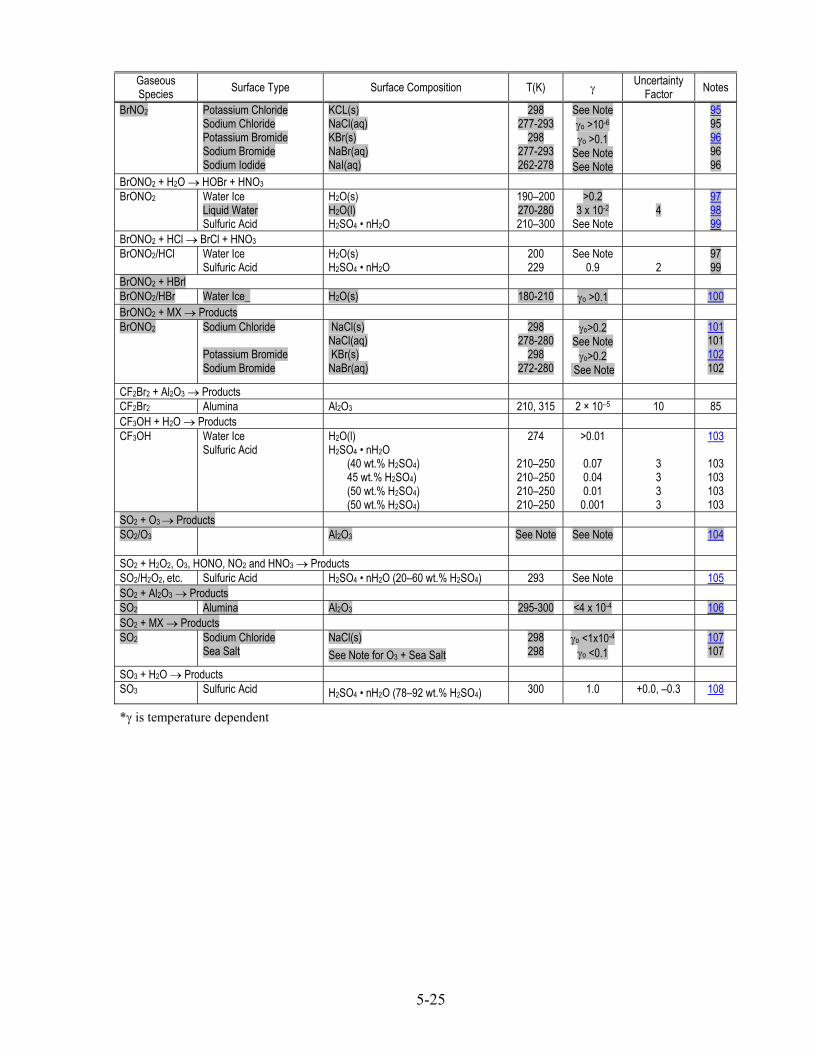
5-25
Gaseous Species Surface Type Surface Composition T(K) γ Uncertainty
Factor Notes
BrNO2 Potassium Chloride Sodium Chloride Potassium Bromide Sodium Bromide Sodium Iodide
KCL(s) NaCl(aq) KBr(s) NaBr(aq) NaI(aq)
298 277-293
298 277-293 262-278
See Note γo >10-6 γo >0.1
See Note See Note
95 95 96 96 96
BrONO2 + H2O → HOBr + HNO3 BrONO2 Water Ice
Liquid Water Sulfuric Acid
H2O(s) H2O(l) H2SO4 • nH2O
190–200 270-280 210–300
>0.2 3 x 10⁻²
See Note
4
97 98 99
BrONO2 + HCl → BrCl + HNO3 BrONO2/HCl Water Ice
Sulfuric Acid H2O(s) H2SO4 • nH2O
200 229
See Note 0.9
2
97 99
BrONO2 + HBrl BrONO2/HBr Water Ice_ H2O(s) 180-210 γo >0.1 100 BrONO2 + MX → Products BrONO2 Sodium Chloride
Potassium Bromide Sodium Bromide
NaCl(s) NaCl(aq) KBr(s) NaBr(aq)
298 278-280
298 272-280
γo>0.2 See Note
γo>0.2 See Note
101 101 102 102
CF2Br2 + Al2O3 → Products CF2Br2 Alumina Al2O3 210, 315 2 × 10⁻⁵ 10 85 CF3OH + H2O → Products CF3OH Water Ice
Sulfuric Acid H2O(l) H2SO4 • nH2O (40 wt.% H2SO4) 45 wt.% H2SO4) (50 wt.% H2SO4) (50 wt.% H2SO4)
274
210–250 210–250 210–250 210–250
>0.01
0.07 0.04 0.01
0.001
3 3 3 3
103
103 103 103 103
SO2 + O3 → Products SO2/O3 Al2O3 See Note See Note 104
SO2 + H2O2, O3, HONO, NO2 and HNO3 → Products SO2/H2O2, etc. Sulfuric Acid H2SO4 • nH2O (20–60 wt.% H2SO4) 293 See Note 105 SO2 + Al2O3 → Products SO2 Alumina Al2O3 295-300 <4 x 10⁻⁴ 106 SO2 + MX → Products SO2 Sodium Chloride
Sea Salt NaCl(s) See Note for O3 + Sea Salt
298 298
γo <1x10⁻⁴ γo <0.1
107 107
SO3 + H2O → Products SO3 Sulfuric Acid H2SO4 • nH2O (78–92 wt.% H2SO4) 300 1.0 +0.0, –0.3 108
*γ is temperature dependent

5-26
5.14 Notes to Table 5-2
1. O3 + Al2O3(s). Very low ozone decomposition efficiencies for reaction on coarse (3 µm dia.) and fine (0.1 µm dia., partially hydroxylated) γ-alumina and coarse (3 µm dia.) α-alumina were measured in flowing and static systems by Hanning-Lee et al. [187] at temperatures ranging between 212 and 473 K. Based on measured BET surface areas, γs ranged from 2 × 10–11 to 4 × 10⁻¹⁰ over the 212 to 298 K temperature range. γs for γ-alumina at lower temperatures exceeded those for α-alumina. Results are roughly consistent with earlier, unpublished flow tube data from L. F. Keyser and from fluidized bed reactor studies of Alebić-Juretić et al. [20]. Note that γs based on geometric surface particle surface areas would be significantly (104–107) larger. Additional fluidized bed reactor studies by Alebić-Juretić et al. [21] demonstrated that room temperature uptake are initially first order in O3, but change to a slower second order reaction at longer exposure times. Klimvskii et al. [282] reported an initial uptake coefficient (γο) of 1 × 10⁻⁴ on a γ-alumina surface at 293K assuming a geometric surface area, BET surface correction presumably would have yielded a lower value. Michel et al. [324, 325] reported Knudsen cell uptake studies at 296K on α-alumina particles that yielded γo values of (8±5) × 10-5 and (1.4 ± 0.3) × 10-4 after BET surface area corrections. Sullivan et al. [429] used a coated wall flow reactor to obtain 298K γo values of 7 × 10⁻⁶ to 1,6 × 10⁻⁵ for α-alumina powder films exposed to no more than [O3] of 1013 cm-3 after BET surface area correction. Higher [O3] yielded lower apparent γos. Usher et al. [452] demonstrated the pretreatment of α-alumina with HNO3 vapor reduced O3 Knudsen cell γo values by ~70%. Back to Table
2. O3 + NaCl. The reaction of O3 with NaCl is slow. Il'in et al. [236] measured the loss of O3 in a coated reactor over the temperature range 223 - 305 K, and found the same uptake coefficients, γ ~ 10-6, independent of temperature, for NaCl and NH4NO3 and (NH4)2SO4, suggesting that even the small uptake is not due to reaction with the chloride. Alebić-Juretić [20] did not observe any uptake on NaCl powders using a fluidized bed reactor but did not report an upper limit to the uptake coefficient. Akimoto and coworkers [332, 394], reported an upper limit of γo < 1 × 10⁻⁵ on NaCl. When the NaCl was mixed with 0.5 - 1% w:w FeCl3, γ0 increased to 3 × 10⁻² and production of gaseous Cl2 was observed with yields from 25 - 50% of the ozone taken up. With 0.1 % FeCl3, no production of Cl2 was observed but the initial uptake coefficient was still 3 × 10⁻². These experiments were carried out with a Knudsen cell using multiple salt layers and the measured initial uptake coefficients were converted to the reported values using the pore diffusion model of Keyser et al. [274, 275].
Abbatt and Waschewsky [10] followed O3 in a flow tube containing deliquesced 1 - 5 μm NaCl particles (75% RH); no significant loss was observed on unbuffered particles or particles buffered at pH of 7.2. An upper limit of γo < 1 ×10⁻⁴ was derived from these measurements. Back to Table
3. O3 + NaBr and KBr. Mochida et al. [332] did not observe any uptake of O3 on NaBr or KBr powders, from which they derived an upper limit of γ < 1 ×10⁻⁵. Hirokawa et al. [218] reported production of gas phase Br2 from the reaction of O3 with NaBr only when water vapor was added so that the salt was near deliquescence.
Uptake of O3 and production of gas phase Br2 has been observed for deliquesced NaBr salt on a glass surface [29]. Production of Br2 has also been measured by Hunt et al. [231] in the reaction of O3 with deliquesced NaBr particles in the dark in an aerosol chamber; the production of Br2 exceeded that from known aqueous phase chemistry by about an order of magnitude, suggesting that a surface reaction of O3 with bromide at the air-solution interface was occurring with a reaction probability of γ0 = (1.9 ± 0.8) × 10-6 (2 σ). Back to Table
4. O3 + sea salt. Akimoto and coworkers [332, 394], reported uptake coefficients for O3 on synthetic and natural sea salt powders of ~ 1 × 10⁻³ using a Knudsen cell with multiple salt layers. Similar uptake coefficients were reported for the hydrates of MgBr2 and CaBr2. These are the initial uptake coefficients after correction for the available surface area using the pore diffusion model of Keyser et al. [274, 275]. The measured values before this correction was applied were about a factor of 20 larger. Given the uncertainty associated with these corrections, the final values derived have a large uncertainty associated with them as well. When FeCl3 was added to synthetic sea salt (Fe/Na weight ratio of 1%), the uptake coefficient increased by an order of magnitude to (3.2 ± 1.1) × 10-2. Br2 was the gas phase product, with variable yields up to 100% of the O3 lost. The enhanced reactivity of sea salt compared to NaCl and NaBr is due to the significant amounts of surface-adsorbed water (SAW) present on sea salt; the component of sea salt present in
5-27
the second highest concentration is magnesium chloride which forms a stable hydrate and is quite hygroscopic. Reactions with powders of MgCl2•6H2O and sea salt are often observed to be similar to reaction with aqueous salt solutions (see note on SO2 uptake). The formation of Br2 is favored over Cl2 by a number of factors: (1) surface segregation of bromide ions [170, 171, 490] in mixed solid crystals of NaCl and NaBr; (2) higher solubility of NaBr which increases its concentration in the surface layer as a mixture of NaCl and NaBr crystallizes; (3) faster oxidation of Br- compared to Cl-; [143, 181, 182, 384], (4) solution phase chemistry of chloride and bromide ion mixtures that favors the production of gas phase bromine compounds; [143, 384], (5) enhanced interfacial bromide ion concentrations compared to chloride ions at the air-water interface of aqueous solutions of mixed salts [253, 254]. Back to Table
5. OH + H2O(s). Cooper and Abbatt [104] measured initial irreversible OH uptake coefficients of ~ 0.1 for water ice between 205–230 K; these decayed to γ = 0.03 ±0.02 after repeated exposure to OH. Self-reaction to form H2O or H2O2 was indicated by the lack of observable gas phase products despite observation of first-order OH loss. Back to Table
6. OH + HCl • nH2O(l). Cooper and Abbatt [104] demonstrated significant enhancement of OH uptake (to γ > 0.2) after HCl doping of 220 K ice surfaces sufficient to melt the surface layer. It is unclear whether OH is lost to self-reaction or reaction with hydrated Cl– ions. Back to Table
7. OH + HNO3 • 3H2O. Cooper and Abbatt [104] measured γ > 0.2 for nitric acid-doped ice surfaces under conditions suitable for NAT formation at 200 and 228 K. Increase over pure ice uptake rates is probably due to HNO3 + OH → H2O + NO3 reaction. Back to Table
8. OH + H2SO4 • nH2O. Lower limits of 0.2 for uptake coefficients on 45–65 wt.% H2SO4 between 220 and 230 K and for 96 wt.% H2SO4 at 230 and 298 K by Cooper and Abbatt [104] are consistent with a lower limit of 0.07 on 28 wt.% H2SO4 at 275 K in similar experiments by Hanson et al. [194] and a probable surface saturated value of (4.9 ±0.5) × 10–4 from Knudsen cell measurements by Baldwin and Golden [34] and an estimate of γ = 1 on ~96 wt.% H2SO4 at 298 K by Gerhenzon et al. [166] using a coated insert flow tube technique. Uptake is probably reactive with OH + HSO4
– → H2O + SO4– the hypothesized process. Back to
Table
9. OH + NaCl. Ivanov et al. [242] measured the uptake of OH on NaCl and on NH4NO3 over the temperature range from 245 - 340 K using a fast flow discharge reactor with a coated rod along the axis and EPR detection of OH. The initial values of the uptake coefficient approached 10-2. The OH was generated from the reaction of H atoms with excess NO2; it is not clear whether NO2 might have also reacted with the salt surface. Given that the uptake coefficients were similar for NaCl and NH4NO3, the uptake likely does not reflect oxidation of the chloride. The pseudo-steady state value, γss, was measured to be 4 × 10⁻³ at 298 K and the temperature dependence was described by γss = (1.2 ± 0.7) × 10-5 exp[(1750 ± 200)/T].
Aerosol chamber studies by Finlayson-Pitts and coworkers showed that there was no Cl2 production from NaCl particles when OH was generated by reaction of O(1D) from photolysis of O3 at relative humidities below the deliquescence point of NaCl; above the deliquescence point, however, a rapid reaction of OH with Cl- at the interface to generate gas phase Cl2 is observed [283, 352]. Because the mechanism is uncertain, and clearly must involve multiple steps, a unique value of the reaction probability for this interface reaction could not be obtained. Back to Table
10. OH on Al2O3(s). Measured value is from flow tube experiment with native oxide on aluminum as the active surface. An uptake coefficient of 0.04 ± 0.02 independent of temperature over the range of 253–348 K was recommended by (Gershenzon et al. based on three measured values ranging unsystematically from 0.02 to 0.06 at 253, 298 and 348 K [166]). Back to Table
11. HO2 + H2O(s) and H2SO4 • nH2O(l). Uptake of HO2 on ice and super-cooled 55 wt.% sulfuric acid at 223 K has been demonstrated to be limited by HO2 surface saturation by Cooper and Abbatt [104]. They argue that self-reaction, presumably 2HO2 → H2O2 + O2 is limiting measured uptake coefficients of 0.025 ±0.005 for ice and 0.055 ±0.020 for 55 wt.% H2SO4. However, Gershenzon et al. [165] measured γ > 0.2 for 80 and 96 wt.% H2SO4 at 243 K and Hanson et al. [194] measured a lower limit for 28 wt.% H2SO4 at 275 K of 0.07. However, large gas phase diffusion corrections mean this value is consistent with γ = 1. Back to Table
12. HO2 + NaCl(s) and KCl(s). Gershenzon and coworkers [165, 366] used a combination of matrix isolation EPR and gas phase EPR with a fast flow tube to measure the uptake of HO2 on NaCl from 245 - 335 K. Early studies by Gershenzon et al. [165] measured values of γ = 1.8 × 10⁻² for KCl and 1.6 × 10⁻² for NaCl, both at

5-28
295 K, supplementing an even earlier value of γ ~ 8 × 10⁻³ measured by Gershenzon and Purmal [167]. In later studies on NaCl [366] the uptake was reported to remain constant for at least 30 min, so this is likely to be a steady-state value, γss = 1.2 × 10⁻² at 295 K. The temperature dependence is given by γss = (5.7 ± 3.6) × 10-5 exp[(1560 ± 140)/T]. Above 330 K, the uptake coefficient was significantly smaller than expected from this temperature dependence. The data are indistinguishable, within experimental error, from the uptake of HO2 on NH4NO3, suggesting that the uptake of HO2 likely involves recombination on the surface rather than oxidation of the chloride. The surface recombination was interpreted in terms of a combined Eley-Rideal and Langmuir-Hinshelwood mechanism. The addition of small amounts of water vapor decreased the uptake coefficient for HO2; the authors attributed this to water adsorption on the active sites. Another possibility is formation of HO2-H2O complexes whose uptake and recombination on the surface is not as fast as for uncomplexed HO2. Back to Table
13. H2O (g) + Al2O3 (s). Isotopic thermal programmed desorption studies at 300K by Elam et al. [129] show that H2O dissociatively absorbs on α-alumina surfaces and that initial uptake coefficient (γo) is ~0.1. Pre-hydroxylation or long term exposure to water vapor decreases the H2O uptake coefficient nearly exponentially. Al Albadeleh et al. [18] used FTIR techniques to study water vapor uptake at 296K on α-alumina crystal 0001 surfaces as a function of relative humidity (RH). Below 10% RH uptake is dissociative, but molecular absorption dominates uptake between 10 and 70% RH. FTIR spectra of water absorbed on both α-alumina and γ-alumina powder surfaces are similar to those on 0001 crystal surfaces. Goodman et al. [173] used FTIR to show that α-alumina surfaces saturated with HNO3 vapor has the same water absorption isotherm as untreated samples at 296 K. Back to Table
14. NO2 + H2O(1). Value for γ of (6.3 ± 0.7) × 10–4 at 273 K (Tang and Lee, [437]) was achieved by chemical consumption of NO2 by SO3
2-; their stopped-flow measurement was probably still affected by surface saturation, leading to the measurement of a lower limit. Ponche et al. [357] measured an uptake coefficient of (1.5 ± 0.6) × 10–3 at 298 K, which was also probably subject to saturation limitations. Mertes and Wahner [323] used a liquid jet technique to measure a lower limit of γ ≥ 2 × 10⁻⁴ at 278 K, and they observed partial conversion of the absorbed NO2 to HONO. Msibi et al. [342] used a cylindrical/annular flow reactor to derive γ = (8.7 ± 0.6) × 10–5 on pH = 7 deionized water surfaces and (4.2 ± 0.9) × 10–4 on pH = 9.3 wet ascorbate surfaces; it seems likely that these results are also subject to surface saturation given the gas/surface interaction times involved in the experiment. Harrison and Collins [212] performed aerosol flow reactor experiments on deliquescent sodium chloride and ammonium sulfate droplets at 279 K obtaining reactive uptake coefficients in the range of (2.8-10) × 10-4, probably with some surface saturation constraints. Cheung et al. [82] used a droplet train flow reactor to show that the reactive uptake coefficient for NO2 at number densities between 1013 and 1016 on pure water at 273 K is <5 × 10⁻⁴, contradicting many of the earlier experiments. Cheung et al. also used a bubble train reactor to demonstrate that the reactive uptake of NO2 is second order, so that experimental uptake coefficients will be dependent on gas phase NO2 concentrations. Data are consistent with a reactive uptake coefficient of <1 × 10⁻³ for 270–295 K and a liquid-phase second-order hydrolysis of NO2 to HONO and HNO3 which depends on temperature and pH. However, the interplay between accommodation, possible surface reaction, and bulk reaction may be complex. Back to Table
15. NO2 + H2SO4 • nH2O. Kleffman et al. [281] performed bubble tube reactor uptake measurements for 0–98 wt.% acid at 298 K and for 44.6 and 56.1 wt.% from 250–325 K. At 298 K, measured uptake coefficients varied between 6 and 3 × 10⁻⁷ with a minimum near 70 wt.%. Most measurements at 44.6 and 56.1 wt.% overlapped within their error limits and showed little temperature dependence although there is evidence that uptake increases at the lowest temperatures. The data can all be captured with a recommended value of 5 × 10⁻⁷ with an uncertainty factor of three.
This recommendation is consistent with earlier upper limits of 1 × 10⁻⁶ by Baldwin and Golden [33] for 96 wt.% at 295 K and 5 × 10⁻⁶ for 70 wt.% between 193 and 243 K by Saastad et al. [391]. Kleffman et al. [281] conclude that their uptake measurements are mass accommodation limited; however, it is not clear that their values are not influenced by bulk or surface reaction of two NO2 with H2O to form HONO and HNO3 at lower acid wt.% values and the formation of nitrosyl sulfuric acid at higher acid concentrations. Kleffman et. al. [281] did perform separate static wetted wall reactor studies showing the formation of gas phase HONO at acid concentrations below 60 wt.%. It is more likely that reactive uptake is a controlling factor and the measured uptakes are solubility and/or reaction rate limited. Thus, the mass accommodation coefficient may be much larger than the recommended uptake values. Back to Table
5-29
16. NO2 on Al2O3. Miller and Grassian [330] observed NO2 absorbed reactively on γ-alumina using FTIR and UV spectroscopy to observe surface nitrite and nitrate. Underwood et al. [448-450] report Knudsen cell studies measuring γo values on γ-alumina particles of 2 × 10⁻⁸, 2.0 × 10⁻⁸, and 2.2 × 10⁻⁸ at 298K based on BET surface area corrections and either KML [272] or linear mass dependent (LMD) corrections for porosity, with the KML and LMD corrections leading to very similar values [448]. They also report larger γo values for α-alumina of 9.3 × 10⁻⁶ and 9.1 × 10⁻⁶ [448, 450]. Underwood et al. [450] also suggest a final “multiple collision” that would raise the γo values for γ-alumina by factor of 1,1 and α-alumina by 9.4. This proposed correction is not included in the recommended upper limits. Börensen et al. [64] report diffuse reflectance FTIR measurements of uptake on γ-alumina showing that the reaction order is 1.86±0.1 in NO2. They report BET corrected γo values varying linearly from 7.3 × 10⁻¹⁰ to 1.3 × 10⁻⁸ as [NO2] was increased from 2.5 × 10¹³ to 8.5 × 10¹⁴. Back to Table
17. NO2/N2O4 + NaCl. Schroeder and Urone reported that NO2 at Torr concentrations reacted with NaCl to form ClNO [397]. Subsequently, Finlayson-Pitts [142] showed that the reaction contined at ppm concentrations of NO2 and estimated a lower limit to the uptake coefficient for NO2 of 5 × 10⁻⁸, assuming the reaction was first order in NO2. Winkler et al. [478] used XPS to follow the increase in nitrate during the reaction of NO2 with NaCl and reported that the rate was proportional to the square of the NaCl surface sites and the square root of NO2. Vogt and Finlayson-Pitts [460-462] used diffuse reflectance Fourier transform infrared spectrometry (DRIFTS) to follow the formation of nitrate and showed that the reaction was second order in NO2; assuming that N2O4 was the reactant, the uptake coefficient was measured to be (1.3 ± 0.6) × 10-4 (1 σ). Peters and Ewing [356] followed the formation of nitrate on single crystal NaCl(100) and also found the reaction was second order in NO2. Assuming that N2O4 is the reactant, the uptake coefficient was (1.3 ± 0.3) × 10-6, two orders of magnitude less than reported by Vogt and Finlayson-Pitts. However, in the presence of 9.5 mbar water vapor, the uptake coefficient increased by a factor of about 100. It is likely that the difference is that their single crystals did not hold significant amounts of surface adsorbed water, whereas the powders used by Vogt and Finlayson-Pitts are known to hold significant amounts of SAW [53] which enhances the reactivity through mobilization of the nitrate ions and exposure of fresh NaCl during the reaction. Caloz et al. [72] measured using a Knudsen cell an upper limit of <10-7 for uptake of NO2 on NaCl and < 2 × 10⁻⁷ for uptake on KBr, with the reaction being first order in NO2. Yoshitake [485] also used DRIFTS to study this reaction and reported that for “dry” NaCl, the reaction was second order in NO2 with an uptake coefficient assuming the reactant is N2O4 of (4 ± 2) × 10-5. However, if the NaCl had been pretreated with water vapor, the uptake was first order in NO2 with γ = (1.5 ± 0.2) × 10-8. Karlsson and Ljungstrom [266] generated NaCl particles and measured the loss of chloride and formation of nitrate using ion chromatography on particles collected on filters; they obtained a lower limit for the reaction probability of 3 × 10⁻⁴. Surprisingly, the conversion of to nitrate decreased as the relative humidity increased from 9 to 79%. These reactions are sufficiently slow that they are unlikely to be important in the atmosphere.
Abbatt and Waschewsky [10] measured the loss of NO2 in a flow tube containing deliquesced 1 - 5 μm NaCl particles (75% RH); no significant loss was observed on unbuffered particles or particles buffered at pH of 7.2 or having pH of 0.3 using HCl. An upper limit of γo < 1 ×10⁻⁴ for the uptake of NO2 was derived from these measurements. Back to Table
18. NO2 + NaBr(s). Vogt et al. [459] used diffuse reflectance infrared spectroscopy to study NO2 + NaBr(s) at 298 K. The reaction was determined to be approximately second order in NO2. Assuming that adsorbed N2O4 is the reactant leads to γ = 2 (+4, –1.3) × 10–4. Back to Table
19. NO2/N2O4 + sea salt. Sverdrup and Kuhlman [430] measured the uptake of NO2 on artificial sea salt using the NO2 loss measured in a flow tube lined with the salt. The uptake coefficient was reported to increase from 10-7 to 10-6 as the relative humidity increased from 44% to 88%. Langer et al. [291] used diffuse reflectance Fourier transform infrared spectrometry to follow nitrate formation on synthetic sea salt and found the reaction was approximately second order (1.8 ± 0.2) in NO2 in He carrier gas but approximately first order (1.2 ± 0.2) in NO2 in air. Assuming that N2O4 was the reactant in He, γss = 1 × 10⁻⁴, and assuming NO2 is the reactant in air, γss = 1 × 10⁻⁸. These reactions are sufficiently slow that they are unlikely to be important in the atmosphere. Back to Table
20. NO3 on H2O(s). Fenter and Rossi [138] measured an upper limit for γ of 10–3 over the range from 170 to 200 K. Back to Table

5-30
21. NO3 + H2O(l). Rudich et al. [388, 389] used wetted-wall flow tube techniques to measure uptake coefficients for NO3 on pure water and aqueous NaCl, NaBr, NaI, and NaNO2 solutions. These studies were extended to other aqueous solutions by Imamura et al. [238]. Uptake on pure water was consistent with reaction of NO3 to produce HNO3 and OH. Uptake coefficients with solutions containing I–, Cl–, Br –, NO2
– and other anions were larger and scaled with anion concentration, indicating electon transfer reactions to produce NO3
–. The γ of (2.0 ±1.0 × 10– 4) at 273 K determined for pure water by Rudich et al. is significantly lower than the lower limit of 2.5 × 10⁻³ quoted by Mihelcic et al. [329]. A detailed analysis of uptake coefficients for KI aqueous solutions indicated that the NO3 mass accommodation coefficient is >0.04 [388]. Back to Table
22. NO3 + NaCl. Recommended value for the initial uptake coefficient on solid NaCl is based on work of Seisel et al. [410, 411] Gershenzon and coworkers [164] and Gratpanche and Sawerysyn [178]. Seisel et al. [410, 411] used a Knudsen cell with mass spectrometric and laser-induced fluorescence detection of the NO3. Salt powders from 60 - 630 μm in size were used, as well as spray-deposited samples; no dependence on the sample mass for powders or between powders and the spray-deposited samples was observed so no corrections for diffusion into underlying layers were applied. They obtained values for γ0 of (4.9 ± 3) × 10-2
and (4.6 ± 4) × 10-2 (1 σ), respectively. Gershenzon and coworkers used flow reactors with ESR and MS detection and measured the loss of NO3 on an axially located rod coated with salt; they interpret their results, and the associated value of γ0 derived from their data based on a multi-step mechanism involving adsorption and then reaction of NO3 on the salt. The value for γ0 is sensitive to several unknown parameters in the model, and they give a range from (0.2 - 3.9) × 10-2. Gratpanche and Sawerysyn [178] used a flow tube coated with NaCl and ESR detection of NO3, and reported a value of (1.7 ± 1.2) × 10-2 (1 σ); on very dry NaCl, no uptake was observed, again indicating the importance of small amounts of water for the reaction. Gershenzon et al. [164] reported that the uptake coefficient decreased by about a factor of 20 over about half an hour, suggesting that the steady state value of γss is approximately 1.5 × 10⁻³. Zelenov et al. [491, 492] reported that the uptake coefficient for NO3 on NaCl (and NaBr; see next note) [491, 492] could be fit by a time-dependent term and a time-independent term: γ(t) = γ0exp(-t/τ) + γss. They observed that γss depends on the type of salt, as well as the NO3 and water concentrations, while γ0 depended only on the type of salt and NO3 concentration. They concluded that the products are chemisorbed Cl atoms. No temperature dependence has been observed over the temperature range 258 - 301 K by Gratpanche and Sawerysyn, [178] consistent with only an ~ 10% change in the uptake coefficient from 293 to 373 K observed by Gershenzon et al. [164].
The uptake of NO3 on aqueous solutions of NaCl has been measured at 273 K by Rudich et al. [389] and at 293 K by Thomas et al. [439]. NO3 reacts in solutions with the halide ions. The measured uptake coefficients varied from (0.8 - 6) × 10-3 for solutions of activity ranging from 0.008 to 0.45 at 273 K [389] and was reported to be > 2 × 10⁻³ on 0.1 M NaCl at 293 K [439]. Back to Table
23. NO3 + NaBr and NaI. See note for NO3 + NaCl. Recommended value of γ0 for the reaction with solid NaBr is based on reported values of 0.16 ± 0.08, [410] 0.20 ± 0.10, [411] a range of 0.1 to 0.3 [164] and 0.11 ± 0.06 [178] (all errors cited are 1 σ). Gershenzon et al. [164] observed a decrease of about a factor of two with time, suggesting that γss ~ 0.05. Gratpanche and Sawerysyn [178] found a slight negative temperature dependence, γ0 = (1.6+1.8
-0.9 × 10⁻³) exp[(1210 ± 200)/T] over the range from 243 - 293 K. Gershenzon et al. [164] also reported a small (30%) decrease in γ0 from 293 to 373 K. Zelenov et al. [491, 492] reported that the uptake coefficient for NO3 on NaBr (and NaCl; see preceding note) could be fit by a time-dependent term and a time-independent term: γ(t) = γ0exp(-t/τ) + γss. They observed that γss depends on the type of salt, as well as the NO3 and water concentrations, while γ0 depended only on the type of salt and NO3 concentration. They concluded that the products are gas phase bromine atoms in agreement with the observations of the branching ratio as well as the mass balance by Seisel et al. [410, 411].
Rudich et al. [388] measured the uptake of NO3 on aqueous KI solutions; NO3 is taken up and reacts with I- in solution. Uptake coefficients increased with the concentration of I-, ranging from γ = 0.9 × 10⁻³ at 5 × 10⁻⁶ M KaI to 3.2 × 10⁻³ at a concentration of 8 × 10⁻⁵ M. Back to Table
24. N2O5 + H2O(s). Leu [293] and Hanson and Ravishankara [200] measured nearly identical values of 0.028 (±0.011) and 0.024 (±30%) in the 195–202 K range on relatively thick ice films in coated wall flow tubes. Quinlan et al. [363] measured a maximum value for γ on ice surfaces at 188 K of 0.03 in a Knudsen cell reactor. The average of these three studies is 0.027 with a standard deviation of 0.003. Hanson and Ravishankara [202, 204] presented new and re-analyzed data as a function of ice thickness, with a value of ~0.008 for the thinnest ice sample, rising to 0.024 for the thickest. From these data there would appear to be

5-31
no strong dependence on temperature, at least over the 188–195 K range. It is unclear whether the measured dependence on ice film thickness is due to added porosity surface area in the thicker films or decreased ice film integrity in thinner films. The error estimate in the table is driven by the possible systematic error due to unresolved film thickness effects rather than the small statistical error among the “thick film” values from the three groups.
Zondlo et al. [506] report the formation of a supercooled H2O/HNO3 liquid layer at 185 K as a reaction product, forming NAT or NAD only after decreasing the relative humidity below the ice frost point. This effect is similar to that resulting from the interaction of gaseous HNO3 or ClONO2 with the ice surface. These authors measured γ = (7 ± 3) × 10–4 at 185 K for the reaction of N2O5 with this supercooled liquid layer. Back to Table
25. N2O5 + H2O(l). Reaction on liquid water has a negative temperature dependence. Van Doren et al. [455] measured γs of 0.057 ± 0.003 at 271 K and 0.036 ± 0.004 at 282 K using a droplet train uptake technique. George et al. [160] also used a droplet train technique to measure s of (3.0 ± 0.2) × 10–2 (262 K), (2.9 ± 1.2) × 10–2 (267 K), (2.0 ± 0.2) × 10–2 (273 K), (1.6 ± 0.8) × 10–2 (276 K), and (1.3 ± 0.8) × 10–2 (277 K) on pure water, while Schweitzer et al. [407] used the same approach for pure water and salt solutions between 262 and 278 K, obtaining similar results. Mozurkewich and Calvert [339] studied uptake on NH3/H2SO4/H2O aerosols in a flow reactor. For their most water-rich aerosols (RH = 76%) they measured γs of 0.10 ±0.02 at 274 and 0.039 ±0.012 at 293 K. However, similar studies by Hu and Abbatt [225] on (NH3)2SO4 aerosols at 297 K showed that uptake rises with decreasing relative humidity (RH); their 94% RH results agree very well with the temperature trend measured by Van Doren et al., Msibi et al. [341] measured a smaller γ of 2.5 × 10–
3 for water adsorbed on a denuder flow tube well under 66–96% relative humidity conditions at room temperature. N2O5 + H2O(l). Schütze and Herrmann [400] measured a γ of 2 x 10⁻² at 298 K using a single suspended droplet flow reactor method 0.0011 (+.0012/`0.0006) that was almost certainly constrained by nitrate build-up in the droplet’s surface layer. Mental and co-workers [465] and [322] studied N2O5 uptake on deliquescent salt particles from 291 to 298 K in an aerosol chamber; for sodium sulfate particles γ was in the range of 0.2 to 0.4, while sodium nitrate particles demonstrated uptakes more than an order of magnitude lower, demonstrating the negative influence of nitrate on the reaction rate. Behnke et al. [50] also used an aerosl chamber to study uptake on deliquescent NaCl particles, measuring γ=0.032±0.02 for 76-94% relative humidity with some contribution from the reaction of N2O5 with Cl-.
The higher γ values of Van Doren et al., Mozurkewhich and Calvert, and Hu and Abbatt are quite consistent when temperature and RH effects are factored in. The lower values from the Louis Pasteur (George et al.; Schweitzer et al.) and Birmingham (Msibi et al.) groups appear to have much less pronounced temperature dependence and are inconsistent with the other measurements. The aerosol chamber measurements at low nitrate loadings are generally consistent with the higher range of values. The same function used to fit the N2O5 uptake on sulfuric acid as a function of temperature and concentration, discussed in below, has been extended to the Van Doren et al. and Hu and Abbatt data for pure water and very high RH aerosols. See note on N2O5 + H2SO on H2O for the functional fit and its error discussion. Back to Table
26. N2O5 + HNO3 • 3H2O(s). Hanson and Ravishankara [198] have measured γ = 0.0006 (± 30%) near 200 K. They presented re-analyzed and additional data as a function of ice thickness (Hanson and Ravishankara [202]; [204]), deriving a value of 3 × 10⁻⁴ for the thinnest NAT covered ice layer, with values up to three times higher for thicker NAT-covered ice layers. As in the case of uptake on water ice this may be due to increased surface area from porosity in the thicker films, or less integrity in the thinner films. The uncertainty listed in Table A-1 is driven by this observed effect. All of the Hanson et al. data are in very poor agreement with the γ = 0.015 ± 0.006 reported by Quinlan et al. [363] from their Knudsen cell measurements; this measurement may have been biased by formation of a super-cooled aqueous nitric acid surface and is judged to be unreliable. Back to Table
27. N2O5 + H2SO4 • nH2O(l). This reaction has been intensively studied between 195 and 296 K for a wide range of H2SO4 wt.% values using four complementary experimental techniques. Data are available from aerosol flow tube studies (Fried et al. [154], Hanson and Lovejoy [195], Hu and Abbatt [225], and Hallquist et al. [184]), coated wall flow tube studies (Hanson and Ravishankara [198], Zhang et al. [497]), a stirred Knudsen cell (Manion et al. [315]) and droplet train studies (Van Doren et al. [455], Robinson et al. [376]). All studies have yielded γs between ~0.05 and 0.20 with modest dependence on surface H2SO4 wt.% and temperature. The Knudsen cell studies, aerosol flow tube studies at higher N2O5 exposure and the ternary H2SO4/HNO3/H2O studies of Zhang et al. [497] all illustrate that significant levels of HNO3 in the

5-32
H2SO4/H2O solutions will reduce γ measurably; this fact explains some of the scatter in aerosol flow tube studies and the surface saturation evident in the Knudsen cell studies. The effect of 5.0 × 10⁻⁷ Torr HNO3 on γ as a function of temperature at two water vapor concentrations are plotted in Zhang et al. [497]; the decrease in γ is greatest at low temperatures, approaching a factor of 2–5 between 200 and 195 K.
Experimental data on sulfuric acid surfaces between 40 and 80 wt.% sulfuric acid deemed to be free of saturation effects, plus the pure water uptake data of Van Doren et al. [455] and high relative humidity ammonium sulfate aerosol uptake data of Hu and Abbatt [225] were all fit to a polynomial expression to yield a single model describing γ for N2O5 uptake valid between 0 and 80 wt.% H2SO4 and 180 to 300 K (Robinson et al. [376]). The form of this function is: γo=exp (ko+k1/T+k2/T2), where T is the temperature in K. The parameters ko, k1, and k2 obtained from the best-fit are:
ko = –25.5265 – 0.133188wt + 0.00930846wt2 – 9.0194×10⁻⁵wt3
k1 = 9283.76 + 115.345wt – 5.19258wt2 + 0.0483464wt3
k2 = –851801– 22191.2wt + 766.916 wt2 – 6.85427wt3
where wt is the weight percentage of H2SO4.
The overall error of applying the uptake function provided here consists of two components. One is the standard deviation of the model-calculated value with respect to measured data, σm, which is given by
model
21
11m
N ii
N
γ
γσ
⎛ ⎞−⎜ ⎟∑ ⎜ ⎟= ⎝ ⎠=
−.
The other is the standard deviation of relative experimental measurement error from the mean, σd, which is given by
( )
2
1d
N ii l i
N N
γ
γσ
⎛ ⎞Δ⎜ ⎟∑⎜ ⎟= ⎝ ⎠=
−.
The overall error is
2 2m dσ σ σ= + .
(These formulations are also applied below in the error estimation for the ClONO2 + H2O and HCl, BrONO2 + H2O, and HOCl + HCl reaction system. For N2O5, the error is estimated to be 15% (one sigma), with σm=14.7% and σd=2.9%). Back to Table
28. N2O5 + H2SO4 • H2O(s). Zhang et al. [498] used coated flow tube techniques to measure the uptake of N2O5 on solid sulfuric acid monohydrate over a temperature range of 200 to 225 K. The measurement values of γ were significantly higher at 200 K (γ ~ 1 × 10⁻³) than at 225 K (γ ~10–4) and were well fit by log γ = [4.78 – 0.0386T(K)]. Acid-rich H2SO4 • H2O surfaces had a lower γ than water rich surfaces (log γ = [0.162 – 0.789 × log pH2O] where pH2O is their experimental water vapor partial pressure). Back to Table
29. N2O5 + H2SO4 • 4H2O(s). Hanson and Ravishankara [205] studied N2O5 uptake by frozen 57.5 and 60 wt.% H2SO4 as a function of temperature and relative humidity. The 57.5 wt.% surface was not sensitive to relative humidity and was slightly more reactive (γ = 0.008 vs 0.005) at 205 K than at 195 K. Reaction probabilities on the 60 wt.% surface dropped off with temperature and relative humidity. Back to Table
30. N2O5 + HCl on H2O(s). Leu [294] measured γ = 0.028 ± 0.011 at 195 K, while Tolbert et al. [442] measured a lower limit of 1 × 10⁻³ at 185 K. These experiments were done at high HCl levels probably leading to a liquid water/acid surface solution (Abbatt et al. [6]). Seisel et al. [412] measured γ ~ 0.03 at 200 K using a Knudsen flow reactor with a range of HCl flows. The uptake coefficient at low HCl flows is only slightly enhanced compared to the uptake on a pure ice surface. Back to Table

5-33
31. N2O5 + HCl on HNO3 • 3H2O(s). Hanson and Ravishankara [198] measured γ = 0.0032 (±30%) near 200 K. Back to Table
32. N2O5 + HCl on H2SO4 • H2O(s). Zhang et al. [498] saw no increase in N2O5 uptake on sulfuric acid monohydrate at 195 K upon exposure to HCl, setting γ < 10–4. Back to Table
33. N2O5 + HBr on H2O(s). Seisel et al. [412] report γ values ranging from ~3 × 10⁻³ to 0.1, depending on the HBr concentrations employed; the measurements were conducted at 180 and 200 K. These authors report Br2 and HONO in 80% yield as products with respect to N2O5 taken up, generated presumably by the secondary reaction of the primary product BrNO2 with HBr. Back to Table
34. N2O5 + HBr on HNO3 • 3H2O(s). This reaction, yielding γ ~0.005, was investigated on NAT surfaces near 200 K by Hanson and Ravishankara [201]. Under some conditions a much higher reaction coefficient of ~0.04 was observed. Back to Table
35. N2O5 + NaCl. The uptake of N2O5 on solid NaCl has been studied using Knudsen cells [136, 220], flow reactors [297, 306], annular reactors [341] and diffusion tubes [285]. The reaction has two possible channels if there is water available on the surface: N2O5 + NaCl → ClNO2 + NaNO3 (1) and N2O5 + H2O/NaCl → 2 HNO3 (2). The presence of the two channels is supported by measured yields of ClNO2 (relative to N2O5 lost) that vary from 60 - 100% [136, 220, 285, 306] and by the observation of gaseous HCl as a reaction product [220]. Because hydrolysis on the surface occurs in addition to the reaction with Cl-, the net uptake coefficient for N2O5 is particularly sensitive to the presence of surface-adsorbed water (SAW), with higher values for powders where there are more steps and edges that hold SAW. For example, Leu et al. [297] measured an upper limit of γ < 1.0 × 10⁻⁴ for salt powders that had been heated overnight in a vacuum, but ~ 4.5 × 10⁻⁴ for samples that were only pumped on for about an hour. Fenter et al. [136] reported a preferred value for the uptake coefficient of (5 ± 2) × 10-4; however, the measured values varied from 2 × 10⁻³ for monodisperse powders (after correction for pore diffusion by factors of ~ 5 to 30) to < 1.0 × 10⁻⁴ for a polished window face. Hoffman et al. [220] report a steady state value of γss = 3 × 10⁻³ based on Knudsen cell studies of powders using less than a layer of salt where corrections to the available surface area due to diffusion into the salt are not necessary; the branching ratio for reaction (1) was measured to be 0.73 ± 0.28 (2σ). Stewart and Cox [428] measured the uptake of N2O5 on NaCl particles in a flow tube; after correction for diffusion/particle size effects, an uptake coefficient of 3 × 10⁻² was derived at relative humidities 30% and above.
The uptake of N2O5 on NaCl solutions or aqueous particles has been measured by a number of techniques [50, 51, 158, 341, 407, 493]. The reported values of γ range from 1.5 × 10⁻² to 5.0 × 10⁻². Zetzsch and coworkers [50, 51, 493], used an aerosol chamber to measure the uptake of N2O5 on deliquesced NaCl particles from 71 - 94% RH, and obtained a value of γ = 3.2 × 10⁻². Behnke et al. [50], measured ClNO2 in a yield of 66 ± 7% from aerosol particle experiments; in a wetted wall flow tube, the yield was observed to increase to 100% at concentrations of NaCl of 1 M and above. They proposed a mechanism involving a competition between the reaction of NO2
+ with water to form HNO3 or with Cl- to form ClNO2. George et al. [158] used a droplet train and measured the formation of NO3
- in the droplets; the value of γ decreased from 0.039 ± 0.013 at 263 K to 0.014 ± 0.008 at 278 K.
Schweitzer et al. [407] used a droplet train apparatus to measure the uptake of N2O5 on water and on solutions of NaCl, NaBr and NaI with concentrations ranging from 0.1 to 1 M over a temperature range from 262 to 278 K. Within experimental error, all of the uptake coefficients were the same, with an average value of γ = 0.018 ± 0.003. For 1 M NaCl, the ClNO2 yield was 100%. Back to Table
36. N2O5 + KBr, NaBr, NaI. Fenter et al. [136] and Koch et al. [285] measured the uptake coefficient for N2O5 on KBr at ambient temperature using a Knudsen cell and molecular diffusion tube respectively. The Knudsen cell experiments gave a value of (4 ± 2) × 10-3 after correction (by factors of 6-16) for pore diffusion, and the molecular diffusion tube a value of (2.5 ± 1) × 10-3. In the Knudsen cell studies, the uptake coefficient was larger for powders and a depolished window face (both 4 × 10⁻³) than for a polished window face (< 1 × 10⁻⁴), similar to the observations for the NaCl reaction (see note 10); this again suggests the importance of surface-adsorbed water and possibly surface defects created by roughening (which, however, also hold water) for the reaction. The initial product of the reaction is BrNO2, identified by Finlayson-Pitts et al. [145] by FTIR but this can react further with the salt to generate Br2, the product observed by Fenter et al. [136].

5-34
Schweitzer et al. [407] used a droplet train apparatus to measure the uptake of N2O5 on water and on solutions of NaBr and NaI, as well as NaCl, with concentrations ranging from 0.1 to 1 M over a temperature range from 262 to 278 K. Within experimental error, all of the uptake coefficients were the same, with an average value of γ = 0.018 ± 0.003. For the NaBr reaction, the gas phase products were BrNO2, Br2 and HONO. For the NaI reaction, the only gas phase product observed was I2. Back to Table
37. N2O5 + sea salt. The uptake of N2O5 on synthetic sea salt was measured to be γ = (3.4 ± 0.8) × 10-2 (2 σ) by Hoffman et al. [220]. This will be an upper limit as 1-2 layers of salt were used and no correction was made for diffusion into the bottom layer. However, it is clear that the reaction is at least an order of magnitude faster than that for NaCl; the yield of ClNO2 is 100%. Stewart and Cox [428] measured the uptake of N2O5 on submicron synthetic sea salt aerosols in a flow tube; after correction for diffusion/particle size effects, a value of γ = 2.5 × 10⁻² was derived, independent of relative humidity above 30%. Back to Table
38. HONO + H2O(l). Bongartz et al. [61] present uptake measurements by two independent techniques, the liquid jet technique of Schurath and co-workers and the droplet train/flow tube technique of Mirabel and co-workers (Ponche et al. [357]). With a surface temperature of ~245 K the droplet train techniques yielded 0.045<γ<0.09, while the liquid jet operating with a surface temperature of 297 K obtained 0.03 < γ < 0.15. Mertes and Wahner [323] used a liquid jet technique to measure 4 × 10– 3 < γ < 4 × 10⁻² at 278 K. Harrison and Collins [212] performed aerosol flow reactor experiments on deliquescent sodium chloride and ammonium sulfate droplets at 279 K obtaining reactive uptake coefficients of 0.0028±0.0015 and 0.0028±0.0006, for 85% relative humidity conditions, respectively; these measurements are probably subject to significant surface saturation. Since HONO uptake by liquid water probably involves hydrolysis, an increase in Henry’s law solubility with decreasing temperature may be offset by a decreasing hydrolysis rate constant, leaving the uptake coefficient’s temperature trend uncertain. Measured uptake coefficients will not correspond to the mass accommodation coefficient. Back to Table
39. HONO + H2SO4 • nH2O(l). Zhang et al. [500] measured uptake coefficients for HONO on sulfuric acid that increased from (1.6 ±0.1) × 10–2 for 65.3 wt.% H2SO4 (214 K) to (9.1 ±1.6) × 10–2 for 73 wt.% H2SO4 (226 K). Fenter and Rossi [137] measured uptake coefficients rising from 1.8 × 10⁻⁴ for 55 wt.% H2SO4 (220 K) to 3.1 × 10⁻¹ for 95 wt.% H2SO4 (220 K and 273 K). Baker et al. [31] measured much smaller uptake coefficients for 60 wt.% at 298 K. In general, the values measured by Zhang et al. [500] are a factor of 2 to 5 higher than those of Fenter et al. [137] for comparable acid concentrations. Since the reaction probably depends on both temperature and acid concentration and since the data scatter is high in both experiments, further independent data will be required to define γ as a function of acid concentration and temperature. These data are generally consistent with the effective Henry’ law constant measurements of Becker et al. [49] who illustrate that HONO solubility decreases exponentially with H2SO4 concentration until ~53 wt.%, at which point reaction to form nitrosyl sulfuric acid increases H* dramatically as H2SO4 concentration increases. Baker et al. [31] invoke surface decomposition of HONO to explain their room temperature data, since they separately determine that the bulk second-order disproportionation rate for HONO is too slow to account for even their small uptake coefficients. It is possible that surface formation of nitrosyl sulfuric acid and not HONO disproportionation is responsible for much of their measured uptake. The Zhang et al. [500] and Fenter and Rossi [137] data have been combined and fit with a four-term polynomial as a function of acid wt.% (these data did not show an obvious temperature dependence):
ln γ = a + b wt + c wt2 + d wt3
where wt is the H2SO4 wt.%, and
a = –155.7 ± 29.7
b = 5.663 ± 1.232
c = –0.07061 ± 0.01679
d = 0.000297 ± 0.000076
This parameterization should be used only within the 55–95-wt.-%-H2SO4 range and the 214-to-273-K temperature range. Back to Table
40. HONO + HCl + H2O(s). Knudsen cell uptake studies for HONO/HCl co-deposited on ice (180–200 K) and for HONO on 0.1 to 10 m HCl frozen solutions (~190 K) by Fenter and Rossi [137] showed HONO uptake
5-35
coefficients in the 0.02 to 0.12 range as long as surface HCl concentrations significantly exceed HONO concentrations. ClNO was evolved quantitatively with HONO consumption. Back to Table
41. HONO + HCl on H2SO4 • nH2O(l). Fenter and Rossi [137] saw no reaction for acid wt.% > 65. They measured γ = 2.0±0.7 × 10⁻³ for 60 wt.% acid saturated with HONO at 230 K. Zhang et al. [500] also measured the uptake of HCl after exposure to HONO, they observed HCl uptake with γs between 0.01–0.02 over an acid wt.% range of 60.8–71.3 (T = 207.9–222.6 K). The reaction was also studied by Longfellow et al. [307] using both HCl doped and HONO doped sulfuric acid aerosols. Their uptake measurements confirmed reaction at higher acid wt.%, but by using lower HONO partial pressures they measured smaller γs. The reverse reaction, ClNO hydrolysis, was also studied in a wetted wall flow reactor and in the aerosol flow reactor by Longfellow et al. [307] and in a Knudsen cell reactor by Fenter and Rossi [137]. Data show clear evidence of both surface and bulk kinetics for the forward reaction. Longfellow et al. [307] report kII values for the bulk reaction (in units of 104 M–1s–1) for 50 wt.%: 81 at 250 K and 15 at 205 K; for 60 wt.%: 9.4 at 250 K, 6.9 at 230 K and 5.0 at 219 K; for 67 wt.%: 3.9 at 250 K; and for 70 wt.%: 5.8 at 269 K and 0.35 at 215 K. The reaction is clearly complex and will require a comprehensive model of both the surface and bulk processes to arrive at an appropriate parameterization for γ. Back to Table
42. HONO + NaCl(s). Diffuse reflectance experiments by Vogt and Finlayson-Pitt [461] on room temperature NaCl(s) and Knudsen cell uptake experiments by Fenter and Rossi on room temperature NaCl(s) and frozen 0.1 M NaCl aqueous solutions, all failed to show HONO uptake [137]. The latter results yield γ < 1 × 10⁻⁴. HONO + NaCl. Junkermann and Ibusuki [255] reported that HONO reacts with NaCl to form nitrite on the surface. However, subsequent studies [461] showed that the infrared bands assigned to NO2
- were due to nitrate, likely from the reaction of gas phase NO2 and perhaps HNO3 present in the HONO. There is no evidence at the present time for a reaction between HONO and NaCl. Back to Table
43. HNO3 + NaCl. Recommendation is based on an average of the values of Hoffman et al. [221], Ghosal and Hemminger [169], the data of Davies and Cox [113] as revised by Ghosal and Hemminger [169] using their model for surface reactivation, and the single crystal data of Leu et al. [297] Hoffman et al. [221] used less than a single layer of particles so that diffusion into the underlying layers is not a factor to obtain an initial value of γ0 = (2.3 ± 1.9) × 10-3 (2σ). This is consistent within the combined experimental errors with a value of (1.3 ± 0.6) × 10-3 determined from the formation of nitrate on the surface of single crystal (100) NaCl by Ghosal and Hemminger [169], and with a value of 1.1 × 10⁻³ from application of the Ghosal and Hemminger model to the Davis and Cox data [113]. Ghosal and Hemminger suggest that the value could be as high as 5 × 10⁻³ for NaCl powders that have more steps and edges that hold SAW [170]. At longer reaction times, the steady-state value [221] is a factor of two smaller, γ = 1 × 10⁻³. The reaction is hypothesized to occur both on dry terraces, which saturate rapidly, and on steps and edges that hold surface-adsorbed water. The water acts to recrystallize the product NaNO3 so that the surface does not passivate during the reaction at atmospherically relevant HNO3 pressures. This model, developed and modified by several research groups [53, 113, 169, 221] brings together most of the seemingly disparate measurements of the reaction probability made using a variety of techniques including flow tubes [113], Knudsen cells [53, 135, 136, 221], and XPS studies of nitrate formation on single crystals [169, 170, 461]Laux, 1994 #2173}. The only gas phase product observed is HCl, with a yield that is within experimental error of 100%. The higher value of (1.3 ± 0.4) × 10-
2 of Leu et al. [297] was obtained by correcting even larger measured values using a pore diffusion model;[274, 275] the corrections were typically in the range of a factor of 4-6. On single crystal NaCl where such corrections were not necessary, Leu et al. [297] measured a value of (2.4 ± 0.6) × 10-3. A value of (4 ± 1) × 10-2 was measured using a molecular diffusion tube technique by Koch et al. [285]. The corrected value of (8.7 ± 1.4) × 10-5 reported by Zangmeister and Pemberton [488, 489] using Raman spectroscopy to follow the nitrate formed on the surface is lower than the other values likely because a much higher HNO3 concentration was used (~ 1018 cm-3), which would lead to a larger coverage of the surface by the recrystallized NaNO3 product and passivation of much of the NaCl surface.
Abbatt and Waschewsky [10] measured the loss of gas phase HNO3 in a flow tube containing deliquesced 1 - 5 μm NaCl particles (75% RH) and obtained a lower limit to the uptake coefficient for HNO3 of 0.2 on unbuffered NaCl. Guimbaud et al. [179] measured the uptake coefficient of HNO3 on 70 nm supersaturated NaCl particles (deliquesced NaCl particles held at 55% RH) to be 0.50 ± 0.20; they concluded that this was the mass accommodation coefficient. Tolocka et al. [445] followed the reaction of HNO3 with 100 - 220 nm NaCl particles at 80% RH using single particle MS to measure the Cl-/NO3
- ratio; the uptake coefficient for 100 nm particles was (4.9 ± 2.7) × 10-3 and increased with droplet size. The combination of these studies

5-36
shows that the initial uptake of HNO3 into solution is fast, with γ0 > 0.2; as the solution becomes acidified, HCl is expelled as the gaseous product. Back to Table
44. HNO3 + NaBr and KBr. Fenter et al. [135] reported that the value of γ for uptake of HNO3 on NaCl, NaBr, KBr and KCl was the same, (2.8 ± 0.3) × 10-2, independent of sample mass. Koch et al. [285] reported an uptake coefficient of HNO3 on KBr of (2 ± 1) × 10-2 using a molecular diffusion tube technique. As discussed in Note 7, integration of the results of an extensive series of studies in different laboratories using different techniques, uptake coefficients for HNO3 on NaCl give a value for the HNO3-NaCl reaction that is smaller than measured in the Fenter et al. [135] and Koch et al. [285] studies. These values for KBr may therefore be upper limits. Leu et al. [296] reported a value that is an order of magnitude smaller, (2.8 ± 0.5) × 10-3 after applying large corrections (about an order of magnitude) for pore diffusion; the average uncorrected value using the geometric area was 0.027. Back to Table
45. HNO3 + sea salt. The uptake coefficient for HNO3 on synthetic sea salt [118] is much larger than that on NaCl, which is attributed to the very hygroscopic nature of sea salt due to such components as the magnesium chloride and its hydrates (see Note 4). De Haan and Finlayson-Pitts [118] reported initial uptake coefficients of γ0 in the range of 0.07 to 0.75 and steady state values in the range of 0.03 to 0.25; these were measured using salt layers from 2 layers to 103 layers. The initial uptake on MgCl2•6H2O was > 0.4 and the steady-state value > 0.1. At these high uptake values, the correction for diffusion into underlying layers is expected to be small. The large uptake coefficient on sea salt is consistent with the values measured for uptake on concentrated aqueous solutions of NaCl (see Note 7) and the high water content of the surface of sea salt (see Note 4). The yield of HCl was within experimental error of 100%. Back to Table
46. HNO3 + Al2O3. Börensen et al. [64] used diffuse reflectance FTIR observations to show that HNO3 reacts with surface hydroxyl groups on γ-alumina at 299 K to produce surface bonded nitrate, while Goodman et al. reported similar observations for α-alumina at 296 K [173]. Goodman et al. [173] also observed that higher relative humidity lead to higher HNO3 uptake. They integrated their nitrate absorbance feature to yield a time averaged uptake coefficient of (4±1) × 10-8 [173]. Underwood et al. [447] report a liner mass dependent, BET corrected γo for α-alumina at 295 K of (9.7±0.5) × 10-5. Hanisch and Crowley also measured liner mass dependent γos on α-alumina (at 298 k) for four particle sizes, which yielded an average value of 0.133 ±0.033 [186]. They argue that the lack of variance of γos on a large range of particle sizes and masses indicate that the BET correction to the geometrical surface area is not required. They also measured γo for an unpolished single crystal of (1.6±1.4) × 10-3 and smaller values on polished single crystals, showing the higher density of surface defect sites on small amorphous particle are critical for their high reactive active uptake coefficients. The recommendation is based on the Hanisch and Crowley data and analyses for particulate samples [186]. Back to Table
47. HO2NO2 + HCl on H2SO4 • nH2O(l). Zhang et al. [501] performed wetted-wall flow-reactor studies with HCl and HO2NO2 partial pressures in the 10–6 to 10–7 Torr range. Using chemical ionization mass spectrometry (CIMS) to detect expected reaction products, no Cl2 (using SF4
– as an analyte ion) or HOCl (using F–) was detected over a temperature range of 200–225 K and an acid concentration range of 50–70 wt.% H2SO4. An upper limit for the reactive uptake coefficient for HO2NO2 reacting with HCl of γ < 1 × 10⁻⁴ was deduced. Back to Table
48. NH3 + H2SO4 • nH2O. Robbins and Cadle [372], Huntzicker et al. [232], McMurry et al. [320], and Daumer et al. [111] all studied NH3 uptake by sulfuric acid aerosols in near room temperature flow reactors (T = 281–300 K). Uptake coefficients varied between 0.1 and 0.5. Rubel and Gentry [387] used levitated H3PO4 acid droplets to show that heterogeneous reaction does control the initial NH3 uptake on strong acid solutions. Both Rubel and Gentry and Däumer et al. also explored the effect of organic surface coatings. Swartz et al. [431] used a droplet train flow reactor to measure reactive uptake coefficients on 20 to 70 wt.% acid over a temperature range from 248 t0 288 K. Measured uptake coefficients varied from 1.0 at 55 wt.% and above to 0.3 at 20 wt.% and drop off smoothly to the pure water results reported by the same group, as well as other droplet train flow reactor and coaxial jet uptake studies [482]. Hanson and Kosciuch [189] used an aerosol flow reactor to measure reactive uptake coefficients at room temperature (287 to 297 K) from 15 to 65 wt.%. While the data have a fair amount of scatter, taken as a whole they are consistent with γ=1 over the whole range of acid concentrations. There is no obvious reason for the discrepancy between the 15 to ~45 wt.% results from Swartz et al. [431] and Hanson and Kosciuch [189], the two groups have discussed conceivable issues at length in print [482] and Hanson and Kosciuch [190]. Back to Table

5-37
49. VOCs on Al2O3. Carlos-Cueller et al. [76] and Li et al. [299] have reported Knudsen cell studies that determined γo values for oxygenated volatile organic compounds (VOCs) at 295 and 298 K, respectively. Carlos-Cueller [76] measured γos on α-alumina for formaldehyde, (7.7±0.3) × 10-5, methanol, (1.0±0.7) x 10-
4, and acetic acid, (2 ± 1) × 10-3 based on BET surface areas and the KML [272] correction for porosity; the reported value for the relatively “sticky” acetic acid may not require the full BET and porosity corrections and thus may be underestimated. Li et al. [299] measured BET corrected γos on α-alumina for acetaldehyde, 3.2 × 10⁻⁵, propionaldehyde, 4.7 × 10⁻⁵, and acetone, 2.0 × 10⁻⁵. The recommended upper limits are factors higher than the measured values since all the measurements are from a single laboratory using a single experimental technique. BET may overcorrect. Back to Table
50. CH3C(O)O2 + H2O(l) and H2SO4 • nH2O. Villalta et al. [457] used wetted-wall flow tube techniques to measure γ = 4.3 (+ 2.4 /–1.5) × 10–3 for water at 274 ± 3K. They also measured uptake for 34 wt.% H2SO4 at 246 K (γ = (2.7 ± 1.5) × 10–3), 51 wt.% at 273 K (γ = (0.9 ± 0.5) × 10–3), and 71 wt.% at 298 K (γ = (1.4 ± 0.7) × 10–3). They suggest that products subsequent to hydrolysis are HO2 and CH3C(O)OH. Back to Table
51. CH3C(O)O2NO2 + HCl, Cl, ClO, and OClO on H2SO4 • nH2O(l). Zhang and Leu [496] performed wetted wall flow reactor studies with Cl species partial pressures in the 10–6 to 10–7 Torr range and CH3C(O)O2NO2 at 3 × 10⁻⁶ Torr after equilibrating the acid surfaces (42, 51, and 69 wt.% at 202 and 224 K) with CH3C(O)O2NO2. Also uptake studies with 5 × 10⁻⁷ Torr CH3C(O)O2NO2 were performed after exposing the acid surface to the Cl species. No Cl species or CH3C(O)O2NO2 uptake enhancements were observed under either condition and an upper limit for the reactive uptake coefficient of γ < 1 × 10 –4 of CH3C(O)O2NO2 was deduced. No gas phase reaction products were observed using CIMS after 42 wt.% H2SO4at 210 K was exposed to CH3C(O)O2NO2 and each Cl species for 20 minutes. Back to Table
52. Cl + H2SO4 • nH2O(l). Measured reaction probability (Martin et al. [317]) varies between 3 × 10⁻⁵ and 7 × 10⁻⁴ as H2O and T co-vary. Reaction product is claimed to be HCl. Back to Table
53. Cl2+HBr + H2O(s). Hanson and Ravishankara [201] measured a reaction probability of > 0.2 on water ice near 200 K. BrCl was not detected, presumably due to rapid reaction with excess HBr. Back to Table
54. Cl2 + NaCl. Mochida et al. [331] used salt powders and spray-deposited films of NaCl and reported an initial uptake coefficient of 1.0 × 10⁻³. Aguzzi and Rossi [11] reported no measurable uptake of Cl2 on NaCl. Back to Table
55. Cl2 + NaBr and NaI. Mochida et al. [331] used salt powders and spray-deposited films to obtain a value for the initial uptake coefficient of 2 × 10⁻². The measured uptake coefficients for the salt powders were a factor of six larger, but application of the pore diffusion model of Keyser et al. [274, 275] gave this value, which is in agreement with that for a spray-deposited film. Br2 was generated in a yield of 100%, within experimental error.
Hu et al. [226] measured the uptake of Cl2 on aqueous solutions of NaBr and NaI over the temperature range of 263 - 293 K using a droplet train flow reactor. Measured values of the uptake coefficients on NaBr solutions ranged from 0.16 at 263 K to 0.05 at 293 K, and there was evidence of a surface reaction between Cl2 and Br- at the air-particle interface. Similarly, the uptake coefficients for Cl2 on NaI solutions ranged from 0.20 to 0.07 over the same temperature range, again with evidence for a contribution from an interface reaction. Back to Table
56. Cl2 + KBr. Mochida et al. [331] used salt powders and spray-deposited films to obtain a value for the initial uptake coefficients. The value measured for salt powders was 0.176, but after correction for pore diffusion, this became 3.7 × 10⁻², similar to a value of 2.3 × 10⁻² measured for spray-deposited films. Br2 was generated in a yield of 100%, within experimental error. Aguzzi and Rossi [11] measured a similar value, 2.7 × 10⁻², using a Knudsen cell. Santschi and Rossi [395] reported an initial value of γ0 = 0.11 for the uptake of Cl2 on thin spray-deposited films of KBr that had not been extensively pumped on; this initial value was 4 × 10⁻² for films that had been pumped on for hours. They attributed the difference to the removal of surface-adsorbed water (SAW) by extensive pumping. Back to Table
57. Cl2 + sea salt. Mochida et al. [331] used a synthetic sea salt and a "natural" seasoning sea salt in Knudsen cell studies of the uptake of Cl2. The synthetic sea salt value of (2.2 ± 0.3) × 10-2 is the value reported after correction of the measured value of 0.138 using the pore diffusion model. For the “natural” seasoning salt, the measured value was 0.11 which after correction for diffusion into the underlying layers became (3.1 ±

5-38
1.1) × 10-2. Br2 was the major gas phase product, with small mass spectrometric signals also seen for BrCl. Back to Table
58. ClO + H2O(s) and HNO3 • nH2O(s). Proposed reaction (Leu [294]) is 2 ClO → Cl2 + O2; reactive uptake may depend on ClO surface coverage, which in turn may depend on gas phase ClO concentrations. Kenner et al. [271] measured reaction probabilities of (8 ±2) × 10–5 for ice at 183 K which is far lower than the limit of >1 × 10⁻³ obtained by Leu [294]. Abbatt [3], using nearly the same low levels of ClO as Kenner et al., obtained γ < 1 × 10⁻⁵ at 213 K. The difference may lie in the level of ClO or other adsorbable reactive species present. The lower value of Abbatt is probably closer to the expected reactivity under stratospheric conditions. Kenner et al. also measured a reaction probability limit of < (8 ±4) × 10–5 for NAT at 183 K. Back to Table
59. ClO + H2SO4 • nH2O. Measured reaction probability (Martin et al. [317]) varies between 2 × 10⁻⁵ and 2 × 10⁻⁴ as H2O content is varied by changing wall temperature. Reaction product is claimed to be HCl, not Cl2. Abbatt [3] measured γ < 1 × 10⁻⁵ for 60 and 70 wt.% H2SO4 at 213 K. Back to Table
60. HCl + HNO3 on H2SO4• m HNO3 • nH2O(l). Two studies have noted HCl activation in concentrated ternary H2SO4/HNO3/H2O solutions or ice slurries. Luick et al. [311] saw only gas phase HCl in 64.6 wt.% H2SO4/ 4.8 wt.% HNO3 at 200 K, but saw a vapor phase Cl partitioning of 50% HCl and 50% ClNO/ClNO2 for a 76.6/20.1 wt.% solution (an ice slurry) at 200 K. Cappa et al. [75] saw substantial yields of ClNO, ClNO2, and Cl2 at 273 K for a range of solution compositions; e.g. 32.6%, 9.8% and 44.4% respectively for a total HCl conversion of 86.9% in a 35% H2SO4 /45% HNO3 solution and 20.2%, 6.9%, 27.9% for a 60/25 wt.% solution. While no kinetic coefficients or detailed mechanisms are available, these studies do show the potential for HCl activation in strong H2SO4/HNO3/H2O solutions. Back to Table
61. HOCl + HCl + H2O(s) and HNO3 • 3H2O(s). Hanson and Ravishankara [202] and Abbatt and Molina [8] have investigated the HOCl + HCl reaction on water ice and NAT-like surfaces, and Chu et al. [90]; [85] studied the reaction on water ice. Product yield measurements support the identification of Cl2 and H2O as the sole products. The measured yield of product Cl2 is 0.87 ±0.20 and was stated to be similar on both surfaces according to Abbatt and Molina. Within the accuracy of the experiments, the reaction probability does not depend on the gas phase HCl and HOCl densities. Only Abbatt and Molina investigated at more than one temperature, their data indicates that γ increases at lower temperatures. A plot of data from the three studies does show a weak temperature trend, with γ increasing about a factor of two as the temperature drops from 202 to 188 K. However, the data are too sparse to assign a definitive temperature dependence. The average of all three studies yields γ = 0.26 ± 0.08 for data based on the geometrical area of the flow tube surfaces. Chu et al. [85] indicate that a porosity correction for their data would reduce their value bya factor of 3 to 4. The real uncertainty would appear to be dominated by systematic uncertainties in porosity corrections and a potential temperature dependence. Given the fact that any porosity correction must reduce the value, a central value of 0.2 is adopted with an uncertainty factor of 2. The high reaction probabilities measured for water ice indicate that this reaction may play a significant role in release of reactive chlorine from the HCl reservoir.
Two studies (Hanson and Ravishankara [202]; Abbatt and Molina [8]) have measured the reaction probability of HOCl + HCl on NAT surfaces. These data show γ increases as the ambient water pressure increases and then reaches a plateau. At relatively high water pressure, the two studies averaged γ = 0.135 ± 0.049, with no porosity correction. The reaction probability on water poor NAT-like surfaces falls off dramatically (a factor of 10). A recommendation of 0.1 with an uncertainty factor of 2 is shown in Table 5-2. Carslaw and Peter [78] have published a model of this reaction and its dependence on HCl uptake. Back to Table
62. HOCl + HCl + H2SO4 • nH2O(l). This process has been studied in coated flow tubes over ~200–260 K by Zhang et al. [495], Hanson and Ravishankara [206], Donaldson et al. [124], and Hanson and Lovejoy [197]. Hanson and Lovejoy also made measurements in an aerosol flow tube from 251 to 276 K. A model of this and related sulfuric acid aerosol reactions tailored to stratospheric conditions has been published by Hanson et al. [210]. Zhang et al. held the water vapor partial pressure at 3.8 × 10⁻⁴ Torr and showed γ increased by a factor of 50 as the temperature was lowered from 209 to 198 K increasing the water mole fraction, showing that the reaction rate is strongly dependent on water activity.
A detailed kinetic uptake model has been developed to fit the experimental data [414]. The formulation for γ is given as:
5-39
1 1 1rxnHOClγ α
= +Γ
where
( )1/ 2
_4rxn HOCl
HOCl HOCl HOCl HClH RT D k
cΓ =
At the low temperatures of interest, α for HOCl was assumed to be unity consistent with the value for HCl measured at 240 K and below (Robinson et al. [377]). The individual formulations for HHOCl, DHOCl and kHOCl-HCl are given in Table A-4 in Shi et al. [414]. Reaction of HOCl with HCl is considered to be acid catalyzed. It is known that the reaction rate for HOCl + HCl in pure water is low (Donaldson et al. [124]). Experimental data noted above indicated that the reaction rate of HOCl + HCl increases with acidicity of H2SO4 solution. The data from the experimental studies noted above were fit to the model without bias. Using the same error analysis discussed in the note for N2O5 uptake on sulfuric acid, a detailed kinetic model yields a 33.4% error (one sigma fit to the available data set, with σm=33.3% and σd=3.0%).
In the cold stratosphere where T<190 K, the reaction of ClONO2 + HCl is so fast that HCl is depleted which slows down the reaction of HOCl + HCl. As shown in Table A-4 in Shi et al., the effect of HCl depletion on the HOCl reactive uptake coefficient (due to reaction with ClONO2 inside/on the surface of particles) is taken into account via the factor FHCl (also see the note on chlorine nitrate/hydrochloric acid reactive uptake on sulfuric acid surfaces). Back to Table
63. HOCl + HBr on H2O(s). Chu and Chu [85] measured γ at 189 K to be in the range from 0.06 to 0.38 for HBr partial pressures ranging from 1.1 × 10⁻⁷ to 6.6 × 10⁻⁵ Torr. At 220 K they measured γ in the range from 0.01 to 0.07 for HBr partial pressures in the range from 7.2 × 10⁻⁷ to 1.3 × 10⁻⁵ Torr. These γ values were estimated assuming the area of the ice surface to be equal to the geometric area of the cylindrical flow reactor; corrections for surface porosity effects range from a factor of 3 to 10 lower. Back to Table
64. HOCl + HBr on H2SO4 • nH2O(l). Abbatt and Nowak [9] measured uptake of HOCl in the presence of excess HBr on a 69.3 wt.% sulfuric acid solution in a wetted wall flow reactor at 228 K. A second order bulk reaction rate constant, kII, of 2 × 10⁶ M–1s–1 was derived; this is a factor of ~10 faster than HOBr + HCl under the same conditions. Since HOCl and HBr have similar solubilities under stratospheric conditions, characterizing this reaction with a simple uptake coefficient is not appropriate. A full reaction/solubility/liquid phase diffusion model will require further data. Back to Table
65. HOCl + KBr. Rossi reported [384] studies of the uptake of HOCl in a Knudsen cell using KBr powders and spray-deposited thin films. Values for the initial uptake coefficients covered a wide range, from 5 × 10⁻³ to 0.2, due to changes in the surface from adsorbed reaction products. The major product initially was Br2, and subsequently BrCl and HOBr, with much smaller amounts of BrOCl and Br2O. The mechanism was interpreted as the formation of small amounts of HBr on the surface from hydrolysis of KBr, followed by the reaction of HOCl with adsorbed HBr to form BrCl which then reacts with KBr to form Br2. Back to Table
66. ClNO + H2O(l). Scheer et al. [396] used droplet train and wetted wall flow reactor measurements to determine reactive uptake coefficients for ClNO over a temperature range of 273-293 K. Measured values show a weak negative temperature dependence ranging from 0.12 at 273 K to 0.0058 at 293K. Thereaction was shown to be base catalyzed producing HONO. Back to Table
67. ClNO + NaCl(s). Using a Knudsen cell technique Beichart and Finlayson-Pitts [53] set upper limits of γ < ~10–5 for reactive uptake of ClNO on NaCl(s) powders at 298 K. Back to Table
68. ClNO2 + H2O(l). Behnke, George and co-workers have used droplet train and wetted wall flow reactor techniques to investigate the reactive uptake of ClNO2 on aqueous solutions [50, 139, 158, 407]. Droplet train flow reactor experiments fron 268-279 K demonstrated that the reactive uptake coefficient on pure water is <1 x 10⁻⁵ [158]. Wetted wall flow reactor studies from 279 to 292 K on pure water and very low concentration sodium halide solutions all yielded reactive uptake coefficients in the 10-6 range, with typical valures of (4.84±0.13) x 10-6 at 291 K [50], and 3.41 x 10⁻⁶ at 276.6 K, 4.27 x 10⁻⁶ at 282.2 K, and 4.48 x 10⁻⁶ at 287.4 K [139]. There is apparently no significant temperature dependence. Back to Table
69. ClNO2 + KBr, NaBr, NaI and NaCl. Caloz et al. [74] measured the uptake of ClNO2 on solid KBr at room temperature using a Knudsen cell and salt samples in the form of powders, spray-deposited films, polished

5-40
windows and depolished windows. The uptake coefficient increased with the number of layers of salt powders; correction of the uptake coefficients using the pore diffusion model gave initial uptake coefficients of (1.0 - 1.3) × 10-4, in agreement with values measured for the spray-deposited film (1.0 × 10⁻⁴) and depolished window (1.0 × 10⁻⁴). The value for the polished window was an order of magnitude smaller, as expected since this has much less surface-adsorbed water (SAW) that assists in keeping the surface from becoming passivated. The yield of Br2 relative to ClNO2 lost was 0.55 ± 0.2. Using a diffusion tube method, Koch and Rossi [284] measured an uptake coefficient of 2.0 × 10⁻⁴, in reasonable agreement with the Knudsen cell results.
The uptake of ClNO2 on aqueous solutions of NaBr has been shown to increase with the concentration of NaBr. Frenzel et al. [152] measured the uptake of ClNO2 on (0.5 - 5) × 10-3 M NaBr solutions from 275–291 K using a wetted wall flow tube apparatus; the values of γ increased from 1.2 × 10⁻⁵ to 4.0 × 10⁻⁵ over this range of NaBr concentrations. Schweitzer et al. [407] used a droplet train apparatus from 275 - 288 K; γ increased from 8.6 × 10⁻⁶ to 9.4 × 10⁻⁴ as the NaBr concentration increased from 10-4 to 1.0 M. The main product was Br2, with traces of BrNO2 and BrCl. In a subsequent study [408], they applied a wetted wall flow tube method from 275–293 K and reported uptake coefficients that were independent of temperature over this range, but again increased with the concentration of NaBr: γ increased from 7.1 × 10⁻⁶ at 10-4 M NaBr to 9.2 × 10⁻⁴ at 1.0 M. Fickert et al. [141] used a wetted wall flow tube at 274 K and measured an uptake coefficient of 1.1 × 10⁻⁵ for 10-4 M NaBr, increasing to 1.1 × 10⁻⁴ for 10-2 M NaBr. The major gas phase products were Br2 and BrNO2, with the yield of BrNO2 decreasing as the initial bromide ion concentration in solution increased. The mass accommodation coefficient for ClNO2 on aqueous solutions at 275 K was measured to be (9 ± 4) × 10-3. A Knudsen cell study by Beichart and Finlayson-Pitts [53] found γ < ~ 10-5 on NaCl powders at 298 K.
The uptake of ClNO2 on solutions of NaI was studied by George et al. [158] and by Schweitzer et al. [407, 408]. The uptake coefficient increases with the concentration of NaI. For example, George et al. [158] reported that γ0 increased from 1.1 × 10⁻³ to 6.6 × 10⁻³ as the iodide concentration increased from 10-3 M to 10-2 M at 280 K. This is consistent with the results of Schweitzer et al. [407, 408] who reported that γ0 increased from 3.1 × 10⁻⁵ to 4.5 × 10⁻³ as the iodide concentration increased from 10-4 M to 10-2 M at 275 K.
The uptake of ClNO2 on solutions of NaCl is much slower than on NaBr or NaI solutions. Behnke et al. [50] reported uptake of ClNO2 at 291 K using a wetted wall flow tube, with uptake coefficients decreasing as the NaCl concentration increased. At 0.1 M NaCl, γ0 = (3.1 ± 0.3) × 10-6 but at 4.6 M NaCl, the value was about an order of magnitude smaller, γ0 = (0.27 ± 0.02) × 10-6. They proposed that this was due to the common ion effect owing to the reversible hydrolysis of ClNO2 to Cl- + NO2
+. Back to Table
70. ClONO2 + H2O(s). Measurement of γ = 0.3 (+0.7, –0.1) (Hanson and Ravishankara [198]) significantly exceeds previous measurements of Molina et al. [335], Tolbert et al. [444], Leu [293] and Moore et al. [337] but agrees reasonably well with subsequent measurements by Chu et al. [90] and Zhang et al. [497] when geometrical surface areas are assumed for analysis. Previous measurements were probably complicated by NAT formation on the surface (Hanson and Ravishankara [202]; Chu et al. [90]). Lower levels of ClONO2 (g) used by Hanson and Ravishankara [198] minimized this surface saturation problem. Also, using lower ClONO2 concentrations, Zhang et al. obtained a reaction probability of 0.08 ± 0.02 at 195 K, in fair agreement with the range of 0.03 to 0.13 measured by Chu et al. Subsequent Knudsen cell measurements at 180 and 200 K by Oppliger et al. [351] showed initial uptake γs in the 0.2 to 0.4 range. Measured reaction products were HNO3 and HOCl. All of the HNO3 and much of the HOCl is retained on the surface under polar stratospheric conditions (Hanson and Ravishankara [198, 202]). Hanson [192] deposited ClONO2 on H2
18O enriched ice and detected H18OCl showing the Cl–ONO2 bond is broken at 191 K.
Data plots confirm a trend showing that at a high density of ClONO2, the product HNO3 covers the ice surface preventing the further reaction of ClONO2 with H2O molecules on the surface. Therefore, data obtained at high ClONO2 densities (>1014 molecules/cm3) are excluded from further evaluation. An experiment (Berland et al. [58]) using a laser-induced thermal desorption technique yielded a much lower value of ClONO2 reaction probability at 190 K (about 3 orders of magnitude lower) after extrapolating the results obtained at temperatures of 140 K and below. We also exclude this point in the averaging of data since the physical characteristics of ice surfaces at these very low temperatures may not be very representative of those found at stratospheric temperatures. Selected data show no temperature dependence between T=180 and 200 K and averaged γo= 0.28 ± 0.25. Again, within the experimental accuracy, the Hanson and Ravishankara [202, 204] and Chu et al. [90] data show that uptake measurements are nearly
5-41
independent of ice substrate thickness. See Henson et al. [216] for discussion of a model which accounts for the effect of HNO3 on the reaction ClONO2 on water and nitric acid ice surfaces.
Zondlo et al. [506] report the formation of a supercooled H2O/HNO3 liquid layer at 185 K as a reaction product, forming NAT or NAD only after decreasing the relative humidity below the ice frost point. This effect is similar to that resulting from the interaction of gaseous HNO3 or N2O5 with the ice surface. These authors measured γ = (3 ± 2) × 10–3 at 185 K for the reaction of ClONO2 with this supercooled liquid layer. Back to Table
71. ClONO2 + H2O. Deiber et al [119] used a droplet train rector to measure to uptake of ClONO2 on pure water between 274 and 285 K. No apparent temperature dependence was observed with all three temperatures measured resulting in reactive uptake measurements near 0.025. Back to Table
72. ClONO2 + HNO3•nH2O(s). Hanson and Ravishankara [198] report a γ value of 0.006 at 201 K for the ClONO2 reaction with the water on NAT (HNO3•nH2O). However, these authors present re-analyzed and additional data with γ ≈ 0.001 at 191 K in Hanson and Ravishankara [202, 204]. Similar experiments (Moore et al. [337], Leu et al. [295]) report a larger value of 0.02 ±0.01 which falls very rapidly as slight excesses of H2O above the 3/1 H2O/HNO3 ratio for NAT are removed. They measure γ of less than 1 × 10⁻⁶ for slightly water poor NAT surfaces. The inconsistency between Hanson and Ravishankara and the JPL group (Moore et al. [337]; Leu et al., [295]) has not been resolved. Abbatt and Molina [7] report γ values reaching 0.002 at 202 K and high RH. Hanson and Ravishankara [202] reported that γ for this reaction increases by a factor of 4 as the surface temperature increases from 191 to 211 K. However, Knudsen cell measurements at 185 K by Barone et al. [37] reported γ = 0.004 at a relative humidity (RH) of 100%, rising to 0.007 near RH = 120%, indicating a possible mild negative temperature dependence when high RH values from this and other studies are compared. Excluding the JPL data, the other data obtained at high RH (~90%) were averaged, assuming no temperature dependence, to yield γ = 0.0043 ±0.0021. The strong dependence on RH and the possible temperature dependence suggest that systematic error probably exceeds the calculated statistical error. Within the experimental accuracy, the data of Hanson and Ravishankara [202, 204] show that measured uptake coefficients are independent of ice substrate thickness. Barone et al. report very similar uptake coefficients for nitric acid dihydrate (NAD) as for NAT as a function of RH at 202 K. See Henson et al. [216] for discussion of a model which accounts for the effect of HNO3 on the reaction of ClONO2 on water and nitric acid ice surfaces. Back to Table
73. ClONO2 + H2SO4•nH2O(l). Results from wetted-wall flow tube (Hanson and Ravishankara [207]) Knudsen cell reactor (Manion et al. [315]), aerosol flow tube (Hanson and Lovejoy [196]), and droplet train uptake (Robinson et al. [376]) experiments supplement older wetted-wall flow tube (Hanson and Ravishankara, [200]) and Knudsen cell measurements (Rossi et al. [386], Tolbert et al [443]). Although earlier Knudsen cell measurements probably suffered from surface saturation, more recent results compare well with those from other techniques. Saturation free results, available over a temperature range of 200–265 K and a H2SO4 concentration range of 39 to 75 wt.%, were fit to a phenomenological model developed by Robinson et al. [376]. Measured γ values depend strongly on H2SO4 concentration and vary modestly with temperature, with a trend to somewhat higher values for the 210–220 K temperature range. The temperature-dependent uptake model takes into account the temperature and composition dependence of the effective Henry's Law constant, liquid phase diffusion coefficient, and the liquid phase hydrolysis rate constant. The hydrolysis reaction was treated by modeling two reaction channels, a direct hydrolysis process dominating reaction at low H2SO4 concentrations with a reaction rate proportional to water activity and a proton-catalyzed reaction with a rate proportional to H+ activity, which dominates at higher acid concentrations.
The data fit to the original Robinson et al. model have been supplemented by additional wetted-wall flow tube and aerosol flow tube data from Hanson [193] and aerosol flow tube data from Ball et al. [35]. A revised kinetic model (Shi et al. [414]) incorporating these data has been developed that is based on the earlier work of Robinson et al. [376]. In this model, γ is calculated using the expression
2
1 1 1H Obγ α
= +Γ
where,

5-42
( )22
2
1/ 24 ClONOH Ob ClONO hydr
H RTD k
cΓ =
The detailed parameterizations for HClONO2, DClONO2, and khydr are given in the Appendix in Shi et al. [414] As was the case for N2O5 hydrolysis khydr is seen to have a direct and an acid catalyzed channel. Using the same error analysis approach as in the note on N2O5 uptake, the model error is about 32.4% (one sigma), with σm=32.2% and σd=4.0%.
In the calculation of the chlorine activation (Cl2 production) rate under stratospheric conditions, one needs to take into account the competition between the reactions of ClONO2 + H2O and ClONO2 + HCl. The presence of HCl will depress the reaction probability of ClONO2 with H2O. Back to Table
74. ClONO2 + H2SO4 • H2O(s) and H2SO4 • 4H2O(s). Measurements by Hanson and Ravishankara [205] and Zhang et al. [495] demonstrate that the reaction probability on the tetrahydrate is a strong function of both temperature and relative humidity, both of which affect the level of adsorbed H2O. Both groups covered the temperature range of 192–205 K. The reaction is slowest at higher temperatures and lower relative humidities. Zhang et al. [495] have parameterized their data in the form of log γ = a1 + a2 log x + a3 log2 x; for 195 K and x = water partial pressure in Torr: a1 = 10.12, a2 = 5.75 and a3 = 0.62; for a water partial pressure of 3.4 × 10⁻⁴ Torr and x = T(K) between 182 and 206: a1 = 318.67, a2 =–3.13 and a3 = 0.0076. Zhang et al.[499] have also measured a low value of γ ∼ 2 × 10⁻⁴ on sulfuric acid monohydrate at 195 K. Back to Table
75. ClONO2 + HCl + H2O(s). Reaction probabilities of 0.27 (+0.73, –0.13) (Leu [293]) and 0.05 to 0.1 (Molina et al. [335]) were reported at 195 and 185 K, respectively. Abbatt and Molina [7] and Hanson and Ravishankara [200] report that a portion of the reaction may be due to HOCl + HCl → Cl2 + H2O, with HOCl formed from ClONO2 + H2O(s) → HOCl + HNO3(s). Hanson and Ravishankara [198] saw no enhancement of the ClONO2 reaction probability when H2O(s) is doped with HCl. Their preferred value at 192 K is γ = 0.3, but this is consistent with γ = 1. Chu et al. [90] also report a value of 0.27 (±0.19) at 188 K, assuming no correction for porosity, but suggest the true value is 0.10 (±0.08). Using a Knudsen cell technique and looking at initial uptake, Oppliger et al. [351] measured γ = 0.7 at 180 K and 0.2 at 200 K with HCl in excess. Eliminating the Molina et al. points, which were taken at much higher ClONO2 concentrations than the others, plots of the remaining data show no obvious bias when plotted as a function of reactant concentration or temperature (180–200 K). Their average value γ = 0.26 ±0.06. The Oppliger et al. data were presented for two HCl concentrations, differing by a factor of three. All points from both HCl concentrations were included since all the data were generally consistent with previous measurements, although the higher HCl concentrations did tend to produce modestly higher uptake coefficients. Until a fuller model is available, a single temperature independent value with a moderate uncertainty due to surface porosity seems appropriate. Back to Table
76. ClONO2 + HCl + HNO3•3H2O. Measurements by Hanson and Ravishankara [198, 202], Leu and co-workers in Moore et al. [337] and Leu et al. [295], and Abbatt and Molina [7] all report high γ values (>0.1) on NAT for temperatures between 192 and 202 K. Hanson and Ravishankara indicate that reaction probabilities on NAD are similar to those on NAT. The most recent NAT studies (Abbatt and Molina [7]) show a strong fall-off with relative humidity from γ > 0.2 at 90% RH to 0.002 at 20% RH, indicating the necessity of sufficient water to solvate reactants. Within the limited measurements, data plots show no indication that the reaction probability of ClONO2 + HCl depends on HCl and ClONO2 gas phase concentrations or temperature between 191 and 202 K. Averaged data yield is γ = 0.23 ±0.10. Carslaw and Peter [78] have published a model of this reaction and its dependence on HCl uptake. Back to Table
77. ClONO2 + HCl + H2SO4•nH2O(l). Early work by Tolbert et al. [443] and Hanson and Ravishankara [200] indicated that the presence of HCl had little effect on the reaction of ClONO2 with concentrated sulfuric acid (>65 wt.% H2SO4). Subsequent realization that HCl would be more soluble, and therefore a more potent reactant, in the colder, more dilute sulfuric acid aerosols characteristic of the polar stratosphere led to additional investigations by Hanson and Ravishankara [207], Zhang et al. [495], Elrod et al. [131] and Hanson [193]. All these measurements show a strong dependence of reactivity on HCl solubility, which in turn depends on water activity. The solubility of HCl in a wide range of sulfuric acid solutions has been experimentally determined by a range of techniques that agree well with current thermodynamic models. See Robinson et al. [377] for a review. Hanson and Lovejoy [196] measured a reacto-diffusive length, , of only 0.009±0.005 μm for 60 wt.% H2SO4 in an aerosol flow reactor. (See Hanson et al. [210] for a definition of

5-43
.) This is a factor of four lower than the value for the hydrolysis reaction of ClONO2 showing the significant enhancement of ClONO2 uptake due to HCl.
The ClONO2 + HCl reaction on sulfuric acid has been modeled in Shi et al. [414] using the same phenomenological model for ClONO2 hydrolysis driven uptake by sulfuric acid. Since the effect of HCl on the ClONO2 uptake is to increase the ClONO2 pseudo-first-order reaction rate, the model of ClONO2 uptake (see note on ClONO2 uptake on sulfuric acid) should include the pseudo first order reaction rate, kHCl. The formulation of kHCl is found in the Appendix in Shi et al. [414]. It is likely that the ClONO2 reaction with HCl, like the ClONO2 hydrolysis reaction, is acid catalyzed via protonated HClONO2
+, where Cl+ is activated as in the case of HOCl + HCl. For the ClONO2 + HCl reaction, there is also a surface reaction (Hanson [193]). Hanson proposed that Γs is linearly proportional to water activity; however, the calculated value of γo at 250 K and 60 wt.% H2SO4 using his formulation is 0.02 (here γo~Γs), which is contradictory to his aerosol flow reactor result, which yielded γo=0.0079 (here γo~Γb) (Hanson and Lovejoy [196]). In the model presented in the Shi et al. appendix, it is assumed that that Γs is linearly proportional to Henry’s law constant of ClONO2, rather than the water activity. The temperature dependence of Γs is determined, based on two measured values of Γs at 203 K (Hanson, [193]) and 250 K (Hanson and Lovejoy, [196]). The model yields a value of γo~0.011 (here γo~Γs), which is close to the measured value.
In the stratosphere, when the reaction rate of ClONO2 with HCl exceeds the flux of HCl to the particle surface, HCl is depleted. This, in turn, will depress the rate of both the ClONO2 and HOCl + HCl reactions, and increase the ClONO2 hydrolysis rate. Shi et al. [414] have proposed a model in which this effect is taken into account by including a factor FHCl (see Table A–3 in Shi et al.). The formulation of FHCl is based on scaling HCl reaction and accommodation fluxes. This flux correction is not exact (i.e. it does not rigorously calculate the HCl surface or bulk concentration) but provides a good approximation to the expected reduction in HCl + ClONO2/HOCl reactivity and, just as importantly, the effective increase in ClONO2 + H2O reactivity when pClONO2 > pHCl. This is particularly relevant during cold Cl activation events when HCl can be removed almost completely (i.e., see Jaegle et al. [243]).
Using the same error analysis approach as in the note on N2O5 uptake by sulfuric acid, the error of using the model in the Appendix is about 40.0% (one sigma), with σm=39.8% and σd=4.0% Back to Table
78. ClONO2+HCl + H2SO4 • H2O(s) and H2SO4 • 4H2O(s). This reaction has been studied by Hanson and Ravishankara [205] and Zhang et al. [495]. The reaction probability is strongly dependent on the thermodynamic state of the SAT surface, which is controlled by the temperature and the water vapor partial pressure. At a water vapor pressure of 5.6 × 10⁻⁴ Torr the measured γ drops by over two orders of magnitude as the SAT surface temperature rises from 195 to 206 K. The results from the two groups are in qualitative agreement, but sample different H2O and HCl partial pressures. Zhang et al. have parameterized their data as a function of water partial pressure (at 195 K) and temperature (both at an HCl partial pressure of 4 to 8 × 10–
7 Torr) in the form log γ = a1 + a2 log x + a3 (log x)2. For H2O partial pressure, a1 = 5.25, a2 = 1.91, and a3 = 0.0; for T(K), a1 = 175.74, a2 = –1.59, and a3 = 0.0035. Care must be taken in extrapolating either data set to lower HCl concentrations. Zhang et al. [499] measured no enhancement of ClONO2 uptake on sulfuric acid monohydrate at 195 K with (2–8) × 10–7 Torr of HCl present, implying γ < 1 × 10⁻⁴. Back to Table
79. ClONO2 + HCl + Al2O3(s). Molina et al. [334] used flow tube techniques to measure γ = 0.020 ±0.005 on α−alumina at 195–230 K with stratospheric (5 ppmV) water vapor levels. Measured γ was independent of T and was affected very little by 5 ppbv HNO3 vapor. The same γ was measured for a Pyrex surface, indicating the absorbed water and not the inorganic substrate hosted the reaction. Back to Table
80. ClONO2 + NaCl. Timonen et al. [440] studied the uptake of ClONO2 on NaCl powders at 296 K and 225 K using a flow tube. Complete deactivation of the surface was observed at 225 K but not at 296 K. The initial uptake coefficients, after correction (typically by an order of magnitude) using the pore diffusion model of Keyser et al. [274, 275] were γ0 = (4.6 ± 3.1) × 10-3 (1 σ) at 296 K and γ0 = (6.7 ± 3.2) × 10-3 (1 σ) at 225 K. Caloz et al. [73] used a Knudsen cell and found that the initial uptake coefficient was 0.23 ± 0.06, independent of the type of salt used (powders, single crystals, deposited salt films) and without applying a correction for pore diffusion since no mass dependence for γ was observed; in similar studies. Aguzzi and Rossi [11] measured a value of γ0 = 0.10 ± 0.05 for the uptake of ClONO2 on NaCl and 0.27 ± 0.10 for uptake on the unreactive NaNO3 and Na2SO4 salts. The Cl2 yield was 100% for NaCl, in agreement with the earlier studies [73, 440] but 27 ± 7 % on the unreactive salts. Koch and Rossi [284] used a diffusion tube technique to measure a value of 0.1 for the uptake coefficient. Gebel and Finlayson-Pitts [156] used a
5-44
Knudsen cell and measured an initial value of γ0 = 0.14 ± 0.11 (2 σ) and a steady-state value of γ = (3.9 ± 1.8) × 10-2, but concluded that approximately two layers of salt were sampled in these multi-layer experiments. The use of a single or sub-single layer of NaCl gave a steady state value corrected using the model of Hoffman et al. of γ = (2.4 ± 1.2) × 10-2 [220]. The source of the very disparate results from the different groups and techniques is not clear. All studies agree that the yield of Cl2 is 100%, consistent with ClONO2 + NaCl → Cl2 + NaNO3 as observed earlier [144], with small amounts of HOCl from hydrolysis of ClONO2 on the surface being observed in the presence of water.
Deiber et al. [119] studied the uptake of ClONO2 on water, NaCl and NaBr solutions using a droplet train flow reactor. The uptake coefficient was the same on water and 0.1 M NaCl, and Cl2 was observed as the gas phase product. Back to Table
81. ClONO2 + KBr and NaBr. Caloz et al. [73] and Aguzzi and Rossi [11] report a rapid uptake of ClONO2 on KBr solid salts at room temperature, γ0 = 0.35 ± 0.06 and γ0 = 0.18 ± 0.07 respectively; corrections for pore diffusion were not applied but are not expected to be large at these high uptake coefficients (see Introduction). This is consistent with a value of 0.1 measured by Koch and Rossi [284] using a diffusion tube technique. The reaction products are BrCl, Br2 and Cl2. BrCl is the initial reaction product formed from ClONO2 + KBr → BrCl + KNO3. Br2 is generated in a secondary reaction of BrCl with KBr: BrCl + KBr → Br2 + KCl. Cl2 is then formed as the surface KBr is converted to KCl, which then reacts with ClONO2.
Deiber et al. [119] studied the uptake of ClONO2 on water, NaCl and NaBr solutions using a droplet train flow reactor. On NaBr, the uptake increased from 0.041 at 0.01 M NaBr to 0.073 at 1 M NaBr. From the dependence on the NaBr concentration, a value for the mass accommodation coefficient for ClONO2 of 0.108 ± 0.033 (2 σ) was obtained. The gas phase products were BrCl and Br2, the latter formed by secondary reactions of BrCl with Br-. Back to Table
82. ClONO2 + sea salt. Gebel and Finlayson-Pitts [156] reported a rapid reaction between ClONO2 and synthetic sea salt, with initial values based on the geometric sample area of γ0 = 0.42 and steady-state values of γ = 0.16 (2 σ). These were measured with multiple salt layers (3 - 236) but corrections for diffusion into underlying layers for such high uptake coefficients are relatively small, less than a factor of three. The yield of Cl2 was 78 ± 13%; small amounts of HCl and HOCl were also observed as products. The recommended lower limit is based on these studies and the rapid uptake of other reactive species such as HNO3 and N2O5. Back to Table
83. ClONO2+HBr + H2O(s) and HNO3 • nH2O(s). This reaction was studied by Hanson and Ravishankara [201] on water ice and NAT near 200 K. A diffusion-limited reaction probability of >0.3 was observed. Allanic et al. [23] measured γ = 0.56 ± 0.11 at 200 K on water ice, observing Cl2 and Br2 to be formed in yields of 100% and 66 to 80%, respectively, in the range 180 to 200 K. Back to Table
84. ClONO2 + HF + H2O(s) and HNO3 • nH2O(s). Hanson and Ravishankara [201] were not able to observe this reaction on water ice and NAT surfaces near 200 K. Back to Table
85. CFxCl(4-x) (x=0–3) and CF2Br2 + Al2O3(s). Robinson et al. [374] reported dissociative uptake of CF2Cl2 and CF2Br2 on α-alumina surfaces at 210 and 315 K. Reaction probabilities of about 1 × 10⁻³ at 210 K were measured by monitoring the amounts of surface species bonded to the Al2O3 substrate. A re-analysis (Robinson et al. [375]) lowered this value by about a factor of 50. Moderate surface dosage with water vapor did not quench the reaction. In addition, Dai et al. [108] and Robinson et al. [373] studied dissociative chemisorption of CF3Cl, CF2Cl2, CFCl3, and CCl4 on dehydroxylated γ-alumina powders. The obtained reactive uptake probabilities ranging from 0.4 × 10⁻⁵ for CFCl3 to 1.0 × 10⁻⁵ for CFCl3 over a temperature range of 120 to 300 K. HCl and halomethyl radicals were observed as desorption products. Loss of these products may point to somewhat higher γs, since they were measured by integrating halogen bound to Al2O3 substrates. Back to Table
86. BrCl + NaCl, KBr and NaI. The uptake of BrCl on solid NaCl and KBr using a Knudsen cell has been reported by Aquzzi and Rossi [11], yielding 298 K values of 6 × 10⁻² for NaCl and 0.14 on KBr. An earlier preliminary study from the same group reported a value at γ>0.1 on KBr [73]. Insufficient data are available to make a recommendation.
Katrib et al. [267] measured the uptake of BrCl on aqueous solutions of NaI over the temperature range from 273 to 288 K; the uptake coefficient increased from 0.37 × 10⁻² to 0.7 as the I- concentration increased from 1

5-45
× 10-4 to 0.5 M NaI. The complex dependence on the I- concentration indicated that a surface reaction was occurring at the air-solution interface. Back to Table
87. Br2 + NaCl, KBr and NaI. Only one report of the uptake of Br2 on solid NaCl and KBr using a Knudsen cell is available [11] as part of a study of BrONO2 uptake on salts. The uptake coefficient for Br2 was 4 x 10⁻³ on NaCl and 3 × 10⁻³ on KBr. Insufficient data are available to make a recommendation.
Hu et al. [226] measured the uptake of Br2 on aqueous solutions of NaI using a droplet train flow reactor over the temperature range of 263 to 293 K. The measured uptake coefficients decreased from 0.33 at 263 K to 0.08 at 293 K, with evidence for a significant contribution from a reaction at the interface between Br2 and I-. Back to Table
88. BrO + H2O(s), H2SO4 • nH2O(l) and NaCl(aq). Abbatt [3] used a coated flow tube technique to measure heterogeneous uptake on water ice, 60 and 70 wt.% H2SO4 at 213 K, and 23 wt.% aqueous NaCl at 253 K. He obtained γ(ice) = (1.0 ± 0.4) × 10–3, γ (60 wt.% H2SO4) = (7 ± 2) × 10– 4, γ (70 wt.% H2SO4) = (5 ± 2) × 10– 4 and γ (23 wt.% NaCl) < 3 × 10⁻³. He observed product Br2, indicating BrO self-reaction on both water ice and sulfuric acid solutions. Since reaction rate will depend on BrO concentrations, no recommendation is made for an atmospheric rate. Back to Table
89. HOBr + HCl(s). Abbatt [1] measured γ = 0.25 (+0.10/-0.05) for this reaction on ice at 228 K. Chaix et al. [81] measured γ = 0.3 on ice from 180 to 195 K, dropping to ~0.15 at 205 K. The BrCl product was observed by mass spectrometry. Mossinger et al. [338] report a lower limit for γ of 0.1, under conditions with HCl concentration in excess of the HOBr concentration. No data on NAT surfaces is available. Back to Table
90. HOBr + HCl + H2SO4 • nH2O. For the sulfuric acid reaction, Abbatt [2] measured γs of ~ 0.1 to 0.2 for [HCl] > 1 × 1012 cm–3 over 68.8 wt.% H2SO4 at 228 K; yielding an estimated kII
HCl+HOBr = 1.4 × 10⁵ M–1 s–1 with a factor of 2 uncertainty. Hanson and Ravishankara [208] also measured γ< = 0.2 [+0.2, – 0.1] for 60 wt.% H2SO4 at 210 K. However, both of these measurements were based on significant underestimation of the solubility of HOBr in the relevant sulfuric acid solutions. More recent measurements by Waschewsky and Abbatt [468] indicate that H for HOBr varies slightly with acidity between 60 to 70 wt.% H2SO4 and more strongly with temperature between 208 and 238 K. (For 59.7 wt.% H2SO4, H (M atm–1) = 1.2 × 10⁶ at 208 K and and 2.2 × 10⁵ at 228 K.) The HOBr + HCl second order liquid phase rate constant, kII
HCl+HOBr, varies between 2 × 10⁵ and 3 × 10⁸ (M–1s–1) between 213 and 238 K over the same composition range (60–70 wt.% H2SO4). Such a strong dependence on acid composition for the reaction rate of HOBr + HCl and the very small acid composition dependence for HOBr solubility in H2SO4 solution might be partially due to the formation of H2OBr+ in the acidic solution as discussed in their paper. However, this acid catalyzed reaction, i.e. H2OBr+ + HCl, alone does not completely account for measured reaction rates over the acid composition range studied.
Using the Henry’s Law data for HOBr reported by Waschewsky and Abbatt [468], the limiting reagent will vary depending on atmospheric temperature (H2SO4 wt.%) and the concentrations of HOBr and HCl. For stratospheric conditions where [HOBr] is 10 pptv and [HCl] 1ppbv, they predict dissolved HOBr will be in excess above 204 K and HCl in excess below 204 K for a H2O vapor partial pressure of 3x10⁻⁷ atm. From their coated wall flow reactor uptake measurements, Waschewsky and Abbatt [468] derived expressions for kII
HCl+HOBr and predicted uptake coefficients. For temperature between 204 and 218 K where HOBr is likely to be in excess, they calculated HCl uptake coefficients, γHCl, which range between 7 × 10⁻⁵ and 9 × 10⁻⁵. For temperatures in the 202–198 K range, where dissolved HCl is likely to be excess, the calculated uptake coefficients for HOBr, γHOBr, of ∼1 × 10⁻². Hanson has reported Henry’s law solubility data for 58-70 wt.% sulfuric acid and reactive uptake coefficients for HCl on HOBr doped sulfuric acid surfaces using a wetted wall flow reactor [188]. Hanson’s reported that HHOBr was independent of acid concentration at 250 K, however, the heat of solvation for HOBr derived is significantly lower (-12.5±3.7 versus -9±1 kcal/mol reported at lower temperatures by Waschewsky and Abbatt) that the values of HHOBr based on Hanson’s data are mush lower than the prior study’s when extrapolated to their lower temperatures. Hanson’s reported γHCl are strongly dependent on HOBr partial pressure and drop almost three orders of magnitude as the sulfuric acid concentration is raised from 58 t6 9.5 wt.%, possibly because HCl may be reacting with sulfuric acid at higher acid concentrations. The higher temperature kII
HCl+HOBr values computed by Hanson for his data disagree, when extraplated to lower temperatures with the vales reorted by Waschewsky and Abbatt as well as a prior lower temperature value reported by Hanson and Ravishankara [208], better agreement can be obtained if the solvation enthalpy reported by Hanson is used to adjust the HHOBr values used in the earlier, lower temperature studies. Clearly, the HOBr + HCl reaction will be difficult to parameterize in a simple
5-46
manner. Potential inconsistencies in their kIIHCl+HOBr values, as discussed by Waschewsky and Abbatt [468]
and Hanson [188] indicate that further measurements will be required before this reaction can be definitively modeled. Back to Table
91. HOBr + HBr + H2O(s) and H2SO4 • nH2O. Abbatt [1] measured γ = 0.12 ± (0.03) on ice at 228 K. Chiax et al. [81] measured γo values ranging from 0.44 at 180 K to 0.15 at 205 K. The Br2 product was observed by mass spectrometry. Abbatt [2] measured γ = 0.25 for [HBr] = 1 × 1012 cm–3 over 68.8 wt.% H2SO4 at 228 K; yielding an estimated kII > 5 × 10⁴ M–1 s–1. Back to Table
92. HOBr + NaCl. Mochida et al. [333] studied the uptake of HOBr on NaCl using multi-layer powders (10 - 500 μm) in a Knudsen cell at room temperature. After correction (by about an order of magnitude) for diffusion into the underlying layers, they obtained values for the initial uptake coefficient in the range of (0.97 - 6.5) × 10-3, with the corrected values decreasing with increasing concentrations of HOBr. They attributed this to competition between the reaction of HOBr with NaCl and a self-reaction of HOBr on the surface: 2 HOBr → Br2 + H2O + ½ O2. Their final value of < 6.5 × 10⁻³ is based on their extrapolation back to very low HOBr concentrations. Both Br2 and BrCl were observed as products. Chu et al. [87] measured the uptake of HOBr on NaCl at 250 K over a range of RH from 1.5 to 22.5%. After correcting the measured loss of HOBr by a factor of ~ 30 for diffusion into the underlying salt layers using the pore diffusion model, they obtained a value γo = 5 ×10⁻⁵. The smaller value compared to the Knudsen cell results of Mochida et al. [333] may be due to the much lower temperature they used; BrCl was the only gas phase product observed.
Abbatt and Waschewsky [10] measured the uptake of HOBr on deliquesced 1 - 5 μm NaCl particles (75% RH); for particles at pH values of 0.3 and 7.2, a lower limit to the uptake coefficient of γo > 0.2 was measured. On unbuffered particles, the upper limit for the uptake coefficient was γo < 1.5 ×10⁻³ due to the limited availability of H+ for the reaction between HOBr and Cl- to form BrCl. Back to Table
93. HOBr + KBr and NaBr. Mochida et al. [333] studied the uptake of HOBr on solid KBr using multi-layer powders and spray-deposited films in a Knudsen cell. After correction (by factors of ~ 4-5) for diffusion into the underlying layers for the powders, they obtained values for the initial uptake coefficient in the range of (1.3 - 8.4) × 10-2, with the corrected values again decreasing with increasing concentrations of HOBr due to the self-reaction of HOBr on the surface: 2 HOBr → Br2 + H2O + ½ O2. On spray-deposited films where correction for diffusion into the underlying layers is not necessary, a value of 0.18 ± 0.04 was measured. The recommended upper limit is based on their extrapolation back to very low HOBr concentrations for the powders, and the spray-deposited film results. Br2 was the only product observed.
Chu et al. [87] measured the uptake of HOBr on NaBr at 250 K in a flow tube at RH from 0.5 to 12 %. After correction by approximately an order of magnitude for diffusion of HOBr into the underlying salt layers using a pore diffusion model, a value for γ0 of 2.5 × 10⁻³ was obtained; the smaller value may be due to the much lower temperature at which these studies were carried out. Again, Br2 was the only product observed.
The uptake of HOBr on aqueous solutions of NaBr has been measured by Wachsmuth et al. [463] and by Fickert et al. [140] Wachsmuth et al. [463] report a rapid rate of uptake that is limited by mass accommodation; the mass accommodation coefficient was calculated to be 0.6 ± 0.2. This is consistent with the studies of Fickert et al. [140] who reported a lower limit for the mass accommodation coefficient of 1 × 10⁻² at 274 K and observed that Br2 was released at 100% yield at pH < 6.5. The yield of Br2 decreased rapidly with pH at higher pH values due to the declining ratio of HOBr to BrO-.
Fickert et al. [140] also measured the uptake of HOBr on aqueous solutions containing mixtures of NaCl and NaBr. BrCl was the major product at small Br- concentrations while Br2 dominated as the bromide ion concentration in solution increased. Back to Table
94. BrNO2 + H2O(l). Behnke, George and co-workers have used wetted wall flow reactor techniques to investigate the reactive uptake of BrNO2 on aqueous solutions from 276 to 298 K [407] and [139]. Measured reactive uptake coefficients range from 1 to 3.5 × 10⁻⁶ with a small postive temperature dependence. Back to Table
95. BrNO2 + KCl and NaCl. Caloz et al. [74] measured an uptake coefficient for BrNO2 on KCl of 5 x 10⁻², but concluded that it was due only to reaction with a small bromide impurity in the KCl; as expected if this is the case, only Br2 was generated in the reaction.

5-47
The uptake of BrNO2 on aqueous solutions of 0.5 M NaCl has been measured using a droplet train flow reactor by Schweitzer et al. [407] from 277 - 293 K yielding γ0 ~ 1 × 10⁻⁵. Frenzel et al. [152] used a wetted wall flow tube to obtain a lower limit for the uptake coefficient of 3.8 × 10⁻⁵ at 291 K. Back to Table
96. BrNO2 + KBr, NaBr and NaI. Caloz et al. [74] used a Knudsen cell to study the uptake of BrNO2 on solid KBr powders. The uptake was fast, γ0 > 0.3, with production of Br2 as the gas phase product.
On aqueous solutions of NaBr, the uptake coefficient increases as the concentration of NaBr increases [152, 407, 408]. For example, at 278 K, γ0 increased from 8.6 × 10⁻⁶ to 1.1 × 10⁻⁴ as the NaBr concentration increased from 5 × 10⁻⁴ to 5 × 10⁻², but was independent of temperature over the range from 275 - 293 K [408]. The major gas phase product is Br2, with smaller amounts of BrNO2 and only at the smaller concentrations of NaBr [407, 408].
The uptake of BrNO2 on aqueous NaI solutions has been determined using a droplet train flow reactor [407] and a wetted wall flow tube [408]; the uptake coefficient from 4.4 × 10⁻⁵ to 4.4 × 10⁻⁴ as the iodide concentration increased from 10-4M to 5 × 10⁻³ M [408]. Back to Table
97. BrONO2 and BrONO2 + HCl + H2O(s). Hanson and Ravishankara [204] investigated these reactions in an ice-coated flow reactor at 200 (±10) K. The reaction of BrONO2 with H2O(s) proceeded at a rate indistinguishable from the gas phase diffusion limit, implying that the reaction probability may be as high as one; the product BrNO(g) was observed. Allanic et al [22] used a Knudsen cell reactor to measure BrONO2 uptake between 190-200 K. Values of initial γ’s in the 0.2-0.3 range were observed. An average γ = 0.26 ± 0.05 was obtained from all of the appropriate data from both experiments. Aguzzi and Rossi [13] studied the hydrolysis reaction on various types of ices, obtaining γ = 0.34 ± 0.03 at 180 K and γ = 0.15 ± 0.01 at 210 K. They observed HOBr as the main product and Br2O as a secondary product. Hanson and Ravishankara [204] also codeposited HCl with BrONO2 observing rapid production of BrCl. It is unclear whether BrCl is produced directly from BrONO2 + HCl or via HOBr (from BrONO2 hydrolysis) reacting with HCl. Back to Table
98 BrONO2 + H2O(l). Deiber et al. [119] used a droplet train rector to measure to uptake of BrONO2 on pure water between 272 and 280 K. An apparent positive temperature dependence was observed with measured reactive uptake measurements ranging from 0.024±0.0008 at 272.5 K to 0.039±0.0012 at 279.7 K. Back to Table
99. BrONO2 and BrONO2 + HCl + H2SO4•nH2O(l). Hanson and co-workers used both coated flow tube and aerosol flow tube techniques to show that the reaction of BrONO2 with 45–70 wt.% H2SO4 is extremely facile at temperatures from 210 to 298 K. Hanson and Ravishankara [208] measured γs of 0.5 (+0.5, –0.25) (45 wt.% H2SO4, 210 K, 0.4 (+0.6, –0.2) (60 wt.%, 210 K), and 0.3 (+0.7, –0.1) (70 wt.%, 220 K) in a coated-wall flow tube experiment. Hanson et al. [209], measured γ~ 0.8 (20 to 40% error) for submicron aerosols at temperatures between 249 and 298 K and H2SO4 concentrations of 45 to 70 wt.%; there was a sharp fall off in γ for H2SO4 concentrations between 73 and 83 wt.%. Hanson also reported additional temperature dependent (230-295 K) coated flow reactor and room temperature (295-300 K) aerosol flow reactor studies extending measurements to higher acid wt.% values [188]. Hanson has analyzed these combined data sets, the data indicated that γ is a function of sulfuric acid concentration, but independent of temperature. After eliminating one previously reported anomalously low 83 wt.% data point Hanson has fit an empirical expression for measured γs for BrONO2 + H2O in the form of: 1/γ=1/α +1/γrxn, where γrxn = exp(a+b*wt.) and α=0.80, and a=29.2, b=–0.40 [188]. Using the same approach as detailed in the note for N2O5 uptake on sulfuric acid, the error for BrONO2+ H2O is 27.3% (one sigma), with γm=26.6% and γd=6.3%. Addition of excess HCl to 229 K, 40 and 60 wt.% H2SO4 aerosols caused an increase in γ to 1.0 and 0.9, respectively [209]. Back to Table
100. BrONO2 + HBr. Aguzzi and Rossi [13] measured γ over the 180-210 K temperature range, with γ = 0.3 at 180 K and an activation energy of -1.2 ± 0.2 kcal/mol. Back to Table
101. BrONO2 + NaCl. Aguzzi and Rossi [11] used a Knudsen cell and three types of NaCl samples (powders, spray-deposited and single crystal) to measure the uptake of BrONO2 and obtained consistent results with γ0 = 0.31 ± 0.12. No correction for diffusion into the powders was made because of the high uptake coefficient (see Subsection 5.6). BrCl was the major product, 80 ± 20%, with smaller amounts (~ 10%) of Br2 and some HCl. Rapid uptake of BrONO2 of the same magnitude was observed on the unreactive salts NaNO3 and Na2SO4, with a Br2 yield of 45 ± 10%; this uptake and reaction was attributed to the self-reaction of BrONO2 on the surface to generate Br2O which decomposed to Br2.

5-48
Deiber et al. [119] studied the uptake of BrONO2 on water, NaCl and NaBr solutions using a droplet train apparatus from 272 - 280 K. The uptake coefficient was the same on water and 0.1 M NaCl, where BrCl was observed as the gas phase product. On NaBr, the uptake increased with the square root of the NaBr concentration, from which a value for the mass accommodation coefficient for BrONO2 of 0.063 ± 0.021 (2 σ) was obtained. Back to Table
102. BrONO2 + KBr and NaBr. Aguzzi and Rossi [11] used a Knudsen cell and three types of KBr samples (powders, spray-deposited and single crystal) to measure the uptake of BrONO2 and obtained consistent results with γ0 = 0.33 ± 0.12. No correction for diffusion into the powders was made because of the high uptake coefficient (see Subsection 5.6). Br2 was the major product, with its yield decreasing as the concentration of BrONO2 increased; this was attributed to a competition between the reaction of BrONO2 with KBr and the self-reaction of BrONO2 on the surface.
Deiber et al. [119] studied the uptake of BrONO2 on water, NaCl and NaBr solutions using a droplet train flow reactor from 272 - 280 K. The uptake coefficient was the same on water and 0.1 M NaCl. On NaBr, the uptake increased with the square root of the NaBr concentration, from which a value for the mass accommodation coefficient for BrONO2 of 0.063 ± 0.021 (2 σ) was obtained. The gas phase product on the NaBr solution was Br2. Back to Table
103. CF3OH + H2O + H2O(l) and H2SO4 • nH2O(l). Lovejoy et al. [310] used both wetted-wall and aerosol flow tube techniques to measure reactive uptake of CF3OH on water at 274 K and 39–60 wt.% H2SO4 at various temperatures between 206 and 250 K. γ’s showed a strong dependence on water activity. Aerosol uptake studies yielded reacto-diffusive lengths of > 0.4 µm for 40 wt.% H2SO4 and 1.0 µm for 50 wt.% H2SO4, both at 250 K. Recommended γ’s were estimated by averaging bulk uptake measurements at similar H2SO4 concentrations and ignoring temperature effects on water activity. Back to Table
104. O3 + SO2 + Al2O3(s). Usher et al. [452] present Knudsen cell data showing that pretreatment of α-alumina with SO2 increases γo values for O3 uptake by 30%; FTIR observations by the same group show that O3 oxidized surface sulfite and bisulfite formed by SO2 absorption to sulfate and bisulfate. Back to Table
105. SO2 + H2O2, O3, HONO, NO2, HNO3 + H2SO4 • nH2O(l). Rattigan et al. [364] used a bubble train reactor to measure the uptake of SO2 in the presence of solvated oxidants at 293 K. For H2O2 the second order rate constant at 1 wt.% H2SO4 agreed well with previous bulk kinetics measurements and with previous droplet train/flow reactor measurements. Measurements at 20, 40, and 60 wt.% H2SO4 are the first reported for concentrated acid. Reaction rate data were fit to a two term (acid catalyzed and water catalyzed) bulk second order rate expression, which, in the limit of high acid activity ( aH
+ = αH+[H+], where αH+ is the H+ activity coefficient) reduces to: kII
H2O2= 8.3 × 10⁴ (αH2O/ aH+), where α H2O is the water activity coefficient. Both αH+
and αH2O can be obtained from the sulfuric acid thermodynamic model of Carslaw et al. [77]. The high aH+
approximation for kII H2O2 should be accurate to a factor of two between 40 and 70 wt.%.
Uptake of SO2 in the presence of solvated O3 was measured for 1–70 wt.% acid; the Henry’s law expression for O3 was determined in separate experiments. Measured second order rates agree reasonably well with previous results measured below 18 wt.%. A three term fit for reaction with SO2(aq), HSO3
–, and SO4= was
fit to the data: kiiO3 = 6.6 × 10³ [SO2(aq)] + 3.2 × 10⁵ [HSO3
–] + 1 × 10⁹ [SO4=]. This expression should be
accurate to a factor of two between 20 and 70 wt.%.
The HONO reaction was studied by adding nitrosyl sulfuric acid to 20, 40, 60, and 70 wt.% acid. Measured second order rate constants were moderately consistent with previous measurements below 10 wt.%. A kII
HONO = 142[H+] was fit to the full data set; it should be accurate to a factor of two for acid concentrations between 10 and 70 wt.%.
No enhanced SO2 uptake was observed with added gas phase NO, NO2, or with 20 wt.% HNO3 added to 50–60 wt.% sulfuric acid. Back to Table
106. SO2 + Al2O3. Goodman et al. [174] used FTIR observations of SO2 absorption on α-alumina to show that surface bound sulfite and bisulfite products are produced, they integrated these surface feature absorbencies to estimate a γo of (9.5 ± 0.3) x 10-5. Usher et al. [451] performed BET corrected room temperature studies on four α-alumina samples reporting and average γo of (1.6 ± 0.5) x 10-4. FTIR studies of SO2 uptake on commercial γ-alumina catalyst samples also show sulfite formation on non-hydroxylated surfaces [110, 265]. Back to Table
5-49
107. SO2 + NaCl and sea salt. Gebel et al. [157] reported no measurable uptake of SO2 on NaCl, yielding an upper limit of 1 × 10⁻⁴ for the uptake coefficient. The same was true for synthetic sea salt that had been heated while pumping. However, sea salt that had not been heated or pumped on extensively had a rapid uptake of SO2, with initial uptake coefficients as large as 0.09. The time dependence of the uptake coefficient was consistent with uptake of SO2 into a liquid layer, likely due to large amounts of water adsorbed on the hygroscopic components of sea salt such as magnesium hydrate. No gas phase products were observed but sulfite formation in the salt was seen by FTIR, indicating that uptake was due to dissolution of SO2 into the water film on the salt surface. Back to Table
108. SO3 + H2SO4 • nH2O(l). Jayne et al. [248] measured the uptake coefficient in a wetted wall-flow reactor at 300 K over a composition range of 78–92 H2SO4 wt.%. The measured γ was indistinguishable from 1.0. Higher water concentrations and lower temperatures probably tend to increase γ, so a value near 1.0 probably holds for all atmospheric conditions. Back to Table

5-50
5.15 Soot Surface Uptake Coefficients
Table 5-3. Soot Surface Uptake Coefficients
Gaseous Species Uptake Coefficient (γ) Notes SO2 See Note 1, 2 NH3 0, See Note 1, 3 O3 See Note 1, 4 HNO3 See Note 1, 5 N2O5 See Note 1, 6 NO2 See Note 1, 7 NO3 See Note 1, 8 HO2 See Note 1, 9 HO2NO2 See Note 1, 10 H2O See Note 1, 11
5.16 Notes to Table 5-3
1. See also the sections on soot under “Surface Types” and “Parameter Definitions” for a description of some of the factors affecting the uptake and reaction of gases on soot surfaces. In most cases, the available reactive surface area rather than the geometric areas have been used in obtaining the uptake coefficients; in those cases where the geometric area was used but a higher available surface area was involved in the measured uptake, the uptake coefficient is given as an upper limit. Most data are available at room temperature or there are very limited data at lower temperatures characteristic of the upper troposphere. Back to Table
2. SO2 + soot. γ < 3 × 10⁻³ measured using Degussa FW2 carbon black by Rogaski et al. [382]. This is an upper limit since it is based on the geometric surface area. Koehler et al. [287] measured an average value of (2 ±1) × 10–3 over the first 10–30 s on n-hexane soot at –100° C (the initial uptake may be larger), but indicate that taking into account surface roughness would reduce this value. A number of studies [32, 91, 92, 103, 287, 303, 382] suggest that uptake is primarily due to physisorption on the surface; oxidation occurs in the presence of water, oxidants and metals. Back to Table
3. NH3 + soot. Chughtai et al. [91] and Muenter and Koehler [343] measured the uptake of NH3 on soot. Based on Muenter and Koehler [343] where conditions are closest to atmospheric, NH3 is not taken up by soot particles at temperatures above 173 K. Back to Table
4. O3 + soot. Many studies report a rapid, initial loss of O3 followed by a slower loss that also occurs on aged soot or soot pre-exposed to ozone [96, 100, 121, 133, 134, 236, 262, 309, 382, 419, 422, 427]. Initial, rapid O3 loss may be most applicable for soot as it comes out of aircraft exhaust, with γinit ~ 10–3 from most studies using both carbon black and organic combustion soots [133, 134, 236, 382, 427]. The second stage of the reaction is probably more applicable to soot dispersed in air; γaged ~ 10–4–10–6 using both carbon black and organic combustion soots [133, 134, 236, 262, 309, 359, 427], but in the range of 10–4 to 10–5 based on organic combustion soot data alone [236, 309]. A few studies have been carried out at temperatures below room temperature [96, 236, 262, 309]; given the wide ranges measured even at room temperature, these values generally fall in the same range. Il’in et al. [236] report a temperature dependence for the initial uptake on fresh soot of γfresh = 1.9 × 10⁻³(exp–780/T) and for aged soots, γaged = 1.8 × 10⁻⁴(exp–1000/T). Both physisorption and reaction of ozone with the surface appear to take place. The studies of Fendel et al. [133] suggest that lower particle growth in size below 40 ppb O3 is due to less than a monolayer of O3 on the surface. Stephens et al. [427] proposed a Langmuir-type reversible adsorption of O3, followed by a slower reaction with the surface. Pöschl et al. [359] proposed a similar scheme for uptake of ozone on spark-generated graphite soot coated with benzo[a]pyrene. Initial reversible physisorption occurred with γ ~ 10–3, and “apparent reaction probabilities” for O3 with BaP on soot of γ ~ 10–5–10–6 were reported. The presence of water inhibited the reaction, which was postulated to be due to competitive adsorption between water and ozone on the surface; this is in contrast to the report of Chughtai et al. [95] in which the rate of ozone loss increased with RH. Pöschl et al. [359] report Langmuir adsorption equilibrium constants for O3 and H2O, and a second order surface reaction rate constant for the O3-BaP reaction of (2.6 ± 0.8) × 10–17 cm–2 s–1. Three possible paths have been proposed: (1) chemisorption of O3; (2) catalytic decomposition of O3: 2O3 → 3O2; (3) surface oxidation and formation of gas-phase carbon oxides. The studies of Fendel et al. [133] suggest
5-51
that lower particle growth in size below 40 ppb O3 is due to less than a monolayer of O3. Studies of Smith et al. [422] and Smith and Chughtai [419] suggest that catalytic decomposition occurs to some extent over the entire reaction sequence. CO2 and H2O are the major gas phase and surface oxidized functional groups on the surface such as carboxylic acids are observed [95-97, 121, 133, 262, 319, 419-421, 427]. Back to Table
5. HNO3 + soot. Studies of the uptake of HNO3 on soot have been carried out over a range of nitric acid pressures [83, 105, 120, 277, 309, 382, 385, 392, 393]. Measured values of γ at room temperature are typically in the range 10–1–10–5, with smaller uptake coefficients measured at longer reaction times. Saatthoff et al. [392] report an upper limit of 3 × 10⁻⁷ as a time-averaged value over two days. At lower concentrations characteristic of the atmosphere, uptake appears to be primarily due to physisorption while at higher concentrations, > 2 × 10¹² molecule cm–3, a surface reaction occurs. At 220 K, γ ~ 0.1 with irreversible uptake attributed to reaction with surface groups [83]. Reaction of HNO3 at concentrations from (1–9) × 1012 molecule cm–3 with “grey” soot from a rich flame using hexane has been reported [393] to generate HONO as the major gaseous product with initial and steady-state reaction probabilities of γo = 4.6 × 10⁻³ and γss = 5.2 × 10⁻⁴ respectively; reaction with “black” soot from a lean flame gave NO as the major gaseous product, with initial and steady-state reaction probabilities of γo = 2.0 × 10⁻² and γss = 4.6 × 10⁻³ respectively (based on geometric surface area of sample holder). The NO was hypothesized to result from secondary reactions of an initial HONO product. Back to Table
6. N2O5 + soot. Brouwer et al. [65], Longfellow et al. [309] and Saathoff et al. [392] studied the uptake of N2O5 at room temperature on a ground charcoal (carbon black) sample, on propane soot and on spark-generated graphite soot, respectively. Brouwer et al. and Longfellow et al. report uptake coefficients based on the geometric sample surface area, and therefore give upper limits. An upper limit of γ < 0.02 can be derived based on the larger value of 0.016 reported by Longfellow et al. As discussed below, much smaller values are reported by Saathoff et al.: 4 × 10⁻⁵ under dry conditions and 2 × 10⁻⁴ at 50% RH. Three possible reactions may occur: (1) Decomposition of N2O5 on the surface to generate NO2 + NO3; (2) reaction of N2O5 with the soot; (3) hydrolysis of N2O5 with water on the surface to generate HNO3. The studies of Longfellow et al. support the decomposition reaction, with yields of NO2 within experimental error of 100%; the generation of NO3 on the surface followed by its decomposition to NO2, may contribute to the observed production of NO2. The studies of Brouwer et al. suggest that a redox reaction with the soot surface to generate NO occurs in parallel with hydrolysis of N2O5 to generate HNO3. Saathoff et al. propose two independent, parallel reactions: (1) hydrolysis generating HNO3, N2O5 + soot → 2 HNO3 with γ = (4 ± 2) × 10–5 under dry conditions (< 10 ppm H2O) which increases to (2 ± 1) × 10–4 at 50% RH. (2) decomposition to NO and NO2: N2O5 + soot → NO + NO2 + products, with γ = (4 ± 2) × 10–6 under dry conditions. Back to Table
7. NO2 + soot. A fast initial uptake of NO2 is observed on fresh soots [17, 19, 27, 91, 94, 98, 99, 162, 257, 277, 308, 382, 424, 433, 434] with the initial uptake coefficient in studies involving both carbon blacks and organic combustion soots in the range of γinit ≅ 10–1 to 10–4. For longer reaction times on carbon black soots, γaged ~ 10–4
based on studies by Kalberer et al. [258] and Ammann et al. [27, 28]. However, Kleffmann et al. [280] report a lower uptake coefficient of ~ 10–7 on carbon black over the first 5 minutes of reaction and and Saathoff et al. [392] report an upper limit of < 4 × 10⁻⁸ averaged over 5 days under dry conditions (< 10 ppm H2O) on spark-generated graphite. On organic combustion soots, γaged has been reported to be in the range of ~ 10–4–10–6 [17, 28, 30, 308, 393, 424]. All studies were done at room temperature except those of Longfellow et al. [308] which were carried out at 262 K. The surface deactivates on continued exposure to NO2, suggesting a maximum amount of HONO that can be formed per cm2 of soot area or mg of soot; this has been reported to be in the range of 1016 to 1018 HONO per mg of soot [30, 162, 256, 257, 280, 424]. However, reactivation on heating of the surface, exposure to water vapor and/or with time after the exposure is stopped has been observed [162, 308, 424, 433, 434]. A small portion (~10-20%) of the NO2 taken up appears to be chemisorbed to the surface [17, 30, 94, 256, 257, 277, 280, 424, 433, 434]. Infrared studies [17, 277, 421] show that surface C–ONO, C–N–NO2, and C–NO2 groups are formed. The remainder of NO2 reacted appears as gaseous HONO and NO; Salgado and Rossi [393] report HONO as the major product for hexane soot from a flame at near stoichiometric ratio but NO as the major product for soot from an extremely lean flame. In addition, N2O, CO, and CO2 have been observed as products at higher temperatures [41, 42]. At lower NO2 concentrations, the HONO yield can approach 100%; production of NO may be due to the bimolecular reaction of HONO on the surface at higher concentrations to give NO + NO2 + H2O. The HONO yield at 262 K appears to be smaller than at room temperature [308]. Formation of HONO is due to reaction with a reduced surface site and not to NO2 surface-catalyzed hydrolysis. The formation of HONO from the

5-52
reaction of NO2 with unspecified semi-volatile organics in diesel exhaust has been reported [180] and proposed to be a much larger source of HONO than the reaction with the soot itself. Back to Table
8. NO3 + soot. Saathoff et al. [392] report an upper limit of γ < 3 × 10⁻⁴ on dry soot (< 10 ppm H2O) and < 10–3 at 50% RH based on measurements of NO3 and N2O5. Back to Table
9. HO2 + soot. Saathoff et al. [392] report an upper limit of γ < 10–2 on dry soot (<10 ppm H2O) based on the decay of HO2NO2 (in equilibrium with HO2 and NO2) in the presence and absence of soot. Back to Table
10. HO2NO2 + soot. Saathoff et al. [392] report an upper limit of γ < 10–5 on dry soot (<10 ppm H2O) based on the decay of HO2NO2 in the presence and absence of soot. Back to Table
11. H2O + soot. Alcala–Jornod et al. [19] report an upper limit to the initial uptake coefficient of γ < 2 × 10⁻³, consistent with the earlier measurements of Rogaski et al. [382]. The uptake is most likely a reversible physisorption [19, 358] although based on water uptake isotherms, Chughtai et al. [91, 93, 97, 100] propose that at low relative humidities (< 25%) chemisorption occurs. While prior exposure of Degussa FW-2 to NO2 and SO2 was not found to increase the uptake coefficient for water, treatment with HNO3 increased the measured uptake coefficient by a factor of 28 and with H2SO4 by a factor of 68 [382]. Water adsorption isotherms on soot have been measured in a number of studies, e.g. [91, 93, 95, 97, 100] and the amount of water taken up found to increase with the air/fuel ratio used to generate the soot, with the sulfur content, with aging and oxidation of the surface (e.g. by O3) and with the presence of metals [91, 93, 95, 97, 100, 471]. Back to Table

5-53
5.17 Henry’s Law Constants for Pure Water
Table 5-4. Henry’s Law Constants for Pure Water
Substance TemperatureRange, K H (298 K)a A B C Uncertainty
Rangeb
100 x hG,o
M–1
1000 x hT, M–1K–1
Note
O2 273–348 1.27×10⁻³ –161.6 8160 22.39 I ≡ 0 –0.334 1 O3 273–333 1.03×10⁻² –14.08 2830 II 0.396 1.79 2 H 273–298 2.6×10⁻⁴ IV 3 OH 298 39 III 4 HO2 298 690 IV 5 H2O2 278–303 7.73×10⁴ –13.27 7310 III 6 N2 273–348 6.52×10⁻⁴ –177.1 8640 24.71 I –0.10 –0.605 7 NH3 273–348 60.2 –9.84 4160 III –4.81 8 NH2Cl 293-313 87 -15.51 5960 IV 9 NHCl2 293-313 29 -10.68 4180 IV 9 NCl3 293-313 0.10 -16.17 4130 IV 9 NO 273–358 1.92×10⁻³ –157.1 7950 21.298 II 0.60 10 NO2 298 1.4×10⁻² III 11 NO3 298 3.8×10⁻² IV 12 N2O 273–313 2.42×10⁻² –148.1 8610 20.266 I –0.85 –0.479 13 CO 278–323 9.81×10⁻⁴ –178.0 8750 24.875 I 14 CO2 273–353 3.38×10⁻² –145.1 8350 19.960 I –1.72 –0.338 15 CH4 273–328 1.41×10⁻³ –194.7 9750 27.274 I 0.22 –0.524 16 C2H6 273–323 1.88×10⁻³ –240.2 12420 33.744 I 1.20 –0.601 17 C3H8 273–348 1.51×10⁻³ –281.1 14510 39.652 I 2.40 –0.702 18 n–C4H10 273–348 1.24×10⁻³ –269.9 14330 37.734 I 2.97 –0.726 19 CH3CH(CH3)CH3 278–318 9.18×10⁻⁴ –360.6 18020 51.444 II 20 C2H4 288–348 5.96×10⁻³ –154.6 8540 21.202 II 0.37 21 C2H2 273–343 4.14×10⁻² –145.8 7880 20.384 II –1.59 22 CH3F 273-313 6.15×10⁻² -9.478 1990 IV 23 CH3Cl 273-313 0.127 -13.13 3270 III 23 CH3Br 273-313 0.173 -12.16 3100 III 23 CH3I 273-313 0.200 -13.52 3550 III 23 CH2Cl2 273-313 0.366 -14.68 4080 III 23 CHCl3 273-313 0.255 -16.48 4510 II 23 CHCl2Br 273-313 0.409 -18.32 5200 III 23 CHClBr2 273-313 0.868 -18.67 5530 III 23 CHBr3 273-313 1.76 -16.79 5170 III 23 CF2Cl2 273-313 3.09×10⁻³ -17.41 3470 III 23 CFCl3 273-313 1.07×10⁻² -15.74 3340 III 23

5-54
Substance TemperatureRange, K H (298 K)a A B C Uncertainty
Rangeb
100 x hG,o
M–1
1000 x hT, M–1K–1
Note
CCl4 273-313 3.47×10⁻² –17.38 4180 II 23 CH3OH 273–298 220 –12.08 5210 III 24 CH3CH2OH 273–298 200 –16.98 6630 III 25 n–C3H5OH 273–298 130 –20.16 7470 IV 26 iso–C3H5OH 273–298 130 –20.15 7450 IV 26 n–C4H9OH 273–298 127 –19.34 7210 IV 26 iso–C4H9OH 298 102 IV 26 sec–C4H9OH 273–298 110 –19.65 7260 IV 26 tert–C4H9OH 273–298 70 –23.63 8310 IV 26 CH3OOH 277–293 300 –11.99 5280 IV 27 HOCH2OOH 278–293 1.7×10⁶ –18.79 9870 V 28 HCHO 288–318 3.23×10³ –15.73 7100 IV –240 69 29 CH3CHO 273–313 12.9 –17.19 5890 IV –3.0 –5.5 30 C2H5CHO 273–313 10.0 –12.20 4330 V 2.2 –4.0 31 C3H7CHO 283–318 9.6 –18.59 6220 V 8.7 –0.06 32 CH3COCH3 273–311 28.1 –13.62 5050 IV –5.2 –2.9 33 C2H5COCH3 273–298 18 –16.40 5740 IV 1.1 –0.9 34 CH3C(O)O2 274 <0.1 V 35 HC(O)OH 275–308 8.9×10³ –11.40 6100 IV 36 CH3C(O)OH 275–308 4.1×10³ –12.50 6200 IV 37 CH3C(O)C(O)OH 278-308 3.11×10⁵ -4.417 5090 V 9.0 38 CH3CN 273–303 52.8 –9.35 3970 III –0.049 39 CH3NO2 293–323 34.6 –9.92 4010 IV 40 C2H5NO2 293–323 21.7 –11.80 4430 IV 40 C3H7NO2 293–323 13.1 –13.22 4710 IV 40 CH3CH(NO2)CH3 293–323 8.42 –13.02 4520 IV 40 CH3ONO2 273–298 2.0 –15.20 4740 IV 41 C2H5ONO2 273–298 1.59 –17.50 5360 IV 41 1–C3H7ONO2 273–298 1.10 –18.31 5490 IV 41 2–C3H7ONO2 273–298 0.791 –18.20 5360 IV 41 1–C4H9ONO2 273–298 1.01 –19.40 5790 IV 41 2–C4H9ONO2 273–298 0.648 –18.59 5410 IV 41 CH3C(O)O2NO2 274–297 2.8 –18.15 5730 IV –6.5 42 O2NOC2H4ONO2 293 640 IV 43 HOC2H4ONO2 293 3.99×10⁴ IV 43 HOCH2CH(ONO2)CH3 293 7.3×10³ IV 43 CH3CH(OH)CH2ONO2 293 6.7×10³ IV 43 CH3CH(ONO2)CH2ONO2 293 175 IV 43 CH3C(O)CH2ONO2 293 1.01×10³ IV 43

5-55
Substance TemperatureRange, K H (298 K)a A B C Uncertainty
Rangeb
100 x hG,o
M–1
1000 x hT, M–1K–1
Note
Cl 298 2.3 IV 44 Cl2 283–383 9.29×10⁻² –134.4 7590 18.702 II 45 ClO 298 0.71 VI 46 Cl2O 273–293 17 –3.23 1810 IV 47 ClO2 383–333 1.01 –11.65 3470 II 48 HOCl 660 –13.2 5880 IV 49 Br2 273–308 0.725 –15.05 4390 II 50 BrCl 279–299 0.98 –18.9 5630 III 51 HOBr 298 >1.3×10² V 52
SO2 278–383
1.36 –39.72
4250
4.525 II –6.07 0.275 53
H2S 273–323 0.102 –145.2 8120 20.296 III –3.33 54 CS2 274–305 0.062 –17.05 4250 IV 5.49 –4.65 55 COS 273–288 2.02×10⁻² –15.68 3510 IV 56 CH3SH 298–368 0.39 –12.42 3420 V 0.3 57 C2H5SH 298–368 0.28 –13.82 3740 V 58 CH3SCH3 272–305 0.54 –12.19 3460 V –3.1 –0.26 59 CH3S(O)CH3 298 9.9×10⁴ V 60 a. ln H = A + B/T +C ln(T) [M atm–1] b. Uncertainty Classes: I—Better than 10% II—10% to 50% III—50% to 100% IV—Factor of 2 to factor of 10 V—Factor of 10 to factor of 100 VI—Greater than a factor of 100
5-56
5.18 Notes to Table 5-4 Many of the data sets required various transformations to convert them to the units (mol L–1 atm–1) and
form (solubility instead of volatility) used in this Table. The transformations often involve either the mass or molar density of water, which in all cases was taken from [292].
1. O2. The recommendation was taken from the studies of Benson [57] and Rettich [368]. The data show clear curvature in a plot of ln H v. 1/T. A two parameter fit gives A = –13.26 and B = 1950 K for the temperature range 273–285 K. The salt effect parameter hG,o is by definition, as zero (see text). The temperature dependent salt effect parameter is from the optimization of Weisenberger and Schumpe [472]. Back to Table
2. O3. The recommendation of Rischbieter [371] was accepted and refitted. Salt effect parameters were obtained from the effect of NaCl, KCl, Na2SO4, and Ca(NO3)2 on H, combined with specific ion parameters. Back to Table
3. H. An average of estimates of the solubility of H based on two approaches: One is simply the assumption that the solubility of H is the same as the solubility of H2. [353, 354]. The second assumes that the solubility of H is what would be expected for a rare gas atom of the same radius [379]. The average value from 273 K to 298 K is 2.6 × 10⁻⁴, with very small variation with temperature. Above room temperature the solubility increases. Back to Table
4. OH. Calculated from the reduction potential of the OH radial, Eo(OH/OH–) = (1.90±0.02)V, derived from an equilibrium with Tl+ [405]. Back to Table
5. HO2. The recommendation was from a calculation by Schwartz [402] based on the gas phase constituents HO2, H+, and O2
–. Thermodynamic values were updated to those in our Thermodynamic tables, to pKa=(4.8±0.1), and to a reduction potential E (O2/O2
–) = -(0.35±0.01)V. The reduction potential, referenced to one atmosphere O2, is based primarily on equilibria reported by Meisel and Czapski, [321] corrected for a revised duroquinone potential [467]. Back to Table
6. H2O2. The data of Lind and Kok [304, 305], Hwang and Dasgupta [234], Yoshizumi et al. [486], and O’Sullivan et al. [349] are all in good agreement. The recommendation is from a two-parameter fit to all the results. Back to Table
7. N2. The recommendation of Battino [41] was accepted and refitted to three-parameter equations. A two parameter fit gives A = 12.81 and B = 1625 K for the temperature range 273–293 K. Salt effect parameters taken from the optimization of Weisberger and Schumpe [472]. Back to Table
8. NH3. Based on the recommendation by Edwards et al. [128], refit to a two-parameter equation. Over the temperature range 273–348 K, there appears to be little curvature in the data. The more recent data of Dasgupta and Dong [109] are in quite good agreement with this recommendation, whereas the results of Hales and Drewes [183] are somewhat higher and those of Shi and Davidovits [415] (an uptake study) are significantly lower. The Hales and Drewes paper also included studies of the effect of dissolved CO2 on the solubility of NH3. The solubility of NH3 in solutions containing a wide variety of ions is discussed by Clegg and Brimblecombe [102]. Salt effect parameters taken from the optimization of Weisberger and Schumpe [472]. Back to Table
9. Chloramines. Derived from flashoff studies with glass sparging columns at 20oC and 40oC [224]. The data point for ammonia at 20oC is in exact agreement with the recommended value in this Table. Back to Table
10. NO. Three-parameter refit from the recommendation of Battino [39]. Two-parameter fit gives A = –12.27 and B = 1790 K for the temperature range 273–293 K. Salt effect parameters taken from the optimization of Weisberger and Schumpe [472]. Back to Table
11. NO2. From analysis of studies of reactive dissolution of NO2 by Schwartz and White [404]. Back to Table
12. NO3. From the reduction potential Eo(NO3/NO3–) = (2.46±0.02)V, which is an average based on
determinations of equilibria with Cl– [70, 360]. This value is in good agreement with that calculated from the uptake of NO3 into a wetted-wall flow reactor containing Cl– [389]. It is in very poor agreement with the much higher value derived from a study of the uptake of NO3 by a series of wetted denuders [439]. Back to Table
5-57
13. N2O. Three-parameter refit to the recommendation of Battino [38]. Two parameter fit gives A = 13.40 and B = 2880 K for the temperature range 273–293 K. Salt effect parameters taken from the optimization of Weisberger and Schumpe [472]. Back to Table
14. CO. The recommendation is based on smoothed data from Rettich et al. [367] and refit to three-parameter equation. A two parameter fit gives A = –12.72 and B = 1720 K for the temperature range 273–293 K. Back to Table
15. CO2. Refit to three- parameter equation from the recommendation of Wilhelm et al. [473]. Two parameter fit gives A = 12.49 and B = 2710 K for the temperature range 273–293 K. Salt effect parameters taken from the optimization of Weisberger and Schumpe [472]. Back to Table
16. CH4. The recommendation is a three-parameter fit to the smoothed recommendation of Battino [48]. There is very good agreement with the more recent data of Ben-Naim and Battino [54]. A two parameter fit gives A = –13.45 and B = 2040 K for the temperature range 273–293 K. Salt effect parameters taken from the optimization of Weisberger and Schumpe [472]. Back to Table
17. C2H6. The recommendation is a three-parameter fit to the smoothed recommendation of Battino [40]. There is very good agreement with the more recent data of Ben-Naim and Battino [54]. Two parameter fit gives A = –15.95 and B = 2875 K for the temperature range 273–293 K. Salt effect parameters taken from the optimization of Weisberger and Schumpe [472]. Back to Table
18. C3H8. The recommendation is from a three-parameter fit to the smoothed recommendation of [47]. There is very good agreement with the more recent data of Ben-Naim and Battino [54]. A two parameter fit gives A = 17.52 and B = 3275 K for the temperature range 273–293 K. Salt effect parameters taken from the optimization of Weisberger and Schumpe [472]. Back to Table
19. n-C4H10. The recommendation is from a three-parameter fit to the smoothed recommendation of Battino [46]. There is very good agreement with the more recent data of Ben-Naim and Battino [54]. A two parameter fit gives A = –19.28 and B = 3740 K for the temperature range 273–288 K. Salt effect parameters taken from the optimization of Weisberger and Schumpe [472]. Back to Table
20. CH3CH(CH3)CH3. The recommendation is from a three-parameter fit to the smoothed recommendation of Battino [45]. A two parameter fit gives A = 18.22 and B = 3340 K for the temperature range 278–293 K. Back to Table
21. C2H4. The recommendation is from a three-parameter fit to the smoothed recommendation of Wilhelm [473]. A two parameter fit gives A = –12.40 and B = 2170 K for the temperature range 288–313 K. Salt effect parameters taken from the optimization of Weisberger and Schumpe [472]. Back to Table
22. C2H2. The recommendation is from a three-parameter fit to the smoothed recommendation of Wilhelm [473]. The recommendation of Yaws et al. [484] generates identical results. A two parameter fit gives A = –10.12 and B = 2065 K for the temperature range 273–298 K. Back to Table
23. Halomethanes. A refit to the evaluation of Staudinger and Roberts [426]. Back to Table
24. CH3OH. The recommendation is based on the two data points of Snider and Dawson [423]. The 298 K result of Butler et al. [69] and a calculation based on the NBS Thermodynamic tables, [464], are in very good agreement. The 298 K result of Altschuh et al. [26] is about 40% lower. Back to Table
25. C2H5OH. The recommendation is based on the two data points of Snider and Dawson [423]. The 298 K results of [69] and [383], and a calculation based on the NBS Thermodynamic tables, [464], are in very good agreement. The 298 K result of Altschuh [26] is about 50% lower. Back to Table
26. All of the recommendations for the C3–C4 alcohols are based on two data points each from Snider and Dawson [423]. Room temperature data from other studies ([68, 69], and [26]) typically support these results. Back to Table
27. CH3OOH. The data of Lind and Kok [304, 305] and O’Sullivan et al. [349] are in excellent agreement and were fit to a two-parameter expression. Back to Table
28. HOCH2OOH. The results of O’Sullivan [349] and Staffelback and Kok [425] are very close and were fit to obtain the recommended values. The results of Zhou and Lee [503] are much lower and were not included. Back to Table

5-58
29. HCHO. The recommended value is the apparent Henry’s law constant and includes a contribution due to hydrolysis H* = H(1 + Khyd). Data from Betterton and Hoffmann [59] and Zhou and Mopper [504] are in substantial agreement and were fit to a two-parameter expression. Betterton and Hoffmann have calculated H = 2.5 M atm–1 at 298 K for the physical solubility. Salt effect parameters derived from data on the effect of seawater concentration (0 to 100%) on the measured H [504]. For these calculations, the seawater was assumed to be a solution of pure NaCl, with 35% salinity equal to 0.6 M. Back to Table
30. CH3CHO. The recommended value is the apparent Henry’s law constant and includes a contribution due to hydrolysis H* = H(1 + Khyd). The results of Snider and Dawson [423], Benkelberg et al. [56], and Betterton and Hoffmann [59] are in excellent agreement and have been fit to a two-parameter expression for the recommendation. The results of Zhou and Mopper [504] curve off at higher temperatures and were not included in the fit. (Note the similar situation for acetone.) Betterton and Hoffmann have calculated H = 4.8 M atm–1 at 298 K for the physical solubility. Salt effect parameters derived from data on the effect of seawater concentration (0 to 100%) on the measured H [504]. For these calculations, the seawater was assumed to be a solution of pure NaCl, with 35% salinity equal to 0.6 M. Back to Table
31. C2H5CHO. Results of Zhou and Mopper [504] and Snider and Dawson [423] agree only to within about a factor of two. The two points from the former were weighted by 3 and combined with the five points of the latter to generate the recommendation. Salt effect parameters derived from data on the effect of seawater concentration (0 to 100%) on the measured H [504]. For these calculations, the seawater was assumed to be a solution of pure NaCl, with 35% salinity equal to 0.6 M. Back to Table
32. C3H7CHO. The only results are from Zhou and Mopper [504], which have been fit to a two-parameter expression. Salt effect parameters derived from data on the effect of seawater concentration (0 to 100%) on the measured H [504]. For these calculations, the seawater was assumed to be a solution of pure NaCl, with 35% salinity equal to 0.6 M. Back to Table
33. CH3COCH3. The recommendation is from a fit to the data of Snider and Dawson [423] and Benkelberg et al. [56]. Room temperature data points of Hoff et al. [219], Burnett [68] and Vitenberg et al. [458] are in very good agreement. Results of Zhou and Mopper [504] are somewhat higher, particularly at room temperature and above. The situation is similar for acetaldehyde. Salt effect parameters derived from data on the effect of seawater concentration (0 to 100%) on the measured H [504]. For these calculations, the seawater was assumed to be a solution of pure NaCl, with 35% salinity equal to 0.6 M. The KS values from this work are somewhat different than those obtained by Benkelberg et al. [56], 0.089 vs 0.17 at 298 K and 0.17 vs 0.085 at 273 K. The magnitude of this difference is not too great, but the two studies predict a different sign for hT. Back to Table
34. C2H5COCH3. The recommendation is from the two points of Snider and Dawson [423]. The room temperature points of Vitenberg et al. [458] and Rohrschneider [383] are in good agreement. The higher temperature data of Zhou and Mopper [504] are somewhat higher and those of Friant and Suffet [153] are lower than the recommendation. Salt effect parameters derived from data on the effect of seawater concentration (0 to 100%) on the measured H [504]. For these calculations, the seawater was assumed to be a solution of pure NaCl, with 35% salinity equal to 0.6 M. Back to Table
35. CH3C(O)O2. Villalta et al. [457] measured an upper limit for H of 0.1 M atm-1 in coated-wall flow tube uptake experiments on aqueous sodium ascorbate solutions. Back to Table
36. HC(O)OH. The results of Johnson et al. [252] are accepted. The 298 K result of Khan et al. [276] are about 75% lower. Back to Table
37. CH3C(O)OH. The results of Johnson et al. [252] are accepted. A value calculated from the NBS Thermodynamic tables [464] is about a factor of two higher. Back to Table
38. CH3C(O)C(O)OH. Taken from Khan et al. [276] Salt effect derived from effect of NaCl (ks = 0.236 M–1) and KCl (ks = 0.235 M–1) on partial pressure over 1.5 M solution of pyruvic acid at various salt concentrations. Much different values derived when other salts were used, suggesting complications due to specific interactions and, possibly, to the weakly buffered nature of the solution. Back to Table
39. CH3CN. The values reported by Benkelberg [56], Snider and Dawson [423], Hamm et al. [185] are all in good agreement and have been fit to a two-parameter expression for the recommendation. The Hamm et al. paper includes a measurement with artificial seawater at 293 K. Salt effect derived from the effect of 0.6 mol L–1 NaCl on solubility at 293 K [56]. Back to Table

5-59
40. Nitroalkanes (CH3NO2, C2H5NO2, C3H7NO2, and CH3CH(NO2)CH3). The recommended values are all taken from the work of Benes and Dohnal [55]. For nitromethane, the 298 K value from Rohrschneider [383] is about 30% higher. Back to Table
41. Alkyl nitrates (CH3ONO2, C2H5ONO2, 1-C3H7ONO2, 2-C3H7ONO2, 1-C4H9ONO2, 2-C4H9ONO2). The recommended values are all taken from the work of Kames and Schurath [260]. The results of Luke et al. [312] are in very good agreement for 1-butyl and 2- butyl nitrates, but the values reported by Hauff [213] for 1- and 2-propyl and butyl nitrates by head-space chromatography are significantly (∼50%) lower. Back to Table
42. CH3C(O)O2NO2. The results of Kames and Schurath [260] and Frenzel et al. [151] are close, but somewhat higher (~60%) than the single temperature point of Holdren et al. [223]. The recommendation is a fit to the data of Kames and Schurath, and Frenzel et al. Frenzel et al., Kames and Schurath, and Holdren et al. also measured hydrolysis rate constants. Ks = 0.0807 M-1 for NaCl at 293.2 K based on solubility in artificial sea water (~0.7 M) [260]. Back to Table
43. Bifunctional alkyl nitrates. The recommended values (at 293 K) are taken from the work of Kames and Schurath [259]. Back to Table
44. Cl. Eo(Cl/Cl–) = (2.43±0.03)V from an analysis of the reaction of OH with Cl–, yielding the equilibrium constant for OH + Cl– + H+ ↔ H2O + Cl (Keq = 1.1 × 10⁵ M–2, corrected to a standard state of water at unit activity), [487] and the reduction potential Eo(OH–,H+/H2O) = (2.73±0.02)V [405]. Back to Table
45. Cl2. Three-parameter refit to the recommendation of Battino [43]. Two parameter fit gives A = 9.38 and B = 2090 K for the temperature range 283–313 K. Back to Table
46. ClO. From the reduction potential E(ClO/ClO–) = (1.41±0.02)V, which is based on an equilibrium with carbonate at high pH and ionic strength [230]. Due to the high ionic strength, 3 M, it was not possible to correct this value and obtain a reduction potential for the standard state. Thus, the derived Henry’s Law constant must be considered uncertain. Back to Table
47. Cl2O. Fit to recommendation of Wilhelm et al. [473]. Data appear somewhat uncertain. Back to Table
48. ClO2. Two-parameter fit to the recommendation of Battino [42]. Back to Table
49. HOCl. Huthwelker et al. [233] analyzed the limited data for pure water from Blatchley et al. [60] and Holzwarth et al. [224] along with the more extensive data for uptake by sulfuric acid from Hanson and Ravishankara [206], along with thermodynamic information, and obtained a consistent expression for the solubility of HOCl. Back to Table
50. Br2. The results of Kelley and Tartar [270] and Jenkins and King [251] agree well below about 313 K, and with the 298 K point of Hill et al. [217]. Recommendation based on a two-parameter fit to all data at and below 308 K. Back to Table
51. BrCl. The recommendation is from the study of Barlett and Margerum [36]. Back to Table
52 HOBr. The Henry’s law constant was estimated to be more than twice that of HOCl based on a study of the effective Henry’s law constant for free bromine from a stripping column [60]. Back to Table
53. SO2. The recommendation of Battino [44] was accepted and refit to a three-parameter equation. The earlier recommendation of Edwards et al. [128] is slightly lower. A two parameter fit gives A = –9.53 and B = 2930 K for the temperature range 278–298 K. New value of hSO2,0 from absorption equilibria studies in aqueous HCl and NaCl solutions [378]. Temperature dependence from the optimization of Weisberger and Schumpe [472]. Back to Table
54. H2S. In the recommendation of Fogg [149], two expressions were given, representing the results above and below 283 K. The predicted values from these expressions were calculated, with the points at 283 K averaged, converted to the desired units, and then fit with the two- and three-parameter expressions. These are the recommended values. More recent results of Rinker and Sandall [370] and Munder et al. [345] are slightly lower; in these studies, the physical solubility of H2S was determined through measurements involving aqueous solutions of glycols or amines, neutralized with HCl. The reported values of De Bruyn et al. [117] are significantly (~30%) lower. The earlier recommendation of Edwards et al. [128] is very close to the recommendation of Fogg [149] as is the recommendation of Yaws et al. [484]. The room temperature point calculated from the NBS Thermodynamic tables Wagman et al. [464] is also slightly lower. The work

5-60
of De Bruyn et al. [117] covered also a wide range of NaCl and (NH4)2SO4 concentration and of pH. Salt effect parameters taken from the optimization of Weisberger and Schumpe [472]. Back to Table
55. CS2. The recommendation is from a fit to data of Elliott [130], who also present data in 0.5 mol L–1 NaCl. The results of De Bruyn et al. [117] are significantly (50%) lower. The work of DeBruyn et al. covered also a wide range of NaCl and (NH4)2SO4 concentration and of pH. Salt effect parameters derived from the ratio of the solubility of CS2 in water and 0.5 M NaCl [130]. At 278 K, ks = 0.184 M–1, compared to 0.150 M–1 from the results of de Bruyn, et al. [117]. Note also De Bruyn et al. obtained Ks = 0.410 M–1 for (NH4)2SO4, whereas these parameters would predict 0.261 M–1. Back to Table
56. COS. The reviews by Wilhelm et al. [473] and Yaws et al. [484] result in identical results over the low temperature range (<303 K) and are combined to generate the recommendation. The results of De Bruyn et al. [117] are somewhat (~25%) lower at the lower temperature range. The work of De Bruyn et al. covered also a wide range of NaCl and (NH4)2SO4 concentration and of pH. Back to Table
57. CH3SH. The recommendation is based on the data of Przyjazny et al. [361]. Results of De Bruyn et al. [117] are about half the recommended value at 298 K. Similar low values were observed for other compounds in the work of De Bruyn et al. The work of De Bruyn et al. covered a wide range of pH and NaCl and (NH4)2SO4 concentrations. At 298 K, De Bruyn et al. [117] obtained Ks = 0.314 M-1 for (NH4)2SO4 and Ks = 0.143 M-1 for NaCl. From the latter, we calculate hG = 0.003 M-1; the values for (NH4)2SO4 from this work have tended to be high. Back to Table
58. C2H5SH. The recommendation is based on the data of Przyjazny et al. [361]. The results of Vitenberg [458] are slightly lower than the extrapolated value at 293 K. Back to Table
59. CH3SCH3. The recommendation is based on the values of Dacey et al. [106]. The single temperature point of Wong and Wang [480] and the higher temperature results of Przyjazny et al. [361] are in good agreement. The results of De Bruyn et al. [117] are about 30% lower. The studies of Dacey et al. [106] and Wong and Wang [480] were also carried out with seawater. The work of De Bruyn et al. [117] covered also a wide range of NaCl and (NH4)2SO4 concentration and of pH. Salt effect parameters based on the values of Dacey et al. [106] for Sargasso sea water from 0 to 29 C. The values for KH obtained by Wong and Wang [480] for sea water from 18 to 44 C are in good agreement. Dacey et al. also measured KH at 18 C for NaCl solutions up to 32%. For the 10 – 32% data, a value of Ks = 0.117 M–1 can be derived, in good agreement with the predicted value of 0.113 M–1. The 278 K value of Ks = 0.180 M–1 obtained by De Bruyn et al. [117] is somewhat larger. Note also the de Bruyn, et al. obtained Ks = 0.332 M–1 for (NH4)2SO4, whereas the recommended parameters would predict 0.223. Back to Table
60. CH3S(O)CH3. The recommendation is from Watts and Brimblecombe [470], cited by Allen et al. [25]. Back to Table

5-61
5.19 Ion-Specific Schumpe Parameters
Table 5-5. Ion-Specific Schumpe Parameters
Cation hci Anion ha
i
H+ 0 OH– 0.0839 Li+ 0.0754 HS– 0.0851 Na+ 0.1143 F– 0.092 K+ 0.0922 Cl– 0.0318 Rb+ 0.0839 Br– 0.0269 Cs+ 0.0759 I– 0.0039
NH4+ 0.0556 NO2
– 0.0795 Mg2+ 0.1694 NO3
– 0.0128 Ca2+ 0.1762 ClO3
– 0.1348 Sr2+ 0.1881 BrO3
– 0.1116 Ba2+ 0.2168 IO3
– 0.0913 Mn2+ 0.1463 ClO4
– 0.0492 Fe2+ 0.1523 IO4
– 0.1464 Co2+ 0.168 CN– 0.0679 Ni2+ 0.1654 SCN– 0.0627 Cu2+ 0.1675 HCrO4
– 0.0401 Zn2+ 0.1537 HCO3
– 0.0549 Cd2+ 0.1869 CO3
2– 0.1423 Al3+ 0.2174 HPO4
2– 0.1499 Cr3+ 0.0648 SO3
2– 0.127 Fe3+ 0.1161 SO4
2– 0.1117 La3+ 0.2297 S2O3
2– 0.1149 Ce3+ 0.2406 PO4
3– 0.2119 Th4+ 0.2709 Fe(CN)6
4– 0.3574 The values in this table can be used to estimate the solubility of a gas in various mixed electrolyte solutions, even if these data have not been obtained experimentally for all of the ions. For example, the solubility of ozone in a solution of 0.8 M HCl and 1.2 M Na2SO4 at 273 K would be estimated as follows: First, Ho = 0.024 M atm–1 at 273 K, from the Henry’s Law Table; from the same Table, the gas-specific parameters for ozone are hG,o = 0.00396 M–1 and hT = 1.79 × 10⁻³ M–1 K–1, thus:
kG = 0.00396 + 1.79E-3(273 – 298) = -0.0408 M–1
The specific ion parameters from Table 5-4 are corrected by this value to calculate the change in the logarithm of the Henry’s law constant log (Ho/H273) = 2 × 1.2 M × (0.1143 – 0.0408) M–1 + 1.2 M × 0.1117 – 0.0408) M–1 + 0.8 M × (0 – 0.0408) M–1 + 0.8 M × (0.0318 – 0.0408) M–1 = 0.181 Thus, (Ho/H273) = 1.517 H = 0.024 M atm–1/1.517 = 0.016 M atm–1 for O3 in this salt solution at 273 K.

5-62
5.20 Henry’s Law Constants for Acids
Table 5-6. Henry’s Law Constants for Acids
T(K) Wt.% H2SO4 H or H* (M/atm) Notes O3 in H2SO4 • nH2O(l) 293 1–70 Ln(Ho/H) = (4.08 ± 0.2) × 10–3 × wt
Ho = 0.012 M atm–1 wt is the H2SO4 wt.%
1
NO2 in H2SO4• nH2O(l) 203–343 39–68 See Note 2 HONO in H2SO4 • nH2O(l) 248–298 >60 ln H*= a1 + a2 wt + a3 wt2 + (b1 + b2 wt)/T
a1 = 26.1 ± 9.4, a2 = –1.095 ± 0.21, a3 = 0.00732 ± 0.00121 b1 = –5792 ± 1610, b2 = 181.3 ± 24
3
HNO3 in H2SO4 • nH2O(l) ∼195–300 0–80 See Note 4 HNO3 and HCl in H2SO4 • nHNO3 • mH2O(l)
∼195–300 0–80 See Note 4
HO2NO2 in H2SO4 • nH2O(l) 201–230 50–75 ln H = 3.69–mH2SO4 × (–0.25 + 65/T) – 8400 × (1/To–1/T) mH2SO4 is the molality of the H2SO4 solution, To = 298.15 K
5
CH2O in H2SO4 • mHNO3 • nH2O(l)
240–300 10–85 also 8–40
wt.% HNO3
See Note 6
CH3OH in H2SO4 • nH2O(l) 197–223 See Note 7 CH3C(O)CH3 in H2SO4 • nH2O(l) 198–298 10–80 ln H* = a1+a2 wt+a3 wt2 + (b1+b2 wt+b3 wt2)/T
wt is the H2SO4 wt.%, a1 = –21.438 ± 4.31, a2 = –0.32163 ± 0.207, a3 = 0.0072935 ± 0.00235 b1 = 7292 ± 1220, b2 = 33.524 ± 53.42, b3 = –0.975 ± 0.571
8
CH3C(O)O2NO2 in H2O(l), H2SO4• nH2O(l)
199–295 0–75 ln H* = 1.07–mH2SO4× (0.69 – 152/T) – 5810 × (1/To–1/T), mH2SO4 = molality of the H2SO4 solution To = 298.15 K
9
CF2O in H2SO4 • nH2O(l) 215–230 60 < 5 10 CF3OH in H2SO4 • nH2O(l) 250 40
50 > 240 210
11
HOCl in H2SO4 • nH2O(l) 200–300 46–80 HHOCl = 1.91×10⁻⁶ × exp(5862.4/T) × exp(–SHOCl MH2SO4) M atm–1
where: SHOCl = 0.0776+59.18/T M–1, MH2SO4 = H2SO4 molar conc 12
ClONO2 in H2SO4 • nH2O(l) 200–265 40–75 HClONO2 = 1.6 ×10⁻⁶ × exp(4710/T) × exp(–SHOClM H2SO4) M atm–1
where: SClONO2 = 0.306 + 24.0/T M–1, MH2SO4 = H2SO4 molar conc. 13
HBr in H2SO4 • nH2O • H2O(l) and H2SO4 • nHNO3 • mH2O(l)
200–240 40–72 ln H* = a1 + (b1+b2 wt)/T a1 = –11.695 ± 0.537, b1= 11,101 ± 163, b2 = –90.7 ± 1.2
14
SO2 in H2O (l), H2SO4 • nH2O(l) 193–242 0–97 ln H* = a1+a2 wt+a3 wt2 + (b1+b2 wt+b3 wt2)/T, where: wt is the H2SO4 wt.%, a1 = –10.778 ± 2.07, a2 = –0.11541 ± 0.0827, a3 = 0.0012506 ± 0.000811 b1 = 3310 ± 578, b2 = 30.581 ± 22.2, b3 = –0.35469 ± 0.209
15

5-63
5.21 Notes to Table 5-6 1. O3 in H2SO4 • nH2O(l). Bubble train uptake measurements where performed by Rattigan et al. [364] at 293 K
for 1–70 wt.% H2SO4. Recommended expression is a Sechenov coefficient formulation where Ho = 0.012 M atm–1 is the 293 K value of H for pure water fom Wilhelm et al. [473]. In the measurement, account was taken of the loss of O3 due to reaction with H+. Back to Table
2. NO2 in H2SO4 • nH2O(l). Langenberg et al. [290] present novel capillary gas chromatography measurements for 39, 59, and 68 wt.% H2SO4 over the temperature range of 203 to 243 K. However, NO2 solubility must be derived from chromatographic waveforms which are contorted by much higher N2O4 solubility. The resulting values for HNO2 are in the 1 to 102 range, but show inconsistent trends with temperature and concentration, indicating possibly large systematic error. Back to Table
3. HONO in H2SO4• nH2O(l). Becker et al. [49] measured HONO partial pressue, PHONO, over bulk solutions in a temperature range of 248–298 K and a H2SO4 concentration range of 0–67 wt.%. Longfellow et al. [307] measured PHONO in a wetted wall flow reactor over a temperature range of 218–295 K and an acid concentration range of 60–83 wt.%. Agreement between these two data sets is excellent. H* decreases from 0 wt.% to 53 wt.% due to physical solubility, then increases above 53 wt.% due to protonation and/or association with H2SO4 to make nitrosyl sulfuric acid. Becker et al. parameterize their data as a function of sulfuric acid wt.% and temperature. However, the Becker et al. parameterization is not able to fit the combined sets of Becker et al. [49] and Longfellow et al. [307] data, particularly at the lower temperatures and higher wt.% most relevant to the stratosphere. Therefore, the recommended functional form was used to fit the data for >60 wt.%. This function fits both sets of data very well. It is important to note that this function is only valid for H2SO4 concentrations near 60 wt.% and above. The parameterization in Becker et al. [49] should be used to calculate H for H2SO4 concentrations <60 wt.%. (Note that the units for H are mol/kg-bar in Becker et al. [49]. The density parameterization of Myhre et al. [347] was used to convert to M/atm units.) Back to Table
4. HNO3 and HCl in H2SO4 • nH2O(l) and H2SO4 • nHNO3 • mH2O(l). Effective Henry’s law coefficients, H*, for HNO3, and HCl in binary H2SO4/H2O and ternary H2SO4/HNO3/H2O solutions over the temperature range 195 to 300 K are required to model the composition and heterogeneous chemistry of stratospheric and upper tropospheric aerosols. Solubility data can be obtained from analysis of heterogeneous uptake experiments with the liquid phase diffusion coefficient estimated from acid solution viscosity (Williams and Long [476]). Solubilities can also be obtained from equilibrium or from vapor pressure data.
Experimental solubility data for HNO3 is provided by Van Doren et al. [456], Reihs et al. [365] and Zhang et al. [502]. Data for HCl solubility is provided by Watson et al. [469], Hanson and Ravishankara [202, 206], Zhang et al. [502], Williams and Golden [474], Abbatt [2], Elrod et al.[131] and Robinson et al. [377].
These studies all show that trace species solubility in H2SO4/H2O and H2SO4/HNO3/H2O solutions is a strong function of water activity, which, in turn, depends on both temperature and acid concentrations. Prediction of HNO3 and HCl H* values for atmospheric compositions requires a sophisticated model. Comprehensive thermodynamic models of acid solutions for a range of atmospheric conditions have been published by Carslaw et al. [77], Tabazadeh et al. [432] and Luo et al. [313] and reviewed by Carslaw and Peter [79]. These models do an excellent job of reproducing the available experimental data, even for ternary H2SO4/HNO3/H2O solutions (Elrod et al. [131]). These models and the Carslaw review should be consulted for plots/predictions of H* for HNO3 and HCl in strong acid solutions over the atmospheric temperature range. The most widely used model of Carslaw et al. [77] was revised in Massucci et al. [318]. Back to Table
5. HO2NO2 in H2SO4 • nH2O(l). Zhang et al. [501] performed wetted wall flow reactor studies using CIMS to detect HO2NO2 uptake over a temperature range of 201–230 K and an acid concentration range of 52.9–74 wt.% H2SO4. HDl
1/2 values where determined for 52.9, 58.3/59.1, 66.4 and 73.8/74 wt.%, with 5 to 15 data points per temperature or temperature pair. All uptake appeared to be reversible with the variation in H strongly temperature dependent, but only moderately dependent on H2SO4 wt.%. Dl values were calculated from a cubic cell model to derive H. Uncertainties in measured H values were estimated by authors to be 25% for H <1 × 10⁶ M atm–1 and 50% for H >1 × 10⁶ M atm–1. These data were parameterized by Leu and Zhang [298] in the Sechenov coefficient form adopted by Huthwelker for HOCl [233], and their formulation is recommended. Back to Table

5-64
6. CH2O in H2SO4 • mHNO3 • nH2O(l). The recommended Henry’s Law relationship is:
( )+22 H O 3 H
H H 1+K a K a∗ = +
where: H = 3.4 × 10⁻⁵ exp –[(–0.0456 + 55.5/T) (0.46 mH2SO4 + 0.13 mHNO3)] M atm–1, T is the temperature in K, and mH2SO4 and mHNO3 are the respective acid molalities; K2 = exp (4020/T–5.83) M–1, K3 = 0.56 exp [8.84–(T–260/T)] M–1, and aH2O and aH+ are the water and H + activities which are obtained from a thermodynamic model of the solution, e.g. Carslaw et al. [77]. Valid for 10–85 wt.% H2SO4, 8–40 wt.% HNO3, T = 240–300 K.
Knudsen cell studies by Tolbert et al. [441] and Iraci and Tolbert [241] and droplet train/flow reactor studies by Jayne et al. [249] all yield data showing that CH2O is strongly absorbed by sulfuric acid solutions, and Jayne et al. also provide data for ternary acid solutions. The Jayne et al. [249] studies included H2SO4 concentrations from 10 to 85 wt.% and HNO3 concentration between 8 and 40 wt.% with temperature variations from 241 to 300 K. These data were parameterized with three terms, representing physical CH2O solubility, reversible hydrolysis to CH2(OH)2, important in more dilute solutions, and reversible formation of CH3 O+, dominant at high acidities. The Jayne et al. [249] parameterization is recommended above. The H* data from Iraci and Tolbert [241] cover 49 to 95 wt.% H2SO4 and a temperature range of 197 to 214.5 K and are in fair agreement with extrapolation of H* expression from Jayne et al. [249] for concentrations below ~75 wt.%. However, the Iraci and Tolbert data are taken on such thin acid films that initial uptake slopes are difficult to determine accurately and the data scatter is large. While the Iraci and Tolbert data do indicate significantly larger H* values for H2SO4 concentrations above 75 wt.%, the data do not compel a reformulation of the Jayne et al. parameterization. Back to Table
7. CH3OH in H2SO4 • nH2O(l). H* data from Kane and Leu [263], taken over 40–85 wt.% H2SO4 and from 210–235 K, indicate soluble uptake below 65 wt.% and predominately reactive uptake to form methanesulfonic acid and dimethysulfate above 65 wt.%. Uptake decreased slightly with temperature below 65 wt.% and increases slightly with temperature above. Data yield H*k1/2 at high acid concentrations. Weakly temperature dependent γs of ~0.15 were measured for 65, 75, and 80 wt.%. However, Knudsen cell studies by Iraci et al. [239] at 45, 61 and 72 wt.% over a 197–223 K temperature range show only well behaved reversible uptake. They argue that low vapor pressures explain the lack of CH3OH recovery for the short observation times used by Kane and Leu. They also cite three older literature studies on the reaction of methanol and ethanol at room temperature in sulfuric acid which report reaction rate constants much lower than those deduced by Kane and Leu [239]. Iraci et al. present the following parameterization of their data plus data for water:
log H* = A + 1000B/T
where A = 7.00 + log MH2O, B = 0.000619 m2 + 0.00544 m + 2.267, MH2O is the molarity of water in the solution (mol L–1) and m is the molality of the H2SO4 (moles H2SO4 per kg H2O).
Note that this parameterization is based only on the Iraci et al. data. A reanalysis of the Kane and Leu [263] results to provide additional data in the 40–72 wt.% range, and H* values for higher wt.% should be undertaken to validate and extend the Iraci et al. data. Back to Table
8. CH3C(O)CH3 in H2SO4 • nH2O(l). Duncan et al. [126, 127] used IR spectra of thin sulfuric acid films to establish that acetone is absorbed as the protonated species. Above 70 wt.% protonated acetone undergoes a self-condensation/dehydration reaction to form protonated mesityl oxide, which, in turn, reacts with an additional protonated acetone to form trimethyl benzene. Duncan et al. [127] measured reversible uptake and derived Henry’s law constants for 70 wt.% H2SO4 at 180, 187 and 195 K and a value at 201 K for 76 wt.%. Kane et al. [264] measured uptake in a wetted wall flow reactor and derived H* parameters for 40, 50, 65, and 75 wt.% over a much wider temperature range than Duncan et al. [127]. Their data diverge above 80 wt.% which they attribute to reactive uptake as suggested by Duncan et al. [126, 127]. Klassen et al. [278] provide Knudsen cell uptake derived data for 48.7 to 78.3 H2SO4 wt.% between 210 and 240 K that are generally consistent with that of Kane et al. [264]. Imamura and Akiyoshi [237] report wetted wall flow reactor H* measurements at 230 K for 50 and 60 wt.%, 250 K for 60, 69 and 76 wt.%, and 270 K for 76 and 79 wt.%; their data diverges a factor of 2 to 4 from that of Kane et al. [264] and Klassen et al. [278].
Equally weighted data sets from Kane et al. [264] and Klassen et al. [278] were combined and fit to generate the recommended parameterization. Two points for the solubility of acetone in water at 298 K and 273 K (Benkelberg et al. [56]) were included to improve the extrapolation to low wt.% solutions.
5-65
The data points from Imamura and Akiyoshi [237] were not included because they were inconsistent with the other data and have a very different temperature dependence. The few data points from Duncan et al. [126, 127] are also inconsistent with the other data and were not included in the parameterization. Back to Table
9. CH3C(O)O2NO2 in H2O and H2SO4 • nH2O(l). Zhang and Leu [496] performed wetted wall flow reactor studies using CIMS to detect CH3C(O)O2NO2 uptake over a temperature range of 199 to 226 K. Uptake studies were performed at 46, 54, 59, and 72 wt.% H2SO4 to yield H*Dl
1/2 values. Dl values were calculated from a cubic cell model to derive H*. Leu and Zhang [298] fit their data from Zhang and Leu [496], including water data from Kames and Schurath [260] and Kames et al. [261], using the Sechenov coefficient form adopted by Huthwelker for HOCl [233]. This formulation is recommended for both water and sulfuric acid solutions. Back to Table
10. CF2O in H2SO4 • nH2O(l). Hanson and Ravishankara [199] calculate an upper limit for H of CF2O based on assumed solubility limit resulting in lack of measurable uptake into 60 wt.% H2SO4. Back to Table
11. CF3OH in H2SO4 • nH2O(l). Lovejoy et al. [310] determined reacto-diffusive lengths of > 0.4 µm and 1.0 µm for CF3OH uptake at 250 K on 40 and 50 wt.% H2SO4 aerosols, respectively. This leads to H* estimates of >240 and 210 M atm–1, respectively. Back to Table
12. HOCl in H2SO4 • nH2O(l). Recommendation is from the model of Shi et al. [414] which is based on wetted wall flow tube data from Hanson and Ravishankara [205] and Hanson and Lovejoy [197], and uptake by stirred and static solutions by Donaldson et al. [124]. This model incorporates newer, higher temperature data and replaces earlier recommended formulation by Huthwelker et al. [233]. Back to Table
13. ClONO2 in H2SO4 • nH2O(l). Recommendation is from the model of Shi et al. [414] who used a measurement of the hydrolysis reaction’s reacto-diffusive length by Hanson and Lovejoy [196] on 60 wt.% H2SO4 at 250 K to derive the hydrolysis rate constant, khyd, and constrain HClONO2 at 250 K. Shi et al. fit the Hk1/2 dependence of the ClONO2 uptake coefficients for a variety of ClONO2 hydrolysis and ClONO2 + HCl data to derive a parameterization for H as a function of wt.% and T. Back to Table
14. HBr in H2SO4 • mHNO3 • nH2O(l). Experimental data for HBr solubility is provided by Williams et al. [475], Abbatt [2], Abbatt and Nowak [9], Kleffman et al. [279], and Behr et al. [52]. Data from time-dependent uptake measurements and from vapor pressure measurements is in good agreement after correcting for the fact that for some of the vapor pressure measurements the HBr concentration in solution was high enough to increase the acidity and thereby decrease the HBr solubility. By comparing pairs of data points with different HBr concentrations (from the same experiment), an average correction factor was obtained. The correction factor was used to correct the vapor pressure data of Williams et al. [475], Abbatt and Nowak [9] and Kleffmann et al. to zero effective HBr concentration. (This is different than the approach taken in Kleffmann et al. of using a “corrected” H2SO4 wt.%. However, the resulting parameterization is very similar to the one in Kleffmann et al. [279].) The time-dependent uptake data of Williams et al. [475] and Abbatt [2], and the molecular beam uptake data of Behr et al. [52] did not require correction. All of the experimental data have been fit to obtain the recommended parameterization as a function of H2SO4 wt.% and temperature.
Agreement between this parameterization and the updated activity coefficient model of Massucci et al. [318] (and http://www.hpc1.uea.ac.uk/~e770/aim.html) is good for > 60 wt.%, but not very good at lower H2SO4 wt.%, particularly at low temperatures. Therefore, this parameterization is recommended for calculating HBr Henry’s law solubilities.
The only data for HBr solubilities in ternary solutions is from Kleffmann et al. [279]. The data do not agree well with the updated activity coefficient in Massucci et al. [279] or with the older activity coefficient model in Luo et al. [313]. Until further information becomes available, the recommendation is to use the parameterization for ternary solutions given in Kleffmann et al. [279]. Back to Table
15. SO2 in H2SO4 • nH2O(l). Room temperature vapor pressure measurements reviewed by Hayduk et al. [214] and bubble train reactor uptake measurements by Rattigan et al. [364] for 0–70 wt.% H2SO4 agree very well. Langenberg et al. [290] used a novel capillary gas chromatography technique to deduce H* values for 41–83 wt.% H2SO4 over a temperature range of 193–242 K. The recommended parameterization is a fair fit to the Rattigan et al. and Langenberg et al. data sets and allows reasonable extrapolation over the full range of atmospheric temperatures. Note that the Langenberg et al. [290] data is in mol/kg-bar units and was converted to mole/l units using the density parameterization of Myhre et al. [347]. Back to Table

5-66
5.22 References 1. Abbatt, J. P. D., 1994, Geophys. Res. Lett., 21, 665-668. 2. Abbatt, J. P. D., 1995, J. Geophys. Res., 100, 14009-14017. 3. Abbatt, J. P. D., 1996, Geophys. Res. Lett., 23, 1681-1684. 4. Abbatt, J. P. D., 1997, Geophys. Res. Lett., 24, 1479-1482. 5. Abbatt, J. P. D., 2003, Chem. Rev., 103, 4783-4800. 6. Abbatt, J. P. D., K. D. Beyer, A. F. Fucaloro, J. R. McMahon, P. J. Wooldridge, R. Zhong and M. J.
Molina, 1992, J. Geophys. Res., 97, 15819-15826. 7. Abbatt, J. P. D. and M. J. Molina, 1992, J. Phys. Chem., 96, 7674-7679. 8. Abbatt, J. P. D. and M. J. Molina, 1992, Geophys. Res. Lett., 19, 461-464. 9. Abbatt, J. P. D. and J. B. Nowak, 1997, J. Phys. Chem. A, 101, 2131-2137. 10. Abbatt, J. P. D. and G. C. G. Waschewsky Heterogeneous Interactions of HOBr, HNO3, O3, and NO2 with
Deliquescent NaCl Aerosols at Room Temperature, 1998; Vol. 102. 11. Aguzzi, A. and M. J. Rossi, 1999, Phys. Chem. Chem. Phys., 1, 4337-4346. 12. Aguzzi, A. and M. J. Rossi, 2001, Phys. Chem. Chem. Phys., 3, 3707-3716. 13. Aguzzi, A. and M. J. Rossi, 2002, J. Phys. Chem. A, 106, 5891-5901. 14. Akhter, M. S., A. R. Chughtai and D. M. Smith, 1985, Appl. Spectrosc., 39, 143-153. 15. Akhter, M. S., A. R. Chughtai and D. M. Smith, 1985, Appl. Spectrosc., 39, 154-167. 16. Akhter, M. S., A. R. Chughtai and D. M. Smith, 1991, Appl. Spectrosc., 45, 653-665. 17. Al-Abadleh, H. A. and V. H. Grassian, 2000, J. Phys. Chem. A, 104, 11926-11933. 18. Al-Abedeleh, H. A. and V. H. Grassian, 2003, Langmuir, 19, 6443-6457. 19. Alcala-Jornod, C., H. Van den Bergh and M. J. Rossi, 2000, Phys. Chem. Chem. Phys., 2, 5584-5593. 20. Alebić-Juretić, A., T. Cvitas and L. Klasinc, 1992, Ber. Bunsenges Phys. Chem., 96, 493-495. 21. Alebić-Juretić, A., T. Cvitas and L. Klasinc, 2000, Chemosphere, 41, 667-670. 22. Allanic, A., R. Oppliger and M. J. Rossi, 1997, J. Geophys. Res., 102, 23529-23541. 23. Allanic, A., R. Oppliger, H. Van den Bergh and M. J. Rossi, 2000, Zeitschrift fur Physikalische Chemie,
214, 11, 1479-1500. 24. Allanic, A. and M. J. Rossi, 1999, J. Geophys. Res., 104, 18,689-18,696. 25. Allen, H. C., D. E. Gragson and G. L. Richmond, 1999, J. Phys. Chem. B, 103, 660-666. 26. Altschuh, J., R. Bruggemann, H. Santl, G. Eichinger and O. G. Piringer, 1999, Chemosphere, 39, 1871-
1887. 27. Ammann, M., M. Kalberer, D. T. Jost, L. Tobler, E. Rossler, D. Piguet, H. W. Gaggeler and U.
Baltensperger, 1998, Nature, 395, 157-160. 28. Ammann, M., M. Kalberer, K. Tabor, K. Tobler, C. Zellweger, E. Weingartner, S. Nyeki, Y. Parrat, F. Li,
D. Piguet, E. Rossler, D. T. Jost, H. W. Gaggeler and U. Baltensperger. "Proc. 7th Euro. Symp. on Physico-Chem. Behav. of Atmos. Poll." 1996.
29. Anastasio, C. and M. Mozurkewich, 2002, J. Atmos. Chem., 41, 135-162. 30. Arens, F., L. Gutzwiller, U. Baltensperger, H. Gaggeler and M. Ammann, 2001, Environ. Sci. Technol., 35,
2191-2199. 31. Baker, J., S. F. M. Ashbourn and R. A. Cox, 1999, Phys. Chem. Chem. Phys., 1, 683-690. 32. Baldwin, A. C., 1982, Int. J. Chem. Kin., 14, 269-277. 33. Baldwin, A. C. and D. M. Golden, 1979, Science, 206, 562. 34. Baldwin, A. C. and D. M. Golden, 1980, J. Geophys. Res., 85, 2888-2889. 35. Ball, S. M., A. Fried, B. E. Henry and M. Mozurkewich, 1998, Geophys. Res. Lett., 25, 3339-3342. 36. Barlett, W. P. and D. W. Margerum, 1999, Environ. Sce. Technol., 33, 3410-3414. 37. Barone, S. B., M. A. Zondlo and M. A. Tolbert, 1997, J. Phys. Chem. A, 101, 8643-8652. 38. Battino, R. Nitrous oxide in water. In Oxides of Nitrogen; C. L. Young, Ed.; Pergamon: Oxford, 1981; Vol.
8; pp 1-22. 39. Battino, R. Oxygen in water. In Oxygen and Ozone; R. Battino, Ed.; Pergamon: Oxford, 1981; Vol. 7; pp 1-
5. 40. Battino, R. Ethane in water. In Ethane; W. Hayduk, Ed.; Pergamon: Oxford, 1982; Vol. 9; pp 1-26. 41. Battino, R. Nitrogen in water. In Nitrogen and Air; R. Battino, Ed.; Pergamon: Oxford, 1982; Vol. 10; pp
1-29. 42. Battino, R. Chlorine dioxide in water. In Sulfur Dioxide, Chlorine, Fluorine and Chlorine Oxides; C. L.
Young, Ed.; Pergamon: Oxford, 1983; Vol. 12; pp 454-456.

5-67
43. Battino, R. Chlorine in water. In Sulfur Dioxide, Chlorine, Fluorine and Chlorine Oxides; C. L. Young, Ed.; Pergamon: Oxford, 1983; Vol. 12; pp 333-347.
44. Battino, R. Sulfur dioxide in water. In Sulfur Dioxide, Chlorine, Fluorine and Chlorine Oxides; C. L. Young, Ed.; Pergamon: Oxford, 1983; Vol. 12; pp 3-33.
45. Battino, R. 2-Methylpropane in water. In Propane, Butane and 2-Methylpropane; W. Hayduk, Ed.; Pergamon: Oxford, 1986; Vol. 24; pp 34-37.
46. Battino, R. Butane in water. In Propane, Butane and 2-Methylpropane; W. Hayduk, Ed.; Pergamon: Oxford, 1986; Vol. 24; pp 16-32.
47. Battino, R. Propane in water. In Propane, Butane and 2-Methylpropane; W. Hayduk, Ed.; Pergamon: Oxford, 1986; Vol. 24; pp 1-15.
48. Battino, R. Methane in water. In Methane; H. L. Clever and C. L. Young, Eds.; Pergamon: Oxford, 1987; Vol. 27/28; pp 1-44.
49. Becker, K. H., J. Kleffman, R. Kurtenbach and P. Wiesen, 1996, J. Phys. Chem., 100, 14,984-14,990. 50. Behnke, W., C. George, V. Scheer and C. Zetsch, 1997, J. Geophys. Res., 102, 3795-3804. 51. Behnke, W., H.-U. Kruger, V. Scheer and C. Zetzsch, 1991, J. Aerosol Sci., 22, S609-S612. 52. Behr, P., J. R. Morris, M. D. Antman, B. R. Ringeisen, J. Splan and G. M. Nathanson, 2001, Geophys. Res.
Lett., 28, 1961-1964. 53. Beichert, P. and B. J. Finlayson-Pitts, 1996, J. Phys. Chem., 100, 15218-15228. 54. Ben-Naim, A. and R. Battino, 1985, J. Sol. Chem., 14, 245-253. 55. Benes, M. and V. Dohnal, 1999, J. Chem. Eng. Data, 44, 1097-1102. 56. Benkelberg, H. J., S. Hamm and P. Warneck, 1995, J. Atmos. Chem., 20, 17-34. 57. Benson, B. B., D. Krause and M. A. Peterson, 1979, J. Sol. Chem., 8, 655-690. 58. Berland, B. S., M. A. Tolbert and S. M. George, 1997, J. Phys. Chem. A, 101, 9954-9963. 59. Betterton, E. A. and M. R. Hoffmann, 1988, Environ. Sci. Technol., 22, 1415-1418. 60. Blatchley, E. R., R. W. Johnson, J. E. Alleman and W. F. McCoy, 1991, Wat. Res., 26, 99-106. 61. Bongartz, A., J. Kames, U. Schurath, C. George, P. Mirabel and J. L. Ponche, 1994, J. Atmos. Chem., 18,
149-169. 62. Bongartz, A., S. Schweighoefer, C. Roose and U. Schurath, 1995, J. Atmos. Chem., 20, 35-58. 63. Boniface, J., Q. Shi, Y. Q. Li, J. L. Chueng, O. V. Rattigan, P. Davidovits, D. R. Worsnop, J. T. Jayne and
C. E. Kolb, 2000, J. Phys. Chem. A, 104, 7502-7510. 64. Borensen, C., U. Kirchner, V. Scheer, R. Vogt and R. Zellner, 2000, J. Phys. Chem. A, 104, 5036-5045. 65. Brouwer, L., M. J. Rossi and D. M. Golden, 1986, J. Phys. Chem., 90, 4599-4603. 66. Brown, D. E., S. M. George, C. Huang, E. K. L. Wong, K. B. Rider, R. S. Smith and B. D. Kay, 1996, J.
Phys. Chem., 100, 4988-4995. 67. Brown, L. A., V. Vaida, D. R. Hanson, J. D. Graham and J. T. Roberts, 1996, J. Phys. Chem., 100, 3121-
3125. 68. Burnett, M. G., 1963, Anal. Chem., 35, 1567-1570. 69. Butler, J. V. A., C. N. Ramchandani and D. W. Thomson, 1935, J. Chem. Soc., 280285. 70. Buxton, G. V., G. A. Salmon and J. Wang, 1999, Phys. Chem. Chem. Phys., 1, 3589-3593. 71. Cachier, H. Carbonaceous Combustion Aerosols. In Atmospheric Particles; R. M. Harrison and R.
VanGrieken, Eds.; Wiley: New York, 1998. 72. Caloz, F., F. F. Fenter, K. D. Tabor and M. J. Rossi, 1997, Rev. Sci. Instrum., 68, 3172-3179. 73. Caloz, F., F. F. Fentner and M. J. Rossi, 1996, J. Phys. Chem., 100, 7494-7501. 74. Caloz, F., S. Seisel, F. F. Fenter and M. J. Rossi, 1998, J. Phys. Chem. A, 102, 7470-7479. 75. Cappa, C. D., S. E. Kuipers, J. M. Roberts, A. S. Gilbert and M. J. Elrod, 2000, J. Phys. Chem. A, 104,
4449-4457. 76. Carlos-Cuellar, S., P. Li, A. P. Christensen, B. J. Krueger, C. Burrichter and V. H. Grassian, 2003, J. Phys.
Chem. A, 107, 4250-4261. 77. Carslaw, K. S., S. L. Clegg and P. Brimblecombe, 1995, J. Phys. Chem., 99, 11,557-11,574. 78. Carslaw, K. S. and T. Peter, 1997, Geophys. Res. Lett., 24, 1743-1746. 79. Carslaw, K. S., T. Peter and S. L. Clegg, 1997, Rev. Geophys., 35, 125-154. 80. Carstens, T., C. Wunderlich and U. Schurath. "Proceedings EUROTRAC Symposium ' 96", 1996,
Southhampton, U. K. 81. Chaix, L., A. Allanic and M. J. Rossi, 2000, J. Phys. Chem. A, 104, 7268-7277. 82. Cheung, J. L., Y. Q. Li, J. Boniface, Q. Shi, P. Davidovits, D. Worsnop, J. T. Jayne and C. E. Kolb, 2000,
J. Phys. Chem. A, 104, 2655-2662. 83. Choi, W. and M. T. Leu, 1998, J. Phys. Chem A, 102, 7618-7630.

5-68
84. Chu, L. and L. T. Chu, 1999, J. Phys. Chem. A, 103, 8640-8649. 85. Chu, L. and L. T. Chu, 1999, J. Phys. Chem. A, 103, 691-699. 86. Chu, L., G. Diao and L. T. Chu, 2000, J. Phys. Chem. A, 104, 3150-3158. 87. Chu, L. T., G. Diao and L. Chu, 2002, J. Phys Chem. B, 106, 5679-5688. 88. Chu, L. T. and J. W. Heron, 1995, Geophys. Res. Lett., 22, 3211-3214. 89. Chu, L. T., M.-T. Leu and L. F. Keyser, 1993, J. Phys. Chem., 97, 7779-7785. 90. Chu, L. T., M.-T. Leu and L. F. Keyser, 1993, J. Phys. Chem., 97, 12798-12804. 91. Chughtai, A. R., M. M. O. Atteya, J. Kim, B. K. Konowalchuck and D. M. Smith, 1998, Carbon, 36, 1573-
1589. 92. Chughtai, A. R., M. E. Brooks and D. M. Smith, 1993, Aer. Sci. Tech., 19, 121-132. 93. Chughtai, A. R., M. E. Brooks and D. M. Smith, 1996, J. Geophys. Res., 101, 19505-19514. 94. Chughtai, A. R., S. A. Gordon and D. M. Smith, 1994, Carbon, 32, 405-416. 95. Chughtai, A. R., J. M. Kim and D. M. Smith, 2002, J. Atmos. Chem., 43, 21-43. 96. Chughtai, A. R., J. M. Kim and D. M. Smith, 2002, J. Atmos. Chem., 45, 231-243. 97. Chughtai, A. R., N. J. Miller, D. M. Smith and J. R. Pitts, 1999, J. Atmos. Chem., 34, 259-279. 98. Chughtai, A. R., W. F. Welch, M. S. Akhter and D. M. Smith, 1990, Appl. Spectrosc., 44, 294-298. 99. Chughtai, A. R., W. F. Welch and D. M. Smith, 1990, Carbon, 28, 411-421. 100. Chughtai, A. R., G. R. Williams, M. M. O. Atteya, N. J. Miller and D. M. Smith, 1999, Atmos. Environ.,
33, 2679-2687. 101. Clegg, S. L. and P. Brimblecombe, 1986, Atmos. Environ., 20, 2483. 102. Clegg, S. L. and P. Brimblecombe, 1989, J. Phys. Chem., 93, 7237-7248. 103. Cofer, W. R., D. R. Schryer and R. S. Rogowski, 1981, Atm. Environ., 15, 1281-1286. 104. Cooper, P. L. and J. P. D. Abbatt, 1996, J. Phys. Chem., 100, 2249-2254. 105. Cowin, J. P., personal comm. 106. Dacey, J. W. H., S. G. Wakeham and B. L. Howes, 1984, Geophys. Res. Lett., 11, 991-994. 107. Dai, D. J., S. J. Peters and G. E. Ewing, 1995, J. Phys. Chem., 99, 10,299-10,304. 108. Dai, Q., G. N. Robinson and A. Freedman, 1997, J. Phys. Chem., 101, 4940-4946. 109. Dasgupta, P. K. and S. Dong, 1986, Atmos. Environ., 20, 565-570. 110. Datta, A., R. G. Cavell, R. W. Tower and Z. M. George, 1985, J. Phys. Chem., 89, 443-449. 111. Daumer, R. Nissner and D. Klockow, J. Aerosol Sci., 23, 315-325. 112. Davidovits, P., D. R. Worsnop, J. T. Jayne, C. E. Kolb, P. Winkler, A. Vrtala, P. E. Wagner, M. Kulmula,
K. E. J. Lehtinen, T. Vessala and M. Mozurkewich, 2004, Geophys. Res. Lett., 31, L22111, doi: 10.1029/2004GRL020835.
113. Davies, J. A. and R. A. Cox, 1998, J. Phys. Chem. A, 102, 7631-7642. 114. De Bruyn, W. J., S. X. Duan, X. Q. Shi, P. Davidovits, D. R. Worsnop, M. S. Zahniser and C. E. Kolb,
1992, Geophys. Res. Lett., 19, 1939-1942. 115. De Bruyn, W. J., J. A. Shorter, P. Davidovits, D. R. Worsnop, M. S. Zahniser and C. E. Kolb, 1994, J.
Geophys. Res., 99, 16927-16932. 116. De Bruyn, W. J., J. A. Shorter, P. Davidovits, D. R. Worsnop, M. S. Zahniser and C. E. Kolb, 1995,
Environ. Sci Technol., 29, 1179-1185. 117. De Bruyn, W. J., E. Swartz, J. H. Hu, J. A. Shorter, P. Davidovits, D. R. Worsnop and M. S. Zahniser,
1995, J. Geophys. Res., 100, 7245-7251. 118. DeHaan, D. O. and B. J. Finlayson-Pitts, 1997, J. Phys. Chem. A, 101, 9993-9999. 119. Deiber, G., C. George, S. Le Calve, F. Schweitzer and P. Mirabel, 2004, Atmos. Chem. Phys., 4, 1291-
1299. 120. Disselkamp, R. S., M. A. Carpenter and J. P. Cowin, 2000, J. Atmos. Chem., 37, 113-123. 121. Disselkamp, R. S., M. A. Carpenter, J. P. Cowin, C. M. Berkowitz, E. G. Chapman, R. A. Zaveri and N. S.
Laulainen, 2000, J. Geophys. Res., 105, 9767-9771. 122. Dlugokencky, E. J. and A. R. Ravishankara, 1992, Geophys. Res. Lett., 19, 41-44. 123. Donaldson, D. J., J. A. Guest and M. C. Goh, 1995, J. Phys. Chem., 99, 9313-9315. 124. Donaldson, D. J., A. R. Ravishankara and D. R. Hanson, 1997, J. Phys. Chem. A, 101, 4717-4725. 125. Duan, S. X., J. T. Jayne, P. Davidovits, D. R. Worsnop, M. S. Zahniser and C. E. Kolb, 1993, J. Phys.
Chem., 97, 2284-2288. 126. Duncan, J. L., L. R. Schindler and J. T. Roberts, 1998, Geophys. Res. Lett., 25, 631-634. 127. Duncan, J. L., L. R. Schindler and J. T. Roberts, 1999, J. Phys. Chem. B, 103, 7247-7259. 128. Edwards, T. J., G. Maurer, J. Newman and J. M. Prausnitz, 1978, AIChE, 24, 966-976.

5-69
129. Elam, J. W., C. E. Nelson, M. A. Cameron, M. A. Tolbert and S. M. George, 1998, J. Phys. Chem. B, 102, 7008-7015.
130. Elliott, S., 1989, Atmos. Environ., 23, 1977-1980. 131. Elrod, M. J., R. E. Koch, J. E. Kim and M. S. Molina, 1995, Faraday Discuss, 100, 269-278. 132. Fairbrother, D. H. and G. Somorjai, 2000, J. Phys. Chem. B, 104, 4649-4652. 133. Fendel, W., D. Matter, H. Burtscher and A. Schimdt-Ott, 1995, Atmos. Environ, 29, 967-973. 134. Fendel, W. and A. Schmidt-Ott, 1993, J. Aerosol Sci., 24, S317-S318. 135. Fenter, F. F., F. Caloz and M. J. Rossi, 1994, J. Phys. Chem., 98, 9801-9810. 136. Fenter, F. F., F. Caloz and M. J. Rossi, 1996, J. Phys. Chem., 100, 1008-1019. 137. Fenter, F. F. and M. J. Rossi, 1996, J. Phys. Chem., 100, 13765-13775. 138. Fenter, F. F. and M. J. Rossi, 1997, J. Phys. Chem. A, 101, 4110-4113. 139. Fenzel, A., V. Scheer, R. Sikorski, C. George, W. Behnke and C. Zetsch, 1998, J. Phys. Chem. A, 102,
1329-1337. 140. Fickert, S., J. W. Adams and J. N. Crowley, 1999, J. Geophys. Res., 104, 23719-23727. 141. Fickert, S., F. Helleis, J. W. Adams, G. K. Moortgat and J. N. Crowley, 1998, J. Phys. Chem. A, 102,
10689-10696. 142. Finlayson-Pitts, B. J., 1983, Nature, 306, 676-677. 143. Finlayson-Pitts, B. J., 2003, Chem Rev., 103, 4801-4822. 144. Finlayson-Pitts, B. J., M. J. Ezell and J. N. Pitts, Jr., 1989, Nature, 337, 241-244. 145. Finlayson-Pitts, B. J., F. E. Livingston and H. N. Berko, 1989, J. Phys. Chem., 93, 4397-4400. 146. Finlayson-Pitts, B. J. and J. N. Pitts Chemistry of the Upper and Lower Atmosphere: Theory, Experiments
and Applications; Academic: San Diego, 2000. 147. Flückiger, B. and M. J. Rossi, 2003, J. Phys. Chem. A, 107, 4103-4115. 148. Flückiger, B., A. Thielmann, L. Gutzwiller and M. J. Rossi, 1998, Ber. Bunsenges. Phys. Chem., 102, 915-
928. 149. Fogg, P. G. T. Hydrogen sulfide in water. In Hydrogen Sulfide, Deuterium Sulfide and Hydrogen Selenide;
P. G. T. Fogg and C. L. Young, Eds.; Pergamon: Oxford, 1988; Vol. 32; pp 1-19. 150. Fox, L. E., D. R. Worsnop, M. S. Zahniser and S. C. Wofsy, 1994, Science, 267, 351-355. 151. Frenzel, A., S. Kutsuna, K. Takeuchi and T. Ibusuki, 2000, Atmos. Environ., 34, 3641-3544. 152. Frenzel, A., V. Scheer, R. Sikorski, C. George, W. Behnke and C. Zetzsch, 1998, J. Phys. Chem. A, 102,
1329-1337. 153. Friant, S. L. and I. H. Suffet, 1979, Anal. Chem., 51, 21672176. 154. Fried, A., B. E. Henry, J. G. Calvert and M. Mozukewich, 1994, J. Geophys. Res., 99, 3517-3532. 155. Fung, K. N., I. N. Tang and H. R. Munkelwitz, 1987, Appl. Optics, 26, 1282-1287. 156. Gebel, M. E. and B. J. Finlayson-Pitts, 2001, J. Phys. Chem. A, 105, 5178-5187. 157. Gebel, M. E., B. J. Finlayson-Pitts and J. S. Ganske, 2000, Geophys. Res. Lett., 27, 887-890. 158. George, C., W. Behnke, V. Scheer, C. Zetsch, L. Magi, J. L. Ponche and P. Mirabel, 1995, Geophys. Res.
Lett., 22, 1505-1508. 159. George, C., J. Lagrange, P. Lagrange, P. Mirabel, C. Pallares and J. L. Ponche, 1994, J. Geophys. Res., 99,
1255-1262. 160. George, C., J. L. Ponche, P. Mirabel, W. Behnke, V. Sheer and C. Zetzsch, 1994, J. Phys. Chem., 98, 8780-
8784. 161. George, C., J. Y. Saison, J. L. Ponche and P. Mirabel, 1994, J. Phys. Chem., 98, 10857-10862. 162. Gerecke, A., A. Thielmann, L. Gutzwiller and M. J. Rossi, 1998, Geophys. Res. Lett., 25, 2453-2456. 163. Gershenzon, M., P. Davidovits, L. R. Williams, Q. Shi, J. T. Jayne, C. E. Kolb and D. Worsnop, 2004, J.
Phys. Chem. A, 106, 1567-1573. 164. Gershenzon, M. Y., S. Il'in, N. G. Fedotov, Y. M. Gershenzon, E. V. Aparina and V. V. Zelenov, 1999, J.
Atmos. Chem., 34, 119-135. 165. Gershenzon, Y. M., V. M. Grigorieva, A. V. Ivanov and R. G. Remorov, 1995, Faraday Discuss, 100, 83-
100. 166. Gershenzon, Y. M., A. V. Ivanov, S. I. Kucheryavyi and V. B. Rozenshtein, 1986, Kinet. Katal., 27, 1069-
1074. 167. Gershenzon, Y. M. and A. P. Purmal, 1990, Russ. Chem. Rev., 59, 1007-1023. 168. Gertner, B. J. and J. T. Hynes, 1996, Science, 271, 1563-1566. 169. Ghosal, S. and J. C. Hemminger, 1999, J. Phys. Chem. A, 103, 4777-4781. 170. Ghosal, S. and J. C. Hemminger, 2004, J. Phys. Chem. A, in press. 171. Ghosal, S., A. Shbeeb and J. C. Hemminger, 2000, Geophys. Res. Lett., 27, 1879.

5-70
172. Goldberg, E. D. Black Carbon in the Environment; Wiley: New York, 1985. 173. Goodman, A. L., E. T. Bernard and V. H. Grassian, 2001, J. Phys. Chem. A, 105, 6443-6457. 174. Goodman, A. L., P. Li, C. R. Usher and V. H. Grassian, 2002, J. Phys. Chem. A, 105, 6109-6120. 175. Graham, J. D. and J. T. Roberts, 1994, J. Phys. Chem., 98, 5974-5983. 176. Graham, J. D. and J. T. Roberts, 1995, Geophys. Res. Lett., 22, 251-254. 177. Graham, J. D., J. T. Roberts, L. A. Brown and V. Vaida, 1996, J. Phys. Chem., 100, 3115-3120. 178. Gratpanche, F. and J.-P. Sawerysyn, 1999, J. Chim. Phys., 96, 213-231. 179. Guimbaud, C., F. Arens, L. Gutzwiller, H. W. Gäggeler and M. Ammann, 2002, Atmos. Chem. Phys., 2,
249-257. 180. Gutzwiller, L., F. Arens, U. Baltensperger, H. W. Gäggeler and M. Ammann, 2002, Environ. Sci. Technol.,
36, 677-682. 181. Haag, W. R. and J. Hoigné, 1983, Environ. Sci. Technol., 17, 261-267. 182. Haag, W. R. and J. Hoigné, 1983, Wat. Res., 17, 1397-1402. 183. Hales, J. M. and D. R. Drewes, 1979, Atmos. Environ., 13, 1133-1147. 184. Hallquist, M., D. J. Stewart, J. Baker and R. A. Cox, 2000, J. Phys. Chem. A, 104, 3984. 185. Hamm, S., J. Hahn, G. Helas and P. Warneck, 1984, Geophys. Res. Let., 11, 1207-1210. 186. Hanisch, F. and J. N. Crowley, 2001, J. Phys. Chem. A, 105, 3096-3106. 187. Hanning-Lee, M. A., B. B. Brady, L. R. Martin and J. A. Syage, 1996, Geophys. Res. Lett., 23, 1961-1964. 188. Hanson, D., 2003, J. Geophys. Res., 108, doi: 10.1029/2002JD002519. 189. Hanson, D. and E. Kosciuch, 2003, J. Phys. Chem. A, 107, 2199-2208. 190. Hanson, D. and E. Kosciuch, 2003, J. Phys. Chem. A, 108, 5849-5851. 191. Hanson, D. R., 1992, Geophys. Res. Lett., 19, 2063-2066. 192. Hanson, D. R., 1995, J. Phys. Chem., 99, 13,059-13,061. 193. Hanson, D. R., 1998, J. Phys. Chem. A, 102, 4794-4807. 194. Hanson, D. R., J. B. Burkholder, C. J. Howard and A. R. Ravishankara, 1992, J. Phys. Chem., 96, 4979-
4985. 195. Hanson, D. R. and E. R. Lovejoy, 1994, Geophys. Res. Lett., 21, 2401-2404. 196. Hanson, D. R. and E. R. Lovejoy, 1995, Science, 267, 1326-1329. 197. Hanson, D. R. and E. R. Lovejoy, 1996, J. Phys. Chem., 100, 6397-6405. 198. Hanson, D. R. and A. R. Ravishankara, 1991, J. Geophys. Res., 96, 5081-5090. 199. Hanson, D. R. and A. R. Ravishankara, 1991, Geophys. Res. Lett., 18, 1699-1701. 200. Hanson, D. R. and A. R. Ravishankara, 1991, J. Geophys. Res., 96, 17307-17314. 201. Hanson, D. R. and A. R. Ravishankara, 1992, J. Phys. Chem., 96, 9441-9446. 202. Hanson, D. R. and A. R. Ravishankara, 1992, J. Phys. Chem., 96, 2682-2691. 203. Hanson, D. R. and A. R. Ravishankara. In The Tropospheric Chemistry of Ozone in the Polar Regions; H.
Niki and K. H. Becker, Eds.; NATO, 1993; pp 17281-17290. 204. Hanson, D. R. and A. R. Ravishankara, 1993, J. Phys. Chem., 97, 2802-2803. 205. Hanson, D. R. and A. R. Ravishankara, 1993, J. Geophys. Res., 98, 22931-22936. 206. Hanson, D. R. and A. R. Ravishankara, 1993, J. Phys. Chem., 97, 12309-12319. 207. Hanson, D. R. and A. R. Ravishankara, 1994, J. Phys. Chem., 98, 5728-5735. 208. Hanson, D. R. and A. R. Ravishankara, 1995, Geophys. Res. Lett., 22, 385-388. 209. Hanson, D. R., A. R. Ravishankara and E. R. Lovejoy, 1996, J. Geophys. Res., 101, 9063-9069. 210. Hanson, D. R., A. R. Ravishankara and S. Solomon, 1994, J. Geophys. Res., 99, 3615-3629. 211. Harker, A. B. and W. W. Ho, 1979, Atmos. Environ., 13, 1005-1010. 212. Harrison, R. M. and G. M. Collins, 1998, J. Atmos. Chem., 30, 397-406. 213. Hauff, K., R. G. Fischer and K. Ballschmiter, 1998, Chemosphere, 37, 2599-2615. 214. Hayduk, W., H. Asatani and B. C. Y. Lu, 1988, J. Chem. Eng. Data, 33, 506-509. 215. Haynes, D. R., N. J. Tro and S. M. George, 1992, J. Phys. Chem., 96, 8502-8509. 216. Henson, B. F., K. R. Wilson and J. M. Robinson, 1996, Geophys. Res. Lett., 23, 1021-1024. 217. Hill, J. O., I. G. Worsley and L. G. Helper, 1968, J. Phys. Chem., 72, 3695-3697. 218. Hirokawa, J., K. Onaka, Y. Kajii and H. Akimoto, 1998, Geophys. Res. Lett., 25, 2449-2452. 219. Hoff, J. T., D. Mackay, R. Gillham and W. Y. Shiu, 1993, Environ. Sci. Tehcnol., 27, 2174-2180. 220. Hoffman, R. C., M. E. Gebel, B. S. Fox and B. J. Finlayson-Pitts, 2003, Phys. Chem. Chem. Phys., 5, 1780-
1789. 221. Hoffman, R. C., M. Kaleuati and B. J. Finlayson-Pitts, 2003, J. Phys. Chem. A, 107, 7818-7826. 222. Hofmann, D. J. and S. J. Oltmans, 1992, Geophys. Res. Lett., 22, 2211-2214. 223. Holdren, M. W., C. W. Spicer and J. M. Hales, 1984, Atmos. Environ., 18, 1171-1173.

5-71
224. Holzwarth, G., R. G. Balmer and L. Soni, 1984, Water Res., 18, 1421-1427. 225. Hu, J. H. and J. P. D. Abbatt, 1997, J. Phys. Chem. A, 101, 871-878. 226. Hu, J. H., Q. Shi, P. Davidovits, D. R. Worsnop, M. S. Zahniser and C. E. Kolb, 1995, J. Phys. Chem., 99,
8768-8776. 227. Hu, J. H., J. A. Shorter, P. Davidovits, D. R. Worsnop, M. S. Zahniser and C. E. Kolb, 1993, J. Phys.
Chem., 97, 11037-11042. 228. Hudson, P. K., K. L. Foster, M. A. Tolbert, S. M. George, S. R. Carlo and V. H. Grassian, 2001, J. Phys.
Chem. A, 105, 694-702. 229. Hudson, P. K., J. E. Shilling, M. A. Tolbert and O. B. Toon, 2002, J. Phys. Chem. A, 106, 9874-9882. 230. Huie, R. E., C. L. Clifton and P. Neta, 1991, Radiat. Phys. Chem., 38, 477-481. 231. Hunt, S. W., M. Roesolová, W. Wang, L. M. Wingen, E. M. Knipping, D. J. Tobias, D. Dabdub and B. J.
Finlayson-Pitts, 2004, J. Phys Chem. A, 108, 11559-11572. 232. Huntzicker, J. J., R. A. Cary and C.-S. Ling, 1980, Environ. Sci. Technol., 14, 819-824. 233. Huthwelker, T., T. Peter, B. P. Juo, S. L. Clegg, K. S. Carshlaw and P. Brimblecombe, 1995, J. Atmos.
Chem., 21, 81-95. 234. Hwang, H. and P. K. Dasgupta, 1985, Environ. Sci. Technol., 19, 255-258. 235. Hynes, A. J., M. A. Fernandez and R. A. Cox, 2002, J. Geophys. Res.,, 107, 4797. 236. Il'in, S. D., V. V. Selikhonovich, Y. M. Gershenson and V. B. Rozenshtein, 1991, Sov. J. Chem. Phys., 8,
1858-1880. 237. Imamura, T. and H. Akiyoshi, 2000, Geophys. Res. Lett., 27, 1419-1422. 238. Imamura, T., Y. Rudich, R. K. Talukdar, R. W. Fox and A. R. Ravishankara, 1997, J. Phys. Chem., 101,
2316-2322. 239. Iraci, L. T., A. M. Essin and D. M. Golden, 2002, J. Phys. Chem. A, 106, 4054-4060. 240. Iraci, L. T., A. M. Middlebrook, M. A. Wilson and M. A. Tolbert, 1994, Geophys. Res. Lett., 21, 867-870. 241. Iraci, L. T. and M. A. Tolbert, 1997, J. Geophys. Res., 102, 16,099-16,107. 242. Ivanov, A. V., Y. M. Gershenzon, F. Gratpanche, P. Devolder and J.-P. Saverysyn, 1996, Ann. Geophys.,
14, 659-664. 243. Jaegle, L., C. R. Webster, R. D. May, D. C. Scott, R. M. Stimpfle, D. W. Kohn, P. O. Wennberg, T. F.
Hansico, R. C. Cohen, M. H. Proffitt, K. K. Kelly, J. Elkins, D. Baumgardner, J. E. Dye, J. C. Wilson, R. F. Pueschel, K. R. Chan, R. J. Salawitch, A. F. Tuck, S. J. Hovde and Y. L. Yung, 1997, J. Geophys. Res., 102, 13,235-13,253.
244. Jans, U. and J. Hoigne, 2000, Atmos. Environ., 34, 1069-1085. 245. Jayne, J. T., P. Davidovits, D. R. Worsnop, M. S. Zahniser and C. E. Kolb, 1990, J. Phys. Chem., 94, 6041-
6048. 246. Jayne, J. T., S. X. Duan, P. Davidovits, D. R. Worsnop, M. S. Zahniser and C. E. Kolb, 1991, J. Phys.
Chem., 95, 6329-6336. 247. Jayne, J. T., S. X. Duan, P. Davidovits, D. R. Worsnop, M. S. Zahniser and C. E. Kolb, 1992, J. Phys.
Chem., 96, 5452-5460. 248. Jayne, J. T., U. Poschl, Y. Chen, D. Dai, L. T. Molina, D. R. Worsnop, C. E. Kolb and M. J. Molina, 1997,
J. Phys. Chem. A, 101, 10,000-10,011. 249. Jayne, J. T., D. R. Worsnop, C. E. Kolb, E. Swartz and P. Davidovits, 1996, J. Phys. Chem., 100, 8015-
8022. 250. Jefferson, A., F. L. Eisele, P. J. Zieman, R. J. Weber, J. J. Marti and P. H. McMurry, 1997, J. Geophys.
Res., 102, 19,021-19,028. 251. Jenkins, J. and M. B. King, 1965, Chem. Engin. Sci., 20, 921-922. 252. Johnson, B. J., E. A. Betterton and D. Craig, 1996, J. Atmos. Chem., 24, 113-119. 253. Jungwirth, P. and D. Tobias, 2001, J. Phys. Chem. B., 105, 10468-10472. 254. Jungwirth, P. and D. J. Tobias, 2002, J. Phys. Chem. B, 106, 6361-6373. 255. Junkermann, W. and T. Ibusuki, 1992, Atmos. Environ., 26A, 3099-3103. 256. Kalberer, M., M. Ammann, F. Arens, H. W. Gaggeler and U. Baltensperger, 1999, J. Geophys. Res., 104,
13825-13832. 257. Kalberer, M., M. Ammann, H. W. Gaggeler and U. Baltensperger, 1999, Atmos. Environ., 33, 2815-2822. 258. Kalberer, M., K. Tabor, M. Ammann, Y. Parrat, E. Weingartner, D. Piguet, E. Rossler, D. T. Jost, A.
Turler, H. W. Gaggeler and U. Baltensperger, 1996, J. Phys. Chem., 100, 15487-15493. 259. Kames, J. and U. Schurath, 1992, J. Atmos. Chem., 15, 79-95. 260. Kames, J. and U. Schurath, 1995, J. Atmos. Chem., 21, 151-164. 261. Kames, J., S. Schweighoefer and U. Schurath, 1991, J. Atmos. Chem., 12, 169-180.

5-72
262. Kamm, S., O. Mohler, K.-H. Naumann, H. Saathoff and U. Schurath, 1999, Atmos. Environ., 33, 4651-4661.
263. Kane, S. M. and M.-T. Leu, 2001, J. Phys. Chem. A, 105, 1411-1415. 264. Kane, S. M., R. S. Timonen and M.-T. Leu, 1999, J. Phys. Chem. A, 103, 9259-9265. 265. Karge, H. G. and I. G. Dalla Lana, 1984, J. Phys. Chem., 88, 1538-1543. 266. Karlsson, R. and E. Ljungstrom, 1995, J. Aerosol Sci., 26, 39-50. 267. Katrib, Y., G. Deiber, F. Schweitzer, P. Mirabel and C. George, 2001, J. Aerosol Sci., 32, 893-911. 268. Katrib, Y., Y. Deiber, P. Mirabel, S. Le Calve, C. George, A. Mellouki and G. Le Bras, 2002, J. Atmos.
Chem., 43, 151-174. 269. Katrib, Y., P. Mirabel, S. Le Calve, G. Weck and E. Kochanski, 2002, J. Phys. Chem. B., 106, 7237-7245. 270. Kelley, C. M. and H. V. Tartar, 1956, J. Amer. Chem. Soc., 78, 5752-5756. 271. Kenner, R. D., I. C. Plumb and K. R. Ryan, 1993, Geophys. Res. Lett., 20, 193-196. 272. Keyser, L. F. and M.-T. Leu, 1993, J. Colloid Interface Sci., 155, 137-145. 273. Keyser, L. F. and M.-T. Leu, 1993, Micros. Res. Technol., 25, 434-438. 274. Keyser, L. F., M.-T. Leu and S. B. Moore, 1993, J. Phys. Chem., 97, 2800-2801. 275. Keyser, L. F., S. B. Moore and M. T. Leu, 1991, J. Phys. Chem., 95, 5496-5502. 276. Khan, I., P. Brimblecombe and S. L. Clegg, 1995, J. Atmos. Chem., 22, 285-302. 277. Kirchner, U., V. Scheer and R. Vogt, 2000, J. Phys. Chem. A, 104, 8908-8915. 278. Klassen, J. K., J. Lynton, D. M. Golden and L. R. Williams, 1999, J. Geophys. Res., 104, 26,355-26,361. 279. Kleffman, J., K. H. Becker, R. Broske, D. Rothe and P. Wiesen, 2000, J. Phys. Chem. A, 104, 8489-8495. 280. Kleffman, J., K. H. Becker, M. Lackhoff and P. Wiesen, 1999, Phys. Chem. Chem. Phys., 1, 5443-5450. 281. Kleffman, J., K. H. Becker and P. Wiesen, 1998, Atmos. Environ., 32, 3129-3137. 282. Klimovskii, A. O., A. V. Bavin, V. S. Tkalich and A. A. Lisachenko, 1983, React. Kinet. Catal. Lett., 23,
95-98. 283. Knipping, E. M., M. J. Lakin, K. L. Foster, P. Jungwirth, D. J. Tobias, R. B. Gerber, D. Dabdub and B. J.
Finlayson-Pitts, 2000, Science, 288, 301. 284. Koch, T. G. and M. J. Rossi, 1998, J. Phys. Chem. A, 102, 9193-9201. 285. Koch, T. G., H. vandenBergh and M. J. Rossi, 1999, Phys. Chem. Chem. Phys., 1, 2687-2694. 286. Koehler, B. G., L. S. McNeill, A. M. Middlebrook and M. A. Tolbert, 1993, J. Geophys. Res., 98, 10563-
10571. 287. Koehler, B. G., V. T. Nicholson, H. G. Roe and E. S. Whitney, 1999, J. Geophys. Res., 104, 5507-5514. 288. Kolb, C. E., D. R. Worsnop, M. S. Zahniser, P. Davidovits, L. F. Keyser, M.-T. Leu, M. J. Molina, D. R.
Hanson, A. R. Ravishankara, L. R. Williams and M. A. Tolbert. Progress and Problems in Atmospheric Chemistry. In Adv. Phys. Chem. Series, 3; J. R. Barker, Ed., 1994; pp 771-875.
289. Kroes, G.-J. and D. C. Clary, 1992, J. Phys. Chem., 96, 7079-7088. 290. Langenberg, S., V. Proksch and U. Schurath, 1998, Atm. Environ., 32, 3129-3137. 291. Langer, S., R. S. Pemberton and B. J. Finlayson-Pitts, 1997, J. Phys. Chem. A, 101, 1277-1286. 292. Lemmon, E. W., M. O. McLinden and D. G. Friend. Thermophysical properties of fluid systems. In NIST
Chemistry WebBook; NIST Standard Reference Database No. 69; W. G. Mallard and P. J. Linstrom, Eds.; National Institute of Standards and Technology: Gaithersburg, MD, 2000.
293. Leu, M.-T., 1988, Geophys. Res. Lett., 15, 17-20. 294. Leu, M.-T., 1988, Geophys. Res. Lett., 15, 851-854. 295. Leu, M.-T., S. B. Moore and L. F. Keyser, 1991, J. Phys. Chem., 95, 7763-7771. 296. Leu, M.-T., R. S. Timonen and L. F. Keyser, 1997, J. Phys. Chem. A, 101, 278-282. 297. Leu, M.-T., R. S. Timonen, L. F. Keyser and Y. L. Yung, 1995, J. Phys. Chem., 99, 13203-13212. 298. Leu, M.-T. and R. Zhang, 1999, Geophys. Res. Lett., 26, 1129-1132. 299. Li, P., K. A. Perreau, E. Covington, C. H. Song, G. R. Carmichael and V. H. Grassian, 2001, J. Geophys.
Res., 106, 5517-5529. 300. Li, Y. Q., P. Davidovits, Q. Shi, J. T. Jayne, C. E. Kolb and D. R. Worsnop, 2001, J. Phys. Chem. A, 105,
10623-10634. 301. Li, Y. Q., H. Z. Zhang, P. Davidovits, J. T. Jayne, C. E. Kolb and D. R. Worsnop, 2002, J. Phys. Chem. A,
106, 1220-1227. 302. Li, Z., R. R. Friedl, S. B. Moore and S. P. Sander, 1996, J. Geophys. Res., 101, 6795-6802. 303. Liberti, A., D. Brocco and M. Possanzini, 1978, Atmos. Environ., 12, 255-261. 304. Lind, J. A. and G. L. Kok, 1986, J. Goephys. Res., 91, 7889-7895. 305. Lind, J. A. and G. L. Kok, 1994, J. Geophys. Res., 99, 21119. 306. Livingston, F. E. and B. J. Finlayson-Pitts, 1991, Geophys. Res. Lett., 18, 17-21.

5-73
307. Longfellow, C. A., T. Imamura, A. R. Ravishankara and D. R. Hanson, 1998, J. Phys. Chem. A, 102, 3323-3332.
308. Longfellow, C. A., A. R. Ravishankara and D. R. Hanson, 1999, J. Geophys. Res., 104, 13833. 309. Longfellow, C. A., A. R. Ravishankara and D. R. Hanson, 2000, J. Geophys. Res., 105, 24,345-24,350. 310. Lovejoy, E. R., L. G. Huey and D. R. Hanson, 1995, J. Geophys. Res., 100, 18,775-18,780. 311. Luick, T. J., R. W. Heckbert, K. Schultz and R. S. Disselkamp, 1999, J. Atmos. Chem., 32, 315-325. 312. Luke, W. T., R. R. Dickerson and L. J. Nunnermacker, 1989, J. Geophys. Res., 94, 14905-14921. 313. Luo, B., K. S. Carslaw, T. Peter and S. L. Clegg, 1995, Geophys. Res. Lett., 22, 247-250. 314. Magi, L., F. Schweitzer, C. Pallares, S. Cherif, P. Mirabel and C. George, 1997, J. Phys. Chem. A, 4, 4943-
4948. 315. Manion, J. A., C. M. Fittschen, D. M. Golden, L. R. Williams and M. A. Tolbert, 1994, Israel J. Chem., 34,
355-363. 316. Marek, R. and J. Straub, 2001, Int. J. Heat Mass Transfer, 44, 39-53. 317. Martin, L. R., H. S. Judeikis and M. Wun, 1980, J. Geophys. Res., 85, 5511-5518. 318. Massucci, M., S. L. Clegg and P. Brimblecombe, 1999, J. Phys. Chem. A, 103, 4209-4226. 319. Mawhinney, D. B. and J. J. T. Yates, 2001, Carbon, 39, 1167-1173. 320. McMurry, P. H., H. Takano and G. R. Anderson, 1983, Environ. Sci. Technol., 17, 347-357. 321. Meisel, D. and G. Czapski, 1975, J. Phys. Chem., 79, 1503-1509. 322. Mental, T. F., M. Sohn and A. Wahner, 2000, Phys. Chem. Chem. Phys., 2, 5451-5457. 323. Mertes, S. and A. Wahner, 1995, J. Phys. Chem., 99, 14000-14006. 324. Michel, A. E., C. R. Usher and V. H. Grassian, 2002, Geophys. Res. Lett., 29, doi: 1029/2002/GL014896. 325. Michel, A. E., C. R. Usher and V. H. Grassian, 2003, Atmos. Environ., 37, 3201-3211. 326. Michelangeli, D. V., M. Allen and Y. L. Yung, 1991, Geophys. Res. Lett., 18, 673-676. 327. Middlebrook, A. M., L. T. Iraci, L. S. McNeil, B. G. Koehler, M. A. Wilson, O. W. Saastad and M. A.
Tolbert, 1993, J. Geophys. Res., 98, 20473-20481. 328. Middlebrook, A. M., B. G. Koehler, L. S. McNeill and M. A. Tolbert, 1992, Geophys. Res. Lett., 19, 2417-
2420. 329. Mihelcic, D., D. Klemp, P. Msgen, H. W. Ptz and A. Volz-Thomas, 1993, J. Atmos. Chem., 16, 313-335. 330. Miller, T. M. and V. H. Grassian, 1998, Geophys. Res. Lett., 25, 3835-3838. 331. Mochida, M., H. Akimoto, H. v. d. Bergh and M. J. Rossi, 1998, J. Phys. Chem. A, 102, 4819-4828. 332. Mochida, M., J. Hirokawa and H. Akimoto, 2000, Geophys. Res. Lett., 27, 2629-2632. 333. Mochida, M., J. Hirokawa, Y. Kajii and H. Akimoto, 1998, Geophys. Res. Lett., 25, 3927-3930. 334. Molina, M. J., R. F. Meads, D. D. Spencer and L. T. Molina, 1997, Geophys. Res. Lett., 24, 1619-1622. 335. Molina, M. J., T. L. Tso, L. T. Molina and F. C. Wang, 1987, Science, 238, 1253-1259. 336. Molina, M. J., R. Zhang, P. J. Woolridge, J. R. McMahon, J. E. Kim, H. Y. Chang and K. D. Beyer, 1993,
Science, 261, 1418-1423. 337. Moore, S. B., L. F. Keyser, M. T. Leu, R. P. Turco and R. H. Smith, 1990, Nature, 345, 333-335. 338. Mossinger, J. C., R. G. Hynes and R. A. Cox, 2002, J. Geophys. Res.,, 107, 4740. 339. Mozurkewich, M. and J. Calvert, 1988, J. Geophys. Res., 93, 15882-15896. 340. Mozurkewich, M., P. H. McMurray, A. Gupta and J. G. Calvert, 1987, J. Geophys. Res., 92, 4163-4170. 341. Msibi, I. M., Y. Li, J. P. Shi and R. M. Harrison, 1994, J. Atmos. Chem., 18, 291-300. 342. Msibi, I. M., J. P. Shi and R. M. Harrison, 1993, J. Atmos. Chem., 17339-17351. 343. Muenter, A. H. and B. G. Koehler, 2000, J. Phys. Chem. A, 104, 8527-8534. 344. Müller, B. and M. R. Heal, 2002, Phys. Chem. Chem. Phys.,, 4, 3365-3369. 345. Munder, B., H. Lidal and O. C. Sandall, 2000, J. Chem. Eng. Data, 45, 1201-1204. 346. Murray, B. J. and M. C. Plane, 2003, Phys. Chem. Chem. Phys., 107, 4129-4138. 347. Myhre, C. E. L., C. J. Nielsen and O. W. Saastad, 1998, J. Chem. Eng. Data, 43, 617-622. 348. Noyes, R. M., M. B. Rubin and P. G. Bowers, 1996, J. Phys. Chem., 100, 4167-4172. 349. O'Sullivan, D. W., M. Lee, B. C. Noone and B. G. Heikes, 1996, J. Phys. Chem., 100, 3241-3247. 350. Olszyna, K., R. D. Cadle and R. G. dePena, 1979, J. Geophys. Res., 84, 1771-1775. 351. Oppliger, R., A. Allanic and M. J. Rossi, 1997, J. Phys. Chem. A, 101, 1903-1911. 352. Oum, K. W., M. J. Lakin, D. O. DeHaan, T. Brauers and B. J. Finlayson-Pitts, 1998, Science. 353. Parker, V. D., 1992, J. Am. Chem. Soc., 114, 7458-7462. 354. Parker, V. D., 1992, Acta Chem. Scan., 45, 692-694. 355. Percival, C. J., J. C. Mossinger and R. A. Cox, 1999, Phys. Chem. Chem. Phys., 1, 4565-4570. 356. Peters, S. J. and G. E. Ewing, 1996, J. Phys. Chem., 100, 14093-14102. 357. Ponche, J. L., C. George and P. Mirabel, 1993, J. Atmos. Chem., 16, 1-21.

5-74
358. Poschl, U., M. Canagaratna, J. T. Jayne, L. T. Molina, D. R. Worsnop, C. E. Kolb and M. J. Molina, 1998, J. Phys. Chem. A, 102, 10,082-10,089.
359. Pöschl, U., T. Letzel, C. Schauer and R. Niessner, 2001, J. Phys. Chem. A, 105, 4029-4041. 360. Poskrebyshev, G. A., R. E. Huie and P. Neta, 2003, J. Phys. Chem. A, 107, 1964-1970. 361. Przyjazny, A., W. Janicki, W. Chrzanowski and R. Staszewski, 1984, J. Chromatogr., 280, 249-260. 362. Pueschel, R. F., D. F. Blake, A. G. Suetsinger, A. D. A. Hansen, S. Verma and K. Kato, 1992, Geophys.
Res. Lett., 19, 1659-1662. 363. Quinlan, M. A., C. M. Reihs, D. M. Golden and M. A. Tolbert, 1990, J. Phys. Chem., 94, 3255-3260. 364. Rattigan, O. V., J. Boniface, E. Swartz, P. Davidovits, J. T. Jayne, C. E. Kolb and D. R. Worsnop, 2000, J.
Geophys. Res., 105, 29,065-29,078. 365. Reihs, C. M., D. M. Golden and M. A. Tolbert, 1990, J. Geophys. Res., 95, 16,545-16,550. 366. Remorov, R. G., Y. M. Gershenzon, L. T. Molina and M. J. Molina, 2002, J. Phys. Chem. A, 106, 4558-
4565. 367. Rettich, T. R., R. Battino and E. Wilhelm, 1982, Ber. Bunsen. Phys. Chem., 86, 1128-1132. 368. Rettich, T. R., R. Battino and E. Wilhelm, 2000, J. Chem. Themo., 32, 1145-1156. 369. Rieley, H., H. D. Aslin and S. Haq, 1995, J. Chem. Soc. Faraday Trans., 91, 2349-2351. 370. Rinker, E. B. and O. C. Sandall, 2000, Can. J. Chem. Eng., 78, 232-236. 371. Rischbieter, E., H. Stein and A. Schumpe, 2000, J. Chem. Eng. Data, 45, 338-340. 372. Robbins, R. C. and R. D. Cadle, 1958, J. Phys. Chem., 62, 469-471. 373. Robinson, G. N., Q. Dai and A. Freedman, 1997, J. Phys. Chem., 101, 4947-4953. 374. Robinson, G. N., A. Freedman, C. E. Kolb and D. R. Worsnop, 1994, Geophys. Res. Lett., 21, 377-380. 375. Robinson, G. N., A. Freedman, C. E. Kolb and D. R. Worsnop, 1996, Geophys. Res. Lett., 23, 317. 376. Robinson, G. N., D. R. Worsnop, J. T. Jayne, C. E. Kolb and P. Davidovits, 1997, J. Geophys. Res., 102,
3583-3601. 377. Robinson, G. N., D. R. Worsnop, J. T. Jayne, C. E. Kolb, E. Swartz and P. Davidovits, 1998, J. Geophys.
Res., 103, 25371-25381. 378. Rodriguez-Sevilla, J., M. Alvarez, G. Liminana and M. C. Diaz, 2002, J. Chem. Engineer. Data, 47, 1339-
1345. 379. Roduner, E. and D. M. Bartels, 1992, Ber. Bunsenges. Phys. Chem., 96, 1037-1042. 380. Roeselová, M., P. Jungwirth, D. J. Tobias and R. B. Gerber, 2003, J. Phys. Chem. B.,, 107, 12690-12699. 381. Roeselová, M., J. Vieceli, L. X. Dang, B. C. Garrett and D. J. Tobias, 2004, J. Am. Chem. Soc.,, 126,
16308-16309. 382. Rogaski, C. A., D. M. Golden and L. R. Williams, 1997, Geophys. Res. Lett., 24, 381-384. 383. Rohrschneider, L., 1973, Anal. Chem., 45, 1241-1247. 384. Rossi, M. J., 2003, Chem Rev., 103, 4823-4882. 385. Rossi, M. J., F. F. Fenter, K. Tabor, F. Caloz and L. Gutzwiller. In Heterogeneous and Liquid Phase
Processes. Transport and Chemical Transformation of Pollutants in the Troposphere; P. Warneck, Ed.; Springer-Verlag. Berlin, 1996; pp 213-220.
386. Rossi, M. J., R. Malhotra and D. M. Golden, 1987, Geophys. Res. Lett., 14, 127-130. 387. Rubel, G. O. and J. W. Gentry, 1984, J. Aerosol Sci., 15, 661-671. 388. Rudich, Y., R. K. Talukdar, T. Imamura, R. W. Fox and A. R. Ravishankara, 1996, Chem. Phys. Lett., 261,
467-473. 389. Rudich, Y., R. K. Talukdar, A. R. Ravishankara and R. W. Fox, 1996, J. Geophys. Res., 101, 21023-21031. 390. Rudolf, R. and P. E. Wagner, 1994, J. Aerosol Sci., 25, 597-598. 391. Saastad, O. W., T. Ellerman and C. J. Nielson, 1993, Geophys. Res. Lett., 20, 1191-1193. 392. Saathoff, H., K.-H. Naumann, N. Riemer, S. Kamm, O. Möhler, U. Schurath, H. Vogel and B. Vogel, 2001,
Geophys. Res. Lett., 28, 1957-1960. 393. Salgado-Muñoz, M. S. and M. J. Rossi, 2002, Phys. Chem. Chem. Phys., 4, 5110-5118. 394. Sandanaga, Y., J. Hirokawa and H. Akimoto, 2001, Geophys. Res. Lett., 28, 4433-4436. 395. Santschi, C. and M. J. Rossi, 2004, Phys. Chem. Chem. Phys., 6, 3447-3460. 396. Scheer, V., A. Frenzel, W. Behnke, C. Zetsch, L. Magi, C. George and P. Mirabel, 1997, J. Phys. Chem. A,
101, 9359-9366. 397. Schroeder, W. H. and P. Urone, 1974, Environ. Sci. Technol., 8, 756-758. 398. Schumpe, A., 1993, Chem. Engineer. Sci., 48, 153-158. 399. Schurath, U., A. Bongartz, J. Kames, C. Wunderlich and T. Carstens. In Heterogeneous and Liquid Phase
Processes. Transport and Chemical Transformation of Pollutants in the Troposphere; P. Warneck, Ed.; Springer-Verlag: Berlin, 1996; Vol. 2; pp 182-189.
5-75
400. Schütze, M. and H. Herrmann, 2002, Phys. Chem. Chem. Phys.,, 4, 60-67. 401. Schütze, M. and H. Herrmann, 2004, Phys. Chem. Chem. Phys., 6, 965-971. 402. Schwartz, S. E., 1984, J. Geophys. Res., 89, 11589-11598. 403. Schwartz, S. E., 1988, Atmos. Environ., 22, 2331. 404. Schwartz, S. E. and W. H. White. In Trace Atmospheric Species. Properties, Transformations and Fates;
S. E. Schwartz, Ed.; John Wiley & Sons: New York, 1983; Vol. 12; pp 1-116. 405. Schwarz, H. A. and R. W. Dodson, 1984, J. Phys. Chem., 88, 3643-3647. 406. Schweitzer, F., L. Magi, P. Mirabel and C. George, 1998, J. Phys. Chem. A, 102, 593-600. 407. Schweitzer, F., P. Mirabel and C. George, 1998, J. Phys. Chem. A, 102, 3942-3952. 408. Schweitzer, F., P. Mirabel and C. George, 1999, J. Atmos. Chem., 34, 101-117. 409. Schweitzer, F., P. Mirabel and C. George, 2000, J. Phys. Chem. A, 104, 72-76. 410. Seisel, S., F. Caloz, F. F. Fenter, H. vandenBergh and M. J. Rossi, 1997, Geophys. Res. Lett., 24, 2757-
2760. 411. Seisel, S., B. Fluckiger, F. Caloz and M. J. Rossi, 1999, Phys. Chem. Chem. Phys., 1, 2257-2266. 412. Seisel, S., B. Fluckiger and M. J. Rossi, 1998, Ber. Bunsenges. Phys. Chem., 102, 811-820. 413. Shaw, R. A. and D. Lamb, 1999, J. Chem. Phys.,, 111, 10659-10663. 414. Shi, Q., P. Davidovits, J. T. Jayne, C. E. Kolb and D. R. Worsnop, 2001, J. Geophys. Res., 106, 24259-
24274. 415. Shi, Q., P. Davidovits, J. T. Jayne, D. R. Worsnop and C. E. Kolb, 1999, J. Phys. Chem. A, 103, 8812-
8823. 416. Shi, Q., Y. Q. Li, P. Davidovits, J. T. Jayne, D. R. Worsnop, M. Mozurkewich and C. E. Kolb, 1999, J.
Phys. Chem. B., 103, 2418-2420. 417. Shimono, A. and S. Koda, 1996, J. Phys. Chem., 100, 10,269-10,276. 418. Smith, D. M. and A. R. Chughtai, 1995, Colloids and Surfaces, 105, 47-77. 419. Smith, D. M. and A. R. Chughtai, 1996, J. Geophys. Res., 101, 19607-19620. 420. Smith, D. M. and A. R. Chughtai, 1997, J. Atmos. Chem., 26, 77-91. 421. Smith, D. M., W. F. Welch, S. M. Graham, A. R. Chughtai, B. G. Wicke and K. A. Grady, 1988, Appl.
Spectrosc., 42, 674-680. 422. Smith, D. M., W. F. Welch, J. A. Jassim, A. R. Chughtai and D. H. Stedman, 1988, Appl. Spectros., 42,
1473-1482. 423. Snider, J. R. and G. A. Dawson, 1985, J. Geophys. Res., 90, 3797-3805. 424. Stadler, D. and M. J. Rossi, 2000, Phys. Chem. Chem. Phys., 2, 5420-5429. 425. Staffelbach, T. A. and G. L. Kok, 1993, J. Geophys. Res., 98, 12713-12717. 426. Staudinger, J. and P. V. Roberts, 2001, Chemosphere, 44, 561-576. 427. Stephens, S., M. J. Rossi and D. M. Golden, 1986, Int. J. Chem. Kinetics, 18, 1133-1149. 428. Stewart, D. J. and R. A. Cox, 2004, Atmos. Chem. Phys. Discuss., 4, 569-590. 429. Sullivan, R. C., T. Thornberry and J. P. D. Abbatt, 2004, Atmos. Chem. Phys., 4, 1301-1310. 430. Sverdrup, G. M. and M. R. Kuhlman. "Heterogeneous Nitrogen Oxide-Particle Reactions"; 14th
International Colloquium on Atmospheric Pollution, 1980, Paris. 431. Swartz, E., Q. Shi, P. Davidovits, J. T. Jayne, D. Worsnop and C. E. Kolb, 1999, J. Phys. Chem. A, 103,
8824-8833. 432. Tabazadeh, A., R. P. Turco and M. Z. Jacobson, 1994, J. Geophys. Res., 99, 12,897-12,914. 433. Tabor, K., L. Gutzwiller and M. J. Rossi, 1993, Geophys. Res. Lett., 20, 1431-1434. 434. Tabor, K., L. Gutzwiller and M. J. Rossi, 1994, J. Phys. Chem., 98, 6172-7186. 435. Takami, A., S. Kato, A. Shimono and S. Koda, 1998, Chem. Phys.,, 231, 215-227. 436. Takami, A., T. Kondo, A. Kado and S. Koda, 2001, J. Atmos. Chem., 39, 139-153. 437. Tang, I. N. and J. H. Lee. In The Chemistry of Acid Rain; G. E. Gordon and R. W. Johnson, Eds.; Am.
Chem. Soc. Symp. Series, 1987; pp 109-117. 438. Tang, I. N. and H. R. Munkelwitz, 1989, J. Colloid Interface Sci., 128, 289-295. 439. Thomas, K., A. Volz-Thomas, D. Mihelcic, H. G. J. Smit and D. Kley, 1998, J. Atmos. Chem., 29, 17-43. 440. Timonen, R. S., L. T. Chu, M.-T. Leu and L. F. Keyser, 1994, J. Phys. Chem., 98, 9509-9517. 441. Tolbert, M. A., J. Praff, I. Jayaweera and M. J. Prather, 1993, J. Geophys. Res., 98, 2957-2962. 442. Tolbert, M. A., M. J. Rossi and D. M. Golden, 1988, Science, 240, 1018-1021. 443. Tolbert, M. A., M. J. Rossi and D. M. Golden, 1988, Geophys. Res. Lett., 15, 847-850. 444. Tolbert, M. A., M. J. Rossi, R. Malhotra and D. M. Golden, 1987, Science, 238, 1258-1260. 445. Tolocka, M., T. D. Saul and M. V. Johnston, 2004, J. Phys. Chem. A, 108, 2659-2665.

5-76
446. Toon, O., E. Browell, B. Gray, L. Lait, J. Livingston, P. Newman, R. Russell, P. P., M. Schoeberl, G. Toon, W. Traub, F. P. J. Valero, H. Selkirk and J. Jordan, 1993, Science, 261, 1136-1140.
447. Underwood, G. M., P. Li, H. A. Al-Abedeleh and V. H. Grassian, 2001, J. Phys. Chem. A, 105, 6609-6620. 448. Underwood, G. M., P. Li, C. R. Usher and V. H. Grassian, 2000, J. Phys. Chem. A, 104, 819-829. 449. Underwood, G. M., T. M. Miller and V. H. Grassian, 1999, J. Phys. Chem. A, 103, 6184-6190. 450. Underwood, G. M., C. H. Song, M. Phadnis, G. R. Carmichael and V. H. Grassian, 2001, J. Geophys. Res.,
106, 18055-18066. 451. Usher, C. R., H. Al-Hosney, S. Carlos-Cuellar and V. H. Grassian, 2002, J. Geophys. Res., 107, 4713. 452. Usher, C. R., A. E. Michel, D. Stec and V. H. Grassian, 2003, Atmos. Environ., 37, 5337-5347. 453. Utter, R. G., J. B. Burkholder, C. J. Howard and A. R. Ravishankara, 1992, J. Phys. Chem., 96, 4973-4978. 454. Van Dingenen, R. and F. Raes, 1991, Aerosol Sci. Technol., 15, 93-106. 455. Van Doren, J. M., L. R. Watson, P. Davidovits, D. R. Worsnop, M. S. Zahniser and C. E. Kolb, 1990, J.
Phys. Chem., 94, 3265-3269. 456. Van Doren, J. M., L. R. Watson, P. Davidovits, D. R. Worsnop, M. S. Zahniser and C. E. Kolb, 1991, J.
Phys. Chem., 95, 1684-1689. 457. Villalta, P. W., E. R. Lovejoy and D. R. Hanson, 1996, Geophys. Res. Lett., 23, 1765-1768. 458. Vitenberg, A. G., B. V. Ioffe, Z. S. Dimitrova and I. L. Butaeva, 1975, J. Chromatog., 112, 319-327. 459. Vogt, R., C. Elliott, H. C. Allen, J. M. .Laux, J. C. Hemminger and B. J. Finlayson-Pitts, 1996, Atmos.
Environ, 30, 1729-1737. 460. Vogt, R. and B. Finlayson-Pitts, 1994, J. Phys. Chem., 98, 3747-3755. 461. Vogt, R. and B. F. Finlayson-Pitts, 1994, Geophys. Res. Lett., 21, 2291-2294. 462. Vogt, R. and B. J. Finlayson-Pitts, 1995, J. Phys. Chem., 99, 13,052. 463. Wachsmuth, M., H. W. Gäggeler, R. v. Glasow and M. Ammann, 2002, Atmos. Chem. Phys., 2, 121-131. 464. Wagman, D. D., W. H. Evans, V. B. Parker, R. H. Schumm, I. Halow, S. M. Bailey, K. L. Churney and R.
L. Nutall, 1982, J. Phys. Chem. Ref. Data, 11, , Suppl. No. 1. 465. Wahner, A., T. F. Mental, M. Sohn and J. Stier, 1998, J. Geophys. Res., 103, 31103-31112. 466. Wang, L. and D. C. Clary, 1996, J. Chem. Phys., 104, 5663-5673. 467. Wardman, P., 1991, Free Rad. Res. Comm., 14, 57-67. 468. Waschewsky, G. C. G. and J. P. D. Abbatt, 1999, J. Phys. Chem. A, 103, 5312-5320. 469. Watson, L. R., J. M. V. Doren, P. Davidovits, D. R. Worsnop, M. S. Zahniser and C. E. Kolb, 1990, J.
Geophys. Res., 95, 5631-5638. 470. Watts, S. F. and P. Brimblecombe, 1987, Environ. Technol. Lett., 8, 483-486. 471. Weingartner, E., H. Burtscher and U. Baltensperger, 1997, Atmos. Environ., 31, 2311-2327. 472. Weisenberger, S. and A. Schumpe, 1996, AIChE Journal, 42, 298-300. 473. Wilhelm, E., R. Battino and R. J. Wilcock, 1977, Chem. Rev., 77, 219-262. 474. Williams, L. R. and D. M. Golden, 1993, Geophys. Res. Lett., 20, 2227-2230. 475. Williams, L. R., D. M. Golden and D. L. Huestis, 1995, J. Geophys. Res., 100, 7329-7335. 476. Williams, L. R. and F. S. Long, 1995, J. Phys. Chem., 99, 3748-3751. 477. Winkler, P., A. Vrtala, P. E. Wagner, M. Kulmula, K. E. J. Lehtinen and T. Vesala, 2004, Phys. Rev. Lett.,
93, doi: 10.1103/Phys.Rev.Lett93.075701. 478. Winkler, T., J. Goschnick and H. J. Ache, 1991, J. Aerosol Sci., 22, S605-S608. 479. Wolff, E. W. and R. Mulvaney, 1991, Geophys. Res. Lett., 18, 1007-1010. 480. Wong, P. K. and Y. H. Wang, 1997, Chemosphere, 35, 535-544. 481. Worsnop, D. R., L. E. Fox, M. S. Zahniser and S. C. Wofsy, 1993, Science, 259, 71-74. 482. Worsnop, D. R., L. R. Williams, C. E. Kolb, M. Mozurkewich, M. Gershenzon and P. Davidovits, 2004, J.
Phys. Chem. A, 108, 5846-5848. 483. Worsnop, D. R., M. S. Zahniser, C. E. Kolb, J. A. Gardner, L. R. Watson, J. M. V. Doren, J. T. Jayne and
P. Davidovits, 1989, J. Phys. Chem., 93, 1159-1172. 484. Yaws, C. L., J. R. Hopper, X. Wang and A. K. Rathinsamy, 1999, Chem. Eng., 102-105. 485. Yoshitake, H., 2000, Atmos. Environ., 34, 2571-2580. 486. Yoshizumi, K., K. Aoki, I. Nouchi, T. Okita, T. Kobayashi, S. Kamakura and M. Tajima, 1984, Atmos.
Environ., 18, 395-401. 487. Yu, X. Y. and J. R. Barker, 2003, J. Phys. Chem. A. 488. Zangmeister, C. D. and J. E. Pemberton, 2001, J. Phys. Chem. A, 105, 3788-3795. 489. Zangmeister, C. D. and J. E. Pemberton, 2004, J. Phys. Chem. A, 108, 236-236. 490. Zangmeister, C. D., J. A. Turner and J. E. Pemberton, 2001, Geophys. Res. Lett., 28, 995.

5-77
491. Zelenov, V. V., E. V. Aparina, M. Y. Gershenzon, S. D. Il'in and Y. M. Gershenzon, 2003, Khim. Fiz., 22, 58-70.
492. Zelenov, V. V., E. V. Aparina, M. Y. Gershenzon, S. D. Il'in and Y. M. Gershenzon, 2003, Khim. Fiz., 22, 37-48.
493. Zetzsch, C. and W. Behnke, 1992, Ber. Bunsenges. Phys. Chem., 96, 488-493. 494. Zhang, H. Z., Y. Q. Li, P. Davidovits, W. L. R., J. T. Jayne, C. E. Kolb and D. R. Worsnop, 2003, J. Phys.
Chem. A, 107, 6398-6407. 495. Zhang, R., J. T. Jayne and M. J. Molina, 1994, J. Phys. Chem., 98, 867-874. 496. Zhang, R. and M.-T. Leu, 1997, J. Geophys. Res., 102, 8837-8843. 497. Zhang, R., M.-T. Leu and L. F. Keyser, 1994, J. Phys. Chem., 98, 13,563-13,574. 498. Zhang, R., M.-T. Leu and L. F. Keyser, 1995, Geophys. Res. Lett., 22, 1493-1496. 499. Zhang, R., M.-T. Leu and L. F. Keyser, 1995, J. Geophys. Res., 100, 18,845-18,854. 500. Zhang, R., M.-T. Leu and L. F. Keyser, 1996, J. Phys. Chem., 100, 339-345. 501. Zhang, R., M.-T. Leu and L. F. Keyser, 1997, J. Phys. Chem. A, 101, 3324-3330. 502. Zhang, R., P. J. Wooldridge and M. J. Molina, 1993, J. Phys. Chem., 97, 8541-8548. 503. Zhou, X. and Y. N. Lee, 1992, J. Phys. Chem., 96, 265-272. 504. Zhou, X. and K. Mopper, 1990, Environ. Sci. Technol., 24, 1864-1869. 505. Zolensky, M. E., D. S. McKay and L. A. Kaczor, 1989, J. Geophys. Res., 94, 1047-1056. 506. Zondlo, M. A., S. B. Barone and M. A. Tolbert, 1998, J. Phys. Chem. A, 102, 5735-5748.


![RADIATION CHEMISTRY - KTH · 2015-03-23 · Radiation Chemistry in Heterogeneous systems Photochemistry in Heterogeneous systems THE MAXIMUM RATE CONSTANT [] [] V N e Solute k R R](https://static.fdocuments.in/doc/165x107/5e5a3c31e1689d6f160ca02c/radiation-chemistry-kth-2015-03-23-radiation-chemistry-in-heterogeneous-systems.jpg)