SECTION: 4.1 Data Analysis Based on Survey of...
47
125 CHAPTER 4 DATA PRESENTATION AND ANALYSIS INTRODUCTION This chapter has been divided in to four parts. The researcher has made an attempt to present the data in tabular form and analyze the same. The first section deals with the analysis pertaining to the farmers and its interpretations. The second section deals with the data related to commission agents, the third section covers the data and tables related processing units and the fourth section deals with the data related to hypothesis testing and its calculations. SECTION: 4.1 Data Analysis Based on Survey of Farmers Table No. 4.1: Classification of respondents on the basis of the size of farmers and type of land holding Land Type Respondents Dry Irrigated Dry & Irrigated Total Proportion of the total agricultural land Small Farmers (a) 56 (28%) 14 (7%) 18 (9%) 88 (44%) 17% Medium Farmers (b) 36 (18%) 4 (2%) 48 (24%) 90 (45%) 55% Big Farmers (c) 4 (2%) 0 (0%) 18 (9%) 22 (11%) 28% Total 96 (48%) 18 (9%) 86 (43%) 200 (100%) 100% Source: Survey Data Figures in the parentheses indicate percentages (a) 1 to 15 acres of agricultural land (b) 16 to 50 acres of agricultural land (c) Above 50 acres of agricultural land
Transcript of SECTION: 4.1 Data Analysis Based on Survey of...
125
CHAPTER 4 DATA PRESENTATION AND ANALYSIS
INTRODUCTION
This chapter has been divided in to four parts. The researcher has made an attempt
to present the data in tabular form and analyze the same.
The first section deals with the analysis pertaining to the farmers and its
interpretations. The second section deals with the data related to commission agents, the
third section covers the data and tables related processing units and the fourth section
deals with the data related to hypothesis testing and its calculations.
SECTION: 4.1 Data Analysis Based on Survey of Farmers
Table No. 4.1: Classification of respondents on the basis of the size of farmers and
type of land holding
Land Type
Respondents Dry Irrigated
Dry &
Irrigated
Total
Proportion
of the total
agricultural
land
Small
Farmers (a)
56
(28%)
14
(7%)
18
(9%)
88
(44%) 17%
Medium
Farmers (b)
36
(18%)
4
(2%)
48
(24%)
90
(45%) 55%
Big
Farmers (c)
4
(2%)
0
(0%)
18
(9%)
22
(11%) 28%
Total 96
(48%)
18
(9%)
86
(43%)
200
(100%) 100%
Source: Survey Data
Figures in the parentheses indicate percentages
(a) 1 to 15 acres of agricultural land
(b) 16 to 50 acres of agricultural land
(c) Above 50 acres of agricultural land
126
56
36
4
14
4
0
18
48
18
0
10
20
30
40
50
60
R
e
s
p
o
n
d
e
n
t
s
Dry Irrigated Dry & Irrigated
Type of Land
Classification of respondents on the basis of the size of farmers and type of land holding
Small Farmers Medium Farmers Big Farmers
Graph No. 4.1
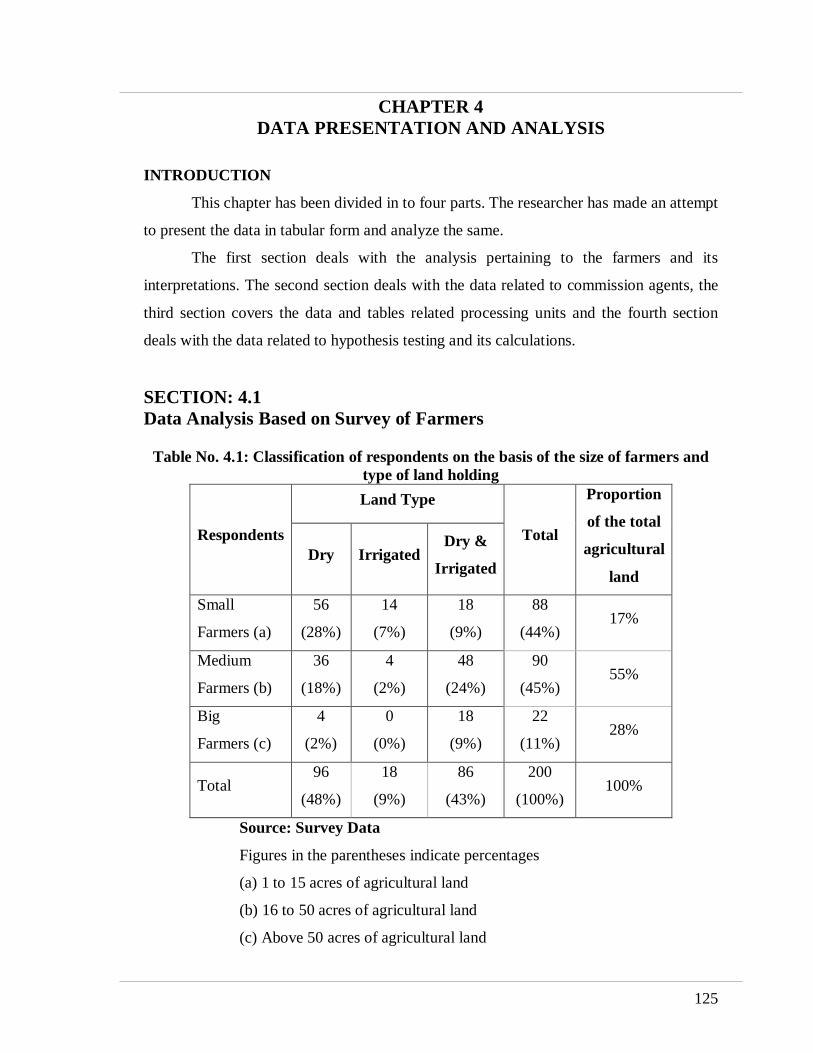
The above table presents the data related to the types of agricultural land and the
size farmers.
As per the data provided by table about 48% of the respondents possessed
completely dry land, 9% of the respondents had completely irrigated land and about 43%
of the respondents possessed both dry & irrigated land.
The respondents consisted of small, medium and big farmers. There were 44%
small farmers, (having 1 to 15 acres of land), 45% medium farmers (having 16 to 50
acres) and 11% big farmers (having 51 acres & above). The small and medium farmers
were more in number (89%) compared to big farmers (11%).
About 44% of the farmers were small farmers and the proportion of the total
agricultural land under small farmers was about 17%. The medium farmers who were
45% of the farmers had 55% of the total agricultural land and the big farmers who formed
11% of the total farmers possessed 28% of the total agricultural land. Compared to the
numbers of small farmers the land possessed by them was less whereas the big farmers
had more land compared to their numbers.
It was observed that about half of the respondents had complete dry agricultural
land and majority of them were small farmers. Majority of the medium and big farmers
had both dry & irrigated land. A small portion of farmers had completely irrigated land.
127
88
46
2 0
28
8
0
1612
0
10
20
30
40
50
60
70
80
90
R
e
s
p
o
n
d
e
n
t
s
1 to 10 11 to 20 21 & Above
Land in Acres
Classification of respondents on the basis of size and area under Tur Cultivation
Small Farmers Medium Farmers Big Farmers
Table No. 4.2 Classification of respondents on the basis of size and area under Tur Cultivation
Land (acres) Respondents
1 to 10 11 to 20 21 & Above Total
Small Farmers (a)
88 (44%)
0 (0%)
0 (0%)
88 (44%)
Medium Farmers (b)
46 (23%)
28 (14%)
16 (8%)
90 (45%)
Big Farmers (c)
2 (1%)
8 (4%)
12 (6%)
22 (11%)
Total 136
(68%) 36
(18%) 28
(14%) 200
(100%)
Proportion of land under Tur cultivation
12% 51% 37% 100%
Source: Survey Data
Figures in the parentheses indicate percentages
(a) 1 to 15 acres of agricultural land
(b) 16 to 50 acres of agricultural land
(c) Above 50 acres of agricultural land
Graph No. 4.2
128
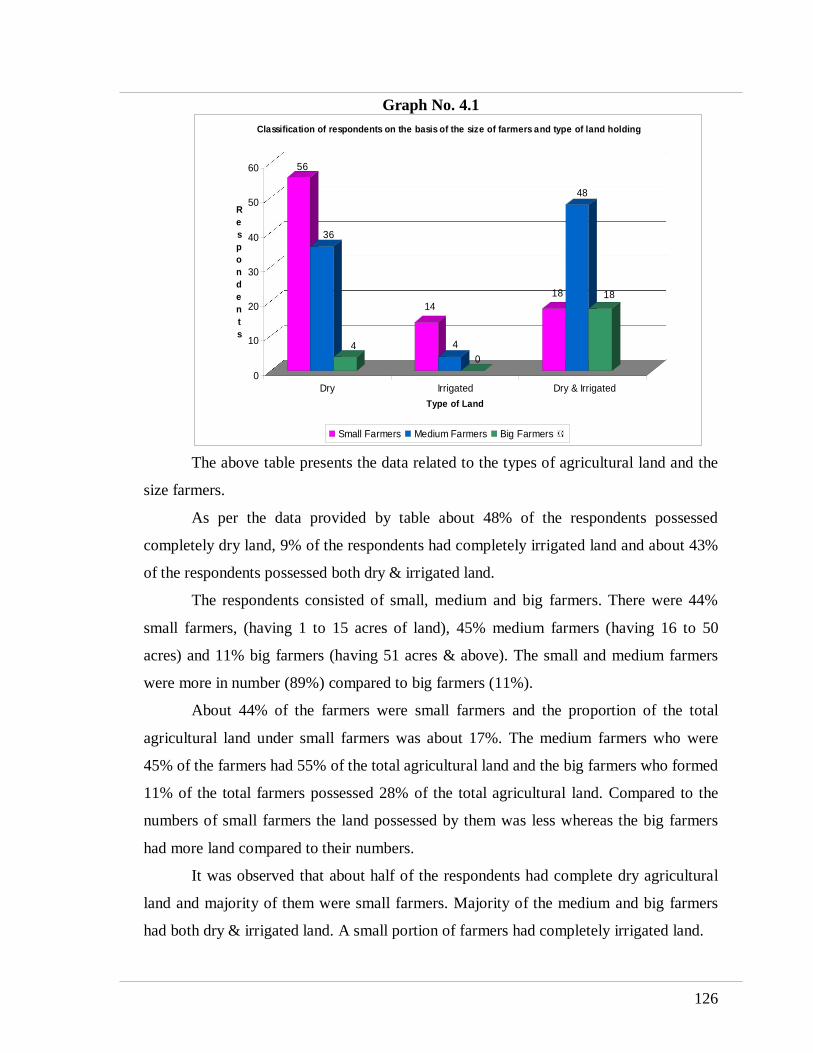
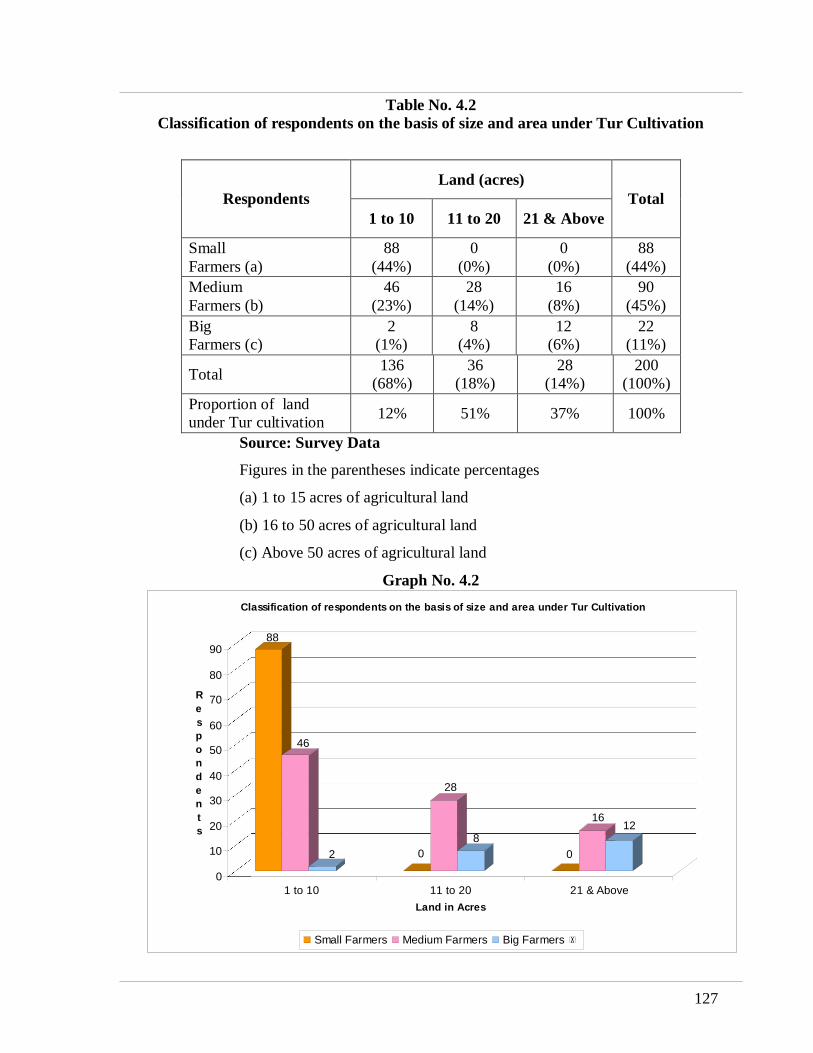
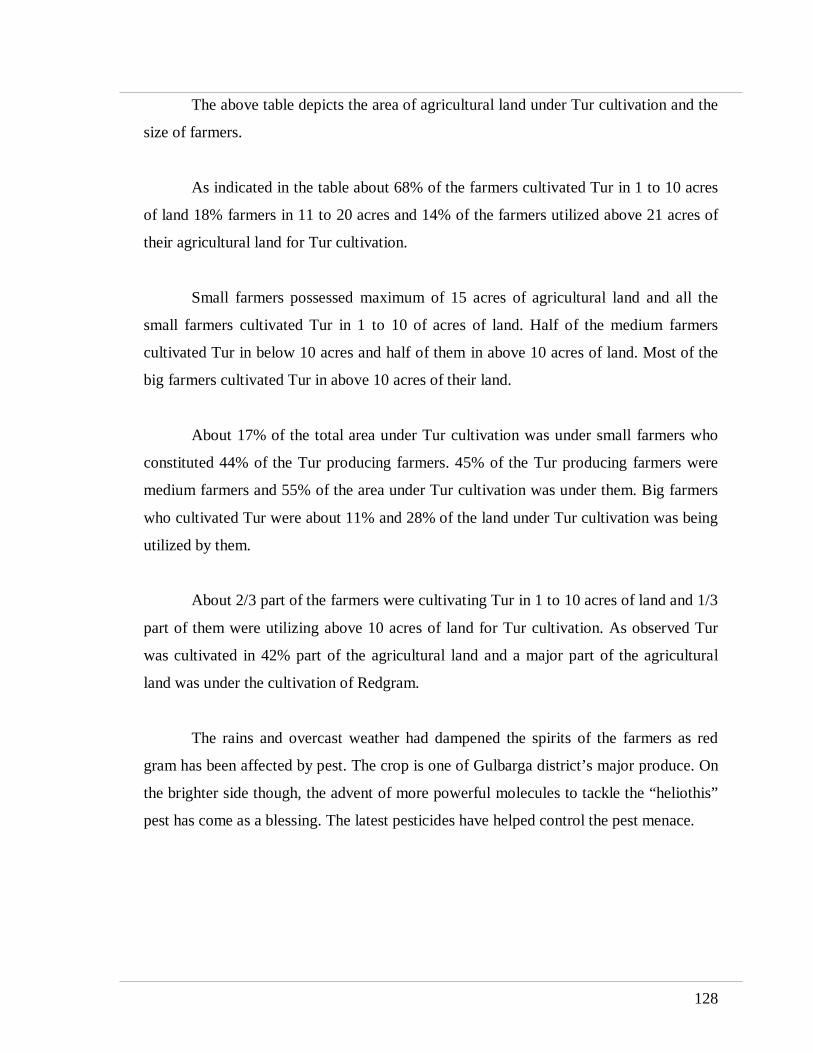
The above table depicts the area of agricultural land under Tur cultivation and the
size of farmers.
As indicated in the table about 68% of the farmers cultivated Tur in 1 to 10 acres
of land 18% farmers in 11 to 20 acres and 14% of the farmers utilized above 21 acres of
their agricultural land for Tur cultivation.
Small farmers possessed maximum of 15 acres of agricultural land and all the
small farmers cultivated Tur in 1 to 10 of acres of land. Half of the medium farmers
cultivated Tur in below 10 acres and half of them in above 10 acres of land. Most of the
big farmers cultivated Tur in above 10 acres of their land.
About 17% of the total area under Tur cultivation was under small farmers who
constituted 44% of the Tur producing farmers. 45% of the Tur producing farmers were
medium farmers and 55% of the area under Tur cultivation was under them. Big farmers
who cultivated Tur were about 11% and 28% of the land under Tur cultivation was being
utilized by them.
About 2/3 part of the farmers were cultivating Tur in 1 to 10 acres of land and 1/3
part of them were utilizing above 10 acres of land for Tur cultivation. As observed Tur
was cultivated in 42% part of the agricultural land and a major part of the agricultural
land was under the cultivation of Redgram.
The rains and overcast weather had dampened the spirits of the farmers as red
gram has been affected by pest. The crop is one of Gulbarga district’s major produce. On
the brighter side though, the advent of more powerful molecules to tackle the “heliothis”
pest has come as a blessing. The latest pesticides have helped control the pest menace.
129
6
86
04 2
15
02
6
62
0
18
0
10
20
30
40
50
60
70
80
90
R
e
s
p
o
n
d
e
n
t
s
Dry Irrigated Dry & Irrigated
Land Type
Cropping Pattern of Tur by the respondents
Rabi Kharif Summer Kharif & Rabi
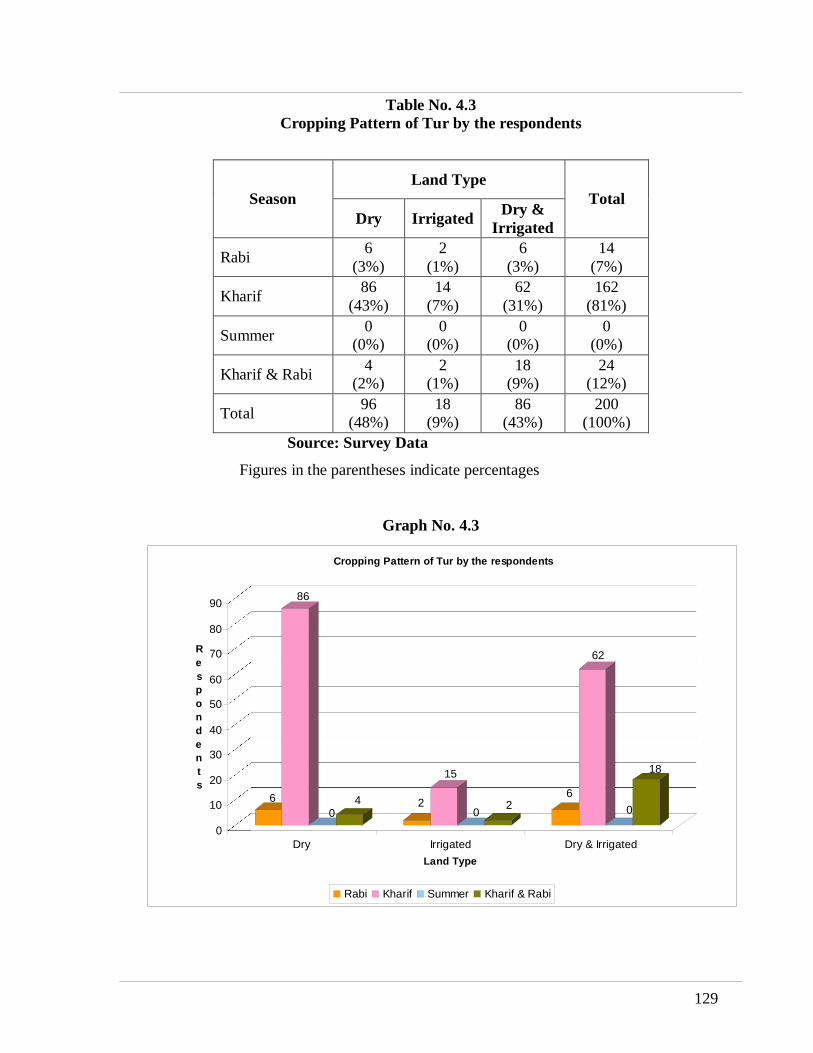
Table No. 4.3 Cropping Pattern of Tur by the respondents
Land Type Season
Dry Irrigated Dry &
Irrigated
Total
Rabi 6
(3%) 2
(1%) 6
(3%) 14
(7%)
Kharif 86
(43%) 14
(7%) 62
(31%) 162
(81%)
Summer 0
(0%) 0
(0%) 0
(0%) 0
(0%)
Kharif & Rabi 4
(2%) 2
(1%) 18
(9%) 24
(12%)
Total 96
(48%) 18
(9%) 86
(43%) 200
(100%)
Source: Survey Data
Figures in the parentheses indicate percentages
Graph No. 4.3

130
The data presented in above table indicates the cropping pattern of Tur by the
farmers.
As per the data, about 81% of the farmers cultivated Tur in kharif season, 7% in
Rabi season and 12% of the farmers cultivated Tur in both Rabi and kharif seasons.
Most of the farmers cultivated Tur in kharif season. About 43% complete dry land
farmers, 31% both dry & irrigated and 7% irrigated land farmers cultivated Tur in kharif
season.
It was observed that most of the farmers cultivated Tur in kharif season and
majority of the agricultural land was under Tur cultivation during kharif season.
In the rainfed and dry areas Redgram are sown with the onset of the monsoon.
Earlier sowing gives higher yield in India. Late sowing causes considerable reduction in
yield due to photoperiodicity and excessive soil moisture stress which coincides with the
reproductive growth (Chandra et.al 1983).
Table No. 4.4
Land under different varieties of Tur Variety of Tur
Area (Acre) Benur BSMR Gulelle Maruti
Kempu gulellu
Total
1 to 10 22
(11%) 6
(3%) 26
(13%) 62
(31%) 18
(9%) 136
(68%)
11 to 20 16
(8%) 0
(0%) 0
(0%) 18
(9%) 2
(1%) 36
(18%)
21 & Above 10
(5%) 0
(0%) 0
(0%) 18
(9%) 0
(0%) 28
(14%)
Total 48
(24%) 6
(3%) 26
(13%) 98
(49%) 20
(10%) 200
(100%) Proportion of land under
cultivation 28% 2% 5% 60% 5% 100%
Proportion of Total Yield 21% 2% 15% 49% 12% 100%
Source: Survey Data
Figures in the parentheses indicate percentages
131
22
6
26
62
18 16
0 0
18
2
10
0 0
18
0
0
10
20
30
40
50
60
70
R
e
s
p
o
n
d
e
n
t
s
1 to 10 11 to 20 21 & Above
Land in Acres
Land under different varieties of Tur
Benur BSMR Gulelle Maruti Kempu gulellu
Graph No. 4.4
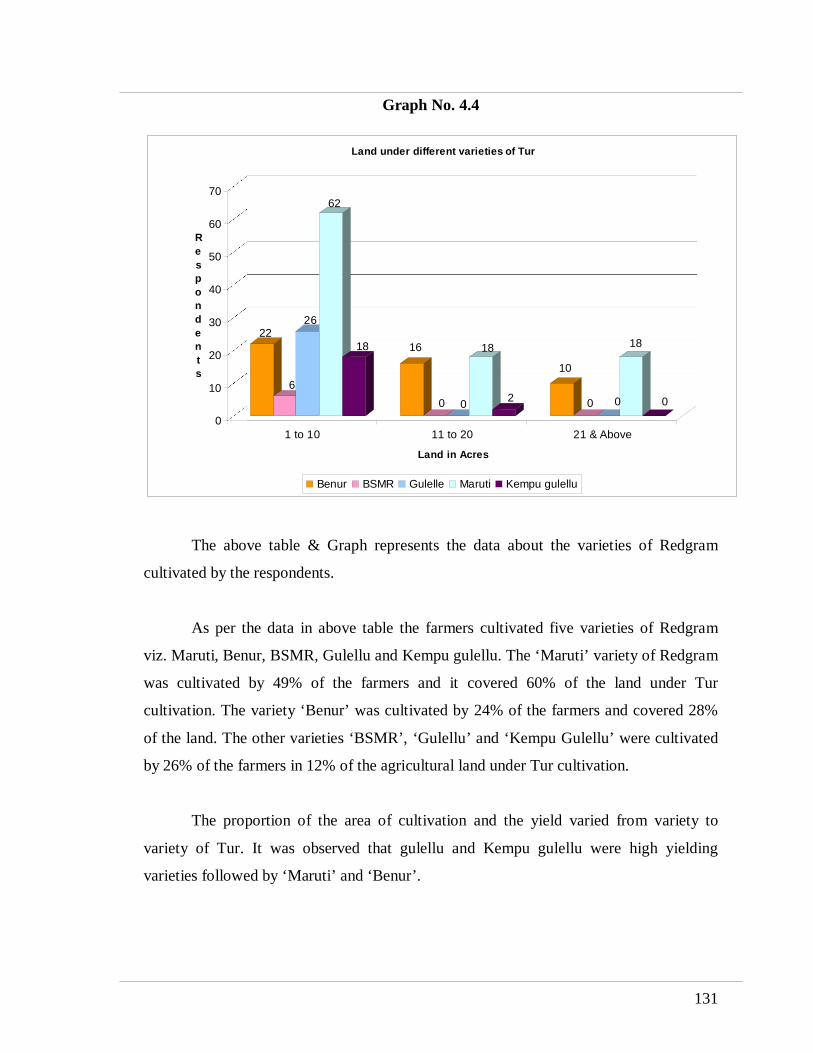
The above table & Graph represents the data about the varieties of Redgram
cultivated by the respondents.
As per the data in above table the farmers cultivated five varieties of Redgram
viz. Maruti, Benur, BSMR, Gulellu and Kempu gulellu. The ‘Maruti’ variety of Redgram
was cultivated by 49% of the farmers and it covered 60% of the land under Tur
cultivation. The variety ‘Benur’ was cultivated by 24% of the farmers and covered 28%
of the land. The other varieties ‘BSMR’, ‘Gulellu’ and ‘Kempu Gulellu’ were cultivated
by 26% of the farmers in 12% of the agricultural land under Tur cultivation.
The proportion of the area of cultivation and the yield varied from variety to
variety of Tur. It was observed that gulellu and Kempu gulellu were high yielding
varieties followed by ‘Maruti’ and ‘Benur’.
132
6
0 0
44
14
4
36
64
42
10
24
6
10
0
5
10
15
20
25
30
35
40
45
R
e
s
p
o
n
d
e
n
t
s
1 to 10 11 to 20 21 to 30 31 to 40 41 to 50
Yield in Quintals
Yield on Tur cultivation
1 to 10 11 to 20 21 & Above
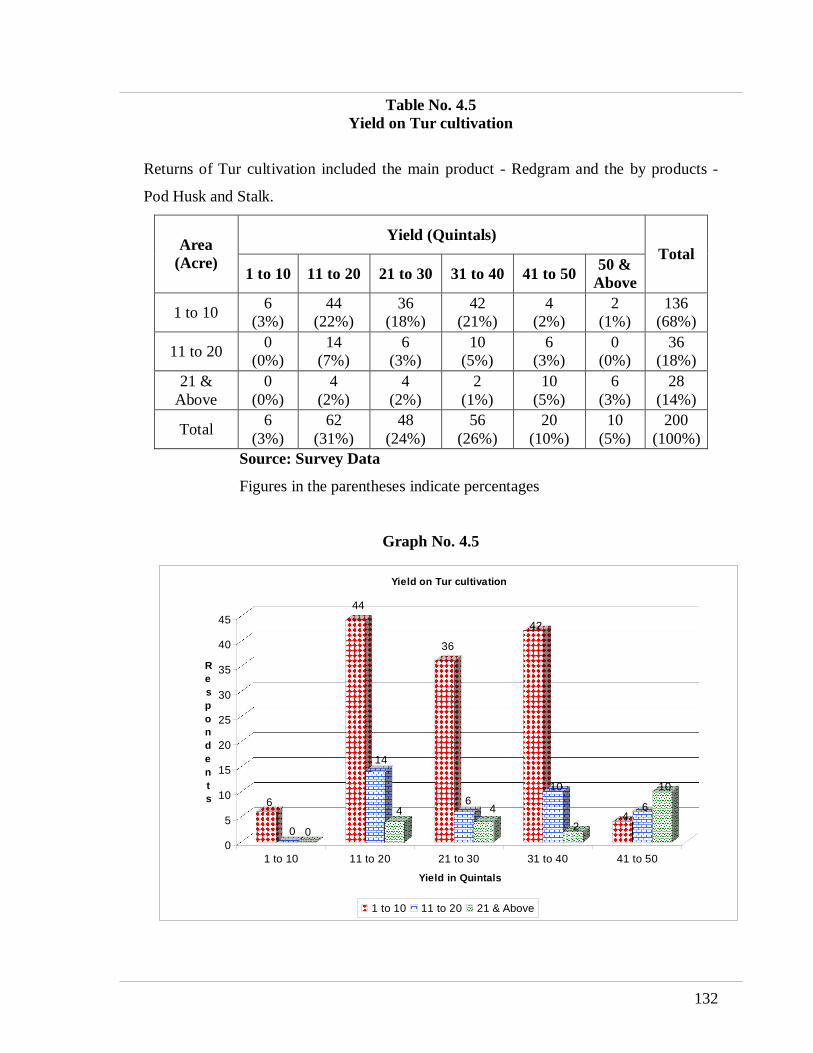
Table No. 4.5 Yield on Tur cultivation
Returns of Tur cultivation included the main product - Redgram and the by products -
Pod Husk and Stalk.
Yield (Quintals) Area
(Acre) 1 to 10 11 to 20 21 to 30 31 to 40 41 to 50
50 & Above
Total
1 to 10 6
(3%) 44
(22%) 36
(18%) 42
(21%) 4
(2%) 2
(1%) 136
(68%)
11 to 20 0
(0%) 14
(7%) 6
(3%) 10
(5%) 6
(3%) 0
(0%) 36
(18%)
21 & Above
0 (0%)
4 (2%)
4 (2%)
2 (1%)
10 (5%)
6 (3%)
28 (14%)
Total 6
(3%) 62
(31%) 48
(24%) 56
(26%) 20
(10%) 10
(5%) 200
(100%)
Source: Survey Data
Figures in the parentheses indicate percentages
Graph No. 4.5

133
8890
2217
55
28
3439
27
0
10
20
30
40
50
60
70
80
90
R
e
s
p
o
n
d
e
n
t
s
Respondents Proportion of Tur Cultivated
Land
Proportion of Total Yield
Different types of Yield
Tur yield obtained by the respondents
Small Farmers Medium Farmers Big Farmers
As per the data provided in above table 68% of the farmers cultivated Tur in 1 to
10 acres of land and these farmers were able to produce 1 to 50 qtls of Tur. 18% of the
farmers cultivated Tur in 11 to 20 acres of land and the yield of these farmers ranged
from 11 qtls to 50 qtls. 14% of the farmers who cultivated Tur in above 20 acres of land
under Tur cultivation. Majority of the farmers cultivated Tur in 1 acre to 10 acres of land
and were getting yields in the range of 11 qtls to 50 qtls.
Table No 4.6 Tur yield obtained by the respondents
Farmers Respondents Proportion of Tur Cultivated Land
Proportion of Total Yield
Small Farmers (a)
88 (44%) 17% 34%
Medium Farmers (b)
90 (45%) 55% 39%
Big Farmers (c)
22 (11%) 28% 27%
Total 200 (100%) 100% 100%
Source: Survey Data
Figures in the parentheses indicate percentages
(a) 1 to 15 acres of agricultural land (b) 16 to 50 acres of agricultural land (c) Above 50 acres of agricultural land
Graph No. 4.6
134
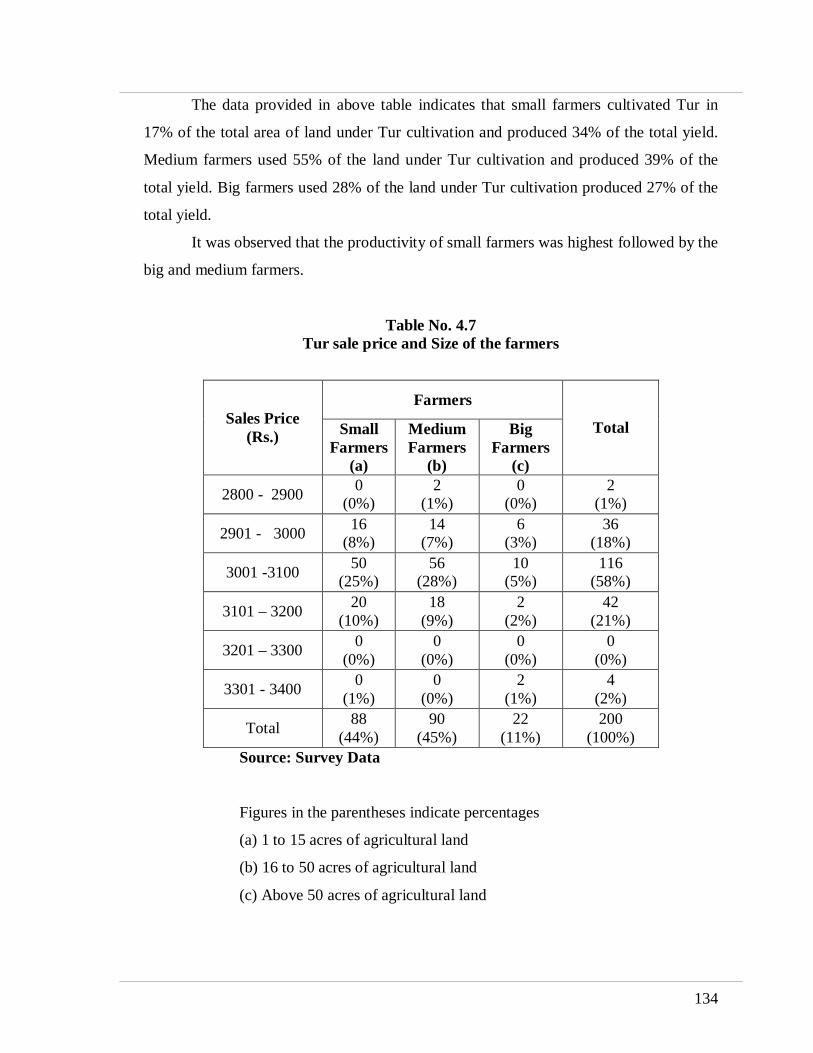
The data provided in above table indicates that small farmers cultivated Tur in
17% of the total area of land under Tur cultivation and produced 34% of the total yield.
Medium farmers used 55% of the land under Tur cultivation and produced 39% of the
total yield. Big farmers used 28% of the land under Tur cultivation produced 27% of the
total yield.
It was observed that the productivity of small farmers was highest followed by the
big and medium farmers.
Table No. 4.7 Tur sale price and Size of the farmers
Farmers Sales Price
(Rs.) Small Farmers
(a)
Medium Farmers
(b)
Big Farmers
(c)
Total
2800 - 2900 0
(0%) 2
(1%) 0
(0%) 2
(1%)
2901 - 3000 16
(8%) 14
(7%) 6
(3%) 36
(18%)
3001 -3100 50
(25%) 56
(28%) 10
(5%) 116
(58%)
3101 – 3200 20
(10%) 18
(9%) 2
(2%) 42
(21%)
3201 – 3300 0
(0%) 0
(0%) 0
(0%) 0
(0%)
3301 - 3400 0
(1%) 0
(0%) 2
(1%) 4
(2%)
Total 88
(44%) 90
(45%) 22
(11%) 200
(100%)
Source: Survey Data
Figures in the parentheses indicate percentages
(a) 1 to 15 acres of agricultural land
(b) 16 to 50 acres of agricultural land
(c) Above 50 acres of agricultural land

135
0
16
50
20
0 0
2
14
56
18
0 00
16
10
20
2
0
10
20
30
40
50
60
R
e
s
p
o
n
d
e
n
t
s
Small Farmers Medium Farmers Big Farmers
Types of Farmers
Tur sale price and Size of the farmers
2800 - 2900 2901 - 3000 3001 -3100 3101 – 3200 3201 – 3300 3301 - 3400
Graph No. 4.7
In the markets sales prices of Tur were found to vary in the range of Rs 2900 per
quintal to Rs 3400 per quintal. Majority of the farmers were able to sell their produce at
the price of Rs 3100 per quintal a price very close to the average sales price of Rs 3108
per quintal. It was observed that there was not much price deviation in the markets.
Majority of the farmers sold Tur at a price which was almost equal to the overall average
sales price in the market. Most of the farmers were selling their produce in the range of
Rs +100 to -100 of the average sales price in the market.
In the liberalized trade environments there are several aspects with which the
farmer needs to be familiarized regularly to enable him to plan his production for best
returns. This is possible only through constant market research and making their findings
available to farmers in the form of an advisory service. The Farmers Advisory System
will help the farmers in adopting good marketing practices. It will help him in taking
decisions such as which commodities to produce; how much to produce; how much to
sell and at what price, etc.
136
6
56
110
0
18
10
0
20
40
60
80
100
120
R
e
s
p
o
n
d
e
n
t
s
For Sale Domestic use/seeds
Purpose
Storage pattern of Tur by the farmers
1 to 4 5 to 8 9 to 12
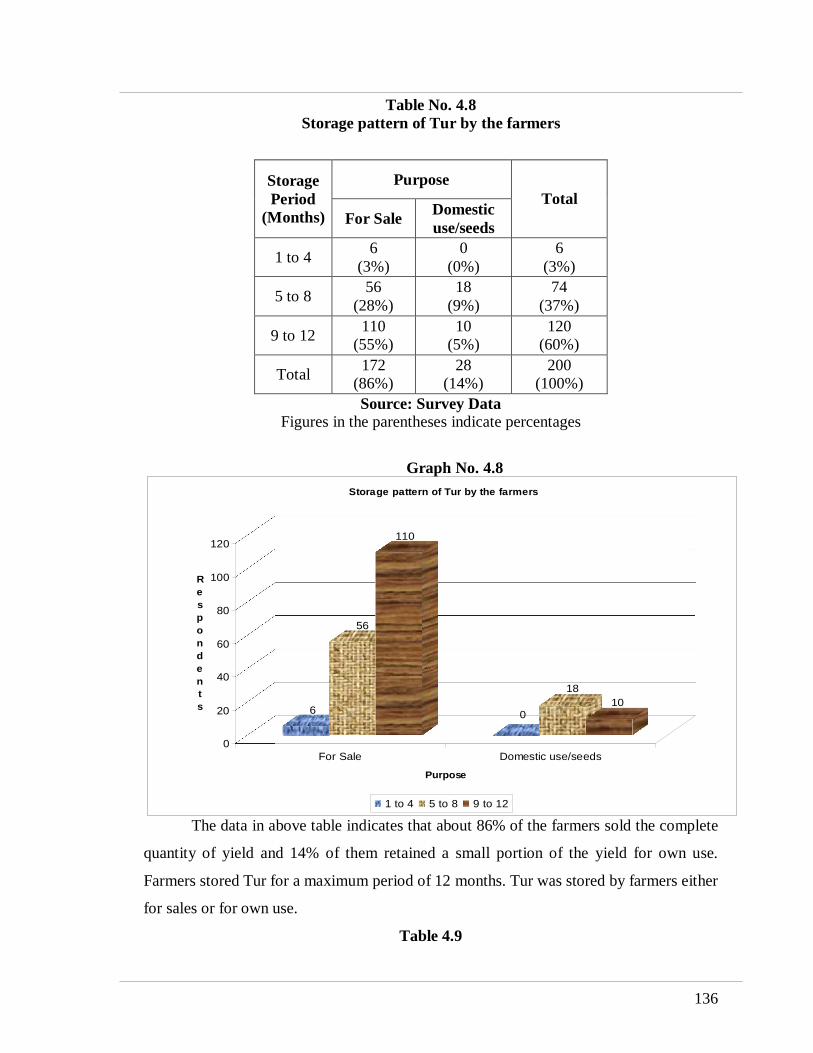
Table No. 4.8 Storage pattern of Tur by the farmers
Purpose Storage Period
(Months) For Sale Domestic use/seeds
Total
1 to 4 6
(3%) 0
(0%) 6
(3%)
5 to 8 56
(28%) 18
(9%) 74
(37%)
9 to 12 110
(55%) 10
(5%) 120
(60%)
Total 172
(86%) 28
(14%) 200
(100%)
Source: Survey Data Figures in the parentheses indicate percentages
Graph No. 4.8
The data in above table indicates that about 86% of the farmers sold the complete
quantity of yield and 14% of them retained a small portion of the yield for own use.
Farmers stored Tur for a maximum period of 12 months. Tur was stored by farmers either
for sales or for own use.
Table 4.9

137
715
447
1073 1162
2235
1073
894
626 715
0
500
1000
1500
2000
2500
R
e
s
p
o
n
d
e
n
t
s
Land
Preparation
FYM Seeds &
Sow ing
Fertilizer and
its
Application
PPC Weeding &
Hoeing
Harvesting Threshing Winnow ing /
Bagging
Field Operations
Cost of cultivation incurred by the farmers
Average Expenses (Rs/Acre)
Cost of cultivation incurred by the farmers
Field Operations Average Expenses
(Rs/Acre) Proportion
(%)
Land Preparation 715 8%
FYM 447 5%
Seeds & Sowing 1073 12%
Fertilizer and its Application 1162 13%
PPC 2235 25%
Weeding & Hoeing 1073 12%
Harvesting 894 10%
Threshing 626 7%
Winnowing / Bagging 715 8%
Total 8940 100%
Source: Survey Data Figures in the parentheses indicate percentages
Graph No. 4.9

138
The above table presents the data related to the costs of cultivation incurred by
farmers. The data indicates that the cost of cultivation consisted of the expenses on
different materials and field operations. The expenses on materials included purchasing
of seeds, manures, fertilizers and plant protection chemicals. The expenses on field
operations included land preparation, sowing, application of fertilizers and plant
protection chemicals, weeding, hoeing, harvesting, threshing, winnowing, and bagging.
The expenses on the plant protection chemicals (25%) constituted a major
component of the cost of cultivation. Other major expenses were fertilizers and
application (13%), weeding and hoeing (12%) seeds and sowing (12%). The expenses on
the operations of harvesting, threshing, winnowing and bagging combined together
formed 25% of the cost of cultivation.
Pigeonpea pod borer, Helicoverpa armigera Hubner is the most devastating pest
causing damage up to 90 to 100%. To curtain the menace farmers are mainly relying on
chemicals. Farmer take up 10 to 12 sprays in a period of two months. This unilateral
approach of pest management has caused several un-warranted repercussions.
The vermicompost is one of the integral parts of organic farming. 1 Kg worms
after three months these worms are multiplied by 5 folds and also produce 6 quintals of
compost per pit. In order to reduce pest menace organic farming is the need of the hour
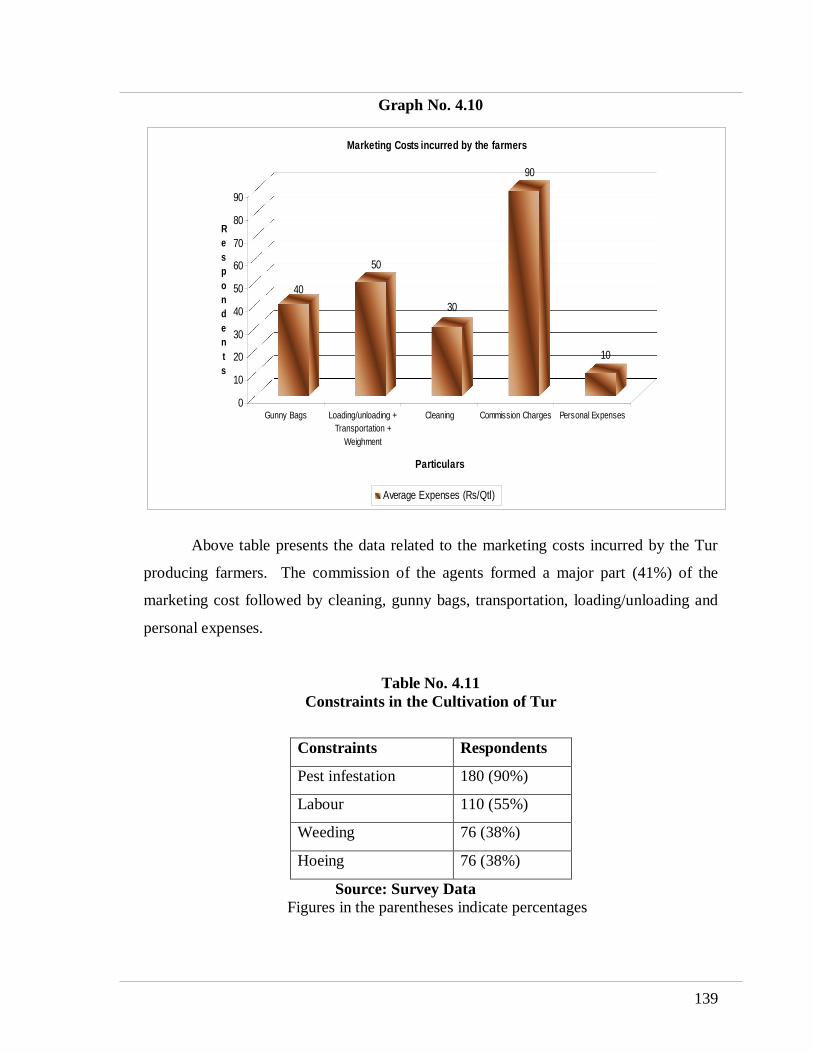
Table No. 4.10 Marketing Costs incurred by the farmers
Particulars Average Expenses (Rs/Qtl) Proportion
Gunny Bags 40 18%
Loading/unloading + Transportation + Weighment
50 23%
Cleaning 30 14%
Commission Charges 90 41%
Personal Expenses 10 4%
Total 220 100%
Source: Survey Data Figures in the parentheses indicate percentages
139
40
50
30
90
10
0
10
20
30
40
50
60
70
80
90
R
e
s
p
o
n
d
e
n
t
s
Gunny Bags Loading/unloading +
Transportation +
Weighment
Cleaning Commission Charges Personal Expenses
Particulars
Marketing Costs incurred by the farmers
Average Expenses (Rs/Qtl)
Graph No. 4.10
Above table presents the data related to the marketing costs incurred by the Tur
producing farmers. The commission of the agents formed a major part (41%) of the
marketing cost followed by cleaning, gunny bags, transportation, loading/unloading and
personal expenses.
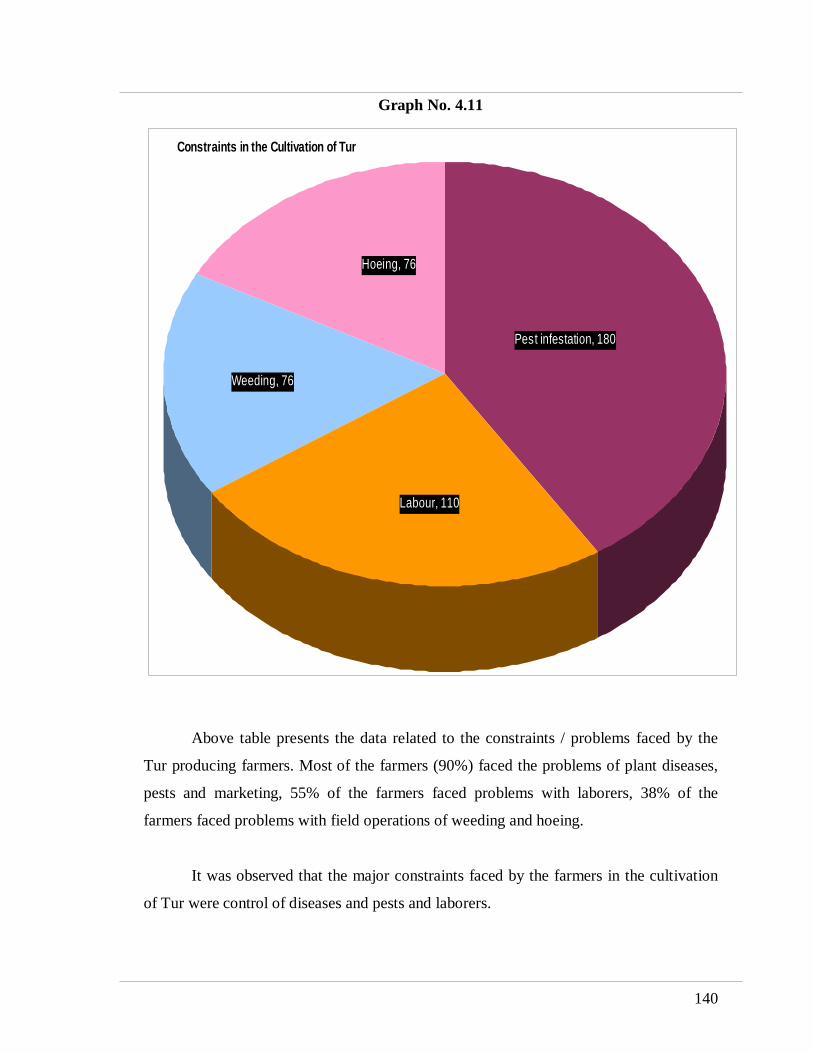
Table No. 4.11 Constraints in the Cultivation of Tur
Constraints Respondents
Pest infestation 180 (90%)
Labour 110 (55%)
Weeding 76 (38%)
Hoeing 76 (38%)
Source: Survey Data Figures in the parentheses indicate percentages
140
Constraints in the Cultivation of Tur
Hoeing, 76
Weeding, 76
Labour, 110
Pest infestation, 180
Graph No. 4.11
Above table presents the data related to the constraints / problems faced by the
Tur producing farmers. Most of the farmers (90%) faced the problems of plant diseases,
pests and marketing, 55% of the farmers faced problems with laborers, 38% of the
farmers faced problems with field operations of weeding and hoeing.
It was observed that the major constraints faced by the farmers in the cultivation
of Tur were control of diseases and pests and laborers.

141
SECTION: 4.2 Data Analysis Based on Survey of Middleman
The market intermediaries acted between the producers and processors of
Redgram. They acted as purchasers for producers of Tur and sellers for processors of Tur.
In the activities of purchasing and selling middlemen earned profits as commission. The
commission agents, wholesale agents and co-operative societies etc, acted as market
intermediaries.
In the marketing of Redgram there were different market intermediaries having
different years of experience, different capacities of handling Redgram and employing
different number of laborers.
Table No. 4.12 Classification of Commission agents on the basis of the experience in to the business
Years No. of Respondents
(Commission Agents)
1 to 5 5 (10%)
6 to 10 21 (42%)
11 to 15 6 (12%)
16 to 20 9 (18%)
21 to 25 4 (8%)
26 to 30 3 (6%)
31 & Above 2 (4%)
Total 50 (100%)
Source: Survey Data
Figures in the parentheses indicate percentages

142
Classification of Commission agents on the basis of the experience in to the business
1 to 5
6 to 10
11 to 15
16 to 20
21 to 25
26 to 30
31 & Above
1 to 5
6 to 10
11 to 15
16 to 20
21 to 25
26 to 30
31 & Above
Graph No. 4.12
The concept of middleman who intervenes between the farmer and the ultimate
consumer, profiting in the act, is an old socialist augment, one which ultimately leads to
Government controlled monopolies.
Above table presents the data related to the business experience of respondents.
The data indicates that 5% of the market intermediaries were in to this business for more
than 30 years. The respondents who were in to this business since 21 to 30 years were
about 13% and 31% of the middlemen were in to this business since 11 to 20 years. The
respondents who were in to this business since 10 years constituted 51% of the
respondents
It was observed that the number of persons entering into the business of
marketing Tur as middleman was increasing.
143
Quantity of Tur handled by Middleman
20
14 16
1 – 400
401 – 600
Above 600
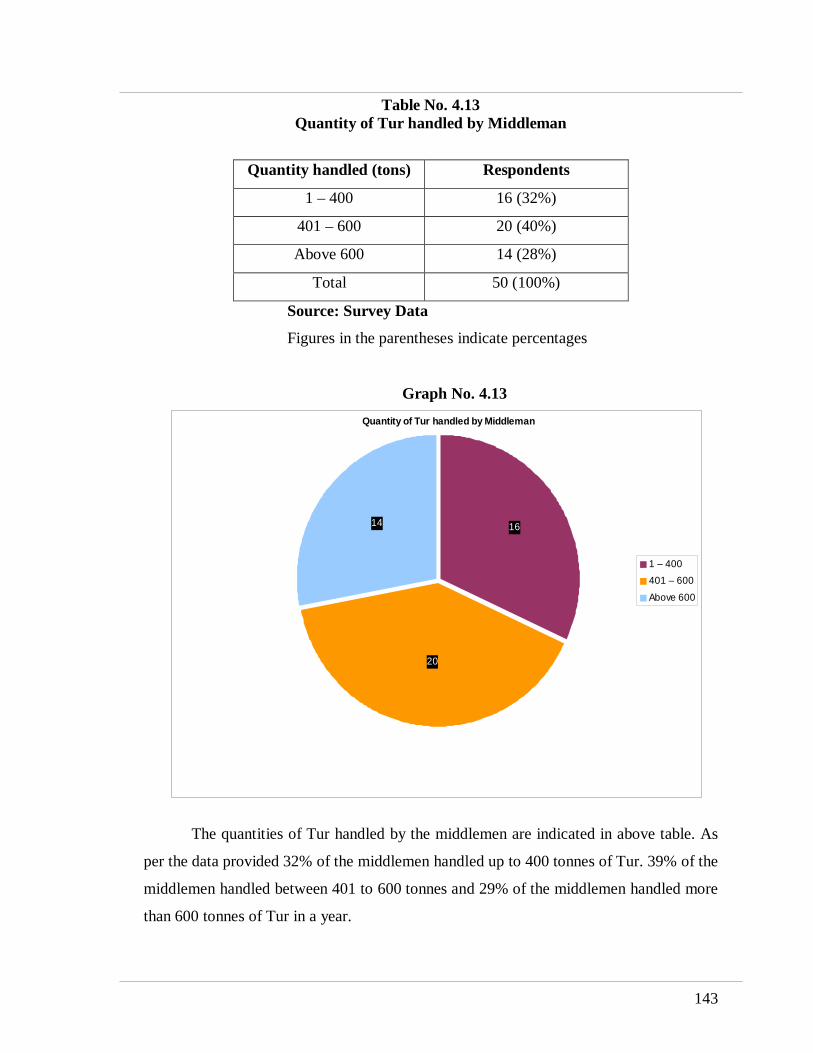
Table No. 4.13 Quantity of Tur handled by Middleman
Quantity handled (tons) Respondents
1 – 400 16 (32%)
401 – 600 20 (40%)
Above 600 14 (28%)
Total 50 (100%)
Source: Survey Data
Figures in the parentheses indicate percentages
Graph No. 4.13
The quantities of Tur handled by the middlemen are indicated in above table. As
per the data provided 32% of the middlemen handled up to 400 tonnes of Tur. 39% of the
middlemen handled between 401 to 600 tonnes and 29% of the middlemen handled more
than 600 tonnes of Tur in a year.

144
Employment of laborers by the middleman
0
5
10
15
20
25
30
1 2 3 4
Number of Labors
R
e
s
p
o
n
d
e
n
t
s
Casual labor Permanent
A major part of market intermediaries handled quantities of Tur in the range of
401 to 600 tonnes followed by the market intermediaries who handled up to 400 tonnes
and the middlemen handling above 600 tonnes of Tur.
Table No. 4.14 Employment of laborers by the middleman
Type of labor No. of Labors
Casual labor Permanent 1 Nil 27 (54%) 2 14 (28%) 18 (36%) 3 20 (40%) 4 (8%) 4 16 (32%) 1 (2%) Source: Survey Data
Figures in the parentheses indicate percentages
Graph No. 4.14
Above table gives the details of the laborers employed by market intermediaries.
The data shows the numbers and type of employment of the laborers.
Majority of the market intermediaries (53%) employed one labor on permanent
basis. Where as 41% of the middlemen employed three laborers on casual basis. No
145
Facilities provided to farmers by the middleman
0
10
20
30
40
50
60
Storage Transport Loading / Un
loading
Gunny Bags Credit Inputs to farmers
Facilities
Res
po
nd
en
ts
middlemen employed single casual labor. It was observed that most of the middlemen
employed 1 to 2 permanent laborers and 2 to 3 casual laborers. On an average the
middlemen employed 5 laborers out of which 2 were permanent and 3 were casual.
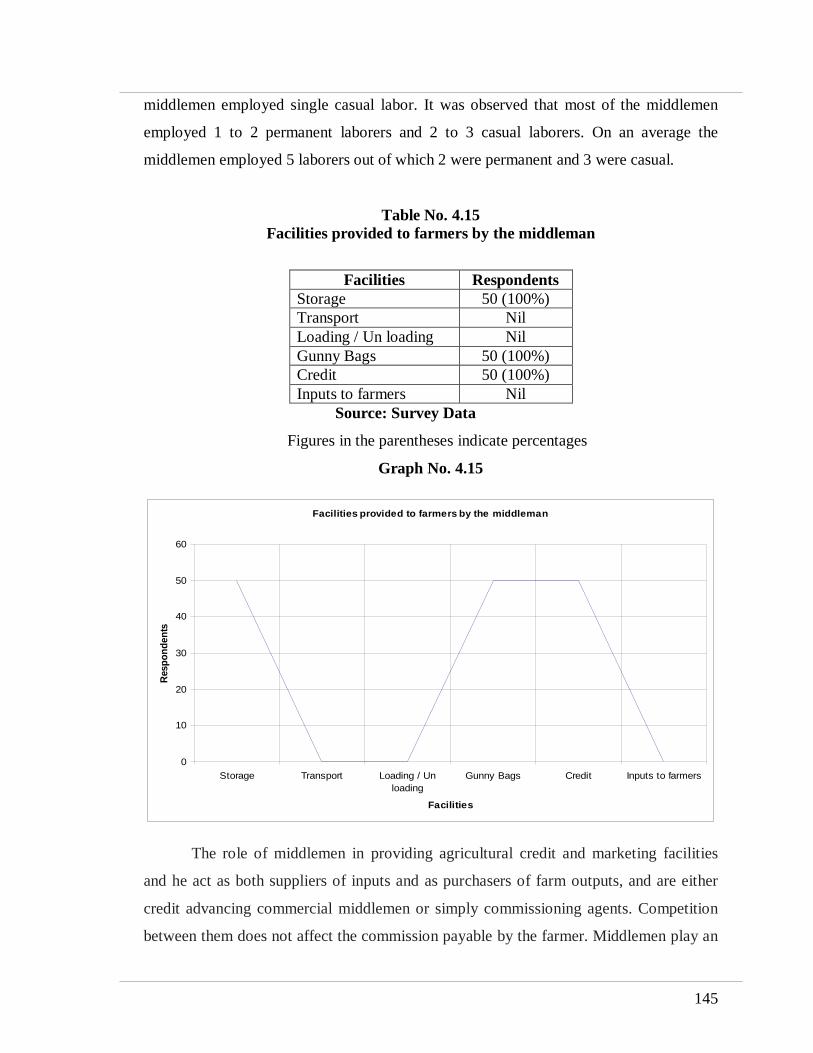
Table No. 4.15 Facilities provided to farmers by the middleman
Facilities Respondents Storage 50 (100%) Transport Nil Loading / Un loading Nil Gunny Bags 50 (100%) Credit 50 (100%) Inputs to farmers Nil
Source: Survey Data
Figures in the parentheses indicate percentages
Graph No. 4.15
The role of middlemen in providing agricultural credit and marketing facilities
and he act as both suppliers of inputs and as purchasers of farm outputs, and are either
credit advancing commercial middlemen or simply commissioning agents. Competition
between them does not affect the commission payable by the farmer. Middlemen play an

146
Knowledge of quality, grades and standards of different pulses among the intermediary
0
5
10
15
20
25
30
35
Little Average Perfect
Particulars
Resp
on
de
nts
important marketing role because of the small size of agricultural units and consequently
of the marketable surplus produced by individual farmers. Their elimination as credit
sources depends on the ready availability of institutional credit at the right time and
without extensive formalities. Their role in marketing is a more intractable problem.
The above table reveals the data related to the facilities provided by middlemen.
As per the data all middlemen provided the gunny bags and storage facilities commonly
to all farmers. None of the middlemen provided transport, loading/unloading and input
facilities (fertilizers, good quality seeds, pesticides etc) to farmers.
Table No. 4.16 Knowledge of quality, grades and standards of different pulses among the
intermediary
Particulars Respondents
Little 5 (10%)
Average 15 (30%)
Perfect 30 (60%)
Source: Survey Data
Figures in the parentheses indicate percentages
Graph No. 4.16

147
Traditionally, farmers are producers of food and other agricultural products by
utilizing natural resources, labor, skills and knowledge plus their investment, either from
their own saving or financial loans. But some farmers are poorer than others. Usually
they are landless farmers who need to rent other people’s land or become daily-waged
agricultural workers. Farm products are usually directed to local middlemen or brokers,
who sometimes provide farmers loans and factors of productions with tied conditions,
before distributing to larger national suppliers. These are the people who know the
market condition, grades etc. These people will then sell the products to the markets.
Under this market-oriented structure, most farmers are price takers. Their bargaining
power is low except in rare circumstances such as in very early or late season or during
period where supply is shortage.
As per the data provided in the above table all agents were found to possess the
knowledge of grades. 10% of the agents had little knowledge of the grades of Tur, 40%
had average and 60% had perfect knowledge.
Table No. 4.17 Knowledge of arrival / prices of different pulses prevailing in the different markets
and the media through which the information available
Media
Market Personal
Visit Neighbour
News Paper /
Radio / TV Telephone
Total
Local market 30
(60%)
10
(20%) Nil
10
(20%)
50
(100%)
Other market 3
(6%)
5
(10%)
10
(20%)
32
(65%)
50
(100%)
Source: Survey Data Figures in the parentheses indicate percentages

148
Knowledge of arrival / prices of different pulses prevailing in the different markets and the
media through which the information available
0
5
10
15
20
25
30
35
Personal Visit Neighbour News Paper / Radio / TV Telephone
Different types of Markets
Res
po
nd
en
ts
Local market Other market
Graph No. 4.17
Above table provides the data related to the methods followed by middleman to
collect information about the conditions of the local and other markets.
As per the data the information about the local market was gathered by personal
visit by 60% of the middleman and through neighbor by 20% and 20% respondents use
telephone to collect the information.
To collect the information of other markets 5% respondents used personal visit,
10% used neighbor, 20% used newspaper/radio/TV and 65% of the respondents used
telephone medium.
149
Policies followed by middleman in setting the purchase price
0
5
10
15
20
25
30
35
40
Price leadership Agreement among buyers Trade co-ordination Tender System
Policies Adopted
Re
sp
on
den
ts
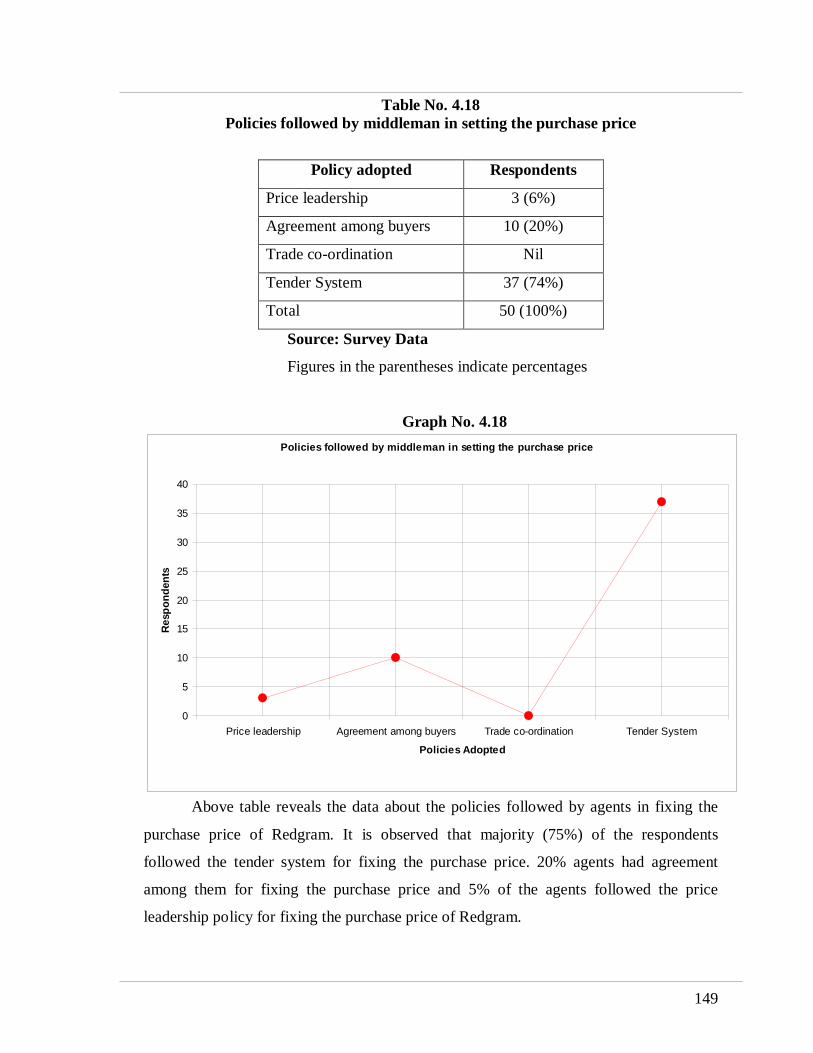
Table No. 4.18 Policies followed by middleman in setting the purchase price
Policy adopted Respondents
Price leadership 3 (6%)
Agreement among buyers 10 (20%)
Trade co-ordination Nil
Tender System 37 (74%)
Total 50 (100%)
Source: Survey Data
Figures in the parentheses indicate percentages
Graph No. 4.18
Above table reveals the data about the policies followed by agents in fixing the
purchase price of Redgram. It is observed that majority (75%) of the respondents
followed the tender system for fixing the purchase price. 20% agents had agreement
among them for fixing the purchase price and 5% of the agents followed the price
leadership policy for fixing the purchase price of Redgram.
150
Statement showing the year of establishment and the installed capacity of the processing
units
5
12
10 0 0 0
5
21 1
2
0
2
0
21
26
17
5
1
34
1
0
5
10
15
20
25
30
< 5 yrs 5 – 10 Yrs 10 – 15 Yrs > 15 Yrs
Period of Establishment
Re
sp
on
den
ts
50 - 60 61 - 70 71 - 80 81 - 90 91 - 100 100 & Above
SECTION: 4.3 Data Analysis Based on Survey of Processing Units
The respondents included the processing units with different capacities, located at
different places, established in different periods.
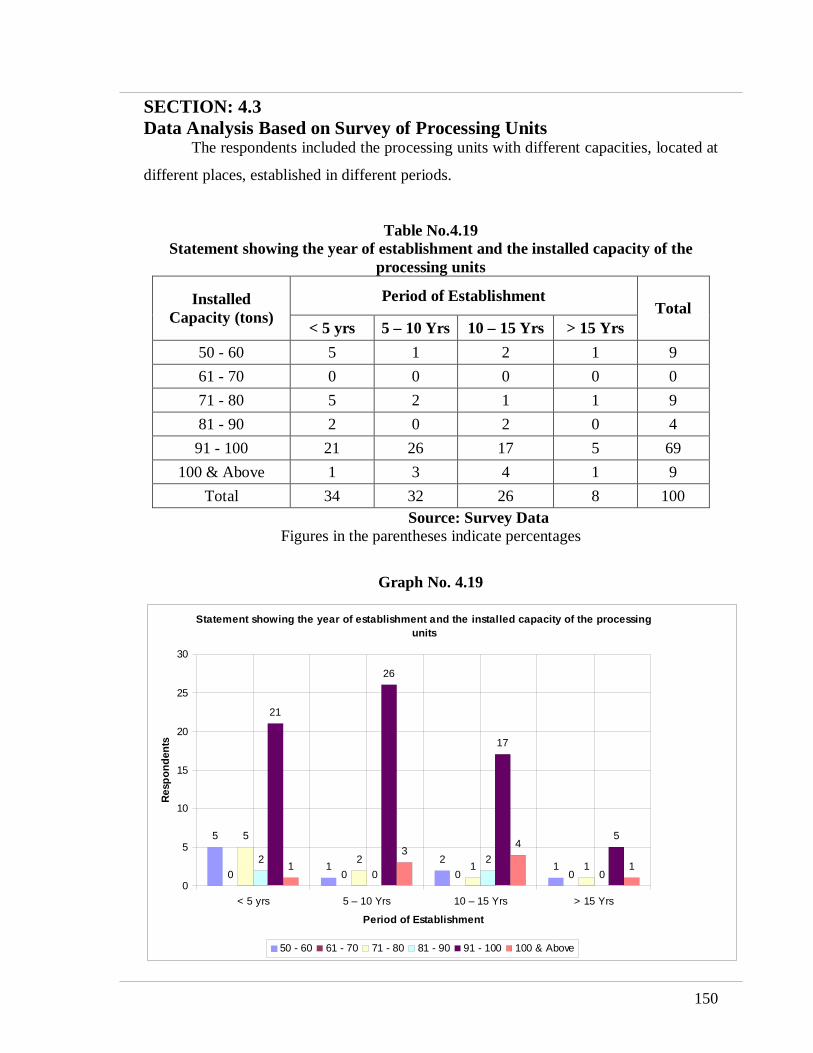
Table No.4.19 Statement showing the year of establishment and the installed capacity of the
processing units
Period of Establishment Installed Capacity (tons)
< 5 yrs 5 – 10 Yrs 10 – 15 Yrs > 15 Yrs Total
50 - 60 5 1 2 1 9
61 - 70 0 0 0 0 0
71 - 80 5 2 1 1 9
81 - 90 2 0 2 0 4
91 - 100 21 26 17 5 69
100 & Above 1 3 4 1 9
Total 34 32 26 8 100
Source: Survey Data Figures in the parentheses indicate percentages
Graph No. 4.19

151
Laborers employed in processing units
Men
71%
Women
29%
Above table presents the data related to the establishment and installed capacity of
processing units.
As per the data the respondents consisted of the processing units which were
operating / working since more than 15 years. 8% of the processing units were working
since more than 15 years, 26% were 10- 15 years old, 32% were working since 5-10
years and 34% of the processing units were working since 5 years.
The installed capacity of 18% of the processing units was between 50 and 80
quintals per day. 73% of the processing units had the installed capacity of 81 to 100
quintals per day and 9% of the processing units had the capacity of processing above 100
quintals of Tur per day.
It was observed that the number of newly installed processing units had increased
steadily.
Table No.4.20 Laborers employed in processing units
Labor category Percentage
Men 71%
Women 29%
Total 100%
Source: Survey Data Total number of respondents = 100
Graph No. 4.20

152
Above table shows the data related to laborers employed in processing units. The
data shows that the laborers employed by processing units included both men and
women. 71% of the laborers were men and 29% of the laborers were women. On an
average a processing unit employed 11 number of laborers of which 8 were men and 3
were women.
Table No.4.21 Procurement cost of Redgram
Procurement Costs of Redgram
Price of Redgram
Transportation Loading/
Unloading Gunny Bags
Commission
Cost (Rs) 3207 221 74 55 129
Proportion 87.0% 6.0% 2% 1.5% 3.5%
Source: Survey Data Total number of respondents = 100
Graph No. 4.21
Procurement cost of Redgram
3207
22174 55
129
0
500
1000
1500
2000
2500
3000
3500
Cost / Rs
Re
sp
on
de
nts
153
Procurement problems regarding availability of Tur
99
10
20
40
60
80
100
120
Regular Irregular
Availability of Redgram
Re
sp
on
den
ts
Above table presents the data about the different costs of procurement incurred by
the processing units. According to the data the total cost of procurement incurred by the
processing units included the cost of Redgram, transportation, loading / unloading, gunny
bags and commission. The cost of Redgram constituted 87% of the total procurement cost
followed by transportation cost (6%) commission (3%), loading / unloading (2.5%) and
gunny bags (1.5%).
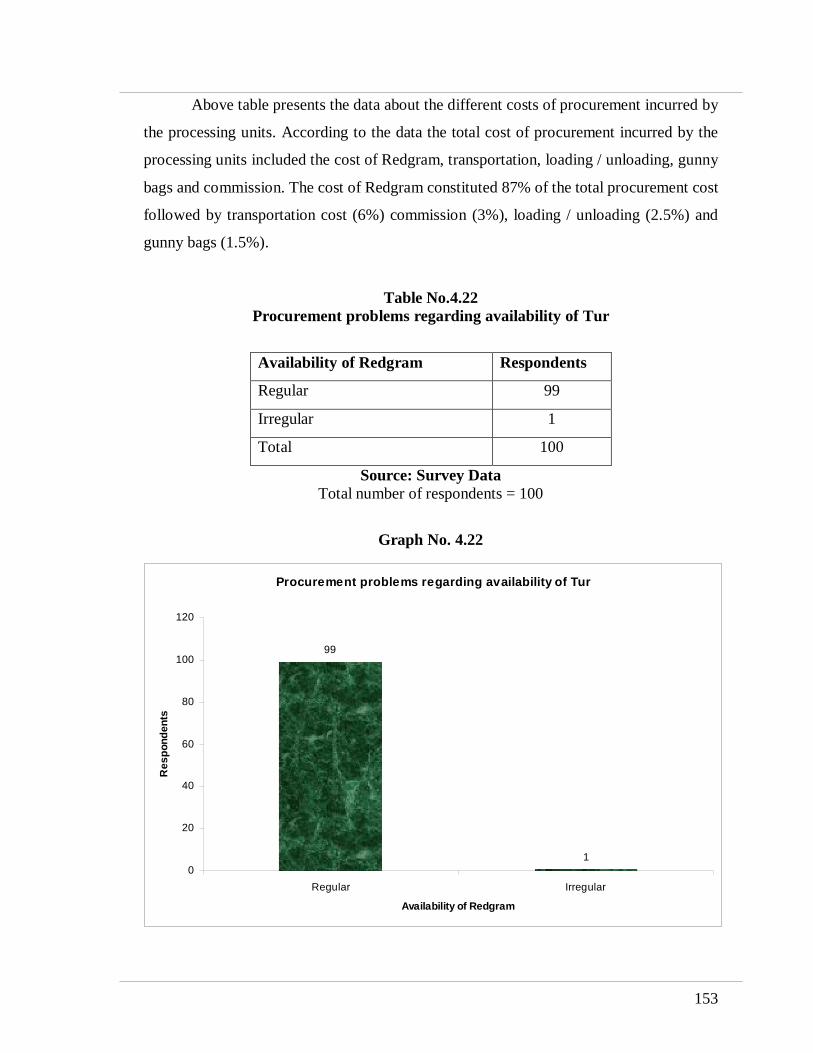
Table No.4.22 Procurement problems regarding availability of Tur
Availability of Redgram Respondents
Regular 99
Irregular 1
Total 100
Source: Survey Data Total number of respondents = 100
Graph No. 4.22
154
Availability of transportation facilities
74
15
9
2
0
10
20
30
40
50
60
70
80
Adequate Inadequate Costly Moderate
Transportation Facility
Re
sp
ond
en
ts
Pulses suffer heavy losses due to stored grain pests. The quality of seeds stored in
the traditional storage structures also deteriorates. Further, there are no small processing
units to convert pulse grains into Dal and other byproducts. This compels the growers to
dispose of their produce immediately after harvest at low price.
Above table reveals the data about availability of Redgram in markets for
procurement by processing units. According to the data 99% of the processing units
found regular availability of Tur in the markets. Most of the respondents were getting the
required quantity of Tur regularly in the markets. However, only 1% of the processing
units found difficulty in the procurement of Tur.
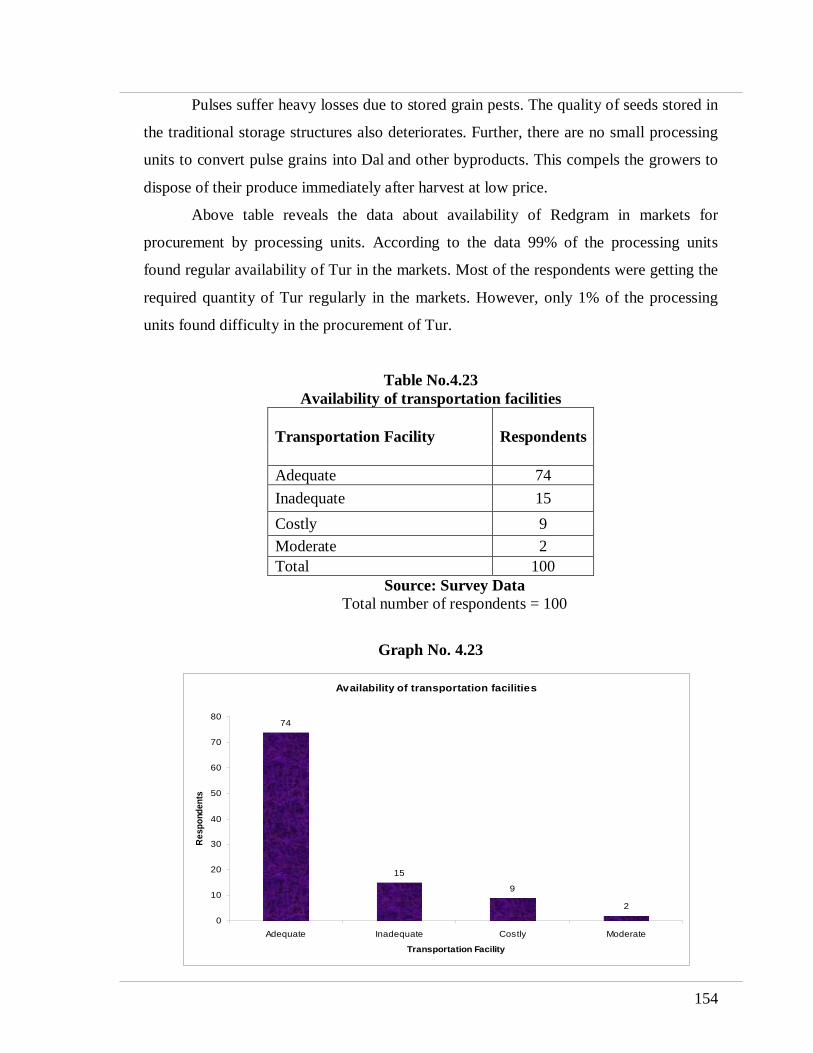
Table No.4.23 Availability of transportation facilities
Transportation Facility Respondents
Adequate 74
Inadequate 15
Costly 9
Moderate 2
Total 100 Source: Survey Data
Total number of respondents = 100
Graph No. 4.23

155
Availability of market facilities
97
3
Near Far away
From the above table it is found that transportation facilities were adequately
available to the 74% of the respondents and 15% of the respondents were finding
difficulties in getting the adequate transportation facilities. 9% of the respondents felt that
transportation facilities were costly and 2 % of the respondents felt they were moderate.
It was observed that most of the processing units were getting adequate
transportation facilities.
Table No.4.24 Availability of market facilities
Distance from the market Respondents
Near 97
Far away 03
Total 100
Source: Survey Data Total number of respondents = 100
Graph No. 4.24

156
Procurement problems with respect to the market fees charges and the
pricing
59
1
36
4
0
10
20
30
40
50
60
70
Fair High
Market Fees / Charges
Re
sp
on
den
ts
High Reasonable
Above table gives the data about the distances between the processing units and
markets in procurement process of Tur. As per the data 97% of the processing units found
the markets at the places near to them and 3% of them found the market places at faraway
distances.
Table No.4.25 Procurement problems with respect to the market fees charges and the pricing
Price condition Market Fees/
Charges Fair High
Total
High 59 1 60
Reasonable 36 4 40
Total 95 5 100
Source: Survey Data Total number of respondents = 100
Graph No. 4.25

157
Statement showing about the main product, by-product and wastage
80%
15%
5%
0%
10%
20%
30%
40%
50%
60%
70%
80%
90%
Main product By product – Chunni, Bhusa Wastage
Particulars
Re
sp
on
de
nts
The data about prices of Redgram in the markets and market fees/charges are
presented in the above table. According to the data 95% of the processing units were able
to procure Redgram at fair prices. Whereas, 5% of them found the prices of Redgram
were high. 60% of the respondents found that the market fees/charges were high and 40%
of them found the market fees/charges as reasonable.
Table No.4.26 Statement showing about the main product, by-product and wastage
Particulars Proportion
Main product 80%
By product – Chunni, Bhusa 15%
Wastage 5%
Source: Survey Data
Total number of respondents = 100
Graph No. 4.26

158
Problems regarding the availability of space and gunny bags
99
01 00
20
40
60
80
100
120
Timely Untimely
Availability of Gunny Bags
Res
po
nd
en
ts
Adequate Inadequate
In many countries of the world grain legumes are initially processed by removing
the hull and splitting into dicotyledonous components. Dehulling pigeonpea is a primary
process that converts the whole seed into dhal. Dehulling operation is usually performed
in two steps, the first involves loosening the husk from the cotyledons and the second
removing the husk from cotyledons and splitting them using a roller machine or stone
chakki.
Data about the final products of the processing of Redgram are presented in the
above table. As per the data provided the final products consisted of 80% Dal and 18%
chunni and bhusa. About 2% of Redgram was lost in the processing operations as
wastages.
Table No.4.27 Problems regarding the availability of space and gunny bags
Availability of Gunny Bags Availability of Space
Timely Untimely Total
Adequate 99 0 99
Inadequate 1 0 1
Total 100 0 100
Source: Survey Data Total number of respondents = 100
Graph No. 4.27
159
Above table reveals the data regarding the availability of space and gunny bags
for storage. From the data it was found that 99 % of the respondents were having
adequate space for storage of goods and only 1 % of respondents faced the problem of
storage space. All respondents were able to get required numbers of gunny bags on time.
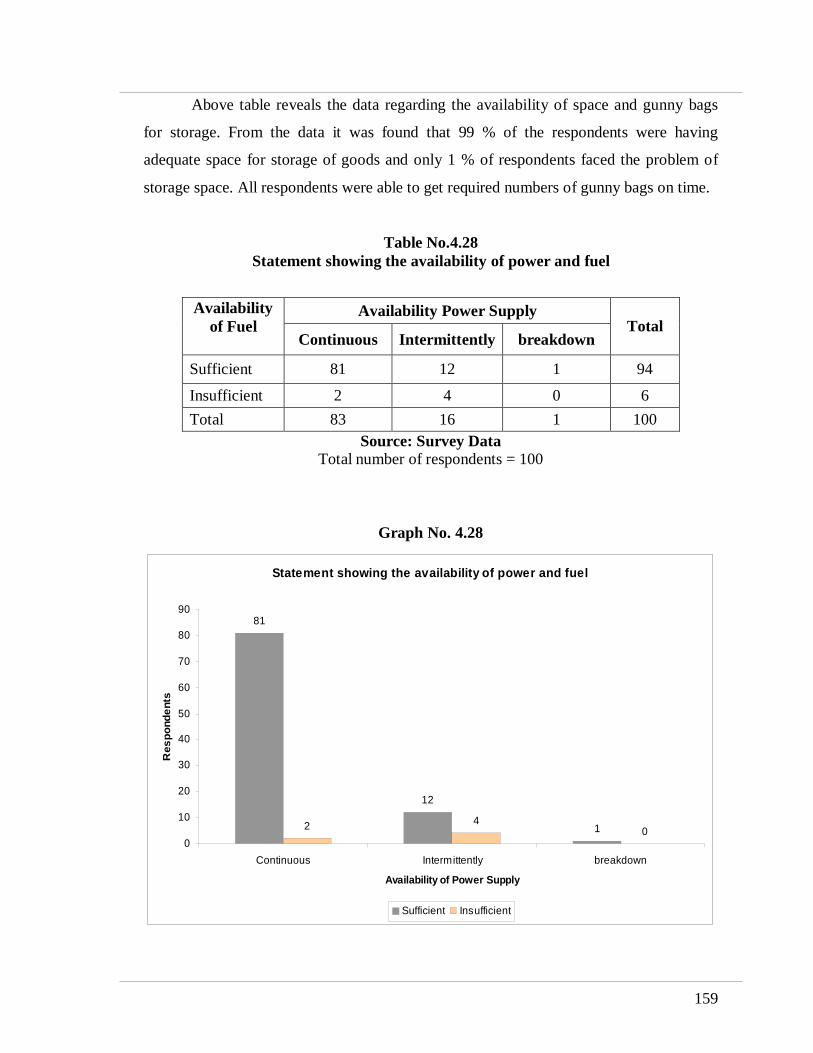
Table No.4.28 Statement showing the availability of power and fuel
Availability Power Supply Availability of Fuel
Continuous Intermittently breakdown Total
Sufficient 81 12 1 94
Insufficient 2 4 0 6
Total 83 16 1 100
Source: Survey Data Total number of respondents = 100
Graph No. 4.28
Statement showing the availability of power and fuel
81
12
124
00
10
20
30
40
50
60
70
80
90
Continuous Intermittently breakdown
Availability of Power Supply
Res
po
nd
en
ts
Sufficient Insufficient

160
Availability of Labor and Mode of Payment
Sufficient, 37
Sufficient, 45
Insufficient, 2Insufficient, 0
Sufficient, 8
Insufficient, 8
0
5
10
15
20
25
30
35
40
45
50
Daily Weekly Monthly
Mode of Payment
Re
sp
on
den
ts
Sufficient Insufficient
Above table presents the data about availability of power and fuel to processing
units. According to the data power was continuously available to 83% of the dal mills,
intermittently to 16% of them and 1% of the processing units were facing the problem of
power breakdown. 94% of the processing units were able to get adequate fuel and 6% of
them were facing the shortage of fuel.
It is observed that majority of the processing units were getting continuous power
supply and adequate quantity of fuel.
Table No.4.29 Availability of Labor and Mode of Payment
Mode of Payment Availability of Labor Daily Weekly Monthly
Total
Sufficient 37 8 45 90
Insufficient 2 8 0 10
Total 39 16 45 100
Source: Survey Data Total number of respondents = 100
Graph No. 4.29
161
Agro-processing is now regarded as the sunrise sector of the Indian economy in
view of its large potential for growth and likely socio economic impact specifically on
employment and income generation. Some estimates suggest that in developed countries,
up to 14 per cent of the total work force is engaged in agro-processing sector directly or
indirectly. However, in India, only about 3 per cent of the work force finds employment
in this sector revealing its underdeveloped state and vast untapped potential for
employment
Above table presents the data about the availability and mode of payment of the
laborers in processing units.
The data shows that 90% of the processing units were able to get the required
numbers of workers and 10% of them were facing problems in finding the required
numbers of workers. Majority of the processing units (45%) who were easily getting the
required numbers of workers made payments on monthly basis and 37% were paying on
daily basis.
The processing units which were finding difficulties in getting the required
numbers of workers were making payments on daily and weekly basis.
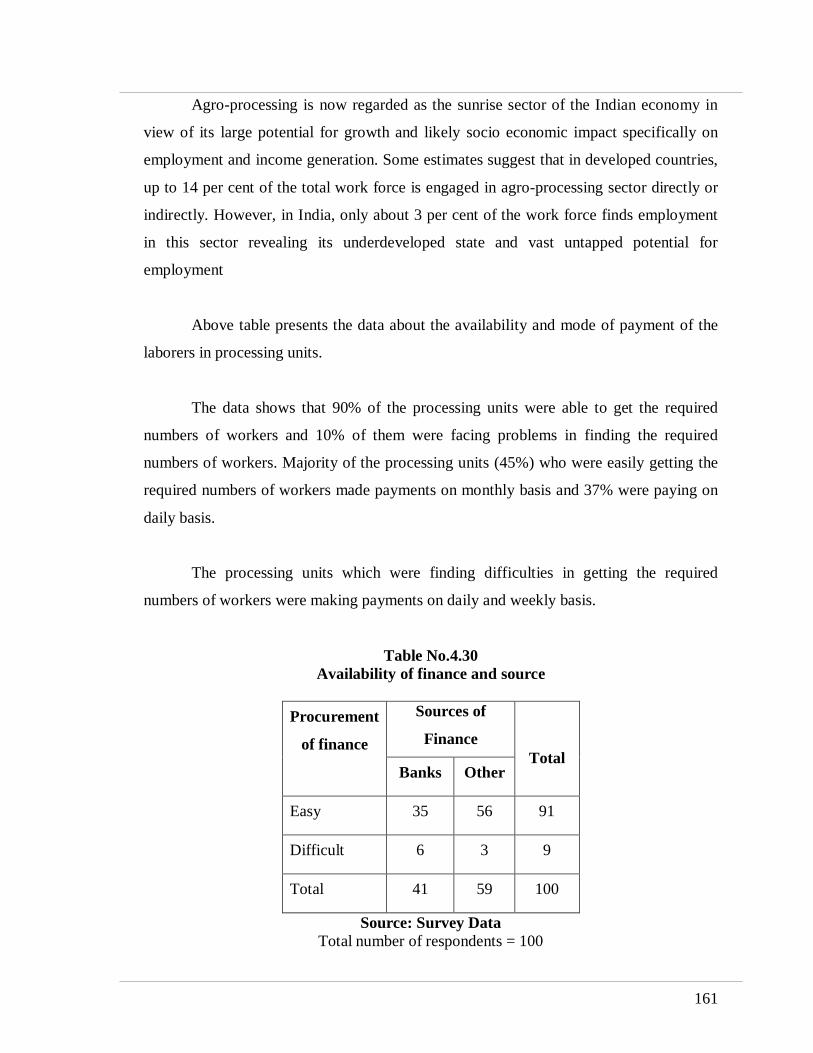
Table No.4.30 Availability of finance and source
Sources of
Finance
Procurement
of finance
Banks Other
Total
Easy 35 56 91
Difficult 6 3 9
Total 41 59 100
Source: Survey Data Total number of respondents = 100

162
Graph No. 4.30
Availability of finance and source
Easy, 35
Easy, 56
Difficult, 6 Difficult, 3
0
10
20
30
40
50
60
Banks Other
Source of Finance
Res
po
nd
en
ts
Easy Difficult
Above table presents the data about the problems faced by the processing units in
arranging the finance. As per the data the dal millers were getting finance from banks and
other sources. 41% of the dal millers were financed by local banks and 59% of dal millers
were financed from other sources such as private financing agency, money lenders etc.
About 91% processing units were able to get the required finance easily.
Table No.4.31 Statements showing availability of customers and transportation Facilities
Availability of Customer Transportation Facilities
Good Poor Total
Adequate 97 0 97
Inadequate 3 0 3
Total 100 0 100
Source: Survey Data Total number of respondents = 100

163
Statements showing availability of customers and transportation Facilities
Adequate, 97
Adequate, 0 Inadequate, 0Inadequate, 30
20
40
60
80
100
120
Good Poor
Source of Finance
Re
sp
on
de
nts
Adequate Inadequate
Graph No. 4.31
The data about problems faced by processing units in marketing of dal are
presented in the above table.
According to the data all processing units were finding good number of customers
in the market. 97% of the respondents were getting adequate transportation facilities for
marketing of dal and 3% of them were finding difficulties in getting adequate
transportation facilities. It is observed that all processing units were finding good number
of customers and most of them were getting adequate transportation facilities.

164
Table No.4.32 Price spread, Marketing margin and Farmer's share for Tur (Rs./quintal)
A. Farmer Existing
channel
Proposed
channel
a. Gross Return 3108 3108
b. Expenses incurred by farmer
ii. Commission of the agent and market charges 90 0
iii. Marketing cost 130 130
c. Net price received by farmer 2888 2978
B. Commission agent
a. Purchase price 3108 0
b. Marketing cost 90 0
c. Market margin by the agent 128 0
C. Dall mill
a. Purchase price 3326 3108
b. Commission of the agent 128 0
c. Marketing cost 222 222
d. Expenses incurred by the dal mill 371 371
D. Final price 4047 3701
Source: Survey Data
As apparent from the above table, the farmers who sold their produce through this
channel realized with a net price of Rs.3108 per quintal. The farmers marketed their
produce through commission agents and Dall mills, who reaped away large amount of
producer’s margin.
Commission agents as marketing intermediary was found to be involved in this
channel. It was found that commission agents also reaped benefit with only a small effort.
Dall mills who are the processing units were also found to be one of the
intermediaries in this channel, which was reaped comparatively higher benefit than the
commission agents.

165
Table No.4.33 Marketing Efficiency of Tur
Particular Existing channel Proposed channel
Net farmer share (Rs./quintal) 2888 2978
Total marketing cost and margins 1159 723
Final price 4047 3701
Marketing Efficiency Index 2.49 4.11
Source: Survey Data
Shepherd’s Equation:
MEI = (V/ I ) – 1
Where
MEI = Marketing Efficiency Index
V = Value of the goods sold (Final Price)
I = Total Marketing Cost and margins
Marketing Efficiency Index (MEI) estimated in marketing of Tur is presented in
the above table. It is revealed form the table that the marketing efficiency of the existing
channel was 2.49. An alternative to the existing channel was proposed and the marketing
efficiency was found to be 4.11 and the marketing margins would be less than to the
existing channel which would result in better efficiency of marketing of Tur compared to
the existing channel.

166
SECTION: 4.4 Testing of Hypothesis
Hypothesis 1: The production of Tur is positively related to the area under crop.
The result of correlation analysis depicts that the production of Tur in quintal is
significantly correlated with the area under the crop (r = 0.581). The result of correlation
analysis provided support for the hypothesis.
Table No 4.34: Showing the result of simple regression analysis
R R Square Adjusted R
Square
Std. Error of
the Estimate
.581 .338 .330 13.067
Predictors: (Constant), Area Crop
Table No 4.35: Showing analysis of variance
Sum of Squares
df Mean
Square F Sig.
Regression 7399.525 1 7399.525 43.338 .000
Residual 14512.912 85 170.740
Total 21912.437 86
Predictors: (Constant), Area Crop, Dependent Variable: Production
Table No 4.36: Showing the analysis of coefficients
Unstandardized Coefficients
Standardized Coefficients
t Sig.
B
Std. Error
Beta
(Constant) 7.726 1.995 3.872 .000
Area Crop 0.823 0.125 0.581 6.583 .000
Dependent Variable: Production
167
The result of Entered regression method depicts that the production of Tur (p <
0.05) was found to be statistically significantly related with the area under crop. The null
hypothesis that the linear relationship does not exist was rejected at the 0.05 significant
level since the significant probability of the F-test was 0.000.
The explanatory power of independent variable to the dependent variable can be
estimated because the coefficient of determinant (R2) was at least 33.8%.
The coefficient of regression equation is statistically significant at the 0.05 level.
So, it can be interpreted that the result of Entered regression analysis method provided
support for the above hypothesis. There is a positive association between area under the
crop and the production of Tur. It shows that the production of Tur can increase of 0.823
quintal per acre of the area under the crop.
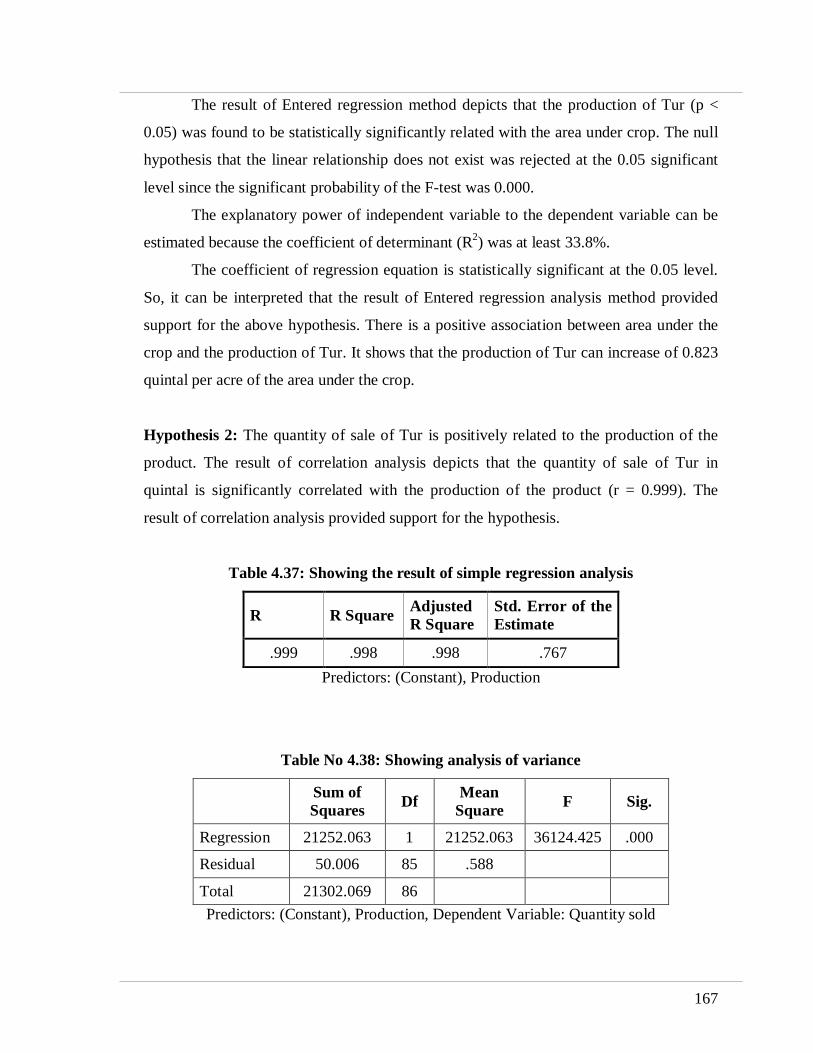
Hypothesis 2: The quantity of sale of Tur is positively related to the production of the
product. The result of correlation analysis depicts that the quantity of sale of Tur in
quintal is significantly correlated with the production of the product (r = 0.999). The
result of correlation analysis provided support for the hypothesis.
Table 4.37: Showing the result of simple regression analysis
R R Square Adjusted R Square
Std. Error of the Estimate
.999 .998 .998 .767
Predictors: (Constant), Production
Table No 4.38: Showing analysis of variance
Sum of Squares
Df Mean
Square F Sig.
Regression 21252.063 1 21252.063 36124.425 .000
Residual 50.006 85 .588
Total 21302.069 86
Predictors: (Constant), Production, Dependent Variable: Quantity sold

168
Table 4.39: Showing the analysis of coefficients
Unstandardized
Coefficients Standardized Coefficients
t Sig.
B Std. Error Beta
(Constant) 0.075 0.121 0.624 0.534
Production 0.985 0.005 0.999 190.064 0.000
Dependent Variable: Quantity sold
The result of Entered regression method depicts that the quantity of sale of Tur (p
< 0.05) was found to be statistically significantly related with the production of the
product. The null hypothesis that the linear relationship does not exist was rejected at the
0.05 significant level since the significant probability of the F-test was 0.000.
The explanatory power of independent variable to the dependent variable can be
estimated because the coefficient of determinant (R2) was at least 99.8%.
The coefficient of regression equation is statistically significant at the 0.05 level.
So, it can be interpreted that the result of Entered regression analysis method provided
support for the above hypothesis. There is a positive association between the quantity of
sale of Tur and the production of Tur. It shows that the quantity of sale of Tur can
increase of 0.985 quintal for the production of the crop.
Hypothesis 3: The sale of Tur is positively related to the price per quintal.
The result of correlation analysis depicts that the sale of Tur in quintal is
significantly correlated with the price per quintal (r = 0.092). The result of correlation
analysis provided support for the hypothesis.
Table 4.40: Showing the result of simple regression analysis
R R
Square
Adjusted R
Square
Std. Error of the
Estimate
0.092 0.008 -0.003 15.764
Predictors: (Constant), Price/Qtl

169
Table 4.41: Showing result of the analysis of variance
Sum of Squares df
Mean Square F Sig.
Regression 179.765 1 179.765 .723 0.397
Residual 21122.304 85 248.498
Total 21302.069 86
Predictors: (Constant), Price/Qtl, Dependent Variable: Quantity sold
Table 4.42: Showing result of the analysis of coefficients
Unstandardized Coefficients
Standardized
Coefficients t Sig.
B Std.
Error Beta
(Constant) -38.574 65.240 -0.591 0.556
Price/Qtl 0.018 0.021 0.092 0.851 0.397
Dependent Variable: Quantity sold
The result of Entered regression method depicts that the sale of Tur (p < 0.05) was
found to be statistically not significant related with the price per quintal. The null
hypothesis that the linear relationship does not exist was accepted at the 0.05 significant
level since the significant probability of the F-test was 0.397.
The explanatory power of independent variable to the dependent variable can be
estimated because the coefficient of determinant (R2) was at least 0.08%.
The coefficient of regression equation is not statistically significant at the 0.05
level. So, it can be interpreted that the result of Entered regression analysis method did
not provide support for the above hypothesis. There is not a positive association between
the sale of Tur and the price per quintal.

170
Hypothesis 4: Variety of Tur production differs significantly due to the area under crop.
Table No 4.43: Output in a one-way ANOVA (Single Factor)
Sum of Squares
df Mean
Square F Sig.
Between Groups 202.174 2 101.087 54.735 .000
Within Groups 363.826 197 1.847
Total 566.000 199
The ANOVA test revealed the significant influence of area under crop in the
variety of Tur at the 5% level. It clearly states that the null hypothesis is rejected as F-
statistics of 54.735 on (2, 197) degrees of freedom for which p-value is 0.000. Hence, it
can be stated that the variety of Tur depends on the area under the crop.
Hypothesis 5: Proportion of yield differs significantly due to the area under the crop.
Table 4.44: Output in a one-way ANOVA (Single Factor)
Sum of Squares
df Mean
Square F Sig.
Between Groups 239.651 2 119.825 115.293 .000
Within Groups 204.744 197 1.039
Total 444.395 199
The ANOVA test revealed the significant influence of area under crop in
the proportion of yield of Tur at the 5% level. It clearly states that the null hypothesis is
rejected as F-statistics of 115.293 on (2, 197) degrees of freedom for which p-value is
0.000. Hence, it can be stated that the proportion of yield differs significantly due to the
area under the crop.

171
Hypothesis 6: Proportion of yield differs significantly due to the different categories of farmers.
Table No 4.45: Output in a one-way ANOVA (Single Factor)
Sum of Squares
df Mean
Square F Sig.
Between Groups 64.621 2 32.310 26.778 .000
Within Groups 237.699 197 1.207
Total 302.320 199
The ANOVA test revealed the significant influence of categories of the farmers
on the proportion of yield of Tur at the 5% level. It clearly states that the null hypothesis
is rejected as F-statistics of 26.778 on (2, 197) degrees of freedom for which p-value is
0.000. Hence, it can be stated that the proportion of yield of Tur depends on the
categories of farmers.