SECTION 3 Sewage Treatment Utilizing Soil 3: Sewage Treatment Utilizing Soil ... The hydraulic...
39
SECTION 3: Sewage Treatment Utilizing Soil Impacts of Effluent on Groundwater ................................................................................................................. 3-2 Soil Treatment Processes ..................................................................................................................................... 3-2 Soil Science Basics ................................................................................................................... 3-7 Soil Defined........................................................................................................................................................... 3-7 Soil Texture .......................................................................................................................................................... 3-7 Soil Structure ...................................................................................................................................................... 3-13 Consistence ......................................................................................................................................................... 3-17 Soil Colors ........................................................................................................................................................... 3-17 Soil Profile ........................................................................................................................................................... 3-24 Soil Horizons ...................................................................................................................................................... 3-25 Soil Morphology................................................................................................................................................. 3-26 Soil Pores ............................................................................................................................................................. 3-26 Soil Permeability ................................................................................................................................................ 3-26 Saturated Hydraulic Conductivity ................................................................................................................... 3-26 Infiltration ........................................................................................................................................................... 3-27 Plastic Limit ........................................................................................................................................................ 3-28 Porosity ................................................................................................................................................................ 3-29 Bulk Density ....................................................................................................................................................... 3-29 Percolation Rate ................................................................................................................................................. 3-29 Soil Formation ................................................................................................................................................... 3-29 Minnesota Soils .................................................................................................................................................. 3-35 References ........................................................................................................................................................... 3-37
Transcript of SECTION 3 Sewage Treatment Utilizing Soil 3: Sewage Treatment Utilizing Soil ... The hydraulic...

SECTION 3: Sewage Treatment Utilizing Soil
Impacts of Effluent on Groundwater ................................................................................................................. 3-2Soil Treatment Processes ..................................................................................................................................... 3-2
Soil Science Basics ................................................................................................................... 3-7Soil Defined ........................................................................................................................................................... 3-7Soil Texture .......................................................................................................................................................... 3-7Soil Structure ...................................................................................................................................................... 3-13Consistence ......................................................................................................................................................... 3-17Soil Colors ........................................................................................................................................................... 3-17Soil Profile ........................................................................................................................................................... 3-24Soil Horizons ...................................................................................................................................................... 3-25Soil Morphology ................................................................................................................................................. 3-26Soil Pores ............................................................................................................................................................. 3-26Soil Permeability ................................................................................................................................................ 3-26Saturated Hydraulic Conductivity ................................................................................................................... 3-26Infiltration ........................................................................................................................................................... 3-27Plastic Limit ........................................................................................................................................................ 3-28Porosity ................................................................................................................................................................ 3-29Bulk Density ....................................................................................................................................................... 3-29Percolation Rate ................................................................................................................................................. 3-29Soil Formation ................................................................................................................................................... 3-29Minnesota Soils .................................................................................................................................................. 3-35References ........................................................................................................................................................... 3-37
SECTION 3: Sewage Treatment Utilizing Soil 3-1
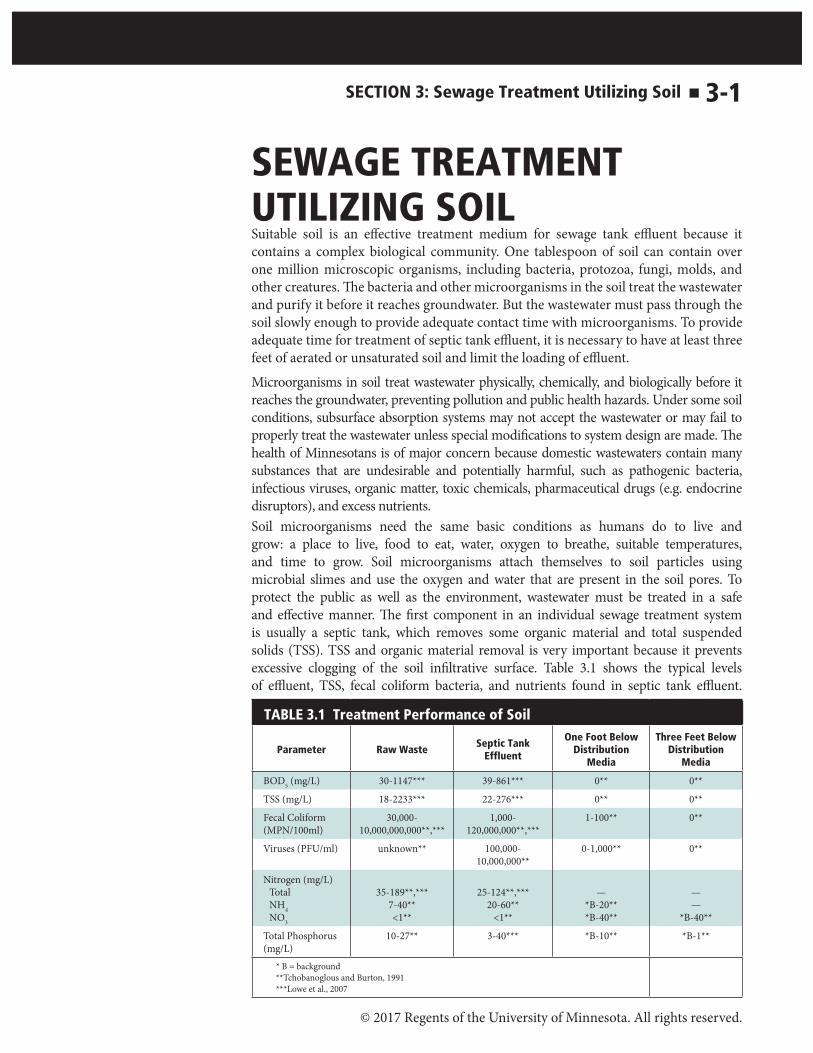
SEWAGE TREATMENT UTILIZING SOILSuitable soil is an effective treatment medium for sewage tank effluent because it contains a complex biological community. One tablespoon of soil can contain over one million microscopic organisms, including bacteria, protozoa, fungi, molds, and other creatures. The bacteria and other microorganisms in the soil treat the wastewater and purify it before it reaches groundwater. But the wastewater must pass through the soil slowly enough to provide adequate contact time with microorganisms. To provide adequate time for treatment of septic tank effluent, it is necessary to have at least three feet of aerated or unsaturated soil and limit the loading of effluent.Microorganisms in soil treat wastewater physically, chemically, and biologically before it reaches the groundwater, preventing pollution and public health hazards. Under some soil conditions, subsurface absorption systems may not accept the wastewater or may fail to properly treat the wastewater unless special modifications to system design are made. The health of Minnesotans is of major concern because domestic wastewaters contain many substances that are undesirable and potentially harmful, such as pathogenic bacteria, infectious viruses, organic matter, toxic chemicals, pharmaceutical drugs (e.g. endocrine disruptors), and excess nutrients. Soil microorganisms need the same basic conditions as humans do to live and grow: a place to live, food to eat, water, oxygen to breathe, suitable temperatures, and time to grow. Soil microorganisms attach themselves to soil particles using microbial slimes and use the oxygen and water that are present in the soil pores. To protect the public as well as the environment, wastewater must be treated in a safe and effective manner. The first component in an individual sewage treatment system is usually a septic tank, which removes some organic material and total suspended solids (TSS). TSS and organic material removal is very important because it prevents excessive clogging of the soil infiltrative surface. Table 3.1 shows the typical levels of effluent, TSS, fecal coliform bacteria, and nutrients found in septic tank effluent.
TABLE 3.1 Treatment Performance of Soil
Parameter Raw Waste Septic Tank Effluent
One Foot Below Distribution
Media
Three Feet Below Distribution
Media
BOD5 (mg/L) 30-1147*** 39-861*** 0** 0**
TSS (mg/L) 18-2233*** 22-276*** 0** 0**
Fecal Coliform (MPN/100ml)
30,000- 10,000,000,000**,***
1,000- 120,000,000**,***
1-100** 0**
Viruses (PFU/ml) unknown** 100,000- 10,000,000**
0-1,000** 0**
Nitrogen (mg/L)TotalNH4NO3
35-189**,***7-40**<1**
25-124**,***20-60**
<1**
—*B-20***B-40**
——
*B-40**
Total Phosphorus (mg/L)
10-27** 3-40*** *B-10** *B-1**
* B = background **Tchobanoglous and Burton, 1991 ***Lowe et al., 2007
© 2017 Regents of the University of Minnesota. All rights reserved.

3-2 SECTION 3: Sewage Treatment Utilizing Soil
Suitably-textured soil must be deep enough to allow adequate filtration and treatment of the effluent before it is released into the natural environment. Usually this release is into groundwater. It has been determined that three feet of aerated soil will provide sufficient treatment of septic tank effluent. Therefore, a three-foot separation distance is required from the bottom of the dispersal media to a limiting soil condition such as groundwater or bedrock. This three-foot treatment zone provides sufficient detention time for final bacteria breakdown and sufficient distance for the filtration that is essential for the safe treatment of effluent BOD. In Table 3.1, the levels of effluent, TSS, bacteria, and nutrients remaining after treatment by one foot and three feet of soil are shown (Tchobanoglous and Burton, 1991).
Impacts of Effluent on GroundwaterGroundwater represents the largest volume of fresh water on earth. Only three percent of the earth’s fresh water resides in streams, lakes, and other surface water bodies. The other 97 percent is beneath the surface, flowing toward points of discharge such as streams, lakes, springs, and wetlands. Groundwater becomes surface water at these discharge points.Effective waste treatment is essential to protecting our water supplies. Approximately 25 percent of households in North America utilize groundwater for consumption and other domestic uses. These same homes employ septic systems as their means for wastewater treatment (US EPA, 2008).As water percolates through the soil, it is purified and in most cases requires no further treatment before being consumed. However, when the soil is overloaded with a treatable contaminant, or when the contaminant cannot be treated by the soil, the quality of the underlying groundwater may change significantly.When a septic system fails to effectively treat and disperse effluent, it can become a source of pollution. This type of failure can occur in three different ways. The first way is when effluent ponds on the soil surface, causing a wet seepy area. The second obvious way that a septic system can fail is to have effluent backing up into the dwelling. It is also important to prevent a third, and less obvious, type of failure, which is contamination of the ground or surface waters.Pollution of groundwater (with nitrogen, pathogens, bacteria, chemicals, etc.) is very difficult to clean up, since the only access to the water table is through wells, trenches (if the water table is high enough), or natural discharge points such as springs. An incident of groundwater pollution often becomes a problem that persists for many years.
Soil Treatment ProcessesThe soil treatment and dispersal zone provides for the final treatment and dispersal of septic tank effluent. To varying degrees, the soil treatment and dispersal zone treats the wastewater by acting as a filter, exchanger, or absorber by providing a surface area on which many chemical and biochemical processes occur. The combination of these processes, acting on the effluent as it passes through the soil, purifies the water. In this section, the movement of effluent through the treatment zone is outlined.

SECTION 3: Sewage Treatment Utilizing Soil 3-3
BiomatAs septic tank effluent flows into a soil treatment trench, it moves vertically through the distribution media to the biomat where treatment begins. The biomat is a biological layer formed by anaerobic bacteria, which secrete a sticky substance and anchor themselves to the soil, rock particles, or other available surfaces. The biomat develops first along the trench bottom, where effluent begins to pond. The biomat develops along
the soil-media contact surfaces on the trench’s sidewalls. When fully developed, the gray-to-black sticky biomat layer is about one inch thick.Flow through a biomat is considerably slower than flow through natural soil, allowing unsaturated conditions to exist in the soil beneath the soil treatment trench. Unsaturated flow increases the travel time of effluent through the soil, ensuring that it has sufficient time to contact the surfaces of soil particles and microorganisms (Figure 3.1).A properly functioning gravity-fed system will have wastewater ponded in the distribution media while the soil a few inches outside of and below the distribution media will be unsaturated. Unsaturated soil has pores containing both air and water so aerobic microor-
ganisms living in the soil can effectively treat the wastewater as it travels through the soil system.In unsaturated soil, under a biomat, water movement is restricted. In order for the wastewater to move through the soil, it must be pulled or wicked through the fine pores by capillary action. A developed biomat reaches equilibrium over time, remaining at about the same thickness and the same permeability if effluent quality is maintained. For this equilibrium to be maintained, the biomat and the effluent ponded within the trench must be in anaerobic conditions, the organic materials in the wastewater feed the anaerobic microorganisms, which grow and multiply, increasing the thickness and decreasing the permeability of the biomat. On the soil side of the biomat beneath the drainfield, oxygen is present so that conditions are allowing aerobic soil bacteria to feed on and continuously break down the biomat. These two processes occur at about the same rate so that the thickness and permeability of the biomat remain in equilibrium (see Figure 3.2, next page).If the quality of the effluent leaving the septic tank decreases because of failure to regularly pump out the septic tank, more food will be present for the anaerobic bacteria, which will cause an increase in the thickness of the biomat and decrease its
FIGURE 3.1 Unsaturated Flow Provides Treatment

3-4 SECTION 3: Sewage Treatment Utilizing Soil
permeability (Siegrist, 1987). If seasonally saturated conditions occur in the soil outside the trench, aerobic conditions will no longer exist, which will prevent aerobic bacteria from breaking down the biomat. Under these conditions the biomat will thicken, reducing its permeability and the effectiveness of effluent entering the soil.
Soil TreatmentOnce the effluent passes through the biomat, it enters the soil for final treatment. Soil particles, the presence of electrical charges, and the soil biological community all provide treatment of the effluent.Soil particles provide the surface areas that septic tank effluent must contact to move. This contact provides treatment of the effluent by filtering the larger contaminants while adsorbing (e.g., attachment or binding) others. Because soil particles are negatively charged, they can attract and hold positively charged pollutants. Soils also contain minerals that bind with some pollutants and immobilize them (see Figure 3.3).Bacteria, fungi, actinomycetes, and protozoa live
in the soil, all of which feed on organic material in the septic tank effluent. Aerobic bacteria provide treatment and function optimally in aerated soil because they prefer oxygen. If the soil is saturated and no oxygen is present, anaerobic bacteria function, but they provide insufficient treatment. Bacteria and total suspended solids contained within septic tank effluent have been found to be treated and removed in the first foot of most aerated soil under the trench (Table 3.1).
Pathogen RemovalBacteria in effluent are typically large enough, aggregated with other bacteria or associated with solids, that they are filtered out like suspended solids (Gerba and Bitton, 1984). Viruses are much smaller than bacteria, and are not filtered (Coyne, 1999). However, some contain a positive ionic charge, allowing the soil to attract and hold the viruses. Once bacteria and
viruses are caught in the soil, they eventually die off because of soil conditions (e.g. temperatures, moisture levels, bacteria predation). Certain soil fungi naturally produce antibiotics that attack some contaminants. Others consume the bacteria and viruses as a food source.In sandy soils with limited negative charges, the main means of viral attachment to soil particles is by microbial slimes laid down by soil bacteria. A soil column study conducted by Van Cuyk and Siegrist (2006) demonstrated high levels of virus removal after 6 weeks of operation (greater than 85%) by less than 2-inches of sandy soil at various hydraulic loading rates (1.2 gpd/sq ft and 6 gpd/sq ft). Studies have shown that if aerated sandy soils are loaded at no greater than
FIGURE 3.2 Biomat Equilibrium
FIGURE 3.3 Electrical Charges Provide Treatment

SECTION 3: Sewage Treatment Utilizing Soil 3-5
1.2 gallons per day per square foot (gpd/sqft), virus removal occurs within two feet (Magdorf et al., 1974; US EPA, 1980; Van Cuyk et al., 2001). The hydraulic loading rate for sandy soils found in Chapter 7080 reflects this loading rate.
Nutrient RemovalThe two principle nutrients of concern in wastewater are nitrogen and phosphorus.
NitrogenNitrogen is a concern because it can contaminate drinking water. Nitrogen undergoes many changes as it travels through a septic system. Septic tank effluent contains both organic nitrogen and ammonium (NH4
+). The predominant form entering the soil is ammonium. The transport and fate of nitrogen underneath a soil treatment system is dependent upon the forms entering and the biological conversions that take place. Figure 3.4 shows the forms and fate of nitrogen in the subsurface environment. All of these nitrogen transformations are microbially mediated and require suitable temperatures (above 41 degrees F), a usable source of carbon (organic matter) for energy, and suitable alkalinity.
Nitrates (NO3-) are formed by nitrification.
Nitrification (NH4+ � NO2
-�NO3-) is an aerobic
reaction, so it is dependent upon the availability of oxygen in the soil. Denitrification is another important nitrogen transformation in the soil environment below onsite systems. It is the only mechanism by which the NO3
- concentration in the effluent can be reduced. Denitrification (NO3-N2O-N2) occurs in the absence of oxygen. For denitrification to take place, the nitrogen must usually be in the form of NO3
-, so nitrification must happen before denitrification. Mound systems facilitate this process and typically reduce nitrogen concen-trations by 32 to 70 percent (Magdorf et al., 1974; Eastburn and Ritter, 1984). Additional studies have shown little total nitrogen removal below 31 at-grade systems in Wisconsin (Converse et al., 1991) and moderate rates of removal (7-15%) in laboratory studies (Van Cuyk et al., 2001).The transport of nitrate ions may occur by move-ment with in solution, uptake in plants or crops, or denitrification. Since nitrate ions (NO3
-) have a negative charge, they are not attracted to soils and are very mobile. The mobility of nitrate is further enhanced by the solubility of these ions in the soil water.Treatment of nitrates occurs to a limited extent by the following mechanisms.
Uptake by Vegetation: If soil treatment areas are kept near the surface, some of the nitrate will be taken up by surface vegetation during the growing season.
FIGURE 3.4 The Nitrogen Cycle and Soil Treatment

3-6 SECTION 3: Sewage Treatment Utilizing Soil
Denitrification: If the ammonium (NH4+) is nitrified to nitrate (NO3
-) and then encounters a saturated zone which lacks oxygen, the nitrate is converted to nitrogen gas (N2) and is lost to the atmosphere. Mound systems provide these nitrifying and subsequently denitrifying conditions.
Once nitrates reach the groundwater, dilution with the native groundwater can mitigate this contamination. There is also a potential for some denitrification of the nitrate in the groundwater itself and when it enters a riparian area at a groundwater discharge zone. The effectiveness of dilution is dependent upon the amount of nitrate entering from other sources in the area, including agricultural practices and other improperly functioning wastewater treatment systems, along with the hydrogeologic conditions of the groundwater system.
PhosphorusSince groundwater is ultimately discharged as surface water, the quality of Minnesota’s surface water is highly dependent upon the quality of its groundwater. Phosphorus from onsite sewage treatment systems must not enter lakes through the groundwater.Phosphorus is a concern because lakes receiving additional phosphorus will experience an increase in aquatic vegetation. The most common limiting nutrient for primary production in Minnesota lakes is phosphorus, so small additions bring about a great increase in growth. Algal blooms and heavy growth of emergent vegetation not only make surface water bodies unappealing for recreation, they also threaten the health of fish and other aquatic creatures. Phosphorus is removed from wastewater by being chemically bound by minerals and held on exchange sites on soil particles. Iron, calcium, and aluminum are minerals that chemically bind with phosphates in a process called adsorption. When the adsorption sites are filled, newly added phosphorus must travel deeper in the soil to find fresh sites. Soils higher in clay content have more surface area and binding sites on the soil particles than soils high in sand. This means phosphorus movement is generally less in finer-textured soils. Numerous field and laboratory studies have documented these differences in phosphorus movement/leaching from soils below a soil treatment area (Sawhney, 1977; Lotse, 1976; Bouma, 1979). If the treatment system is functioning correctly, and proper setbacks are maintained from surface waters and vertical separation from periodically saturated soil, problems from phosphorus movement to surface water or groundwater should be minimal.
Residence TimesThe longer contaminants remain in unsaturated soil, the greater the opportunity for treatment. One way to enhance residence times is to ensure that less water percolates through the soil to carry contaminants into groundwater before treatment is achieved. The following methods can be used to reduce the amount of water being treated by a given soil.
Water conservation: Using less water in the home will increase contaminant residence times in the soil. Reduced flows also allow increased quiet times in septic tanks, which increases the settling of solids of contaminants in the tank so that they do not reach the soil treatment system.
Long, narrow, and shallow systems: Soil treatment areas constructed shallow to the ground surface will allow the upward removal of water by evaporation and

SECTION 3: Sewage Treatment Utilizing Soil 3-7
transpiration through growing plants. Shallow trenches also provide good oxygen exchange with the atmosphere so that the aerobic soil bacteria provide good treatment.
Install flow-restricting water fixtures. Install composting, incinerating, chemical, and low-flow toilets. Divert upslope water. Promptly repair leaks in plumbing system.
Soil Science BasicsSoil DefinedWhat is Soil?Soil is defined as the unconsolidated mineral or organic matter on the surface of the earth that has been subjected to and shows effects of the genetic and environmental factors of: climate (including water and temperature effects), and macro- and microorganisms, conditioned by relief, acting on parent material over a period of time (Soil Science Society of America, 2008).
Components of SoilSoil contains about 50 percent solid material and 50 percent pore space. The solid portion typically contains five percent organic matter and 45 percent mineral material (see Figure 3.5).Since both the solid material and pore space of the soil are imperative to
proper septic tank effluent treatment and dispersal, we need a greater understanding of how to identify, describe, and interpret many soil properties. The ability to understand soil will provide the confidence that the subsequent SSTS design will be appropriate (in size, depth, etc.) for the soil and site conditions.
Soil Texture DescribedSoil texture is the quantity of various inorganic particle sizes present. The inorganic particles are grouped together into sand-, silt-, and clay-sized particles, which are called soil separates. You can think about texture as the “feel” of the soil. Soil texture influences how fast water moves into and through the soil. This soil-water movement is referred to as infiltration (movement at soil surface) and permeability or hydraulic conductivity (movement through the soil). Detailed soil texture analyses are required to estimate the size of the soil treatment
FIGURE 3.5 Soil Components

3-8 SECTION 3: Sewage Treatment Utilizing Soil
area. While soil texture is not the only factor determining soil-water movement, it can provide helpful preliminary information. Soil texture is the relative proportion, by mass, of the soil particles finer than two millimeters. These particles are sometimes called the fine earth fraction. Materials larger than two millimeters are called rock fragments. These fine earth fraction of soil particles largely influence moisture storage and soil-water movement, and they change the amount of surface areas of soil material that can provide treatment of the effluent.While most people believe that they have a good idea of what a sand particle looks and feels like, it is impossible to see a single clay particle with the naked eye, and it is difficult to imagine 0.002 millimeters. If a sand particle were magnified to a size ten inches in diameter, a silt particle would be about one inch in diameter, in comparison, and a clay particle would be about the size of a grain of sugar. 7080.1100 Subp. 80. Soil texture. “Soil texture” means the soil particle size classification and particle size distribution as specified in the Field Book for Describing and Sampling Soils.
Soil Textural ClassificationThere are several different soil textural classification systems used in the United States. Textural classification systems include the US Department of Agriculture (USDA) textural classes, the United Soil Classification, and the American Association of State
FIGURE 3.6 Soil Textural Classification Systems in the United States

SECTION 3: Sewage Treatment Utilizing Soil 3-9
Highway and Transportation Officials (AASHTO) Classification (Figure 3.6). The USDA textural classification was developed to reflect water movement in soils and is the system used in sizing SSTS systems. USDA texture classes are given as percentages of sand, silt, and clay. Soil textural classes are defined according to the distribution of the soil separates. The basic texture classes, in order of increasing proportions of fine particles, are sand, loamy sand, sandy loam, loam, silt loam, silt, sandy clay loam, clay loam, silty clay loam, sandy clay, silty clay, and clay. The sand, loamy sand, and sandy loam classes may be further subdivided into coarse, fine, or very fine, according to the sand particle size.Figure 3.7 is a diagram called the soil texture triangle, which is used to
identify soil texture based upon the percentages of sand, silt, and clay in a soil sample. Be careful to enter the triangle along the proper lines for the three particle sizes. At any point on the soil triangle, the sum of the per-centages of sand, silt, and clay should total 100 percent. This figure does not address non-soil particles (e.g., organic matter, rock fragments > 2mm, etc.).For example: Locate the soil texture for a soil possessing 20 percent clay, 40 percent silt and 40 percent sand. A soil with this combination of particles is classified as a loam. Note that a soil sample classified as a loam can have over 50 percent sand and still have the characteristics and soil-water movement of a loam.
The twelve soil textural classesClay is the finest textured soil. When wet, clay is quite plastic and is very sticky. When the moist soil is squeezed,
it forms a long, flexible ribbon; when moist and smeared, it is shiny. A clay soil leaves a slick surface when rubbed with a long stroke and firm pressure. Due to its stickiness, clay tends to hold the thumb and forefingers together.Silty Clay has characteristics similar to clay. It contains approximately equal amounts of silt and clay. It is both sticky and smooth feeling. Sandy Clay also has characteristics similar to clay. It has nearly equal parts sand and clay, and very little silt. It has a sticky feel. Individual sand particles may also be felt.Clay Loam is a fine-textured soil. The moist soil is plastic and will form a cast that will bear much handling; when formed into a long ribbon, it breaks readily. When kneaded in the hand, it does not crumble readily but tends to work into a heavy compact mass.Silty Clay Loam is a fine-textured soil similar to clay loam. It generally contains more silt than clay, and can have up to 20 percent sand. It has a slightly sticky feel and is rather stiff. It also feels smooth or floury.
FIGURE 3.7 Soil Texture Triangle

3-10 SECTION 3: Sewage Treatment Utilizing Soil
Sandy Clay Loam is composed primarily of sand with varying amounts of clay and silt and has characteristics similar to clay loam. It is slightly to fairly sticky-feeling. Individual sand grains may be felt. Silt is too fine to be gritty to the touch, but its smooth, slick, or greasy feel lacks any stickiness.Silt Loam is a soil having a moderate amount of the fine grades of sand and a moderate to small amount of clay, over half of the particles being of the size called “silt.” When pulverized, it feels soft and floury. When moist, the soil readily runs together and puddles. Loam feels like a relatively even mixture of sands, silt, and clay. A loam feels somewhat gritty, yet fairly smooth and highly plastic. Loam textures refer to the mineral fraction of the texture. The term “loam” is not related to the term “topsoil,” as loam textures can occur at any depth in the soil.Sandy loam is similar to loam, but contains a higher percentage of sand, with enough silt and clay to make it somewhat sticky. Individual sand grains can be seen readily and felt. Loamy Sand is a soft, easily squeezed soil that is only slightly sticky. Individual sand particles can be felt. Sand is commonly loose and single-grained, but it may be cemented together. Individual grains can be readily seen or felt. Squeezed in the hand when dry, it falls apart when pressure is released and does not form a ribbon. Squeezed when moist, it forms a cast that crumbles. Sand sizes can range from very gritty (coarse sand) to nearly smooth (very fine sand.)
Field Determination of Soil TextureThe determination of soil texture is made in the field mainly by feeling the soil with the fingers, and sometimes by examination under a hand lens. This requires skill and experience, but good accuracy can be obtained if the site evaluator frequently checks his or her estimation against laboratory results.Soil samples of known textural classes can be obtained from:
Crops and Soils ClubDepartment of Plant and Earth ScienceUniversity of Wisconsin River FallsRiver Falls, WI 54022
To determine the soil texture, moisten a sample of soil one to two inches in diameter. There should be enough moisture so that the consistency is like putty. Too much moisture results in a sticky material, which is hard to work. Too little moisture will result in the soil feeling coarser in texture. Press and squeeze the sample between thumb and forefinger. Press the thumb forward to try to form a ribbon with the soil. The amount of sand in the sample can be determined by “washing off ” the silt and clay and feeling for sand particles. Sand particles can be seen individually with the naked eye and have a gritty feel to the fingers. Many sandy soils are loose, but some are not. Silt particles cannot be seen individually without magnification; they have a smooth feel to the fingers when dry or wet. Clay soils are sticky when moist and can possess a sheen at a high clay content.

SECTION 3: Sewage Treatment Utilizing Soil 3-11
Whether and how a properly moistened soil develops a long continuous ribbon when pressed between the thumb and fingers gives a good idea of the amount of clay present. If the soil sample forms a ribbon (as do loams, clay loams, or clays) it may be desirable to determine if sand or silt predominate. If there is a gritty feel and lack of smooth talc-like feel, then sand very likely predominates. If there is not a predominance of either the smooth or gritty feel, then the sample should not be called anything other than clay, clay loam, or loam. If a sample feels quite smooth with little or no grit in it, the sample should be called silt loam.The content of particles coarser than two millimeters cannot be evaluated by feel. The content of the coarser particles is determined by estimating the proportion of the soil volume that they occupy. Rock fragments are described as a modifier to the textural term, such as gravelly sandy loam.
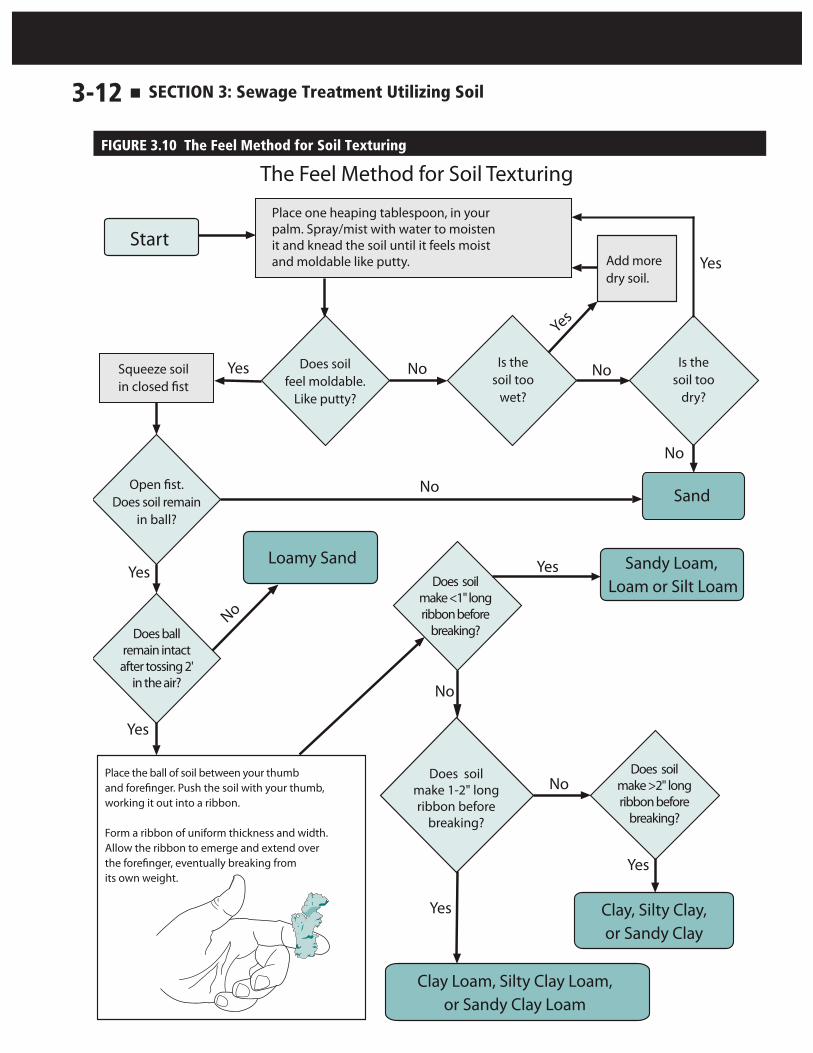
An experienced site evaluator can determine the texture of soil quite accurately using both feel and sight. A good estimate of the texture class can be made using the following procedure (See Figure 3.10). Final sizing of systems without the aid of a percolation test should only be attempted by an experienced site evaluator with adequate training or by a soil scientist who can accurately determine the soil texture and structure.
Procedure 1. Moisten a sample of soil the size of a golf ball until it is workable and moldable like putty (Figure 3.8). Work it until it is uniformly moist, and then squeeze it out between your thumb and forefinger to try to form a ribbon. This is the method to estimate the clay percentage (Figure 3.9).2. First decision. If the moist soil is: a. Extremely sticky and stiff: one of the clays b. Sticky and stiff to squeeze: one of the clay loams c. Soft, easy to squeeze, only slightly sticky: one of the loams d. Easy to squeeze or crumbly: one of the sands
3. Second decision. Try to add an adjective to refine the description: a. The soil feels very smooth: silt or silty b. The soil feels somewhat gritty: no adjective c. The soil feels very gritty: sandy4. Third decision. Determine the amount of sand present: a. Very sandy (85% to 100%): sand b. Quite sandy (70% to 85%): loamy sand c. Somewhat sandy (50% to 70%): sandy loam
5. To distinguish between silt loam and silt, consider how slick or floury the soil feels.
a. Very slick: silt b. Somewhat slick: silt loam
FIGURE 3.8 Moisten and Mold Sample
FIGURE 3.9 Create a Ribbon
3-12 SECTION 3: Sewage Treatment Utilizing Soil
FIGURE 3.10 The Feel Method for Soil Texturing
Place one heaping tablespoon, in your palm. Spray/mist with water to moisten it and knead the soil until it feels moist and moldable like putty. Add more
dry soil.
Squeeze soilin closed fist
Does soilfeel moldable.
Like putty?
Is thesoil too
wet?
Is thesoil too
dry?
Does ballremain intactafter tossing 2'
in the air?
Open fist.Does soil remain
in ball?
Does soilmake <1" longribbon before
breaking?
Does soilmake 1-2" longribbon before
breaking?
Does soilmake >2" longribbon before
breaking?
Start
Loamy Sand
Sand
Sandy Loam, Loam or Silt Loam
Clay Loam, Silty Clay Loam,or Sandy Clay Loam
Clay, Silty Clay,or Sandy Clay
The Feel Method for Soil Texturing
Place the ball of soil between your thumb and forefinger. Push the soil with your thumb, working it out into a ribbon.
Form a ribbon of uniform thickness and width.Allow the ribbon to emerge and extend over the forefinger, eventually breaking from its own weight.
Yes
Yes
Yes
Yes
Yes
Yes
Yes No No
No
No
No
No
Yes
No

SECTION 3: Sewage Treatment Utilizing Soil 3-13
Soil StructureSoil structure is defined as the combination or arrangement of primary soil particles (sands, silts, and clays) into secondary units or peds (Soil Science Society of America, 2008). The secondary units are characterized on the basis of size, shape, and grade (i.e., degree of distinctness). Visually, soil structure simply describes how soil particles are glued together into larger units. Soil structure develops over time (many hundreds to thousands of years) through physical and chemical weathering. Examples of forces forming soil structure include freeze/thaw cycles, wet/dry cycles, plant rooting, earth inhabiting invertebrate activity, etc. These forces are concentrated in the upper portion of the soil (within three to five feet of the soil surface) leaving virtually no soil structure at greater depths. If enough force is used, any body of soil material can be broken into smaller pieces. If the smaller pieces have consistent size and shape and are related to persistent planes of weakness, then this is soil structure that must be described. Some soil layers or soils do not have orderly shapes or sizes; these are referred to as structureless. In these layers, soil clumps may be broken out of a soil sample, but they are random in size and shape, and the same pieces might not be evident during another soil observation. Depending on the nature of the underlying soil, the soil structure will commonly be described as either massive (cohesive soils) or single grain (non- cohesive soils). A massive soil does not necessarily indicate a hard and cemented layer as massive layers can be relatively easy to manipulate. Large pores develop between soil structural units. These pores allow a soil to accept and transmit water more efficiently than soils without soil structure. Understanding soil structure is key to the proper sizing of a soil treatment system. Because soil structure is dynamic, changing in response to moisture content, the soil solution’s chemical composition, biological activity, and management practices, soil structure is easily altered or destroyed. Some soils contain clay particles that shrink and swell; montmorillonite or vertic clays, show particularly dramatic changes. When the soil peds swell upon wetting, the large pores become smaller and water movement through the soil is reduced. Therefore, when determining the hydraulic properties of a soil for wastewater treatment and dispersal, the soil’s moisture content should be similar to that expected in the soil surrounding a soil treatment system.
Soil Structure in MinnesotaIn Minnesota, soil structure usually is developed only in the upper three to five feet of the soil profile. Topsoil generally has a smaller structure than subsoil due to increased weathering forces. Soil structure types are distinct from one another in shape, size, and grade (i.e., distinctness).
Soil Structure DescriptionA detailed description of the soil structure is necessary for a thorough understanding and functional design of a soil treatment area. A soil pit or large-diameter probe (e.g. >1 inch diameter) will be necessary to adequately examine the structure. The soil should be examined and described carefully, using a pick or similar device, to expose the natural cleavage and planes of weakness. Cracks in the face of the soil profile are indications of breaks between soil peds. If cracks are not visible, a sample of soil should

3-14 SECTION 3: Sewage Treatment Utilizing Soil
be carefully picked out and, by hand, the structural units carefully separated until any further breakdown can only be achieved by fracturing.In soils that have structure, the shape, size, and grade of the peds are described. Nomenclature for describing soil structure consists of separate terms for each of these properties. The three descriptive characteristics of soil structure are:
Shape Size Grade
ShapeSeveral basic shapes of peds are recognized in soils. The following terms (Figure 3.11), describe the basic shapes and related arrangement of peds. Granular: The peds are approximately spherical or polyhedral
and are commonly found in topsoil. These are the small, rounded peds that hang onto fine roots when soil is turned over. Platy: The peds are flat and plate-like. They are oriented
horizontally and are usually overlapping. Platy structures are commonly found in forested areas just below the leaf litter, shallow topsoil, or compacted areas. Blocky: The peds are block-like or polyhedral, and are bounded
by flat or slightly rounded surfaces that are casts of the faces of surrounding peds. Blocky peds have similar height, width, and length dimensions. The structure is described as angular blocky if the faces intersect at relatively sharp angles and as sub-angular blocky if the faces are a mixture of rounded and plane faces. Blocky structures are commonly found in the lower topsoil and subsoil.
Prismatic: Surfaces of peds are flat or slightly rounded vertical faces. Peds are distinctly longer vertically and the faces are typically casts or molds of adjoining peds. Prismatic structure is commonly found in the lower subsoil.
Single Grain: The structureless description for sandy soils. The individual particles are not held together.
Massive: The structureless description for loamy and clayey soils. The soil particles do not break into uniform patterns. Commonly found in the lower subsoil.
Soils with granular, blocky, prismatic, or columnar structures enhance flow both horizontally and vertically. Platy structures restrict downward movement of water because the ped faces are oriented horizontally. Platy structures are often associated with lateral (sideways) movement of water.
FIGURE 3.11 Soil Shapes
SECTION 3: Sewage Treatment Utilizing Soil 3-15
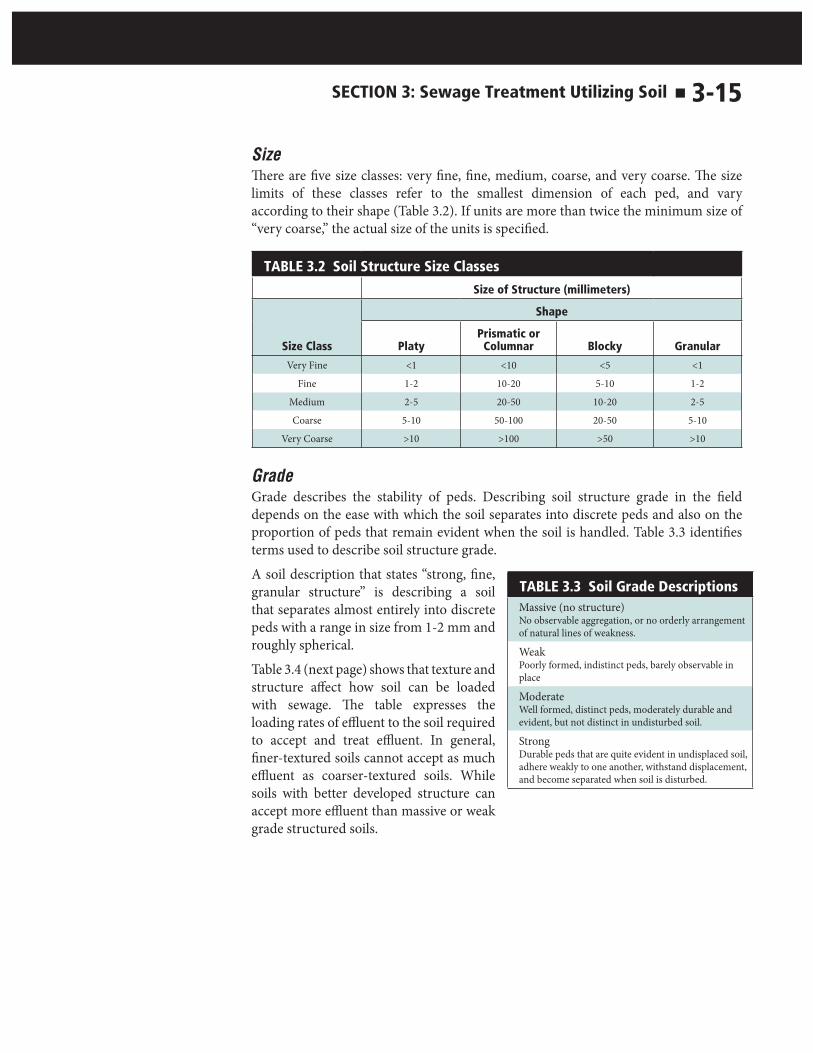
SizeThere are five size classes: very fine, fine, medium, coarse, and very coarse. The size limits of these classes refer to the smallest dimension of each ped, and vary according to their shape (Table 3.2). If units are more than twice the minimum size of “very coarse,” the actual size of the units is specified.
TABLE 3.2 Soil Structure Size Classes
Size of Structure (millimeters)
Size Class
Shape
PlatyPrismatic or
Columnar Blocky Granular
Very Fine <1 <10 <5 <1
Fine 1-2 10-20 5-10 1-2
Medium 2-5 20-50 10-20 2-5
Coarse 5-10 50-100 20-50 5-10
Very Coarse >10 >100 >50 >10
GradeGrade describes the stability of peds. Describing soil structure grade in the field depends on the ease with which the soil separates into discrete peds and also on the proportion of peds that remain evident when the soil is handled. Table 3.3 identifies terms used to describe soil structure grade.A soil description that states “strong, fine, granular structure” is describing a soil that separates almost entirely into discrete peds with a range in size from 1-2 mm and roughly spherical. Table 3.4 (next page) shows that texture and structure affect how soil can be loaded with sewage. The table expresses the loading rates of effluent to the soil required to accept and treat effluent. In general, finer-textured soils cannot accept as much effluent as coarser-textured soils. While soils with better developed structure can accept more effluent than massive or weak grade structured soils.
TABLE 3.3 Soil Grade DescriptionsMassive (no structure)No observable aggregation, or no orderly arrangement of natural lines of weakness.
WeakPoorly formed, indistinct peds, barely observable in place
ModerateWell formed, distinct peds, moderately durable and evident, but not distinct in undisturbed soil.
StrongDurable peds that are quite evident in undisplaced soil, adhere weakly to one another, withstand displacement, and become separated when soil is disturbed.

3-16 SECTION 3: Sewage Treatment Utilizing Soil
TABLE 3.4 IX - Loading rates for determining bottom absorption area and absorption ratios using detailed soils descriptions*
Treatment Level C Treatment Level A, A-2, B, B-2
USDA soil textureSoil structure and grade
Absorption area loading rate (gpd/ft2)
Mound absorption
ratio
Absorption area loading rate (gpd/
ft2)
Mound absorption
ratio***Sand, coarse sand, loamy sand, loamy coarse sand, fine sand, very fine sand, loamy fine sand, loamy very fine sand, 35 to 50% rock fragments
Single grain, granular, blocky, or prismatic structure; weak grade ** 1.0 ** 1.0
Sand, coarse sand, loamy sand, loamy coarse sand, <35% rock fragments
Single grain, granular, blocky, or prismatic structure; weak grade
1.2 1.0 1.6 1.0
Fine sand, very fine sand, loamy fine sand, loamy very fine sand, <35% rock fragments
Single grain, granular, blocky, or prismatic structure; weak grade 0.6 2.0 1.0 1.6
Sandy loam, coarse sandy loam, fine sandy loam, very fine sandy loam
Granular, blocky, or prismatic structure; weak to strong grade 0.78 1.5 1.0 1.6
Sandy loam, coarse sandy loam, fine sandy loam, very fine sandy loam
Platy with weak grade or massive 0.68 1.8 0.87 1.8
Loam Granular, blocky, or prismatic structure; weak to strong grade
0.6 2.0 0.78 2.1
Loam Platy with weak grade or massive 0.52 2.3 0.68 2.4
Silt loam, silt Granular, blocky, or prismatic structure; weak to strong grade
0.5 2.4 0.78 2.1
Silt loam, silt Platy with weak grade or massive 0.42 2.9 0.65 2.5
Clay loam, sandy clay loam, silty clay loam
Granular, blocky, or prismatic structure; moderate to strong grade
0.45 2.6 0.6 2.7
Clay, sandy clay, silty clay - ** ** ** **
* ONLY INCLUDES SOIL HORIZONS WITH <50% ROCK FRAGMENTS, WITH VERY FRIABLE AND FRIABLE CONSISTENCE, AND LOOSE NONCEMENTED SANDS. All USDA sands and loamy sands with 35% or more rock fragments or any soil horizons with >50% rock fragments must not come in contact with soil dispersal system media.** Conduct percolation test and size under Table IXa. May need to be designed under part 7080.2300.*** Assume a hydraulic loading rate to the sand at 1.6 gpd/ft2.

SECTION 3: Sewage Treatment Utilizing Soil 3-17
ConsistenceSoil consistence refers to the attributes of soil material as expressed in degree of cohesion and adhesion or in resistance to deformation on rupture (Soil Science Society of America, 2017). In the field, resistance of the soil structure to rupture is used to determine consistence. Consistence is highly dependent upon on the soil-water state and should be consistent. Therefore, it is required that moist samples be used. The amount of cohesion in the soil is important to soil-water movement. A soil with much cohesion will limit water movement compared to the same soil without a high degree of consistence. To determine a soil’s consistence, place a single soil structure or ped between thumb and forefinger. Apply force with thumb and forefinger for one second. Observe the relative force required to rupture the ped. Terms used to describe soil consistence are identified in Table 3.5.
TABLE 3.5 Rupture Resistance Classes
moist consistence class specimen fails under
loose (intact specimen not available.)
very friable very slight force between fingers
friable slight force between fingers
firm moderate force between fingers
extremely firm moderate force between hands or slight foot pressure
rigid foot pressure
Soil ColorsSoil colors are any observable coloration present in a unique layer of soil. Soil color varies from place to place in the landscape and from top to bottom in a soil profile. Accurate descriptions and interpretations of soil colors and soil color patterns are critical to understanding a site and eventually designing the appropriate soil-based sewage treatment system for the site.
Significance of ColorSoil color is one of the most useful soil properties to describe because it provides valuable information about the nature and conditions of the soil. Proper color identification and description are critical during a site evaluation because many other landscape, soil and hydrologic factors are interpreted based on the soil color. For instance, soil color is an indicator of natural drainage conditions.There are four dominant coloring effects on the soil: soil moisture, organic matter, iron, and uncoated soil grains. Soil moisture changes the color of a soil due to varying soil moisture levels. For instance, a muddy shoe has very dark soil stuck to it. When the same mud dries out, it is a lighter color due to soil moisture. For our soil coloring, we will always want to keep the soil moist. Most people recognize darker surface colors as being humus-enriched (organic matter). In Minnesota it is quite common to have six to 12 inches or more of these “top soil” colors before getting to the subsoil. These dark soils are commonly found where decomposition of plant matter is the greatest. It is rare to find a dark soil color below

3-18 SECTION 3: Sewage Treatment Utilizing Soil
a lighter color, unless the site has been disturbed. These dark colors cover or mask other features of the soil that may be important, so it is imperative to investigate these soils thoroughly.Iron in the soil is the source for the many varying shades of red, yellow, brown, and orange in soils. Iron is mostly inherited with the soil parent material, but some can accumulate from movement of water. Where bright soil colors dominate a soil layer, there is evidence that this soil is aerated or has oxygen present the majority of the time. Reddish brown colors in Minnesota soils are generally due to the iron-rich parent material from which the soil has developed. Large areas of these soils are found in northeastern and central Minnesota.The last coloring component to influence soil color is a lack of coatings on the soil grains. Soil colors are typically described as gray or light-colored. They can form due to vegetative conditions, soil parent materials, and/or soil saturation. A soil color description must be placed in the proper context during the site evaluation to ensure that the proper interpretation is made. Soils derived from sandy parent material(s) are generally light in color due to a lack of iron and small amounts of organic matter.Soil horizons may contain many different colors. The colors are derived from either the parent material or the soil-forming process. These processes may result in the formation of layers, banding, clay accumulations, silts coatings, organic stains, and nodules, all of different colors. All soil colors observed are potentially important to understanding the soil and site conditions. It is imperative that the site evaluator record all soil colors, including the dominant color (matrix color) and any additional colors (mottles) within each layer of soil. The designer will make the final interpretations as to the significance of soil colors present in a soil boring log. 7080.1100 Subp. 47. Matrix means the majority of the color in a soil horizon, as described in the Field Book for Describing and Sampling Soils.
Determining Soil ColorsBecause of the importance of soil color, a standard system is needed for consistent soil color description and for the development of standard color criteria. The color system referred to for soils is the Munsell Soil Color Charts (Munsell Color Company, 2000). Descriptions of soil color are comprised of three variables:
Hue: The primary colors or combinations of primary colors, such as red and yellow
Value: The measure of darkness or lightness of color, such as light red or dark red Chroma: The measure of the strength of color or level of brightness, or its departure from a dull color, such as grayish red or bright red
Soil color is measured by comparison with a standard color chart. The chart used by site evaluators is the Munsell color system. The standard Munsell chart for soil color consists of about 175 differently colored chips, systematically arranged on nine cards, including two cards for gleyed soils, assembled into a loose-leaf binder. Two for the reddest hues of soils and two for the bluish and greenish hues of gleyed soils, are also available. To order Munsell color books, contact the Onsite Sewage Treatment Program.

SECTION 3: Sewage Treatment Utilizing Soil 3-19
All colors displayed on any color page are of constant hue, which is a number and letter symbol in the upper right-hand corner of the Munsell Color Chart, also referred to as the page (Figure 3.12). Chroma, the deviation from gray, increases from left to right on each page. The scale for chroma occurs at the bottom of every page. The chroma is the same for each color chip in a column (vertical). As color chips graduate to lighter colors at the top of a color page, value increases. The scale for value is located at the far left of the color chart page; each row (horizontal) of chips will have the same value. Opposite each page containing color chips is a page of color symbols and corresponding English names, so that color can be expressed both by Munsell notation and color names.
Conditions for Measuring ColorThe quality and intensity of the light falling on a sample of soil affects the amount and quality of the light reflected from the sample to the eye. The moisture content of the sample and the roughness or smooth-ness of its surface also affects the amount and quality of the light reflected. The visual impression of color from the standard color chips is accurate only under standard conditions of light intensity and quality. Since the color standards are used in the field, it is important that the light be white enough that the sample reflects its true color and that the amount of light be adequate for visual distinction between chips.When the sun is low in the sky, the light reaching the sample is lower in intensity due to filtration by the atmosphere. For this reason, color determination may be inaccurate early in the morning or late in the evening, or in late fall through early spring. Readings of the sample color during these times are commonly one or more intervals of hue redder than at midday. Colors also appear different in the subdued light of a cloudy day than in bright sunlight. If artificial light is used, the light source should be a full light spectrum bulb (not a common incandescent or fluorescent bulb) and must be utilized as near midday as possible. Intensity of the incident light is especially critical when matching soil to chips of low chroma and low value.The color value of most soils becomes lower as the soil is moistened. Soil colors utilized in the soil survey and for SSTS determinations require coloring the soil under moist soil
FIGURE 3.12 Page from Munsell Color Book

3-20 SECTION 3: Sewage Treatment Utilizing Soil
conditions. The soil can be moistened with water or, if too wet, dried by blowing on a small ped. Usually one small application of wter to a dry soil will provide adequate moisture for coloring a soil sample. Color determinations of overly wet soil may be in error because of the effect of light reflected from water films, while dry soil colors will appear lighter and duller.
Reading the Color1. Take a ped from the horizon to be examined. Do not crush or break the ped.2. Adjust the water content of the ped to “moist.” This may be needed depending on
field conditions.3. Estimate the primary soil matrix color (Figure 3.13), and turn to the appropriate
Munsell page.
4. With the sun at your back, hold the sample behind the holes of the page. Match as closely as possible with the color book page perpendicular (a right angle) to the sun angle.
5. If you are not satisfied with the match, flip the page forward for browner or redder colors, backward for more olive or gray colors.
6. Record the color or colors that provide the closest match (Figure 3.14).7. Break, cut, or crush (but do not rub) the ped to see if the ped interior color differs from the ped surface. If so, repeat steps 3 to 6 above for the ped interior.
Mottles7080.1100 Subp. 49. “Mottles” means the minority of the variegated colors in a soil horizon, as described in the Field Book for Describing and Sampling Soils.
Soil mottles are the soil colors that are in the minority if more than one soil color is pres-ent (Figure 3.15). Soil mottles can be almost any color.
FIGURE 3.14 Record Soil Colors
FIGURE 3.13 Munsell’s Primary Soil Matrix Color Options

SECTION 3: Sewage Treatment Utilizing Soil 3-21
Color pattern within soil horizons are described for: Matrix color (dominant color) Mottle colors (minority colors
including silt coats, clay accumulations, organic stains, etc.)It is important to describe a fresh, field-moist soil face. When looking at a single unbroken ped, you may be viewing a coating on the ped. This coating can be organic material, silt, clay or an iron compound. Breaking or crushing (but not rubbing) will reveal the color of the ped interior, as shown in Figure 3.16. If the ped interior has two or more colors, the majority color is considered the matrix color, and the minority color is the mottle color. If the ped is not coated, the matrix color will be at the ped surface.The ped exterior, ped interior, and all mottle colors should be recorded. The physical state of the sample should be recorded as broken, crushed, or cut. In mottled soils with thick ped coatings, the color and patterns of faces of peds, and those of a surface broken through
the peds, can be markedly different as shown in Figure 3.16. The soil must be in a moist state when examined.Contrast refers to the degree of visual distinction that is evident between mottle and matrix colors. Contrast may be described as faint, distinct, or prominent. See Table 3.6 (next page) for all criteria for level of contrast. Faint: Evident only on close
examination; hue, value, and chroma of mottles and matrix are similar.7080.1100 Subp. 29. Faint means a soil color:
a. with the same hue as another soil color but that varies from the other color by two or fewer units of value and not more than one unit of chroma;
Figure 3.15 Mottles and Matrix
FIGURE 3.16 Interpreting Soil Peds

3-22 SECTION 3: Sewage Treatment Utilizing Soil
b. that differs from another soil color by one hue and by one or fewer units of value and not more than one unit of chroma; or
c. that differs from another soil color by two units of hue with the same value and chroma.
Distinct: Readily seen; soil color varies by one or more hue, more than two units of value, or more than one chroma.
7080.1100 Subp. 19. “Distinct” means a soil color that is not faint.
Prominent: Observable from several feet away; soil mottle color varies significantly from matrix color. Chapter 7080 defines prominent as being distinct.
An example of prominent contrasting mottles is “pale-brown (10YR 6/3) fine sand, with many coarse, prominent, reddish-brown (5YR 5/6) mottles.”
TABLE 3.6 Contrast Classes and Color Differences
Contrast Class Code Difference in Color Between Matrix and Mottle (Δ means “difference between”)
Hue (h) Value (v) Chroma (c)
Faint1 F
Δh = 0: Δv < 2 and Δc < 1
Δh = 1: Δv ≤ 1 and Δc ≤ 1
Δh = 2: Δv = 0 and Δc = 0
Distinct1 D
Δh = 0: or
Δv ≤ 2 Δv > 2 to < 4
and and
Δc > 1 to < 4 Δc < 4
Δh = 1: or
Δv ≤ 1 Δv > 1 to < 3
and and
Δc > 1 to < 3 Δc < 3
Δh = 2: or
Δv = 0 Δv > 0 to < 2
and and
Δc > 0 to < 2 Δc < 2
Prominent1 P
Δh = 0: Δv ≥ 4 or Δc ≥ 4
Δh = 1: Δv ≥ 3 or Δc ≥ 3
Δh = 2: Δv ≥ 2 or Δc ≥ 2
Δh ≥ 3:1 If compared colors have both a Value ≤ 3 and a Chroma of ≤ 2, the contrast is Faint, regardless of Hue differences.
Redoximorphic FeaturesA specific kind of mottle (color variation) occurs in soils that are subject to seasonal saturation, known as redoximorphic features. These color changes are the result of chemical and biological reactions that typically occur in wetter soil horizons. The presence of these features indicates there is a limiting condition present in this soil that the SSTS design must address. Minnesota state regulations require the identification of these features in order to accurately determine the suitability of each site for a SSTS.7080.1100 Subp. 59. Periodically saturated soil means the highest elevation in the soil that is in a reduced chemical state due to soil pores filled or nearly filled with water causing anaerobic conditions. Periodically saturated soil is determined by the presence of redoximorphic features in conjunction with other established indicators as specified in part 7080.1720, subpart 5, items E and F, or determined by other scientifically established technical methods or empirical field measurements acceptable to the permitting authority in consultation with the commissioner.

SECTION 3: Sewage Treatment Utilizing Soil 3-23
These features remain evident in the soils, allowing the site evaluator to correctly identify soils subject to periodic saturation even when the soil is dry. Alternating periods of saturation and unsaturated conditions in the soil profile results in soil color changes evidenced by mottled shades of gray, reddish or orange, bluish grays, or a high content of organic matter at the soil surface (e.g. mucky).7080.1100 Subp. 65. Redoximorphic features means:
a. a color pattern in soil, formed by oxidation or reduction of iron and manganese in saturated soil coupled with their removal, translocation, or accrual, which results in the loss (depletion) or gain (concentration) of mineral compounds compared to the matrix color; or
b. a soil matrix color controlled by the presence of ferrous iron. Redoximorphic features are described in part 7080.1720, subpart 5, item E.
Redoximorphic Feature FormationA typical dry upland soil has mostly air (oxygen) filling the void spaces between the soil particles. The air can move into the soil readily and supply soil microbes with enough oxygen to survive. Brighter soil colors are a result of the oxidation (i.e., exposure to oxygen) that occurs in dry soil conditions.When the voids or pore spaces of a soil are filled with water instead of air, soil microbes are prevented from using oxygen and must utilize other constituents in the soil to survive. Without oxygen, the microbes are able to adapt and utilize other electron acceptors in the soil, particularly iron. When iron is used in this way, the soil microbes are able to change (i.e. chemically reduce) iron from its rust (oxidized) form to its steel blue (reduced) form. Not only is this color change observable, but the higher solubility of iron in its reduced form is dissolved and transported in water, while oxidized iron is not transported in water. The movement of reduced iron with the water in the soil will result in areas where iron has been removed (i.e., depletions with dull colors), accumulated (i.e., concentrations with bright colors), and reduced but not removed (i.e., the reduced iron is still present with gleyed colors). Gley colors are typical where water levels are static or do not have strong gradients of movement. These types of formations in the soil are known collectively as redoximorphic features, soil
features that form by the processes of reduction and oxidation (redox). Before the redox reactions can take place in the soil, the soil must meet four conditions:a. soil is saturated, soil pores filled with water;b. soil water is depleted of any dissolved oxygen; c. soil temperature is above biological zero (>41 degrees F); and d. soil contains a readily usable form of organic matter for microbial activity. If all four of these soil conditions are simultaneously met in the soil, then the reduction reactions will occur, potentially altering soil colors.
Redoximorphic Feature DescriptionRedoximorphic features are described in the same way as mottling is described above. The only additional criteria to record about the redox features are the kind (depletion, concentration, or gley)(see Figure 3.17).
FIGURE 3.17 Concentrations and Depletions

3-24 SECTION 3: Sewage Treatment Utilizing Soil
Other Soil FeaturesThe site evaluator should be aware that there are other soil features that have not been previously described. They are important because the site evaluation may confuse some of these features with soil redoximorphic features caused by wetness. These include clay films or silt coatings on the surface of the peds. The site evaluator should include these features in their descriptions. The presence of iron-based redoximorphic features, particularly in gray (i.e., high value, low chroma) soil matrix, often indicates periodic saturation. The features discussed here are identifiable bodies embedded in the soil. Some of these bodies are thin and sheet-like; some are spherical; others have irregular shapes. They may contrast sharply with the surrounding material in strength, composition, or internal organization.
Nodules and ConcretionsNodules and concretions are discrete bodies. They are commonly cemented. They may also be uncemented but coherent units that separate from the surrounding soil along clearly defined boundaries. They range in composition of chemical compounds (see Figure 3.18).
Soft accumulationsSoft accumulations contrast with the surrounding soil in color and composition but are not easily separated as discrete bodies, although some have clearly defined boundaries. Most soft accumulations consist of calcium carbonate, iron, and manganese (Figure 3.19).
Soft rock fragmentsSoft rock fragments have rock structure, but break down or crush easily.
Surface featuresThe surfaces of individual peds may have coats of a variety of substances and covering part or all of the surfaces. Descriptions of surface features may include kind, location, amount, continuity, distinctness, and thickness of the features. In addition, color, texture, and other characteristics that apply may be described, especially if they contrast with the characteristics of the adjacent material.
Roots and root tracesThe presence of roots in each layer is recorded in soil descriptions. The absence of roots or the orientation of roots may indicate hardpan, saturated soil, or bedrock (see Figure 3.20).
Soil ProfileA soil profile is a vertical section of a soil consisting of one or more soil horizons and the unweathered material underlying the horizons. A thorough description of a soil profile to a depth of six feet or greater provides the site evaluator with valuable information about the soil. A soil profile can inform the evaluator about the hydrology, depositional environment, limiting condition(s), problem soil situations, percentage of rock, disturbance history, and many other soil and site features. The wall of an excavation pit is a good place to study the soil profile.
FIGURE 3.18 Nodules and Concretions
FIGURE 3.20 Roots and Root Traces
FIGURE 3.19 Soft Accumulations

SECTION 3: Sewage Treatment Utilizing Soil 3-25
Soil HorizonsWeathering of the parent material over time forms different layers in the soil called horizons. A soil horizon is a layer of soil approximately parallel to the soil surface with similar characteristics. Soil horizons are identified by observing changes in soil properties with depth. Changes in soil texture, structure and/or color are some of the characteristics used to determine soil horizons (see Figure 3.21).
Soils vary widely in the degree to which horizons are expressed. Relatively recent geologic formations, such as alluvial fans, may have no recognizable horizons although they may have distinct layers that reflect geologic deposition. As soil formation progresses, horizons may be detected in their early stages only by very careful examination. As weathering increases, horizons are more easily identified in the field. The term layer, rather than horizon, is used when all of the properties are inherited from the parent material (geologic strata) and not from soil-forming processes.Typically, horizon distinctness decreases
below three to five feet in depth, which corresponds to the depth of soil structure development. Horizons below this depth are characteristically thicker, and the boundaries between horizons are not easily seen. Technically, the loss of structure development is the lowest horizon of the soil; deeper horizons are actually parent material (such as unweathered glacial till or unweathered loess). Since each horizon has its own set of soil characteristics, it will respond differently to applied sewage tank effluent. Also, the conditions at the boundary between soil horizons can significantly influence effluent movement and treatment in the soil. Effluent movement between horizons can be severely limited when extreme differences between two soil horizons exist.Horizons are described and differentiated from one another on the basis of the following characteristics:
Texture Matrix color Mottles Structure Consistence Presence or absence of roots
The depth at which one or more of these characteristics appreciably changes will be described and recorded. A soil boring log sheet is provided at septic.umn.edu/ssts-professionals/forms-worksheets to aid in recording the soil description.
FIGURE 3.21 Soil Horizons

3-26 SECTION 3: Sewage Treatment Utilizing Soil
Determining BoundariesBoundaries between horizons are determined by any change in color, texture, soil structure, or other soil property. For example, in Figure 3.22, Horizon 1 is 12 inches thick and is a black sandy loam. Horizon 2 is from 12 to 36 inches and is a brown sandy loam. Horizon 3 is from 36 to 72 inches and is a brown loam. At the bottom of the soil-boring log, the total depth of the boring hole should be entered as well as any evidence of mottling or saturated soil conditions.
Soil MorphologySoil morphology is defined as the visible characteristics of the soil or any of its parts (Soil Science Society of America, 2017). It is the term used by soil scientists to refer to the complete observation, description, and interpretation of the soil profile.
Soil PoresSoil pores are the void spaces between soil particles. These voids provide important functions in the soil, including air and liquid exchange. A soil with a high volume of pores has a high pore space. A soil described as dense or restrictive will typically have less pore space.Pores are generally described as either macropores or micropores. Macropores are large pores. Macropores are important for preferential flow of gases and liquids through the soil. If water or liquids are applied to the soil at rates exceeding the unsaturated hydraulic conductivity, liquids move through the soil profile mainly via saturated flow through macropores, thereby bypassing micropores and rapidly transporting any solutes to the lower soil profile. This type of water movement is a concern for the proper treatment of septic tank effluent.Micropores are the smaller voids between individual soil particles, found on the interior of soil peds. Soil water movement in these pores occurs under unsaturated soil conditions and typically is associated with increased levels of effluent treatment. Micropores are also partly responsible for the capillary fringe, which is a zone in the soil just above the plane of saturation that wicks moisture and causes saturated or almost saturated conditions.
Soil PermeabilitySoil permeability is the ease with which gases, liquids, or plant roots penetrate or pass through a bulk mass of soil or a layer of soil (Soil Science Society of America, 2008). This general concept of soil permeability has no inherent measurable properties but is similar to soil saturated hydraulic conductivity. Most existing soil survey reports will list the soil permeability, but this measurement is actually a measure of the soil’s saturated hydraulic conductivity.
Saturated Hydraulic ConductivitySaturated hydraulic conductivity is a quantitative measure of a saturated soil’s ability to transmit water when subjected to a hydraulic gradient. It can be thought of as the ease with which pores of a saturated soil permit water movement.
FIGURE 3.22 Soil Horizon Boundaries
SECTION 3: Sewage Treatment Utilizing Soil 3-27
To convert from saturated hydraulic conductivity (inches per hour) to percolation units, divide the conductivity value into the number 60. For example:
60 minutes ÷ 2 in./hr = 30 minutes per inch (mpi).
To convert from percolation rate units to conductivity units, divide the percolation rate into 60. For example:
60 minutes ÷ 30 min/in. = 2 in./hr
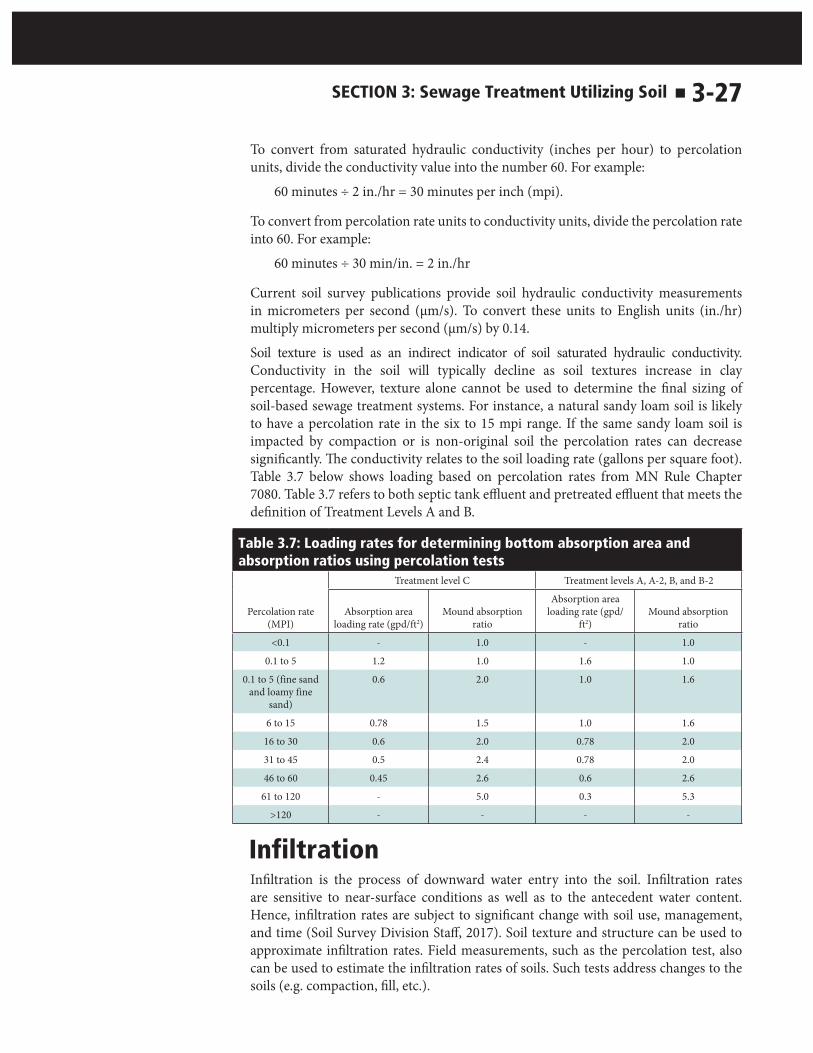
Current soil survey publications provide soil hydraulic conductivity measurements in micrometers per second (μm/s). To convert these units to English units (in./hr) multiply micrometers per second (μm/s) by 0.14.Soil texture is used as an indirect indicator of soil saturated hydraulic conductivity. Conductivity in the soil will typically decline as soil textures increase in clay percentage. However, texture alone cannot be used to determine the final sizing of soil-based sewage treatment systems. For instance, a natural sandy loam soil is likely to have a percolation rate in the six to 15 mpi range. If the same sandy loam soil is impacted by compaction or is non-original soil the percolation rates can decrease significantly. The conductivity relates to the soil loading rate (gallons per square foot). Table 3.7 below shows loading based on percolation rates from MN Rule Chapter 7080. Table 3.7 refers to both septic tank effluent and pretreated effluent that meets the definition of Treatment Levels A and B.
Table 3.7: Loading rates for determining bottom absorption area and absorption ratios using percolation tests
Treatment level C Treatment levels A, A-2, B, and B-2
Percolation rate (MPI)
Absorption area loading rate (gpd/ft2)
Mound absorption ratio
Absorption area loading rate (gpd/
ft2)Mound absorption
ratio
<0.1 - 1.0 - 1.0
0.1 to 5 1.2 1.0 1.6 1.0
0.1 to 5 (fine sand and loamy fine
sand)
0.6 2.0 1.0 1.6
6 to 15 0.78 1.5 1.0 1.6
16 to 30 0.6 2.0 0.78 2.0
31 to 45 0.5 2.4 0.78 2.0
46 to 60 0.45 2.6 0.6 2.6
61 to 120 - 5.0 0.3 5.3
>120 - - - -
InfiltrationInfiltration is the process of downward water entry into the soil. Infiltration rates are sensitive to near-surface conditions as well as to the antecedent water content. Hence, infiltration rates are subject to significant change with soil use, management, and time (Soil Survey Division Staff, 2017). Soil texture and structure can be used to approximate infiltration rates. Field measurements, such as the percolation test, also can be used to estimate the infiltration rates of soils. Such tests address changes to the soils (e.g. compaction, fill, etc.).

3-28 SECTION 3: Sewage Treatment Utilizing Soil
Plastic LimitPlastic limit (PL) is defined as the minimum water content at which the mixture acts as a plastic solid. The behavior of dry soil changes as the soil takes on an increasing amount of water. When dry, the soil is rigid and solid, but as more water is added, it starts to lose strength. If the soil contains expansive clays, such as smectite, the soil will also begin to swell. As the soil swells, it becomes plastic and will remain in this plastic state until the liquid limit is exceeded, at which point the soil will change into a viscous liquid that will flow when disturbed. The amount of water required to shift soil from a plastic to a liquid consistency is known as the Atterburg limit and is expressed as a percent. 7080.1100 Subp. 60. Plastic limit means a soil moisture content above which manipulation will cause compaction or smearing. The plastic limit can be measured by American Society for Testing and Materials, Standard Test Methods for Liquid Limit, Plastic Limit, and Plasticity Index of Soils, ASTM D4318 (2005).
Soils at or near the plastic limit will be significantly altered by normal construction activities (e.g., traffic, excavation, building, etc.). The alteration can render a soil that was suitable for an SSTS into one that will no longer support an SSTS. To assess the soil’s ability to suitably withstand the construction activities at the current soil moisture status, the below procedure should be followed.
Procedure for Determining Plastic Limit in the Field1. Select a handful of soil for testing. Any non-soil material, rocks, roots, etc. should
be removed. Do not add moisture or let the sample dry-out. Sample should be taken at the depth of excavation (absorption area.)
2. Roll the sample between the palms (in the shape of a pencil/worm shape). 3. Continue rolling the thread until it reaches a uniform diameter of 1/8 inch if
possible (See Figures 3.23 and 3.24).
FIGURE 3.23 Roll Sample Between the Palms FIGURE 3.24 Field Determination of Plastic Limit

SECTION 3: Sewage Treatment Utilizing Soil 3-29
4. If the sample does not reach a diameter of 1/8 inch, the soil moisture content is lower (i.e. soil is drier) than the plastic limit and construction can proceed.
5. If the sample is rolled into a diameter equal to 1/8 inch or less before breaking, the soil is at or above the soil moisture content required to meet or exceed the plastic limit (i.e. soil is too wet) and construction should not occur.
PorosityPorosity is a measure of the volume of pores in a soil sample (nonsolid volume) divided by the bulk volume of the sample (Soil Science Society of America, 2017). Also referred to as the amount of void space between soil particles, soil porosity can range from 35 to 50 percent of a soil volume. In disturbed or compacted soils, porosity can be much less. Texture, structure, and organic matter are all important in determining soil porosity. The higher the porosity, the more potential for efficient movement of liquids or septic tank effluent through the soil.
Bulk DensityBulk density is an indicator of the total porosity of the soil. It is calculated as the mass (grams) per given volume of soil (cubic centimeters), which includes pore spaces. An average bulk density is 1.3 grams per cubic centimeter. As bulk density increases, liquid movement through the soil will decrease, requiring more land area to treat and hydraulically accept septic tank effluent.Lower horizons in the natural soil profile tend to have higher bulk densities than upper layers because subsoils are generally more compacted due to the overlying weight of the upper soil. They usually contain less organic matter, and thus a less open granular structure. Often subsoils accumulate clays and iron oxides that have washed down from the upper horizons. These clay particles may become trapped in larger pores, reducing the overall pore space.
Percolation RatePercolation rate or perc rate, is the length of time it takes for water flow downward in or into the soil. It is measured in minutes per inch (mpi). A higher percolation rate indicates that the soil or horizon tested accepts liquids at a slower rate due to a number of soil factors. This finding suggests a larger area for treatment and acceptance of septic tank effluent will be required. Percolation testing should be completed at multiple locations in the proposed soil treatment area. Detailed instructions for completing a Percolation Test are included in Chapter 4.
Soil Formation Soil formation describes the variables, usually interrelated natural forces, that are active in and responsible for the formation of soil. These factors are usually grouped into five major categories as follows: parent material, climate, organisms, topography, and time (Soil Science Society of America, 2017).The process of soil formation is physical, chemical, and biological. During soil formation, some constituents of the parent material are lost (subtractions), others get concentrated (additions), some are altered (transformed), and others moved (translocated).

3-30 SECTION 3: Sewage Treatment Utilizing Soil
The results of soil formation are the accumulation of organic matter (topsoil development), formation of soil structure (aggregation of sand, silt, and clay into peds), horizonation, redoximorphic features formation, and the development of characteristic soil colors.
Parent MaterialsParent material is the geologic material from which a soil is formed. Knowing the type of parent material and understanding its characteristics are critical to determining whether the soil is suitable for an SSTS. In many places in Minnesota, sufficient time and resources are needed to distinguish among the kinds of parent material(s). The common types of parent materials in Minnesota are glacial till, glacial outwash, alluvium, loess, organic materials, lacustrine deposits, and weathering bedrock. They are briefly described below and are shown in Figure 3.25.
FIGURE 3.25 Minnesota’s Parent Materials
LacustrineLacustrine sediments are composed of material ranging from fine clay to sand derived from glaciers and are deposited in glacial lakes by water originating mainly from the melting of glacial ice. Many are bedded or laminated with varves (Soil Science Society of America, 2017). The Red River Valley of the North in northwestern Minnesota is an example of a landscape with soils derived from this process. These soils are characterized by clay soils and limitations due to saturation close to the land surface. Lacustrine landscapes are usually quite flat and absent of surface rocks. These soils are generally very limiting for SSTS due to their fine textures, flat landscapes, and wetness.
AlluviumAlluvial sediments are deposited by the running water of streams and rivers. Deposits may occur on terraces well above present streams, on the present flood plains or deltas, or as a fan at the base of a slope. Typically these deposits are stratified, with textures including gravel, sand, silt, clay, and all variations of mixtures of these. These sediments can be extremely difficult to interpret due to the constant additions of soil materials and burial of older sediments. The suitability of alluvial soils for SSTS commonly relies on the evaluation of the slope shape, hillslope position, and elevation of the proposed site in relation to established floodplain elevations.
SECTION 3: Sewage Treatment Utilizing Soil 3-31
ColluviumColluvium is the unconsolidated, unsorted earth material transported or deposited on sideslopes and/or at the base of slopes by mass movement (i.e., direct gravitational action) and by local, unconcentrated runoff (Soil Science Society of America, 2017). Soil properties may at first appear to be glacial till, but a thorough investigation of the site should confine these parent materials to the bases (foot and toe slopes) of steeper hills.
Glacial Outwash Glacial outwash is stratified sand and gravel removed or washed out of a glacier by melt-water streams and deposited in front of or beyond the end moraine or the margin of a glacier (Soil Science Society of America, 2008). These locations are typically sources of aggregate for many purposes. Because of its coarse textures, outwash presents problems for treatment of septic tank effluent. The following rule language applies to such soils when used for an ISTS.MN Rules Chapter 7080.2150, subp. 3 C 1(b)Any soil layers that are any of the United States Department of Agriculture (USDA) soil textures classified as sand with 35 to 50 percent rock fragments or loamy sand with 35 to 50 percent rock fragments must be credited at only one-half their thickness as part of the necessary treatment zone. Soil layers, regardless of soil texture, with greater than 50 percent rock fragments must not be credited as part of the necessary treatment zone. Layers that are given full, partial, or no credit must, in any layering arrangement in the soil profile, be cumulatively added to determine the amount of soil treatment zone in accordance with other soil treatment zone provisions; Refer to the first three rows of Table 3.4 to identify acceptable loading rates for SSTS in these soils.
Glacial TillGlacial till is an extensive parent material in Minnesota. Glacial till is deposited directly by glacial ice with little or no transportation by water. It is generally an unstratified, unconsolidated, heterogeneous mixture of clay, silt, sand, gravel, and boulders. Most areas composed of these materials were overridden by glaciers and today are characterized by dense and low-permeability subsoils. Till varies widely in texture and chemical composition. In Minnesota there are multiple glacial advances affecting our soils. Glaciers originated from three distinctly different directions, bringing very different glacial till materials. Reddish brown till originates out of the Lake Superior Basin. Grayish brown parent materials were transported by glacial ice traversing straight south over the Rainy River. Advances southeast from Manitoba brought yellowish brown sediments rich with calcium carbonates (crushed limestone) and numerous small fragments of sedimentary rocks.
LoessLoess is the name given to materials transported and deposited by wind and consisting of predominantly silt-sized particles (Soil Science Society of America, 2017). Soil materials are commonly stratified and can have subtle changes in texture that may

3-32 SECTION 3: Sewage Treatment Utilizing Soil
cause soil water saturation. These silt soils are very susceptible to soil erosion and should be protected from sloping and bare soil conditions. These areas are common in southeastern and southwestern corners of Minnesota.
Organic SoilsOrganic soils are soils in which the original plant parts may or may not be recognizable. Organic soils form in wet landscapes where organic matter (plant materials that are no longer living) accumulates more rapidly than it decomposes. These accumulations are called by various terms depending on the level of decomposition of the organic matter, including peat, muck, Histosol, sapric, fibric, hemic, or histic. Organic matter that is sufficiently thick can become a parent material for soils. Since these soils are associated with prolonged saturated soil conditions at or very near the soil surface, SSTS cannot be built in these areas. MN Rules Chapter 7080.1720 Subp. 5 E 3(b) mentions organic soils or mineral soils with an organic modifier (see above terms) identification during the site evaluation/field evaluation phase. When these soils are encountered, there is zero inches of suitable original soil. These are extremely limited soils and sites and should only be considered as a last resort for existing dwellings where there is absolutely no other land area available.
BedrockBedrock is a general term for the solid rock that underlies the soil and other unconsolidated material or that is exposed at the surface (Soil Science Society of America, 2017).7080.1100 Subp. 8. Bedrock means geologic layers, of which greater than 50 percent by volume consist of weathered in-place consolidated rock or rock fragments. Bedrock also means weathered in-place rock which cannot be hand augered or penetrated with a knife blade in a soil pit.
TypesSedimentary rock is formed from materials deposited from suspension or precipitated from solution that are usually more or less consolidated. The principal sedimentary rocks are sandstone, shale, limestone, greywacke, and conglomerate (Soil Science Society of America, 2008). Many sedimentary rock types are located in southeastern, southcentral, and southwestern Minnesota.Metamorphic rock is derived from preexisting rocks that have been altered physically, chemically, and/or mineralogically as a result of natural geological processes, principally heat and pressure, originating within the earth. The preexisting rocks may have been igneous, sedimentary, or another form of metamorphic rock (Soil Science Society of America, 2008). Common metamorphic rocks include slate, schist, and gneiss. These metamorphic rocks are found in northern and central Minnesota.Igneous rock formed from the cooling and solidification of magma, and that has not been changed appreciably by weathering since its formation (Soil Science Society of America, 2008). Basalts and granites are common igneous rocks found in northeastern, northcentral, northwestern, and central Minnesota.
IssuesBedrock presents numerous issues for the proper treatment and hydraulic acceptance of septic tank effluent due to its level of consolidation, presence near the soil surface,

SECTION 3: Sewage Treatment Utilizing Soil 3-33
cracks and fissures, etc. Below are some common SSTS treatment and acceptance issues with bedrock in Minnesota.KarstThe cause of karst land surface features is the dissolution of limestone, gypsum, or other rock as precipitation, runoff, and groundwater come into contact with limestone rock. The dissolution dissolves the carbonates in water and leaves voids in the bedrock.These conditions are typically expressed on landscapes by sinkholes, caves, and underground drainage (Soil Science Society of America, 2017). Karstic conditions and landscapes are found in southeastern Minnesota, where limestone bedrock is common. The common issue in karstic regions is proper treatment of septic tank effluent. The many voids in these areas that can permit water to move quickly to surface and/or groundwater, so a careful investigation of bedrock type, bedrock depth, and sinkhole proximity is imperative. It is also advantageous to use pressure distribution in karst areas to minimize the impact of the septic tank effluent on bedrock dissolution in the localized area. Mound ISTS are commonly recommended or required by local governments.Preferential flowThe process where water and its constituents move by a preferred pathway through a porous medium is known as preferential flow (Soil Science Society of America, 2017). Preferential flow conditions can also occur in soils, but in this section preferential flow is referred to in the context of bedrock conditions.Any site in Minnesota with bedrock near the soil surface may be susceptible to preferential movement of water through cracks, fissures, voids, etc. The nature of the local bedrock material(s) must be understood.The proper treatment of septic tank effluent is an issue with preferential movement. Rapid vertical or horizontal movement of water through any rock type will result in minimal treatment of septic tank effluent. Proper characterization of the bedrock topography (i.e, depth across proposed soil treatment area), maintaining adequate vertical separation, and developing an understanding of the local bedrock material(s) and conditions will reduce impacts to human health and the environment.Soft bedrockSoft bedrock is a term used to describe various types of sedimentary rocks. The term is derived from the ability to penetrate or excavate these bedrock types with standard hand or powered equipment. Most of our sedimentary bedrock is found in southern Minnesota.A few common issues arise with soft bedrock. First, it is difficult to distinguish between soil and bedrock in many areas. For these areas, soil pits are recommended. Second, the proper treatment of septic tank effluent is an issue where soft bedrock is found. While much of these soft bedrock areas may act similarly to soil, they have a lower ability to treat effluent due to their lack of biological activity (when compared to soil). Soft bedrock may still possess preferential flow, stratification (layering of materials), and restrictive conditions that may further limit its ability to treat effluent effectively.RestrictiveRestrictive conditions are a general term used to describe a bedrock type or condition that prevents the vertical movement of water. They are further indicated by the need for special equipment to excavate or extract samples.

3-34 SECTION 3: Sewage Treatment Utilizing Soil
These restrictive bedrock types or conditions can occur anywhere in Minnesota when bedrock is found near the soil surface. Common occurrences of these restrictive bedrock types occur in northern and central Minnesota.With restrictive bedrock, two issues that arise are the proper treatment of effluent and hydraulic acceptance. When restrictive bedrock occurs in an area, adequate treatment of the effluent must take place above this layer. An accurate assessment of the bedrock topography across the proposed soil treatment area should be completed. Hydraulic acceptance is another issue in restrictive bedrock situations. An area with adequate unsaturated soil conditions must be located to allow the treated effluent to permeate the soil, without causing a surface discharge.
ClimateClimate greatly affects the rate of soil formation. The two components of climate to be considered here are precipitation and temperature.
PrecipitationWater is necessary for mineral weathering and for plant growth. Surplus water participates in the downward translocation of very small mineral particles (e.g., clays and organic matter) and soluble salts (e.g., calcium carbonates). In Minnesota, precipitation increases from northwest to southeast, and in these regions subtle differences in the depths of certain minerals can be observed. Precipitation has the greatest influence on the native vegetation. Tallgrass prairies predominated the northwestern and drier portions of western Minnesota, while deciduous forests characterized the landscapes of southeastern Minnesota due in large part to precipitation differences. Variations in soils due to precipitation differences are not obvious within an area the size of a few counties, so precipitation is not usually cited as a reason for soils to vary over short distances (<100 miles).
TemperatureTemperature differences exist from north to south across Minnesota. Warmer soils have more biological activity and potential for chemical reactions. Every 10°C (approximately 18° F) increase in temperature increases the rate of biochemical reactions approximately two times. Increased weathering and clay formation occur with an increase in soil temperature. Differences in temperatures from the Canadian to the Iowan border do not significantly change our soils. Perhaps the most notable effect of temperature variation in Minnesota is the lower decomposition rates of organic matter in northern Minnesota. When this decreased decomposition is combined with wet landscapes, the result is expansive areas of peatlands.
Time of Soil FormationThe length of time over which a soil forms is another soil forming factor. Generally, a soil allowed to form for longer periods of time will have more translocated and weathered minerals. Due to our deposits of glacially-derived soil materials (12,000-18,000 years before present) in Minnesota, we have little variation in time of soil formation. There are very few older soils found in protected areas of southern Minnesota, and there are much more recent soil deposits across Minnesota due to flooding and cut and fill activities. These young soils have not had time to change to reflect their current conditions and should be interpreted with caution.

SECTION 3: Sewage Treatment Utilizing Soil 3-35
Vegetation and OrganismsPlantsPlants affect soil formation by producing organic matter, nutrient cycling, and the movement of water. The most obvious effect of organisms on soil development is that caused by the natural vegetation. Rooting of plants helps form much soil structure in our soils. Forested soils contain less organic matter than prairie soils. This difference in the amount and distribution of organic matter is related to the annual growth and fall die off of most prairie plants versus the accumulation of organic matter in the trunk and branches of trees. Accurately interpreting of the soil requires an understanding of the native vegetation that has occurred on the site.
Microorganisms and Soil-Dwelling AnimalsMicroorganisms play an important role in organic matter mineralization and nutrient cycling. Soil animals are consumers and decomposers of organic matter; however, the most obvious role of animals appears to be that of earthmovers.
TopographyThe word topography is commonly used to refer to the shape or elevations of the landscape. Differences in topography can cause wide variations in soils within
the confines of a single field or single hillslope. Topography plays a role in the distribution of precipitation (runoff, run on , and infiltration) and determines the extent to which the water table influences soil development.Topography includes: Slope shapes or curvatures, which can be convex, concave, or planar
(see Figure 3.26) Catchment area, also referred to as a watershed. Either term refers to
all the surrounding lands that contribute water (surface or subsurface) to the site Relief, the difference in elevation of land surface Landscapes, which are a collection of related landforms; usually the land
surface which the eye can comprehend in a single view Landforms, which are specific features in a natural landscape such as a
floodplain, stream terrace, ridge-top, or valley Slope, the elevation difference over a unit length. Slope affects the velocity
at which water moves over or through the soilLandscape diagrams and common onsite problems encountered with certain landscapes are given in Chapter 4: Site Evaluation
Minnesota SoilsMinnesota is comprised of complex combinations of predominantly glacially-affected landscapes. A careful understanding of these landscapes and component landforms is crucial to developing a complete understanding of a soil and site for SSTS evaluation. Soil textures and soil colors vary in large part to parent material differences and water movement in the soil. Soil colors also can change due to seasonal saturation, and these color changes will remain evident even after the soil has been allowed to drain.
FIGURE 3.26 Slope Shapes or Curvatures

3-36 SECTION 3: Sewage Treatment Utilizing Soil
A complete soil boring log involves the observation, description, and interpretation of: Impacts of effluent on groundwater Soil treatment processes Soil texture Soil structure Consistence Soil colors Soil formation Water movement dynamics
Failure to consider and understand the importance of each component can result in an incomplete understanding of the soils and may cause the SSTS to function at a suboptimal level.
SECTION 3: Sewage Treatment Utilizing Soil 3-37
ReferencesBouma, J., 1979. Subsurface applications of sewage effluent. In: Planning the uses and management of land. M.T. Beatty, G.W. Petersen and L.D. Swindale (Eds.). Agronomy 21. Am. Soc. of Agronomy. Madison, WI. pp. 665-703.Converse, J.C., M.E. Kean, E.J. Tyler and J.O. Peterson. 1991. Bacterial and nutrient removal in Wisconsin at-grade on-site systems. In: On-site Wastewater Treatment. Proceedings of the Sixth National Symposium on Individual and Small Community Sewage Systems. American Society of Agricultural Engineers. St. Joseph MI. pp. 46-61.Converse, JC, Kean, ME, Tyler, EJ, Peterson, JO. 1992. Nitrogen, Fecal Coliforms and Chlorides Beneath Wisconsin At-Grade Soil Absorption Systems, Proceedings of the 7th Northwest On-Site Wastewater Treatment Short Course and Equipment Exhibition, University of Washington, Seattle, WA. 105-123.Coyne, M.S. 1999. Soil microbiology: and exploratory approach. Delmar Publishers, NY. p. 124-136.Eastburn, R.P. and W.F. Ritter. 1984. “Denitrification in on-site wastewater treatment systems - a review,” in On-site Wastewater Treatment. Proceedings of the 4th National Symposium on Individual and Small Community Sewage Systems. New Orleans, LA, Dec. 10-11, 1984. Am. Soc. of Ag. Engineers.Gerba, C.P. and G. Bitton. 1984. Microbial pollutants: their survival and transport pattern to groundwater. In G. Bitton and C.P. Gerba (Eds.) Groundwater Pollution Microbiology. John Wiley & Sons Inc., NY p. 65-88.Lowe, K., Rothe, N., Tomaras, J., DeJong, K., Tucholke, M., Drewes, J., McCray, J., Munakata-Marr, J. 2007. Influent constituent characteristics of the modern waste stream from single sources: literature review. Final Report. Water Environment Research Foundation, Alexandria, VA.Magdorf, F.R., D.R. Keeney, J. Bouma, W.A. Ziebell. 1974. Columns representing mound type disposal systems for septic tank effluent: II. nutrient transformations and bacterial populations. Journal of Environmental Quality. 3(3) p .228-234.Minnesota Rule Chapter 7080. 2016. Subsurface sewage treatment systems program. www.revisor.mn.gov/rules/?id=7080. verified 8/29/2016.Munsell Color Company. 2000. Munsell Soil Color Charts, Munsell Color, Macbeth Division of Kollmorgen Instruments Corporation. New Windsor, NY, USA.Sawhney, B.L. 1977. Predicting phosphate movement through soil columns. Journal of Environmental Quality. 6:86-89.Siegrist, R.L. 1987. Soil clogging during subsurface wastewater infiltration as affected by effluent composition and loading rate. Journal of Environmental Quality. 16(2) p. 181-187.Soil Survey Division Staff. 2017. Soil survey manual. C. Ditzler, K. Scheffe, and H.C. Monger (eds.). USDA Handbook 18. Government Printing Office, Washington D.C.Soil Science Society of America. 2017. Glossary of soil science terms. www.soils.org/publications/soils-glossary. verified 10/6/2017.

3-38 SECTION 3: Sewage Treatment Utilizing Soil
US EPA. 1980. Design manual - Onsite wastewater treatment and disposal systems. Van Cuyk, S. and R.L. Siegrist. 2006. Virus removal within a soil infiltration zone as affected by effluent composition, application rate, and soil type. Water Research 41(3): pp699-709.US EPA. 2017. Septic (Onsite) Systems. www.epa.gov/septic. verified10/6/2017Van Cuyk, S., R. Siegrist, A. Logan, S. Masson, E. Fischer and L. Figueroa. 2001. Hydraulic and purification behaviors and their interactions during wastewater treatment in soil infiltration systems, Water Res. 35(4), pp. 101-110.


![SECTION 3 Sewage Treatment Utilizing Soil...SECTION 3: ^ Á P d u v h o ] Ì ] v P ^ } ] o 3-1SEWAGE TREATMENT UTILIZING SOIL Suitable soil is an effective treatment medium for sewage](https://static.fdocuments.in/doc/165x107/60e29e0535d6ec1215397da9/section-3-sewage-treatment-utilizing-soil-section-3-p-d-u-v-h-o-oe-.jpg)