©2005 PJM 1 APEx The Mature PJM Market Kenneth W. Laughlin PJM October 31, 2005 Orlando, FL.

State of the Market 2003 94 www.pjm.com State of the Market 2003 95 www.pjm.com
3 –
Inte
rchange T
ransa
cti
ons
Section 3 – Interchange Transactions
PJM has interfaces with four contiguous, external regions. These interfaces are the seams between PJM and other regions. PJM market participants import energy from, and export energy to, external regions on a continuous basis.1 These transactions may fulfill long-term or short-term bilateral contracts or take advantage of price differentials. At the end of 2003, PJM’s four interfaces had five interface pricing points: PJM/New York Independent System Operator (PJM/NYIS), PJM/FirstEnergy Corp. (PJM/FE), PJM/Duquesne Light Company (PJM/DLCO), PJM/AEPVP, and PJM/Ontario Independent Electricity Market Operator (PJM/IMO). The first three were in place at the beginning of the year; the last two were created in 2003 to help manage loop flow issues. In March, PJM/AEPVP was formed by combining the PJM/American Electric Power Company, Inc. (PJM/AEP) and PJM/Virginia Electric and Power Company (PJM/VAP) interfaces. On August 1, 2003, PJM/IMO was created.
Overview
Transaction Activity
• Aggregate Imports and Exports. For each month of 2003, PJM was a net importer of power, averaging 1.15 million MWh of net imports per month, or slightly less than the year 2002 level of 1.23 million MWh. The 2003 average monthly gross import volume of 2.60 million MWh also represented a slight decline from 2.67 million MWh in 2002. Gross exports changed little in 2003 from 2002, averaging 1.45 million MWh in 2003 and 1.44 million MWh in 2002.
• Interface Imports and Exports. During 2003, net imports at two interfaces accounted for 96 percent of total net imports. Net imports at the PJM/AEPVP interface were 49 percent and net imports at the PJM/FE interface were 47 percent. Net exports occurred only at the PJM/NYIS interface.
Interchange Transaction Issues
• Loop Flow. Loop flow results when the transmission contract path for energy transactions does not match the actual path of energy flows on the transmission system. Loop flows can arise from transactions scheduled into, out of or around the PJM system. Outside of PJM’s LMP-based Energy Market, energy is scheduled and paid for based on contract path while the actual associated energy deliveries flow on the path of least resistance. Loop flows can result when a transaction is scheduled between two external control areas and some or all of the actual flows occur at PJM interfaces. Loop flows can also result when transactions are scheduled into or out of PJM on one interface, but actually flow on another. Although total PJM scheduled and actual flows were approximately equal in 2003, such was not the case for each individual interface.
• Interface Pricing Issues. PJM experienced continuing loop flow issues during the winter of 2002 and early in 2003 when transactions scheduled for delivery at the PJM/VAP interface actually flowed at the PJM/AEP interface. When the issue first emerged in the summer of 2002, it resulted from actions designed to exploit differences between the way in which PJM locational marginal prices (LMPs) were determined and the artificial contract paths that existed west and south of PJM. To address that problem, PJM issued updated rules in July 2002. Ongoing investigation into loop flows and circulation impacting PJM indicated, however, that further modifications were needed to the pricing rules governing external transactions. Specifically, a continuing discrepancy between scheduled and actual power flows at the PJM/AEP and the PJM/VAP interfaces worsened, particularly during the off-peak hours, late in 2002 and continued into early 2003 despite the July 2002 rule changes.2 To address this issue, on February 24, 2003, the PJM Market Monitoring Unit
1 These transactions occur primarily in the Real-Time Energy Market. Approximately 82 percent of total gross imports and 84 percent of gross exports take place in the Real-Time
Energy Market without corresponding day-ahead transactions.
2 The July 2002 rule changes had mitigated the magnitude of the recurrence.

State of the Market 2003 96 www.pjm.com State of the Market 2003 97 www.pjm.com
(MMU) notified market participants of a rule change governing interface pricing for transactions, scheduled to and from specific control areas. The PJM/AEP and PJM/VAP interfaces were combined into a new, single, PJM/AEPVP interface. The document, “Mapping for External Transaction Pricing,” was developed; it assigned specific control areas an import and export price point regardless of contract path.3 Additionally, on August 1, 2003, PJM created the PJM/IMO interface pricing point that is applicable to transactions sourcing/sinking into IMO. This price point was added to address the fact that flows from IMO flow over both the PJM/NYIS and PJM Western Interfaces and, therefore, that neither price was appropriate for such transactions.
• PJM and New York Transaction Issues. The relationship between the PJM/NYIS interface price and the New York Independent System Operator (NYISO) PJM Proxy bus price appears to reflect economic fundamentals. The relationship between interface price differentials and power flows between PJM and the NYISO also appears to reflect economic fundamentals. However, both are affected by differences in institutional and operating practices in PJM and NYISO.
Transaction Activity
Aggregate Imports and Exports
PJM was a net importer of energy for each month of 2003, although monthly net imports did not reach the levels experienced during January, March, May and June 2002 when each month had net import volume in excess of 1.9 million MWh. The 2003 peak net import was 1.7 million MWh in December with all other months at or below 1.5 million MWh (Figure 3-1). Monthly net import volume in 2003 was more consistent than in 2002 (Figure 3-3). The standard deviation of monthly net import flows was 358,000 MWh in 2003 compared to 683,000 MWh in 2002. PJM market participants import and export energy primarily in the Real-Time Energy Market (Figure 3-1 and Figure 3-2). In 2003, approximately 82 percent of total gross imports (85 percent in 2002) and 84 percent of total gross exports (93 percent in 2002) took place in the Real-Time Energy Market without corresponding day-ahead imports and exports.
Figure 3-1 PJM Real-Time Imports and Exports: 2003
Vol
ume(
MW
h)
0
500,000
1,000,000
1,500,000
2,000,000
2,500,000
3,000,000
3,500,000
Jan Feb Mar Apr May Jun Jul Aug Sep Oct Nov Dec
Net Import VolumeExport VolumeImport Volume
3 The language is from the current rule which was updated most recently on February 24, 2003.

State of the Market 2003 96 www.pjm.com State of the Market 2003 97 www.pjm.com
Figure 3-2 Total Day-Ahead Import and Export Volume: 2003
Gross imports and exports have continued to show different patterns. Gross imports have been increasing since 1999, although the rate of increase fell in 2003 when only two months exceeded the long-term trend (Figure 3-3). Gross exports continued to be relatively flat in 2003 with about an equal number of months above and below long-term trends (Figure 3-3).
Figure 3-3 PJM Imports and Exports: Transaction Volume History
Vol
ume(
MW
h)
0
500,000
1,000,000
1,500,000
2,000,000
2,500,000
3,000,000
3,500,000
Jan Feb Mar Apr May Jun Jul Aug Sep Oct Nov Dec
DA Net ImportsDA ExportsDA Imports
Gross ImportsGross ExportsNet Imports
MW
h
-500,000
0
500,000
1,000,000
1,500,000
2,000,000
2,500,000
3,000,000
3,500,000
JAN
99
APR
99
JUL9
9
OC
T99
JAN
0 0
APR
0 0
JUL0
0
OC
T00
JAN
0 1
APR
0 1
JUL0
1
OC
T01
JAN
0 2
APR
02
JUL0
2
OC
T02
JAN
0 3
APR
0 3
JUL0
3
OC
T03
JAN
04
PJM WesternRegion Begins
3 –
Inte
rchange T
ransa
cti
ons
State of the Market 2003 98 www.pjm.com State of the Market 2003 99 www.pjm.com
Interface Imports and Exports
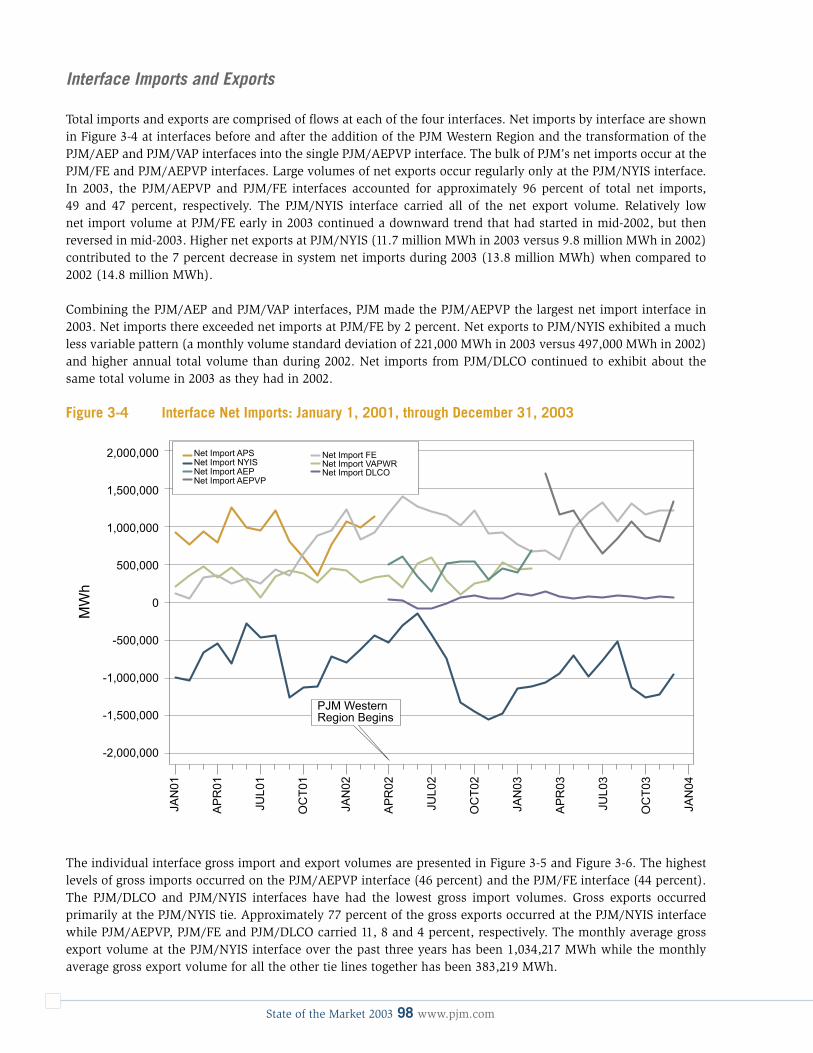
Total imports and exports are comprised of flows at each of the four interfaces. Net imports by interface are shown in Figure 3-4 at interfaces before and after the addition of the PJM Western Region and the transformation of the PJM/AEP and PJM/VAP interfaces into the single PJM/AEPVP interface. The bulk of PJM’s net imports occur at the PJM/FE and PJM/AEPVP interfaces. Large volumes of net exports occur regularly only at the PJM/NYIS interface. In 2003, the PJM/AEPVP and PJM/FE interfaces accounted for approximately 96 percent of total net imports, 49 and 47 percent, respectively. The PJM/NYIS interface carried all of the net export volume. Relatively low net import volume at PJM/FE early in 2003 continued a downward trend that had started in mid-2002, but then reversed in mid-2003. Higher net exports at PJM/NYIS (11.7 million MWh in 2003 versus 9.8 million MWh in 2002) contributed to the 7 percent decrease in system net imports during 2003 (13.8 million MWh) when compared to 2002 (14.8 million MWh).
Combining the PJM/AEP and PJM/VAP interfaces, PJM made the PJM/AEPVP the largest net import interface in 2003. Net imports there exceeded net imports at PJM/FE by 2 percent. Net exports to PJM/NYIS exhibited a much less variable pattern (a monthly volume standard deviation of 221,000 MWh in 2003 versus 497,000 MWh in 2002) and higher annual total volume than during 2002. Net imports from PJM/DLCO continued to exhibit about the same total volume in 2003 as they had in 2002.
Figure 3-4 Interface Net Imports: January 1, 2001, through December 31, 2003
The individual interface gross import and export volumes are presented in Figure 3-5 and Figure 3-6. The highest levels of gross imports occurred on the PJM/AEPVP interface (46 percent) and the PJM/FE interface (44 percent). The PJM/DLCO and PJM/NYIS interfaces have had the lowest gross import volumes. Gross exports occurred primarily at the PJM/NYIS tie. Approximately 77 percent of the gross exports occurred at the PJM/NYIS interface while PJM/AEPVP, PJM/FE and PJM/DLCO carried 11, 8 and 4 percent, respectively. The monthly average gross export volume at the PJM/NYIS interface over the past three years has been 1,034,217 MWh while the monthly average gross export volume for all the other tie lines together has been 383,219 MWh.
Net Import APS Net Import FENet Import VAPWRNet Import DLCO
Net Import NYISNet Import AEPNet Import AEPVP
MW
h
PJM WesternRegion Begins
JAN
01
AP
R01
JUL0
1
OC
T01
JAN
02
AP
R02
JUL0
2
OC
T02
JAN
03
AP
R03
JUL0
3
OC
T03
JAN
04
2,000,000
1,500,000
1,000,000
-2,000,000
-1,500,000
-1,000,000
500,000
-500,000
0

State of the Market 2003 98 www.pjm.com State of the Market 2003 99 www.pjm.com
Figure 3-5 Interface Gross Imports: January 1, 2001, through December 31, 2003
Figure 3-6 Interface Gross Exports: January 1, 2001, through December 31, 2003
Import APS Import FE
Import VAPWRImport DLCO
Import NYISImport AEPImport AEPVP
JAN
01
AP
R01
JUL0
1
OC
T01
JAN
02
AP
R02
JUL0
2
OC
T02
JUL0
3
OC
T03
JAN
04
JAN
03
AP
R03
PJM WesternRegion Begins
1,800,000
1,600,000
1,400,000
1,200,000
1,00,000
800,000
600,000
200,000
400,000
0
MW
h
Export APSExport NYISExport AEPExport AEPVP
Export FEExport VAPWRExport DLCO
JAN
01
AP
R01
JUL0
1
OC
T01
JAN
02
AP
R02
JUL0
2
OC
T02
JAN
03
AP
R03
JUL0
3
OC
T03
JAN
04
PJM WesternRegion Begins
1,800,000
1,600,000
1,400,000
1,200,000
1,000,000
800,000
0
600,000
400,000
200,000
MW
h
3 –
Inte
rchange T
ransa
cti
ons

State of the Market 2003 100 www.pjm.com State of the Market 2003 101 www.pjm.com
Interchange Transaction Issues
Loop Flow
Loop flow results when the transmission contract path for energy transactions does not match the actual path of energy flows on the transmission system. Loop flows can arise from transactions scheduled into, out of, or around the PJM system. Outside of PJM’s LMP-based Energy Market, energy is scheduled and paid for based on contract path although actual, associated energy deliveries flow on the path of least resistance. Loop flows can also occur when a transaction is scheduled between two external control areas, and some or all of the actual flows occur at PJM interfaces. Loop flows can result when transactions are scheduled into or out of PJM on one interface, but actually flow on another interface. Loop flows based on contract paths between external systems can only be managed by PJM using transmission loading relief (TLR) procedures. Loop flows based on gaming PJM price differentials can be managed, in part, by improving the pricing of transactions at the PJM interfaces.
Although total PJM net scheduled and actual flows were approximately equal in 2003, such was not the case for each individual interface (Figure 3-7).
For PJM as a whole, net scheduled and actual interface flows were approximately balanced in 2003. Actual total system net imports were approximately 12.9 million MWh, exceeding the scheduled total of approximately 12.7 million MWh by 0.2 million MWh or less than 2 percent. Flow balance varied, however, at each individual interface. The PJM/NYIS interface was the most out of balance, with net actual exports exceeding net scheduled by approximately 3.4 million MWh for the year or an average of 287,000 MWh per month. At the PJM/AEPVP interface, net actual imports exceeded those scheduled by approximately 1.9 million MWh or 159,000 MWh per month. Note that the separate reporting of PJM/AEP and PJM/VAP in Figure 3-7 is for the period prior to March. At the PJM/FE interface, net actual imports exceeded those scheduled by 0.6 million MWh or 51,000 MWh per month while at the PJM/DLCO interface, net actual imports exceeded net scheduled by 1.1 million MWh or 91,000 MWh per month.
PJM/NYIS replaced PJM/AEP and PJM/VAP as the more out of balance interface in 2003 compared to 2002. The primary reason for this was the combining of PJM/AEP and PJM/VAP into PJM/AEPVP in 2003. The imbalances in PJM/AEP flows (net positive 4.6 million MWh in 2002) largely offset the imbalances in PJM/VAP flows (net negative 4.0 million MWh in 2002). The result is that the net of scheduled and actual interface flows at the combined PJM/AEPVP interface is smaller and the net imbalance between scheduled and actual flows at the PJM/NYIS interface was the largest in 2003.

State of the Market 2003 100 www.pjm.com State of the Market 2003 101 www.pjm.com
Figure 3-7 Net Scheduled and Actual PJM Interface Flows: 2003
Interface Pricing Issues
In a February 24, 2003, letter from the PJM Market Monitor to the PJM Members Committee and the Energy Market Committee, PJM announced that effective March 1, 2003, it would combine the previously separate PJM/AEP and PJM/VAP interfaces into PJM/AEPVP, a single interface with separate and distinct import and export pricing. As a result of its continuing investigation into loop flow and circulation on the system and into appropriate pricing points for external transactions, PJM found a clear need to further modify its rules governing pricing for external transactions. In the February 24 letter, PJM stated that it had determined that transactions that source in PJM, but sink in specified control areas should receive a price consistent with the associated actual power flows. The PJM sources for export transactions then became PJM/NYIS, PJM/FE, PJM/DLCO and PJM/AEPVPEXP, excluding the PJM/VAP or PJM/AEP interfaces. The PJM/AEPVPEXP interface consists of buses previously included in the PJM/AEP and PJM/VAP interface definitions, dynamically weighted by the specific underlying actual tie line export power flow patterns. Similarly, PJM determined that transactions that sink in PJM and source in specified control areas should receive a price consistent with the actual associated power flows. The PJM sinks for import transactions then became PJM/NYIS, PJM/FE, PJM/DLCO and PJM/AEPVPIMP, excluding the PJM/VAP and PJM/AEP interfaces. The PJM/AEPVPIMP interface consists of buses previously included in the PJM/AEP and PJM/VAP interface definitions, dynamically weighted by the specific underlying actual tie line import power flow patterns.
To reflect the actual flow of transactions linked to the PJM/AEP and PJM/VAP interfaces, PJM began on March 1, 2003, to price all transactions that source in PJM and sink in one of the relevant defined control areas4 at the PJM/AEPVPEXP interface price. At the same time, PJM began to price all transactions that sink in PJM and source in one of the defined control areas at the PJM/AEPVPIMP interface price. Going forward, PJM intends to apply the same power-flow-based methodology for pricing transactions into and out of its control area at all interfaces. It is expected that this approach can provide consistent pricing for transactions to and from PJM that are electrically comparable, regardless of interface.
This PJM action was taken in accord with 3.3.1(d) of Schedule 1 of the “Operating Agreement,” governing payment for deliveries to the PJM Spot Market. It states in relevant part: “For pool External Resources the Office of
PJM/VAP PJM/AEP PJM/AEPVP PJM/NYIS PJM/FETotal System PJM/DLCO
Actual - Net Scheduled
Actual
Net ScheduledV
olum
e (M
Wh)
20,000,00
15,000,00
-20,000,00
-15,000,00
10,000,00
-10,000,00
5,000,00
-5,000,00
0
4 See “Mapping for External Transaction Pricing,” an attachment to the February 24, 2003, letter available through the PJM Web site (www.pjm.com).
3 –
Inte
rchange T
ransa
cti
ons

State of the Market 2003 102 www.pjm.com State of the Market 2003 103 www.pjm.com
the Interconnection shall model, based on an appropriate flow analysis, the hourly amounts delivered from each such resource to the corresponding interface point between adjacent control areas and the area comprised of the PJM-West [PJM Western] Region and PJM Control Area [PJM Mid-Atlantic Region].”
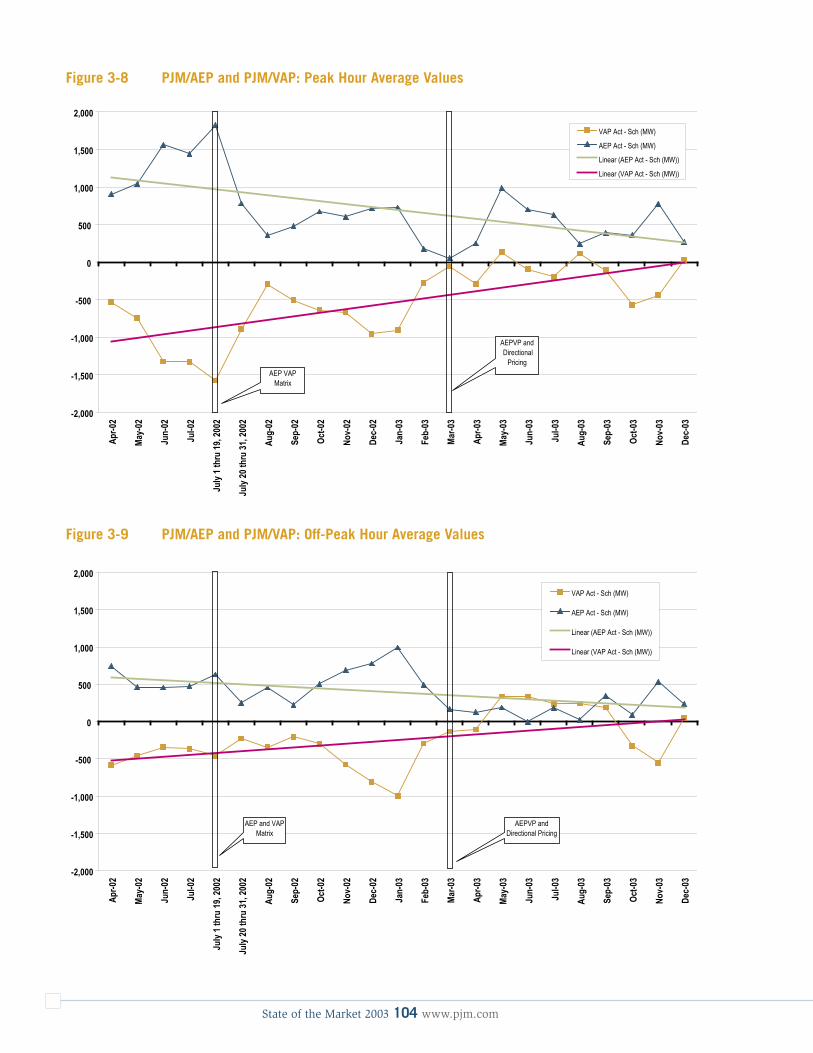
As Table 3-1, Figure 3-8 and Figure 3-9 illustrate, the discrepancy between scheduled and actual power flows at the PJM/AEP and PJM/VAP interfaces began to increase late in 2002 and early in 2003.5 This was particularly evident during off-peak hours (Figure 3-9). For example, the difference between monthly average actual and contract power flows at the PJM/AEP interface increased from an off-peak average of 223 MW in September 2002, to 992 MW in January 2003. Correspondingly, the difference in price between the PJM/VAP and PJM/AEP interfaces increased from an off-peak average of $3.94 per MWh in September 2002, to $24.58 in January 2003. This pattern, although not as dramatic, was also evident during the peak hours (Figure 3-8).
Implementation of the AEPVP interface price rule change had the greatest impact during off-peak periods. The loop flow pattern that was developing in the fall and winter of 2002/2003 at PJM/VAP and PJM/AEP was reduced. On peak, the rule change had a lesser impact. It was the July 2002 rule change that provided a major correction to a diverging flow pattern during on-peak hours.
The offsetting relationship between power flow discrepancies at the PJM/AEP and PJM/VAP interfaces is clearly evident in both on-peak and off-peak data before March 2003. The flow discrepancy at the PJM/AEP interface was approximately equal to and opposite from the discrepancy at the PJM/VAP interface. The pattern was clear during all time periods monitored since the PJM/AEP interface had been developed in April 2002. Although the July 2002 rule change had the effect of mitigating its amplitude, it did not change the opposing pattern; however, the AEPVP rule change has brought a pattern-changing effect on the interface flow discrepancies. Since March 2003, the PJM/AEP and PJM/VAP flows have not exhibited the previously observed relationship. In fact, the MW discrepancy at PJM/VAP has diminished considerably and, rather than being consistently negative, has varied between positive and negative with little apparent relationship to the flows at the PJM/AEP interface. The PJM/AEP discrepancies have continued, but at a much lower MW value, again with little apparent relationship to PJM/VAP. The change to directional (i.e., import and export) pricing has altered the pricing signal from one based on location to one based on location and direction. Previously high prices at PJM/VAP, which created an incentive to schedule imports, no longer exist because PJM/VAP is no longer a pricing point. Instead, PJM now has price signals that more accurately reflect the value of import and export transactions at the combined PJM/AEPVP interface.
The July 2002 and the March 2003 AEPVP rule changes combined to produce the desired effect on power flow discrepancies at PJM/AEP and PJM/VAP. The magnitude of actual versus scheduled values for both interfaces declined significantly. Additionally, the offsetting relationship between flows at the two interfaces has been greatly reduced. The July 2002 changes appear to have had a greater effect on on-peak hours, but although reducing the magnitude of the loop flows, did not change the pattern between PJM/AEP and PJM/VAP. Off-peak periods were not as greatly affected by the change. The AEPVP rule change had its biggest impact on off-peak periods and did change the offsetting relationship between MW flows at the two interfaces, most likely because of the directional pricing aspect of the rule change.
On August 1, 2003, PJM implemented a new interface price point when it added PJM/IMO to the existing four interface price points. PJM created the PJM/IMO price point to reflect more accurately the actual power flow from sources located in IMO. Prior to August 1, the interface pricing rules set the price for power coming from and/or going to IMO at the PJM/NYIS interface price. The loop flow investigation determined that actual flow path of sources located in IMO was not primarily through PJM/NYIS, but was split between the PJM/NYIS and PJM’s Western Interfaces. Some transactions sourced in IMO were cut by PJM based on their impact on PJM’s western interface facilities. These transactions were responding to the price signal at the PJM/NYIS interface while their actual flow was split between PJM/NYIS and PJM’s Western Interfaces. The PJM/IMO interface price is based on a generator bus located in IMO.
5 The referenced table and all figures begin at April 1, 2002, when the PJM Western Region was integrated and PJM/AEP was created.

State of the Market 2003 102 www.pjm.com State of the Market 2003 103 www.pjm.com
Table 3-1 Interface LMP Differentials and Actual-Schedule Differential
2003 Periods
Jan Feb Mar Apr May June July July 1 thru 19
July 20 thru 31
Aug Sept Oct Nov Dec
Peak-Hour Periods
$VAP-$AEP/$AEPVPIMP-$AEPVPEXP ($/MWh)
$9.18 $1.06 $ (2.06) $ (1.08) $ (8.11) $ (10.85) $ (7.55) na na $ (1.08) $ (6.45) $ (2.17) $ (2.44) $ (0.41)
VAP Act - Sch (MW) -909 -277 -52 -288 133 -95 -194 na na 114 -106 -568 -440 29
AEP Act - Sch (MW) 726 179 50 248 982 701 629 na na 245 390 359 778 264
AEPVP Act-Sch (MW) -2 -40 1,115 606 435 na na 359 283 -209 24 293
Off-Peak Hour Periods
$VAP-$AEP/$AEPVPIMP-$AEPVPEXP ($/MWh)
$24.58 $4.92 $ (5.69) $ (0.61) $ (3.11) $ (3.21) $ (6.82) na na $ (2.09) $ (1.22) $ (1.35) $ (1.10) $ (0.87)
VAP Act - Sch (MW) -998 -296 -134 -106 337 333 237 na na 240 188 -326 -551 48
AEP Act - Sch (MW) 992.33 495.3 167.45 125 189 -1 186 na na 22 348 89 534 235
AEPVP Act-Sch (MW) 33 18 525 332 423 na na 262 536 -237 9 283
2002 Periods
Jan Feb Mar Apr May June July July 1 thru 19
July 20 thru 31
Aug Sept Oct Nov Dec
Peak-Hour Periods
$VAP-$AEP/$AEPVPIMP-$AEPVPEXP ($/MWh)
na na na $7.19 $6.49 $14.33 $14.06 $16.44 $9.88 $10.12 $4.86 $7.36 $5.57 $ 11.70
VAP Act - Sch (MW) na na na -533 -748 -1,323 -1,327 -1,577 -891 -295 -507 -641 -668 -955
AEP Act - Sch (MW) na na na 904 1,042 1,561 1,442 1,821 780 359 479 673 606 715
AEPVP Act-Sch (MW)
Off-Peak Hour Periods
$VAP-$AEP/$AEPVPIMP-$AEPVPEXP ($/MWh)
na na na $ 5.13 $ 0.01 $ 4.87 $ 6.16 $ 7.41 $ 4.38 $ 4.39 $ 3.94 $ 6.49 $ 3.61 $ 8.56
VAP Act - Sch (MW) na na na -582 -460 -346 -364 -457 -229 -346 -205 -299 -574 -809
AEP Act - Sch (MW) na na na 740 459 457 476 633 251 457 223 504 687 778
AEPVP Act-Sch (MW)
State of the Market 2003 104 www.pjm.com State of the Market 2003 105 www.pjm.com
Figure 3-8 PJM/AEP and PJM/VAP: Peak Hour Average Values
Figure 3-9 PJM/AEP and PJM/VAP: Off-Peak Hour Average Values
Peak Hour Average Values
-2,000
-1,500
-1,000
-500
0
500
1,000
1,500
2,000Ap
r-02
May-
02
Jun-
02
Jul-0
2
July
1thr
u19
,200
2
July
20th
ru31
,200
2
Aug-
02
Sep-
02
Oct-0
2
Nov-
02
Dec-
02
Jan-
03
Feb-
03
Mar-0
3
Apr-0
3
May-
03
Jun-
03
Jul-0
3
Aug-
03
Sep-
03
Oct-0
3
Nov-
03
Dec-
03
VAP Act - Sch (MW)
AEP Act - Sch (MW)
Linear (AEP Act - Sch (MW))
Linear (VAP Act - Sch (MW))
AEP VAPMatrix
AEPVP andDirectional
Pricing
Off-Peak Hour Average Values
-2,000
-1,500
-1,000
-500
0
500
1,000
1,500
2,000
Apr-0
2
May-
02
Jun-
02
Jul-0
2
July
1thr
u19
,200
2
July
20th
ru31
,200
2
Aug-
02
Sep-
02
Oct-0
2
Nov-
02
Dec-
02
Jan-
03
Feb-
03
Mar-0
3
Apr-0
3
May-
03
Jun-
03
Jul-0
3
Aug-
03
Sep-
03
Oct-0
3
Nov-
03
Dec-
03
VAP Act - Sch (MW)
AEP Act - Sch (MW)
Linear (AEP Act - Sch (MW))
Linear (VAP Act - Sch (MW))
AEP and VAPMatrix
AEPVP andDirectional Pricing
State of the Market 2003 104 www.pjm.com State of the Market 2003 105 www.pjm.com
PJM and NYISO Transaction Issues
If the interface prices were defined in a comparable manner by PJM and the NYISO, if there were identical rules governing external transactions in PJM and the NYISO, if there were no time lags built into the rules governing such transactions and if there were no risks associated with such transactions, prices at the interfaces would be expected to be very close and the level of transactions would be expected to be related to any price differentials. The fact that none of these conditions exist is important in explaining the observed relationship between interface prices and the observed relationship between inter-ISO power flows and those price differentials.
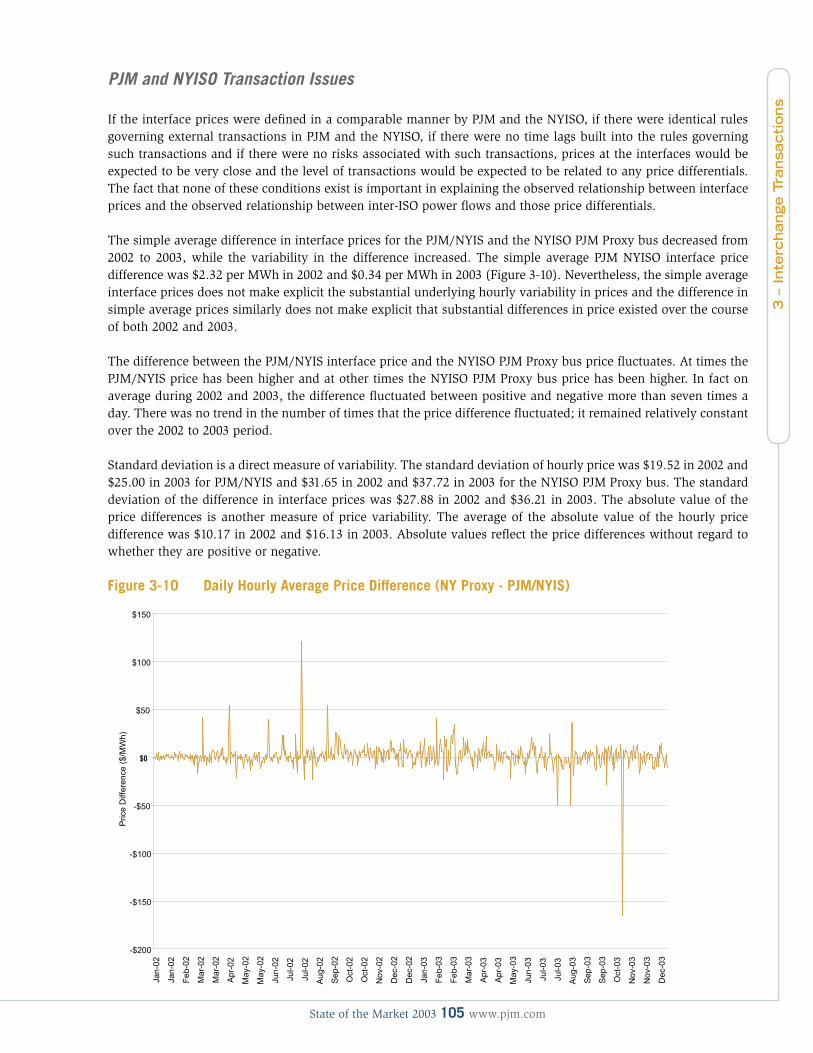
The simple average difference in interface prices for the PJM/NYIS and the NYISO PJM Proxy bus decreased from 2002 to 2003, while the variability in the difference increased. The simple average PJM NYISO interface price difference was $2.32 per MWh in 2002 and $0.34 per MWh in 2003 (Figure 3-10). Nevertheless, the simple average interface prices does not make explicit the substantial underlying hourly variability in prices and the difference in simple average prices similarly does not make explicit that substantial differences in price existed over the course of both 2002 and 2003.
The difference between the PJM/NYIS interface price and the NYISO PJM Proxy bus price fluctuates. At times the PJM/NYIS price has been higher and at other times the NYISO PJM Proxy bus price has been higher. In fact on average during 2002 and 2003, the difference fluctuated between positive and negative more than seven times a day. There was no trend in the number of times that the price difference fluctuated; it remained relatively constant over the 2002 to 2003 period.
Standard deviation is a direct measure of variability. The standard deviation of hourly price was $19.52 in 2002 and $25.00 in 2003 for PJM/NYIS and $31.65 in 2002 and $37.72 in 2003 for the NYISO PJM Proxy bus. The standard deviation of the difference in interface prices was $27.88 in 2002 and $36.21 in 2003. The absolute value of the price differences is another measure of price variability. The average of the absolute value of the hourly price difference was $10.17 in 2002 and $16.13 in 2003. Absolute values reflect the price differences without regard to whether they are positive or negative.
Figure 3-10 Daily Hourly Average Price Difference (NY Proxy - PJM/NYIS)
-$200
-$150
-$100
-$50
$0
$50
$100
$150
Jan-02
Jan-02
Feb-02
Mar-02
Mar-02
Apr-02
May-02
May-02
Jun-02
Jul-02
Jul-02
Aug-02
Sep-02
Oct-02
Oct-02
Nov-02
Dec-02
Dec-02
Jan-03
Feb-03
Feb-03
Mar-03
Apr-03
Apr-03
May-03
Jun-03
Jul-03
Jul-03
Aug-03
Sep-03
Sep-03
Oct-03
Nov-03
Nov-03
Dec-03
PriceDifference($/MWh)
3 –
Inte
rchange T
ransa
cti
ons

State of the Market 2003 106 www.pjm.com State of the Market 2003 107 www.pjm.com
A number of factors are responsible for the observed relationship between interface prices. The fact that the simple average of interface prices is relatively small suggests that competitive forces prevent price deviations from persisting. That is further supported by the frequency with which the price differential switches between positive and negative. Significant variability in interface prices is consistent with the fact that interface prices are defined and established differently, making it difficult for prices to equalize, regardless of other factors.
PJM defines the PJM/NYIS interface price based on flow-weighted LMPs on two specific lines that physically connect PJM and the NYISO. By contrast, the NYISO defines the NYISO PJM Proxy bus price using a single point inside PJM. Different definitions mean that the PJM and NYISO interface prices reflect different pricing dynamics including different levels of congestion. A closer relationship between interface prices would be expected if the prices were defined by PJM and the NYISO on the same tie lines, in the same flow-weighted manner and at points close to the border in PJM and in the NYISO.
In addition to the small average interface price differences and the large variability in the hourly price differences, there is a significant correlation between monthly average hourly PJM and NYISO interface prices over the entire 2002-2003 period (Figure 3-11). There is also a significant correlation between hourly PJM and NYSIO interface prices over the entire 2002-2003 period.
Figure 3-11 Monthly Hourly Average NYISO PJM Proxy Bus Price and the PJM/NYIS Price
The apparently somewhat weak observed relationship between the PJM and NYISO power flows and the corresponding interface price differences are, in significant part, functions of differences in rules governing external transactions in PJM and the NYISO as well as of the time lags built into those rules. There is no statistically significant relationship between such power flows and the contemporaneous interface price differential. Similarly, there is no statistically significant relationship between such power flows and the interface price differential one hour prior to the power flows. However, there is a statistically significant relationship between such power flows and the interface price differential two hours prior to the power flows. This pattern is consistent with both the time lags built into the transaction rules and the uncertainty built into those rules.
$10
$15
$20
$25
$30
$35
$40
$45
$50
$55
$60
Jan-02
Feb-02
Mar-02
Apr-02
May-02
Jun-02
Jul-02
Aug-02
Sep-02
Oct-02
Nov-02
Dec-02
Jan-03
Feb-03
Mar-03
Apr-03
May-03
Jun-03
Jul-03
Aug-03
Sep-03
Oct-03
Nov-03
Dec-03
AveragePrice($/MWh)
PJMNYIS
NYIS PJM Proxy

State of the Market 2003 106 www.pjm.com State of the Market 2003 107 www.pjm.com
The rules governing transactions limit the timeliness with which market participants can react to real-time price differences and the extent to which they can benefit from real-time price spreads. In addition, participants may enter into longer term transactions under which the physical flows may not be a direct function of the hourly price differences between the interface prices. While this is not a reason to expect persistent price differences, it is consistent with data on interface price differences and the volumes and directions of power flows.
The nature of the relationship between the hourly price at PJM’s New York interface and the price at NYISO’s PJM proxy bus appears to be the result of differences in market rules governing transactions at the two independent system operators.6 In real time, PJM market participants request transactions at PJM interfaces that are accepted and scheduled by PJM based on the physical limits of the system. The transaction request can be scheduled to begin on any quarter of the hour. These transactions are price takers in real time and do not submit prices.
The NYISO requires hourly bids or offer prices for each export or import transaction and clears its market each hour based on hourly bids. Import transactions to NYISO are treated by NYISO as generator bids at the NYISO PJM Proxy bus. Export transactions are treated by NYISO as price-capped load offers. Competing bids and offers are evaluated along with the other NYISO resources and a proxy bus price is derived. Bidders are notified of the outcome. This process is repeated, with new bids and offers, each hour. A significant lag exists between the time when offers and bids are submitted to the NYISO and the time when participants are notified that they have cleared. It is a function of time lags built into the functioning of the balancing market evaluation (BME) system and the fact that transactions can only be scheduled at the beginning of the hour.
As a result of BME timing, market participants are required to submit their bid or offer by no less than 75 minutes before the operating hour. The bid or offer includes the MW volume desired and, for imports into NYISO, the asking price or, for exports out of NYISO, the price the participants are willing to pay. The required lead time means that participants make price and MW bids or offers based on expected prices. Transactions are accepted only for a single hour.
PJM operating practices provide that market participants must make a request to import or export power at one of PJM’s interfaces at least 20 minutes before the desired start time which can be any quarter hour. The duration of the requested transaction can vary from a single hour to an unlimited amount of time. Generally PJM market participants provide only the MW, the duration and the direction of the real-time transaction. While bid prices for transactions are allowed in PJM, only about 4 percent of all transactions submit an associated price. Transactions are accepted in order of submission based on whether PJM has the capability to import or export the requested MW given a variety of factors, including ramp room. Since they receive the actual real-time price for their scheduled imports or exports, these transactions are price takers in the Real-Time Market. As in the NYISO, the required lead time means that participants must make offers to buy or sell MW based on expected prices.
The NYISO rules provide that BME results are available 40 minutes prior to the operating hour. Thus winning bidders have 20 minutes from the time when BME results indicate that their transaction will flow until the time when they must get their transaction cleared with PJM to meet its 20-minute requirement. To get a transaction cleared with PJM, the market participant must have a valid NERC Tag, an Open Access Same-Time Information System (OASIS) reservation, a PJM schedule and a PJM ramp reservation. Each of these requirements takes time to process.
The length of required lead times could be a contributor to the observed relationship between price differentials and flows. Market conditions can change significantly in a relatively short time. The resultant uncertainty could weaken the observed relationship between contemporaneous interface prices and flows.
6 The NYISO is implementing a new real-time scheduling system that is expected to address some of the issues addressed here.
3 –
Inte
rchange T
ransa
cti
ons

State of the Market 2003 108 www.pjm.com State of the Market 2003 109 www.pjm.com

State of the Market 2003 108 www.pjm.com State of the Market 2003 109 www.pjm.com
4 –
Capacit
y M
ark
ets
Section 4 – Capacity Markets
Each organization serving PJM load must own or acquire capacity resources to meet its respective capacity obligations. Load-serving entities (LSEs) can acquire capacity resources by entering into bilateral agreements or by participating in the PJM-operated Capacity Credit Market. Collectively, all arrangements by which LSEs acquire capacity are known as the Capacity Market.1
The PJM Capacity Credit Market provides a mechanism to balance supply of and demand for capacity unmet by the bilateral market or self-supply. The PJM Capacity Credit Market consists of the Daily, Interval, Monthly and Multimonthly Capacity Credit Markets. The Capacity Credit Market is intended to provide a transparent, market-based mechanism for competitive retail LSEs to acquire the capacity resources needed to meet their capacity obligations and to sell capacity resources when no longer needed to serve load. The PJM Daily Capacity Credit Market permits LSEs to match capacity resources with short-term shifts in retail load while Interval, Monthly and Multimonthly Capacity Credit Markets provide mechanisms to match longer term obligations with capacity resources.
The PJM Market Monitoring Unit (MMU) recommended in its “2002 State of the Market Report” that the PJM Mid-Atlantic and Western Regions’ separate Capacity Credit Markets be combined into a single market with one set of rules. That recommendation was implemented by PJM on June 1, 2003.
Overview
The MMU analyzed key measures of PJM Capacity Market structure and performance for 2003, including concentration ratios, prices, outage rates and reliability. The MMU found serious market structure issues, but no exercise of market power during 2003.
The PJM Mid-Atlantic Region’s Capacity Market results were competitive during 2003. The PJM Western Region’s Capacity Market did not operate in a meaningful way during 2003. There was not a functioning competitive market in the PJM Western Region. Beginning June 1, 2003, the two markets were combined into a single market with rules identical to those that had previously provided the operating framework for the Capacity Market in the PJM Mid-Atlantic Region alone. Inclusion of the PJM Western Region’s Capacity Market in a broader capacity market is a positive step. Nonetheless, market power remains a serious concern for the MMU in the Capacity Market.
Market Structure
PJM Mid-Atlantic Region: January through May 2003• Supply. Structural analysis of the PJM Mid-Atlantic Region’s Capacity Credit Market found that short-term
markets exhibited moderate concentration and long-term markets exhibited high concentration levels in 2003.
• Demand. During 2003, the original PJM Mid-Atlantic Region electric utilities and their affiliates accounted for 90 percent of the PJM Mid-Atlantic Region’s load obligations.
• Supply and Demand. During the first interval2 of 2003, installed capacity, unforced capacity and obligations grew in the PJM Mid-Atlantic Region. Compared to the same period of 2002, average installed capacity increased by 2,615 MW or 4.3 percent to 64,075 MW, while average unforced capacity rose by 2,467 MW or 4.2 percent to 60,960 MW. Average load obligations climbed by 2,992 MW or 5.3 percent to 59,630 MW,
1 See Appendix E, “Glossary,” for definitions of PJM Capacity Credit Market terms.
2 PJM defines three intervals for PJM Capacity Markets. The first interval extends for five months and runs from January through May. The second interval extends for four
months and runs from June through September. The third interval extends for three months and runs from October through December.

State of the Market 2003 110 www.pjm.com State of the Market 2003 111 www.pjm.com
or 1,330 MW less than average unforced capacity. During the first interval, overall Capacity Credit Market transactions increased by nearly 22 percent. Daily Capacity Credit Market volume increased by 112 percent, while Monthly and Multimonthly Capacity Credit Market volume increased by 7.2 percent and 14.2 percent, respectively.
PJM Western Region: January through May 2003 • Supply. Structural analysis of the PJM Western Region’s Capacity Credit Markets found extremely high
concentration levels in the first interval of 2003.
• Demand. During the first interval of 2003, the original PJM Western Region electric utility accounted for 96.9 percent of the PJM Western Region’s load obligations.
• Supply and Demand. In the first interval of 2003, the PJM Western Region’s average installed capacity was 10,293 MW and the average available capacity was 8,482 MW. The average capacity obligation was 6,817 MW while the maximum capacity obligation was 9,002. The Capacity Credit Market was effectively not operating in the PJM Western Region during the first interval of 2003.
PJM: June through December 2003• Supply. Structural analysis of the combined PJM Mid-Atlantic and Western Regions’ Capacity Credit
Markets found that high concentration levels were exhibited during the last two intervals of 2003.
• Demand. During the last two intervals of 2003, the original electric utilities in the two regions and their affiliates accounted for 85.8 percent of systemwide PJM load obligations.
• Supply and Demand. During the last two intervals of 2003, installed capacity, unforced capacity and obligations grew in PJM with respect to the same time period last year. Compared to the same period of 2002, average installed capacity increased by 4,774 MW or 6.5 percent to 77,728 MW. Average load obligations climbed to 70,203 MW. Overall, Capacity Credit Market transactions increased to 4,740 MW while Daily Capacity Credit Market volume increased to 1,120 MW. Monthly Capacity Credit Market volume decreased to 746 MW, but Multimonthly Capacity Credit Market volume rose to 2,874 MW. 3
Market Performance
PJM Mid-Atlantic Region: January through May 2003• Prices. Daily Capacity Credit Market prices were low during the first interval of 2003, averaging $6.00 per
MW-day. Prices in the monthly and multimonthly markets declined slightly over the interval from $21.14 per MW-day in January to $16.87 per MW-day in May, averaging $17.36 per MW-day for the first interval.
PJM Western Region: January through May 2003• Prices. Daily Capacity Market prices averaged $0.02 per MW-day. There were no trades in the monthly and
multimonthly markets during 2003.
• Volumes. There was very little activity in the Capacity Credit Markets during the first interval of 2003. An average 0.15 MW traded in the daily market. Trades occurred on only three separate days. No trades were completed in the monthly or multimonthly markets. One very small 0.1 MW multimonthly trade from 2002 was effective through May 31, 2003.
3 Since some of the measures of capacity market supply and demand were in different units for the Mid-Atlantic and Western Regions (e.g. unforced MW for the Mid-Atlantic
Region and available MW for the Western Region), these measures cannot be directly compared.
State of the Market 2003 110 www.pjm.com State of the Market 2003 111 www.pjm.com
PJM: June through December 2003• Prices. Daily Capacity Credit Market prices were quite low during the last two intervals of 2003, averaging
$0.68 per MW-day. Prices in the monthly and multimonthly markets declined over that period from $36.46 per MW-day in June to $11.26 per MW-day in December, averaging $24.18 per MW-day.
• Availability. Between 1996 and 2001, the average PJM forced outage rate (EFORd) trended downward, reaching 4.8 percent in 2001 and then increased to 5.2 percent in 2002 and 7.1 percent in 2003. The increase in EFORd of 1.9 percent from 2002 to 2003 was the result of increased forced outage rates across all unit types.
Given the basic features of Capacity Market structure in both the PJM Mid-Atlantic and the PJM Western Regions, including high levels of concentration, the relatively small number of nonaffiliated LSEs, the capacity-deficiency penalty structure facing LSEs, supplier knowledge of the penalty structure and supplier knowledge of aggregate market demand if not individual LSE demand, the MMU concludes that the likelihood of the exercise of market power is high. Market power is structurally endemic to PJM Capacity Markets. Supply and demand fundamentals offset these market structure issues in the PJM Mid-Atlantic Region’s Capacity Market in 2003, producing competitive results. In the PJM Western Region’s Capacity Market, the dominance of a single supplier and the extremely small load levels served by independent LSEs meant that there was not a functioning competitive market in the PJM Western Region prior to the inclusion of the PJM Western Region in the PJM Capacity Market.
Market Structure
PJM Mid-Atlantic Region: January through May 2003
Supply SideConcentration ratios4 are a summary measure of market share, a key element of market structure. High concentration ratios mean that a comparatively small number of sellers dominates a market, while low concentration ratios mean that a larger number of sellers shares market sales more equally. Concentration measures must be applied carefully in assessing the competitiveness of markets. Low aggregate market concentration ratios do not establish that a market is competitive, that market participants cannot exercise market power or that concentration is not high in particular geographic market areas. High aggregate market concentration ratios do, however, indicate an increased potential for market participants to exercise market power.
The MMU structural analysis indicates that the PJM Mid-Atlantic Region’s Capacity Credit Markets in the first interval of 2003 exhibited moderate levels of concentration in the Daily Capacity Credit Markets and high levels of concentration in the Monthly and Multimonthly Capacity Credit Markets. As shown in Table 4-1, HHIs for Daily Capacity Credit Markets averaged 1521 during 2003, with a maximum of 1972 and a minimum of 1078 (four firms with equal market shares would result in an HHI of 2500). HHIs for the longer term Monthly and Multimonthly Capacity Credit Markets averaged 3090, with a maximum of 5173 and a minimum of 1288 (three firms with equal market shares would result in an HHI of 3333). On average 602 MW were traded in the Daily Capacity Credit Markets and 3,177 MW were traded in the Monthly and Multimonthly Capacity Credit Markets. The total of 3,779 MW represented, on average, 6.3 percent of total load obligation for the period of which 1 percent was attributable to the Daily Capacity Credit Market and 5.3 percent was attributable to the Monthly and Multimonthly Capacity Credit Market.
4 See Section 2, “Energy Market,” for a discussion of concentration ratios and the HHI.
4 –
Capacit
y M
ark
ets

State of the Market 2003 112 www.pjm.com State of the Market 2003 113 www.pjm.com
Table 4-1 PJM Capacity Market HHI: 2003
Term Region Statistic Daily Market HHI Monthly and Mutlimonthly Market
HHI
Jan. through May PJM Mid-Atlantic Region Average 1521 3090
Minimum 1078 1288
Maximum 1972 5173
June through Dec. PJM
Average 2155 2479
Minimum 1262 1430
Maximum 3071 6180
Jan. through Dec. PJM
Average 2003 2711
Minimum 1078 1288
Maximum 3071 6180
Demand SideDuring the first interval of 2003, PJM electric utility companies (the original PJM electric utilities) and their affiliates maintained their market share of PJM Mid-Atlantic Region load obligations, averaging 90.3 percent (Figure 4-1). The market share of PJM electric utility companies averaged 67.8 percent of the PJM Mid-Atlantic Region’s load. The market share of the affiliates of PJM electric utilities averaged 22.5 percent. The market share of LSEs not affiliated with a utility was about 4 percent and the market share of non-PJM utilities and their affiliates averaged about 6 percent.
Figure 4-1 Percent of PJM Mid-Atlantic Region Load Obligation Served: January through May 2003
0%
10%
20%
30%
40%
50%
60%
70%
80%
90%
100%
Jan Feb Mar Apr May
Perce
ntLo
adOb
ligati
onSe
rved
Non-PJM Utility or Affiliate
Not Affiliated with Utility
PJM Utility
PJM Utility Affiliate
Percent of PJM Mid-Atlantic Region Load Obligation Served: January through May 2003

State of the Market 2003 112 www.pjm.com State of the Market 2003 113 www.pjm.com
During the first interval of 2003, reliance on the PJM Mid-Atlantic Region’s Capacity Credit Markets varied by sector. As Figure 4-2 shows, PJM electric utilities relied on Capacity Credit Markets for an average of -0.7 percent of their first interval 2003 unforced capacity obligation while their affiliates relied on Capacity Credit Markets for an average of 7.9 percent of theirs. Affiliates of non-PJM electric utilities obtained an average of -35.5 percent of their unforced capacity obligations from the Capacity Credit Markets (they were net sellers) while unaffiliated LSEs obtained an average of 19.1 percent of their capacity obligations from the Capacity Credit Markets. The measure of Capacity Credit Market reliance is the sector’s daily net Capacity Credit Market position divided by the sector’s capacity obligation (This excludes self-supply and bilateral transactions.) Thus, a negative share means that a sector has sold more capacity credits than it has purchased for a day.
During the first interval of 2003, LSEs unaffiliated with any utilities increased their reliance on Capacity Credit Markets from approximately 5 percent to about 35 percent. These entities nearly doubled the amount of load obligation served during the first interval. The proportion of load obligation served in the Capacity Credit Markets fluctuated for non-PJM utilities and their affiliates based on changes in capacity obligations and activity in the Capacity Credit Markets.
Figure 4-2 Percent of Load Obligation Served by the PJM Mid-Atlantic Region’s Capacity Credit Market: January through May 2003
Supply and DemandIn the first interval of 2003, capacity resources exceeded capacity obligations in the PJM Mid-Atlantic Region on every day. The pool was long by an average of 1,330 MW. The amount of capacity resources in the PJM Mid-Atlantic Region on any day reflects the addition of new resources, the retirement of old ones and the importing or exporting of capacity resources, decisions that are functions of market forces. The total pool capacity obligation is set annually via an administrative process.
System net excess capacity can be determined using unforced capacity, obligation, the sum of members’ excesses and the sum of members’ deficiencies. Table 4-2 presents these data for the first interval of 2003.5 Net excess is the net pool position, calculated by subtracting obligations from capacity resources. Since obligations include expected load plus a reserve margin, a net pool position of zero is consistent with established reliability objectives.
5 These data are posted on a monthly basis at www.pjm.com under the Market Monitoring Link.
Percent of Load Obligation Served by PJM Mid-Atlantic Region's Capacity Credit Market:January through May 2003
-100%
-80%
-60%
-40%
-20%
0%
20%
40%
60%
80%
100%
Jan Feb Mar Apr May
Perce
ntLo
adOb
ligati
onSe
rved
Non-PJM Utility or Affiliate
Not Affiliated with Utility
PJM Utility
PJM Utility Affiliate
4 –
Capacit
y M
ark
ets

State of the Market 2003 114 www.pjm.com State of the Market 2003 115 www.pjm.com
Table 4-2 The PJM Mid-Atlantic Region’s Member Capacity Summary: January through May 2003 (in MW)
PJM Mid-Atlantic Region Mean Standard Deviation
Minimum Maximum Change from 2002
Percent
Installed Capacity 64,075 335 63,561 64,723 2,615 4.3%
Unforced Capacity 60,960 295 60,548 61,575 2,467 4.2%
Obligation 59,630 0 59,630 59,631 2,992 5.3%
Sum of Excess 1,330 295 917 1,944 -606 -31.3%
Sum of Deficiency 0 2 0 19 -81 -99.7%
Net Excess 1,329 295 917 1,944 -525 -28.3%
Imports 888 232 695 1,236 -586 -39.8%
Exports 1,020 274 766 1,550 721 241.1%
Net Exports 132 429 -357 855 1,307 -111.2%
Unit-Specific Transactions 46,797 1,423 45,245 48,709 18,624 66.1%
Capacity Credit Transactions 64,715 1,990 62,675 67,590 20,096 45.0%
Internal Bilateral Transactions 111,511 3,387 108,177 116,101 38,721 53.2%
Daily Capacity Credits 602 185 413 1,085 318 112.0%
Monthly Capacity Credits 639 93 477 737 43 7.2%
Multimonthly Capacity Credits 2,538 169 2,251 2,688 316 14.2%
All Capacity Credits 3,779 320 3,343 4,463 677 21.8%
ALM Credits 1,292 0 1,292 1,292 -671 -34.2%
Figure 4-3 The PJM Mid-Atlantic Region’s Capacity Obligations: January through May 2003The PJM Mid-Atlantic Region's Capacity Obligations:
January through May 2003
58,000
59,000
60,000
61,000
62,000
63,000
64,000
65,000
Jan Feb Mar Apr May
MW:
Solid
Lines
-1,000
-500
0
500
1,000
1,500
2,000
MW:D
ashe
dLine
s
Installed CapacityUnforced CapacityObligationNet ExcessNet Exports

State of the Market 2003 114 www.pjm.com State of the Market 2003 115 www.pjm.com
Figure 4-4 The PJM Mid-Atlantic Region’s Daily Capacity Credit Market Clearing Price and Cinergy Spread versus Its Net Exports: January through May 2003
As shown in Figure 4-3 and Figure 4-4, capacity owners increased external sales of capacity resources toward the end of the first interval (May) even though the external, daily forward energy prices were generally less than the PJM Mid-Atlantic Region’s prices. Starting in May 2003, there were approximately 1,200 MW exported to New York for its summer period (May through October). The PJM Mid-Atlantic Region’s price in these graphs is the firm, daily forward on-peak PJM Mid-Atlantic Region Western Hub energy price, while the external price is the firm, daily forward on-peak price for Cinergy.6
External Capacity TransactionsPJM Mid-Atlantic Region capacity resources may be traded bilaterally within and outside of the PJM Mid-Atlantic Region. Figure 4-5 presents PJM Mid-Atlantic Region external bilateral capacity transaction data for the first interval of 2003 (Table 4-2 also includes data on imports and exports.) During the first interval, an average of 888 MW of capacity resources was imported into the PJM Mid-Atlantic Region while an average of 1,020 MW was exported (delisted), resulting in an average net export of 132 MW of capacity resources. The maximum level of exports was 1,550 MW, while the maximum import was 1,236 MW. Imports decreased by about 500 MW on March 1, 2003 (see Figure 4-5) and the PJM Mid-Atlantic Region became a net exporter of capacity as a result. Exports rose by about 600 MW on May 1, 2003, and net exports of capacity from the PJM Mid-Atlantic Region increased. Compared to the first interval in 2002, exports rose by 241 percent and imports decreased by about 40 percent. PJM was a net importer of capacity in the first interval of 2002.
The May 1, 2003, export increase was a combination of a 600 MW reduction of capacity exports to a non-NYISO control area and a 1,200 MW increase in exports to the NYISO control area in response to changes in the NYISO capacity markets. These exports to the NYISO capacity market contributed to slightly higher Capacity Market prices in the PJM monthly markets. Analysis suggests that there was a price impact resulting from the increased exports to the NYISO capacity market although the price increase was no more than $5.00 per MW-day because PJM had excess capacity even after the increase in net exports.
The PJM Mid-Atlantic Region's Daily Capacity Credit Market Clearing Price and Cinergy Spreadversus Its Net Exports: January through May 2003
-3,000
-2,500
-2,000
-1,500
-1,000
-500
0
500
1,000
Jan Feb Mar Apr May
NetE
xpor
ts(M
W):
Solid
Lines
-$1,200
-$1,000
-$800
-$600
-$400
-$200
$0
$200
$400
$600
$800
Price
in$p
erMW
-Day
:Das
hedL
ines
Net Exports
Clearing Price
Cinergy Spread
6 These daily forward prices are on-peak prices.
4 –
Capacit
y M
ark
ets

State of the Market 2003 116 www.pjm.com State of the Market 2003 117 www.pjm.com
Figure 4-5 The PJM Mid-Atlantic Region’s External Transactions: January through May 2003
Internal Bilateral TransactionsInternal, unit-specific transactions for the PJM Mid-Atlantic Region during the first interval of 2003 were about 66 percent higher than they had been in the same period of 2002. Internal capacity credit transactions in the first interval of 2003 were about 45 percent higher than they had been in the first interval of 2002.
Figure 4-6 The PJM Mid-Atlantic Region’s Internal Bilateral Transactions: January through May 2003
The PJM Mid-Atlantic Region's External Transactions: January through May 2003
-2,000
-1,500
-1,000
-500
0
500
1,000
1,500
2,000
Jan Feb Mar Apr May
Exter
nalT
rans
actio
ns(M
W)
Net Exports
Imports
Exports
The PJM Mid-Atlantic Region's Bilateral Transactions: January through May 2003
0
10,000
20,000
30,000
40,000
50,000
60,000
70,000
80,000
Jan Feb Mar Apr May
Bilat
eral
Tran
sacti
ons(
MW)
Internal Unit-Specific Bilaterals
Internal Capacity Credit Bilaterals

State of the Market 2003 116 www.pjm.com State of the Market 2003 117 www.pjm.com
Active Load Management CreditsActive load management (ALM) reflects the ability of individual customers, under contract with their LSE, to reduce specified amounts of load during an emergency declared in the PJM Mid-Atlantic Region. ALM credits, measured in MW of curtailable load, reduce LSE capacity obligations. ALM credits in the PJM Mid-Atlantic Region averaged 1,292 MW in the first interval of 2003, down approximately 34 percent from 1,963 MW in the first interval of 2002 (Table 4-2). ALM participation declined for a number of reasons, including the shifting of participants to other PJM demand-side response (DSR) programs.
PJM Western Region: January through May 2003
Supply SideStructural analysis indicates that the PJM Western Region’s Capacity Credit Markets exhibited extremely high levels of concentration in the first interval of 2003. HHI for the shorter term, Daily Capacity Credit Markets averaged about 9808 during the first interval of 2003, with a maximum of 9976 and a minimum of about 3196 (A single firm with 100 percent market share would result in an HHI of 10000 and two firms with equal market shares would result in an HHI of 5000). HHIs for the Interval, Monthly and Multimonthly Capacity Credit Markets were not calculated because there were no transactions in these markets during the first interval of 2003.7 These results are consistent with the conclusion that there was no Capacity Market in the PJM Western Region.
Demand SideDuring the first interval of 2003, electric utility companies supplied nearly 100 percent of the PJM Western Region’s load obligations. Their market shares ranged from 99.95 percent to 99.98 percent and averaged 99.97 percent. The market share of unaffiliated companies was negligible, averaging 0.03 percent.
During the first interval of 2003, reliance on the PJM Western Region’s Capacity Credit Markets was virtually nonexistent. All of the LSEs entered into bilateral contracts for their capacity during 2002. There was market activity on only three days during the interval. There was very little load served by LSEs other than the local electric utility.
Supply and DemandBefore June 2003, on average, capacity resources exceeded capacity obligations by 1,669 MW in the PJM Western Region (Table 4-3). Nonetheless, the PJM Western Region was capacity deficient on three days in the first interval of 2003 as the result of unit outages that affected the amount of available capacity resources under the PJM Western Region Capacity Market rules.
The amount of capacity resources in the PJM Western Region on any day reflects the addition of new resources and the retirement of old ones as well as the import or export of capacity resources, decisions that are a function of market forces. The total pool capacity obligation is set annually via an administrative process.
System net excess capacity can be determined by using available capacity (installed capacity adjusted for all current outages), obligation, the sum of members’ excesses and the sum of their deficiencies. Table 4-3 presents these data for the first interval of 2003. Net excess is the net PJM Western Region position, calculated by subtracting system daily available capacity obligation (DACO) from total capacity resources. System DACO includes expected daily load plus 6 percent. Thus a net PJM Western Region position of zero is consistent with established reliability objectives.
7 See Section 2, “Energy Market,” for a further discussion of HHI.
4 –
Capacit
y M
ark
ets

State of the Market 2003 118 www.pjm.com State of the Market 2003 119 www.pjm.com
Table 4-3 The PJM Western Region’s Member Capacity Summary: January through May 2003 (in MW)
PJM Western Region Mean Standard Deviation
Minimum Maximum Change from 2002
Percent
Installed Capacity 10,293 128 9,919 10,561 -27 -0.3%
Available Capacity 8,482 996 6,271 10,274 946 12.6%
Obligation 6,817 889 5,377 9,002 819 13.7%
Sum of Excess 1,669 633 204 3,710 130 8.5%
Sum of Deficiency 4 31 0 309 3 259.0%
Net Excess 1,666 642 -102 3,710 127 8.3%
Imports 1,649 110 1,241 1,721 -40 -2.4%
Exports 0 0 0 0 -89 -100.0%
Net Exports -1,649 110 -1,721 -1,241 -49 3.1%
Unit-Specific Transactions 2,290 256 1,577 2,633 1,832 400.4%
Capacity Credit Transactions 58 33 33 174 -106 -64.4%
Internal Bilateral Transactions 2,348 249 1,626 2,667 1,726 277.6%
Daily Capacity Credits 0 1 0 8 -7 -98.0%
Monthly Capacity Credits 0 0 0 0 -123 -100.0%
Multimonthly Capacity Credits 0 0 0 0 0 n/a
All Capacity Credits 0 1 0 8 -130 -99.8%
QIL Credits 0 0 0 0 0 n/a
Figure 4-7 The PJM Western Region’s Capacity Obligations: January through May 2003The PJM Western Region's Capacity Obligations: January through May 2003
0
2,000
4,000
6,000
8,000
10,000
12,000
Jan Feb Mar Apr May
MW:S
olidL
ines
-2,000
-1,500
-1,000
-500
0
500
1,000
1,500
2,000
2,500
3,000
3,500
4,000
MW:D
ashe
dLine
s
Installed Capacity
Available Capacity
Obligation
Net Excess
Net Exports

State of the Market 2003 118 www.pjm.com State of the Market 2003 119 www.pjm.com
As shown in Table 4-3, imports of capacity resources for the first interval averaged about 1,650 MW. There were no exports from the PJM Western Region in the first interval of 2003. This is consistent with the fact that the external, daily forward energy prices were generally less than the PJM Western Region’s prices. The PJM Western Region price in these graphs is the firm, daily forward on-peak PJM Western Hub energy price, while the external price is the firm, daily forward on-peak price for Cinergy.
Figure 4-8 The PJM Western Region’s Capacity Credit Market Clearing Price and Cinergy Spread versus Its Net Exports: January through May 2003
External Capacity TransactionsThe PJM Western Region’s capacity resources may be traded bilaterally within and outside of the PJM Western Region. Table 4-3 presents the PJM Western Region bilateral capacity transaction data for the first interval of 2003. An average of 1,650 MW of capacity resources was imported into the PJM Western Region and an average of 0 MW was exported (delisted), for an average net import of 1,650 MW of capacity resources during the period. The maximum export (delist) was 0 MW, while the maximum import was 1,721 MW.
Internal Bilateral TransactionsAverage internal transactions for the PJM Western Region during the first interval of 2003 were 2,348 MW. Internal unit-specific bilateral transactions accounted for approximately 97 percent of all internal bilateral transactions or 2,290 MW. Internal capacity credit transactions in the first interval of 2003 averaged approximately 58 MW.
The PJM Western Region's Capacity Credit Market Clearing Price and Cinergy Spreadversus Its Net Exports: January through May 2003
-2,400
-2,200
-2,000
-1,800
-1,600
-1,400
-1,200
Jan Feb Mar Apr May
NetE
xpor
ts(M
W):
Solid
Lines
-$40
-$30
-$20
-$10
$0
$10
$20
$30
$40
$50
$60
$70
$80
Price
in$p
erMW
-Day
:Das
hedL
ines
Net Exports
Clearing Price
Cinergy Spread
4 –
Capacit
y M
ark
ets

State of the Market 2003 120 www.pjm.com State of the Market 2003 121 www.pjm.com
PJM: June through December 2003
Supply SideThe MMU structural analysis indicates that overall, the PJM Capacity Credit Markets in the last two intervals of 2003 exhibited high levels of concentration. HHIs for the Daily Capacity Credit Markets averaged about 2155, with a maximum of about 3071 and a minimum of about 1262 (four firms with equal market shares would result in an HHI of 2500). HHI for the longer term Interval, Monthly and Multimonthly Capacity Credit Markets averaged about 2479, with a maximum of 6180 and a minimum of more than 1430 (three firms with equal market shares would result in an HHI of 3333). On average 1,120 MW were traded in the Daily Capacity Credit Markets and 3,620 MW were traded in the Monthly and Multimonthly Capacity Credit Markets. The total of 4,740 MW represented, on average, 6.8 percent of total load obligation for the period of which 1.6 percent was attributable to the Daily Capacity Credit Market and 5.2 percent was attributable to the Monthly and Multimonthly Capacity Credit Market.
Demand SideThe market share of non-PJM utilities or affiliates and LSEs not affiliated with a utility, increased on August 1, 2003 by 3,572 MW (5.1 percent) and 1,257 MW (1.8 percent), respectively. Correspondingly, the market share of PJM electric utility companies and their affiliates declined by 4,721 MW or 6.9 percent, averaging 86 percent of the total PJM load obligations during the final two intervals. The market share of PJM electric utility companies averaged 61 percent of the service area’s load. Prior to August 1, 2003, PJM electric utility companies averaged 46,307 MW of load or 66.3 percent of load obligation; after August 1, 2003, their load share averaged 41,328 MW or 58.8 percent of load obligation. As Figure 4-9 shows, market share of the affiliates of PJM electric utilities averaged 25 percent. Their market share prior to August 1, 2003 averaged 17,152 MW or 24.6 percent of load obligation; after August 1, 2003, their market share averaged 17,627 MW or 25.1 percent. The market share of LSEs not affiliated with a utility averaged 3,610 MW was about 5 percent for the final two intervals. Prior to August 1, 2003, their share averaged 2,718 MW or 3.9 percent of load obligation; after August 1, 2003, their average share increased to 3,963 MW or 5.6 percent of load obligation. The market share of non-PJM utilities and their affiliates averaged 6,314 MW or 9 percent for the final two intervals. Prior to August 1, 2003, their share averaged 3,628 MW or 5.2 percent of load obligation; after August 1, 2003, their average share increased to 7,378 MW or 10.5 percent of load obligation.
Figure 4-9 Percent of PJM Load Obligation Served: June through December 2003Percent of PJM Load Obligations Served: June through December 2003
0%
10%
20%
30%
40%
50%
60%
70%
80%
90%
100%
Jun Jul Aug Sep Oct Nov Dec
Perce
ntLo
adOb
ligati
onsS
erve
d
Non-PJM Utility or Affiliate
Not Affiliated with Utility
PJM Utility
PJM Utility Affiliate
State of the Market 2003 120 www.pjm.com State of the Market 2003 121 www.pjm.com
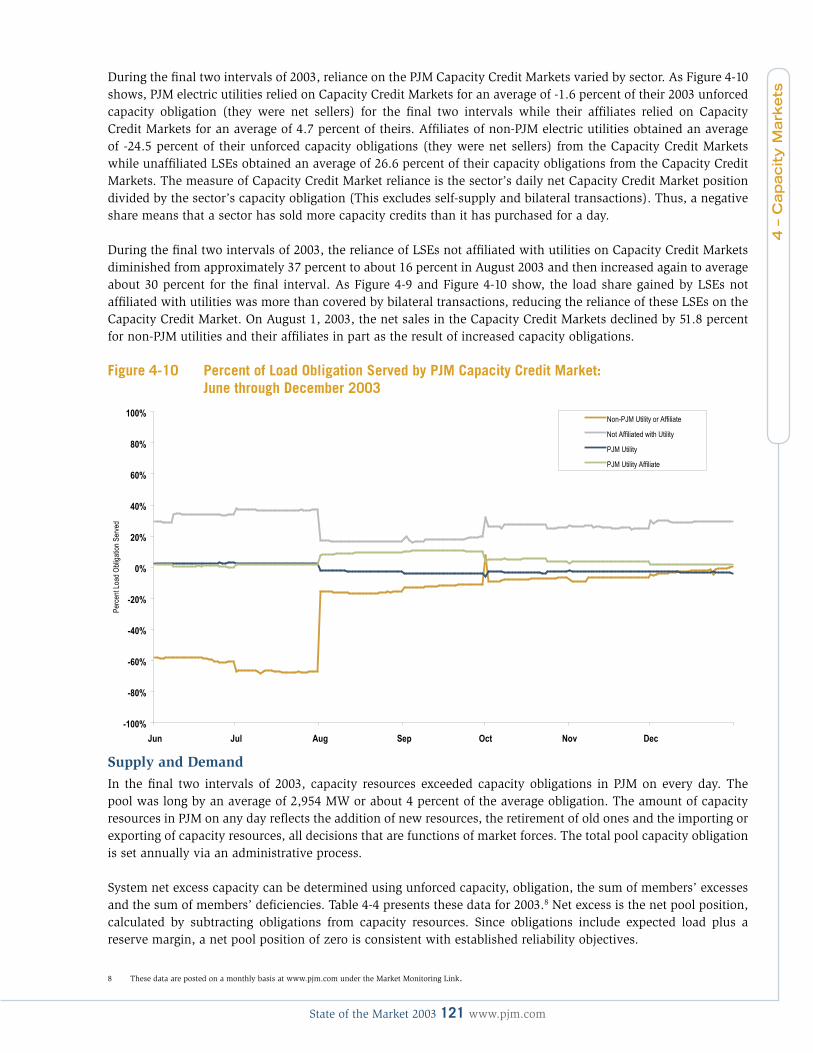
During the final two intervals of 2003, reliance on the PJM Capacity Credit Markets varied by sector. As Figure 4-10 shows, PJM electric utilities relied on Capacity Credit Markets for an average of -1.6 percent of their 2003 unforced capacity obligation (they were net sellers) for the final two intervals while their affiliates relied on Capacity Credit Markets for an average of 4.7 percent of theirs. Affiliates of non-PJM electric utilities obtained an average of -24.5 percent of their unforced capacity obligations (they were net sellers) from the Capacity Credit Markets while unaffiliated LSEs obtained an average of 26.6 percent of their capacity obligations from the Capacity Credit Markets. The measure of Capacity Credit Market reliance is the sector’s daily net Capacity Credit Market position divided by the sector’s capacity obligation (This excludes self-supply and bilateral transactions). Thus, a negative share means that a sector has sold more capacity credits than it has purchased for a day.
During the final two intervals of 2003, the reliance of LSEs not affiliated with utilities on Capacity Credit Markets diminished from approximately 37 percent to about 16 percent in August 2003 and then increased again to average about 30 percent for the final interval. As Figure 4-9 and Figure 4-10 show, the load share gained by LSEs not affiliated with utilities was more than covered by bilateral transactions, reducing the reliance of these LSEs on the Capacity Credit Market. On August 1, 2003, the net sales in the Capacity Credit Markets declined by 51.8 percent for non-PJM utilities and their affiliates in part as the result of increased capacity obligations.
Figure 4-10 Percent of Load Obligation Served by PJM Capacity Credit Market: June through December 2003
Supply and DemandIn the final two intervals of 2003, capacity resources exceeded capacity obligations in PJM on every day. The pool was long by an average of 2,954 MW or about 4 percent of the average obligation. The amount of capacity resources in PJM on any day reflects the addition of new resources, the retirement of old ones and the importing or exporting of capacity resources, all decisions that are functions of market forces. The total pool capacity obligation is set annually via an administrative process.
System net excess capacity can be determined using unforced capacity, obligation, the sum of members’ excesses and the sum of members’ deficiencies. Table 4-4 presents these data for 2003.8 Net excess is the net pool position, calculated by subtracting obligations from capacity resources. Since obligations include expected load plus a reserve margin, a net pool position of zero is consistent with established reliability objectives.
Percent of Load Obligation Served by PJM Capacity Credit Martket:June through December 2003
-100%
-80%
-60%
-40%
-20%
0%
20%
40%
60%
80%
100%
Jun Jul Aug Sep Oct Nov Dec
Perce
ntLo
adOb
ligati
onSe
rved
Non-PJM Utility or Affiliate
Not Affiliated with Utility
PJM Utility
PJM Utility Affiliate
8 These data are posted on a monthly basis at www.pjm.com under the Market Monitoring Link.
4 –
Capacit
y M
ark
ets

State of the Market 2003 122 www.pjm.com State of the Market 2003 123 www.pjm.com
Table 4-4 PJM Member Capacity Summary: June through December 2003 (in MW)
PJM Mean Standard Deviation
Minimum Maximum
Installed Capacity 77,728 1,123 75,866 79,045
Unforced Capacity 73,152 1,061 71,485 74,401
Obligation 70,203 190 69,487 70,492
Sum of Excess 2,954 927 1,447 4,266
Sum of Deficiency 5 10 0 31
Net Excess 2,949 931 1,447 4,266
Imports 3,819 468 3,218 4,638
Exports 1,664 314 1,259 2,457
Net Exports -2,155 686 -3,094 -761
Unit-Specific Transactions 59,311 199 59,011 59,674
Capacity Credit Transactions 71,649 948 70,079 72,937
Internal Bilateral Transactions 130,960 912 129,372 132,611
Daily Capacity Credits 1,120 468 429 2,872
Monthly Capacity Credits 746 168 458 955
Multimonthly Capacity Credits 2,874 602 1,950 3,484
All Capacity Credits 4,740 346 4,420 5,942
ALM Credits 1,207 36 1,156 1,256
Figure 4-11 PJM Capacity Obligations: June through December 2003PJM Capacity Obligation: June through December 2003
66,000
68,000
70,000
72,000
74,000
76,000
78,000
80,000
82,000
Jun Jul Aug Sep Oct Nov Dec
MW:S
olidL
ines
-3,000
-2,000
-1,000
0
1,000
2,000
3,000
4,000
5,000
MW:D
ashe
dLine
s
Installed CapacityUnforced CapacityObligationNet ExcessNet Exports

State of the Market 2003 122 www.pjm.com State of the Market 2003 123 www.pjm.com
Figure 4-12 PJM Daily Capacity Credit Market Clearing Price and Cinergy Spread versus Its Net Exports: June through December 2003
As shown in Figure 4-12 and Figure 4-13, capacity owners increased external sales of capacity resources for the summer period even though the external daily forward energy prices were generally less than PJM systemwide prices. The PJM price in these graphs is the firm, daily forward on-peak PJM Western Hub energy price, while the external price is the firm, daily forward on-peak price for Cinergy.9
Capacity Transactions PJM capacity resources may be traded bilaterally within and outside of the service area. Table 4-4 and Figure 4-14 present PJM bilateral capacity transaction data for the final two intervals of 2003. External bilateral sales (delists) or external bilateral purchases of capacity resources may only be unit-specific; internal bilateral transactions may be unit-specific or in the form of capacity credits.
External Bilateral TransactionsAn average of 3,819 MW of capacity resources was imported into the PJM and an average of 1,664 MW was exported (delisted) for an average net import of 2,155 MW of capacity resources during the period. The maximum export (delist) was 2,457 MW, while the maximum import was 4,638 MW. About three quarters of the capacity exports (1,200 MW in the summer interval) during this period went to New York in response to the NYISO’s implementation of a demand curve for capacity.
PJM Daily Capacity Credit Market Clearing Price and Cinergy Spreadversus Its Net Exports: June through December 2003
-3,000
-2,500
-2,000
-1,500
-1,000
-500
0
500
1,000
Jun Jul Aug Sep Oct Nov Dec
NetE
xpor
tsi(M
W):
Solid
Lines
-$1,200
-$1,000
-$800
-$600
-$400
-$200
$0
$200
$400
$600
$800
Price
in$p
erMW
-Day
:Das
hedL
ines
Net Exports
Clearing Price
Cinergy Spread
9 These daily forward prices are on-peak prices.
4 –
Capacit
y M
ark
ets

State of the Market 2003 124 www.pjm.com State of the Market 2003 125 www.pjm.com
Figure 4-13 PJM External Transactions: June through December 2003
Internal Bilateral TransactionsInternal, unit-specific transactions in the final two intervals of 2003 averaged 59,311 MW per day. Since bilateral contracts of any type can be traded for any period and multiple times, the amount of MW traded can be more than the load obligation. Internal capacity credit transactions during the final two intervals of 2003 averaged 71,649 MW per day. As Figure 4-14 shows, bilateral transactions remained nearly flat for the final two intervals of 2003.
Figure 4-14 PJM Internal Bilateral Transactions: June through December 2003
PJM External Transactions: June through December 2003
-5,000
-4,000
-3,000
-2,000
-1,000
0
1,000
2,000
3,000
4,000
5,000
Jun Jul Aug Sep Oct Nov Dec
Exter
nalT
rans
actio
ns(M
W):
Solid
Lines
Net Exports
Imports
Exports
PJM Bilateral Transactions: June through December 2003
0
10,000
20,000
30,000
40,000
50,000
60,000
70,000
80,000
Jun Jul Aug Sep Oct Nov Dec
Bilat
eral
Tran
sacti
ons(
MW)
Internal Unit-Specific Bilaterals
Internal Capacity Credit Bilaterals

State of the Market 2003 124 www.pjm.com State of the Market 2003 125 www.pjm.com
Active Load Management CreditsALM reflects the ability of individual customers, under contract with their LSE, to reduce specified amounts of load during an emergency declared within the PJM system. ALM credits, measured in MW of curtailable load, reduce LSE capacity obligations. ALM credits in PJM averaged 1,207 MW in the June to December 2003 intervals (Table 4-4). ALM participation in the last two intervals of 2003 declined by 85 MW or nearly 7 percent compared to the year’s first interval because participants shifted to competing PJM DSR programs.
Market Performance
PJM Mid-Atlantic Region: January through May 2003
Capacity Credit MarketsPJM operated Daily, Monthly and Multimonthly Capacity Credit Markets for the Mid-Atlantic Region from January through May 2003. As Table 4-2 shows, the Daily Capacity Credit Market averaged 602 MW of transactions, or about 1.0 percent of the average capacity obligations for the period. Trading in the PJM Mid-Atlantic Region’s Daily Capacity Credit Markets increased slightly compared to activity in the market in 2002.
Prices
Table 4-5 shows prices and volumes in both the Daily and the longer term Capacity Credit Markets. The volume-weighted average price for the first interval of 2003 was $17.36 per MW-day in the Monthly and Multimonthly Capacity Credit Markets and was $6.00 per MW-day in the Daily Capacity Credit Markets. The volume-weighted average price for all Capacity Credit Markets was $15.55 per MW-day.10 Prices in the Daily Capacity Credit Market were relatively constant during the first interval of the year and declined in the Interval, Monthly and Multimonthly Capacity Credit Markets (Figure 4-15). Prices in the monthly and multimonthly markets in 2003 were significantly lower than in 2002; however, prices in the Daily Capacity Credit Markets were slightly higher. The volume-weighted average of all Capacity Credit Markets was $52.86 per MW-day in 1999, $60.55 in 2000, $95.34 in 2001 and $33.40 in 2002. Prices in the Monthly and Multimonthly Capacity Credit Markets were $70.66 per MW-day in 1999, $53.16 in 2000, $100.43 in 2001 and $38.21 in 2002, while the Daily Capacity Credit Market price averaged $3.63 per MW-day in 1999, $69.39 in 2000, $87.98 in 2001 and $0.59 in 2002.
10 Data in the graph and the average price data are all in terms of unforced capacity. Capacity credits are, by definition, in terms of unforced
4 –
Capacit
y M
ark
ets

State of the Market 2003 126 www.pjm.com State of the Market 2003 127 www.pjm.com
Figure 4-15 The PJM Mid-Atlantic Region’s Daily and Monthly Capacity Credit Market Performance: January through May 2003
Table 4-5 The PJM Mid-Atlantic Region’s Capacity Credit Market: January through May 2003
Month/Year Daily (MW) Monthly and Multimonthly
(MW)
Combined (MW)
Weighted-Average
Price Daily ($ per MW)
Weighted-Average Price Monthly and Multimonthly ($ per MW)
Weighted-Average Price
Combined ($ per MW)
Dec-03 n/a n/a n/a n/a n/a n/a
Nov-03 n/a n/a n/a n/a n/a n/a
Oct-03 n/a n/a n/a n/a n/a n/a
Sep-03 n/a n/a n/a n/a n/a n/a
Aug-03 n/a n/a n/a n/a n/a n/a
Jul-03 n/a n/a n/a n/a n/a n/a
Jun-03 n/a n/a n/a n/a n/a n/a
May-03 27,965 104,727 132,693 6.03 16.87 14.58
Apr-03 17,462 98,025 115,487 12.66 15.81 15.33
Mar-03 14,518 103,707 118,225 8.62 15.22 14.41
Feb-03 11,798 82,020 93,818 0.03 18.38 16.07
Jan-03 19,197 91,261 110,458 1.56 21.14 17.73
Jan-May 2003 90,940 479,741 570,681 6.00 17.36 15.55
PJM Mid-Atlantic RegionThe PJM Mid-Atlantic Region Daily and Monthly Capacity Credit Market Performance:
January through May 2003
0
25,000
50,000
75,000
100,000
125,000
150,000
Jan Feb Mar Apr May
Volum
eofC
redit
sTra
nsac
tedin
Unfor
cedM
W
$0
$50
$100
$150
$200
$250
Weig
hted-
Aver
ageC
apac
ityCl
earin
gPric
ein$
perM
W-d
ay
Daily CCM (MW)
Monthly CCM (MW)
Wtd Avg Price Monthly ($/MW)
Wtd Avg Price Daily ($/MW)

State of the Market 2003 126 www.pjm.com State of the Market 2003 127 www.pjm.com
PJM Western Region: January through May 2003
PJM operated Daily, Monthly and Multimonthly Capacity Credit Markets in its Western Region during the first interval of 2003. Consistent with the small share of the market served by nonaffiliated LSEs, the Daily Capacity Credit Market averaged 0.15 MW of transactions, or about 0.04 percent of the average capacity obligations for the period (Table 4-6).11
Capacity Credit Market Pricing Table 4-6 and Figure 4-16 show prices and volumes through May 31, 2003, in both the Daily and the longer term Capacity Credit Markets. The volume-weighted average prices for the period were $74.44 per MW-day in the Monthly and Multimonthly Capacity Credit Markets and $0.02 per MW-day in the Daily Capacity Credit Market. The volume-weighted average of all Capacity Credit Markets was $29.44 per MW-day.12 The high prices in the monthly and multimonthly markets were a result of multimonthly deals done in 2002.
Table 4-6 The PJM Western Region’s Capacity Credit Market: January through May 2003
Month/Year Dail (MW) Monthly and Multimonthly
(MW)
Combined (MW)
Weighted-Average Price Daily ($ per MW)
Weighted-Average Price Monthly and
Multimonthly ($ per MW)
Weighted-Average Price Combined
($ per MW)
Dec-03 n/a n/a n/a n/a n/a n/a
Nov-03 n/a n/a n/a n/a n/a n/a
Oct-03 n/a n/a n/a n/a n/a n/a
Sep-03 n/a n/a n/a n/a n/a n/a
Aug-03 n/a n/a n/a n/a n/a n/a
Jul-03 n/a n/a n/a n/a n/a n/a
Jun-03 n/a n/a n/a n/a n/a n/a
May-03 0 3 3 0.00 74.44 74.44
Apr-03 0 3 3 0.00 74.44 74.44
Mar-03 15 3 18 0.00 74.44 12.68
Feb-03 0 3 3 0.00 74.44 74.44
Jan-03 8 3 11 0.05 74.44 20.83
Jan-May 2003 23 15 38 0.02 74.44 29.44
11 Only limited data are provided for the PJM Western Region’s Capacity Market because the additional data would provide confidential information about the dominant participant
in that market.
12 Data in the graph and the average price data are all in terms of available capacity. Capacity credits are, by definition, in terms of available capacity.
4 –
Capacit
y M
ark
ets

State of the Market 2003 128 www.pjm.com State of the Market 2003 129 www.pjm.com
Figure 4-16 The PJM Western Region’s Daily and Monthly Capacity Credit Market Performance: January through May 2003
The performance of the PJM Western Region’s Capacity Markets illustrates that these were not markets in any meaningful sense. The Capacity Market was dominated on the supply side by one participant and there was very little activity on the demand side.
PJM: June through December 2003
Capacity Credit MarketsPJM operated combined Daily, Monthly and Multimonthly Capacity Credit Markets for the final two intervals of 2003. As Table 4-4 shows, the Daily Capacity Credit Market averaged 1,120 MW of transactions, or about 1.6 percent of the average capacity obligations for the period.
Prices
Table 4-7 shows prices and volumes in both the Daily and the longer term PJM Capacity Credit Markets. The volume-weighted average price for the final two intervals of 2003 was $24.18 per MW-day in the Monthly and Multimonthly Capacity Credit Markets and $0.68 per MW-day in the Daily Capacity Credit Markets. The volume-weighted average price for all Capacity Credit Markets was $18.61 per MW-day.13 Prices in the Daily Capacity Credit Market were relatively constant during the year and declined in the monthly and multimonthly markets (Figure 4-17). Prices in the Capacity Credit Markets in 2003 were lower overall than in 2002.
13 Data in the graph and the average price data are all in terms of unforced capacity. Capacity credits are, by definition, in terms of unforced capacity.
The PJM Western Region'sDaily and Monthly Capacity Credit Market Performance:
January through May 2003
0
10
20
30
40
50
Jan Feb Mar Apr May
Volum
eofC
redit
sTra
nsac
tedin
Unfor
cedM
W
$0
$10
$20
$30
$40
$50
$60
$70
$80
$90
$100
Weig
hted-
Aver
ageC
apac
ityCl
earin
gPric
ein$
perM
W-d
ay
Daily CCM (MW)Monthly CCM (MW)
Wtd Avg Price Monthly ($/MW)Wtd Avg Price Daily ($/MW)

State of the Market 2003 128 www.pjm.com State of the Market 2003 129 www.pjm.com
Figure 4-17 PJM Daily and Monthly Capacity Credit Market Performance: June through December 2003
Table 4-7 PJM Capacity Credit Market: June through December 2003
Month/Year Daily(MW)
Monthly and Multimonthly
(MW)
Combined (MW)
Weighted-Average Price Daily ($ per MW)
Weighted-Average Price Monthly and
Multimonthly ($ per MW)
Weighted-Average Price Combined
($ per MW)
Dec-03 44,240 101,847 146,088 1.63 11.26 8.34
Nov-03 48,638 86,421 135,059 1.55 12.86 8.79
Oct-03 52,844 87,023 139,867 0.04 13.68 8.53
Sep-03 34,596 126,726 161,322 0.02 26.58 20.88
Aug-03 23,164 132,525 155,689 0.05 27.29 23.23
Jul-03 20,632 118,439 139,070 0.11 32.62 27.80
Jun-03 16,020 121,311 137,331 0.50 36.46 32.27
May-03 n/a n/a n/a n/a n/a n/a
Apr-03 n/a n/a n/a n/a n/a n/a
Mar-03 n/a n/a n/a n/a n/a n/a
Feb-03 n/a n/a n/a n/a n/a n/a
Jan-03 n/a n/a n/a n/a n/a n/a
Jun-Dec 2003 240,133 774,292 1,014,426 0.68 24.18 18.61
PJM Daily and Monthly Capacity Credit Market Performance: June through December 2003
0
25,000
50,000
75,000
100,000
125,000
150,000
Jun-03 Jul-03 Aug-03 Sep-03 Oct-03 Nov-03 Dec-03
Volm
eofC
redit
sTra
nsac
tedin
Unfor
cedM
W
$0
$50
$100
$150
$200
$250
Weig
hted-
Aver
ageC
apac
ityCl
earin
gPric
ein$
perM
W-d
ay
Daily CCM (MW)
Monthly CCM (MW)
Wtd Avg Price Monthly ($/MW)
Wtd Avg Price Daily ($/MW)
4 –
Capacit
y M
ark
ets

State of the Market 2003 130 www.pjm.com State of the Market 2003 131 www.pjm.com
PJM: January 2000 through December 2003
Capacity Credit MarketsFigure 4-18 shows prices and volumes in both the Daily and the longer term PJM Capacity Credit Markets from 1999 through 2003. Since the interval system was introduced in June 2001, overall volume in the Monthly and Multimonthly Capacity Credit Markets has increased and prices in both the daily and longer term markets have remained stable. Although daily volume has risen to pre-June 2001 levels, capacity obligations have increased by more than 25 percent. The share of load obligation traded in PJM Daily capacity markets has declined since the introduction of interval markets, while the share of load obligation traded in Monthly and Multimonthly Capacity Markets has increased. Daily Capacity Market volume declined from 2.5 percent of average obligation in 2000 to 1.6 percent in the last two intervals of 2003. Monthly and Multimonthly Capacity Market volume increased from 3.0 percent of obligation in 2000 to 5.2 percent of average obligation in the last two intervals of 2003.
Figure 4-18 PJM Daily and Monthly Capacity Credit Market Performance: January 2000 through December 2003
PJM: January 2003 through December 2003
Capacity Credit Market PricesTable 4-8 shows prices and volumes in both the Daily and the longer term PJM Capacity Credit Markets for the year 2003 combining both the PJM Mid-Atlantic Region from January through May and for PJM from June through December. The volume-weighted average price for 2003 was $21.57 per MW-day in the Monthly and Multimonthly Capacity Credit Markets and $2.14 per MW-day in the Daily Capacity Credit Markets. The volume-weighted average price for all Capacity Credit Markets was $17.51 per MW-day.14 Prices in the Daily Capacity Credit Market were relatively constant during the year and declined in the monthly and multimonthly markets (shown in the last twelve months of Figure 4-18). Prices in the Capacity Credit Markets in 2003 were lower overall than in 2002.
PJM Daily and Monthly Capacity Credit Market Performance:January 2000 through December 2003
0
25,000
50,000
75,000
100,000
125,000
150,000
Jan-
00
Mar-0
0
May-
00
Jul-0
0
Sep-
00
Nov-
00
Jan-
01
Mar-0
1
May-
01
Jul-0
1
Sep-
01
Nov-
01
Jan-
02
Mar-0
2
May-
02
Jul-0
2
Sep-
02
Nov-
02
Jan-
03
Mar-0
3
May-
03
Jul-0
3
Sep-
03
Nov-
03
Volum
eofC
redit
sTra
nsac
tedin
Unfor
cedM
W
$0
$50
$100
$150
$200
$250
Weig
hted-
Aver
ageC
apac
ityCl
earin
gPric
ein$
perM
W-d
ay
Daily CCM (MW)
Monthly CCM (MW)
Wtg Avg Price Monthly ($/MW)
Wtd Avg Price Daily ($/MW)
14 Data in the graph and the average price data are all in terms of unforced capacity. Capacity credits are, by definition, in terms of unforced capacity.

State of the Market 2003 130 www.pjm.com State of the Market 2003 131 www.pjm.com
Table 4-8 PJM Capacity Credit Market: January through December 2003
Month/Year Daily (MW)
Monthly and Multimonthly
(MW)
Combined (MW)
Weighted-Average
Price Daily ($ per MW)
Weighted-Average Price Monthly and
Multimonthly($ per MW)
Weighted-Average Price Combined
($ per MW)
Jan-03 19,197 91,261 110,458 1.56 21.14 17.73
Feb-03 11,798 82,020 93,818 0.03 18.38 16.07
Mar-03 14,518 103,707 118,225 8.62 15.22 14.41
Apr-03 17,462 98,025 115,487 12.66 15.81 15.33
May-03 27,965 104,727 132,693 6.03 16.87 14.58
Jun-03 16,020 121,311 137,331 0.50 36.46 32.27
Jul-03 20,632 118,439 139,070 0.11 32.62 27.80
Aug-03 23,164 132,525 155,689 0.05 27.29 23.23
Sep-03 34,596 126,726 161,322 0.02 26.58 20.88
Oct-03 52,844 87,023 139,867 0.04 13.68 8.53
Nov-03 48,638 86,421 135,059 1.55 12.86 8.79
Dec-03 44,240 101,847 146,088 1.63 11.26 8.34
Jan-Dec 2003 331,073 1,254,033 1,585,106 2.14 21.57 17.51
Availability
Certain outage statistics are calculated by reference to total hours in the year rather than statistical probability. Figure 4-19 shows these performance measures for all PJM units including the PJM Mid-Atlantic Region and the PJM Western Region. The equivalent availability factor equals the proportion of hours in a year that a unit was available to generate at full capacity. The sum of the equivalent availability factor, the equivalent maintenance outage factor, the equivalent planned outage factor and equivalent forced outage factor equals 100 percent. The increase in the equivalent forced outage factor and the equivalent availability factors from 2002 to 2003 corresponded with a decrease in the equivalent planned outage and the equivalent maintenance outage factors. The PJM aggregate equivalent availability factor was 86.8 percent in 2002 and 87.5 percent in 2003.
4 –
Capacit
y M
ark
ets

State of the Market 2003 132 www.pjm.com State of the Market 2003 133 www.pjm.com
Figure 4-19 PJM Equivalent Outage and Availability Factors: 1994 through 2003
Unforced capacity from a specific unit is based on both the maximum summer capability of the unit and the forced outage rate. The PJM Capacity Market creates an incentive to minimize the forced outage rate because the amount of capacity resources available from a unit is inversely related to the forced outage rate. The equivalent demand forced outage rate (EFORd) is a statistical measure of the probability that a unit will fail, either partially or totally, to perform when it is needed. The EFORd calculation uses historical data including equivalent forced outage hours, service hours, average forced outage duration, average run time, average time between unit starts, available hours and period hours. Between 1996 and 2001, the average PJM15 EFORd trended downward, reaching 4.8 percent in 2001 and then increased to 5.2 percent in 2002 and 7.1 percent in 2003. The increase in EFORd of 1.9 percent from 2002 to 2003 was the result of increased forced outage rates across all unit types. Fossil steam units’ EFORd contributed 0.6 percentage points, combustion turbine units’ EFORd contributed 0.9 percentage points and combined-cycle units’ EFORd contributed 0.3 percentage points to the overall increase of 1.9 percentage points. Of the 659 generating units in the EFORd analysis, 134 units (about 20 percent) had increased EFORds. In the absence of offsetting improvements in EFORd by 62 units, the EFORd would have increased by 3.4 percentage points to 8.6 percent. The 62 units with lower forced outage rates reduced the EFORd by 1.5 percentage points, to the observed 7.1 percent EFORd. Figure 4-20 shows the average EFORd since 1994 for all units in the PJM Mid-Atlantic Region and PJM Western Region.
PJM Equivalent Outage and Availability Factors: 1994 through 2003
78%
79%
80%
81%
82%
83%
84%
85%
86%
87%
88%
1994 1995 1996 1997 1998 1999 2000 2001 2002 2003
Equiv
alent
Avail
abilit
yFac
tor:P
erce
ntin
Solid
Line
0%
2%
4%
6%
8%
10%
12%
Outag
eFac
tors:
Perce
ntin
Dash
edLin
es
Equivalent Availability Factor
Equivalent Maintenance Outage Factor
Equivalent Planned Outage Factor
Equivalent Forced Outage Factor
15 The 2003 PJM availability factors and forced outage rates are calculated for the PJM Western Region and the PJM Mid-Atlantic Region combined. The Equivalent Outage and
Availability Factors figure and the EFORd figure are not directly comparable to the corresponding figures in the “2002 State of the Market Report” as the 2002 figures did not include
generating units from the PJM Western Region.

State of the Market 2003 132 www.pjm.com State of the Market 2003 133 www.pjm.com
PJM Equivalent Demand Forced Outage Rate (EFORd) Trend: 1994 through 2003
0
2
4
6
8
10
12
1994 1995 1996 1997 1998 1999 2000 2001 2002 2003
(Per
cent)
Figure 4-20 PJM Equivalent Demand Forced Outage Rate (EFORd) Trend: 1994 through 2003
4 –
Capacit
y M
ark
ets

State of the Market 2003 134 www.pjm.com State of the Market 2003 135 www.pjm.com