Section 2 The Use of Audit Sampling Attribute Sampling.
55
Section 2 The Use of Audit Sampling Attribute Sampling
-
date post
21-Dec-2015 -
Category
Documents
-
view
243 -
download
2
Transcript of Section 2 The Use of Audit Sampling Attribute Sampling.

Section 2
The Use of Audit Sampling
Attribute Sampling

Definition of Audit Sampling
• The application of an audit procedure to less than 100% of the items within an account balance or class of transactions for the purpose of evaluating some characteristic of the balance or class.
• Extrapolation
• Representative sample
• Sample projection
• Aggregate all projected misstatements

Audit Risk and Sampling
• Determine minimum sample need to control audit risk
• How does this relate to sampling?
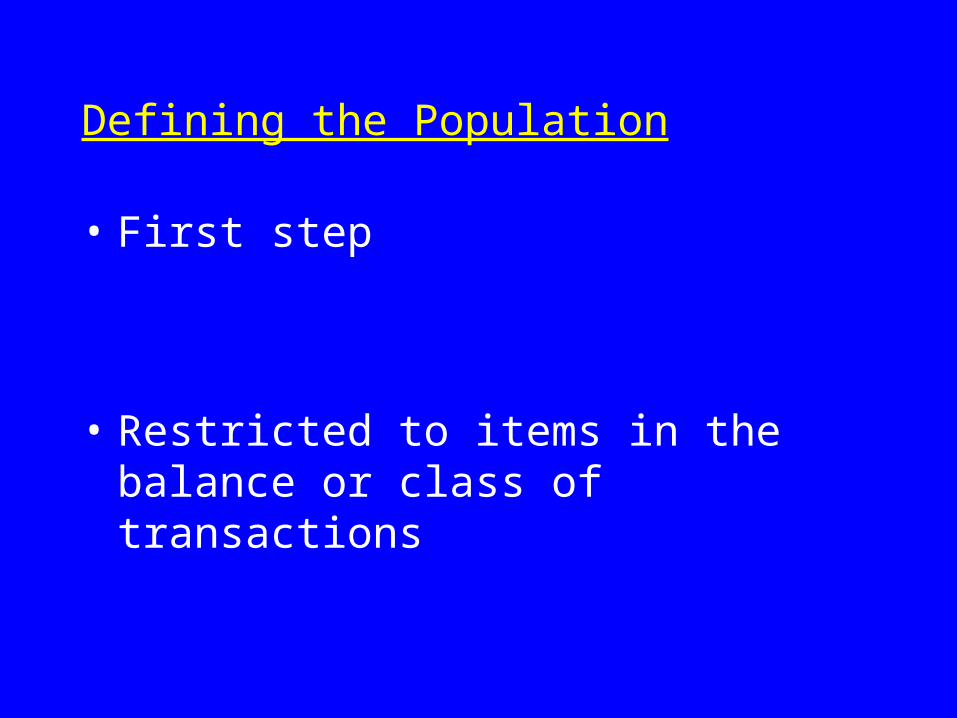
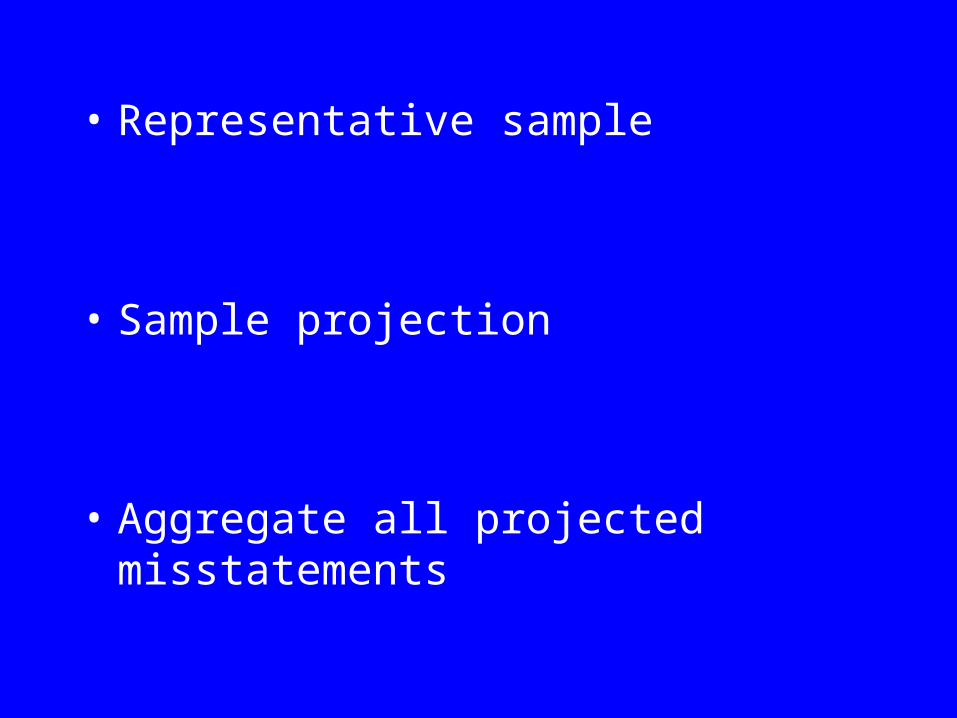
Defining the Population
• First step
• Restricted to items in the balance or class of transactions
Sampling risk
• When an audit test is restricted to a sample
• For testing controls or account balances this means
• Sampling risk inversely related to sample size

Nonsampling risk
• Covers all risks that are not specifically the result of sampling
• i.e. any factor other than sample size

Determinants of Sample Size
• Three factors– Acceptable level of sampling risk
– How much deviation can be accepted
– How much deviation there might be in the population

Acceptable Level of Sampling Risk
• Must consider evidence from other procedures
• Example 1: Low control risk
• Example 2: High control risk

Tolerable Deviation Rate/Tolerable Misstatement
• Rate of deviation from a prescribed control that can be found to exist, without causing a revision in the assessed level of control risk
• Tolerable misstatement amount

• Cannot be larger than the smaller of :
– The materiality amount for the individual item or
– The F/S taken as a whole
• As tolerable rate or misstatement increases

• Suggested range of TDR
• No such guidelines for substantive testing
• Usually done judgmentally based on:
• Overall materiality• Account balance materiality• Type and amount of individual item in the account
balance

• Designing a sample with high tolerable rate or misstatement
• A large sample vs. a small sample
• Highly material accounts or accounts with high likelihood of misstatement
Expected Deviation Rate/ Misstatement Amount
• Impact on sample size
• Commonly use prior years tests of controls

• Estimate need not be exact
• Unless deviation rate is low for tests of controls, what is the alternative?
Statistical Tests of Controls
• Attribute Sampling
– Used to estimate the rate of occurrence of a specific quality or attribute in a population
– Primarily used for

• E.g. Estimating the percentage of shipments not billed
• Thus testing to see if the item was processed correctly or incorrectly
• What about dollar value?

• Three areas to look at:1. Planning the sample
2. Selecting the sample and performing the tests
3. Evaluating the results
• For Attribute Sampling there is no CICA pronouncement
Audit Sampling Steps
• Three sections
a) Plan the sample
b) Select the sample and perform audit procedures
c) Evaluate the results

(a) Planning the Sample
• 9 steps involved
1. State the objectives of the test
• Consider the Revenue Cycle

2. Decide if audit sampling applies
• Is the population appropriate?
• Sampling applies when?

– Specific statement of what contributes an attribute must be made in advance
– E.g.1 A copy of a shipping document is attached to a duplicate sales invoice
– E.g.2 A foreman initials the hourly payroll time cards
3. Define attributes and error conditions

4. Define the population
– Must be defined in advance
– E.g.1 A copy of a shipping document is attached to a duplicate sales invoice• Population?
– E.g.2 A foreman initials the hourly payroll time cards• Population?
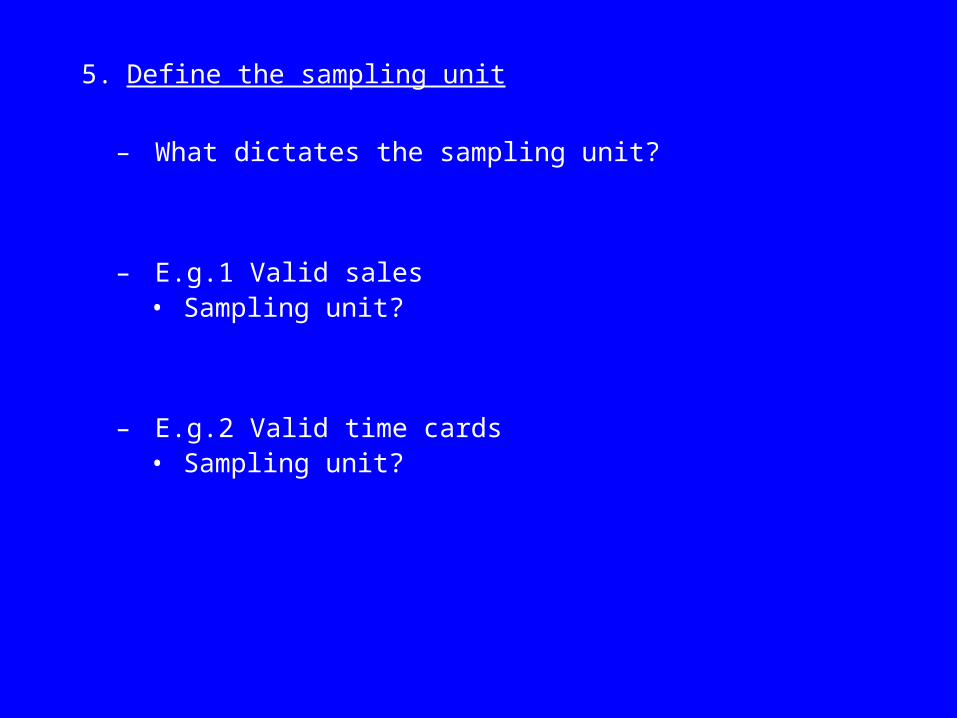
5. Define the sampling unit
– What dictates the sampling unit?
– E.g.1 Valid sales• Sampling unit?
– E.g.2 Valid time cards• Sampling unit?

6. Specify Tolerable Deviation Rate
– What does this mean?
– E.g. With time cards, auditor decides that 5% is the TDR. This means?
- As TDR Sample size?
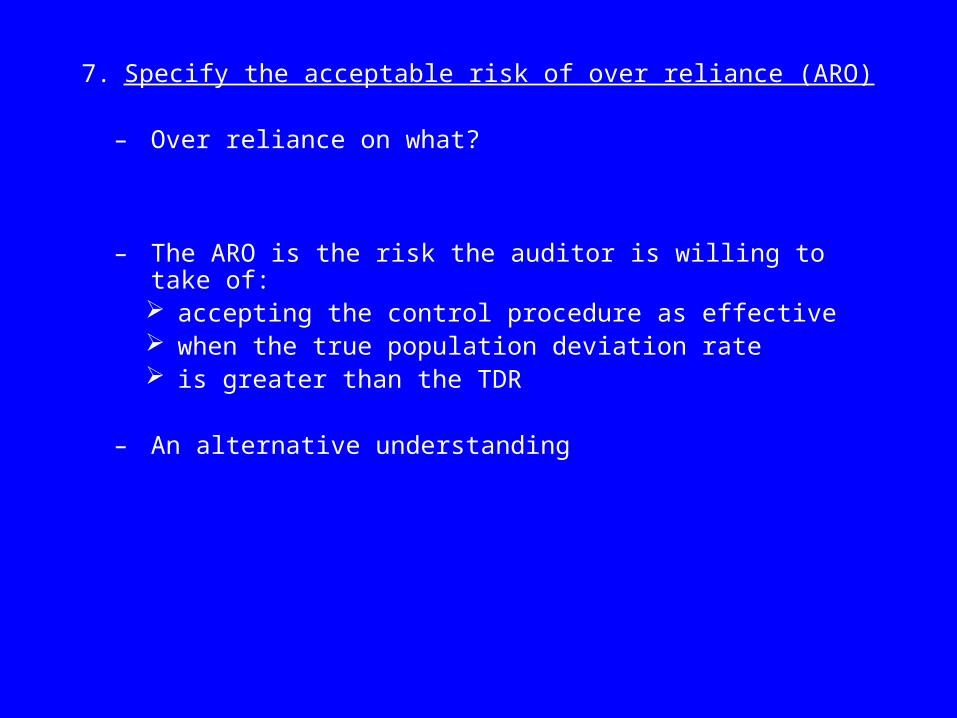
7. Specify the acceptable risk of over reliance (ARO)
– Over reliance on what?
– The ARO is the risk the auditor is willing to take of: accepting the control procedure as effective when the true population deviation rate is greater than the TDR
– An alternative understanding

Illustrative Guidelines for TDR and ARO
Control Risk ARO Significance of T/A’s TDR
Low 5% Highly significant 4%
Medium 10% Significant 5%
High 20% Less significant 6%
•Thus what does it mean if control risk is high?
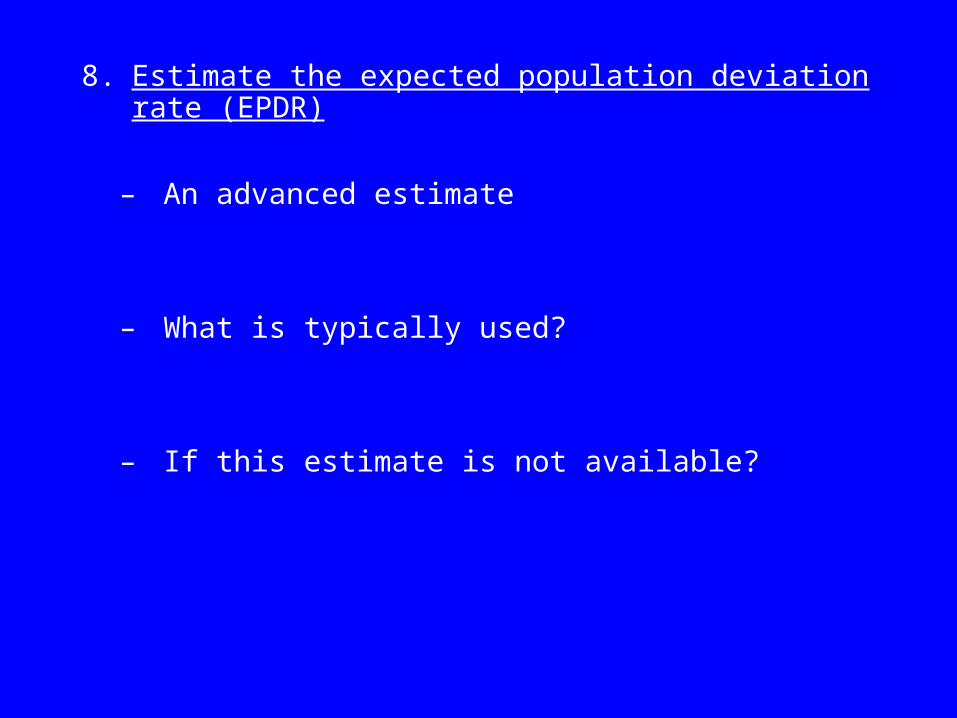
8. Estimate the expected population deviation rate (EPDR)
– An advanced estimate
– What is typically used?
– If this estimate is not available?

9. Determine the initial sample size
– Why look at the initial sample size?
– Will look at an illustrative example.

12-32. Lentner Supply Corp.
Lentner Supply Corp. is a medium sized distributor of wholesale hardware supplies in southern Manitoba. It has been a client of yours for several years and has instituted excellent internal control for the control of sales, at your recommendation.
In providing control over shipments, the client has prenumbered “warehouse removal slips” that are used for every sale. It is company policy never to remove goods from the warehouse without an authorized warehouse removal slip. After shipment, two copies of the warehouse removal slip are sent to billing for the computerized preparation of a sales invoice. One copy is stapled to the duplicate copy of the prenumbered sales invoice, and the other copy is filed numerically. In some cases more than one warehouse removal slip is used for billing one sales invoice. The smallest warehouse removal slip number for the year is 14682 and the largest is 37521. The smallest invoice number is 47821 and the largest is 68507.
In the audit of sales, one of the major concerns is the effectiveness of the control in making sure all shipments are billed. The auditor has decided to use attribute sampling in testing internal control.

(a) State an effective audit procedure for testing whether shipments have been billed. What is the sampling unit for the audit procedure?
(b) Assuming the auditor expects no deviations in the sample but is willing to accept a TDR of 3%, at a 10% risk of over reliance, what is the appropriate sample size?
1. TDR = 3%
2. ARO = 10%
3. EPDR = ?

EXPECTED POPULATION DEVIATION RATE (IN PERCENTAGE)
TOLERABLE DEVIATION RATE
(IN PERCENTAGE)
2 3 4 5 6 7 8 9 10 15 20
5 PERCENT RISK OF OVER RELIANCE
0.00 149 99 74 59 49 42 36 32 29 19 14
0.25 236 157 117 93 78 66 58 51 46 30 22
0.50 . 157 117 93 78 66 58 51 46 30 22
0.75 . 208 117 93 78 66 58 51 46 30 22
1.00 . . 156 93 78 66 58 51 46 30 22
1.25 . . 156 124 78 66 58 51 46 30 22
1.50 . . 192 124 103 66 58 51 46 30 22
1.75 . . 227 153 103 88 77 51 46 30 22
2.00 . . . 181 127 88 77 68 46 30 22
2.25 . . . 208 127 88 77 68 61 30 22
2.50 . . . . 150 109 77 68 61 30 22
2.75 . . . . 173 109 95 68 61 30 22
3.00 . . . . 195 129 95 84 61 30 22
3.25 . . . . . 148 112 84 61 30 22
3.50 . . . . . 167 112 84 76 40 22
3.75 . . . . . 185 129 100 76 40 22
4.00 . . . . . . 146 100 89 40 22
5.00 . . . . . . . 158 116 40 30
6.00 . . . . . . . . 179 50 30
7.00 . . . . . . . . . 68 37

2 3 4 5 6 7 8 9 10 15 2010 PERCENT RISK OF OVER RELIANCE
0.00 114 76 57 45 38 32 28 25 22 15 11
0.25 194 129 96 77 64 55 48 42 38 25 18
0.50 194 129 96 77 64 55 48 42 38 25 18
0.75 265 129 96 77 64 55 48 42 38 25 18
1.00 . 176 96 77 64 55 48 42 38 25 18
1.25 . 221 132 77 64 55 48 42 38 25 18
1.50 . . 132 105 64 55 48 42 38 25 18
1.75 . . 166 105 88 55 48 42 38 25 18
2.00 . . 198 132 88 75 48 42 38 25 18
2.25 . . . 132 88 75 65 42 38 25 18
2.50 . . . 158 110 75 65 58 38 25 18
2.75 . . . 209 132 94 65 58 52 25 18
3.00 . . . . 132 94 65 58 52 25 18
3.25 . . . . 153 113 82 58 52 25 18
3.50 . . . . 194 113 82 73 52 25 18
3.75 . . . . . 131 98 73 52 25 18
4.00 . . . . . 149 98 73 65 25 18
4.50 . . . . . 218 130 87 65 34 18
5.00 . . . . . . 160 115 78 34 18
5.50 . . . . . . . 142 103 34 18
6.00 . . . . . . . 182 116 45 25
7.00 . . . . . . . . 199 52 25
7.50 . . . . . . . . . 52 25
8.00 . . . . . . . . . 60 25
8.50 . . . . . . . . . 68 32

Effect of population size
-Initial sample size only
-Possible to make adjustment to initial sample size based on overall population size
-Finite correction factor
n = revised sample size
n’ = initial sample size
N = population size
n = n’
1 + n’/N

From the problem 12-32
Population is
n =
Thus revised sample size is ?

(b) Select sample and perform audit procedures• Two Steps involved
10. Randomly select the sample (Requirement c of 12-32)
• Use of a random number table
• A one-to-one correspondence between warehouse removal slip
• How is this correspondence achieved?

37039 97547 64673 31546 99314 66854 97855
25145 84834 23009 51584 66754 77785 5235798433 54725 18864 65866 76918 78825 5821097965 68548 81545 82933 93545 85959 6328278049 67830 14624 17563 25697 07734 4824350203 25658 91478 08509 23308 48130 65047
40059 67825 18934 64998 49807 71126 7781884350 67241 54031 34535 04093 35062 5816330954 51637 91500 48722 60988 60029 6087386723 36464 98305 08009 00666 29255 1851450188 22554 86160 92250 14021 65859 16237
50014 00463 13906 35936 71761 95755 8700266023 21428 14742 94874 23308 58533 2650704458 61862 63119 09541 01715 87901 9126057510 36314 30452 09712 37714 95482 3050743373 58939 95848 28288 60341 52174 11879
61500 12763 64433 02268 57905 72347 4949878938 71312 99705 71546 42274 23915 3840564257 93218 35793 43671 64055 88729 1116856864 21554 70445 24841 04779 56774 9612935314 29631 06937 54545 04470 75463 77112
40704 48823 65963 39359 12717 56201 2281107318 44623 02843 33299 59872 86774 0692694550 23299 45557 07923 75126 00808 0131234348 81191 21027 77087 10909 03676 9772392277 57115 50789 68111 75305 53289 39751
56093 58302 52236 65756 50273 61566 6196216623 17849 96701 94971 94758 08845 3226050848 93982 66451 32143 05441 10399 1777548006 58200 58367 66577 68583 21108 4136156640 27890 28825 96509 21363 53657 60119
Random Number Table
Random Stab
Population of Warehouse Removal Slips 14,682 – 37,521

11. Perform the audit procedures
• Requirement a of 12-32 already done
• Requirement d of 12-32
– Other audit procedures

(c) Evaluating the results
• Three steps involved
– Generalize from the sample to the population (12)
– Analyze deviations (13); and
– Decide the acceptability of the population (14)

12. Generalize from the sample to the population
• Need to calculate the sample deviation rate
• SDR = Actual number of deviation
Sample size
• Assume in problem 12-32 that there was 1 deviation in the sample of 76

• Sampling risk prevent auditor from
• Note: ARO was 10%, and n = 76
• Calculation of CUDR
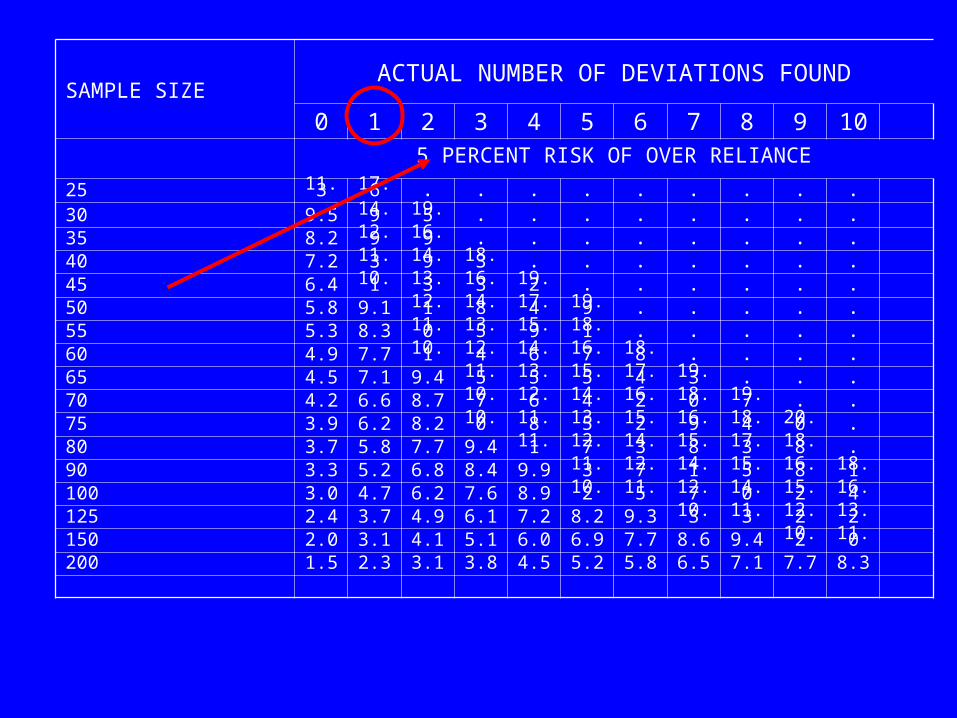
SAMPLE SIZEACTUAL NUMBER OF DEVIATIONS FOUND
0 1 2 3 4 5 6 7 8 9 10
5 PERCENT RISK OF OVER RELIANCE
25 11.3 17.6 . . . . . . . . .
30 9.5 14.9 19.5 . . . . . . . .
35 8.2 12.9 16.9 . . . . . . . .
40 7.2 11.3 14.9 18.3 . . . . . . .
45 6.4 10.1 13.3 16.3 19.2 . . . . . .
50 5.8 9.1 12.1 14.8 17.4 19.9 . . . . .
55 5.3 8.3 11.0 13.5 15.9 18.1 . . . . .
60 4.9 7.7 10.1 12.4 14.6 16.7 18.8 . . . .
65 4.5 7.1 9.4 11.5 13.5 15.5 17.4 19.3 . . .
70 4.2 6.6 8.7 10.7 12.6 14.4 16.2 18.0 19.7 . .
75 3.9 6.2 8.2 10.0 11.8 13.5 15.2 16.9 18.4 20.0 .
80 3.7 5.8 7.7 9.4 11.1 12.7 14.3 15.8 17.3 18.8 .
90 3.3 5.2 6.8 8.4 9.9 11.3 12.7 14.1 15.5 16.8 18.1
100 3.0 4.7 6.2 7.6 8.9 10.2 11.5 12.7 14.0 15.2 16.4
125 2.4 3.7 4.9 6.1 7.2 8.2 9.3 10.3 11.3 12.2 13.2
150 2.0 3.1 4.1 5.1 6.0 6.9 7.7 8.6 9.4 10.2 11.0
200 1.5 2.3 3.1 3.8 4.5 5.2 5.8 6.5 7.1 7.7 8.3

10 PERCENT RISK OF OVER RELIANCE
20 10.9 18.1 . . . . . . . . .
25 8.8 14.7 19.9 . . . . . . . .
30 7.4 12.4 16.8 . . . . . . . .
35 6.4 10.7 14.5 18.1 . . . . . . .
40 5.6 9.4 12.8 15.9 19.0 . . . . . .
45 5.0 8.4 11.4 14.2 17.0 19.6 . . . . .
50 4.5 7.6 10.3 12.9 15.4 17.8 . . . . .
55 4.1 6.9 9.4 11.7 14.0 16.2 18.4 . . . .
60 3.8 6.3 8.6 10.8 12.9 14.9 16.9 18.8 . . .
70 3.2 5.4 7.4 9.3 11.1 12.8 14.6 16.2 17.9 19.5 .
80 2.8 4.8 6.5 8.3 9.7 11.3 12.8 14.3 15.7 17.2 18.6
90 2.5 4.3 5.8 7.3 8.7 10.1 11.4 12.7 14.0 15.3 16.6
100 2.3 3.8 5.2 6.6 7.8 9.1 10.3 11.5 12.7 13.8 15.0
120 1.9 3.2 4.4 5.5 6.6 7.6 8.6 9.6 10.6 11.6 12.5
160 1.4 2.4 3.3 4.1 4.9 5.7 6.5 7.2 8.0 8.7 9.5
200 1.1 1.9 2.6 3.3 4.0 4.6 5.2 5.8 6.4 7.0 7.6
. Over 20 percent

• This measure of CUDR means:
• But true deviation rate is not 5.1
• Revised CUDR = (CUDR-SDR) x N – n
N
+ SDR

13. Analyze deviations or errors
• Why?
• What could have caused the deviation?

14. Decide the acceptability of the population
• When can the population be considered acceptable?
• From 12.32 TDR = 3% and CUDR = 5.1%

Four courses of action can now be followed
1. Revise TDR or ARO
2. Expand sample size
1. If n CUDR

3. Revise assessed control risk
4. Write a letter to management

Problem 1. 12-33: The following is a partial audit program for the audit of cash receipts
1. Review the cash receipts journal for large and unusual transactions.
2. Trace entries from the prelisting of cash receipts to the cash receipts journal to determine if each is recorded.
3. Compare customer name, date, and amount on the prelisting with the cash receipts journal.
4. Examine the related remittance advices for entries selected from the prelisting to determine if cash discounts were approved.
5. Trace entries from the prelisting to the deposit slip to determine if each has been deposited.
Required:
a. Identify which audit procedures could be tested using attribute sampling.
b. What is the appropriate sampling unit for the tests in part (a)?
c. List the attributes for testing in part (a).
d. Assume an ARACR of 5 percent and a TER of 8 percent for tests of controls. The estimated population deviation rate for tests of controls is 2 percent. What is the initial sample size for each attribute?
1 2 3 4 5 6 7
ARACR (in percentage)
10 5 5 5 10 10 5
TER (in percentage)
6 6 5 6 20 20 2
EPER (in percentage)
2 2 2 2 8 2 0
Population size
1,000 100,000 6,000 1,000 500 500 1,000,000
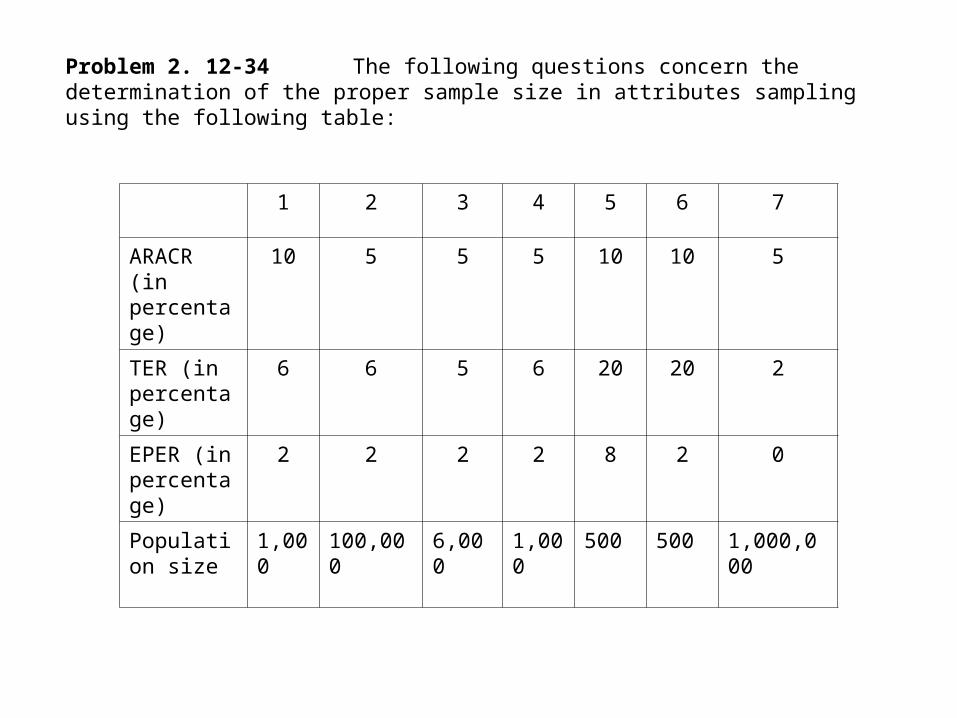
Problem 2. 12-34 The following questions concern the determination of the proper sample size in attributes sampling using the following table:

Required:
a. For each of the columns numbered 1 through 7, decide the initial sample size using nonstatistical methods.
b. For each of the columns numbered 1 through 7, determine the initial sample size needed to satisfy the auditor’s requirements using attribute sampling from Table 12-8.
c. Using your understanding for the relationship between the following factors and sample size, state the effect on the initial sample size (increase or decrease) of changing each of the following factors while the other three are held constant.
1) An increase in ARACR.
2) An increase in the TER.
3) An increase in the EPER.
4) An increase in the population size.
d. Explain why there is such a large difference in the column sizes for columns 3 and 6.
e. Compare your answers in part (b) with the results in part (a). Which of the four factors appears to have the greatest effect on the initial sample size? Which appears to have the least effect?
f. Why is the sample size referred to as the initial sample size?

Control ARO TDR EDR n Deviations Found
CUDR
1 10 8 1 50 0
2 10 8 2 50 1
3 10 8 3 70 3
4 5 8 4 150 1
5 5 10 2 50 2
6 5 10 1 50 1
Problem 3. Computed Upper Deviation Rate: The questions below relate to the upper deviation rate for the following six tests of controls using attribute sampling.

Required:
a. For each control from 1 through 6, determine the computed upper deviation rate.
b. For which controls does the result suggest that the control risk is higher than the auditor has assessed?
c. Explain the effect on the CUDR of changing each of the following three factors while holding the other factors constant:
a. Decreasing the risk of assessing control risk too low.
b. Increasing the deviations found in the sample.
c. Increasing the sample size.

Problem 4. Attributes in Tests of Controls. In auditing the December 31, 200X, financial statements of the Henderson Company, Jenny Starr, CA, is applying attribute sampling in the tests of controls for sales transactions. Based on her knowledge of Henderson Company’s internal control, she estimated that the population deviation rate was 2 percent, and she was willing to accept a 5 percent risk of assessing control risk at a lower level than it actually is. She believes that if the maximum deviation rate is 6 percent, her assessment of control risk at less than maximum is appropriate. Jenny selected a random sample of 200 shipping documents from the 5,500 prepared during the year and audited them. She noted the following matters in the working papers.
1. Invoice 1-422: The signature that would indicate that the shipping clerk recounted the quantity of goods before making shipment was missing from sales order 2971. The accounts receivable record indicates that the customer paid for the quantity listed on the sales order and sales invoice.
2. Invoice 2-631: Bill of lading No. 3118 (indicated on the invoice) could not be located. The accounts receivable record indicates that the customer paid for the quantity listed on the customer’s purchase order and sales invoice.
3. Invoice 3-249: The date that goods were shipped according to the attached bill of lading was four days earlier than the date indicated on the sales invoice and sales journal.

4. Invoice 4-395: The bill of lading No. 5113 indicated that six pairs of R327 flanges were shipped, and the sales invoice and sales journal indicated that only six R327 flanges were shipped. The flanges cost $2.02 each..
5. Invoice 5-422: Bill of lading No. 5892 indicated that the customer order number was LO5992, but the attached order number was PO6884..
6. Invoice 6-837: Bill of lading No. 8921 indicated that a dozen hammers were shipped. The sales journal and sales invoice indicated that 12 dozen hammers were shipped.
7. Invoice 7-012: Invoice 7-012 was voided.
8. Invoice 8-318: A signature was not recorded on the invoice copy indicating that math had been checked before the invoice was mailed to the customer. A mathematical error was not made in calculating the total invoice price.
Required:
a. What attribute(s) did jenny test?
b. Which items listed above should she treat as a deviation?
c. Is it appropriate for Jenny to combine the results of her testing and make an overall statement about internal control?
d. State the statistical conclusions Jenny should reach.
e. What conclusions should Jenny reach about the company’s internal control?