Section 02 Lesson 5/6/7 Atmospheric Pressure, Temperature and Density n Definition of Atmospheric...
34
Section 02 Lesson 5/6/7 Atmospheric Pressure, Temperature and Density Definition of Atmospheric Pressure Measurement of Pressure QFF, QFE, QNH Pressure Variation at Surface Level Pressure Variation with Height Density International Standard Atmosphere Gas Laws
-
Upload
dominic-watkins -
Category
Documents
-
view
221 -
download
2
Transcript of Section 02 Lesson 5/6/7 Atmospheric Pressure, Temperature and Density n Definition of Atmospheric...

Section 02
Lesson 5/6/7
Atmospheric Pressure, Temperature and Density
Definition of Atmospheric Pressure Measurement of Pressure QFF, QFE, QNH Pressure Variation at Surface Level Pressure Variation with Height Density International Standard Atmosphere Gas Laws

Atmospheric Pressure Pressure is defined as force per
unit area. Atmospheric pressure is the force
exerted at the earth’s surface by a column of air above it.
Pressure at a point acts uniformly in all directions.
Units of pressure are: millibar (mb). hectopascal (hPa). 1mb = 1 hPa

Atmospheric Pressure
Atmospheric pressure is defined as the force per unit area exerted against a surface by the weight of the air column above that surface.
The pressure at point "X" increases as the weight of the air above it increases. The pressure at point "X" decreases if the weight of the air above it decreases.

Mercury barometer
Vacuum
Measurement of Atmospheric Pressure

Aneroid Barometer

Barograph Recorder
QFE
Is the prevailing atmospheric/aerodrome pressure at the airfield elevation

QFF
Is the local station barometric pressure adjusted to mean sea level assuming an isothermal column of air at station temperature
It is only used on surface synoptic charts It is expressed to one decimal point.

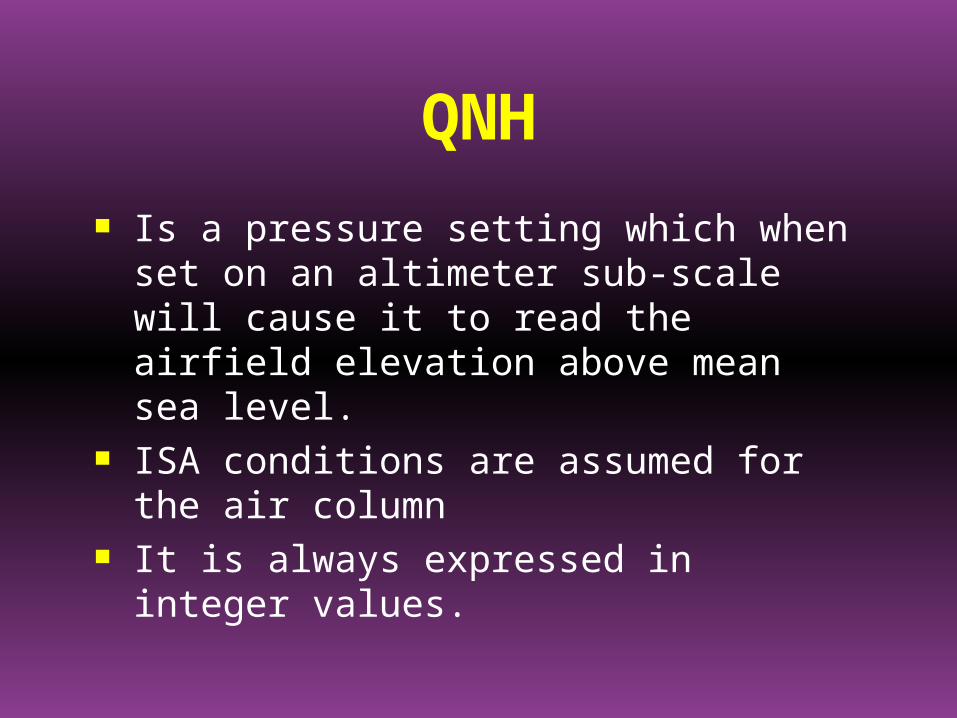
QNH
Is a pressure setting which when set on an altimeter sub-scale will cause it to read the airfield elevation above mean sea level.
ISA conditions are assumed for the air column
It is always expressed in integer values.

Pressure Variation Pressure varies widely from day to
day. Usual range of variation,
970 mb to 1030 mb. Lowest recorded,
870 mb, Typhoon Tip, Oct. 1979. Highest recorded,
1084 mb, Agata, Siberia, Dec. 1968.

Extremes of Surface Pressure Variation
60
Horizontal Pressure Variation
Isobars Highs/Anticyclones Ridges Lows/Cyclones Troughs Pressure Gradient Pressure Gradient Force Isallobars

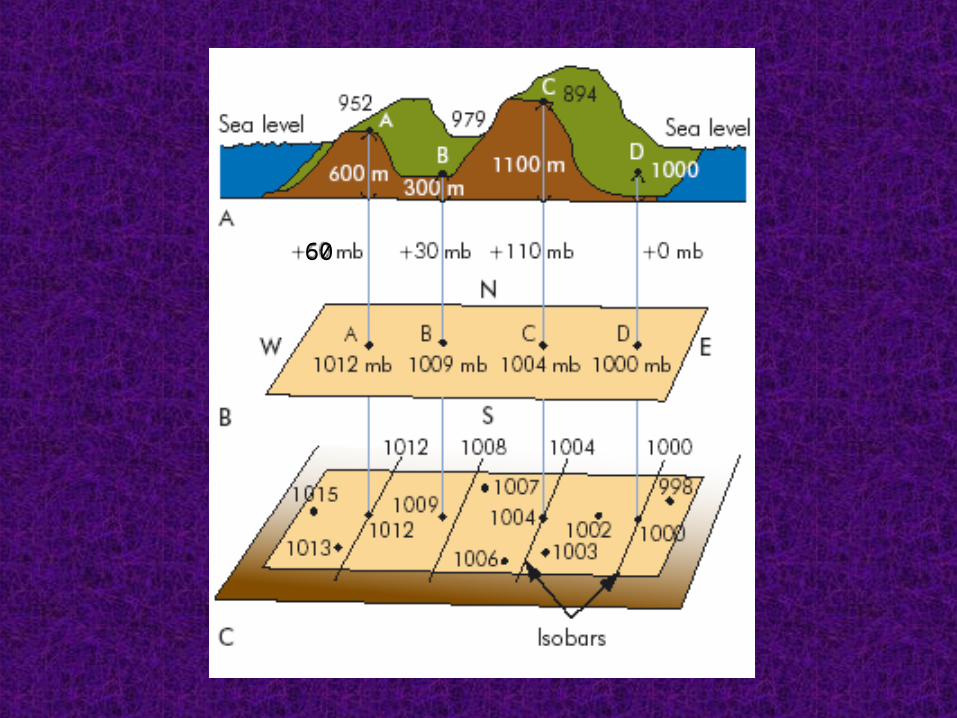
Isobars A line drawn on a weather map
connecting points of equal pressure is called an isobar.
The isobars are generated from mean sea level pressure reports.
The pressure values are given in hectopascals (or millibars).

Surface Isobar Charts
Reporting stations are not all at Mean Sea Level.
Local Barometric Pressure is adjusted to Mean Sea Level using an Isothermal column of air.
Mean Sea Level Pressure plotted on Synoptic Charts is known as the QFF.

Typical Surface Pressure Patterns
TROUGH - formed by the extension of a low
RIDGE - formed by the extension of an anticyclone
COL - a zone of slack pressure gradients with calm or light variable winds
COL Weather over land
Winter: Poor vis; radiation fog
Summer: CB/TS in late afternoon
Patterns of Pressure Distribution
Anticyclones or highs: are regions where the pressure at its centre is highest relative to its surroundings. The circulation is clockwise in the northern hemisphere and anticlockwise in the southern hemisphere.
Ridge: a region of isobars extending away from a high centre with no sharp curvature. Pressure along the line of the ridge is higher than its surroundings.
Patterns of Pressure Distribution
Depressions or lows (or cyclones): are regions where the pressure at its centre is lowest relative to its surroundings. The circulation is anticlockwise in the northern hemisphere and clockwise in the southern hemisphere.
Trough: is a region of isobars extending away from a low centre and may have sharp curvature. Pressure along the line of the trough is lower than its surroundings
Cols: is a region of nearly uniform pressure situated between a pair of highs and a pair of lows.

Pressure Variation with Height
Pressure changes aloft
Pressure decreases with height Pressure also varies horizontally aloft. This is due to horizontal variations of mean
temperature in layers in the atmosphere.

Pressure changes aloft
Rate of pressure decrease with height decreases significantly nearer the tropopause
Pressure is determined by the density of air above


Density
Density = Mass per unit volume (kg/m3)
When air is heated, density becomes less
With an increase in height, both pressure and density decrease
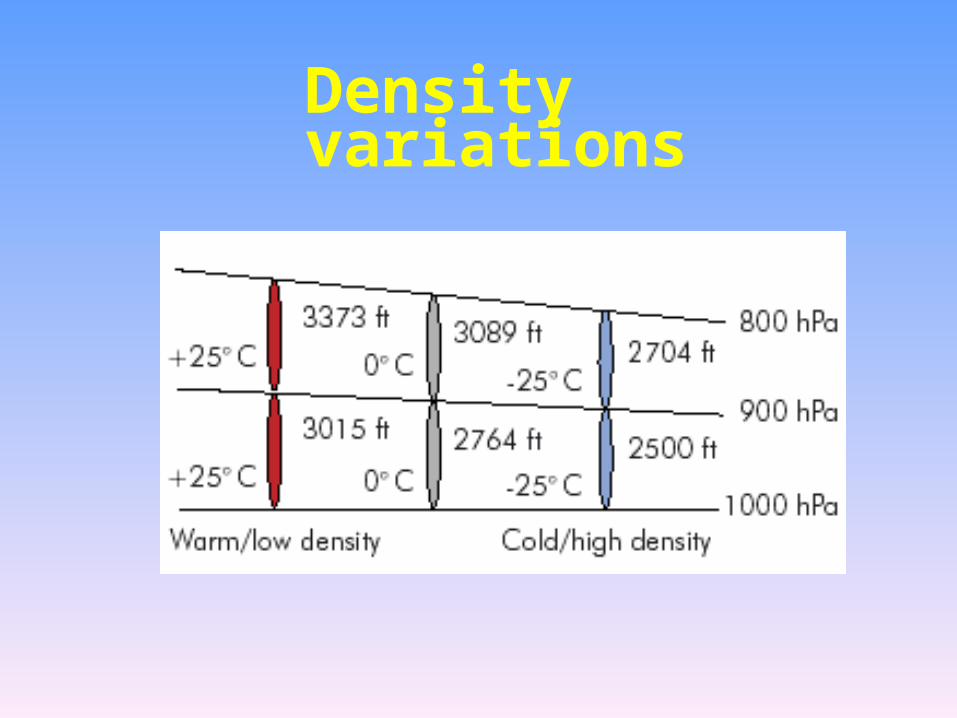
Density variations

Density of dry and moist air
Dry air = 78% N2 , 21% O2
Molecular weight: N2 = 28
O2 = 32
= 60
H20 = 18 Therefore moist air is less dense
than dry air

The Relationship between Pressure, Temperature and Density
Air behaves according to the Gas Law Pressure = Temperature x Density x Gas Constant
• p = T x x C or leaving out the constant
• p T x Pressure is directly proportional to Temperature
and Density
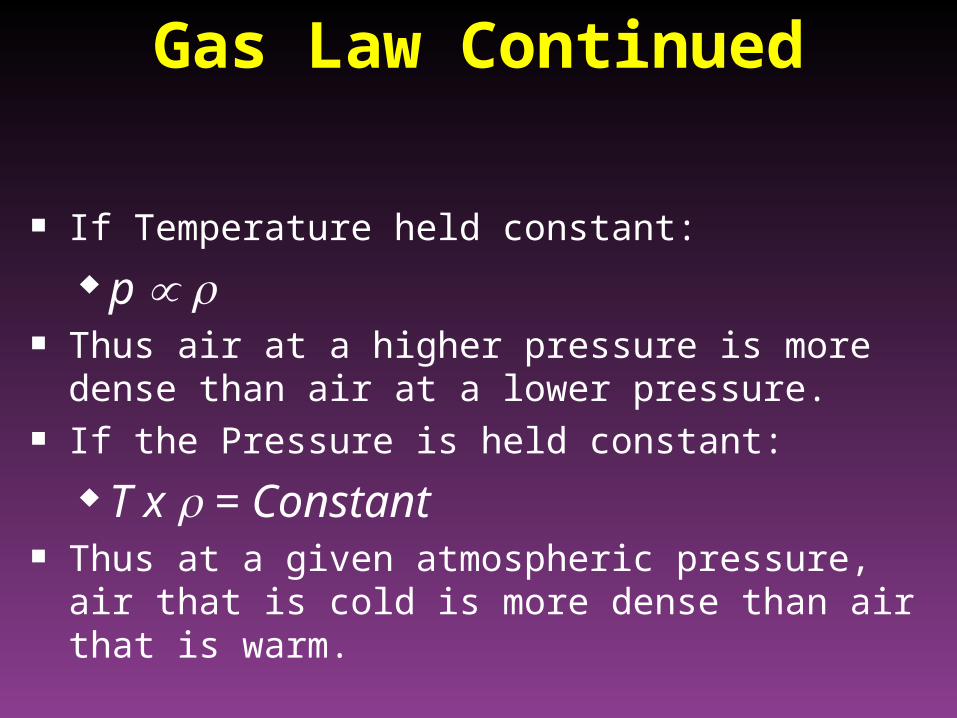
Gas Law Continued
If Temperature held constant:
p Thus air at a higher pressure is more dense than air
at a lower pressure. If the Pressure is held constant:
T x = Constant Thus at a given atmospheric pressure, air that is cold
is more dense than air that is warm.
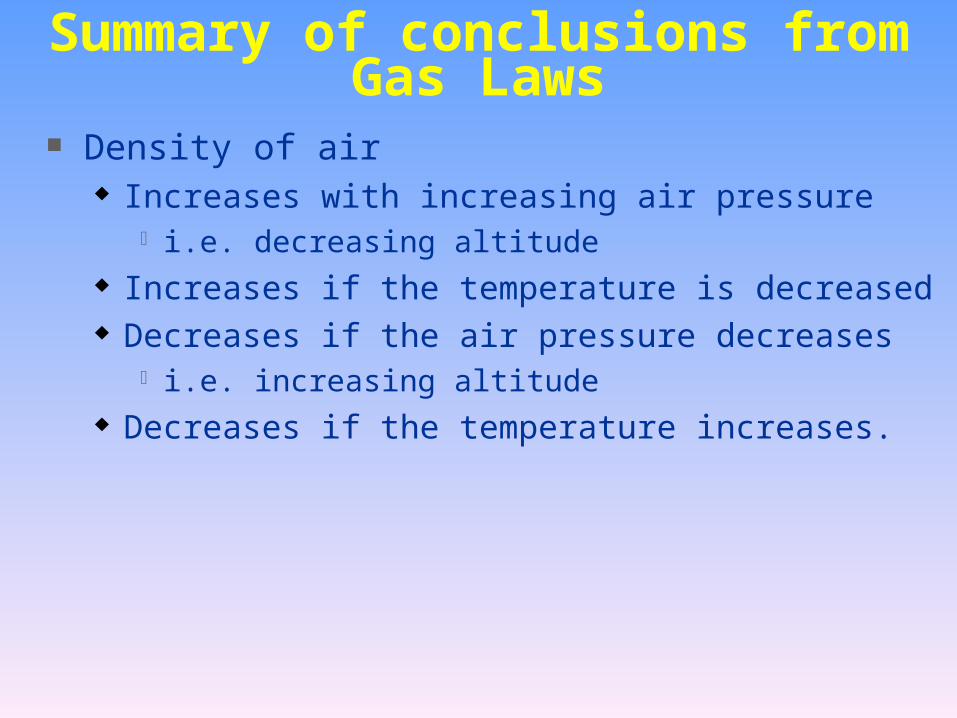
Summary of conclusions from Gas Laws
Density of air Increases with increasing air pressure
i.e. decreasing altitude Increases if the temperature is decreased Decreases if the air pressure decreases
i.e. increasing altitude Decreases if the temperature increases.

Summary of conclusions from Gas Laws
Note that the controlling factor in the atmosphere is air pressure. The rapid decrease of pressure with height
overcomes the tendency of the decreasing temperature with height to increase density.

Pressure and Height Calculations
At sea level pressure 1013hPa and 15°C 1hPa = 27 ft height change
At 500 hPa 1hPa = 50 ft height change
Radiosonde data is used to calculate the “thickness” of the atmosphere at various locations
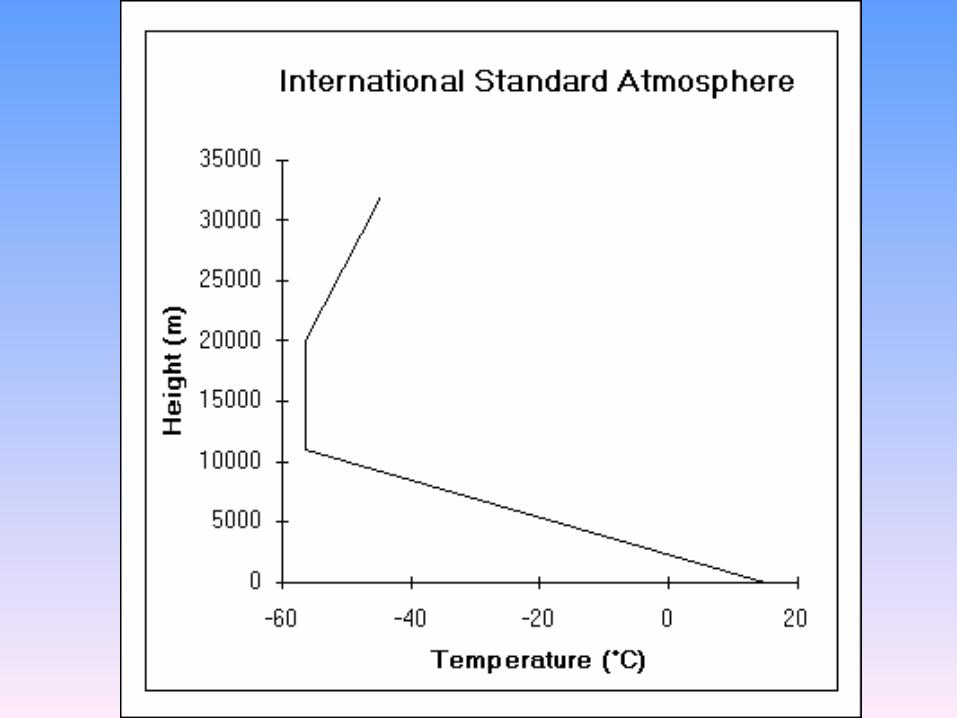

International Standard Atmosphere
MSL Temperature 15°C; 288K
MSL Pressure 1013.25 mb, 29.92 ins Mercury.
MSL Density 1225 gm/m3
TemperatureDecreasing 1.98°C/1000 ft (6.5°C/km) to 11000 m (36090 ft).Isothermal at –56.5°C to 20,000 m (65617 ft).Increasing at 0.3°C/1000ft (1°C/km) to 32,000 m (104987 ft).

Standard Pressure LevelsPressure (mb) Approx. Height1000 Mean sea level700 10,000 ft.500 18,000 ft.400 24,000 ft.300 30,000 ft.250 34,000 ft.200 39,000 ft.150 45,000 ft.