Secondary school leavers and the labour market in Swaziland
24
SECONDARY SCHOOL LEAVERS AND THE LABOUR MARKET IN, SWAZILAND Gerard Sullivan ABSTRACT Secondary education in Swaziland has rapidly expanded in the decade or so since independence. Alongside this achievement has been a growing apprehension that the modern sector's capacity to generate employment is not commensurate with the rising number of educated young people leaving secondary school. The emergence of a 'school leaver problem' as disenchanted educated youngsters remained unemployed was therefore seen as a real possibility towards the end of the 1970s. Such considerations formed the backcloth to tracer surveys conducted in 1979 which investigated the post-school experience of secondary school leavers who left school irt the period 1973-1977. Some aspects of these surveys are discussed in this article which covers the experience of school leavers in finding out about jobs and training, waiting time for jobs, and estimates of unemployment. The occupations entered by school leavers are then assessed in relation to demand projections for educated manpower. These observations reveal that institutional arrangements for transferring school leavers from school to work are embryonic and for a large minority of leavers family and other influential contacts are more important than qualifications in securing a job. For Form 3 Junior Secondary School leavers some credence may be given to the popular impression that unemployment is worsening but Form 5 High School leavers are experiencing little difficulty as yet in finding work. More tentatively it would appear that the marginal additions to the skilled labour force stemming from school leavers are not modifying the occupational structure in line with recent manpower projections. 20
-
Upload
gerard-sullivan -
Category
Documents
-
view
214 -
download
0
Transcript of Secondary school leavers and the labour market in Swaziland
SECONDARY SCHOOL LEAVERS AND THE LABOUR
MARKET IN, SWAZILAND
Gerard Sullivan
ABSTRACT
Secondary education in Swaziland has rapidly expanded in the decade or so since independence. Alongside this achievement has been a growing apprehension that the modern sector's capacity to generate employment is not commensurate with the rising number of educated young people leaving secondary school. The emergence of a 'school leaver problem' as disenchanted educated youngsters remained unemployed was therefore seen as a real possibility towards the end of the 1970s. Such considerations formed the backcloth to tracer surveys conducted in 1979 which investigated the post-school experience of secondary school leavers who left school irt the period 1973-1977.
Some aspects of these surveys are discussed in this article which covers the experience of school leavers in finding out about jobs and training, waiting time for jobs, and estimates of unemployment. The occupations entered by school leavers are then assessed in relation to demand projections for educated manpower.
These observations reveal that institutional arrangements for transferring school leavers from school to work are embryonic and for a large minority of leavers family and other influential contacts are more important than qualifications in securing a job. For Form 3 Junior Secondary School leavers some credence may be given to the popular impression that unemployment is worsening but Form 5 High School leavers are experiencing little difficulty as yet in finding work. More tentatively it would appear that the marginal additions to the skilled labour force stemming from school leavers are not modifying the occupational structure in line with recent manpower projections.
20
LES JEUNES GENS EN FIN DE SCOLARITE ET LE
MARCHE DE L'EMPLOI AU SWAZILAND
Gerard Sullivan
APERCU
L'enseignement secondaire s'est rapidement d6velopp6 au Swaziland, au cours des quelque dix ann6es qui ont suivi son ind6pendance. Parall61ement 5 cette expansion, on constate une inqui6tude croissante: la possibilit6, dans le secteur 6conomique avanc6, de fournir de l'embauche, ne correspond pas au nombre toujours plus 61ev6 de jeunes ayant terrain6 leurs 6tudes secondaires. Le probl6me des jeunes en fin de scolarit6, que n'attendait que le d,6senchantement d'un ch6mage prolong6, s'est fait plus menacant vers la fin des ann6es 70. Cette situation formait la toile de fond d'6tudes men6es en 1979, portant sur l'exp6rience post-scolaire de ces jeunes qui avaient quitt6 l'6cole au tours des ann6es 73-77.
Ces enqu~tes figurent partiellement dans l'expos~ qui suit, et qui met en relief les efforts de ces jeunes h la recherche d'un emploi ou d'une formation, et contraints d'attendre qu'un 'job' se pr6sente; une 6valuation approximative du taux de ch6mage y figure 6galement. Les activit6s dans lesquelles s'engagent les jeunes gens en fin de scolarit6 sont alors compar6es num6riquement aux besoins pr6visibles d'une main-d'oeuvre relativement instruite.
I1 resso.rt de ces observations que les dispositions prises officiellement concernant le transfert 6cole travail ne sont encore qu'en gestation; en outre, pour une minorit6 non n6gligeable des int6ress6s, la famille, entre autres influences, devance en importance les qualifications r6glementaires pour l'obtention d'un emploi. Pour les 616ves des 6coles secondaires ~ cours moyens (d6nomm6es "Junior Schools"), dont la scolarit6 prend fin avec la 3e ann6e d'6tudes, l'impression assez r6pandue que le ch6mage est en hausse est peut-~tre justifi6e; cependant, ceux qui sortent des "High Schools" (dont le programme est comparable ?~ celui des lyc6es francais) h'ont pour l'instant gu6re de difficult6 ~ trouver du travail. Mais ce qui ressort, de facon d'essai, c'est que ces jeunes qui, en quittant l'6cole rejoignent, sur les chantiers d'embauche, les ouvriers sp6cialis6s - - allongeant quelque peu, de ce fair, la liste des candidats 5 l'emploi - - ne modifient en rien les dispositions d'em-d'embauche conformes aux tendances actuelles de la r6partition de la main d'oeuvre.
21
ALUMNOS DEJANDO LAS ESCUELAS SECUNDARIAS
Y EL MERCADO DE TRABAJO EN SWAZILAND
Gerard Sullivan
EXTRACTO
En Swaziland la educaci6n secundaria se ha expansionado rfipidamente en poco mils o menos la filtima d6cada desde la independencia. Junto con este logro ha habido una creciente aprension que la capacidad del sector moderno para generar empleos no guarda relaci6n con el nfimero en aumento de jdvenes dejando la escuela secundaria. La emergencia de un 'problema de alumnos al dejar la escuela', con j6venes educados desencantados permaneciendo sin trabajo rue considerada como una verdadera posibilidad hacia finales de los 70. Tales consideraciones formaron los estudios comprensivos realizados en 1979, investigfindose la experiencia posescolar de los alumnos que terminaron sus estudios en las escuelas secundarias en el perlodo 1973-77.
Algunos aspectos de estos estudios se discuten en este articulo, el cual cubre la experiencia de los alumnos saliendo de las escuelas y adquiriendo conocimientos sobre la manera de haUar trabajo y entrenamiento, tiempos de espera para hallar trabajo y estimaciones de desempleo. Luego se evahian los puestos de trabajo ocupados por los alumnos saliendo de las escuelas en relaci6n a las proyecciones de demanda de mano de obra educada.
Estas observaciones revelan que las disposiciones institucionales para transferir los alumnos dejando la escuela desde la escuela al trabajo son embri6nicas y para una gran minorla de alumnos dejando la escuela, para obtener trabajo la fahailia y otros contactos de influencia son mils importantes que las cualificaciones. Para los alumnos dejando la escuela de la Clase 3 Junior de las Escuelas Secundarias algo de creencia puede darse a la impresi6n popular que el degempleo va empeorando, pero los alumnos dejando la escuela de la Clase 5 de las Escuelas Superiores por el momento tienen poca dificultad para haUar trabajo. Mils tentativamente, parece ser que las adiciones marginales a la fuerza de mano de obra hfibil, consecuencia de los alumnos dejando la escuela, no modifican las estructuras ocupacionales de acuerdo con las proyecciones recientes de mano de obra.
22
Introduction
Moving from a school situation to a work situation for most young people comes at a time when they are experiencing many other changes of a physical and social nature. It is only one of many factors influencing their lives in the late teens and early twenties for, as Williams has observed, 'school leaving and adolescence are contemporary phases in life' (Williams, 1976, 16). Other perhaps more important transformations are taking place at the same time. This article examines some aspects of the experience of secondary school leavers in Swaziland who left the education system after three or five years of secondary schooling from evidence collected in tracer surveys conducted in 1979 (Sullivan, 1981).
National tracer surveys are inadequate instruments for investigating the affective domain. Still, they can provide basic information for planning purposes on how school leavers find out about employment and training opportunities, how long they take to find work, the extent to which they are affected by unemployment and their occupational destinations after leaving school. Each of these themes will be discussed following a preliminary note on the secondary school system in Swaziland and the scope of the tracer surveys. The article concludes with an attempt to relate the out-turn of the secondary school system in the 1970s to recent manpower projections.
Secondary Education in Swaziland Apart from two exceptional schools
offering Sixth Form courses for the Advanced Level examination of the General Certificate of Education, secondary schools provide up to five years of post primary education. The first three years of Junior Secondary education culminate in the locally administered Junior Certificate examination (JC) taken in Form 3 and the last two years of High School education lead to the externally controlled Cambridge Overseas School Certificate examination (COSC) or the Ordinary Level examination of the General
Certificate of Education. Out of 70 schools in 1979 enrolling about 15% of the population's 11-19 years age group, 45 were Junior Secondary Schools and 25 were High Schools. The number of schools has more than doubled since 1966 when there were just over 3,000 children in 31 secondary schools and projected enrolments for 1986 are approaching 27,000. This represents an annual growth in enrolments of about 20% for the decade up to 1976 and 11.5% for the whole period 1966-1986.
Swaziland may therefore be regarded as an archetypal less developed country in the sense that the achievement of such a rapid expansion in the secondary education system in an effort to satisfy the post-independence acceleration in the private demand for educational opportunities, was in danger of being undermined by the labour market's inability to generate sufficient salaried jobs to absorb the rising number of young people leaving the education system. The growing impression that this was the case and the prospect of creating a pool of educated unemployed young people with its attendant social problems formed part of the background to the Ministry of Education's establishment of the School Leaver Tracer Project in 1978. In broad terms the project sought to investigate what has happened to those who left secondary school in the five year period 1973-1977, how examination performance affects the destination of school leavers and to explore the relationship between the secondary school system and the labour market. It concentrated on two groups of leavers, namely, (a) pupils who left school on completion of Form 3 and the JC examination, and (b) pupils who left school on completion of Form 5 and the COSC examination. Examination results were consolidated into three groups corresponding to high, average and low categories of performance to investigate whether the experience of leavers in these groups differed significantly. The equivalence between JC and COSC results and the examination groups is shown in Table 1.
23
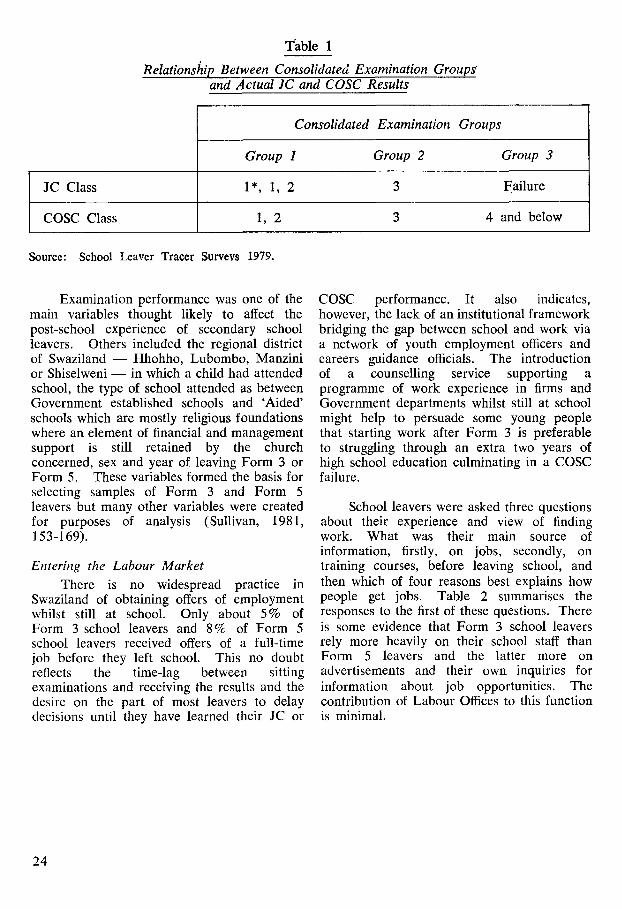
Table 1
Relationship Between Consolidated Examination Groups and Actual 1C and COSC Results
Consolidated Examination Groups
Group 1 Group 2 Group 3
JC Class 1", 1, 2 3 Failure
COSC Class 1, 2 3 4 and below
Source: School Leaver Tracer Surveys 1979.
Examination performance was one of the main variables thought likely to affect the post-school experience of secondary school leavers. Others included the regional district of Swaziland - - Hhohho, Lubombo, Manzini or Shiselweni - - in which a child had attended school, the type of school attended as between Government established schools and 'Aided' schools which are mostly religious foundations where an element of financial and management support is still retained by the church concerned, sex and year of leaving Form 3 or Form 5. These variables formed the basis for selecting samples of Form 3 and Form 5 leavers but many other variables were created for purposes of analysis (Sullivan, 1981, 153-169).
Entering the Labour Market There is no widespread practice in
Swaziland of obtaining offers of employment whilst still at school. Only about 5% of Form 3 school leavers and 8% of Form 5 school leavers received offers of a full-time job before they left school. This no doubt reflects the time-lag between sitting examinations and receiving the results and the desire on the part of most leavers to delay decisions until they have learned their JC or
COSC performance. It also indicates, however, the lack of an institutional framework bridging the gap between school and work via a network of youth employment officers and careers guidance officials. The introduction of a counselling service supporting a programme of work experience in firms and Government departments whilst still at school might help to persuade some young people that starting work after Form 3 is preferable to struggling through an extra two years of high school education culminating in a COSC failure.
School leavers were asked three questions about their experience and view of finding work. What was their main source of information, firstly, on jobs, secondly, on training courses, before leaving school, and then which of four reasons best explains how people get jobs. Table 2 summarises the responses to the first of these questions. There is some evidence that Form 3 school leavers rely more heavily on their school staff than Form 5 leavers and the latter more on advertisements and their own inquiries for information about job opportunities. The contribution of Labour Offices to this function is minimal.
24
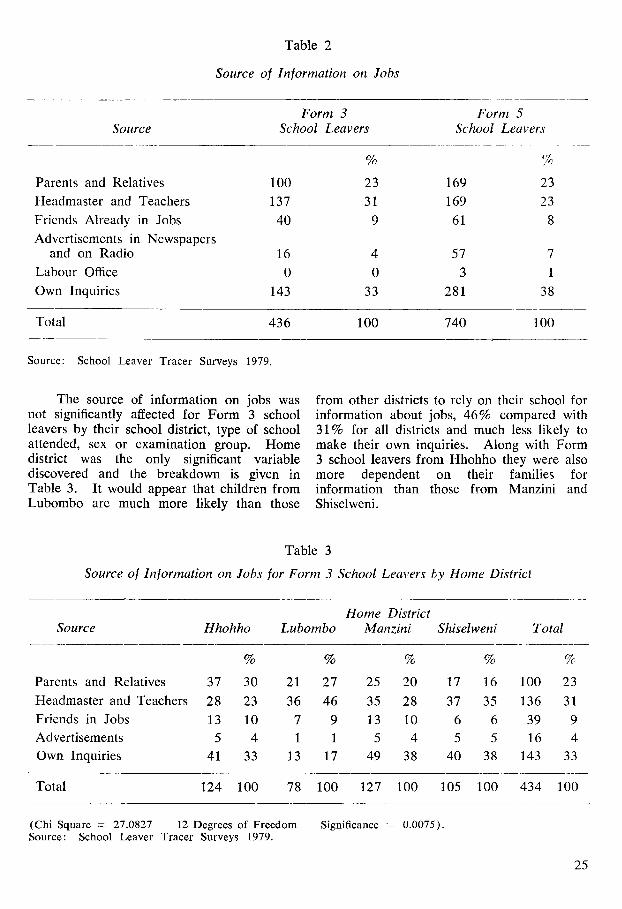
Table 2
Source of Information on Jobs
Form 3 Form 5 Source School Leavers School Leavers
Parents and Relatives
Headmaster and Teachers
Friends Already in Jobs
Advertisements in Newspapers and on Radio
Labour Office
Own Inquiries
% %
100 23 169 23
137 31 169 23
40 9 61 8
16 4 57 7
0 0 3 1
143 33 281 38
Total 436 100 740 100
Source: School Leaver Tracer Surveys 1979.
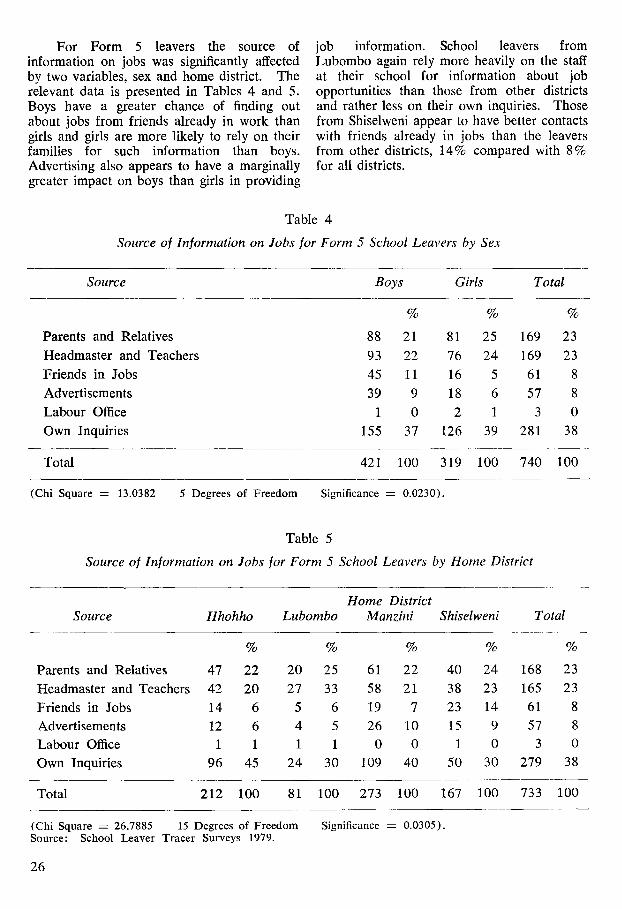
The source of information on jobs was not significantly affected for Form 3 school leavers by their school district, type of school attended, sex or examination group. Home district was the only significant variable discovered and the breakdown is given in Table 3. I t would appear that children f rom Lubombo are much more likely than those
from other districts to rely on their school for information about jobs, 46% compared with 31% for all districts and much less likely to make their own inquiries. Along with Form 3 school leavers f rom Hhohho they were also more dependent on their families for information than those from Manzini and Shiselweni.
Table 3
Source of Information on Jobs for Form 3 School Leavers by Home District
Home District Source Hhohho Lubombo Manzini Shiselweni Total
% % % % %
Parents and Relatives 37 30 21 27 25 20 17 16 100 23
Headmaster and Teachers 28 23 36 46 35 28 37 35 136 31
Friends in Jobs 13 10 7 9 13 10 6 6 39 9
Advertisements 5 4 1 1 5 4 5 5 16 4
Own Inquiries 41 33 13 17 49 38 40 38 143 33
Total 124 100 78 100 127 100 105 100 434 100
(Chi Square =-- 27.0827 12 Degrees of Freedom Source: School Leaver Tracer Surveys 1979.
Significance = 0.0075).
25
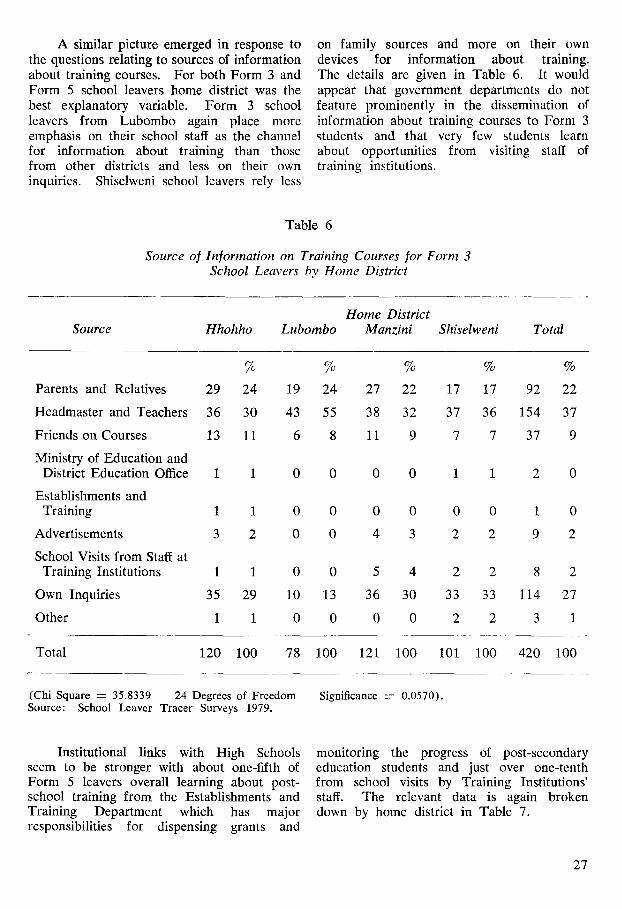
For Form 5 leavers the source of information on jobs was significantly affected by two variables, sex and home district. The relevant data is presented in Tables 4 and 5. Boys have a greater chance of finding out about jobs from friends already in work than girls and girls are more likely to rely on their families for such information than boys. Advertising also appears to have a marginally greater impact on boys than girls in providing
job information. School leavers from Lubombo again rely more heavily on the staff at their school for information about job opportunities than those from other districts and rather less on their own inquiries. Those from Shiselweni appear to have better contacts with friends already in jobs than the leavers from other districts, 14% compared with 8% for all districts.
Table 4
Source of In]ormation on Jobs for Form 5 School Leavers by Sex
Source Boys Girls Total
% % %
Parents and Relatives 88 21 81 25 169 23
Headmaster and Teachers 93 22 76 24 169 23
Friends in Jobs 45 11 16 5 61 8
Advertisements 39 9 18 6 57 8
Labour Office 1 0 2 1 3 0
Own Inquiries 155 37 126 39 281 38
Total 421 100 319 100 740 100
(Chi Square ~ 13.0382 5 Degrees of Freedom Significance = 0.0230).
Table 5
Source o] Information on Jobs ]or Form 5 School Leavers by Home District
Home District Source Hhohho Lubombo Manzini Shiselweni Total
% % % % %
Parents and Relatives 47 22 20 25 61 22 40 24 168 23
Headmaster and Teachers 42 20 27 33 58 21 38 23 165 23
Friends in Jobs 14 6 5 6 19 7 23 14 61 8
Advertisements 12 6 4 5 26 10 15 9 57 8
Labour Office 1 1 1 1 0 0 1 0 3 0
Own Inquiries 96 45 24 30 109 40 50 30 279 38
Total 212 100 81 100 273 100 167 100 733 100
(Chi Square = 26.7885 15 Degrees of Freedom Significance = 0.0305). Source: School Leaver Tracer Surveys 1979.
26
A similar picture emerged in response to the questions relating to sources of information about training courses. For both Form 3 and Form 5 school leavers home district was the best explanatory variable. Form 3 school leavers from Lubombo again place more emphasis on their school staff as the channel for information about training than those from other districts and less on their own inquiries. Shiselweni school leavers rely less
on family sources and more on their own devices for information about training. The details are given in Table 6. It would appear that government departments do not feature prominently in the dissemination of information about training courses to Form 3 students and that very few students learn about opportunities from visiting staff of training institutions.
Table 6
Source o] Information on Training Courses for Form 3 School Leavers by Home District
Home District Source Hhohho Lubombo Manzini Shiselweni Total
% % % % %
Parents and Relatives 29 24 19 24 27 22 17 17 92 22
Headmaster and Teachers 36 30 43 55 38 32 37 36 154 37
Friends on Courses 13 11 6 8 11 9 7 7 37 9
Ministry of Education and District Education Office 1 1 0 0 0 0 1 1 2 0
Establishments and Training 1 1 0 0 0 0 0 0 1 0
Advertisements 3 2 0 0 4 3 2 2 9 2
School Visits from Staff at Training Institutions 1 1 0 0 5 4 2 2 8 2
Own Inquiries 35 29 10 13 36 30 33 33 114 27
Other 1 1 0 0 0 0 2 2 3 1
Total 120 100 78 100 121 100 101 100 420 100
(Chi Square = 35.8339 24 Degrees of Freedom Source: School Leaver Tracer Surveys 1979.
Significance ----- 0.0570).
Institutional links with High Schools seem to be stronger with about one-fifth of Form 5 leavers overall learning about post- school training from the Establishments and Training Department which has major responsibilities for dispensing grants and
monitoring the progress of post-secondary education students and just over one-tenth from school visits by Training Institutions' staff. The relevant data is again broken down by home district in Table 7.
27
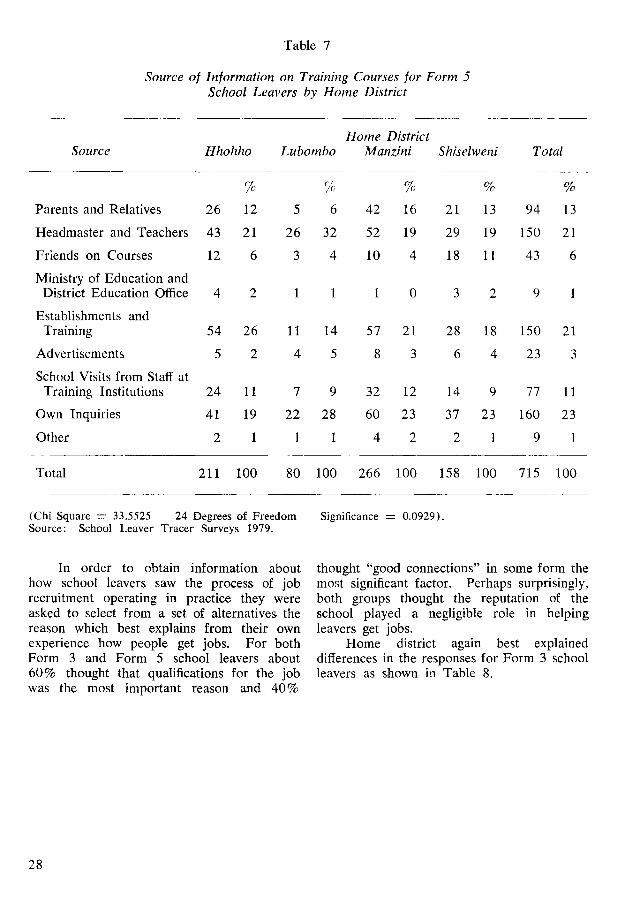
Table 7
Source of Information on Training Courses for Form 5 School Leavers by Home District
Home District Source Hhohho Lubombo Manzini Shiselweni Total
% % % % %
Parents and Relatives 26 12 5 6 42 16 21 13 94 13
Headmaster and Teachers 43 21 26 32 52 19 29 19 150 21
Friends on Courses 12 6 3 4 10 4 18 11 43 6
Ministry of Education and District Education Office 4 2 1 1 1 0 3 2 9 1
Establishments and Training 54 26 11 14 57 21 28 18 150 21
Advertisements 5 2 4 5 8 3 6 4 23 3
School Visits from Staff at Training Institutions 24 11 7 9 32 12 14 9 77 11
Own Inquiries 41 19 22 28 60 23 37 23 160 23
Other 2 1 1 1 4 2 2 1 9 1
Total 211 100 80 100 266 100 158 100 715 100
(Chi Square = 33.5525 24 Degrees of Freedom Source: School Leaver Tracer Surveys 1979.
Significance z 0.0929).
In order to obtain information about how school leavers saw the process of job recruitment operating in practice they were asked to select from a set of alternatives the reason which best explains f rom their own experience how people get jobs. For both Form 3 and Form 5 school leavers about 60% thought that qualifications for the job was the most important reason and 40%
thought "good connections" in some form the most significant factor. Perhaps surprisingly, both groups thought the reputation of the school played a negligible rote in helping leavers get jobs.
Home district again best explained differences in the responses for Form 3 school leavers as shown in Table 8.
28
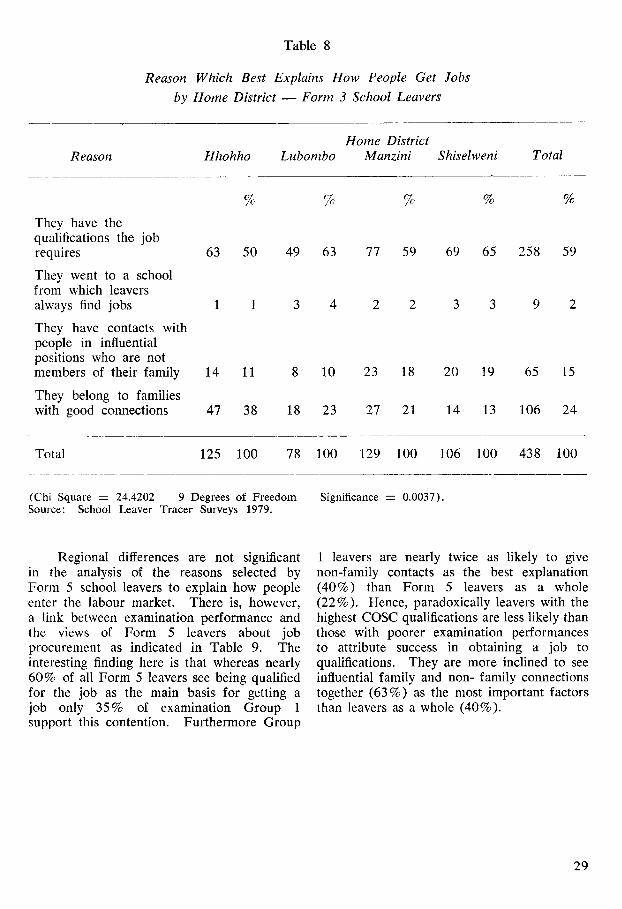
Table 8
Reason Which Best Explains How People Get Jobs
by Home District - - Form 3 School Leavers
Home District Reason Hhohho Lubombo Manzini Shiselweni Total
% % % % %
They have the qualifications the job requires 63 50 49 63 77 59 69 65 258 59
They went to a school from which leavers always find jobs 1 1 3 4 2 2 3 3 9 2
They have contacts with people in influential positions who are not members of their family 14 11 8 10 23 18 20 19 65 15
They belong to families with good connections 47 38 18 23 27 21 14 13 106 24
Total 125 100 78 100 129 100 106 100 438 100
(Chi Square = 24.4202 9 Degrees of Freedom Source: School Leaver Tracer Surveys 1979.
Significance = 0.0037).
Regional differences are not significant in the analysis of the reasons selected by Form 5 school leavers to explain how people enter the labour market. There is, however, a link between examination performance and the views of Form 5 leavers about job procurement as indicated in Table 9. The interesting finding here is that whereas nearly 60% of all Form 5 leavers see being qualified for the job as the main basis for getting a job only 35% of examination Group 1 support this contention. Furthermore Group
1 leavers are nearly twice as likely to give non-family contacts as the best explanation (40%) than Form 5 leavers as a whole (22%). Hence, paradoxically leavers with the highest COSC qualifications are less likely than those with poorer examination performances to attribute success in obtaining a job to qualifications. They are more inclined to see influential family and non- family connections together (63%) as the most important factors than leavers as a whole (40%).
29
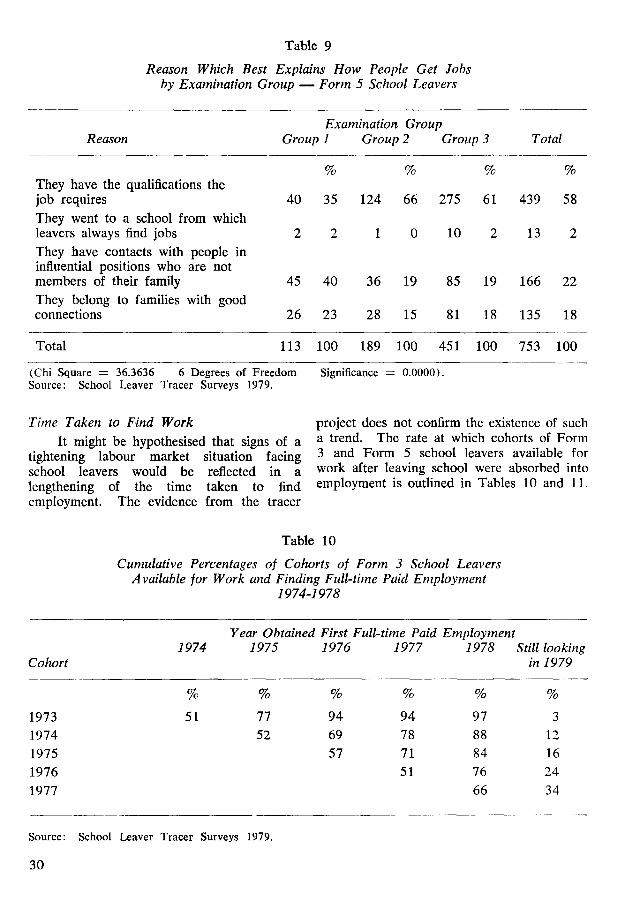
Table 9
Reason Which Best Explains How People Get Jobs by Examination Group m Form 5 School Leavers
Examination Group Reason Group 1 Group 2 Group 3 Total
% % % % They have the qualifications the job requires 40 35 124 66 275 61 439 58
They went to a school from which leavers always find jobs 2 2 1 0 10 2 13 2
They have contacts with people in influential positions who are not members of their family 45 40 36 19 85 19 166 22
They belong to families with good connections 26 23 28 15 81 18 135 18
Total 113 100 189 100 451 100 753 100
(Chi Square = 36.3636 6 Degrees of Freedom Significance = 0.0000). Source: School Leaver Tracer Surveys 1979.
Time Taken to Find Work
It might be hypothesised that signs of a tightening labour market situation facing school leavers would be reflected in a lengthening of the time taken to find employment. The evidence from the tracer
project does not confirm the existence of such a trend. The rate at which cohorts of Form 3 and Form 5 school leavers available for work after leaving school were absorbed into employment is outlined in Tables 10 and 11.
Table 10
Cumulative Percentages of Cohorts of Form 3 School Leavers Available [or Work and Finding Full-time Paid Employment
1974-1978
Cohort 1974
Year Obtained First Full-time Paid Employment 1975 1976 1977 1978 Still looking
in 1979
% % % % % %
1973 51 77 94 94 97 3
1974 52 69 78 88 12
1975 57 71 84 16
1976 51 76 24
1977 66 34
Source: School Leaver Tracer Surveys 1979.
30
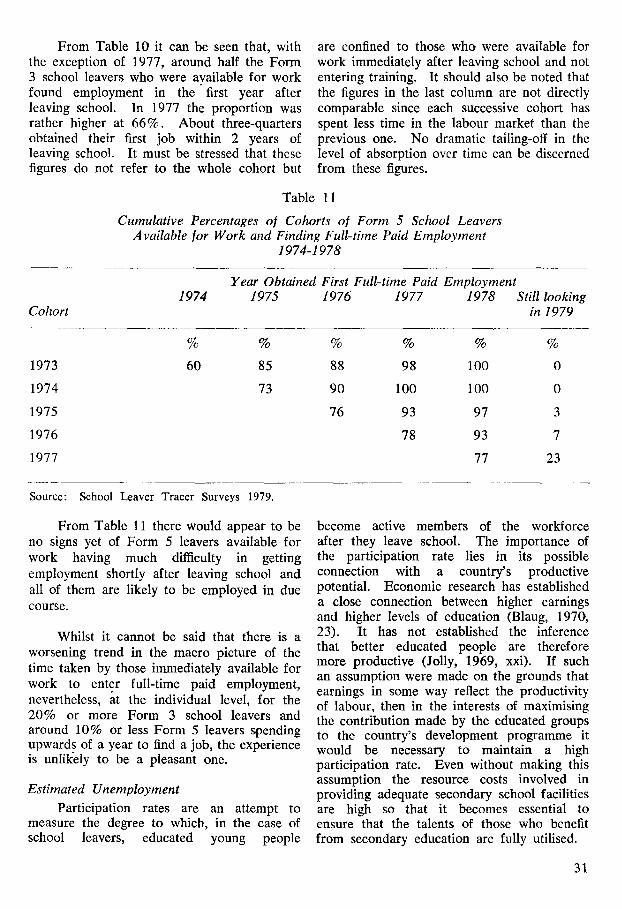
From Table 10 it can be seen that, with the exception of 1977, around half the Form 3 school leavers who were available for work found employment in the first year after leaving school. In 1977 the proportion was rather higher at 66%. About three-quarters obtained their first job within 2 years of leaving school. It must be stressed that these figures do not refer to the whole cohort but
are confined to those who were available for work immediately after leaving school and not entering training. It should also be noted that the figures in the last column are not directly comparable since each successive cohort has spent less time in the labour market than the previous one. No dramatic tailing-off in the level of absorption over time can be discerned from these figures.
Table 11
Cumulative Percentages o] Cohorts of Form 5 School Leavers Available ]or Work and Finding Full-time Paid Employment
1974-1978
Cohort 1974
Year Obtained First Full-time Paid Employment 1975 1976 1977 1978 Still looking
in 1979
% % % % % %
1973 60 85 88 98 100 0
1974 73 90 100 100 0
1975 76 93 97 3
1976 78 93 7
1977 77 23
Source: School Leaver Tracer Surveys 1979.
From Table 11 there would appear to be no signs yet of Form 5 leavers available for work having much difficulty in getting employment shortly after leaving school and all of them are likely to be employed in due course.
Whilst it cannot be said that there is a worsening trend in the macro picture of the time taken by those immediately available for work to enter full-time paid employment, nevertheless, at the individual level, for the 20% or more Form 3 school leavers and around 10% or less Form 5 leavers spending upwards of a year to find a job, the experience is unlikely to be a pleasant one.
Estimated Unemployment
Participation rates are an attempt to measure the degree to which, in the case of school leavers, educated young people
become active members of the workforce after they leave school. The importance of the participation rate lies in its possible connection with a country's productive potential. Economic research has established a close connection between higher earnings and higher levels of education (Blaug, 1970, 23). It has not established the inference that better educated people are therefore more productive (Jolly, 1969, xxi). If such an assumption were made on the grounds that earnings in some way reflect the productivity of labour, then in the interests of maximising the contribution made by the educated groups to the country's development programme it would be necessary to maintain a high participation rate. Even without making this assumption the resource costs involved in providing adequate secondary school facilities are high so that it becomes essential to ensure that the talents of those who benefit from secondary education are fully utilised.
31
Only exceptionally would school leavers not regard themselves as available for either work or training on leaving school and since entering a training course implies availability for, and a high probability of finding, employment afterwards, the participation rate for this group is potentially around its maximum value. The rate of unemployment is the conceptual converse of the participation rate so that at the extreme, a participation rate of 100% is the equivalent of an unemployment rate of zero.
The actual participation rate achieved by school leavers in Swaziland refers to the proportion available for employment after leaving school who found jobs. For Form 3 school leavers the actual participation rate for all cohorts in the survey period was 58% which implies, conversely, that unemployment averaged 42% in the first year after leaving
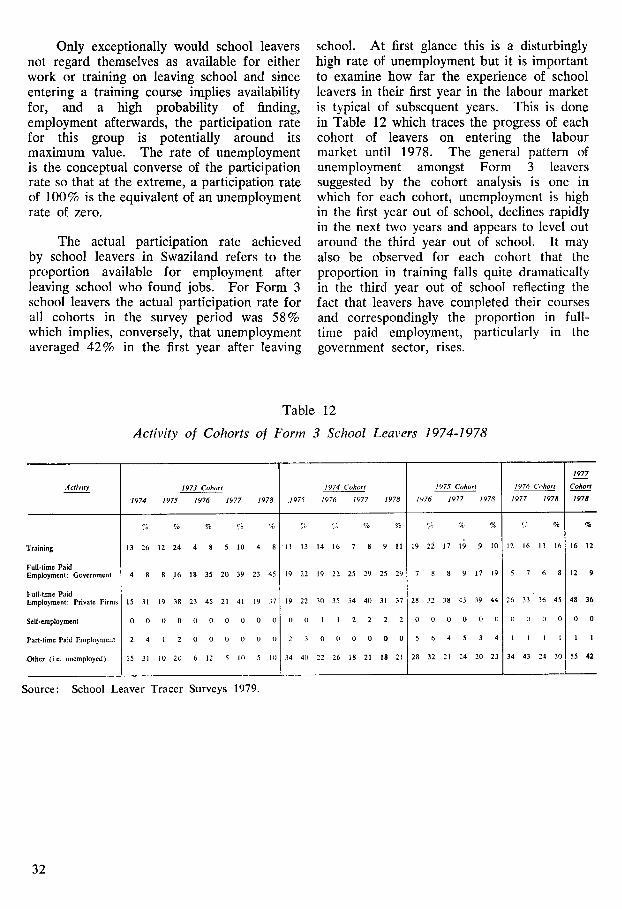
school. At first glance this is a disturbingly high rate of unemployment but it is important to examine how far the experience of school leavers in their first year in the labour market is typical of subsequent years. This is done in Table 12 which traces the progress of each cohort of leavers on entering the labour market until 1978. The general pattern of unemployment amongst Form 3 leavers suggested by the cohort analysis is one in which for each cohort, unemployment is high in the first year out of school, declines rapidly in the next two years and appears to level out around the third year out of school. It may also be observed for each cohort that the proportion in training falls quite dramatically in the third year out of school reflecting the fact that leavers have completed their courses and correspondingly the proportion in full- time paid employment, particularly in the government sector, rises.
Table 12
Activity of Cohorts o[ Form 3 School Leavers 1974-1978
Activity
rralnlng
Full-time Paid Employment: Government
Full-time Paid Employment: Private Firms
~,elf*employment
'art-time Paid Employment
Dlher (i.e. unemployed)
1973 Cohort
"1974 1975 1976 1977 1978
% % % % %
13 26 12 24 4 8 5 10 4 8
4 8 8 .16 18 35 20 39 23 45
15 31 19 38 23 45 21 41 19 37
0 0 0 0 0 0 0 0 0 0
2 4 I 2 0 0 0 0 0 0
15 31 10 20 6 12 5 10 5 10
1974 Cohort
.1975 1976 1977
% % %
11 13 14 16 7 8 9 11
19 22 19 22 25 29 25 29
19 22 30 35 34 40 31 37
0 0 I I 2 2 2 2
2 3 0 0 0 0 0 0
34 40 22 26 18 21 18 21
1975 Cohort
1978 1976 1977 1978
% f ; % %
19 2.~ ~7 z9 9 10
7 8 8 9 17 19
28 32 38 43 39 44
0 0 0 0 0 0
5 6 4 5 3 4
28 32 21 .24 20 23
1977
1976 Cohort Cohort
1977 1978 1978
• : % %
12 16 13 16 16 12
5 7 6 8 12 9
26 33 36 45 48 36
0 II 0 0 0 0
1 I l I 1 I
34 43 24 30 55 42
Source: School Leaver Tracer Surveys 1979.
32
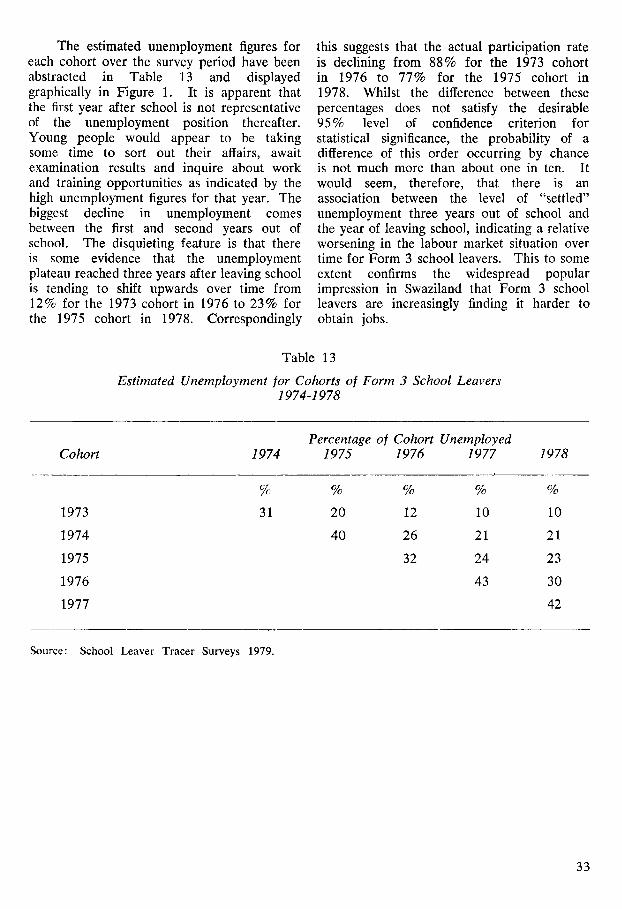
The estimated unemployment figures for each cohort over the survey period have been abstracted in Table 13 and displayed graphically in Figure 1. It is apparent that the first year after school is not representative of the unemployment position thereafter. Young people would appear to be taking some time to sort out their affairs, await examination results and inquire about work and training opportunities as indicated by the high unemployment figures for that year. The biggest decline in unemployment comes between the first and second years out of school. The disquieting feature is that there is some evidence that the unemployment plateau reached three years after leaving school is tending to shift upwards over time from 12% for the 1973 cohort in 1976 to 23% for the 1975 cohort in 1978. Correspondingly
this suggests that the actual participation rate is declining from 88% for the 1973 cohort in 1976 to 77% for the 1975 cohort in 1978. Whilst the difference between these percentages does not satisfy the desirable 95% level of confidence criterion for statistical significance, the probability of a difference of this order occurring by chance is not much more than about one in ten. It would seem, therefore, that there is an association between the level of "settled" unemployment three years out of school and the year of leaving school, indicating a relative worsening in the labour market situation over time for Form 3 school leavers. This to some extent confirms the widespread popular impression in Swaziland that Form 3 school leavers are increasingly finding it harder to obtain jobs.
Table 13
Estimated Unemployment for Cohorts of Form 3 School Leavers 1974-1978
Cohort 1974 Percentage oJ Cohort Unemployed
1975 1976 1977 1978
1973
1974
1975
1976
1977
% % % % %
31 20 12 10 10
40 26 21 21
32 24 23
43 30
42
Source: School Leaver Tracer Surveys 1979.
33
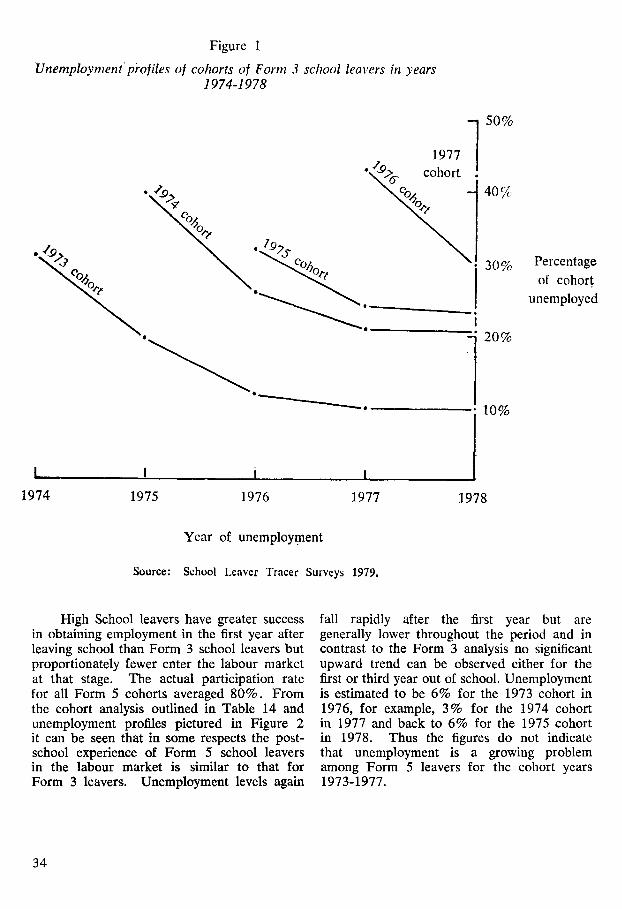
Figure 1
Unernployment pro]iles of cohorts of Form 3 school leavers in years 1974-1978
- 5 0 %
1977 • ~ " ~ / ~ cohort _
• %
• I ~ e ' , I
i • 10%
40%
Percentage
of cohort
unemployed
t I i I
1974 1975 1976 1977 1978
Year of unemployment
Source: School Leaver Tracer Surveys 1979.
High School leavers have greater success in obtaining employment in the first year after leaving school than Form 3 school leavers but proportionately fewer enter the labour market at that stage. The actual participation rate for all Form 5 cohorts averaged 80%. From the cohort analysis outlined in Table 14 and unemployment profiles pictured in Figure 2 it can be seen that in some respects the post- school experience of Form 5 school leavers in the labour market is similar to that for Form 3 leavers. Unemployment levels again
fall rapidly after the first year but are generally lower throughout the period and in contrast to the Form 3 analysis no significant upward trend can be observed either for the first or third year out of school. Unemployment is estimated to be 6% for the 1973 cohort in 1976, for example, 3% for the 1974 cohort in 1977 and back to 6% for the 1975 cohort in 1978. Thus the figures do not indicate that unemployment is a growing problem among Form 5 leavers for the cohort years 1973-1977.
34
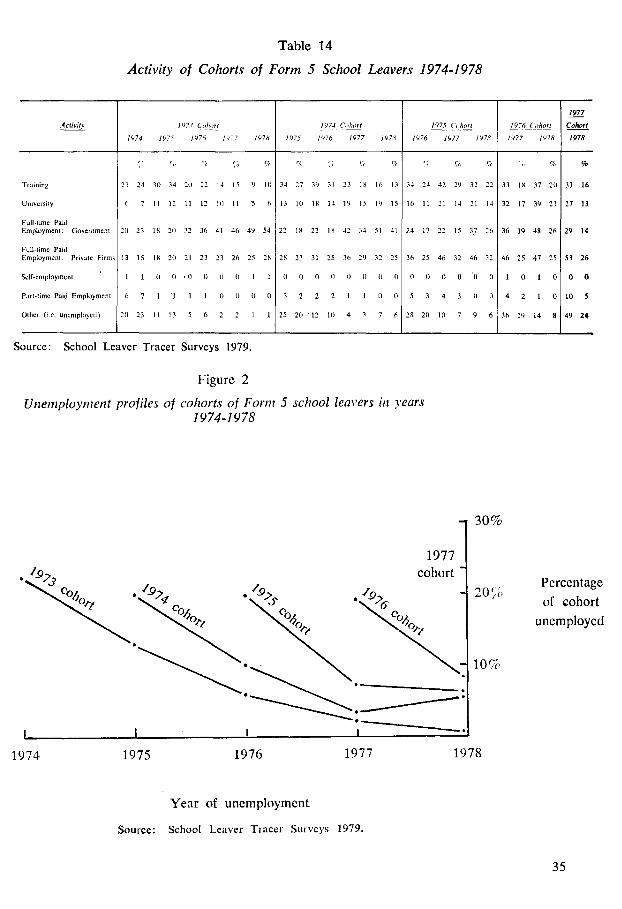
Table 14
Activity of Cohorts of Form 5 School Leavers 1974-1978
ActMty
Training
University
Full-time Paid Employment : Government
Full-time Paid Employment : Pri; 'ate Firms
Self-employment
Part-time Paid Employment
Other l i e . unemployed)
197.? Cohort
1974 1975 1976 I 9 7 7 1978
',; % % % %
21 24 30 34 20 22 14 15 9 I0
6 7 11 12 1l 12 10 11 "5 6
20 23 18 20 32 36 41 46 49 54
13 15 18 21) 21 23 23 26 25 28
1 1 0 13 • 0 0 /I 0 1 I
6 7 1 "1 1 1 0 0 0 0
20 23 I I 13 5 6 2 2 1 1
1974 Cohort
1975 •976 1977 1978
34 27 39 31 23 18 16 13
13 10 18 14 19 15 19 15
22 18 22 18 42 34 51 41
28 23 31 25 36 29 32 25
0 0 0 0 0 0 () 0
3 2 2 2 1 1 0 0
25 20 ' 12 10 4 3 7 fi
1975 Cohort
1976 1977 1978
;, % f~,
34 24 42 29 32 22
16 11 21 14 21 14
24 17 22 15 3.7 26
36 25 46 32 46 32
0 0 0 0 '0 0
5 3 4 3 0 0
28 20 10 7 9 6
1977
1976 Cohort CoUrt
1977 1978 1978
% % %
33 18 37 2O 33 16
32 17 39 21 27 13
3 6 19 48 26 29 14
46 25 47 25 53 2 6
1 0 1 0 0 0
4 2 1 0 10 5
36 19 14 8 49 2 4
Source: School Leaver Tracer Surveys 1979.
Figure 2
Unemployment profiles oJ cohorts of Form 5 school leavers in years 1974-1978
- 30%
1977 cohort
.,%
1974 1975 1976 1977 1978
20%
10%
Percentage
of cohort
unemployed
Year of unemployment
Source: School Leaver Tracer Surveys 1979.
35
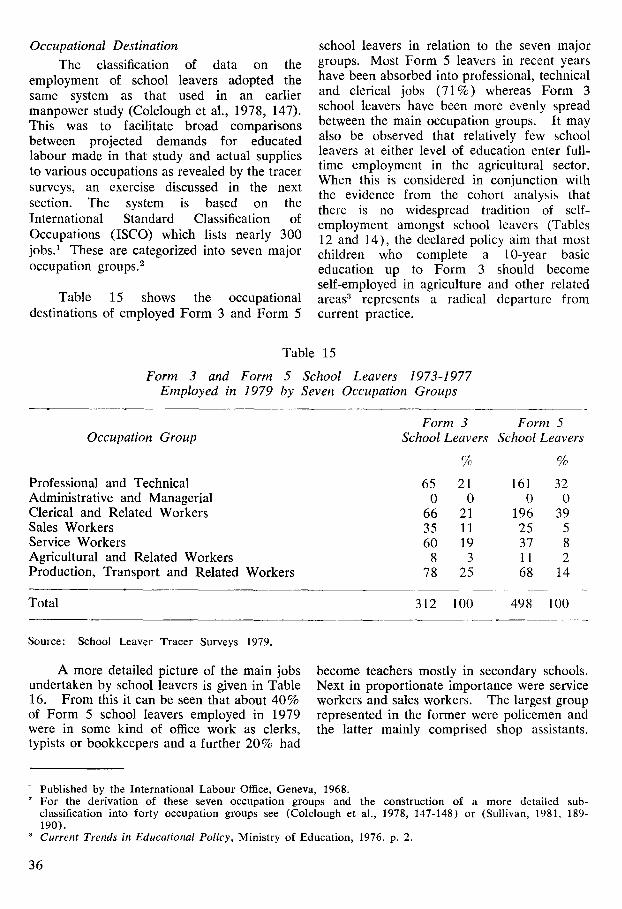
Occupational Destination
The classification of data on the employment of school leavers adopted the same system as that used in an earlier manpower study (Colclough et al., 1978, 147). This was to facilitate broad comparisons between projected demands for educated labour made in that study and actual supplies to various occupations as revealed by the tracer surveys, an exercise discussed in the next section. The system is based on the International Standard Classification of Occupations (ISCO) which lists nearly 300 jobs? These are categorized into seven major occupation groups. 2
Table 15 shows the occupational destinations of employed Form 3 and Form 5
school leavers in relation to the seven major groups. Most Form 5 leavers in recent years have been absorbed into professional, technical and clerical jobs (71%) whereas Form 3 school leavers have been more evenly spread between the main occupation groups. It may also be observed that relatively few school leavers at either level of education enter full- time employment in the agricultural sector. When this is considered in conjunction with the evidence from the cohort analysis that there is no widespread tradition of self- employment amongst school leavers (Tables 12 and 14), the declared policy aim that most children who complete a 10-year basic education up to Form 3 should become self-employed in agriculture and other related areas 3 represents a radical departure from current practice.
Table 15
Form 3 and Form 5 School Leavers 1973-1977 Employed in 1979 by Seven Occupation Groups
Occupation Group
Professional and Technical Administrative and Managerial Clerical and Related Workers Sales Workers Service Workers Agricultural and Related Workers Production, Transport and Related Workers
Form 3 Form 5 School Leave~ School Leave~
% %
65 21 161 32 0 0 0 0
66 21 196 39 35 11 25 5 60 19 37 8
8 3 11 2 78 25 68 14
Total 312 100 498 100
Source: School Leaver Tracer Surveys 1979.
A more detailed picture of the main jobs undertaken by school leavers is given in Table 16. From this it can be seen that about 40% of Form 5 school leavers employed in 1979 were in some kind of office work as clerks, typists or bookkeepers and a further 20% had
become teachers mostly in secondary schools. Next in proportionate importance were service workers and sales workers. The largest group represented in the former were policemen and the latter mainly comprised shop assistants.
1 Published by the International Labour Office, Geneva, 1968. For the derivation of these seven occupation groups and the construction of a more detailed sub- classification into forty occupation groups see (Colclough et al., 1978, 147-148) or (Sullivan, 1981, 189- 190). Current Trends in Educational Policy, Ministry of Education, 1976, p. 2.
36
Of the Form 3 school leavers employed in 1979 about 20% were clerks, typists or bookkeepers. Service workers accounted for the next largest occupational category at 19%. Within this category housewives and other
unpaid dependants 1 and policemen had the largest numbers. A further 14% were teachers mostly in primary schools and sizeable numbers had become shop assistants or worked in the mechanical trades.
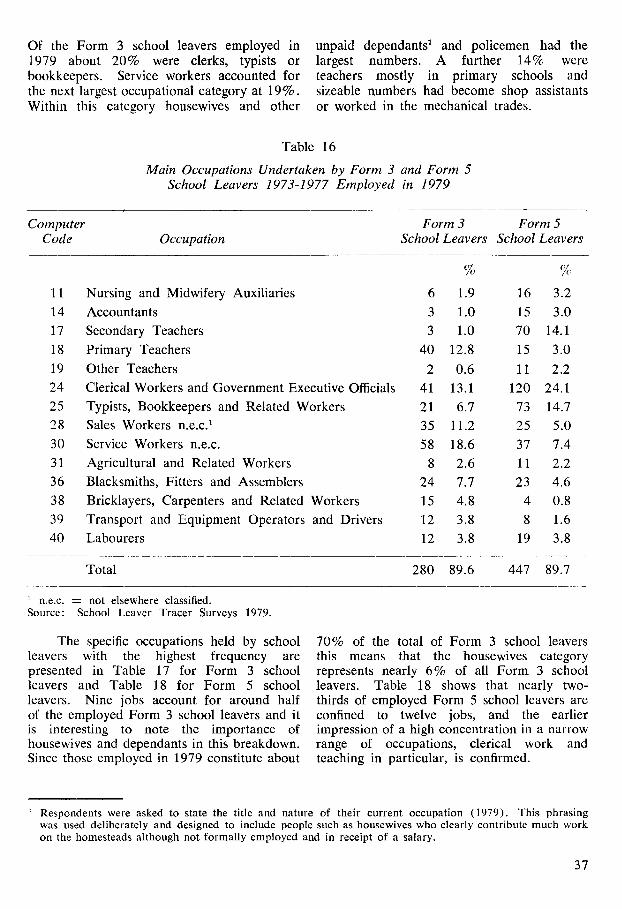
Table 16
Main Occupations Undertaken by Form 3 and Form 5 School Leavers 1973-1977 Employed in 1979
Computer Code Occupation
Form 3 Form 5 School Leavers School Leavers
% %
11 Nursing and Midwifery Auxiliaries 6 1.9 16 3.2
14 Accountants 3 1.0 15 3.0
17 Secondary Teachers 3 1.0 70 14.1
18 Primary Teachers 40 12.8 15 3.0
19 Other Teachers 2 0.6 11 2.2
24 Clerical Workers and Government Executive Officials 41 13.1 120 24.1
25 Typists, Bookkeepers and Related Workers 21 6.7 73 14.7
28 Sales Workers n.e.c. 1 35 11.2 25 5.0
30 Service Workers n.e.c. 58 18.6 37 7.4
31 Agricultural and Related Workers 8 2.6 11 2.2
36 Blacksmiths, Fitters and Assemblers 24 7.7 23 4.6
38 Bricklayers, Carpenters and Related Workers 15 4.8 4 0.8
39 Transport and Equipment Operators and Drivers 12 3.8 8 1.6
40 Labourers 12 3.8 19 3.8
Total 280 89.6 447 89.7
n . e . c . = not elsewhere classified. Source: School Leaver Tracer Surveys 1979.
The specific occupations held by school leavers with the highest frequency are presented in Table 17 for Form 3 school leavers and Table 18 for Form 5 school leavers. Nine jobs account for around half of the employed Form 3 school leavers and it is interesting to note the importance of housewives and dependants in this breakdown. Since those employed in 1979 constitute about
70% of the total of Form 3 school leavers this means that the housewives category represents nearly 6% of all Form 3 school leavers. Table 18 shows that nearly two- thirds of employed Form 5 school leavers are confined to twelve jobs, and the earlier impression of a high concentration in a narrow range of occupations, clerical work and teaching in particular, is confirmed.
1 Respondents were asked to state the title and nature of their current occupation (1979). This phrasing was used deliberately and designed to include people such as housewives who clearly contribute much work on the homesteads although not formally employed and in receipt of a salary.
37
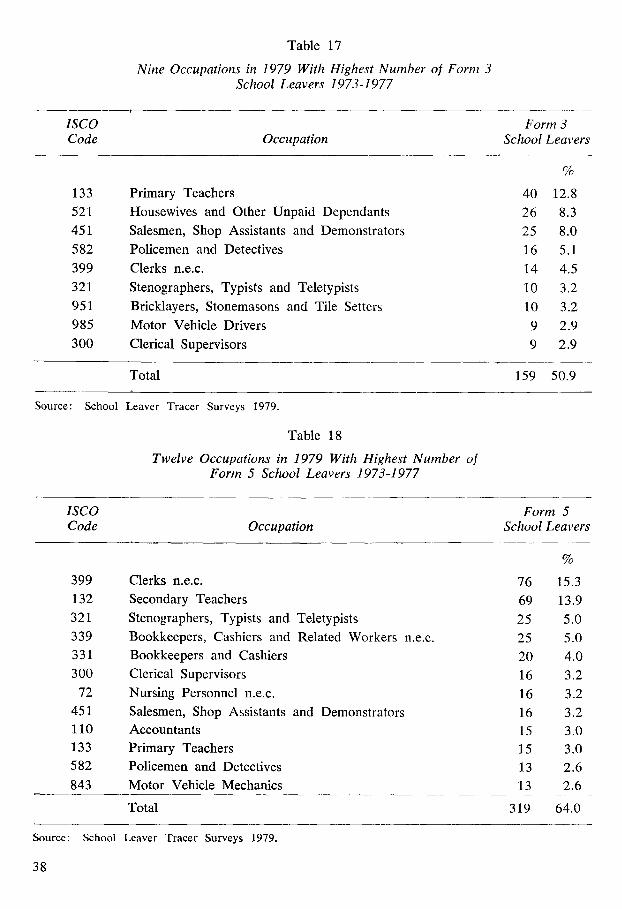
Table 17
Nine Occupations in 1979 With Highest Number of Form 3 School Leavers 1973-1977
ISCO Form 3 Code Occupation School Leavers
%
133 Primary Teachers 40 12.8
521 Housewives and Other Unpaid Dependants 26 8.3
451 Salesmen, Shop Assistants and Demonstrators 25 8.0
582 Policemen and Detectives 16 5.1
399 Clerks n.e.c. 14 4.5
321 Stenographers, Typists and Teletypists 10 3.2
951 Bricklayers, Stonemasons and Tile Setters 10 3.2
985 Motor Vehicle Drivers 9 2.9
300 Clerical Supervisors 9 2.9
Total 159 50.9
Source: School Leaver Tracer Surveys 1979.
Table 18
Twelve Occupations in 1979 With Highest Number of Form 5 School Leavers 1973-1977
ISCO Form 5 Code Occupation School Leavers
%
399 Clerks n.e.c. 76 15.3
132 Secondary Teachers 69 13.9
321 Stenographers, Typists and Teletypists 25 5.0
339 Bookkeepers, Cashiers and Related Workers n.e.c. 25 5.0
331 Bookkeepers and Cashiers 20 4.0
300 Clerical Supervisors 16 3.2
72 Nursing Personnel n.e.c. 16 3.2
451 Salesmen, Shop Assistants and Demonstrators 16 3.2
110 Accountants 15 3.0
133 Primary Teachers 15 3.0
582 Policemen and Detectives 13 2.6
843 Motor Vehicle Mechanics 13 2.6
Total 319 64.0
Source: School Leaver Tracer Surveys 1979.
38
Of the main variables influencing school leavers' occupational destinations sex and school district were significantly associated with the seven major occupational groups entered by Form 3 school leavers. Girls were more highly represented in the Professional and Technical, Sales Workers and Service Workers categories than might be expected and boys in the Production, Transport and Related Workers category.
There was some evidence that those with a Group 3 JC examination performance, as might be expected, were under-represented in the Professional and Technical category and that examination Group 1 leavers were less likely to become Sales Workers. For Form 5 leavers sex and examination group were significant variables associated with the seven major occupation groups. Girls entered the Professional and Technical and Clerical Workers categories in higher proportions than might be expected and boys the Production, Transport and Related Workers category. Leavers in examination Groups 1 and 2 featured more strongly in the Professional and Technical occupations and Group 3 leavers were more prominent in the Production, Transport and Related Workers category.
Manpower Projections Reviewed There is a difficult underlying question
which needs to be raised concerning the
structure of the marginal additions to the skilled labour force coming from secondary school leavers over the five-year period 1973-1977. How far is the balance of jobs it portrays in line with the development needs of Swaziland in the 1980s? Some clues to this problem may be deduced by comparing the proportions of school leavers entering various occupations suggested by the tracer surveys with the projected demands for skilled and educated workers in 1982/83 made in the manpower report (Colclough et al., 1978, 22, 84-85).
The procedure adopted for these comparisons is to take the proportions of school leavers entering the seven major occupation groups (Table 15) and apply them to the increment in total employment projected for a particular level of education between 1977 and 1982/83 and see how the occupational breakdown compares with demand projections. In effect this is to assume that the pattern of employment of the 1973-1977 school leavers depicted by the tracer project in 1979 typifies that for the five-year projection period 1977-1982/83 and therefore offers a glimpse of whether structural changes in the skilled labour market are, at the margin, moving towards or away from the position implied in the demand projections. Tables 19 and 20 show the outcomes for Form 3 and Form 5 school leavers respectively.
39
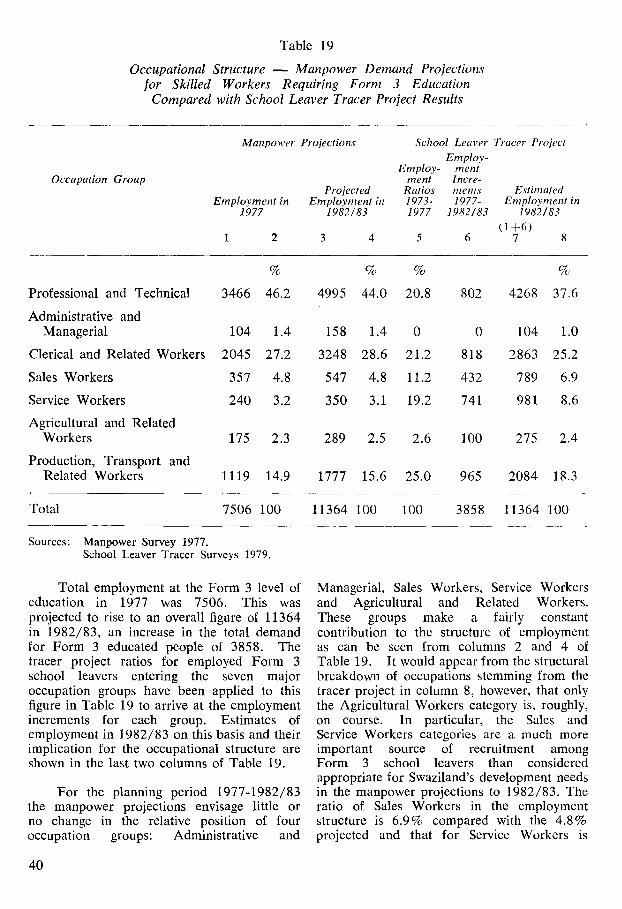
Table 19
Occupational Structure ~ Manpower Demand Projections 1or Skilled Workers Requiring Form 3 Education
Compared with School Leaver Tracer Project Results
Occupation Group
Manpower Projections School Leaver Tracer Project Employ-
Employ- ment ment 1here-
Projected Ratios ments Estimated Employment in Employment in 1973- 1977- Employment in
1977 1982/83 1977 1982/83 1982/83 (1-}-6)
1 2 3 4 5 6 7 8
% % % %
Professional and Technical 3466 46.2 4995 44.0 20.8 802 4268 37.6
Administrative and Managerial 104 1.4 158 1.4 0 0 104 1.0
Clerical and Related Workers 2045 27.2 3248 28.6 21.2 818 2863 25.2
Sales Workers 357 4.8 547 4.8 11.2 432 789 6.9
Service Workers 240 3.2 350 3.1 19.2 741 981 8.6
Agricultural and Related Workers 175 2.3 289 2.5 2.6 100 275 2.4
Production, Transport and Related Workers 1119 14.9 1777 15.6 25.0 965 2084 18.3
Total 7506 100 11364 100 100 3858 11364 100
Sources: Manpower Survey 1977. School Leaver Tracer Surveys 1979.
Total employment at the Form 3 level of education in 1977 was 7506. This was projected to rise to an overall figure of 11364 in 1982/83, an increase in the total demand for Form 3 educated people of 3858. The tracer project ratios for employed Form 3 school leavers entering the seven major occupation groups have been applied to this figure in Table 19 to arrive at the employment increments for each group. Estimates of employment in 1982/83 on this basis and their implication for the occupational structure are shown in the last two columns of Table 19.
For the planning period 1977-1982/83 the manpower projections envisage little or no change in the relative position of four occupation groups: Administrative and
40
Managerial, Sales Workers, Service Workers and Agricultural and Related Workers. These groups make a fairly constant contribution to the structure of employment as can be seen from columns 2 and 4 of Table 19. It would appear from the structural breakdown of occupations stemming from the tracer project in column 8, however, that only the Agricultural Workers category is, roughly, on course. In particular, the Sales and Service Workers categories are a much more important source of recruitment among Form 3 school leavers than considered appropriate for Swaziland's development needs in the manpower projections to 1982/83. The ratio of Sales Workers in the employment structure is 6.9% compared with the 4.8% projected and that for Service Workers is
8.6% instead of 3.1% 2 . The bulk of the requirements for these iobs in the manpower study are intended to be met from among Primary School Standard 5 and Secondary School Form 1 educated young people. Whilst it is not possible to be too clinical with respect to actual figures, the relative magnitudes involved certainly seem to suggest that Form 3 school leavers are entering occupations which until recently were thought to be the preserve of youngsters with less than a Form 3 level of education.
Little can be said about the Administra- tive and Managerial group since understandably no Form 3 school leavers reported being in such occupations. Presumably, promotions in other groups will shift workers into this occupational category and thus contribute to sustaining the group's relative position in the structure. This point also applies with respect to Form 5 leavers discussed subsequently.
For the remaining three occupation groups the manpower projections imply a
diminution in the relative size of the Professional and Technical group and increases in the relative positions of the Clerical Workers and Production and Transport Workers. The tracer project findings agree with the direction of change in two cases but with greater emphasis. Thus it appears that Form 3 recruitment into Professional and Technical jobs will slow down relatively but reduce this group's position in the employment structure to 37.6%, much less than the 44% projected. Similarly, Production and Transport Workers would make up 18.3% of total employment in 1982/83 as opposed to the 15.6% projected. In the case of the Clerical and Related Workers group, whereas the manpower projections predict an increase in this group's relative structural size the tracer survey results suggest that what is actually occurring is a relative fall towards 25.2%. The most likely explanation of this phenomenon is that Form 5 leavers are entering clerical-type jobs in greater number than anticipated in the demand projections, a point referred to later.
1 Even when an adjustment for the special group of 'Housewives and Other Unpaid Dependants' is made to allow for the fact that this group is not covered by the manpower projections but is included under 'Service Workers' in the tracer project, the relative size of the Service Workers group is still twice that implied by the manpower, projections.
41
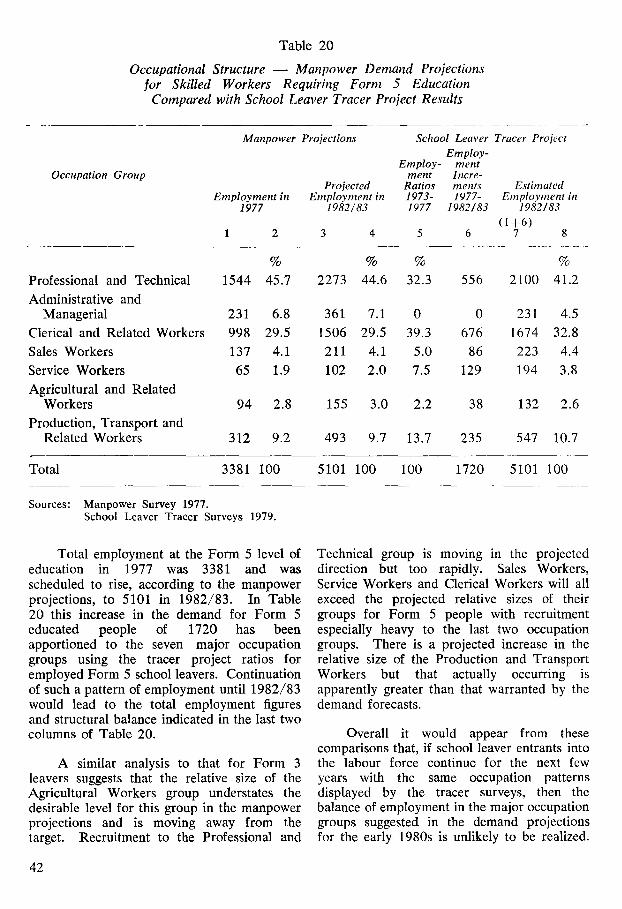
Table 20
Occupational Structure m Manpower Demand Projections ]or Skilled Workers Requiring Form 5 Education
Compared with School Leaver Tracer Project Results
Occupation Group
Manpower Projections School Leaver Tracer Project Employ-
Employ- ment
Projected Ratios Employment in Employment in 1973-
1977 1982/83 1977
1 2 3 4 5
ment Incre- ments Estimated 1977- Employment in
1982/83 1982/83 (1+6)
6 7 8
% % % %
Professional and Technical 1544 45.7 2273 44.6 32.3 556 2100 41.2
Administrative and Managerial 231 6.8 361 7.1 0 0 231 4.5
Clerical and Related Workers 998 29.5 1506 29.5 39.3 676 1674 32.8
Sales Workers 137 4.1 211 4.1 5.0 86 223 4.4
Service Workers 65 1.9 102 2.0 7.5 129 194 3.8
Agricultural and Related Workers 94 2.8 155 3.0 2.2 38 132 2.6
Production, Transport and Related Workers 312 9.2 493 9.7 13.7 235 547 10.7
Tot~ 3381 100 5101 100 100 1720 5101 100
Sources: Manpower Survey 1977. School Leaver Tracer Surveys 1979.
Total employment at the Form 5 level of education in 1977 was 3381 and was scheduled to rise, according to the manpower projections, to 5101 in 1982/83. In Table 20 this increase in the demand for Form 5 educated people of 1720 has been apportioned to the seven major occupation groups using the tracer project ratios for employed Form 5 school leavers. Continuation of such a pattern of employment until 1982/83 would lead to the total employment figures and structural balance indicated in the last two columns of Table 20.
A similar analysis to that for Form 3 leavers suggests that the relative size of the Agricultural Workers group understates the desirable level for this group in the manpower projections and is moving away from the target. Recruitment to the Professional and
Technical group is moving in the projected direction but too rapidly. Sales Workers, Service Workers and Clerical Workers will all exceed the projected relative sizes of their groups for Form 5 people with recruitment especially heavy to the last two occupation groups. There is a projected increase in the relative size of the Production and Transport Workers but that actually occurring is apparently greater than that warranted by the demand forecasts.
Overall it would appear from these comparisons that, if school leaver entrants into the labour force continue for the next fcw years with the same occupation patterns displayed by the tracer surveys, then the balance of employment in the major occupation groups suggested in the demand projections for the early 1980s is unlikely to be realized.
42
Most noticeably what seems to be happening to the occupation structure of skilled and educated workers is that under-recruitment of Form 3 leavers into clerical jobs is partially as a result of a displacement by Form 5 leavers. This implies that the "price" of clerical work in terms of educational qualifications has increased with the COSC examination tending to supplant the JC examination as the minimum qualification. In service jobs both groups of leavers are becoming over-represented in the sense that the demand requirements indicate a 50% increase over the planning period 1977-1982/ 83, whereas the picture presented by the tracer project puts the increase around 300%. Since these jobs offer the lowest average earnings of the seven occupation groups, it is unlikely that educated school leavers would enter them,
unless they could not find work elsewhere. It is probable therefore that this is another example of a "trading up" of the price of jobs in terms of qualifications and that Form 3 leavers are displacing the traditional recruits to service sector jobs, youngsters who leave the education system at an earlier stage than Form 3. The same syndrome to a lesser extent applies to the Sales Workers and Production and Transport Workers groups which are also absorbing school leavers at both levels at a faster rate than considered desirable in the manpower projections. Lastly, Form 3 and Form 5 leavers are not entering the Professional and Technical fields in the proportions necessary to match the projected manpower requirements, a further reflection in particular of the shortage of recruits into technical occupations.
References
Blaug, Mark, 1970, An Introduction to the Economics of Education, London, Penguin Books.
Colclough, Christopher, and Wingfield Digby, Peter, 1978, Skills for the Future - - Education and Manpower Perspectives in Swaziland, Mbabane, Ministry of Finance and Economic Planning, Swaziland Government.
Jolly, Richard, 1969, Planning Education for African Development - - Economic and Man- power Perspectives, Nairobi, East African Publishing House.
Sullivan, Gerard, 1981, From School to W o r k - - Report on the School Leaver Tracer Project, Mbabane, Ministry of Education, Swaziland Government, and Oxford, Cotswold Press Ltd.
Swaziland Government, 1976, Current Trends in Educational Policy, Mbabane, Ministry of Education.
Williams, Peter, 1976, "After School in the Third World" in Peter Williams (ed.), The School Leaver in Developing Countries, Report of a Workshop held in March 1974, London, University of London Institute of Education.
43