Secondary Outcomes
42
Secondary Outcomes Main Results ADVANCE
-
Upload
tyler-hill -
Category
Documents
-
view
23 -
download
0
description
ADVANCE. Main Results. Secondary Outcomes. All-cause mortality. 25. Standard Intensive. 20. Relative risk reduction 7%: 95% CI -6 to 17% P =0.28. 15. Cumulative incidence (%). 10. 5. 0. 0. 6. 18. 24. 30. 36. 12. 42. 48. 54. 60. 66. Follow-up (months). Death. - PowerPoint PPT Presentation
Transcript of Secondary Outcomes

Secondary Outcomes
Main Results
ADVANCE
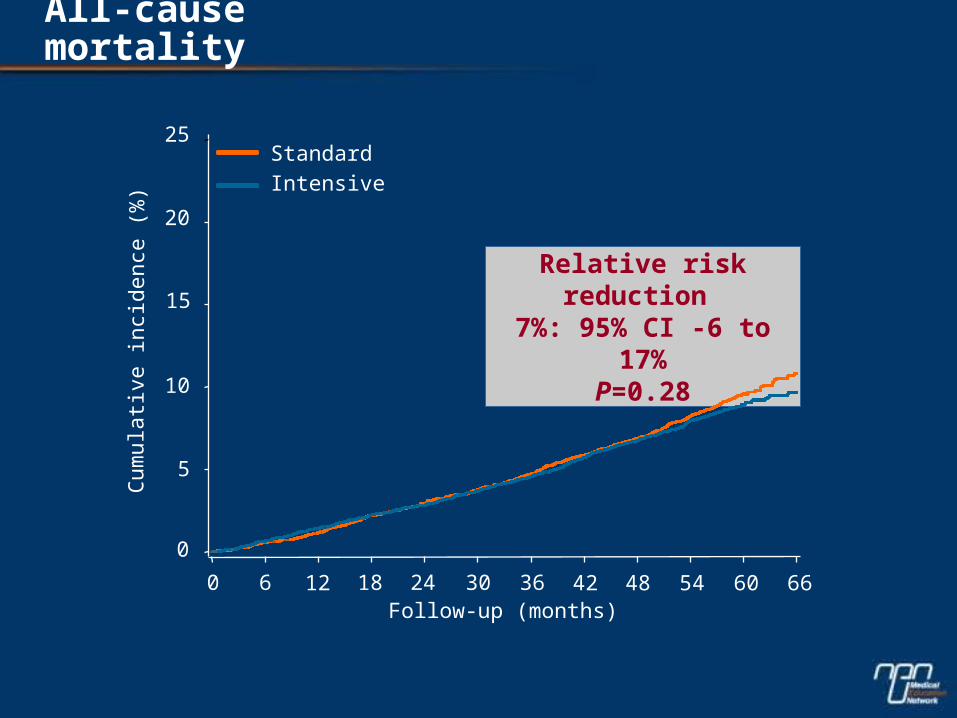
All-cause mortality
Relative risk reduction 7%: 95% CI -6 to 17%
P=0.28
Follow-up (months)
Cum
ulat
i ve
i nci
denc
e (%
)25
20
10
5
0
Standard
Intensive
0 6 12 18 24 30 36 42 48 54 60 66
15

Death
Cardiovascular death 253 289 12% (-4 to 26)
All deaths 498 533 7% (-6 to 17)
Non-cardiovascular death 245 244 0% (-20 to 16)
Number of patients with event
Intensive Standard
(n=5,571) (n=5,569)
Relative risk
reduction (95%CI)
Favors
Intensive
Favors
Standard
Hazard ratio
0.5 1.0 2.0

Coronary and cerebrovascular events
Major cerebrovascular events‡ 238 246 3% (-16 to 19)
Total cerebrovascular events 352 327 -8% (-26 to 7)
Major coronary events† 310 337 8% (-7 to 21)
Total coronary events 560 572 2% (-10 to 13)
Number of patients with eventIntensive Standard(n=5,571) (n=5,569)
Relative riskreduction (95% CI)
FavorsIntensive
FavorsStandard
Hazard ratio
0.5 1.0 2.0
†Non-fatal MI or death from coronary heart disease
‡Non-fatal stroke or death from cerebrovascular disease

Renal events
New or worsening nephropathy 230 292 21% (7 to 34)
New microalbuminuria 1318 1434 9% (2 to 15) ‡
Total renal events 1498 1669 11% (5 to 17)
Number of patients with eventIntensive Standard(n=5,571) (n=5,569)
Relative riskreduction (95% CI)
FavorsIntensive
FavorsStandard
Hazard ratio
0.5 1.0 2.0
†P<0.001
‡P=0.02
***P=0.006
†
***

Nephropathy
New or worsening nephropathy 230 292 21% (7 to 34)†
Macroalbuminuria 162 231 30% (15 to 43)‡
End-stage renal disease 23 36 36% (-8 to 62)
Doubling of serum creatinine* 69 60 -15% (-63 to 18)
Number of patients with eventIntensive Standard(n=5,571) (n=5,569)
Relative riskreduction (95% CI)
FavorsIntensive
FavorsStandard
Hazard ratio
0.5 1.0 2.0
*to at least 200 μmol/L (2.3 mg/dL)†P=0.006
‡P<0.001

Eye events
New or worsening retinopathy 332 349 5% (-10 to 18)
Visual deterioration 3033 3015 0% (-5 to 5)
Total eye events 3105 3094 0% (-5 to 5)
Number of patients with eventIntensive Standard(n=5,571) (n=5,569)
Relative riskreduction (95% CI)
FavorsIntensive
FavorsStandard
Hazard ratio
0.5 1.0 2.0

Heart failure, PVD and neuropathy
All heart failure 220 231 5% (-14 to 21)
All peripheral vascular disease 343 366 6% (-9 to 19)
New or worsening neuropathy 2353 2311 -4% (-10 to 2)
Number (%) of patients with eventIntensive Standard(n=5,571) (n=5,569)
Relative riskreduction (95% CI)
FavorsIntensive
FavorsStandard
Hazard ratio
0.5 1.0 2.0

Cognitive function and dementia
Cognitive decline 895 911 2% (-7 to 11)
Dementia 61 48 -27% (-86 to 13)
Number of patients with event
Intensive Standard
(n=5,571) (n=5,569)
Relative risk
reduction (95% CI)
Favors
Intensive
Favors
Standard
Hazard ratio
0.5 1.0 2.0

Effects in Patient Subgroups
ADVANCE

Effects by age, sex, SBP & glucose controlCombined primary end point
Age (years)
< 65 367 421 14% (1 to 25)
65 642 695 8% (-3 to 17)
Sex
Male 635 705 10% (0 to 19)
Female 374 411 10% (-3 to 22)
SBP (mmHg)
< 140 368 404 9% (-4 to 21)
140 641 712 11% (1 to 20)
HbA1c (%)
< 7.2 387 430 10% (-3 to 22)
7.2 620 682 10% (0 to 20)
Fasting blood glucose (mmol/L)
< 7.9 (142 mg/dL) 414 472 13% (0 to 23)
7.9 (142 mg/dL) 595 643 8% (-2 to 18)
All participants 1009 1116 10% (2 to 18)
Number of patients with eventIntensive Standard(n=5,571) (n=5,569)
Relative riskreduction (95% CI)
FavorsIntensive
FavorsStandard
Hazard ratio
0.5 1.0 2.0
Phomogeneity all >0.1

Effects by disease history & ancillary treatmentCombined primary end point
Phomogeneity all >0.1
History of macrovascular disease
No 591 678 14% (4 to 23)
Yes 418 438 4% (-10 to 16)
History of microvascular disease
No 799 892 11% (2 to 19)
Yes 210 224 4% (-16 to 21)
Treatment with any BP lowering drugs
No 199 222 11% (-7 to 27)
Yes 810 894 10% (1 to 18)
Treatment with ACE inhibitors
No 495 537 14% (3 to 24)
Yes 514 579 5% (-7 to 16)
Treatment with statins
No 746 815 10% (1 to 19)
Yes 263 301 10% (-6 to 24)
Treatment with anti-platelet drugs
No 485 541 9% (-2 to 20)
Yes 524 575 11% (0 to 21)
All participants 1009 1116 10% (2 to 18)
Number of patients with eventIntensive Standard(n=5,571) (n=5,569)
Relative riskreduction (95% CI)
FavorsIntensive
FavorsStandard
Hazard ratio
0.5 1.0 2.0

Effects by age, sex, SBP and glucose controlCardiovascular death
Age (years) < 65 63 64 2% (-39 to 31) 65 190 225 15% (-3 to 30)Sex
Male 172 197 12% (-8 to 28) Female 81 92 12% (-18 to 35)
SBP (mmHg) < 140 82 112 27% (3 to 45) 140 171 177 3% (-19 to 22)HbA1c (%)
< 7.2 90 110 18% (-8 to 38) 7.2 161 178 10% (-12 to 27)Fasting blood glucose (mmol/L)
< 7.9 (142 mg/dL) 110 137 20% (-3 to 38) 7.9 (142 mg/dL) 143 152 6% (-18 to 25)
All participants 253 289 12% (-4 to 26)
Number of patients with eventIntensive Standard(n=5,571) (n=5,569)
Relative riskreduction (95% CI)
FavorsIntensive
FavorsStandard
Hazard ratio0.5 1.0 2.0
Phomogeneity all >0.1

Effects by age, sex, SBP and glucose controlAll cause mortality
Age (years) < 65 111 119 7% (-20 to 28) 65 387 414 6% (-8 to 18)
Sex Male 350 360 2% (-13 to 16) Female 148 173 15% (-6 to 32)
SBP (mmHg) < 140 168 203 17% (-1 to 33) 140 330 330 -0% (-17 to 14)
HbA1c (%) < 7.2 206 214 3% (-17 to 20) 7.2 289 317 9% (-7 to 22)Fasting blood glucose (mmol/L)
< 7.9 (142 mg/dL) 225 263 15% (-2 to 28) 7.9 (142 mg/dL) 272 270 0% (-19 to 15)
All participants 498 533 7% (-6 to 17)
Number (%) of patients with eventIntensive Standard(n=5,571) (n=5,569)
Relative riskreduction (95% CI)
FavorsIntensive
FavorsStandard
Hazard ratio0.5 1.0 2.0
Phomogeneity all >0.1

Subgroup effects
No evidence of different effects in patient subgroups for the combined primary outcome, cardiovascular death or total mortality

Other risk factors and concomitant treatments
Main Results
ADVANCE

Other risk factors levelsAt end of follow-up
Parameter Randomized treatment
Intensive (n=5571)
Standard (n=5569)
Systolic BP (mmHg) 135.5 137.9
Diastolic BP (mmHg) 73.5 74.3
Body mass index (kg/m2) 28 28
LDL chol. (mmol/L [mg/dL]) 2.64 [102] 2.65 [102]
HDL chol. (mmol/L [mg/dL]) 1.24 [48] 1.25 [48]
Triglycerides (mmol/L [mg/dL]) 1.70 [151] 1.82 [161]
Current smoking (%) 8 8

Ancillary drug therapyAt end of follow-up
Randomized treatment
Intensive (n=5571)
Standard (n=5569)
Any BP lowering drug 89% 88%
Statin 46% 48%
Other lipid modifying drug 7% 7%
Aspirin 57% 55%
Other antiplatelet drugs 7% 6%

Summary – effects on main efficacy outcomes
Intensive glucose control resulted in:
10% reduction in combined primary outcome 14% reduction in microvascular events 21% reduction in nephropathy No significant effects on macrovascular events No significant effects on all-cause or cardiovascular
mortality Consistent treatment effects in patient subgroups

Hypoglycemia
ADVANCE

Definition
A blood glucose level <2.8 mmol/L (50mg/dL) and/or an episode with typical symptoms and signs of hypoglycemia, without other apparent cause
SEVERE where an individual had transient central nervous system dysfunction and was unable to treat him/herself (required help from another person)
MINOR where the individual was able to treat him/herself

Occurrence of hypoglycemia
Number of patients
with event
Total number of
events
Rate per 100 patient
years
Severe hypoglycemia 231 298 0.56
Minor hypoglycemia 4432 56,239 105
Any hypoglycemia 4524 56,537 106

Any hypoglycemia 2654 1870 42% (36 to 49)
Severe hypoglycemia 150 81 85% (42 to 142)
Minor hypoglycemia 2598 1834 42% (35 to 48)
Number of patients with event
Intensive Standard(n=5,571) (n=5,569)
Relativeincrease (95% CI)
Effects of treatment on hypoglycemiaHazard ratios
All P<0.001
Standardworse
Intensiveworse
Risk ratio
0.5 1.0 2.0
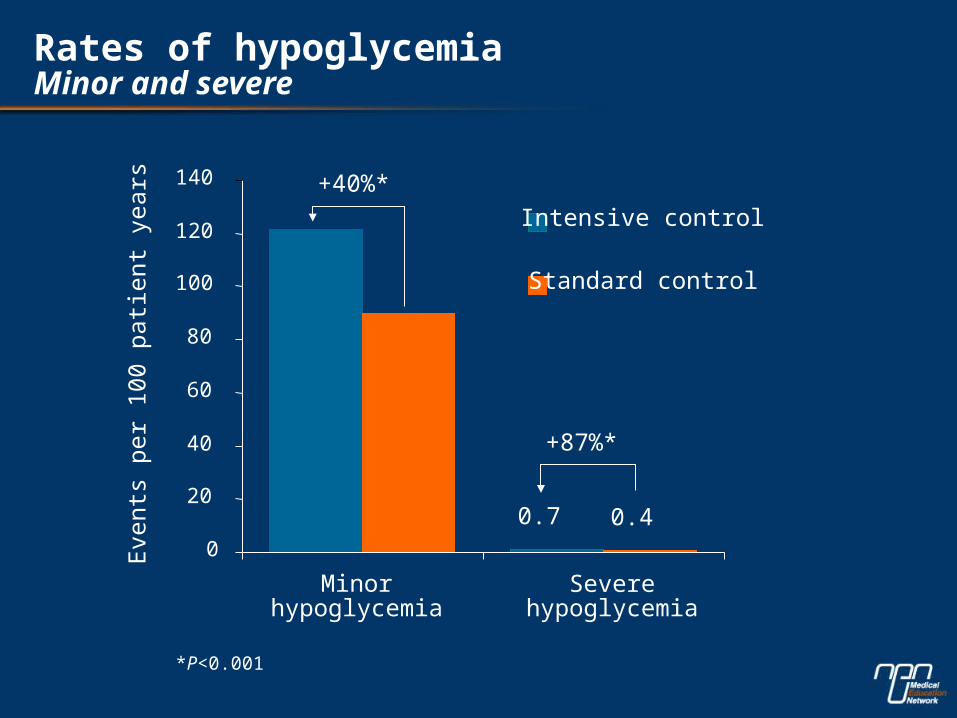
Rates of hypoglycemiaMinor and severe
*P<0.001
0.7 0.40
20
40
60
80
100
120
140
Minor hypoglycemia Severe hypoglycemia
Eve
nts
per
100
patie
nt y
ears Intensive control
Standard control
+87%*
+40%*

Comparative rates of severe hypoglycemia
Pro
port
ion
of p
atie
nts
with
at l
eas
t o
ne e
ven
t eac
h y
ear
0.0%
0.4%
0.8%
1.2%
1.6%
2.0%
UKPDS ADVANCE
Intensive control
Standard control

Fatal or disabling sequelae of severe hypoglycemia
One fatal episode in the standard control group
One episode leading to permanent disability in each of the standard and intensive groups
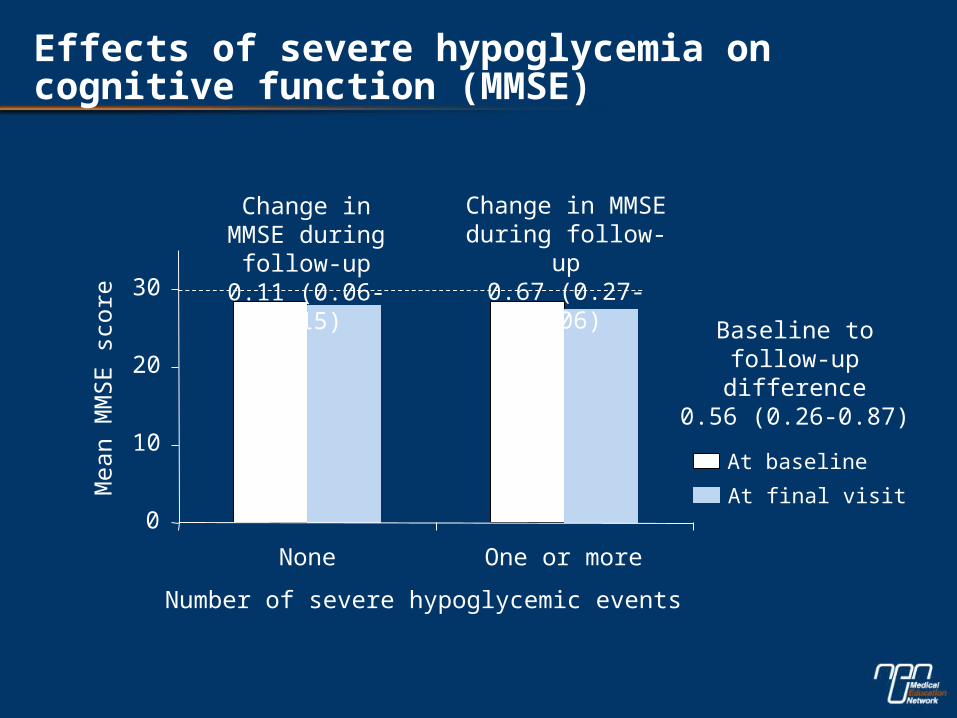
Effects of severe hypoglycemia on cognitive function (MMSE)
0
10
20
30
None One or more
Number of severe hypoglycemic events
Mea
n M
MS
E s
core
At baseline
At final visit
Change in MMSE during follow-up0.11 (0.06-0.15)
Change in MMSE during follow-up0.67 (0.27-1.06)
Baseline to follow-up difference
0.56 (0.26-0.87)

Summary - hypoglycemia
Intensive glucose control increased the risk of severe hypoglycemia
Rates of severe hypoglycemia were low No significant long-term sequelae were identified More than half of patients reported neither minor or
severe hypoglycemia

Body Weight
ADVANCE

Difference in body weight
Difference 0.75kg (0.56, 0.94) 1.65lbs (1.23, 2.07), P<0.0001
Standard
Intensive
Wei
ght
(kg)
75
76
77
78
79
80
Follow-up (months)
0 6 12 18 24 30 36 42 48 54 60

Impact of ethnicity
Asian
Mean baseline weight = 67kg (145lbs) Mean weight difference = 0.44kg (0.97lbs) 0.7% of baseline weight
Non-Asian Mean baseline weight = 85kg (187lbs) Mean weight difference = 0.96kg (2.1lbs) 1.1% of baseline weight

Impact of follow-up duration
UKPDS Weight gain about 3.1kg (6.8lbs) Mostly in first few years after diagnosis Follow-up 10 years
ADVANCE No weight gain Weight difference 0.75kg (1.65lbs) Follow-up 5 years Weight difference projected to 10 years = 1.8kg
(4.0lbs)

Summary - weight
No weight gain in ADVANCE
Weight difference between randomized groups less in ADVANCE than UKPDS
Difference likely explained in part at least by ethnicity, stage of disease and duration of follow-up

Balance of risk and benefits
Five years treatment
Prevents one vascular event among every 52 patients (mostly renal events)
Causes one severe hypoglycemic event among every 81 patients

ADVANCE in the context of other studies
ADVANCE

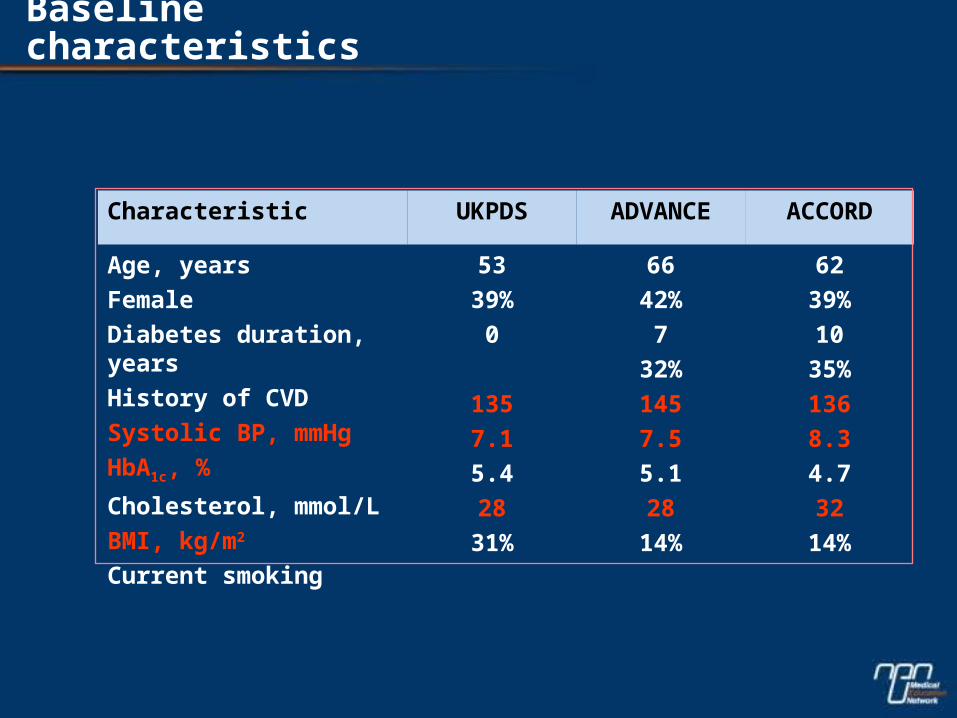
Baseline characteristics
Characteristic UKPDS glucose study
ADVANCE ACCORD
Age, years
Female
Diabetes duration, years
History of CVD
Systolic BP, mmHg
HbA1c, %
Cholesterol, mmol/L
BMI, kg/m2
Current smoking
53
39%
0
135
7.1*
5.4
28
31%
66
42%
7
32%
145
7.5
5.1
28
14%
62
39%
10
35%
136
8.3
4.7
32
14%
* Calculated HbA1c

Treatments at baseline
Characteristic UKPDS glucose study
ADVANCE ACCORD
Sulfonylureas
Metformin
Insulin
Aspirin
Statins
BP lowering drug
0%
0%
0%
2%
0%
13%
72%
61%
1%
44%
28%
75%
50%
60%
35%
54%
59%
85%

UKPDS
ACCORD

Event rates – all cause mortality
0.0
0.5
1.0
1.5
2.0
UKPDS ADVANCE ACCORD
An
nua
l inc
ide
nce
(%
)

Risk ratio (95% CI)
0.5 1 2
Combined
ADVANCE
UKPDS 0.94 (0.80, 1.10)
0.93(0.83, 1.06)
Favors intensive glucose control Favors standard glucose control
Hazard ratio (95% CI)
Mortality (meta-analysis)
0.93(0.85, 1.02)
1.22 (1.01, 1.46)ACCORD
P heterogeneity = 0.016

Baseline characteristics
Characteristic UKPDS ADVANCE ACCORD
Age, years
Female
Diabetes duration, years
History of CVD
Systolic BP, mmHg
HbA1c, %
Cholesterol, mmol/L
BMI, kg/m2
Current smoking
53
39%
0
135
7.1
5.4
28
31%
66
42%
7
32%
145
7.5
5.1
28
14%
62
39%
10
35%
136
8.3
4.7
32
14%
Baseline characteristics
Characteristic UKPDS ADVANCE ACCORD
Age, years
Female
Diabetes duration, years
History of CVD
Systolic BP, mmHg
HbA1c, %
Cholesterol, mmol/L
BMI, kg/m2
Current smoking
53
39%
0
135
7.1
5.4
28
31%
66
42%
7
32%
145
7.5
5.1
28
14%
62
39%
10
35%
136
8.3
4.7
32
14%