Secondary Compression of Clay Soils
112
Secondary Compression of Clay Soils Ali Hossien Basheer Garoushi Submitted to the Institute of Graduate Studies and Research in partial fulfillment of the requirement for the degree of Master of Science in Civil Engineering Eastern Mediterranean University September 2017 Gazimağusa, North Cyprus
Transcript of Secondary Compression of Clay Soils
Secondary Compression of Clay Soils
Ali Hossien Basheer Garoushi
Submitted to the
Institute of Graduate Studies and Research
in partial fulfillment of the requirement for the degree of
Master of Science
in
Civil Engineering
Eastern Mediterranean University
September 2017
Gazimağusa, North Cyprus
Approval of the Institute of Graduate Studies and Research
Assoc. Prof. Dr. Ali Hakan Ulusoy
Acting Director
I certify that this thesis satisfies the requirements as a thesis for the degree of Master
of Science in Civil Engineering.
Assoc. Prof. Dr. Serhan Şensoy
Chair, Department of Civil Engineering
We certify that we have read this thesis and that in our opinion it is fully adequate in
scope and quality as a thesis for the degree of Master of Science in Civil
Engineering.
Asst. Prof. Dr. Eriş Uygar
Supervisor
Examining Committee
1. Prof. Dr. Zalihe Sezai
2. Assoc. Prof. Dr. Huriye Bilsel
3. Asst. Prof. Dr. Eriş Uygar
iii
ABSTRACT
In this thesis, the behavior of secondary compression of a selected clay soil from
Famagusta is assessed by conducting series of one-dimensional consolidation tests
on samples prepared with various initial void ratios and water contents. The testing
program consists of standard oedometer tests (SOT) and long term creep tests (CT)
where the samples are subjected to preconsolidation stress prior to application of a
sustained effective stress for a period of seven days.
The analysis of the test results indicated that, the coefficient of secondary
compression for soft samples increases up to an effective stress of 50 kPa and then
gradually decreases and becomes approximately constant with increasing effective
stress. The coefficient of secondary compression for compacted samples is observed
to increase with increasing vertical effective stress up to an effective stress of
approximately 2.5 times preconsolidation stress, staying approximately constant with
respect to further increase in effective stress. For overconsolidated samples, the
coefficient of secondary compression increased with reduction in the degree of
overconsolidation. The rate of secondary compression decreased with log time for all
samples. The maximum value of the coefficient of secondary compression occurred
in the Log time range of 100 min to1000 min for all samples. A creep function,
previously proposed by (Yin, 1999) is applied on the measured creep curves, the
function indicated a good fit to the measured creep curves for all samples.
Keywords: Creep, Soft clay, Secondary compression, Standard oedometer test.
iv
ÖZ
Gazimağusa’da mevcut bir şişen kil’in ikincil oturma davranışı odömetre deneyleri
ile, değişik su muhtevası ve boşluk oranında hazırlanan deney numuneleri ile
çalışılmıştır. Deney programı, standart odömetre deneyleri ve uzun vadeli oturma
deneyleri (creep) içermektedir, bu deneylerde değişik efektif gerilmelerde ön
yüklemeli olarak hazırlanmış numunelere yedi güne kadar varan sürelerde sabit yük
uygulanmıştır.
Deney sonuçlarının analizi göstermiştir ki, yumuşak numuneler için ölçülen ikincil
oturma katsayısı 50kPa efektif gerilmeye kadar artmakta ve daha sonraki efektif
gerilme artışlarına göre azalarak yaklaşık sabit bir değere ulaşmaktadır. Sıkıştırma
uygulanmış numunelerde ikincil oturma katsayısı, efektif gerilme artarken, ön
gerilme değerinin yaklaşık iki buçuk katına kadar artmış, daha fazla efektif gerilme
artışı olduğunda ise yaklaşık olarak sabit kalmıştır. Ön gerilme uygulanmış
numunelerde ikincil oturma katsayısı, aşırı konsolidasyon olma derecesi düştükçe
artmıştır. Bütün numuneler için ikincil oturma zamanın logaritmasına göre
azalmıştır. Bütün numuneler için en yüksek ikincil oturma 100dak ile 1000dak
logaritma zaman aralığında elde edilmiştir. Daha önce Yin (1999) tarafından
önerilmiş bir ikincil oturma fonksiyonu ölçümler üzerinde denenmiş ve bunların
tümü ile iyi derecede bir uyum içerisinde olduğu gözlemlenmiştir.
Anahtar kelimeler: Ikincil oturma, Yumuşak kil, Standart odömetre deneyi.
v
ACKNOWLEDGMENT
I would like to thank Asst. Prof. Dr. Eriş Uygar for his continuous support and
guidance in the preparation of this study. Without his invaluable supervision, all my
efforts could have been short-sighted.
I owe quit a lot to my family who allowed me to travel all the way from Libya to
Cyprus and supported me all throughout my studies. I would like to dedicate this
study to them as an indication of their significance in this study as well as in my life.
My unlimited appreciation is toward the academic and non-academic staff of civil
engineering department, Eastern Mediterranean University, North Cyprus for their
patience, assistance, advice and encouragement. Also, my warm regards to any
lecturer who enlarged my academic knowledge. I also feel compelled to thank my
colleagues in North Cyprus and in Libya for encouraging me during my studies.
vi
TABLE OF CONTENTS
ABSTRACT ................................................................................................................ iii
ÖZ…… ....................................................................................................................... iv
ACKNOWLEDGMENT .............................................................................................. v
LIST OF TABLES ...................................................................................................... ix
LIST OF FIGURES ..................................................................................................... x
LIST OF SYMBOLS AND ABBREVATIONS ........................................................ xii
1 INTRODUCTION .................................................................................................... 1
1.1 Background ......................................................................................................... 1
1.2 Research Objectives ............................................................................................ 2
1.3 Aim of the Study ................................................................................................. 3
1.4 Research Limitation ............................................................................................ 3
1.5 Scope of Work..................................................................................................... 3
2 LITERATURE REVIEW.......................................................................................... 5
2.1 Introduction ......................................................................................................... 5
2.2 Compressibility Behavior of Clay Soils .............................................................. 5
2.2.1 One-dimensional Compression Curve ...................................................... 5
2.2.2 Compressibility Curve .............................................................................. 7
2.2.3 Secondary Compression ......................................................................... 10
2.3 Coefficient of Secondary Compression (Cα) and Vertical Effective Stress ..... 14
2.4 Variation of the Coefficient of Secondary Compression with Time................. 18
2.5 Summarized Critical Review ............................................................................ 22
3 METHODOLOGY AND EXPERIMENTAL STUDY .......................................... 24
3.1 Introduction ....................................................................................................... 24
vii
3.2 Sampling Location and Local Geology............................................................. 24
3.2.1 The Superficial Deposits of Famagusta.................................................. 24
3.2.2 Soil Sampling ......................................................................................... 25
3.3 Testing Strategy ................................................................................................ 26
3.4 Preparation of the Soft Samples ........................................................................ 27
3.5 Preparation of the Compacted Samples ............................................................ 29
3.5.1 Soil Compaction ..................................................................................... 29
3.5.2 Sample Preparation for Testing .............................................................. 29
3.6 Testing Methods ................................................................................................ 32
3.6.1 Standard Oedometer Test, SOT .............................................................. 32
3.6.2 Creep test ................................................................................................ 32
3.7 Results of Index and Classification Tests ......................................................... 33
3.7.1. Initial Moisture Content ........................................................................ 33
3.7.2 Particle Size Distribution........................................................................ 33
3.7.3 Specific Gravity ...................................................................................... 33
3.7.4 Plasticity Index ....................................................................................... 34
3.7.5 Soil Classification................................................................................... 35
4 RESULTS, ANALYSIS AND DISCUSSION ....................................................... 36
4.1 Introduction ....................................................................................................... 36
4.2 Analysis of Compressibility Behavior Using Standard Oedometer Tests ........ 37
4.2.1 Compression Curves at Each Test Stage ................................................ 37
4.2.2 Comparison of Compressibility Curves ................................................. 39
4.2.3 Analysis of Secondary Compression Behavior using Standard
Oedometer Tests .............................................................................................. 41
4.3 Analysis of Secondary Compression Behavior Using Creep Tests .................. 46
viii
4.3.1 Assessment of Vertical Strain Curves for Soft Samples ........................ 46
4.3.2 Analysis of Secondary Compression of Compacted Samples................ 54
4.4 Summarized Critical Review ............................................................................ 57
5 CONCLUSION ....................................................................................................... 59
REFERENCES ........................................................................................................... 64
APPENDICES ........................................................................................................... 69
Appendix A : Test Reports for Standard Oedometer Tests……………………….70
Appendix B : Test Reports for Creep Tests……………………………………….75

ix
LIST OF TABLES
Table 2.1: Values of compression index for several types of soil………………..…..7
Table 2.2: Soil classification in according to Cα……………………………...….…13
Table 2.3: Values of Cα/Cc for various types of soils………………………...…….14
Table 4.1: Coefficient of secondary compression for soft and compacted samples for
standard oedometer tests……..…...…………………………………………………44
Table 4.2: Non linear fitting curve parameters for sot samples…………...………...52
Table 4.3: Coefficient of secondary compression for soft samples…………………53
Table 4.4: Coefficient of secondary compression for compacted samples……….…55
Table 4.5: Non linear fitting curve parameters for compacted samples………….....55
x
LIST OF FIGURES
Figure 2.1: Standard oedometer curve ......................................................................... 6
Figure 2.2: Typical compression lines ......................................................................... 8
Figure 2.3: Computing of preconsolidation pressure ................................................... 9
Figure 2.4: Determination of the coefficient of secondary compression ................... 12
Figure 2.5: The bi-linear relationship between Cα and Cs* ...................................... 13
Figure 2.6: Types of compression curves .................................................................. 21
Figure 2.7: Comparison between measured curve and fitted curve ........................... 22
Figure 3.1: Site location ............................................................................................. 25
Figure 3.2: Soil sampling ........................................................................................... 26
Figure 3.3: Testing strategy and testing groups for soft sample (GR-1) .................... 28
Figure 3.4: Testing strategy and testing groups of samples compacted using standard
Proctor energy (GR-2)................................................................................................ 29
Figure 3.5: Testing strategy and testing groups of samples compacted with increased
energy (GR-3) ............................................................................................................ 29
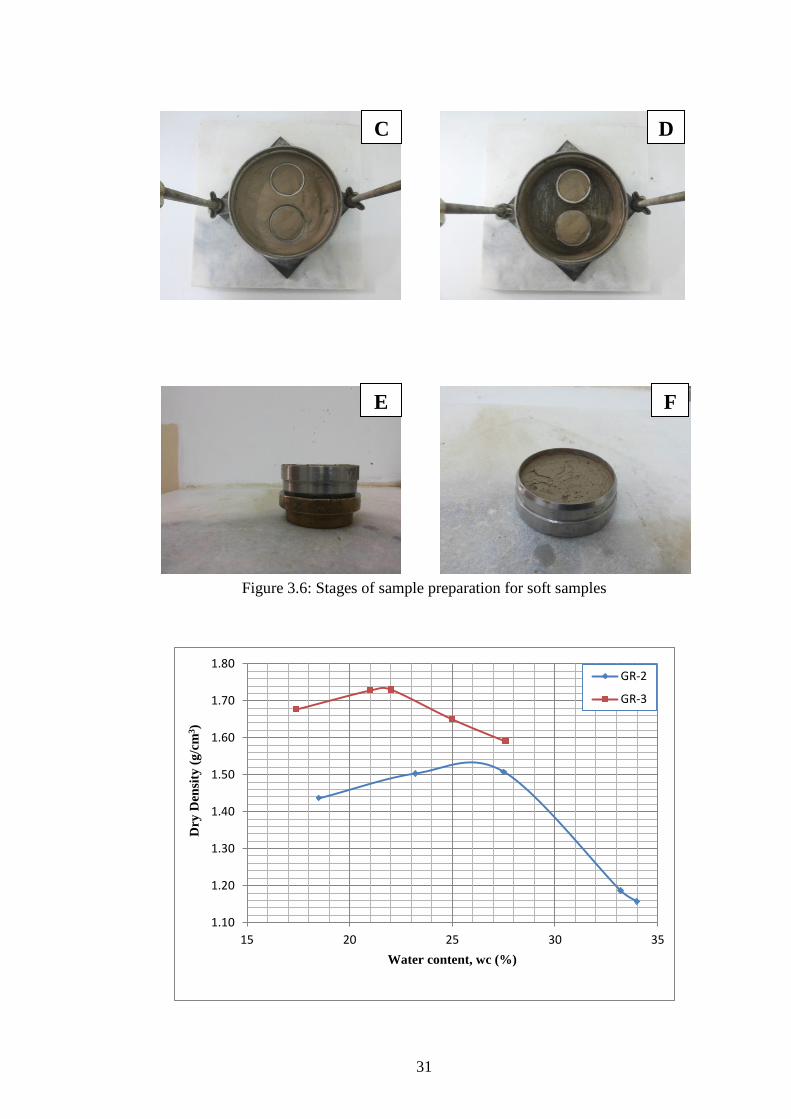
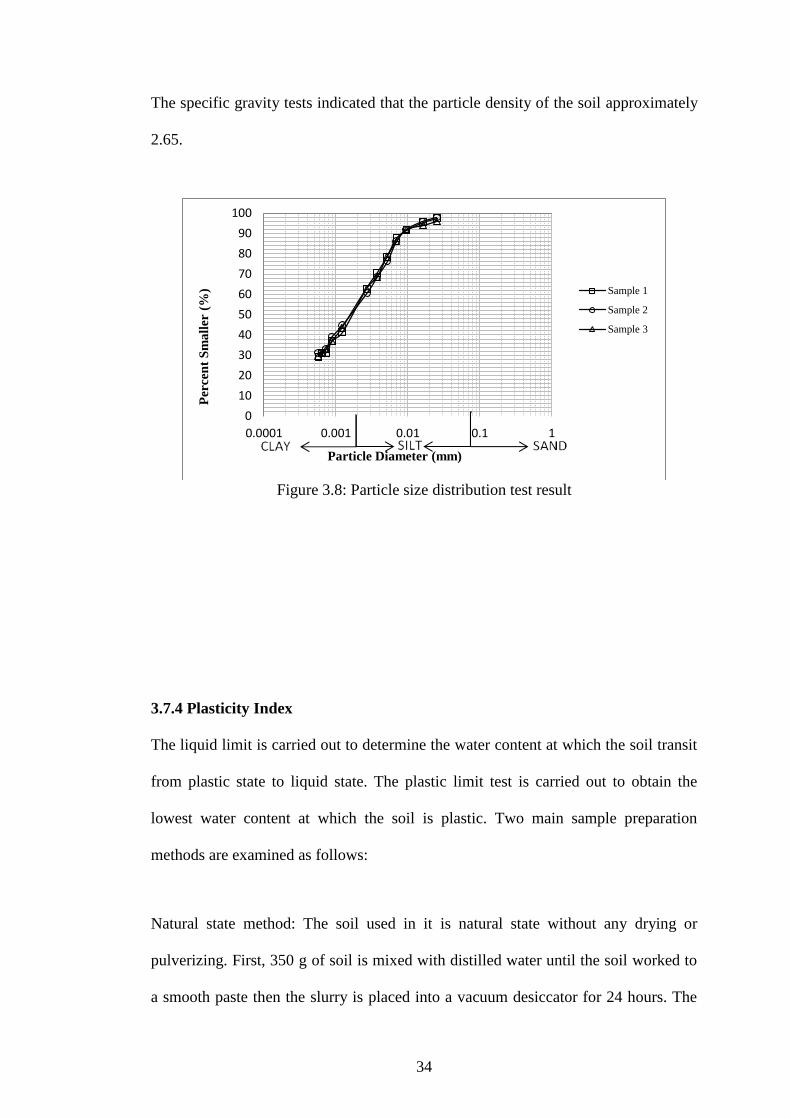
Figure 3.6: Stages of sample preparation for soft samples ........................................ 31
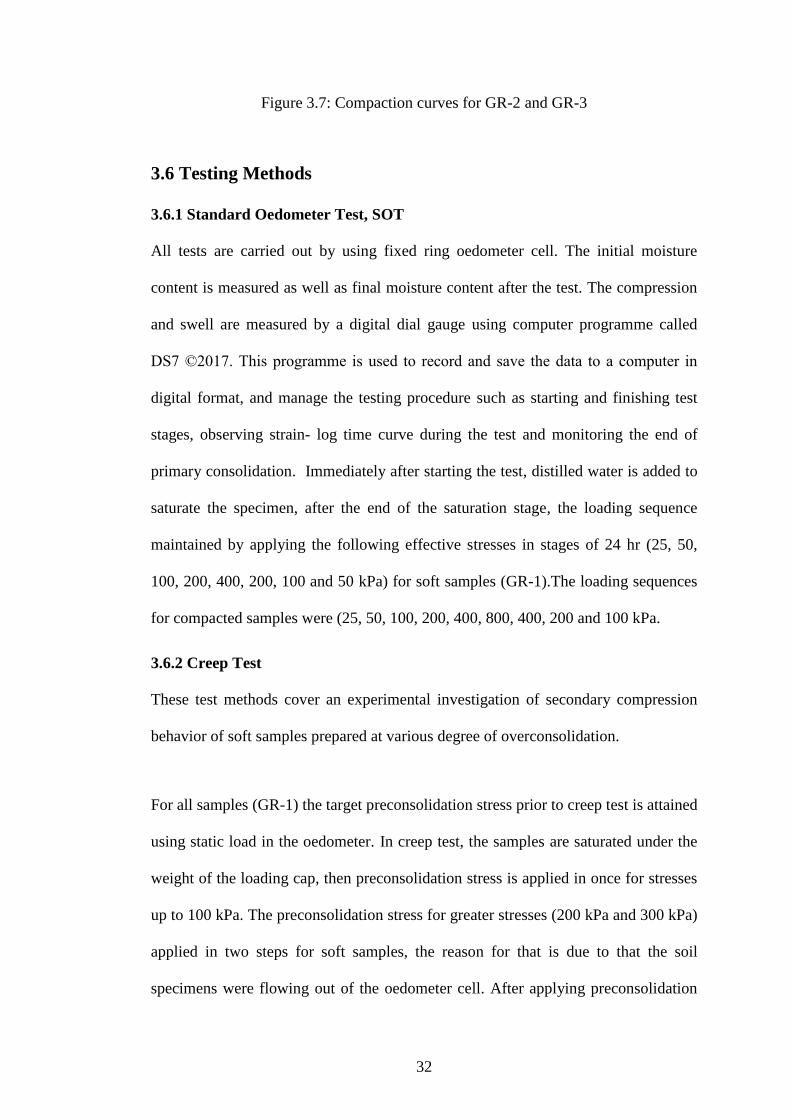
Figure 3.7: Compaction curves for GR-2 and GR-3 .................................................. 32
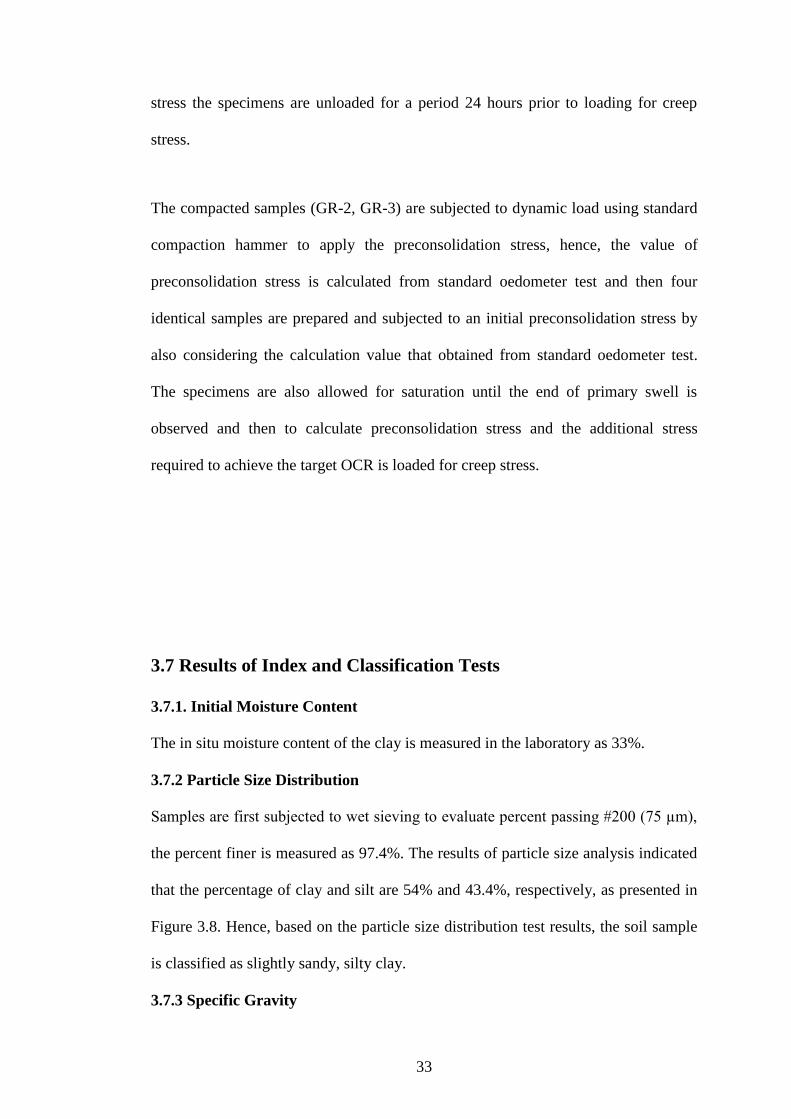
Figure 3.8: Particle size distribution test result .......................................................... 34
Figure 3.9: Liquid limit test results for natural state method ..................................... 35
Figure 3.10: Liquid limit test results for drying pulverizing method ......................... 36
Figure 4.1: Compressibility curves from standard oedometer test, GR-1.................. 38
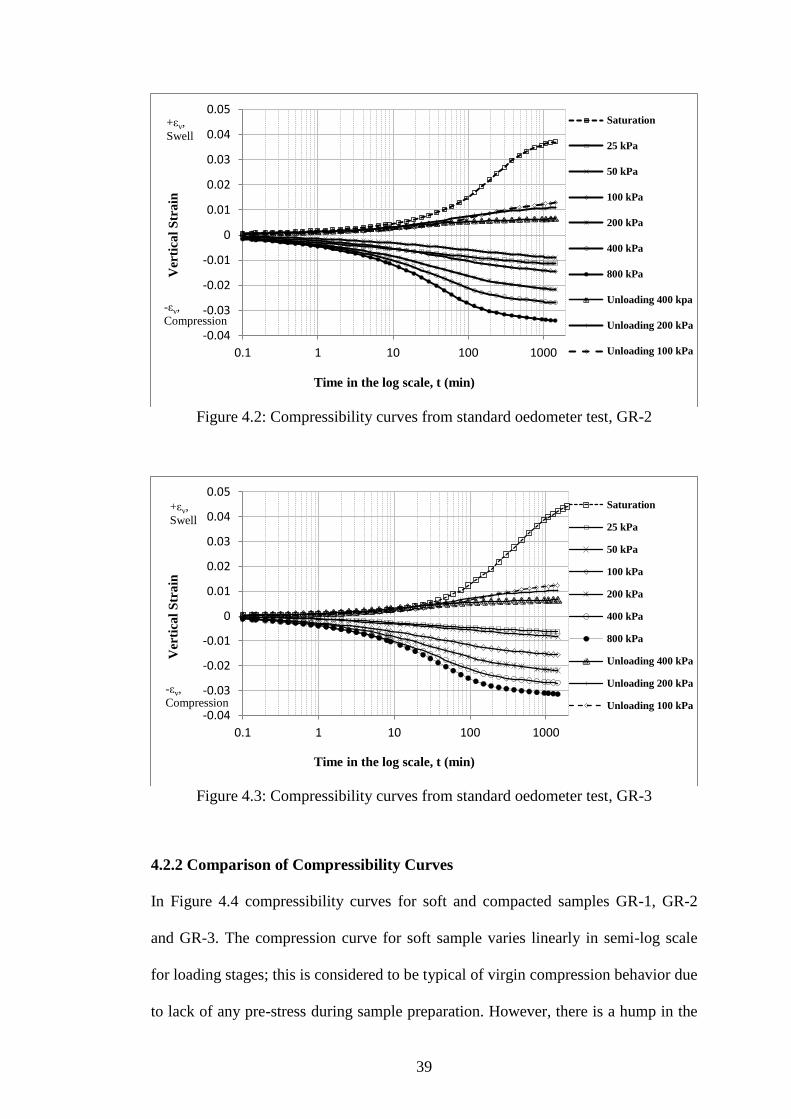
Figure 4.2: Compressibility curves from standard oedometer test, GR-2.................. 39
Figure 4.3: Compressibility curves from standard oedometer test, GR-3.................. 39

xi
Figure 4.4: Standard oedometer compressibility curves for soft and compacted
samples ....................................................................................................................... 41
Figure 4.5: Creep curves from standard oedometer test for, GR-1 ............................ 42
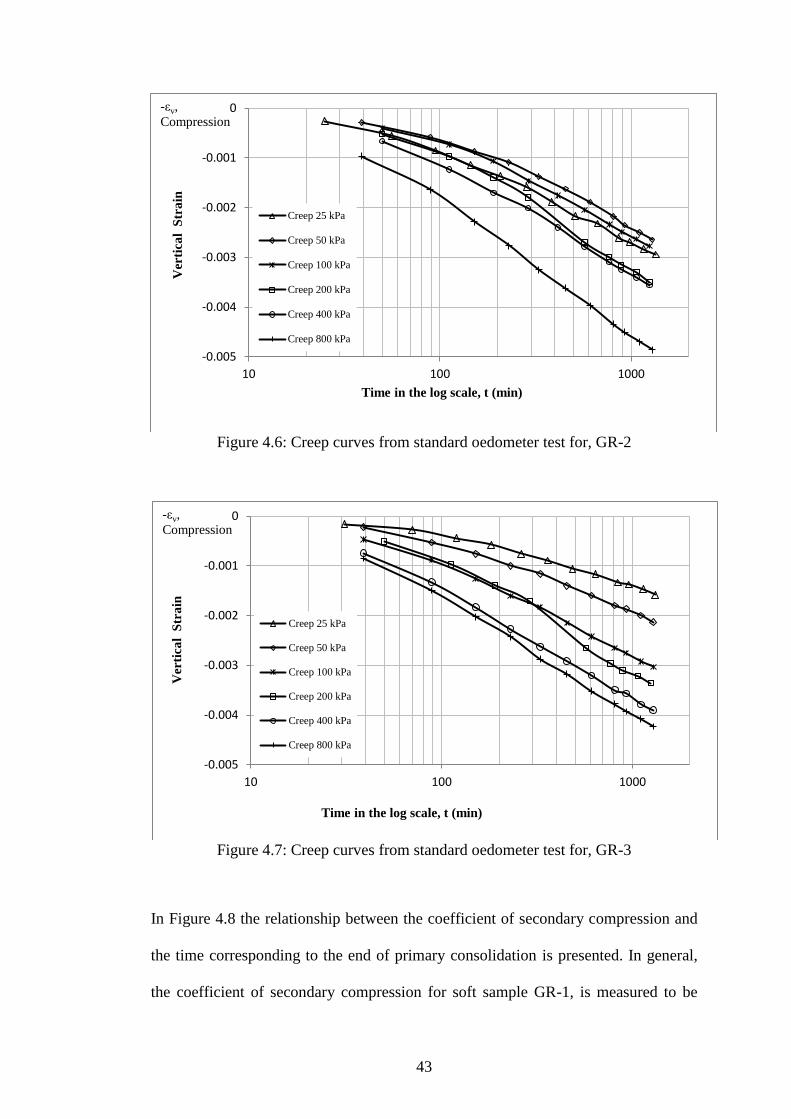
Figure 4.6: Creep curves from standard oedometer test for, GR-2 ............................ 43
Figure 4.7: Creep curves from standard oedometer test for, GR-3 ............................ 43
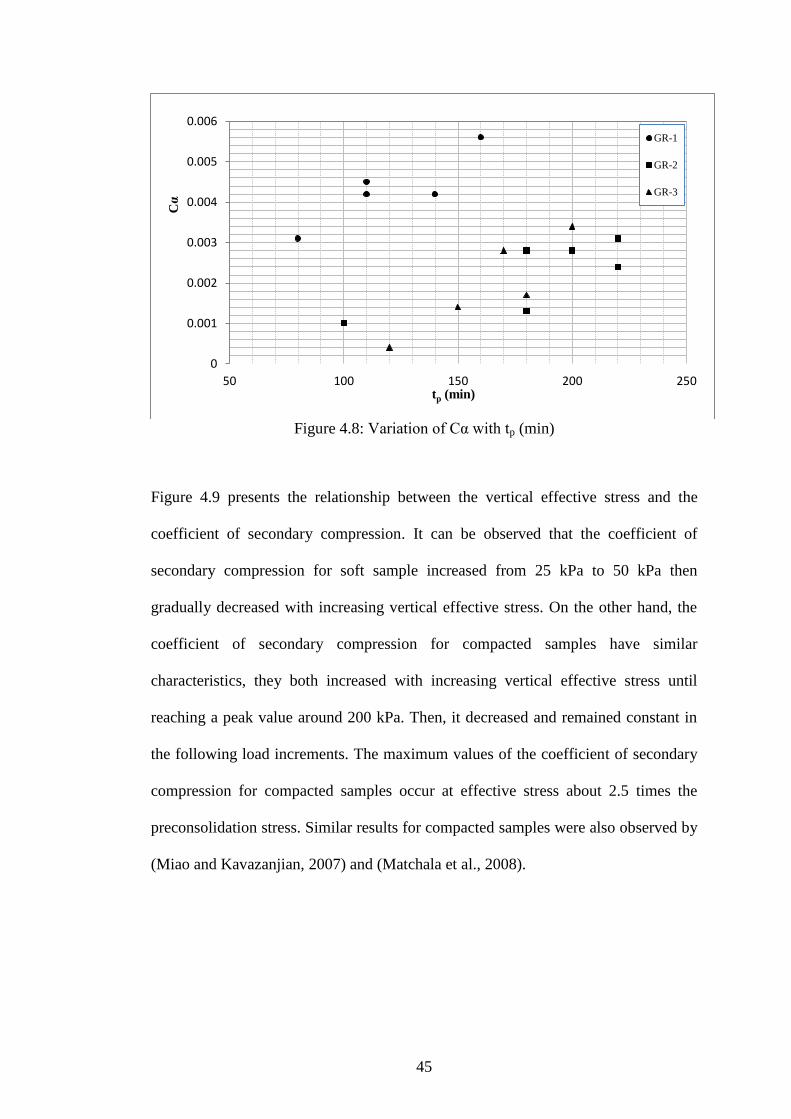
Figure 4.8: Variation of Cα with tp (min)................................................................... 45
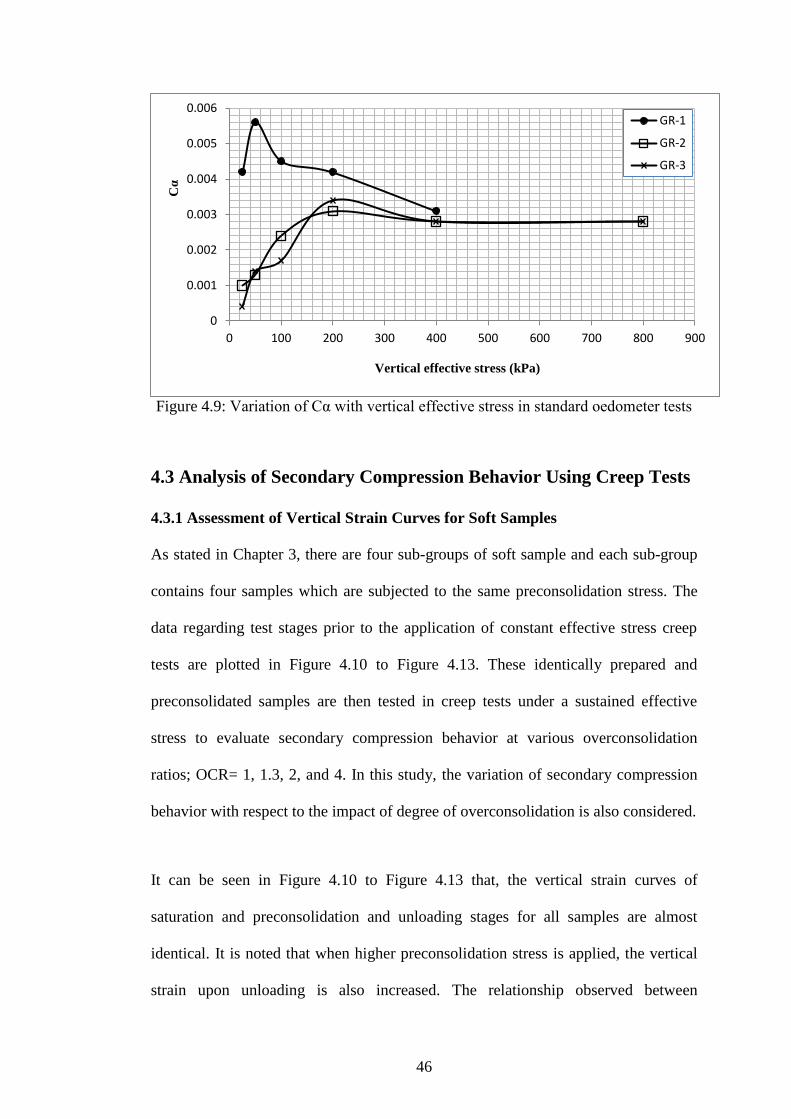
Figure 4.9: Variation of Cα with vertical effective stress in standard oedometer tests
.................................................................................................................................... 46
Figure 4.10: Vertical strain curves of GR-1.1 (Pc=50 kPa) ....................................... 47
Figure 4.11: Vertical strain curves of GR-1.2 (Pc=100 kPa) ..................................... 47
Figure 4.12: Vertical strain curves of GR-1.3 (Pc=200 kPa) ..................................... 48
Figure 4.13: Vertical strain curves of GR-1.4 (Pc=300 kPa) ..................................... 48
Figure 4.14: The relationship observed between preconsolidation stress and vertical
strain upon unloading, obtained after 24 hours .......................................................... 49
Figure 4.15: Vertical strain creep curves of GR-1.1 .................................................. 50
Figure 4.16: Vertical strain creep curves of GR-1.2 .................................................. 51
Figure 4.17: Vertical strain creep curves of GR-1.3 .................................................. 51
Figure 4.18: Vertical strain creep curves of GR-1.4 .................................................. 52
Figure 4.19: Creep curves of compacted samples subjected to standard Energy GR-2
.................................................................................................................................... 57
Figure 4.20: Creep curves of compacted samples subjected to increased energy GR-3
.................................................................................................................................... 57
xii
LIST OF SYMBOLS AND ABBREVATIONS
Cc Compression index
Cr Recompression Index
σʹv Vertical effective stress
Cv Coefficient of consolidation
Cα Coefficient of secondary compression for time interval 100 min to
1000 min
Cα* Coefficient of secondary compression for time interval 1000 min to
10000 min
e Void ratio
Δe Change in void ratio
av Coefficient of compressibility
ρw Density of water
tp Time corresponding to the end of primary consolidation.
mv Compressibility coefficient
Pc Preconsolidation stress
Gs Specific gravity
+εv Vertical strain of swell
- εv Vertical strain of compression
Δε Creep strain
Δε1 Creep strain limit
ψₒ Initial creep strain
t Creep time at strain of Δε
tₒ Initial creep time.
xiii
as Zero consolidation
ΔH Change in height per log cycle of time
Hi Initial height of the specimen
Cs* Swell index
n Number of drops per layer.
N Number of layers.
w Weight of hammer
h Free fall height
v Volume of the mold
m Secondary compression factor.
wc Water Content
ASTM American Society for Testing and materials
CH High Plasticity Clay
CT Creep Test
GR-1 Soft Sample
GR-2 Compacted Sample with Standard Energy
GR-3 Compacted Sample with Increased Energy
LL Liquid Limit
OCR Over Consolidation Ratio
PL Plastic Limits
SOT Standard Oedometer Test
NaCl Salt Water
OWC Optimum Water Content
1
Chapter 1
INTRODUCTION
1.1 Background
Clay soils are complicated natural materials, that contain particle size diameter less
than 0.002 mm. Clay soils are considered significant in construction works due their
complex physical, which have a critical influence on the compressibility
characteristics. Clay soils are very important in geotechnical engineering because of
their complex behavior:
- High plasticity clays (generally plastic Index >30%, or LL>50%) pose high
swelling and shrinkage potential with change in moisture content and may
cause excessive total and differential deformations to structures.
- Clays generally have low hydraulic conductivity. The higher the plasticity,
the lower is hydraulic conductivity.
- In natural state, clay soils generally have moisture content and their
deformation under loads is generally consists of two parts: immediate
deformation and time-dependent deformation (consolidation and creep)-
consolidation is due to dissipation of excess pore-water pressures and creep is
due to plastic deformation of soil structure.
- Pore-water pressure play a major role in strength and deformation of clayey
soils under various loading conditions.
- Chemistry of pore water can significantly affect the behavior of the clay soil.

2
- Strength and deformation properties of the clayey soils depends on their
loading history.
In general, consolidation of clay soils is a process of compression corresponding to
excess pore water pressure due to an effect of vertical stress. The compressibility of
the clay soils is measured in the laboratory using oedometer test by performing
various load increments. However, the compressibility can be divided as follows:
1- Initial compression, where the compression occurs due to compression of air
in the voids.
2- Primary compression, where the consolidation occurs due to excess of pore
water pressure.
3- Secondary compression, which occurs under constant effective stress after
dissipation of the pore water pressure due to rearrangement of soil particles.
However, secondary compression, usually referred as creep, can be expressed by the
coefficient of secondary compression Cα, which is a critical element of prediction of
long term settlement for designing roads and foundations.
1.2 Research Objectives
The overall aim of this thesis is to investigate the creep behavior of a selected
superficial deposit from Famagusta. The specific objectives are as follows:
- To investigate the creep behavior using two methods of sample preparation
and evaluate the creep from each method.
- Discuss the compressibility parameters under various test conditions such as
initial void ratio, initial water content, and preconsolidation stress.
3
- To examine the variation of the coefficient of secondary compression with
time in logarithmic scale.
- Give some recommendations about calculation of the coefficient of secondary
compression.
- To study the impact of vertical effective stress on the secondary compression
during normally consolidated and overconsolidated conditions.
1.3 Aim of the Study
The fundamental purpose of this thesis is to study the creep characteristics of a clay
soil using laboratory tests and analysis of test results for preconsolidation stress and
two methods of sample preparation; uncompacted and compacted.
1.4 Research Limitation
Although the aims of the research are attained, there are still unavoidable limitations
that can be summarized
follows:
- Due to time limitation, only one soil type is examined using two methods of
sample preparation.
- Only one-dimensional consolidation test is used to measure the
compressibility.
- Hence, the study only focuses on the vertical strain by assuming there isn’t
any horizontal strain during creep.
1.5 Scope of Work
The main goal of this thesis is to gain an understanding of the mechanism of creep.
This is accomplished by a survey of previous studies then designing laboratory
program, after analyzing the test results a conclusion is made. The thesis contains
five chapters as follows:
4
In the second chapter, a literature review about compressibility behavior of clay soils
involving the overview of the theory of one-dimensional consolidation, secondary
compression, and non-linear creep are presented.
The laboratory program including soil sampling, testing strategy, methods of sample
preparation, index properties, soil classification and testing methods are presented in
the third chapter.
The fourth chapter is dedicated for computing compressibility parameters and
analysis of the oedometer test results. As a first part, the compressibility of standard
oedometer test and the creep results are presented and analyzed. A significant part of
chapter four involves creep tests, where the coefficient of secondary compression is
deeply studied.
In the last chapter, chapter five, conclusion and recommendations are summarized by
providing general comments from chapter three and four.
5
Chapter 2
LITERATURE REVIEW
2.1 Introduction
In this chapter, a brief review about compressibility behavior of clay soils and the
theory of secondary compression are presented. The compressibility behavior of soft
clays and compacted clays are generally reviewed and summarized. The variation of
long term compression with time and the influence of vertical effective stress are
reviewed. The geotechnical parameters defining compressibility behavior that used
in this thesis are identified.
2.2 Compressibility Behavior of Clay Soils
2.2.1 One-dimensional Compression Curve
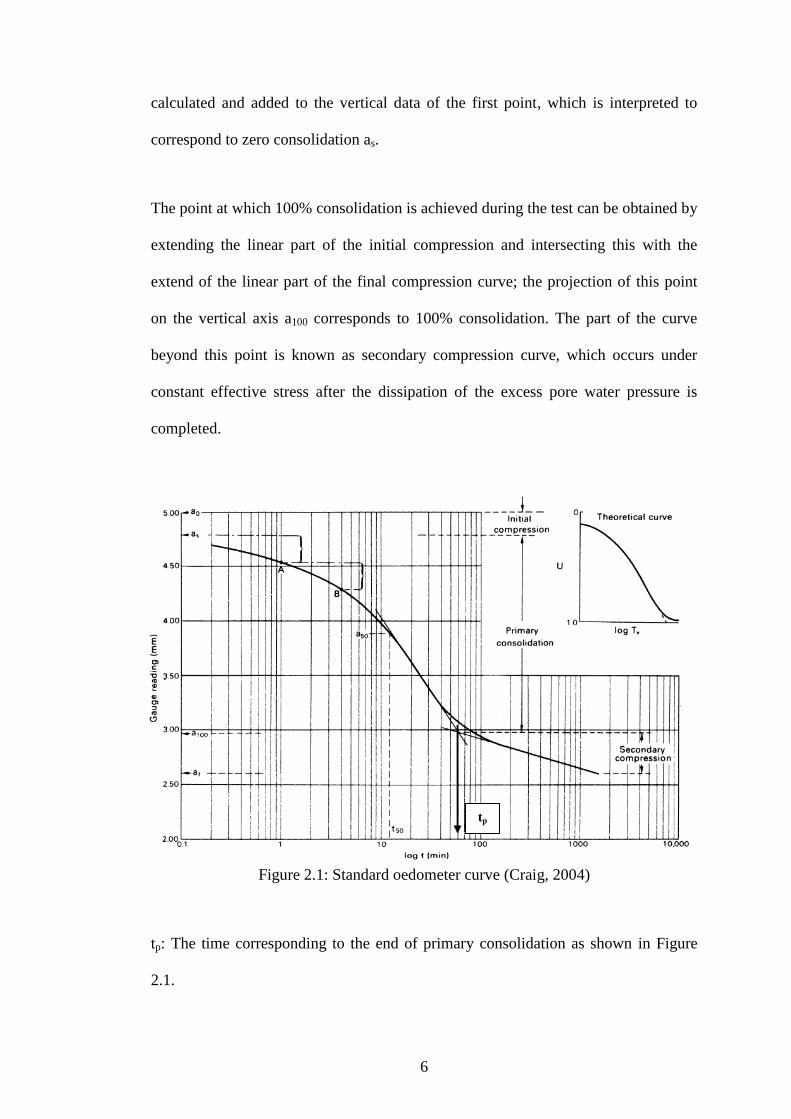
The interpretation of graphical plot of the one-dimentional compression
corresponding to time in logarithmic scale in a standard oedometer test is proposed
by Casagrande (Head, 1986). A one-dimensional compressibility curve obtained in a
standard oedometer tests is shown in Figure 2.1 which consists of three parts; initial
convex parabolic curve, then a linear part and then a final part which the time is
closer to concave parabolic form. The time corresponding to zero consolidation can
be found by choosing two points on the first part of the curve (A and B), where the
difference in time between them is 1:4, the vertical distance between them is
6
calculated and added to the vertical data of the first point, which is interpreted to
correspond to zero consolidation as.
The point at which 100% consolidation is achieved during the test can be obtained by
extending the linear part of the initial compression and intersecting this with the
extend of the linear part of the final compression curve; the projection of this point
on the vertical axis a100 corresponds to 100% consolidation. The part of the curve
beyond this point is known as secondary compression curve, which occurs under
constant effective stress after the dissipation of the excess pore water pressure is
completed.
Figure 2.1: Standard oedometer curve (Craig, 2004)
tp: The time corresponding to the end of primary consolidation as shown in Figure
2.1.
tp
7
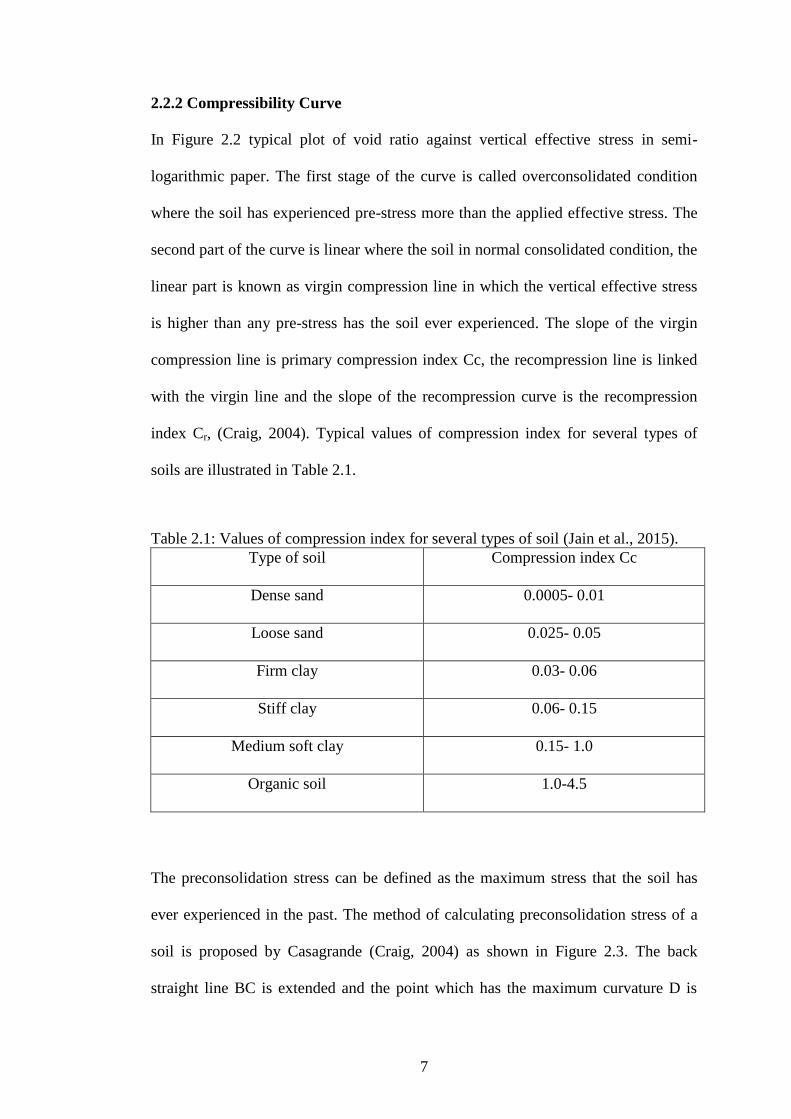
2.2.2 Compressibility Curve
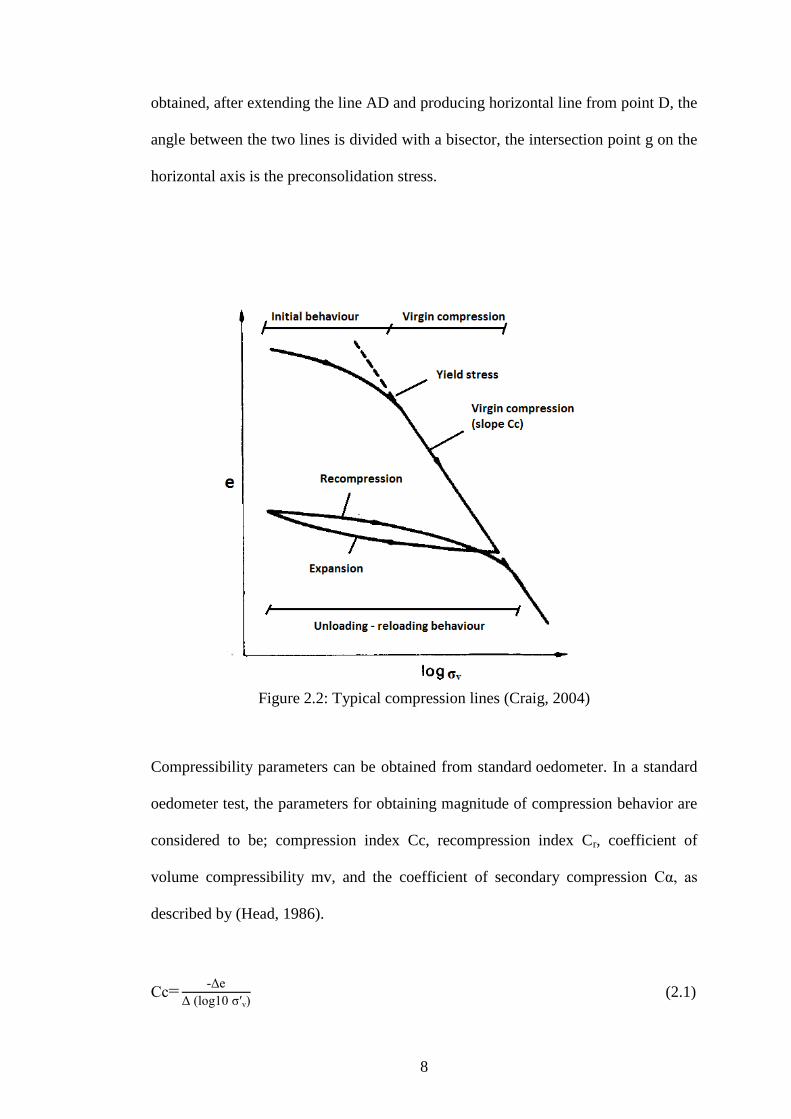
In Figure 2.2 typical plot of void ratio against vertical effective stress in semi-
logarithmic paper. The first stage of the curve is called overconsolidated condition
where the soil has experienced pre-stress more than the applied effective stress. The
second part of the curve is linear where the soil in normal consolidated condition, the
linear part is known as virgin compression line in which the vertical effective stress
is higher than any pre-stress has the soil ever experienced. The slope of the virgin
compression line is primary compression index Cc, the recompression line is linked
with the virgin line and the slope of the recompression curve is the recompression
index Cr, (Craig, 2004). Typical values of compression index for several types of
soils are illustrated in Table 2.1.
Table 2.1: Values of compression index for several types of soil (Jain et al., 2015).
Type of soil Compression index Cc
Dense sand 0.0005- 0.01
Loose sand 0.025- 0.05
Firm clay 0.03- 0.06
Stiff clay 0.06- 0.15
Medium soft clay 0.15- 1.0
Organic soil 1.0-4.5
The preconsolidation stress can be defined as the maximum stress that the soil has
ever experienced in the past. The method of calculating preconsolidation stress of a
soil is proposed by Casagrande (Craig, 2004) as shown in Figure 2.3. The back
straight line BC is extended and the point which has the maximum curvature D is
8
obtained, after extending the line AD and producing horizontal line from point D, the
angle between the two lines is divided with a bisector, the intersection point g on the
horizontal axis is the preconsolidation stress.
Figure 2.2: Typical compression lines (Craig, 2004)
Compressibility parameters can be obtained from standard oedometer. In a standard
oedometer test, the parameters for obtaining magnitude of compression behavior are
considered to be; compression index Cc, recompression index Cr, coefficient of
volume compressibility mv, and the coefficient of secondary compression Cα, as
described by (Head, 1986).
Cc=-Δe
Δ (log10 σʹv) (2.1)

9
where,
Cc: compression index.
Δe: change in void ratio during virgin compression line.
Δ (log10 σʹv): change in vertical effective stress in logarithmic scale.
Figure 2.3: Computing of preconsolidation pressure (Craig, 2004)
Pc: the preconsolidation stress.
Cr=-Δe
Δ (log10 σʹv) (2.2)
where,
Cr: primary swell index.
Δe: change in void ratio during recompression line.
Δ (log10 σʹv): change in vertical effective stress in logarithmic scale.
10
The recompression index is usually referred to compression index, the correlation
between Cr and Cc within the range 0.02 to 0.2 for almost all soils, (Terzaghi et al.,
1996).
mv=av
1+e (2.3)
where,
mv: coefficient of volume compressibility.
av: coefficient of compressibility.
e: void ratio.
The time- dependency is obtained simply by calculation of the coefficient of
consolidation Cv using Terzaghi’s one- dimensional consolidation theory (Head,
1986).
Cv=av
mv*ρw (2.4)
where,
Cv: coefficient of consolidation.
ρw: density of water.
2.2.3 Secondary Compression
After Terzaghi proposed his outstanding theory of one dimensional consolidation of
soils in 1923 based on excess pore water pressure dissipation, laboratory results and
field observations have shown that the settlement continues even after the dissipation
completes (Fatahi et al., 2012). In order to distinguish the two components of the
compression, the term of ‘primary consolidation’ is used to describe the time
dependent process due to the change in volume induced by the expulsion of water
from the voids, and transferring load from the pore water pressure to the soil
particles. On the other hand, creep or so-called secondary compression is generally

11
defined as the deformation under a constant effective stress. It is necessary to
exclude creep phenomenon from the deformation under constant load because the
effective stresses can be variable under a constant load. The research on the long-
term settlement of soils has become important and been developed for many decades
(Fatahi et al., 2012).
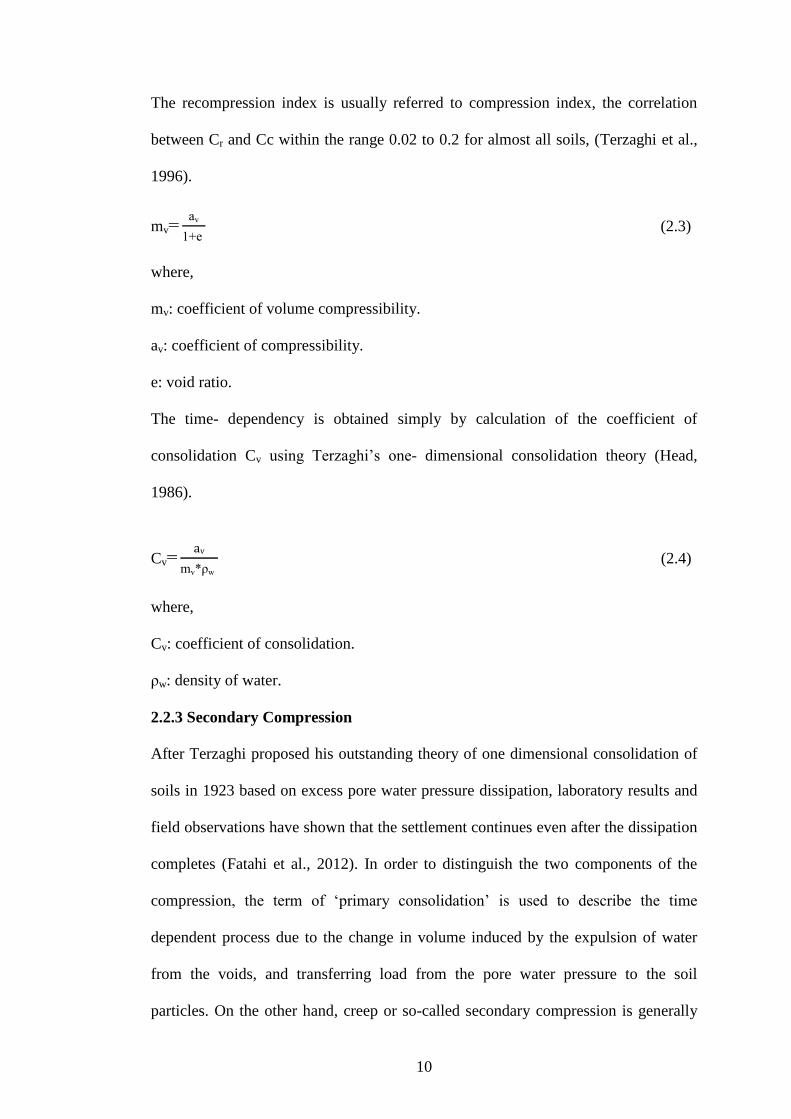
The coefficient of secondary compression Cα is usually used to describe the
secondary compression which can be obtained from Casagrande method (Head,
1986), as:
Cα=ΔH
Hi per one log cycle of time. (2.5)
where,
Cα: coefficient of secondary compression.
ΔH: change in height per log cycle of time.
Hi: initial height of the specimen.
Cα*: coefficient of secondary compression computed from time interval between
1000 min to 10000 min.
The main objective of calculating Cα* is to examine the variation of the coefficient
of secondary compression with time.
The above formulation assumes that the variation of secondary compression is linear
in log time space. Figure 2.4 shows the determination of coefficient of secondary
compression Head (1986).
12
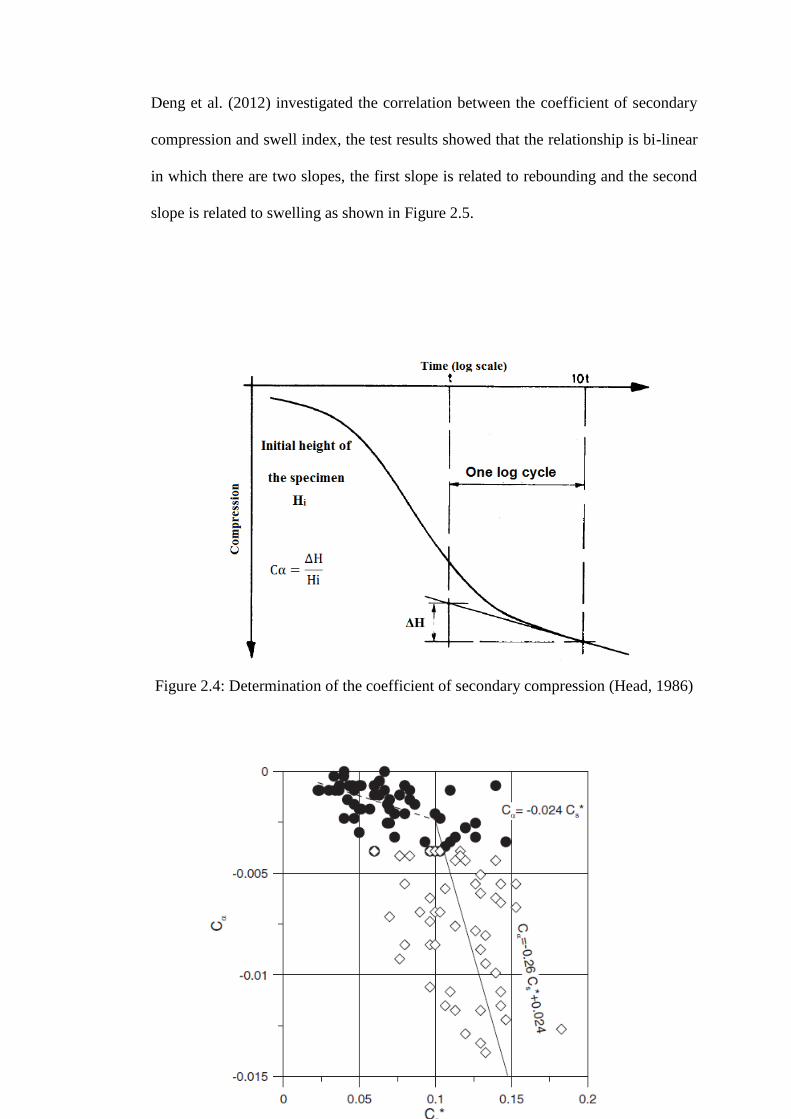
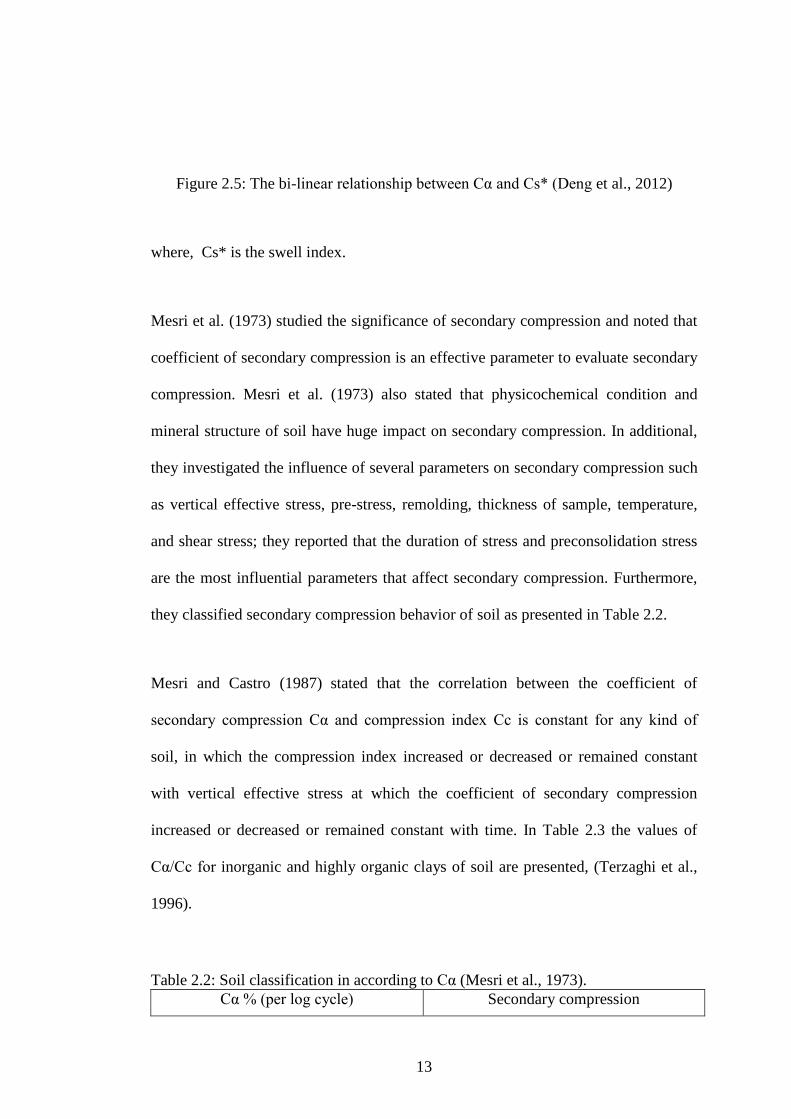
Deng et al. (2012) investigated the correlation between the coefficient of secondary
compression and swell index, the test results showed that the relationship is bi-linear
in which there are two slopes, the first slope is related to rebounding and the second
slope is related to swelling as shown in Figure 2.5.
Figure 2.4: Determination of the coefficient of secondary compression (Head, 1986)
13
Figure 2.5: The bi-linear relationship between Cα and Cs* (Deng et al., 2012)
where, Cs* is the swell index.
Mesri et al. (1973) studied the significance of secondary compression and noted that
coefficient of secondary compression is an effective parameter to evaluate secondary
compression. Mesri et al. (1973) also stated that physicochemical condition and
mineral structure of soil have huge impact on secondary compression. In additional,
they investigated the influence of several parameters on secondary compression such
as vertical effective stress, pre-stress, remolding, thickness of sample, temperature,
and shear stress; they reported that the duration of stress and preconsolidation stress
are the most influential parameters that affect secondary compression. Furthermore,
they classified secondary compression behavior of soil as presented in Table 2.2.
Mesri and Castro (1987) stated that the correlation between the coefficient of
secondary compression Cα and compression index Cc is constant for any kind of
soil, in which the compression index increased or decreased or remained constant
with vertical effective stress at which the coefficient of secondary compression
increased or decreased or remained constant with time. In Table 2.3 the values of
Cα/Cc for inorganic and highly organic clays of soil are presented, (Terzaghi et al.,
1996).
Table 2.2: Soil classification in according to Cα (Mesri et al., 1973).
Cα % (per log cycle) Secondary compression
14
< 0.2 Very low
0.4 Low
0.8 Medium
1.6 High
3.2 Very high
>6.4 Extremely high
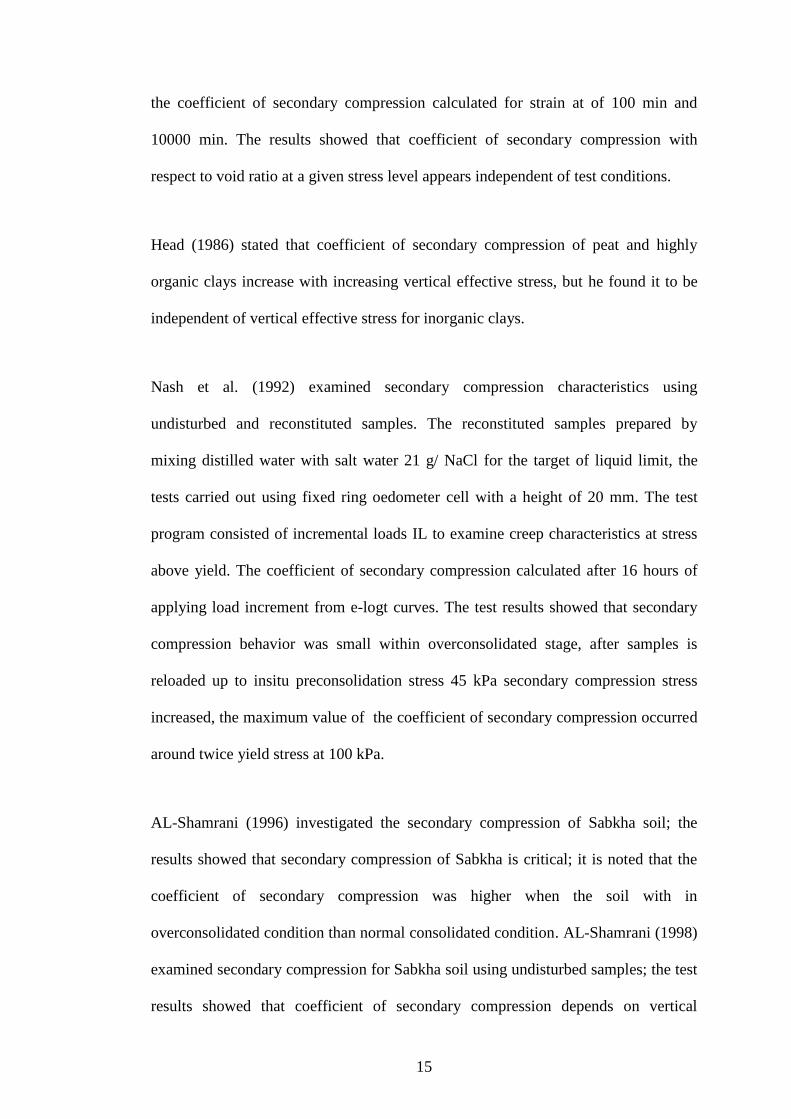
Table 2.3: Values of Cα/Cc for various types of soil (Terzaghi et al., 1996).
Type of soil Cα/Cc
Granular soils 0.02 ± 0.01
Shale and mudstones 0.03 ± 0.01
Inorganic silts, clays 0.04 ± 0.01
Highly organic clays 0.05 ± 0.01
Fibrous peats 0.06 ± 0.01
2.3 Coefficient of Secondary Compression (Cα) and Vertical
Effective Stress
Sridharan and Rao (1982) conducted series of one dimensional consolidation testes
to examine the mechanism of secondary compression. The oedometer testes carried
out in which there are variations in void ratio, load increment ratio and organic
fluids. It is shown that coefficient of secondary compression reduce with increase in
vertical effective stress.
Graham et al. (1983) investigated coefficient of secondary compression for Ottawa
clays using series of one dimensional consolidation tests, each load increment
applied for 10 days. The primary consolidation observed to be ended before 100 min,
15
the coefficient of secondary compression calculated for strain at of 100 min and
10000 min. The results showed that coefficient of secondary compression with
respect to void ratio at a given stress level appears independent of test conditions.
Head (1986) stated that coefficient of secondary compression of peat and highly
organic clays increase with increasing vertical effective stress, but he found it to be
independent of vertical effective stress for inorganic clays.
Nash et al. (1992) examined secondary compression characteristics using
undisturbed and reconstituted samples. The reconstituted samples prepared by
mixing distilled water with salt water 21 g/ NaCl for the target of liquid limit, the
tests carried out using fixed ring oedometer cell with a height of 20 mm. The test
program consisted of incremental loads IL to examine creep characteristics at stress
above yield. The coefficient of secondary compression calculated after 16 hours of
applying load increment from e-logt curves. The test results showed that secondary
compression behavior was small within overconsolidated stage, after samples is
reloaded up to insitu preconsolidation stress 45 kPa secondary compression stress
increased, the maximum value of the coefficient of secondary compression occurred
around twice yield stress at 100 kPa.
AL-Shamrani (1996) investigated the secondary compression of Sabkha soil; the
results showed that secondary compression of Sabkha is critical; it is noted that the
coefficient of secondary compression was higher when the soil with in
overconsolidated condition than normal consolidated condition. AL-Shamrani (1998)
examined secondary compression for Sabkha soil using undisturbed samples; the test
results showed that coefficient of secondary compression depends on vertical
16
effective stress. The results indicated increase with effective stress then remained
approximately constant.
Matchala et al. (2008) studied the impact of vertical stresses on the coefficient of
secondary compression of Marine clays in South Korea. The test results showed that
the coefficient of secondary compression increased with increasing vertical effective
stress and reached a peak value when stress level is twice preconsolidation stress.
Miao and Kavazanjian (2007) carried out series of one dimensional consolidation
tests on undisturbed samples of Jiangsu soft clays. A total of 50 undisturbed samples
were investigated, the specimens dimensions were 61.8 mm in diameter and 20 mm
in height. The relationship between coefficient of secondary compression and stress
ratios (σʹv /Pc) indicated that coefficient of secondary compression depends on stress
level, it increases rapidly for stress level less than 2.5 then became constant for stress
level higher than 2.5.
Lingling and Sonyu (2010) conducted series of one dimensional consolidation tests
to investigate secondary compression behavior of Lianyungang clays, the program
preformed on both undisturbed and reconstituted samples, a thin-wall free piston
tube is used to excavate high quality undisturbed samples from depth of 6 m below
ground surface. The test results showed that coefficient of secondary compression for
both undisturbed and reconstituted samples increases with vertical effective stress
until reaches maximum value in the vicinity of yield stress then dramatically
decreases with increasing vertical stress, it has pointed out that coefficient of
secondary compression can be neglected in pre-yield stage. Also coefficient of

17
secondary compression of undisturbed samples has higher values than reconstituted
samples.
Deng et al. (2012) analyzed results of one dimensional consolidation testes of
undisturbed samples the clay extracted by coring at north east of Belgium, the results
showed that the relationship between coefficient of secondary compression and stress
ratio (σʹv /Pc) increasing linearly on semi-logarithmic scale.
Li et al. (2012) preformed series of one dimensional consolidation tests in order to
investigate secondary compression of Shanghi clays. The long-term consolidation
program consists of three intact specimens and one reconstituted specimens, the
reconstituted specimen prepared by mixing the clays with distilled water equal to 1.4
liquid limits. The secondary compression measured for each load increment within
period of seven days. They have found that coefficient of secondary compression is
approximately linear when stress level in the vicinity of (OCR=1), then reduce with
time for consolidation stress ratios more than 1. Coefficient of secondary
compression for reconstituted specimen found within range (1/3-1/2) of undisturbed
specimen.
Luo and Chen (2014) investigated creep behavior of River Delta Clays. Undisturbed
samples were extracted from depth of 6 m and 16 m, the consolidation ring has a
diameter of 61.8 mm and height of 20 mm is used. The results showed that the
relationship between secondary compression and consolidation stress is conditional,
with in overconsolidated condition secondary compression increases with increasing
effective stress but in normal consolidated condition decrease with increasing
effective stress. These results were found in other studied such as (Walker, 1969).
18
Mehrab et al. (2011) carried out series of one dimensional consolidation tests on
undisturbed samples, the samples were taken from eleven sites in Iran. In order to
investigate long term settlements each load applied for 1 to 3 weeks, the coefficient
of secondary compression is found to be dependent on the ratio between vertical
effective stress to preconsolidation pressure (σʹv/Pc), the maximum value of Cα occur
at stress ratio between (2.7 – 4.72).
Huayang et al. (2016) examined secondary compression behavior using three types
of soft soils: Lin-Gang clays, Gentral fishing clays and Qing-Fang clays.
Reconstituted specimens were prepared by drying the clays at room temperature then
pulverized after that clays is mixed with distilled water until uniform paste achieved,
The reconstituted samples prepared for a targets of 1.9-2.28-2.7 liquid limits. The
effect of consolidation stress and initial void ratio on the coefficient of secondary
compression is investigated; they have found that the characteristic of Cα depends on
vertical effective stress and initial void ratio. The coefficient of secondary
compression increased in order with initial void ratio up to void ratio corresponding
to yield stress then Cα decreased. In addition, it was observed that coefficient of
secondary compression for reconstituted specimens have higher values than
undisturbed specimens.
2.4 Variation of the Coefficient of Secondary Compression with
Time
Secondary compression is thought to be the compression that takes place after the
end of primary consolidation under constant effective vertical stress on e-logt plot.
Coefficient of secondary compression is the slope of secondary compression on e-log
t per load cycle of time (Head, 1986).
19
Barden (1968) reported that coefficient of secondary compression is not linear on
semi logarithmic scale. This finding is also confirmed by (Leroueil et al., 1985).
Fox et al. (1992) preformed long-term one-dimensional consolidation tests on
Middleton peat; the test results demonstrated the significant of secondary
compression to total compression. Compression- log time curves showed that under
constant vertical effective stress the coefficient of secondary compression was not
constant but increased with Log time.
Mesri et al. (1997) investigated the variation of the coefficient of secondary
compression with time of Middleton peat. The coefficient of secondary compression
showed lowest value in the recompression range while the highest value was
immediately after preconsolidation stage, and remained constant or slightly
decreased within normal consolidation stage.
Sridharan and Prakash (1998) suggested new strategy for distinguishing secondary
compression in view of secondary compression factor m, as shows in equation 2.6;
m=Δloge
Δlogt (2.6)
where,
m: secondary compression factor.
e: Void ratio.
t: Time
The benefit of this technique is that the charactering of secondary compression
showed as linear compression over long time span. In the cases of (loge – logt)
20
secondary compression factor is more reliable tool to calculate coefficient of
secondary compression than non-linear secondary compression tail. (e-log t) method
proposed by Terzaghi can be used for soil that shows linear secondary compression
where Cα can be shown as linear line on semi-logarithmic scale.
Mesri and Vardhanabhuti (2006) assessed reliable laboratory results and field
observation of wide variety of natural deposits, it is concluded that characteristics of
coefficient of secondary compression varies with time, it may increases or remain
constant or decrease. The long term monitoring of coefficient of secondary
compression found to be decrease with in almost all cases.
Nurly and Yulindasari (2007) conducted series of oedometer testes on peat,
undisturbed block sampling from West Johor –Malaysia is investigated. Secondary
compression curves derived for two different methods, first method is (e-logt)
proposed by Terzaghi (Head, 1986), the other method is secondary compression
factor (loge – logt) proposed by (Sridharan and Prakash, 1998). The oedometer test
results showed that Cα varies with log time when using (e-logt).The method of
secondary compression factor (loge – logt) can be reliable for estimating Cα since
secondary compression shows as straight line. The disconnection point between
primary compression and secondary compression is significant for estimation of Cα
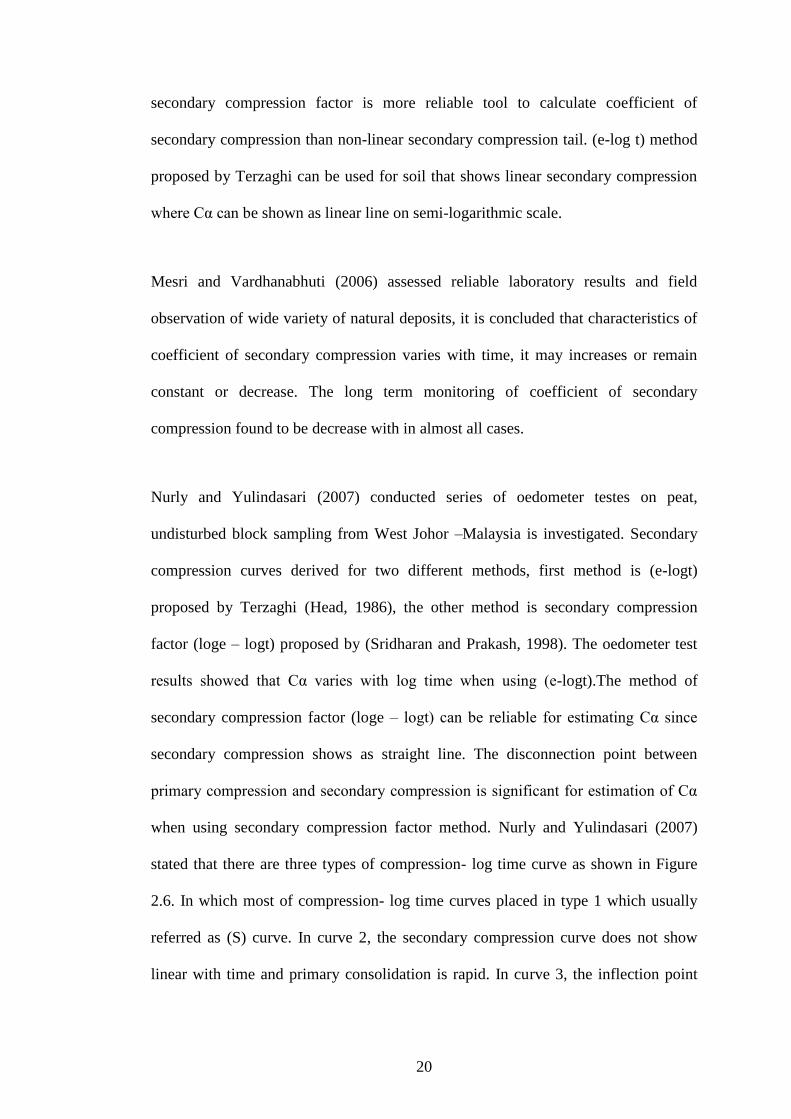
when using secondary compression factor method. Nurly and Yulindasari (2007)
stated that there are three types of compression- log time curve as shown in Figure
2.6. In which most of compression- log time curves placed in type 1 which usually
referred as (S) curve. In curve 2, the secondary compression curve does not show
linear with time and primary consolidation is rapid. In curve 3, the inflection point
21
between primary and secondary compression is not well defined and tp can not well
predict.
Linchang Miao and Edward Kavazanjian (2007) stated that there are two problems
with the relationship between (strain-log time). One problem is that the origin of time
is not well defined. However, this problem becomes less and less significant as the
end time of primary consolidation increases. A second problem is that when the time
is infinite, the semi-logarithmic relationship yields a settlement (or strain) that is
infinite. Thus, the semi-logarithmic function may cause a serious error in the
estimation of the long-term settlement.
Figure 2.6: Types of compression curves (Nurly and Yulindasari, 2007)
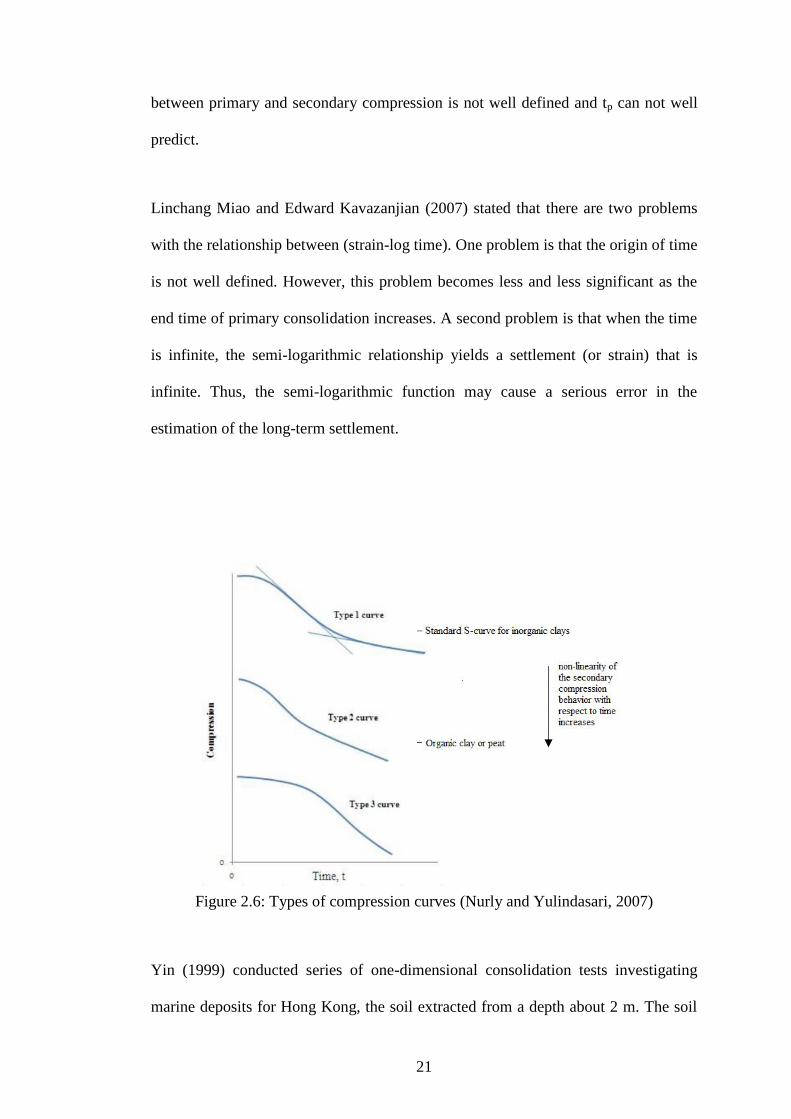
Yin (1999) conducted series of one-dimensional consolidation tests investigating
marine deposits for Hong Kong, the soil extracted from a depth about 2 m. The soil
22
contained of 27.5% clays, 58.4% silts and 14.1% fine sand. The author proposed
non-linear creep formula that describes the creep behavior as follows:
Δε =ψₒ ln[(t+tₒ)/tₒ]
1+(ψₒ+Δε1) ln[(t+tₒ)/tₒ] (2.7)
where,
Δε: Creep strain.
Δε1: Creep strain limit.
ψₒ: Initial creep strain
t: Creep time at strain of Δε.
tₒ: Initial creep time.
The proposed formula indicated good fitting between measured and computed data
as shown in Figure 2.7. (Yin, 1999).
Figure 2.7: Comparison between measured curve and fitted curve (Yin, 1999)
2.5 Summarized Critical Review
The literature review as introduced in section 2.3 and 2.4 the cover the follow:
23
The coefficient of secondary compression Cα is influenced strongly by effective
stress and pre-stress.
There is argue about how do secondary compression behavior change with vertical
effective stress, in some cases increases or remain constant or decrease. In this study,
the effect of consolidation pressure on the secondary compression will be
investigated during overconsolidation stage and normal consolidation stage.
In almost all cases, secondary compression was not constant with time on semi
logarithmic scale under constant effective stress in some cases found to be increased
or remained constant or decreased. The variation of secondary compression with
time is studied.
The coefficient of secondary compression Cα is powerful parameter to predict
secondary compression. There is major problem when calculating coefficient of
secondary compression Cα from logarithmic scale. The variation of secondary
compression is not constant in Log time; it may increases or decreases or remains
constant. Thus, calculating Cα as slope of e – logt pre one cycle of time is not
accurate because the slope is changing from cycle to another. In fact, coefficient of
secondary compression decreases with time under constant stress that in all cases
(Mesri and Vardhanabhuti, 2005).
24
Chapter 3
METHODOLOGY AND EXPERIMENTAL STUDY
3.1 Introduction
In this chapter, the testing strategy and methods followed to investigate the
compressibility behavior of soft samples studied and described, all laboratory testing
are carried out in accordance with the American standards for testing and materials
(ASTM).
3.2 Sampling Location and Local Geology
3.2.1 The Superficial Deposits of Famagusta
25
The superficial deposits of Cyprus can be divided into five groups, (1) Alluvium,
(2) Mesoria clays, (3) Bentonitic clays, (4) Mamonia clays, (5) Degirmenlik clays, as
shown in Figure 3.2 (Atalar and Das, 2009). Clay soils of this region are classified
as high to extremely high swelling potential, with a liquid limit typically varying in
the range from 53 to 91 (Atalar and Das, 2009; Tawfiq and Nalbantoglu, 2009;
Malekzadeh and Bilsel, 2012).
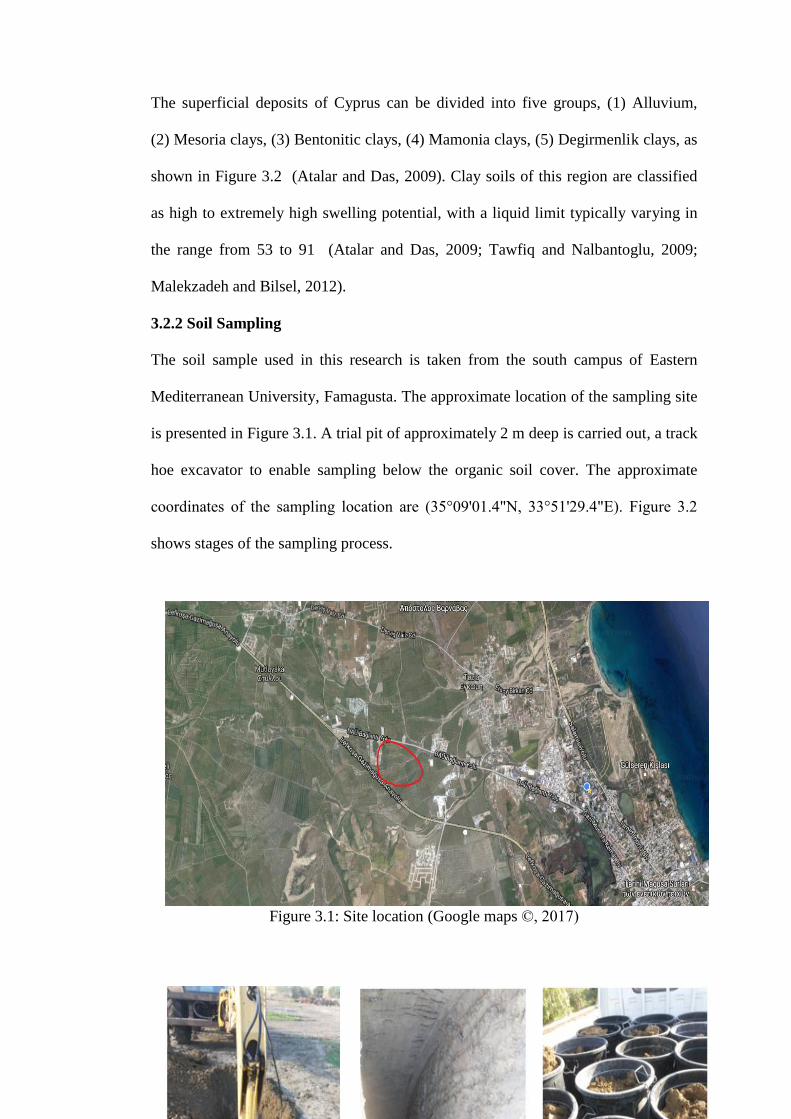
3.2.2 Soil Sampling
The soil sample used in this research is taken from the south campus of Eastern
Mediterranean University, Famagusta. The approximate location of the sampling site
is presented in Figure 3.1. A trial pit of approximately 2 m deep is carried out, a track
hoe excavator to enable sampling below the organic soil cover. The approximate
coordinates of the sampling location are (35°09'01.4"N, 33°51'29.4"E). Figure 3.2
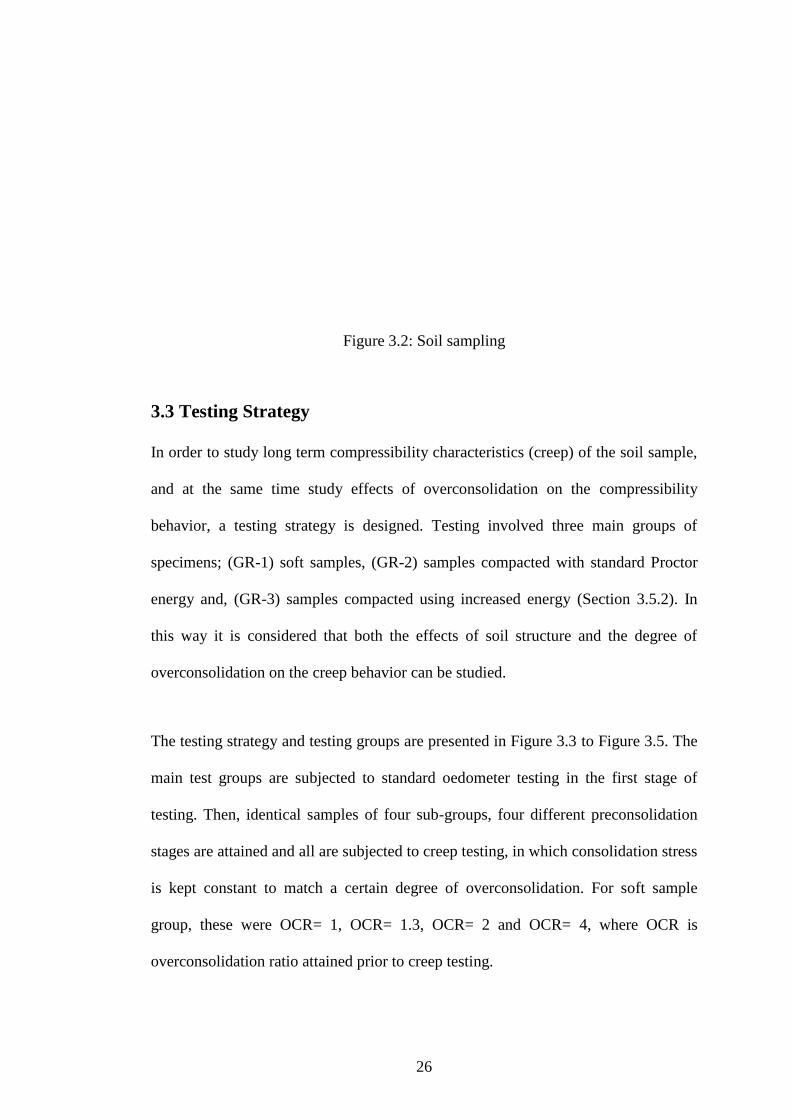
shows stages of the sampling process.
Figure 3.1: Site location (Google maps ©, 2017)
26
Figure 3.2: Soil sampling
3.3 Testing Strategy
In order to study long term compressibility characteristics (creep) of the soil sample,
and at the same time study effects of overconsolidation on the compressibility
behavior, a testing strategy is designed. Testing involved three main groups of
specimens; (GR-1) soft samples, (GR-2) samples compacted with standard Proctor
energy and, (GR-3) samples compacted using increased energy (Section 3.5.2). In
this way it is considered that both the effects of soil structure and the degree of
overconsolidation on the creep behavior can be studied.
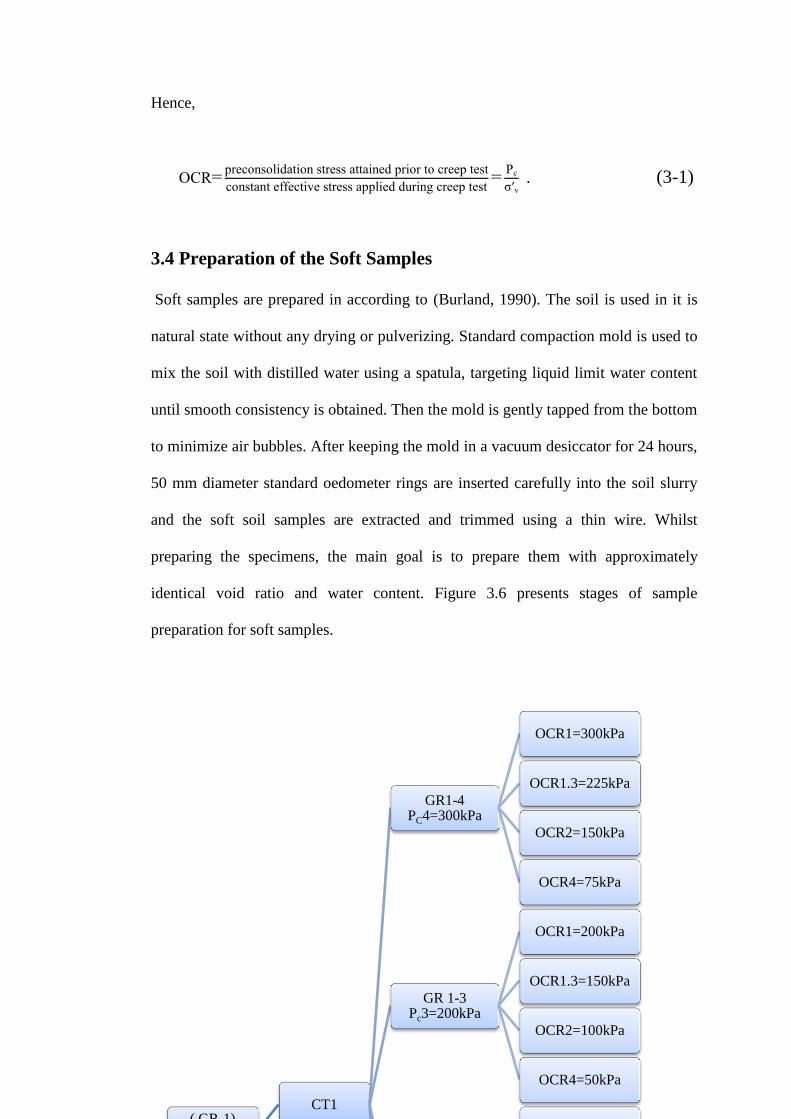
The testing strategy and testing groups are presented in Figure 3.3 to Figure 3.5. The
main test groups are subjected to standard oedometer testing in the first stage of
testing. Then, identical samples of four sub-groups, four different preconsolidation
stages are attained and all are subjected to creep testing, in which consolidation stress
is kept constant to match a certain degree of overconsolidation. For soft sample
group, these were OCR= 1, OCR= 1.3, OCR= 2 and OCR= 4, where OCR is
overconsolidation ratio attained prior to creep testing.
27
( GR-1)
Soft sample
CT1
GR1-4 PC4=300kPa
OCR1=300kPa
OCR1.3=225kPa
OCR2=150kPa
OCR4=75kPa
GR 1-3 Pc3=200kPa
OCR1=200kPa
OCR1.3=150kPa
OCR2=100kPa
OCR4=50kPa
GR 1-2 PC2=100kPa
OCR1=100kPa
OCR1.3=75kPa
OCR2=50kPa
OCR4=25kPa
GR 1-1 PC1=50kPa
OCR1=50kPa
OCR1.3=37.5kPa
OCR2=25kPa
OCR4=12.5kPa
SOT1
Hence,
OCR=preconsolidation stress attained prior to creep test
constant effective stress applied during creep test=
Pc
σʹv . (3-1)
3.4 Preparation of the Soft Samples
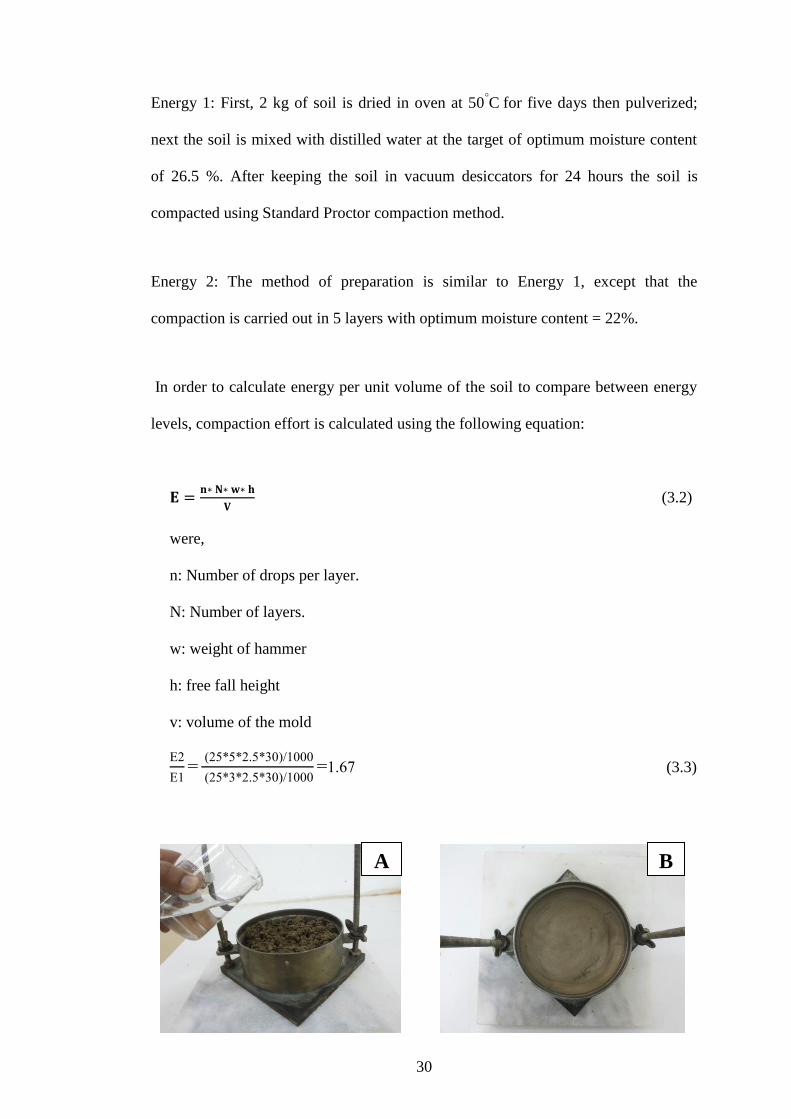
Soft samples are prepared in according to (Burland, 1990). The soil is used in it is
natural state without any drying or pulverizing. Standard compaction mold is used to
mix the soil with distilled water using a spatula, targeting liquid limit water content
until smooth consistency is obtained. Then the mold is gently tapped from the bottom
to minimize air bubbles. After keeping the mold in a vacuum desiccator for 24 hours,
50 mm diameter standard oedometer rings are inserted carefully into the soil slurry
and the soft soil samples are extracted and trimmed using a thin wire. Whilst
preparing the specimens, the main goal is to prepare them with approximately
identical void ratio and water content. Figure 3.6 presents stages of sample
preparation for soft samples.
28
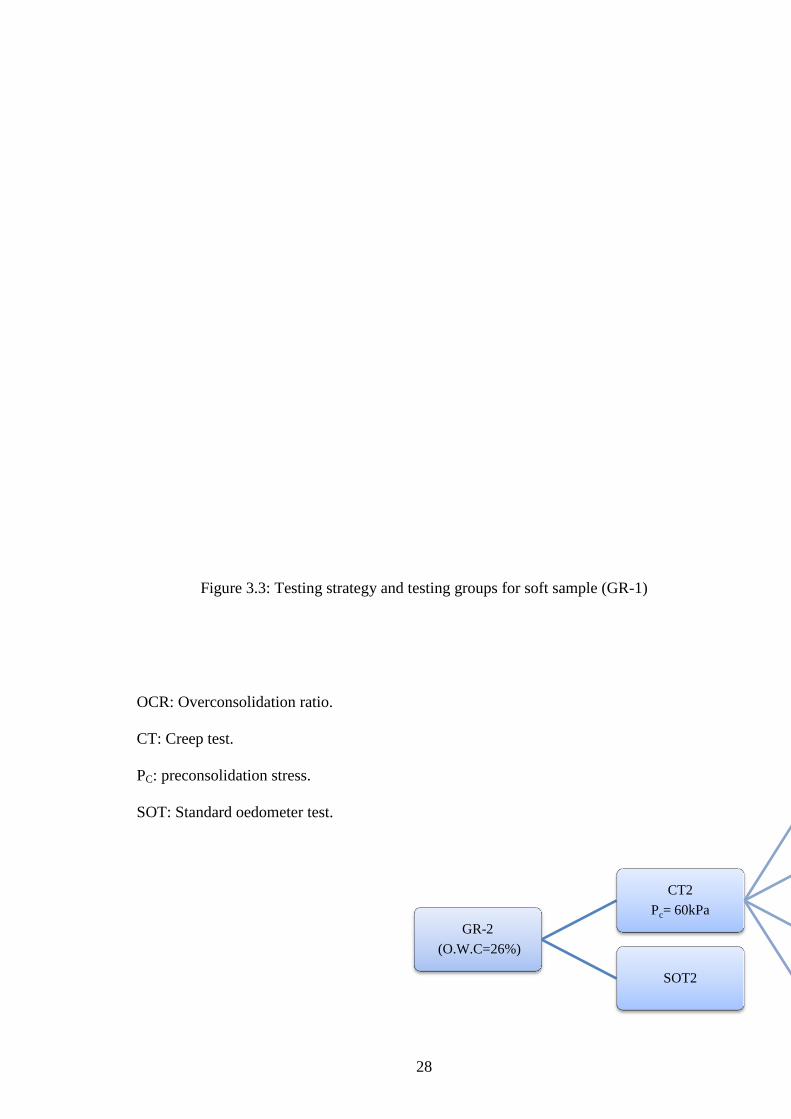
Figure 3.3: Testing strategy and testing groups for soft sample (GR-1)
GR-2
(O.W.C=26%)
CT2
Pc= 60kPa
OCR4=15kPa
OCR2=30kPa
OCR1.3=45kPa
OCR1=60kPa
SOT2
OCR: Overconsolidation ratio.
CT: Creep test.
PC: preconsolidation stress.
SOT: Standard oedometer test.
29
Figure 3.4: Testing strategy and testing groups of samples compacted using standard
Proctor energy (GR-2)
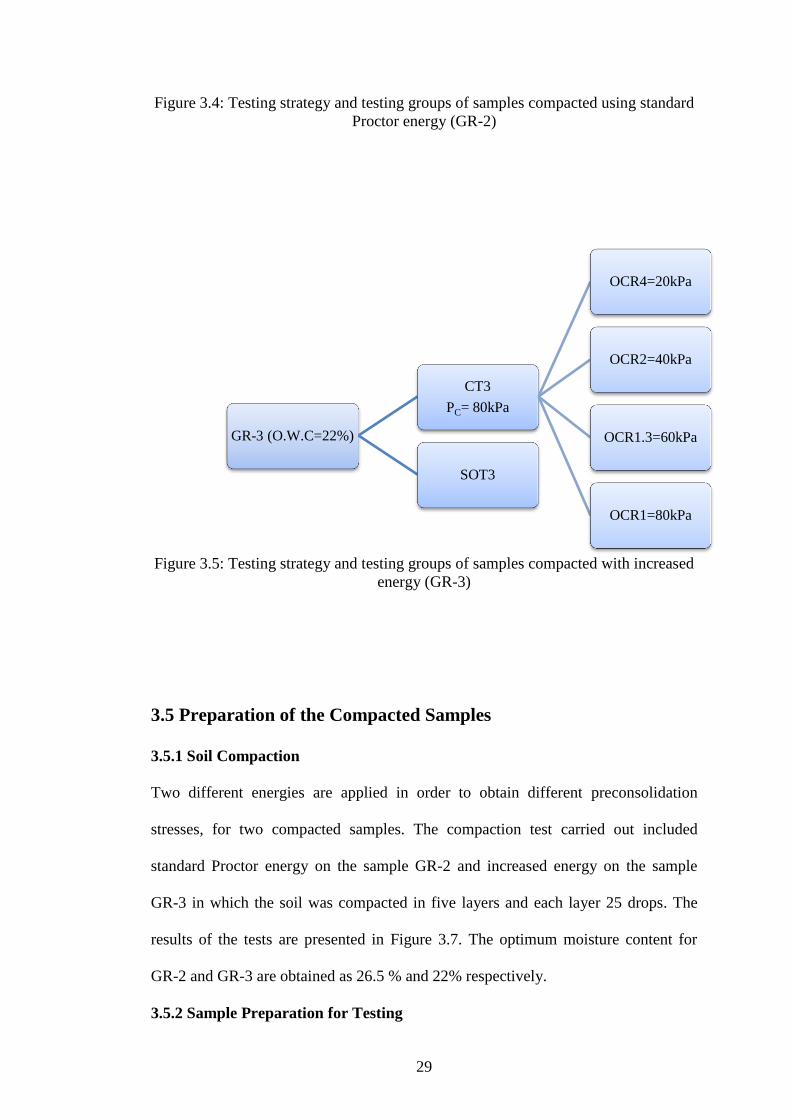
Figure 3.5: Testing strategy and testing groups of samples compacted with increased
energy (GR-3)
3.5 Preparation of the Compacted Samples
3.5.1 Soil Compaction
Two different energies are applied in order to obtain different preconsolidation
stresses, for two compacted samples. The compaction test carried out included
standard Proctor energy on the sample GR-2 and increased energy on the sample
GR-3 in which the soil was compacted in five layers and each layer 25 drops. The
results of the tests are presented in Figure 3.7. The optimum moisture content for
GR-2 and GR-3 are obtained as 26.5 % and 22% respectively.
3.5.2 Sample Preparation for Testing
GR-3 (O.W.C=22%)
CT3
PC= 80kPa
OCR4=20kPa
OCR2=40kPa
OCR1.3=60kPa
OCR1=80kPa
SOT3
30
Energy 1: First, 2 kg of soil is dried in oven at 50°C for five days then pulverized;
next the soil is mixed with distilled water at the target of optimum moisture content
of 26.5 %. After keeping the soil in vacuum desiccators for 24 hours the soil is
compacted using Standard Proctor compaction method.
Energy 2: The method of preparation is similar to Energy 1, except that the
compaction is carried out in 5 layers with optimum moisture content = 22%.
In order to calculate energy per unit volume of the soil to compare between energy
levels, compaction effort is calculated using the following equation:
𝐄 =𝐧∗ 𝐍∗ 𝐰∗ 𝐡
𝐕 (3.2)
were,
n: Number of drops per layer.
N: Number of layers.
w: weight of hammer
h: free fall height
v: volume of the mold
E2
E1=
(25*5*2.5*30)/1000
(25*3*2.5*30)/1000=1.67 (3.3)
A B
31
Figure 3.6: Stages of sample preparation for soft samples
1.10
1.20
1.30
1.40
1.50
1.60
1.70
1.80
15 20 25 30 35
Dry
Den
sity
(g
/cm
3)
Water content, wc (%)
GR-2
GR-3
C D
E F
32
Figure 3.7: Compaction curves for GR-2 and GR-3
3.6 Testing Methods
3.6.1 Standard Oedometer Test, SOT
All tests are carried out by using fixed ring oedometer cell. The initial moisture
content is measured as well as final moisture content after the test. The compression
and swell are measured by a digital dial gauge using computer programme called
DS7 ©2017. This programme is used to record and save the data to a computer in
digital format, and manage the testing procedure such as starting and finishing test
stages, observing strain- log time curve during the test and monitoring the end of
primary consolidation. Immediately after starting the test, distilled water is added to
saturate the specimen, after the end of the saturation stage, the loading sequence
maintained by applying the following effective stresses in stages of 24 hr (25, 50,
100, 200, 400, 200, 100 and 50 kPa) for soft samples (GR-1).The loading sequences
for compacted samples were (25, 50, 100, 200, 400, 800, 400, 200 and 100 kPa.
3.6.2 Creep Test
These test methods cover an experimental investigation of secondary compression
behavior of soft samples prepared at various degree of overconsolidation.
For all samples (GR-1) the target preconsolidation stress prior to creep test is attained
using static load in the oedometer. In creep test, the samples are saturated under the
weight of the loading cap, then preconsolidation stress is applied in once for stresses
up to 100 kPa. The preconsolidation stress for greater stresses (200 kPa and 300 kPa)
applied in two steps for soft samples, the reason for that is due to that the soil
specimens were flowing out of the oedometer cell. After applying preconsolidation
33
stress the specimens are unloaded for a period 24 hours prior to loading for creep
stress.
The compacted samples (GR-2, GR-3) are subjected to dynamic load using standard
compaction hammer to apply the preconsolidation stress, hence, the value of
preconsolidation stress is calculated from standard oedometer test and then four
identical samples are prepared and subjected to an initial preconsolidation stress by
also considering the calculation value that obtained from standard oedometer test.
The specimens are also allowed for saturation until the end of primary swell is
observed and then to calculate preconsolidation stress and the additional stress
required to achieve the target OCR is loaded for creep stress.
3.7 Results of Index and Classification Tests
3.7.1. Initial Moisture Content
The in situ moisture content of the clay is measured in the laboratory as 33%.
3.7.2 Particle Size Distribution
Samples are first subjected to wet sieving to evaluate percent passing #200 (75 µm),
the percent finer is measured as 97.4%. The results of particle size analysis indicated
that the percentage of clay and silt are 54% and 43.4%, respectively, as presented in
Figure 3.8. Hence, based on the particle size distribution test results, the soil sample
is classified as slightly sandy, silty clay.
3.7.3 Specific Gravity
34
The specific gravity tests indicated that the particle density of the soil approximately
2.65.
Figure 3.8: Particle size distribution test result
3.7.4 Plasticity Index
The liquid limit is carried out to determine the water content at which the soil transit
from plastic state to liquid state. The plastic limit test is carried out to obtain the
lowest water content at which the soil is plastic. Two main sample preparation
methods are examined as follows:
Natural state method: The soil used in it is natural state without any drying or
pulverizing. First, 350 g of soil is mixed with distilled water until the soil worked to
a smooth paste then the slurry is placed into a vacuum desiccator for 24 hours. The
0
10
20
30
40
50
60
70
80
90
100
0.0001 0.001 0.01 0.1 1
Per
cen
t S
ma
ller
(%
)
Particle Diameter (mm)
Sample 1
Sample 2
Sample 3
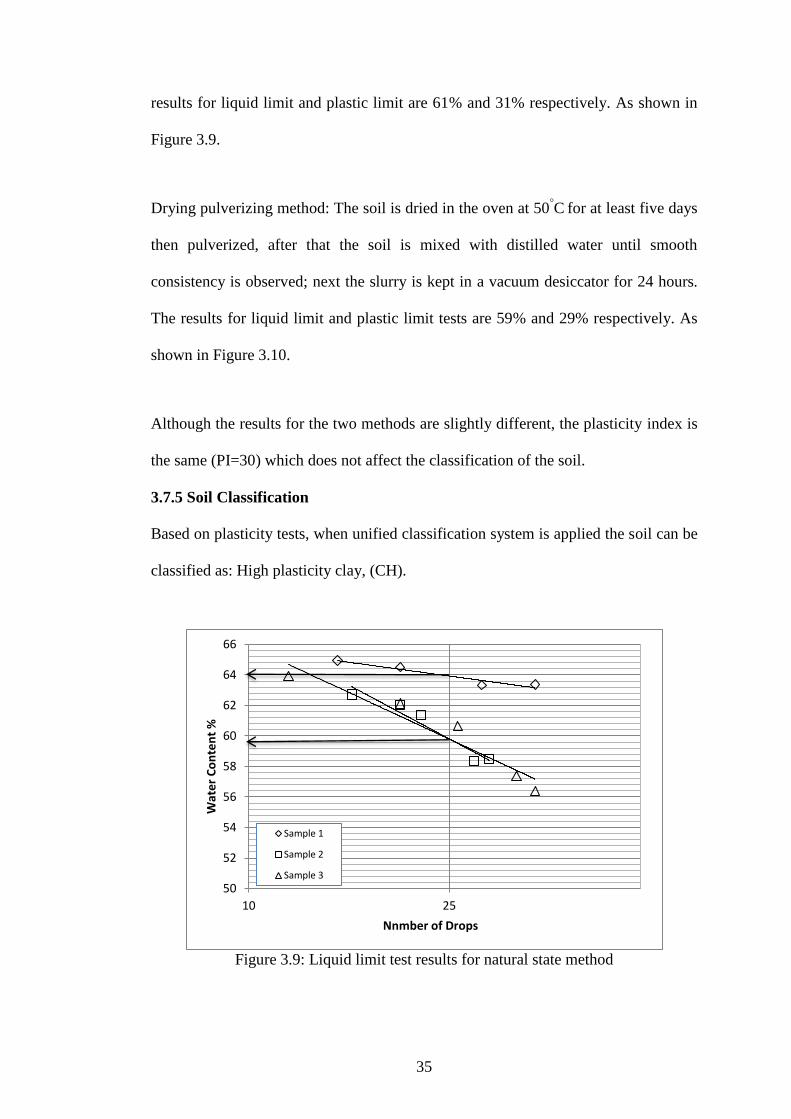
35
results for liquid limit and plastic limit are 61% and 31% respectively. As shown in
Figure 3.9.
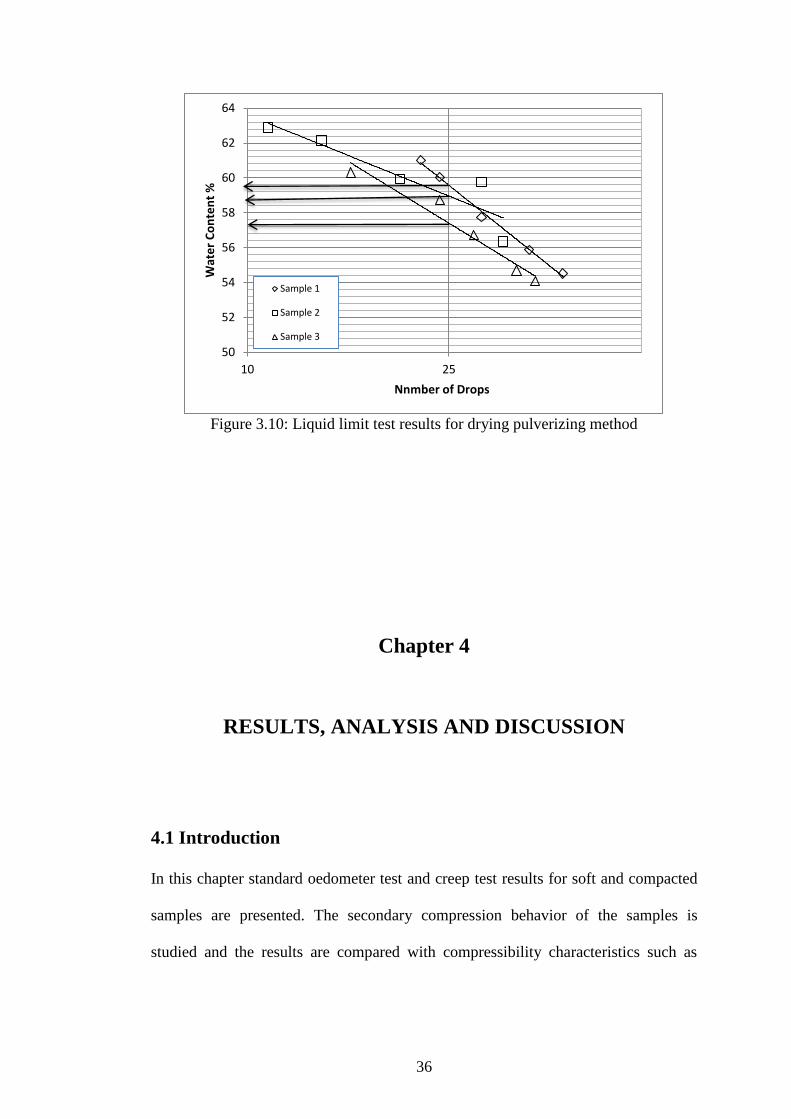
Drying pulverizing method: The soil is dried in the oven at 50°C
for at least five days
then pulverized, after that the soil is mixed with distilled water until smooth
consistency is observed; next the slurry is kept in a vacuum desiccator for 24 hours.
The results for liquid limit and plastic limit tests are 59% and 29% respectively. As
shown in Figure 3.10.
Although the results for the two methods are slightly different, the plasticity index is
the same (PI=30) which does not affect the classification of the soil.
3.7.5 Soil Classification
Based on plasticity tests, when unified classification system is applied the soil can be
classified as: High plasticity clay, (CH).
Figure 3.9: Liquid limit test results for natural state method
50
52
54
56
58
60
62
64
66
10 25
Wat
er
Co
nte
nt
%
Nnmber of Drops
Sample 1
Sample 2
Sample 3
36
Figure 3.10: Liquid limit test results for drying pulverizing method
Chapter 4
RESULTS, ANALYSIS AND DISCUSSION
4.1 Introduction
In this chapter standard oedometer test and creep test results for soft and compacted
samples are presented. The secondary compression behavior of the samples is
studied and the results are compared with compressibility characteristics such as
50
52
54
56
58
60
62
64
10 25
Wat
er
Co
nte
nt
%
Nnmber of Drops
Sample 1
Sample 2
Sample 3
37
compression index, recompression index, Cr. Furthermore, the test results are
compared with the results of the previous studies in the literature.
4.2 Analysis of Compressibility Behavior Using Standard Oedometer
Tests
4.2.1 Compression Curves at Each Test Stage
Standard oedometer test was conducted on soft samples and compacted samples. In
order to analyze compressibility characteristics, the curves of vertical strain
corresponding to the time in logarithmic scale for soft and compacted samples (GR-
1, GR-2 and GR-3) are plotted in Figure 4.1 to Figure 4.3.For each test stage the time
readings are reset, so that they can be compared to each other on equal grounds.
Initial void ratios of the soft and compacted samples are calculated as 1.59, 0.66 and
0.56 respectively. The soft sample GR-1 has the highest void ratio and the lowest
initial void ratio is obtained for the sample prepared with highest compaction energy
(GR-3).
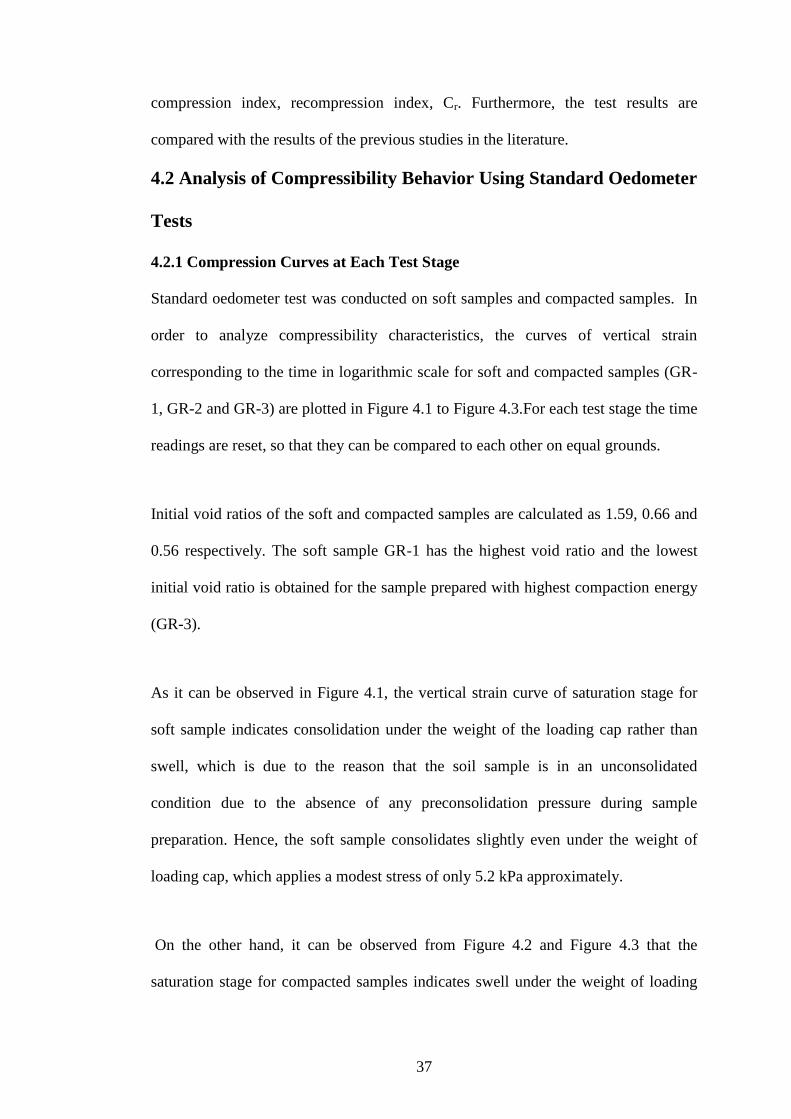
As it can be observed in Figure 4.1, the vertical strain curve of saturation stage for
soft sample indicates consolidation under the weight of the loading cap rather than
swell, which is due to the reason that the soil sample is in an unconsolidated
condition due to the absence of any preconsolidation pressure during sample
preparation. Hence, the soft sample consolidates slightly even under the weight of
loading cap, which applies a modest stress of only 5.2 kPa approximately.
On the other hand, it can be observed from Figure 4.2 and Figure 4.3 that the
saturation stage for compacted samples indicates swell under the weight of loading
38
cap. The vertical strain curve of GR-2 sample indicates lower swell than GR-3
sample. This can be attributed to the fact that GR-2 and GR-3 samples have
experienced an initial preconsolidation stress during sample preparation due to
applied compaction energy.
In Figure 4.1, the loading curves for soft sample indicate that the maximum
compression in the sample is attained in the 25 kPa load increment, which is
approximately twice the compression observed in the proceeding load increments 50
kPa, 100 kPa, 200 kPa and 400 kPa.
The vertical strain observed in the rebound curves in unloading stages indicates that
the greater the unloading stress the greater the rebound strain will be.
Figure 4.1: Compressibility curves from standard oedometer test, GR-1
-0.1
-0.08
-0.06
-0.04
-0.02
0
0.02
0.1 1 10 100 1000
Ver
tica
l S
tra
in
Time in the log scale, t (min)
Saturation
25 kPa
50 kPa
100 kPa
200 kPa
400 kPa
Unloading 200 kPa
Unloading 100 kPa
Unloading 50 kPa
+εv,
Swell
-εv,
Compression
39
Figure 4.2: Compressibility curves from standard oedometer test, GR-2
Figure 4.3: Compressibility curves from standard oedometer test, GR-3
4.2.2 Comparison of Compressibility Curves
In Figure 4.4 compressibility curves for soft and compacted samples GR-1, GR-2
and GR-3. The compression curve for soft sample varies linearly in semi-log scale
for loading stages; this is considered to be typical of virgin compression behavior due
to lack of any pre-stress during sample preparation. However, there is a hump in the
-0.04
-0.03
-0.02
-0.01
0
0.01
0.02
0.03
0.04
0.05
0.1 1 10 100 1000
Ver
tica
l S
tra
in
Time in the log scale, t (min)
Saturation
25 kPa
50 kPa
100 kPa
200 kPa
400 kPa
800 kPa
Unloading 400 kpa
Unloading 200 kPa
Unloading 100 kPa
-εv,
Compression
+εv,
Swell
-0.04
-0.03
-0.02
-0.01
0
0.01
0.02
0.03
0.04
0.05
0.1 1 10 100 1000
Ver
tica
l S
tra
in
Time in the log scale, t (min)
Saturation
25 kPa
50 kPa
100 kPa
200 kPa
400 kPa
800 kPa
Unloading 400 kPa
Unloading 200 kPa
Unloading 100 kPa
+εv,
Swell
-εv,
Compression

40
initial part of the compression curves of compacted samples, due to the initial pre-
stress induced on the samples during compaction, which might have created
preconsolidation in the samples. Therefore, during initial stages of load increments,
until this preconsolidation is attained, there is an enhanced resistance in the samples
of GR-2 and GR-3 against compression compared to soft sample (GR-1).
The compression curve for soft sample GR-1 shows a greater decrease in void ratio,
from 1.58 to 0.93 than compacted samples; void ratios for standard energy GR-2
decreased from about 0.66 to 0.48 and for increased energy GR-3 void ratio reduced
from 0.59 to 0.42. In addition, the compression index of the soft sample is 0.4
significantly greater than the compression index for compacted samples (were Cc for
GR-2 is 0.12 and for Cc for GR-3 is 0.11). The recompression index for GR-3 is the
highest slope observed within all samples with Cr= 0.0028, followed by
recompression index of GR-2 with Cr=0.0018, and for GR-1 recompression index is
obtained as Cr= 0.0012. It can be concluded that the recompression index is directly
proportional with the compaction energy applied on the sample during sample
preparation. The preconsolidation stress is calculated from (e – log σʹv) curve based
on Casagrande's method (Head, 1986); for sample subjected to standard energy, GR-
2, the preconsolidation stress is found Pc= 60 kPa, and for increased energy, GR-3, it
is found as Pc= 80 kPa.

41
Figure 4.4: Standard oedometer compressibility curves for soft and compacted
samples
4.2.3 Analysis of Secondary Compression Behavior Using Standard Oedometer
Tests
Figure 4.5 to Figure 4.7 show creep curves obtained from standard oedometer tests
for GR-1, GR-2, and GR-3 respectively. After identifying the time corresponding to
the end of primary consolidation, the vertical strain versus time data for secondary
compression behavior is separated from the primary consolidation curve by resetting
the time corresponding to the start of creep as zero. The creep curves for GR-1, GR-
2, and GR-3 all indicate an approximately linear trend with log time for all load
increments.
0.40
0.60
0.80
1.00
1.20
1.40
1.60
1 10 100 1000
Vo
id R
ati
o
Vertical effective stress (kPa)
GR-1
GR-2
GR-3
inflection point almost
absent for soft sample

42
It is also observed from the creep curves that, as the effective stress load increased a
greater creep strain is obtained for compacted samples of GR-2, and GR-3, with
greater creep corresponding to normally consolidated behavior (σʹv>Pc).
In Table 4.1 the results of coefficient of secondary compression corresponding to
each load stage for soft and compacted samples and also the time corresponding to
the end of primary consolidation, tp for each load stage are presented. From Table
4.1, it is observed that the coefficient of secondary compression is directly
proportional with the time corresponding to the end of primary consolidation for all
loading stages.
Figure 4.5: Creep curves from standard oedometer test for, GR-1
-0.013
-0.011
-0.009
-0.007
-0.005
-0.003
-0.001
0.001
10 100 1000
Ver
tica
l S
tra
in
Time in the log scale, t (min)
Creep 25 kPa
Creep 50 kPa
Creep 100 kPa
Creep 200 kPa
Creep 400 kPa
-εv,
Compression
43
Figure 4.6: Creep curves from standard oedometer test for, GR-2
Figure 4.7: Creep curves from standard oedometer test for, GR-3
In Figure 4.8 the relationship between the coefficient of secondary compression and
the time corresponding to the end of primary consolidation is presented. In general,
the coefficient of secondary compression for soft sample GR-1, is measured to be
-0.005
-0.004
-0.003
-0.002
-0.001
0
10 100 1000
Ver
tica
l S
tra
in
Time in the log scale, t (min)
Creep 25 kPa
Creep 50 kPa
Creep 100 kPa
Creep 200 kPa
Creep 400 kPa
Creep 800 kPa
-εv,
Compression
-0.005
-0.004
-0.003
-0.002
-0.001
0
10 100 1000
Ver
tica
l S
tra
in
Time in the log scale, t (min)
Creep 25 kPa
Creep 50 kPa
Creep 100 kPa
Creep 200 kPa
Creep 400 kPa
Creep 800 kPa
-εv,
Compression

44
greater to the measurements for the compacted samples for all load increments. The
time corresponding to the end of primary consolidation for soft sample GR-1 was
lower in most of the loading stages compared to measurements for compacted
samples. The results of coefficient of secondary compression and the time
corresponding to the end of primary consolidation were similar for GR-2 and GR-3,
as well as the trends observed.
Table 4.1: Coefficient of secondary compression for soft and compacted samples
from standard oedometer tests
Soft sample
GR-1
Compacted
sample GR-2
Compacted
sample GR-2
σʹv
(kPa)
Cα tp
(min)
Cα tp
(min)
Cα tp
(min)
25 0.0042 140 0.0010 100 0.0004 120
50 0.0056 160 0.0013 180 0.0014 150
100 0.0045 110 0.0024 220 0.0017 180
200 0.0042 110 0.0031 220 0.0034 200
400 0.0031 80 0.0028 200 0.0028 180
800 - - 0.0028 180 0.0028 170
45
Figure 4.8: Variation of Cα with tp (min)
Figure 4.9 presents the relationship between the vertical effective stress and the
coefficient of secondary compression. It can be observed that the coefficient of
secondary compression for soft sample increased from 25 kPa to 50 kPa then
gradually decreased with increasing vertical effective stress. On the other hand, the
coefficient of secondary compression for compacted samples have similar
characteristics, they both increased with increasing vertical effective stress until
reaching a peak value around 200 kPa. Then, it decreased and remained constant in
the following load increments. The maximum values of the coefficient of secondary
compression for compacted samples occur at effective stress about 2.5 times the
preconsolidation stress. Similar results for compacted samples were also observed by
(Miao and Kavazanjian, 2007) and (Matchala et al., 2008).
0
0.001
0.002
0.003
0.004
0.005
0.006
50 100 150 200 250
Cα
tp (min)
GR-1
GR-2
GR-3
46
Figure 4.9: Variation of Cα with vertical effective stress in standard oedometer tests
4.3 Analysis of Secondary Compression Behavior Using Creep Tests
4.3.1 Assessment of Vertical Strain Curves for Soft Samples
As stated in Chapter 3, there are four sub-groups of soft sample and each sub-group
contains four samples which are subjected to the same preconsolidation stress. The
data regarding test stages prior to the application of constant effective stress creep
tests are plotted in Figure 4.10 to Figure 4.13. These identically prepared and
preconsolidated samples are then tested in creep tests under a sustained effective
stress to evaluate secondary compression behavior at various overconsolidation
ratios; OCR= 1, 1.3, 2, and 4. In this study, the variation of secondary compression
behavior with respect to the impact of degree of overconsolidation is also considered.
It can be seen in Figure 4.10 to Figure 4.13 that, the vertical strain curves of
saturation and preconsolidation and unloading stages for all samples are almost
identical. It is noted that when higher preconsolidation stress is applied, the vertical
strain upon unloading is also increased. The relationship observed between
0
0.001
0.002
0.003
0.004
0.005
0.006
0 100 200 300 400 500 600 700 800 900
Cα
Vertical effective stress (kPa)
GR-1
GR-2
GR-3
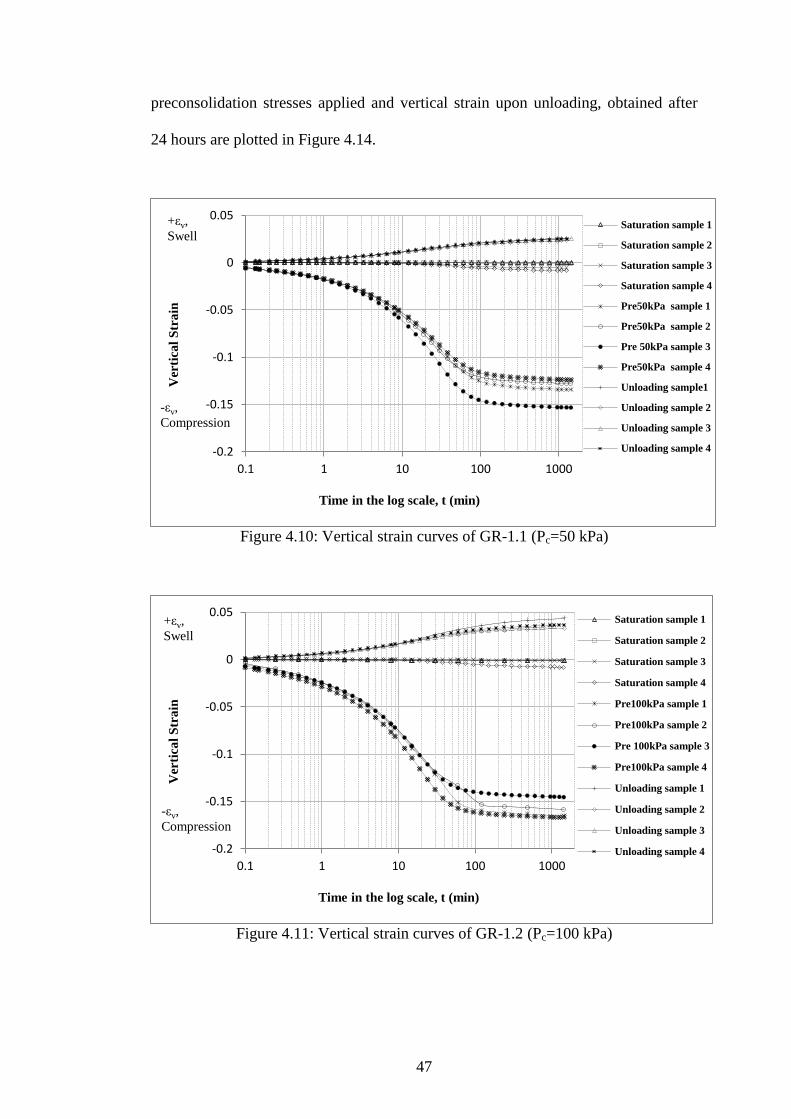
47
preconsolidation stresses applied and vertical strain upon unloading, obtained after
24 hours are plotted in Figure 4.14.
Figure 4.10: Vertical strain curves of GR-1.1 (Pc=50 kPa)
Figure 4.11: Vertical strain curves of GR-1.2 (Pc=100 kPa)
-0.2
-0.15
-0.1
-0.05
0
0.05
0.1 1 10 100 1000
Ver
tica
l S
tra
in
Time in the log scale, t (min)
Saturation sample 1
Saturation sample 2
Saturation sample 3
Saturation sample 4
Pre50kPa sample 1
Pre50kPa sample 2
Pre 50kPa sample 3
Pre50kPa sample 4
Unloading sample1
Unloading sample 2
Unloading sample 3
Unloading sample 4
+εv,
Swell
-εv,
Compression
-0.2
-0.15
-0.1
-0.05
0
0.05
0.1 1 10 100 1000
Ver
tica
l S
tra
in
Time in the log scale, t (min)
Saturation sample 1
Saturation sample 2
Saturation sample 3
Saturation sample 4
Pre100kPa sample 1
Pre100kPa sample 2
Pre 100kPa sample 3
Pre100kPa sample 4
Unloading sample 1
Unloading sample 2
Unloading sample 3
Unloading sample 4
+εv,
Swell
-εv,
Compression
48
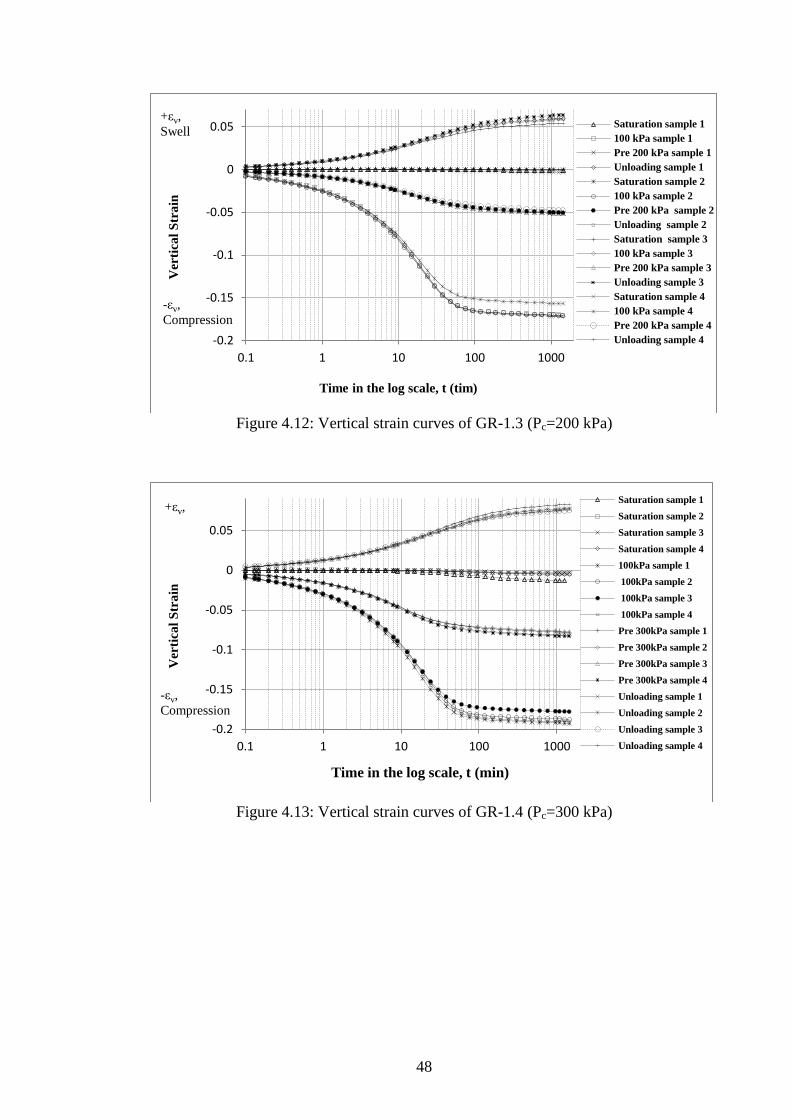
Figure 4.12: Vertical strain curves of GR-1.3 (Pc=200 kPa)
Figure 4.13: Vertical strain curves of GR-1.4 (Pc=300 kPa)
-0.2
-0.15
-0.1
-0.05
0
0.05
0.1 1 10 100 1000
Ver
tica
l S
tra
in
Time in the log scale, t (tim)
Saturation sample 1
100 kPa sample 1
Pre 200 kPa sample 1
Unloading sample 1
Saturation sample 2
100 kPa sample 2
Pre 200 kPa sample 2
Unloading sample 2
Saturation sample 3
100 kPa sample 3
Pre 200 kPa sample 3
Unloading sample 3
Saturation sample 4
100 kPa sample 4
Pre 200 kPa sample 4
Unloading sample 4
+εv,
Swell
-εv,
Compression
-0.2
-0.15
-0.1
-0.05
0
0.05
0.1 1 10 100 1000
Ver
tica
l S
tra
in
Saturation sample 1
Saturation sample 2
Saturation sample 3
Saturation sample 4
100kPa sample 1
100kPa sample 2
100kPa sample 3
100kPa sample 4
Pre 300kPa sample 1
Pre 300kPa sample 2
Pre 300kPa sample 3
Pre 300kPa sample 4
Unloading sample 1
Unloading sample 2
Unloading sample 3
Unloading sample 4
-εv,
Compression Time in the log scale, t (min)
+εv,

49
Figure 4.14: The relationship observed between preconsolidation stress and vertical
strain upon unloading, obtained after 24 hours
The creep measured with respect to log time at constant effective stress for GR-1.1,
GR-1.2, GR-1.3 and GR-1.4 are plotted in Figure 4.15 to Figure 4.18. It is observed
that the slope of vertical strain curves are initially greater, and then as time is
increased it gradually decreases. In almost all vertical strain curves for samples with
highest degree of overconsolidation OCR= 4 there is a significant decrease in the
slope such that the curves are almost asymptotic to the time axis hinting completion
of secondary compression.
Vertical strain curves of OCR= 2 attained greater slopes than OCR= 4. Likewise, the
slops of vertical strain curves of OCR= 1.3 are greater than OCR= 2 and the same
relationship obtained between OCR= 2 and OCR= 1. Hence, It can be stated that the
variation of creep with time strongly depends on OCR. This is in a good conformity
with the results observed by (Matchala et al., 2008) and (Luo and Chen, 2014). It
should also be stated that while a limiting creep strain is observable for samples with
higher degree of overconsolidation, this is almost absent for normally consolidated
samples with OCR= 1.
0.02
0.03
0.04
0.05
0.06
0.07
0.08
0 50 100 150 200 250 300 350
Verti
ca
l S
tra
in u
po
n u
nlo
ad
ing
(2
4 h
r)
Preconsolidation stress (kPa)
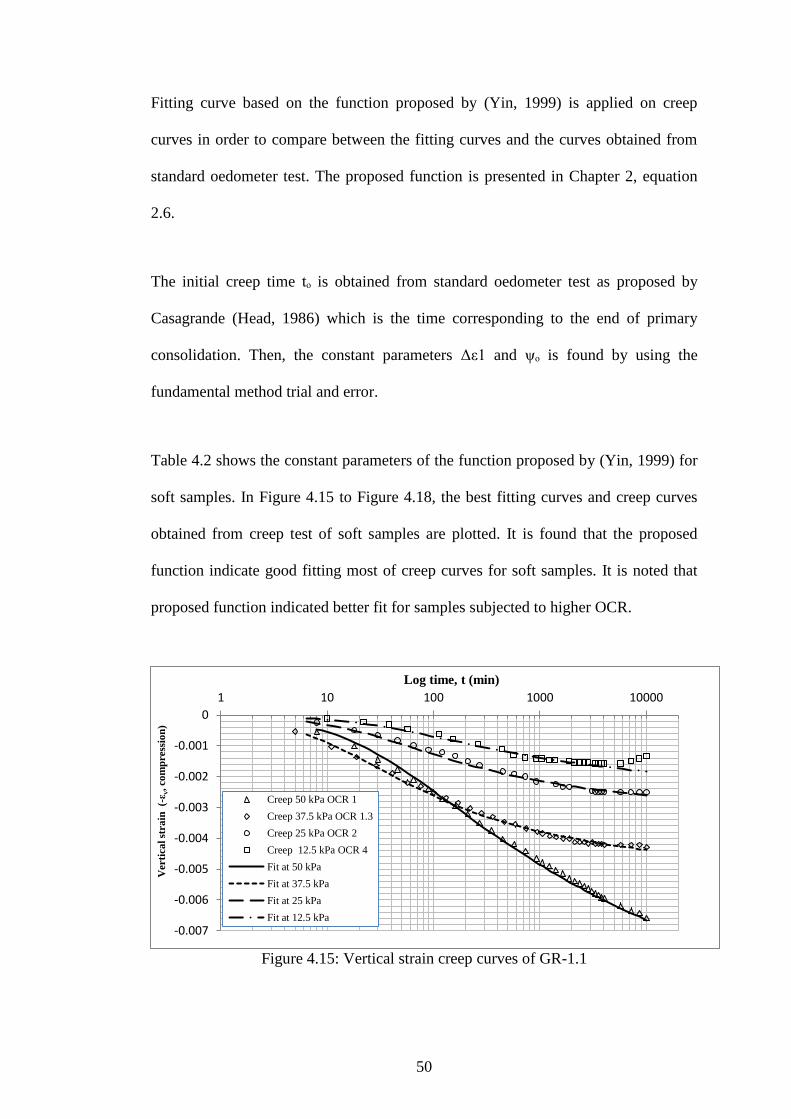
50
Fitting curve based on the function proposed by (Yin, 1999) is applied on creep
curves in order to compare between the fitting curves and the curves obtained from
standard oedometer test. The proposed function is presented in Chapter 2, equation
2.6.
The initial creep time tₒ is obtained from standard oedometer test as proposed by
Casagrande (Head, 1986) which is the time corresponding to the end of primary
consolidation. Then, the constant parameters Δε1 and ψₒ is found by using the
fundamental method trial and error.
Table 4.2 shows the constant parameters of the function proposed by (Yin, 1999) for
soft samples. In Figure 4.15 to Figure 4.18, the best fitting curves and creep curves
obtained from creep test of soft samples are plotted. It is found that the proposed
function indicate good fitting most of creep curves for soft samples. It is noted that
proposed function indicated better fit for samples subjected to higher OCR.
Figure 4.15: Vertical strain creep curves of GR-1.1
-0.007
-0.006
-0.005
-0.004
-0.003
-0.002
-0.001
0
1 10 100 1000 10000
Verti
ca
l st
ra
in (-
ε v, co
mp
ress
ion
)
Log time, t (min)
Creep 50 kPa OCR 1
Creep 37.5 kPa OCR 1.3
Creep 25 kPa OCR 2
Creep 12.5 kPa OCR 4
Fit at 50 kPa
Fit at 37.5 kPa
Fit at 25 kPa
Fit at 12.5 kPa

51
Figure 4.16: Vertical strain creep curves of GR-1.2
Figure 4.17: Vertical strain creep curves of GR-1.3
-0.01
-0.008
-0.006
-0.004
-0.002
0
1 10 100 1000 10000
Verti
ca
l st
ra
in (-
ε v, co
mp
ress
ion
)
Log time, t (min)
Creep 100 kPa OCR1
Creep 75 kPa OCR1.3
Creep50 kPa OCR2
Creep 25 kPa OCR4
Fit at 100 kPa
Fit at 75 kPa
Fit at 50 kPa
Fit at 25 kPa
-0.016
-0.014
-0.012
-0.01
-0.008
-0.006
-0.004
-0.002
0
1 10 100 1000 10000
Verti
ca
l st
ra
in (-
ε v, co
mp
ress
ion
)
Log time, t (min)
Creep 50 kPa OCR4
Creep 100 kPa OCR2
Creep 150 kPa OCR1.3
Creep 200 kPa OCR1
Fit at 50 kPa
Fit at 100 kPa
Fit at 150 kPa
Fit at 200 kPa
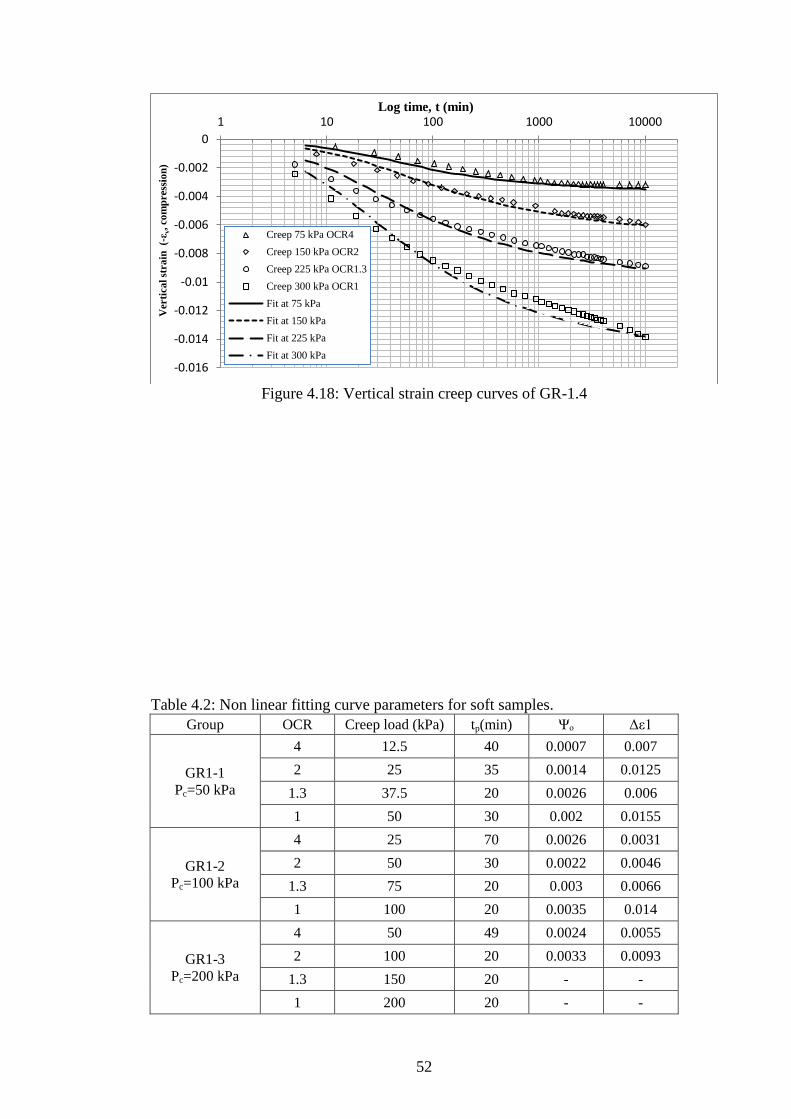
52
Figure 4.18: Vertical strain creep curves of GR-1.4
Table 4.2: Non linear fitting curve parameters for soft samples.
Group OCR Creep load (kPa) tp(min) Ψₒ Δε1
GR1-1
Pc=50 kPa
4 12.5 40 0.0007 0.007
2 25 35 0.0014 0.0125
1.3 37.5 20 0.0026 0.006
1 50 30 0.002 0.0155
GR1-2
Pc=100 kPa
4 25 70 0.0026 0.0031
2 50 30 0.0022 0.0046
1.3 75 20 0.003 0.0066
1 100 20 0.0035 0.014
GR1-3
Pc=200 kPa
4 50 49 0.0024 0.0055
2 100 20 0.0033 0.0093
1.3 150 20 - -
1 200 20 - -
-0.016
-0.014
-0.012
-0.01
-0.008
-0.006
-0.004
-0.002
0
1 10 100 1000 10000
Verti
ca
l st
ra
in (-
ε v, co
mp
ress
ion
)
Log time, t (min)
Creep 75 kPa OCR4
Creep 150 kPa OCR2
Creep 225 kPa OCR1.3
Creep 300 kPa OCR1
Fit at 75 kPa
Fit at 150 kPa
Fit at 225 kPa
Fit at 300 kPa
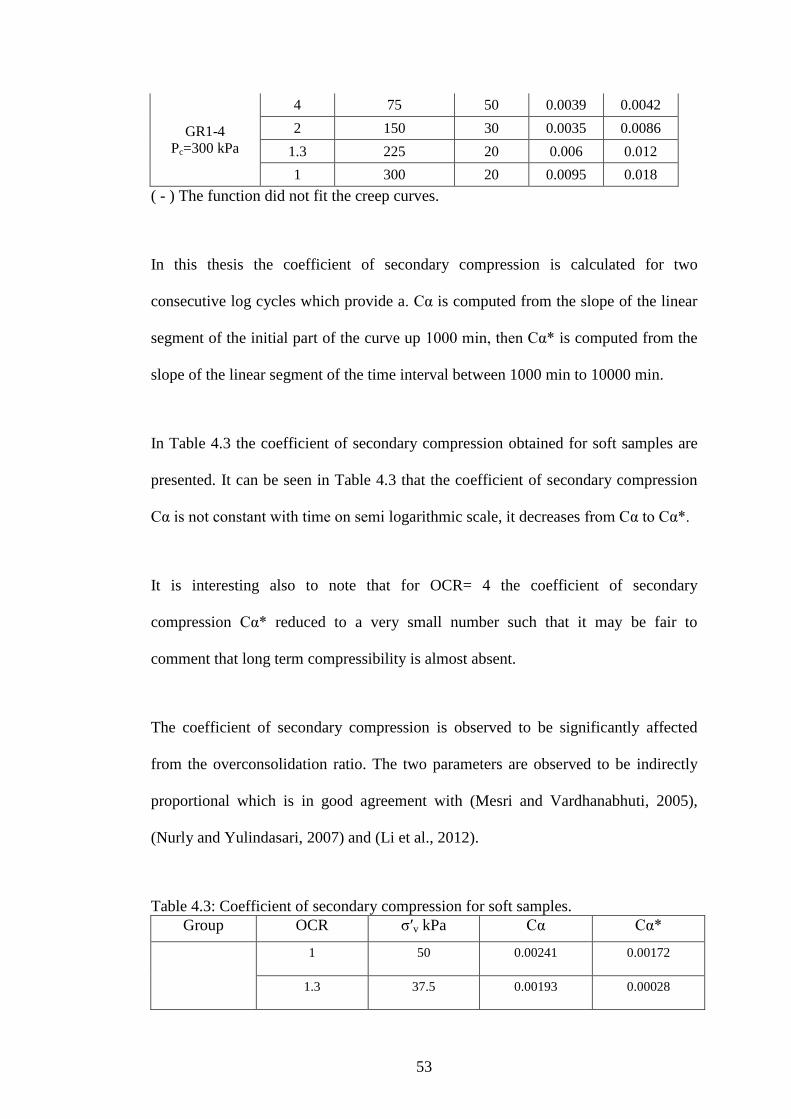
53
GR1-4
Pc=300 kPa
4 75 50 0.0039 0.0042
2 150 30 0.0035 0.0086
1.3 225 20 0.006 0.012
1 300 20 0.0095 0.018
( - ) The function did not fit the creep curves.
In this thesis the coefficient of secondary compression is calculated for two
consecutive log cycles which provide a. Cα is computed from the slope of the linear
segment of the initial part of the curve up 1000 min, then Cα* is computed from the
slope of the linear segment of the time interval between 1000 min to 10000 min.
In Table 4.3 the coefficient of secondary compression obtained for soft samples are
presented. It can be seen in Table 4.3 that the coefficient of secondary compression
Cα is not constant with time on semi logarithmic scale, it decreases from Cα to Cα*.
It is interesting also to note that for OCR= 4 the coefficient of secondary
compression Cα* reduced to a very small number such that it may be fair to
comment that long term compressibility is almost absent.
The coefficient of secondary compression is observed to be significantly affected
from the overconsolidation ratio. The two parameters are observed to be indirectly
proportional which is in good agreement with (Mesri and Vardhanabhuti, 2005),
(Nurly and Yulindasari, 2007) and (Li et al., 2012).
Table 4.3: Coefficient of secondary compression for soft samples.
Group OCR σʹv kPa Cα Cα*
1 50 0.00241 0.00172
1.3 37.5 0.00193 0.00028
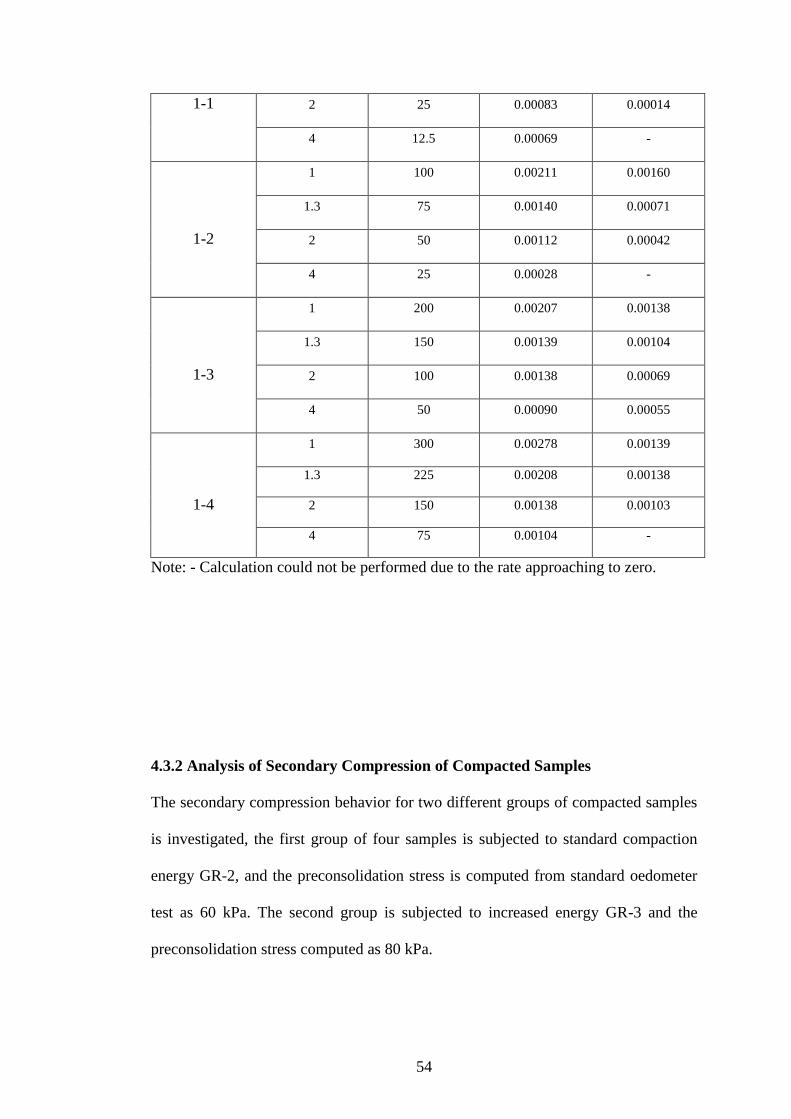
54
1-1 2 25 0.00083 0.00014
4 12.5 0.00069 -
1-2
1 100 0.00211 0.00160
1.3 75 0.00140 0.00071
2 50 0.00112 0.00042
4 25 0.00028 -
1-3
1 200 0.00207 0.00138
1.3 150 0.00139 0.00104
2 100 0.00138 0.00069
4 50 0.00090 0.00055
1-4
1 300 0.00278 0.00139
1.3 225 0.00208 0.00138
2 150 0.00138 0.00103
4 75 0.00104 -
Note: - Calculation could not be performed due to the rate approaching to zero.
4.3.2 Analysis of Secondary Compression of Compacted Samples
The secondary compression behavior for two different groups of compacted samples
is investigated, the first group of four samples is subjected to standard compaction
energy GR-2, and the preconsolidation stress is computed from standard oedometer
test as 60 kPa. The second group is subjected to increased energy GR-3 and the
preconsolidation stress computed as 80 kPa.
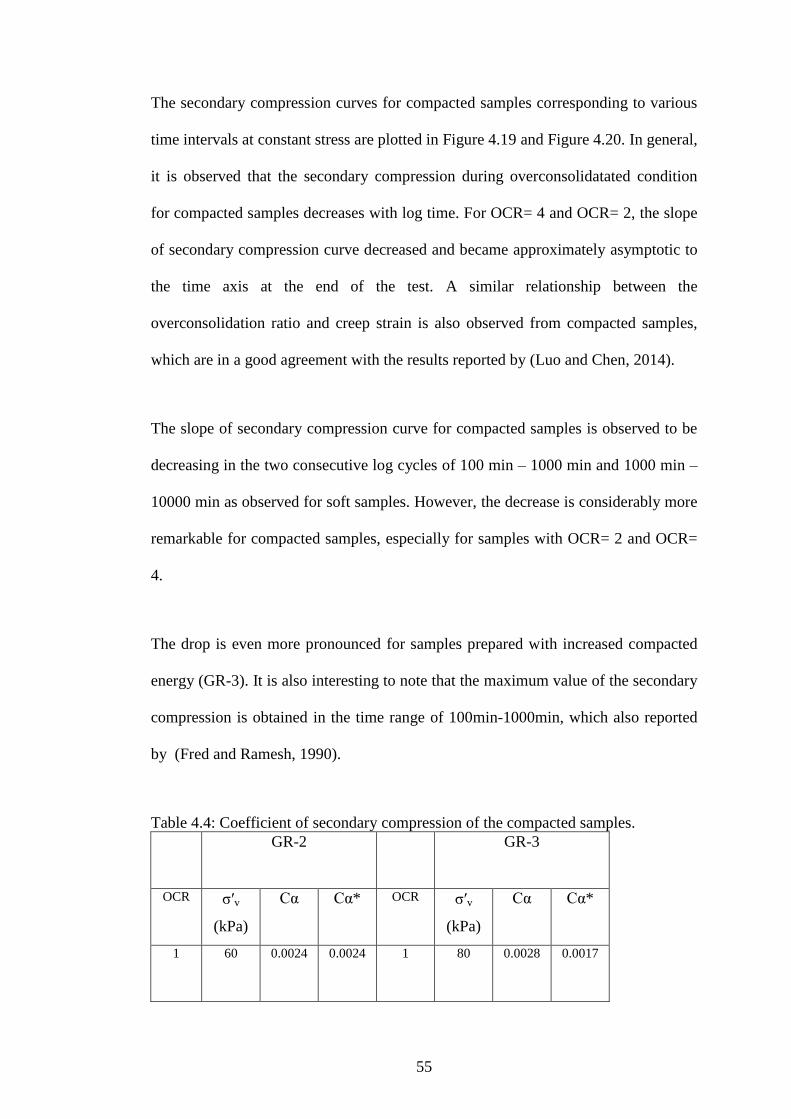
55
The secondary compression curves for compacted samples corresponding to various
time intervals at constant stress are plotted in Figure 4.19 and Figure 4.20. In general,
it is observed that the secondary compression during overconsolidatated condition
for compacted samples decreases with log time. For OCR= 4 and OCR= 2, the slope
of secondary compression curve decreased and became approximately asymptotic to
the time axis at the end of the test. A similar relationship between the
overconsolidation ratio and creep strain is also observed from compacted samples,
which are in a good agreement with the results reported by (Luo and Chen, 2014).
The slope of secondary compression curve for compacted samples is observed to be
decreasing in the two consecutive log cycles of 100 min – 1000 min and 1000 min –
10000 min as observed for soft samples. However, the decrease is considerably more
remarkable for compacted samples, especially for samples with OCR= 2 and OCR=
4.
The drop is even more pronounced for samples prepared with increased compacted
energy (GR-3). It is also interesting to note that the maximum value of the secondary
compression is obtained in the time range of 100min-1000min, which also reported
by (Fred and Ramesh, 1990).
Table 4.4: Coefficient of secondary compression of the compacted samples.
GR-2 GR-3
OCR σʹv
(kPa)
Cα Cα* OCR σʹv
(kPa)
Cα Cα*
1 60 0.0024 0.0024
1 80 0.0028 0.0017
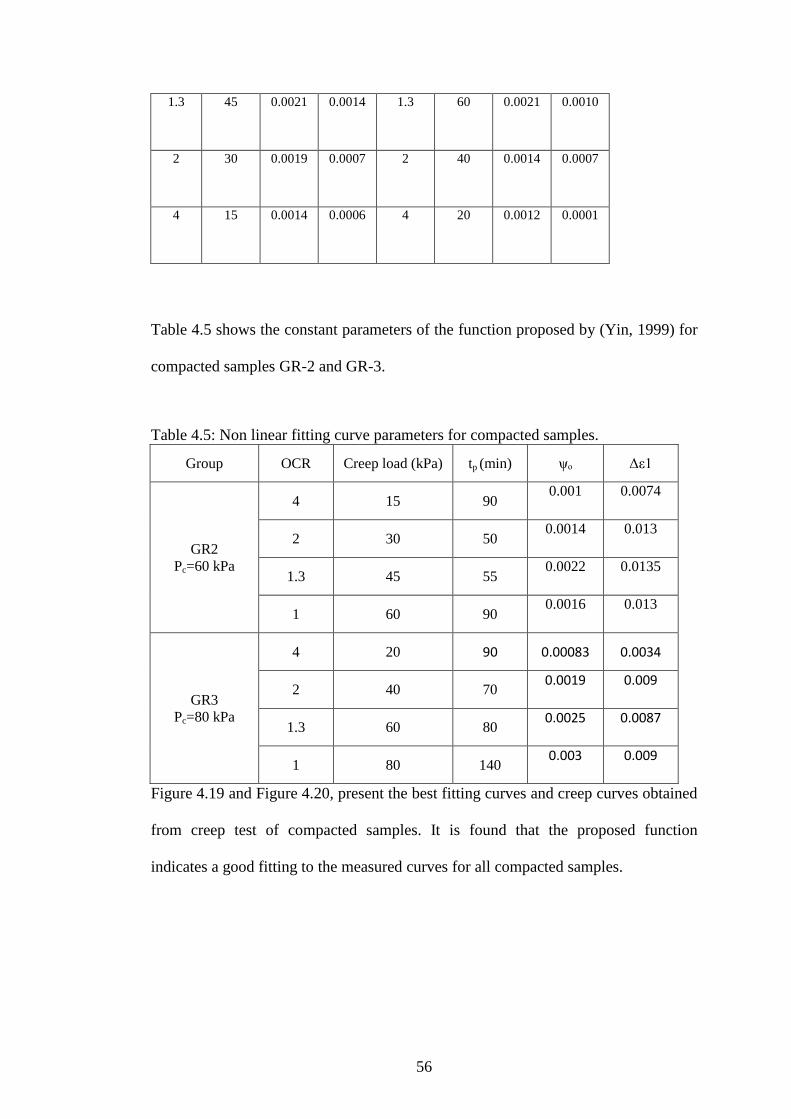
56
1.3 45 0.0021 0.0014
1.3 60 0.0021 0.0010
2 30 0.0019 0.0007
2 40 0.0014 0.0007
4 15 0.0014 0.0006
4 20 0.0012 0.0001
Table 4.5 shows the constant parameters of the function proposed by (Yin, 1999) for
compacted samples GR-2 and GR-3.
Table 4.5: Non linear fitting curve parameters for compacted samples.
Group OCR Creep load (kPa) tp (min) ψₒ Δε1
GR2
Pc=60 kPa
4 15 90 0.001
0.0074
2 30 50 0.0014
0.013
1.3 45 55 0.0022
0.0135
1 60 90 0.0016
0.013
GR3
Pc=80 kPa
4 20 90 0.00083 0.0034
2 40 70 0.0019
0.009
1.3 60 80 0.0025
0.0087
1 80 140 0.003
0.009
Figure 4.19 and Figure 4.20, present the best fitting curves and creep curves obtained
from creep test of compacted samples. It is found that the proposed function
indicates a good fitting to the measured curves for all compacted samples.
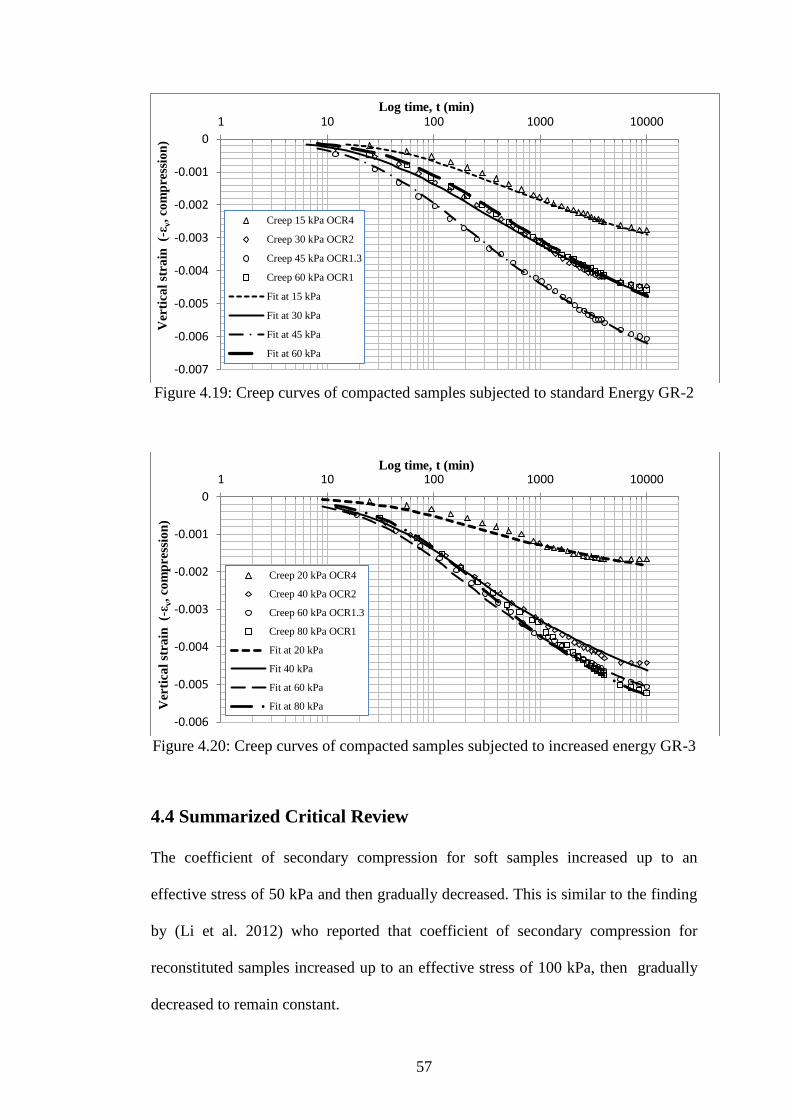
57
Figure 4.19: Creep curves of compacted samples subjected to standard Energy GR-2
Figure 4.20: Creep curves of compacted samples subjected to increased energy GR-3
4.4 Summarized Critical Review
The coefficient of secondary compression for soft samples increased up to an
effective stress of 50 kPa and then gradually decreased. This is similar to the finding
by (Li et al. 2012) who reported that coefficient of secondary compression for
reconstituted samples increased up to an effective stress of 100 kPa, then gradually
decreased to remain constant.
-0.007
-0.006
-0.005
-0.004
-0.003
-0.002
-0.001
0
1 10 100 1000 10000
Ver
tica
l st
rain
(-
ε v, co
mp
ress
ion
)
Log time, t (min)
Creep 15 kPa OCR4
Creep 30 kPa OCR2
Creep 45 kPa OCR1.3
Creep 60 kPa OCR1
Fit at 15 kPa
Fit at 30 kPa
Fit at 45 kPa
Fit at 60 kPa
-0.006
-0.005
-0.004
-0.003
-0.002
-0.001
0
1 10 100 1000 10000
Ver
tica
l st
rain
(-
ε v, co
mp
ress
ion
)
Log time, t (min)
Creep 20 kPa OCR4
Creep 40 kPa OCR2
Creep 60 kPa OCR1.3
Creep 80 kPa OCR1
Fit at 20 kPa
Fit 40 kPa
Fit at 60 kPa
Fit at 80 kPa
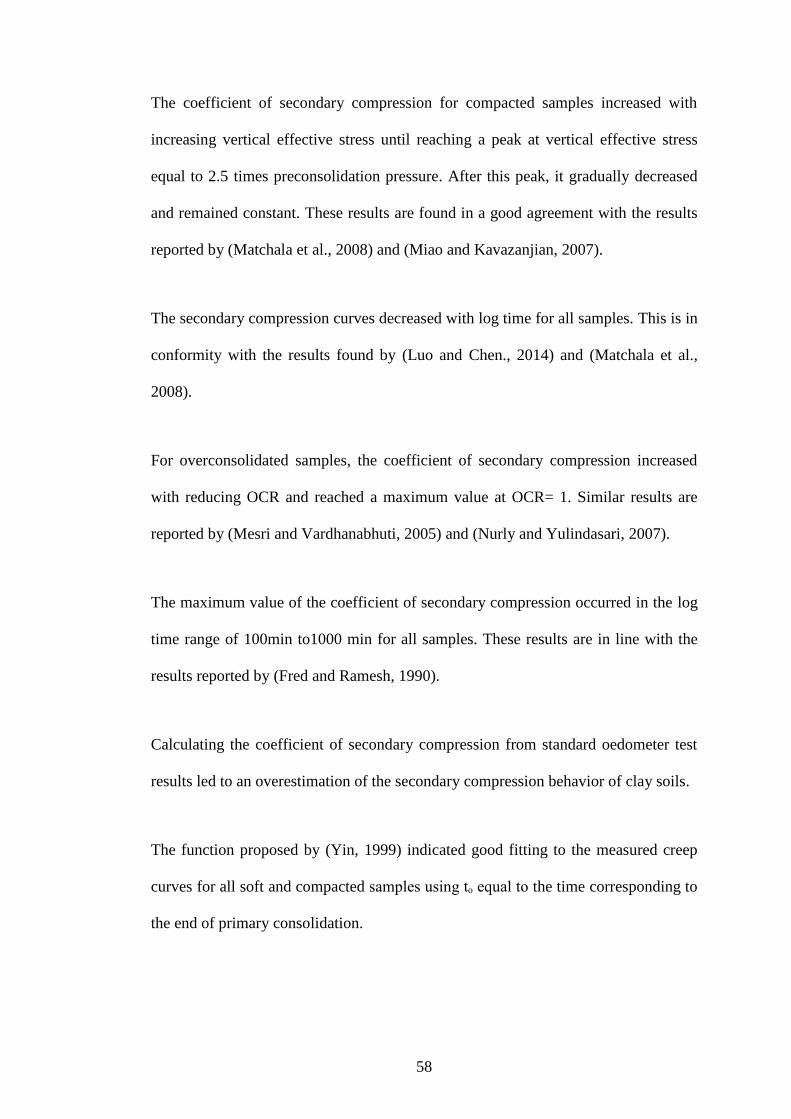
58
The coefficient of secondary compression for compacted samples increased with
increasing vertical effective stress until reaching a peak at vertical effective stress
equal to 2.5 times preconsolidation pressure. After this peak, it gradually decreased
and remained constant. These results are found in a good agreement with the results
reported by (Matchala et al., 2008) and (Miao and Kavazanjian, 2007).
The secondary compression curves decreased with log time for all samples. This is in
conformity with the results found by (Luo and Chen., 2014) and (Matchala et al.,
2008).
For overconsolidated samples, the coefficient of secondary compression increased
with reducing OCR and reached a maximum value at OCR= 1. Similar results are
reported by (Mesri and Vardhanabhuti, 2005) and (Nurly and Yulindasari, 2007).
The maximum value of the coefficient of secondary compression occurred in the log
time range of 100min to1000 min for all samples. These results are in line with the
results reported by (Fred and Ramesh, 1990).
Calculating the coefficient of secondary compression from standard oedometer test
results led to an overestimation of the secondary compression behavior of clay soils.
The function proposed by (Yin, 1999) indicated good fitting to the measured creep
curves for all soft and compacted samples using tₒ equal to the time corresponding to
the end of primary consolidation.
59
Chapter 5
CONCLUSION
The importance of this thesis is to gain an understanding of the creep of clay soils.
To establish a better prediction of the long-term settlement of, for example,
60
embankments or buildings, where measurements of the secondary compression
extremely important. In this study, the variation of the secondary compression with
time and the effect of the vertical stress on the creep are examined.
From the experimental results of the research carried out on soft and compacted
samples to study the behavior of secondary compression during normal and
overconsolidated conditions for soft and compacted samples, the following
conclusions can be made:
The method of preparation for soft sample GR-1 considered obtaining
identical samples with similar initial void ratio and initial water content.
Initial void ratios of the soft sample and compacted samples are calculated as
1.59, 0.66 and 0.56 respectively. The soft sample GR-1 has the highest void
ratio and the lowest initial void ratio is obtained for the sample prepared with
highest compaction energy (GR-3). However, the compression curve for soft
sample GR-1 shows a greater decrease in void ratio, from 1.58 to 0.93 than
compacted samples; void ratios for standard energy GR-2 decreased from
about 0.66 to 0.48 and for increased energy GR-3 void ratio reduced from
0.59 to 0.42.
The compression index of the soft sample is 0.4 significantly greater than
the compression index for compacted samples (were Cc for GR-2 is 0.12 and
for Cc for GR-3 is 0.11).
The vertical strain curve of saturation stage for soft sample indicates
consolidation under the weight of the loading cap rather than swell, which is
due to the reason that the soil sample is in an unconsolidated condition due to
the absence of any preconsolidation pressure during sample preparation.
Hence, the soft sample consolidates slightly even under the weight of loading
61
cap, which applies a modest stress of only 5.2 kPa approximately. On the
other hand, the saturation stage for compacted samples indicates swell under
the weight of loading cap. The vertical strain curve of GR-2 sample indicates
lower swell than GR-3 sample. This can be attributed to the fact that GR-2
and GR-3 samples have experienced an initial preconsolidation stress during
sample preparation due to applied compaction energy.
The loading curves for soft sample indicate that the maximum compression in
the sample is attained in the 25 kPa load increment, which is approximately
twice the compression observed in the proceeding load increments 50 kPa,
100 kPa, 200 kPa and 400 kPa.
The vertical strain observed in the rebound curves in unloading stages
indicates that the greater the unloading stress the greater the rebound strain
will be. The recompression index for GR-3 is the highest slope observed
within all samples with Cr = 0.0028, followed by recompression index of GR-
2 with Cr =0.0018, and for GR-1 recompression index is obtained as Cr=
0.0012. The recompression index is directly proportional with the compaction
energy applied on the sample during sample preparation.
The compression curve for soft sample varies linearly in semi-log scale for
loading stages; this is considered to be typical of virgin compression behavior
due to lack of any pre-stress during sample preparation. However, there is a
hump in the initial part of the compression curves of compacted samples, due
to the initial pre-stress induced on the samples during compaction, which
might have created preconsolidation in the samples. Therefore, during initial
stages of load increments, until this preconsolidation is attained, there is an
62
enhanced resistance in the samples of GR-2 and GR-3 against compression
compared to soft sample (GR-1).
For sample subjected to standard energy, GR-2, the preconsolidation stress is
computed as 60 kPa, and for increased energy, GR-3, it is computed as 80
kPa.
The creep curves obtained from standard oedometer test for GR-1, GR-2, and
GR-3 all indicate an approximately linear trend with log time for all load
increments. It is also observed from the creep curves that, as the effective
stress load increased a greater creep strain is obtained for compacted samples
of GR-2, and GR-3, with greater creep corresponding to normally
consolidated behavior (σʹv >Pc).
The coefficient of secondary compression is directly proportional with the
time corresponding to the end of primary consolidation for all loading stages.
The coefficient of secondary compression for soft sample increased from 25
kPa to 50 kPa then gradually decreased with increasing vertical effective
stress. On the other hand, the coefficient of secondary compression for
compacted samples have similar characteristics, they both increased with
increasing vertical effective stress until reaching a peak value around 200
kPa. Then, it decreased and remained constant in the following load
increments. The maximum values of the coefficient of secondary
compression for compacted samples occur at effective stress about 2.5 times
the preconsolidation stress.
As much higher preconsolidation stress maintained on the samples, the
vertical unloading strain increased. In which the sample prepared with
63
increase energy indicated higher unloading vertical strain curve than standard
energy.
During normal consolidated stage the coefficient of secondary compression
for soft sample GR-1, is measured to be greater to the measurements for the
compacted samples for all load increments. The time corresponding to the
end of primary consolidation for soft sample GR-1 was lower in most of the
loading stages compared to measurements for competed samples. The results
of coefficient of secondary compression and the time corresponding to the
end of primary consolidation were similar for GR-2 and GR-3, as well as the
trends observed.
For overconsolidated samples, the coefficient of secondary compression
increased with reducing OCR and reached a maximum value at OCR= 1.
The coefficient of secondary compression Cα is not constant with time on
semi logarithmic scale, it decreases from Cα to Cα*.
For OCR= 4 the coefficient of secondary compression Cα* reduced to a very
small number such that it may be fair to comment that long term
compressibility is almost absent.
Calculating the coefficient of secondary compression from standard
oedometer test results led to an overestimation of the secondary compression
behavior of clay soils.
The proposed function by Yin (1999) indicates good fitting to the measured
creep curves at tp found by oedometer test for all soft samples. It is noted that
proposed function indicated better fit for samples subjected to higher OCR.
64
For compacted samples, it is found that the proposed function by Yin (1999)
indicates a good fitting to the measured creep curves for all compacted
samples.
REFERENCES
Al-Shamrani, M. A. (1998). Application of the Cα/Cc concept to secondary
compression of Sabkha soils. Canadian Geotechnical Journal, 35(1), 15-26.
65
Al-Shamrani, M. A., & Dhowian, A. W. (1996). Characterization of secondary
compression behavior of Sabkha soils. Engineering Geology, 48(1-2), 19-41.
Atalar, C., & Das, B. M. (2009). Geotechnical properties of Nicosia soils, Cyprus.
Proceedings, 2th Int. Con. New Developments in SMG Eng., 360-367, Nicosia.
Barden, L. (1968). Primary and secondary conslidation of clay and
peat. Geotechnique, 18(1), 1-24.
Barden, L. (1969). Time dependent deformation of normally consolidated clays and
peats. Journal of Soil Mechanics & Foundations Div, 95(1), 1-32.
Bjerrum, L. (1967). Progressive failure in slopes of overconsolidated plastic clay and
clay shales. Journal of Soil Mechanics & Foundations Div. 93(5), 1-49.
Burland, J. B. (1990). On the compressibility and shear strength of natural
clays. Géotechnique, 40(3), 329-378.
Craig, R. F. (2004). Soil mechanics. London, Spon Press, 447.
Das, B.M. (2008). Advanced soil mechanics. London, Taylor and Francis, 594.
Deng, Y. F., Cui, Y. J., Tang, A. M., Li, X. L., & Sillen, X. (2012). An experimental
study on the secondary deformation of Boom clay. Applied Clay Science, 59, 19-
25.
66
Edgell, C. J., McDonald, C. C., & Graham, J. B. (1983). Permanent cell line
expressing human factor VIII-related antigen established by
hybridization. Proceedings of the National Academy of Sciences, 80(12), 3734-
3737.
Fatahi, B., Le, T. M., Le, M. Q., & Khabbaz, H. (2013). Soil creep effects on ground
lateral deformation and pore water pressure under embankments. Geomechanics
and Geoengineering, 8(2), 107-124.
Fox, P. J., Edil, T. B., & Lan, L. T. (1992). Cα/Cc Concept applied to compression of
peat. Journal of Geotechnical Engineering, 118(8), 1256-1263.
Gofar, N., & Sutejo, Y. (2007). Long-term compression behavior of fibrous
peat. Malaysian Journal of Civil Engineering, 19(2), 104-116.
Head, K. H., & Epps, R. (1986). Manual of soil laboratory testing (Vol (3), 798-
869). London: Pentech Press.
Lei, H., Wang, X., Chen, L., Huang, M., & Han, J. (2016). Compression
characteristics of ultra-soft clays subjected to simulated staged preloading. KSCE
Journal of Civil Engineering, 20(2), 718-728.
Leroueil, S., Kabbaj, M., Tavenas, F., & Bouchard, R. (1985). Stress–strain–strain
rate relation for the compressibility of sensitive natural
clays. Geotechnique, 35(2), 159-180.
67
Li, Q., Ng, C. W. W., & Liu, G. B. (2012). Low secondary compressibility and shear
strength of Shanghai Clay. Journal of Central South University, 19(8), 2323-
2332.
Luo, Q., & Chen, X. (2014). Experimental research on creep characteristics of
Nansha soft soil. The Scientific World Journal, 2014 :968738.
doi:10.1155/2014/968738
Malekzadeh, M., & Bilsel, H. (2012). Swell and compressibility of fiber reinforced
expansive soils. International Journal of Advanced Technology in Civil
Engineering, 1(2), 42-45.
Mesri, G., & Castro, A. (1987). Cα/Cc concept and K0 during secondary
compression. Journal of Geotechnical Engineering, 113(3), 230-247.
Mesri, G., Kelly, W. E., Vallee, R. P., & Andersland, O. B. (1973). Coefficient of
secondary compression. Journal of Soil Mechanics & Foundations Div, 99. (Proc
Paper).
Mesri, G., Stark, T. D., Ajlouni, M. A., & Chen, C. S. (1997). Secondary
compression of peat with or without surcharging. Journal of Geotechnical and
Geoenvironmental Engineering, 123(5), 411-421.
Mesri, G., & Vardhanabhuti, B. (2006). Closure to “Secondary
Compression”. Journal of Geotechnical and Geoenvironmental
Engineering, 132(6), 817-818.

68
Miao, L., & Kavazanjian Jr, E. (2007). Secondary compression features of Jiangsu
soft marine clay. Marine Georesources and Geotechnology, 25(2), 129-144.
Nash, D. F. T., Sills, G. C., & Davison, L. R. (1992). One-dimensional consolidation
testing of soft clay from Bothkennar. Geotechnique, 42(2), 241-256.
Sridharan, A., & Prakash, K. (1998). Characteristic water contents of a fine-grained
soil-water system. Geotechnique, 48(3), 337-346.
Sridharan, A., & Rao, A. S. (1982). Mechanisms controlling the secondary
compression of clays. Geotechnique, 32(3), 249-260.
Suneel, M., Park, L. K., & Im, J. C. (2008). Compressibility characteristics of
Korean marine clay. Marine Georesources and Geotechnology, 26(2), 111-127.
Tawfiq, S., & Nalbantoglu, Z. (2009, May). Swell-Shrink behavior of expansive
clays. In Proceedings of 2nd International Congress on New Developments in
Soil Mechanics and Geotechnical Engineering, Nicosia, North Cyprus, 336-341.
Terzaghi, K., Peck, R. B., & Mesri, G. (1996). Soil mechanics in engineering
practice. John Wiley & Sons.
Walker, L. K. (1969). Undrained creep in a sensitive clay. Geotechnique, 19(4), 515-
529.

69
Yin, J. H. (1999). Non-linear creep of soils in oedometer tests. Geotechnique, 49(5),
699-707.
Zeng, L., & Liu, S. (2010). A calculation method of secondary compression index for
natural sedimentary clays using void index. In Soil Behavior and Geo-
Micromechanics, 14-21.

70
APPENDICES
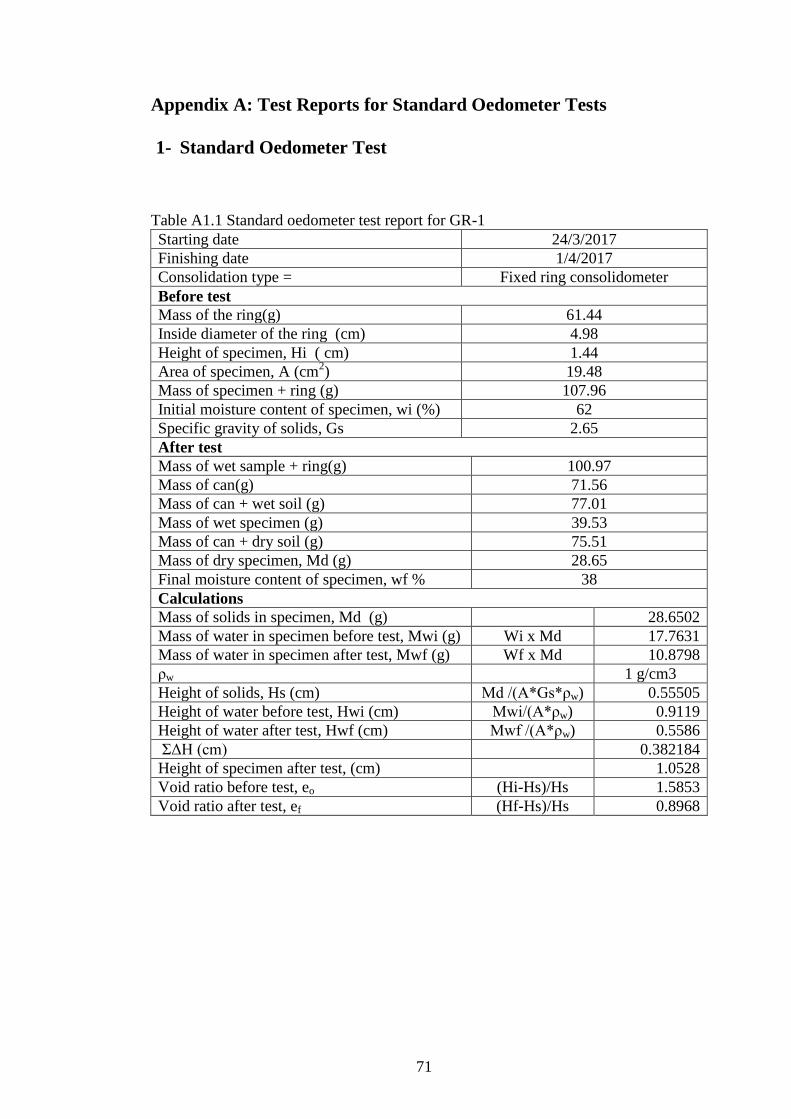
71
Appendix A: Test Reports for Standard Oedometer Tests
1- Standard Oedometer Test
Table A1.1 Standard oedometer test report for GR-1
Starting date 24/3/2017
Finishing date
1/4/2017
Consolidation type = Fixed ring consolidometer
Before test
Mass of the ring(g) 61.44
Inside diameter of the ring (cm) 4.98
Height of specimen, Hi ( cm) 1.44
Area of specimen, A (cm2) 19.48
Mass of specimen + ring (g) 107.96
Initial moisture content of specimen, wi (%) 62
Specific gravity of solids, Gs 2.65
After test
Mass of wet sample + ring(g) 100.97
Mass of can(g) 71.56
Mass of can + wet soil (g) 77.01
Mass of wet specimen (g) 39.53
Mass of can + dry soil (g) 75.51
Mass of dry specimen, Md (g) 28.65
Final moisture content of specimen, wf % 38
Calculations
Mass of solids in specimen, Md (g)
28.6502
Mass of water in specimen before test, Mwi (g) Wi x Md 17.7631
Mass of water in specimen after test, Mwf (g) Wf x Md 10.8798
ρw
1 g/cm3
Height of solids, Hs (cm) Md /(A*Gs*ρw) 0.55505
Height of water before test, Hwi (cm) Mwi/(A*ρw) 0.9119
Height of water after test, Hwf (cm) Mwf /(A*ρw) 0.5586
ΣΔH (cm)
0.382184
Height of specimen after test, (cm)
1.0528
Void ratio before test, eo (Hi-Hs)/Hs 1.5853
Void ratio after test, ef (Hf-Hs)/Hs 0.8968
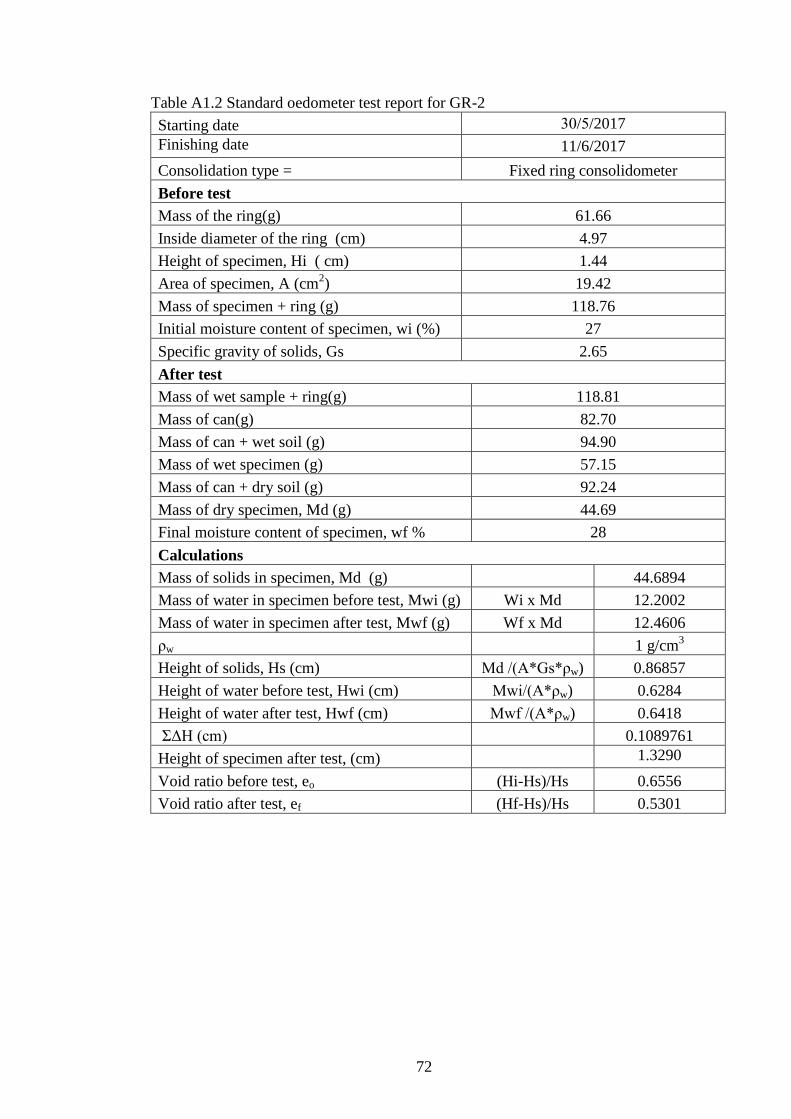
72
Table A1.2 Standard oedometer test report for GR-2
Starting date 30/5/2017
Finishing date
11/6/2017
Consolidation type = Fixed ring consolidometer
Before test
Mass of the ring(g) 61.66
Inside diameter of the ring (cm) 4.97
Height of specimen, Hi ( cm) 1.44
Area of specimen, A (cm2) 19.42
Mass of specimen + ring (g) 118.76
Initial moisture content of specimen, wi (%) 27
Specific gravity of solids, Gs 2.65
After test
Mass of wet sample + ring(g) 118.81
Mass of can(g) 82.70
Mass of can + wet soil (g) 94.90
Mass of wet specimen (g) 57.15
Mass of can + dry soil (g) 92.24
Mass of dry specimen, Md (g) 44.69
Final moisture content of specimen, wf % 28
Calculations
Mass of solids in specimen, Md (g)
44.6894
Mass of water in specimen before test, Mwi (g) Wi x Md 12.2002
Mass of water in specimen after test, Mwf (g) Wf x Md 12.4606
ρw
1 g/cm3
Height of solids, Hs (cm) Md /(A*Gs*ρw) 0.86857
Height of water before test, Hwi (cm) Mwi/(A*ρw) 0.6284
Height of water after test, Hwf (cm) Mwf /(A*ρw) 0.6418
ΣΔH (cm)
0.1089761
Height of specimen after test, (cm)
1.3290
Void ratio before test, eo (Hi-Hs)/Hs 0.6556
Void ratio after test, ef (Hf-Hs)/Hs 0.5301

73
Table A1.3 Standard oedometer test report for GR-3
Starting date 30/5/2017
Finishing date
11/6/2017
Consolidation type = Fixed ring consolidometer
Before test
Mass of the ring(g) 61.19
Inside diameter of the ring (cm) 4.97
Height of specimen, Hi ( cm) 1.45
Area of specimen, A (cm2) 19.40
Mass of specimen + ring (g) 120.54
Initial moisture content of specimen, wi (%) 23.40
Specific gravity of solids, Gs 2.65
After test
Mass of wet sample + ring(g) 121.74
Mass of can(g) 49.81
Mass of can + wet soil (g) 61.34
Mass of wet specimen (g) 60.55
Mass of can + dry soil (g) 58.95
Mass of dry specimen, Md (g) 48.00
Final moisture content of specimen, wf % 0.26
Calculations
Mass of solids in specimen, Md (g)
47.9989
Mass of water in specimen before test, Mwi (g) Wi x Md 1123.1736
Mass of water in specimen after test, Mwf (g) Wf x Md 12.5511
ρw
1 g/cm3
Height of solids, Hs (cm) Md /(A*Gs*ρw) 0.93365
Height of water before test, Hwi (cm) Mwi/(A*ρw) 57.8954
Height of water after test, Hwf (cm) Mwf /(A*ρw) 0.6470
ΣΔH (cm)
0.0804
Height of specimen after test, (cm)
1.3716
Void ratio before test, eo (Hi-Hs)/Hs 0.5552
Void ratio after test, ef (Hf-Hs)/Hs 0.4691
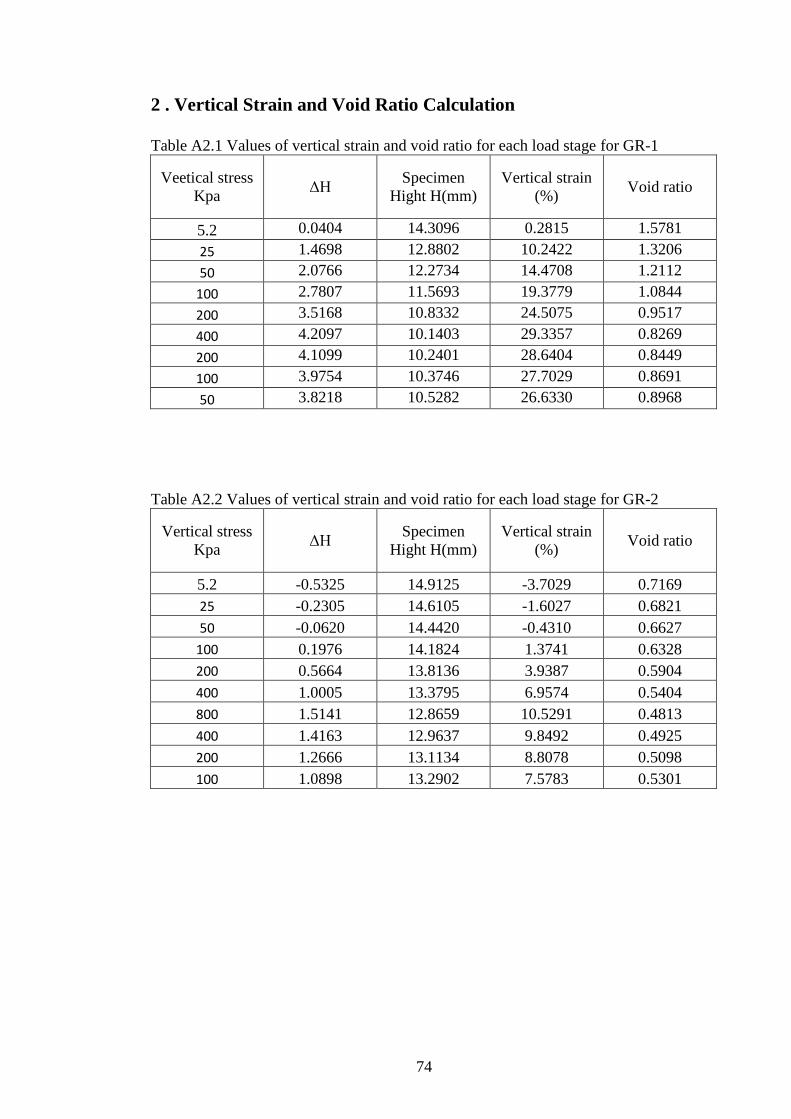
74
2 . Vertical Strain and Void Ratio Calculation
Table A2.1 Values of vertical strain and void ratio for each load stage for GR-1
Veetical stress
Kpa ΔH
Specimen
Hight H(mm)
Vertical strain
(%) Void ratio
5.2 0.0404 14.3096 0.2815 1.5781
25 1.4698 12.8802 10.2422 1.3206
50 2.0766 12.2734 14.4708 1.2112
100 2.7807 11.5693 19.3779 1.0844
200 3.5168 10.8332 24.5075 0.9517
400 4.2097 10.1403 29.3357 0.8269
200 4.1099 10.2401 28.6404 0.8449
100 3.9754 10.3746 27.7029 0.8691
50 3.8218 10.5282 26.6330 0.8968
Table A2.2 Values of vertical strain and void ratio for each load stage for GR-2
Vertical stress
Kpa ΔH
Specimen
Hight H(mm)
Vertical strain
(%) Void ratio
5.2 -0.5325 14.9125 -3.7029 0.7169
25 -0.2305 14.6105 -1.6027 0.6821
50 -0.0620 14.4420 -0.4310 0.6627
100 0.1976 14.1824 1.3741 0.6328
200 0.5664 13.8136 3.9387 0.5904
400 1.0005 13.3795 6.9574 0.5404
800 1.5141 12.8659 10.5291 0.4813
400 1.4163 12.9637 9.8492 0.4925
200 1.2666 13.1134 8.8078 0.5098
100 1.0898 13.2902 7.5783 0.5301
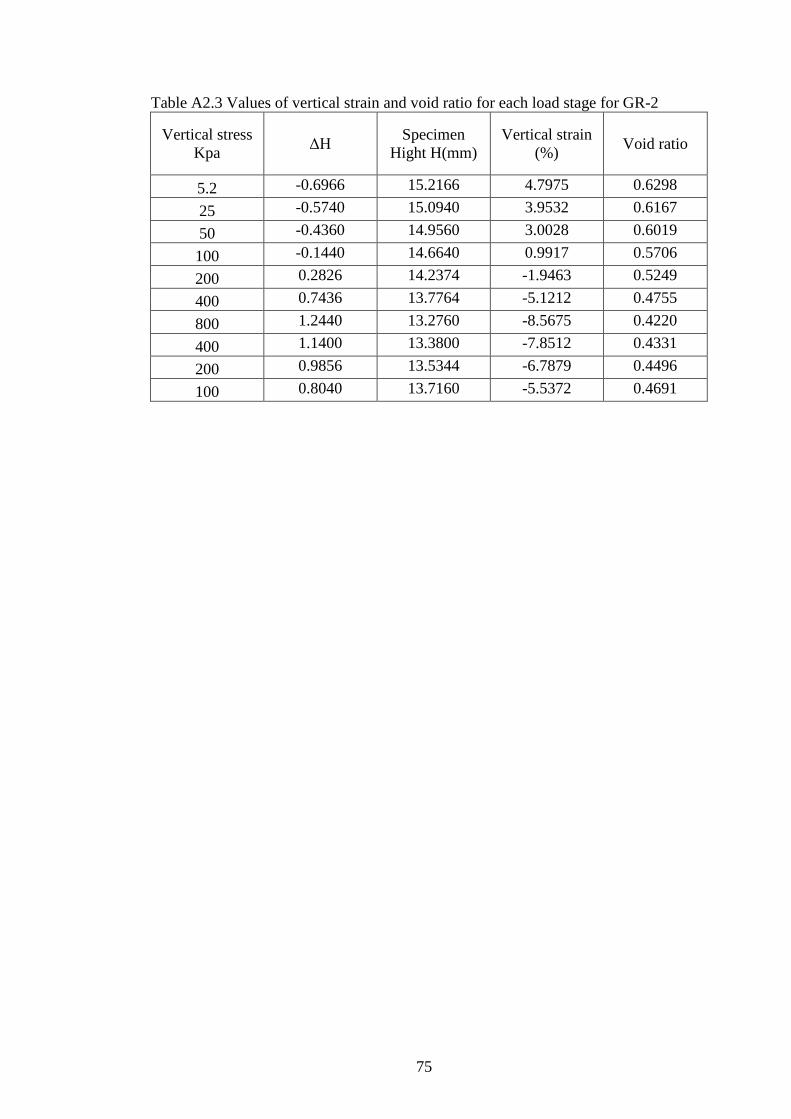
75
Table A2.3 Values of vertical strain and void ratio for each load stage for GR-2
Vertical stress
Kpa ΔH
Specimen
Hight H(mm)
Vertical strain
(%) Void ratio
5.2 -0.6966 15.2166 4.7975 0.6298
25 -0.5740 15.0940 3.9532 0.6167
50 -0.4360 14.9560 3.0028 0.6019
100 -0.1440 14.6640 0.9917 0.5706
200 0.2826 14.2374 -1.9463 0.5249
400 0.7436 13.7764 -5.1212 0.4755
800 1.2440 13.2760 -8.5675 0.4220
400 1.1400 13.3800 -7.8512 0.4331
200 0.9856 13.5344 -6.7879 0.4496
100 0.8040 13.7160 -5.5372 0.4691
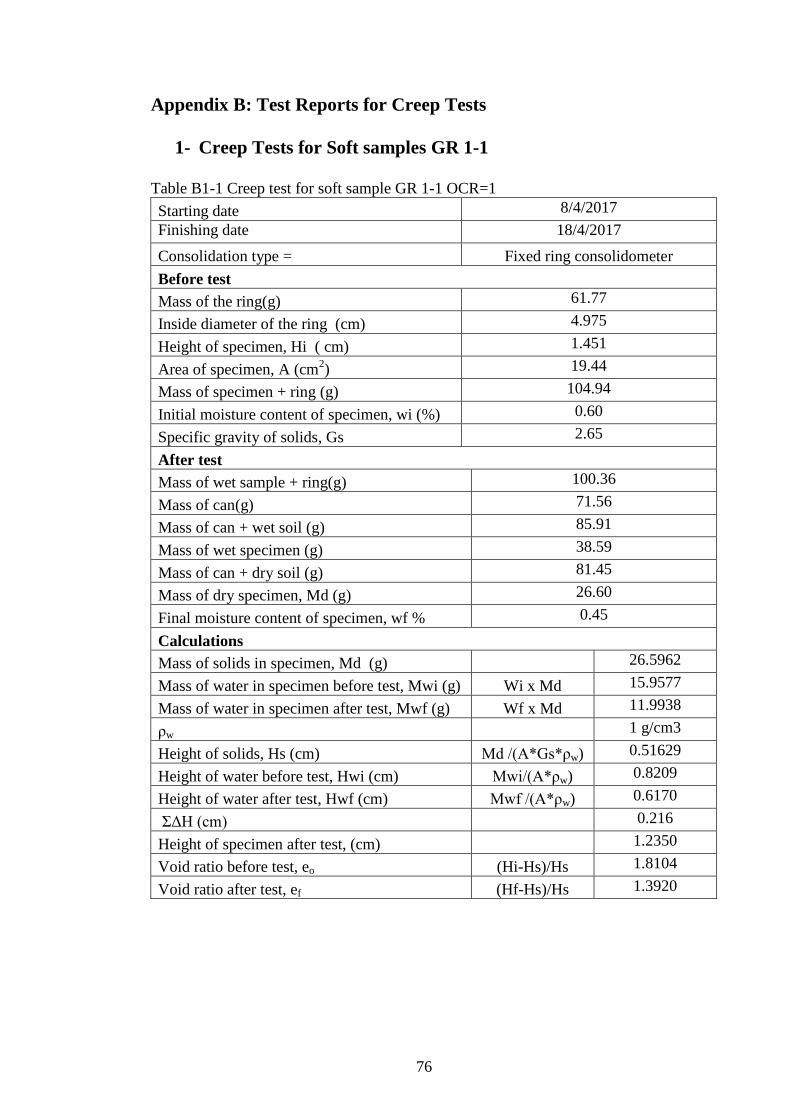
76
Appendix B: Test Reports for Creep Tests
1- Creep Tests for Soft samples GR 1-1
Table B1-1 Creep test for soft sample GR 1-1 OCR=1
Starting date 8/4/2017
Finishing date
18/4/2017
Consolidation type = Fixed ring consolidometer
Before test
Mass of the ring(g) 61.77
Inside diameter of the ring (cm) 4.975
Height of specimen, Hi ( cm) 1.451
Area of specimen, A (cm2) 19.44
Mass of specimen + ring (g) 104.94
Initial moisture content of specimen, wi (%) 0.60
Specific gravity of solids, Gs 2.65
After test
Mass of wet sample + ring(g) 100.36
Mass of can(g) 71.56
Mass of can + wet soil (g) 85.91
Mass of wet specimen (g) 38.59
Mass of can + dry soil (g) 81.45
Mass of dry specimen, Md (g) 26.60
Final moisture content of specimen, wf % 0.45
Calculations
Mass of solids in specimen, Md (g)
26.5962
Mass of water in specimen before test, Mwi (g) Wi x Md 15.9577
Mass of water in specimen after test, Mwf (g) Wf x Md 11.9938
ρw
1 g/cm3
Height of solids, Hs (cm) Md /(A*Gs*ρw) 0.51629
Height of water before test, Hwi (cm) Mwi/(A*ρw) 0.8209
Height of water after test, Hwf (cm) Mwf /(A*ρw) 0.6170
ΣΔH (cm)
0.216
Height of specimen after test, (cm)
1.2350
Void ratio before test, eo (Hi-Hs)/Hs 1.8104
Void ratio after test, ef (Hf-Hs)/Hs 1.3920

77
Table B1-2 Creep test for soft sample GR 1-1 OCR=1.3
Starting date 8/4/2017
Finishing date
18/4/2017
Consolidation type = Fixed ring consolidometer
Before test
Mass of the ring(g) 61.19
Inside diameter of the ring (cm) 4.97
Height of specimen, Hi ( cm) 1.45
Area of specimen, A (cm2) 19.40
Mass of specimen + ring (g) 108.30
Initial moisture content of specimen, wi (%) 0.60
Specific gravity of solids, Gs 2.65
After test
Mass of wet sample + ring(g) 103.06
Mass of can(g) 65.49
Mass of can + wet soil (g) 80.15
Mass of wet specimen (g) 41.87
Mass of can + dry soil (g) 75.73
Mass of dry specimen, Md (g) 29.25
Final moisture content of specimen, wf % 0.432
Calculations
Mass of solids in specimen, Md (g)
29.2462
Mass of water in specimen before test, Mwi (g) Wi x Md 17.5477
Mass of water in specimen after test, Mwf (g) Wf x Md 12.6238
ρw
1 g/cm3
Height of solids, Hs (cm) Md /(A*Gs*ρw) 0.56888
Height of water before test, Hwi (cm) Mwi/(A*ρw) 0.9045
Height of water after test, Hwf (cm) Mwf /(A*ρw) 0.6507
ΣΔH (cm)
0.24756
Height of specimen after test, (cm)
1.2044
Void ratio before test, eo (Hi-Hs)/Hs 1.5524
Void ratio after test, ef (Hf-Hs)/Hs 1.1172

78
Table B1-3 Creep test for soft sample GR 1-1 OCR=2
Starting date 8/4/2017
Finishing date
18/4/2017
Consolidation type = Fixed ring consolidometer
Before test
Mass of the ring(g) 61.66
Inside diameter of the ring (cm) 4.972
Height of specimen, Hi ( cm) 1.438
Area of specimen, A (cm2) 19.42
Mass of specimen + ring (g) 102.87
Initial moisture content of specimen, wi (%) 0.60
Specific gravity of solids, Gs 2.65
After test
Mass of wet sample + ring(g) 100.71
Mass of can(g) 71.56
Mass of can + wet soil (g) 85.21
Mass of wet specimen (g) 39.05
Mass of can + dry soil (g) 80.96
Mass of dry specimen, Md (g) 26.89
Final moisture content of specimen, wf % 0.45
Calculations
Mass of solids in specimen, Md (g)
26.8916
Mass of water in specimen before test, Mwi (g) Wi x Md 16.1349
Mass of water in specimen after test, Mwf (g) Wf x Md 12.1584
ρw
1 g/cm3
Height of solids, Hs (cm) Md /(A*Gs*ρw) 0.52266
Height of water before test, Hwi (cm) Mwi/(A*ρw) 0.8310
Height of water after test, Hwf (cm) Mwf /(A*ρw) 0.6262
ΣΔH (cm)
0.1947
Height of specimen after test, (cm)
1.2433
Void ratio before test, eo (Hi-Hs)/Hs 1.7513
Void ratio after test, ef (Hf-Hs)/Hs 1.3788

79
Table B1-4 Creep test for soft sample GR 1-1 OCR=4
Starting date 8/4/2017
Finishing date
18/4/2017
Consolidation type = Fixed ring consolidometer
Before test
Mass of the ring(g) 61.19
Inside diameter of the ring (cm) 4.970
Height of specimen, Hi ( cm) 1.452
Area of specimen, A (cm2) 19.40
Mass of specimen + ring (g) 107.67
Initial moisture content of specimen, wi (%) 0.60
Specific gravity of solids, Gs 2.65
After test
Mass of wet sample + ring(g) 103.52
Mass of can(g) 47.61
Mass of can + wet soil (g) 64.05
Mass of wet specimen (g) 42.33
Mass of can + dry soil (g) 58.85
Mass of dry specimen, Md (g) 28.94
Final moisture content of specimen, wf % 0.46
Calculations
Mass of solids in specimen, Md (g)
28.9409
Mass of water in specimen before test, Mwi (g) Wi x Md 17.3646
Mass of water in specimen after test, Mwf (g) Wf x Md 13.3891
ρw
1 g/cm3
Height of solids, Hs (cm) Md /(A*Gs*ρw) 0.56294
Height of water before test, Hwi (cm) Mwi/(A*ρw) 0.8951
Height of water after test, Hwf (cm) Mwf /(A*ρw) 0.6902
ΣΔH (cm)
0.18614
Height of specimen after test, (cm)
1.2659
Void ratio before test, eo (Hi-Hs)/Hs 1.5793
Void ratio after test, ef (Hf-Hs)/Hs 1.2486

80
2- Creep Tests for Soft samples GR 1-2
Table B2-1 Creep test for soft sample GR 1-2 OCR=1
Starting date 8/4/2017
Finishing date
18/4/2017
Consolidation type = Fixed ring consolidometer
Before test
Mass of the ring(g) 61.44
Inside diameter of the ring (cm) 4.98
Height of specimen, Hi ( cm) 1.44
Area of specimen, A (cm2) 19.48
Mass of specimen + ring (g) 102.36
Initial moisture content of specimen, wi (%) 0.60
Specific gravity of solids, Gs 2.65
After test
Mass of wet sample + ring(g) 92.26
Mass of can(g) 47.62
Mass of can + wet soil (g) 65.66
Mass of wet specimen (g) 30.82
Mass of can + dry soil (g) 60.36
Mass of dry specimen, Md (g) 21.77
Final moisture content of specimen, wf % 0.416
Calculations
Mass of solids in specimen, Md (g)
21.7653
Mass of water in specimen before test, Mwi (g) Wi x Md 13.0592
Mass of water in specimen after test, Mwf (g) Wf x Md 9.0547
ρw
1 g/cm3
Height of solids, Hs (cm) Md /(A*Gs*ρw) 0.42167
Height of water before test, Hwi (cm) Mwi/(A*ρw) 0.6705
Height of water after test, Hwf (cm) Mwf /(A*ρw) 0.4649
ΣΔH (cm)
0.2969
Height of specimen after test, (cm)
1.1381
Void ratio before test, eo (Hi-Hs)/Hs 2.4031
Void ratio after test, ef (Hf-Hs)/Hs 1.6990

81
Table B2-2 Creep test for soft sample GR 1-2 OCR=1.3
Starting date 8/4/2017
Finishing date
18/4/2017
Consolidation type = Fixed ring consolidometer
Before test
Mass of the ring(g) 36.20
Inside diameter of the ring (cm) 4.98
Height of specimen, Hi ( cm) 1.41
Area of specimen, A (cm2) 19.45
Mass of specimen + ring (g) 77.48
Initial moisture content of specimen, wi (%) 0.60
Specific gravity of solids, Gs 2.65
After test
Mass of wet sample + ring(g) 72.51
Mass of can(g) 71.56
Mass of can + wet soil (g) 88.13
Mass of wet specimen (g) 36.31
Mass of can + dry soil (g) 83.21
Mass of dry specimen, Md (g) 25.53
Final moisture content of specimen, wf % 0.42
Calculations
Mass of solids in specimen, Md (g)
25.5288
Mass of water in specimen before test, Mwi (g) Wi x Md 15.3173
Mass of water in specimen after test, Mwf (g) Wf x Md 10.7812
ρw
1 g/cm3
Height of solids, Hs (cm) Md /(A*Gs*ρw) 0.49537
Height of water before test, Hwi (cm) Mwi/(A*ρw) 0.7876
Height of water after test, Hwf (cm) Mwf /(A*ρw) 0.5544
ΣΔH (cm)
0.2625
Height of specimen after test, (cm)
1.1495
Void ratio before test, eo (Hi-Hs)/Hs 1.8504
Void ratio after test, ef (Hf-Hs)/Hs 1.3205
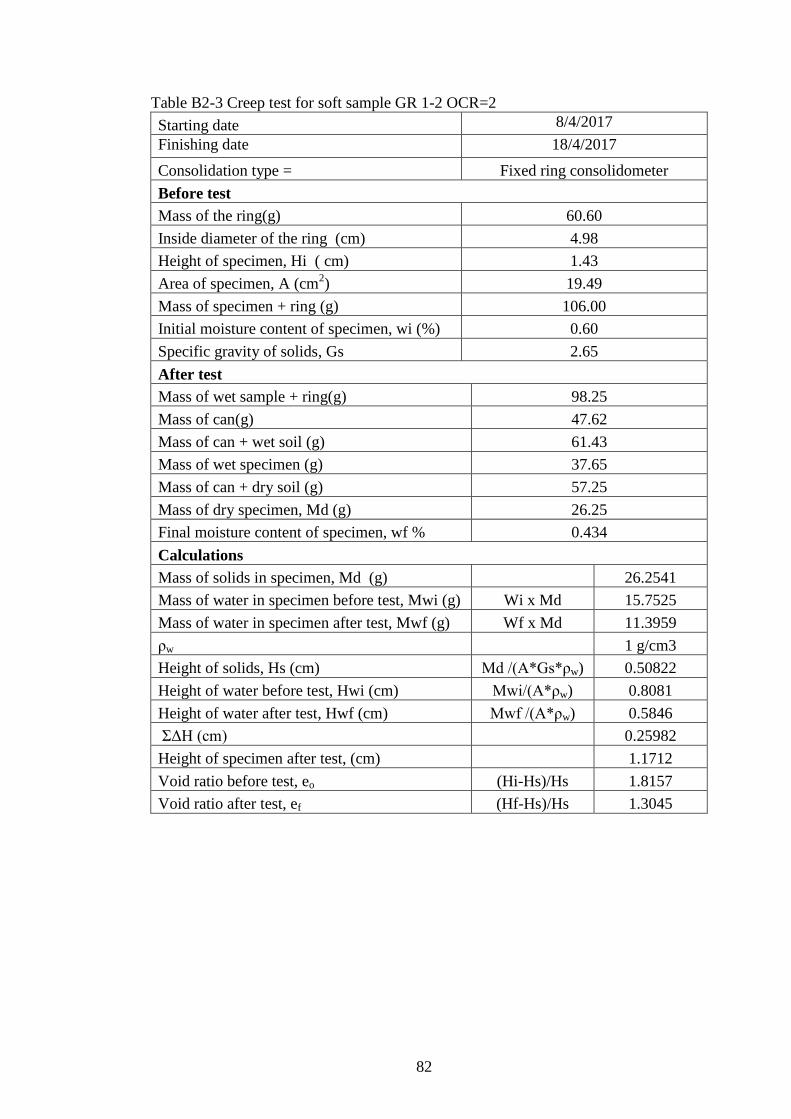
82
Table B2-3 Creep test for soft sample GR 1-2 OCR=2
Starting date 8/4/2017
Finishing date
18/4/2017
Consolidation type = Fixed ring consolidometer
Before test
Mass of the ring(g) 60.60
Inside diameter of the ring (cm) 4.98
Height of specimen, Hi ( cm) 1.43
Area of specimen, A (cm2) 19.49
Mass of specimen + ring (g) 106.00
Initial moisture content of specimen, wi (%) 0.60
Specific gravity of solids, Gs 2.65
After test
Mass of wet sample + ring(g) 98.25
Mass of can(g) 47.62
Mass of can + wet soil (g) 61.43
Mass of wet specimen (g) 37.65
Mass of can + dry soil (g) 57.25
Mass of dry specimen, Md (g) 26.25
Final moisture content of specimen, wf % 0.434
Calculations
Mass of solids in specimen, Md (g)
26.2541
Mass of water in specimen before test, Mwi (g) Wi x Md 15.7525
Mass of water in specimen after test, Mwf (g) Wf x Md 11.3959
ρw
1 g/cm3
Height of solids, Hs (cm) Md /(A*Gs*ρw) 0.50822
Height of water before test, Hwi (cm) Mwi/(A*ρw) 0.8081
Height of water after test, Hwf (cm) Mwf /(A*ρw) 0.5846
ΣΔH (cm)
0.25982
Height of specimen after test, (cm)
1.1712
Void ratio before test, eo (Hi-Hs)/Hs 1.8157
Void ratio after test, ef (Hf-Hs)/Hs 1.3045

83
Table B2-4 Creep test for soft sample GR 1-2 OCR=4
Starting date 8/4/2017
Finishing date
18/4/2017
Consolidation type = Fixed ring consolidometer
Before test
Mass of the ring(g) 61.81
Inside diameter of the ring (cm) 4.98
Height of specimen, Hi ( cm) 1.43
Area of specimen, A (cm2) 19.48
Mass of specimen + ring (g) 103.04
Initial moisture content of specimen, wi (%) 0.60
Specific gravity of solids, Gs 2.65
After test
Mass of wet sample + ring(g) 101.10
Mass of can(g) 47.60
Mass of can + wet soil (g) 62.00
Mass of wet specimen (g) 39.29
Mass of can + dry soil (g) 57.70
Mass of dry specimen, Md (g) 27.56
Final moisture content of specimen, wf % 0.426
Calculations
Mass of solids in specimen, Md (g)
27.5576
Mass of water in specimen before test, Mwi (g) Wi x Md 16.5345
Mass of water in specimen after test, Mwf (g) Wf x Md 11.7324
ρw
1 g/cm3
Height of solids, Hs (cm) Md /(A*Gs*ρw) 0.53388
Height of water before test, Hwi (cm) Mwi/(A* ρw) 0.8489
Height of water after test, Hwf (cm) Mwf /(A* ρw) 0.6023
ΣΔH (cm)
0.18614
Height of specimen after test, (cm)
1.2115
Void ratio before test, eo (Hi-Hs)/Hs 1.6841
Void ratio after test, ef (Hf-Hs)/Hs 1.2692

84
3- Creep Tests for Soft samples GR 1-3
Table B3-1 Creep test for soft sample GR 1-3 OCR=1
Starting date 25/6/2017
Finishing date
6/7/2017
Consolidation type = Fixed ring consolidometer
Before test
Mass of the ring(g) 60.76
Inside diameter of the ring (cm) 4.975
Height of specimen, Hi ( cm) 1.451
Area of specimen, A (cm2) 19.44
Mass of specimen + ring (g) 105.60
Initial moisture content of specimen, wi (%) 59.00
Specific gravity of solids, Gs 2.65
After test
Mass of wet sample + ring(g) 99.03
Mass of can(g) 76.11
Mass of can + wet soil (g) 86.96
Mass of wet specimen (g) 38.27
Mass of can + dry soil (g) 84.04
Mass of dry specimen, Md (g) 27.97
Final moisture content of specimen, wf % 0.37
Calculations
Mass of solids in specimen, Md (g)
27.9706
Mass of water in specimen before test, Mwi (g) Wi x Md 1650.2659
Mass of water in specimen after test, Mwf (g) Wf x Md 10.2994
ρw
1 g/cm3
Height of solids, Hs (cm) Md /(A*Gs* ρw) 0.54298
Height of water before test, Hwi (cm) Mwi/(A* ρw) 84.8942
Height of water after test, Hwf (cm) Mwf /(A* ρw) 0.5298
ΣΔH (cm)
0.3356
Height of specimen after test, (cm)
1.1154
Void ratio before test, eo (Hi-Hs)/Hs 1.6723
Void ratio after test, ef (Hf-Hs)/Hs 1.0542

85
Table B3-2 Creep test for soft sample GR 1-3 OCR=1.3
Starting date 25/6/2017
Finishing date
6/7/2017
Consolidation type = Fixed ring consolidometer
Before test
Mass of the ring(g) 61.66
Inside diameter of the ring (cm) 4.972
Height of specimen, Hi ( cm) 1.438
Area of specimen, A (cm2) 19.42
Mass of specimen + ring (g) 107.18
Initial moisture content of specimen, wi (%) 0.59
Specific gravity of solids, Gs 2.65
After test
Mass of wet sample + ring(g) 100.68
Mass of can(g) 49.80
Mass of can + wet soil (g) 62.13
Mass of wet specimen (g) 39.02
Mass of can + dry soil (g) 58.76
Mass of dry specimen, Md (g) 28.36
Final moisture content of specimen, wf % 0.38
Calculations
Mass of solids in specimen, Md (g)
28.3552
Mass of water in specimen before test, Mwi (g) Wi x Md 16.7295
Mass of water in specimen after test, Mwf (g) Wf x Md 10.6648
ρw
1 g/cm3
Height of solids, Hs (cm) Md /(A*Gs* ρw) 0.55110
Height of water before test, Hwi (cm) Mwi/(A* ρw) 0.8617
Height of water after test, Hwf (cm) Mwf /(A* ρw) 0.5493
ΣΔH (cm)
0.3406
Height of specimen after test, (cm)
1.0974
Void ratio before test, eo (Hi-Hs)/Hs 1.6093
Void ratio after test, ef (Hf-Hs)/Hs 0.9913

86
Table B3-3 Creep test for soft sample GR 1-3 OCR=2
Starting date 25/6/2017
Finishing date
6/7/2017
Consolidation type = Fixed ring consolidometer
Before test
Mass of the ring(g) 60.27
Inside diameter of the ring (cm) 4.986
Height of specimen, Hi ( cm) 1.445
Area of specimen, A (cm2) 19.53
Mass of specimen + ring (g) 106.11
Initial moisture content of specimen, wi (%) 0.59
Specific gravity of solids, Gs 2.65
After test
Mass of wet sample + ring(g) 99.78
Mass of can(g) 76.11
Mass of can + wet soil (g) 92.05
Mass of wet specimen (g) 39.51
Mass of can + dry soil (g) 87.65
Mass of dry specimen, Md (g) 28.60
Final moisture content of specimen, wf % 0.38
Calculations
Mass of solids in specimen, Md (g)
28.6039
Mass of water in specimen before test, Mwi (g) Wi x Md 16.8763
Mass of water in specimen after test, Mwf (g) Wf x Md 10.9061
ρw
1 g/cm3
Height of solids, Hs (cm) Md /(A*Gs* ρw) 0.55282
Height of water before test, Hwi (cm) Mwi/(A* ρw) 0.8643
Height of water after test, Hwf (cm) Mwf /(A* ρw) 0.5586
ΣΔH (cm)
0.3262
Height of specimen after test, (cm)
1.1188
Void ratio before test, eo (Hi-Hs)/Hs 1.6139
Void ratio after test, ef (Hf-Hs)/Hs 1.0238

87
Table B3-4 Creep test for soft sample GR 1-3 OCR=4
Starting date 25/6/2017
Finishing date
6/7/2017
Consolidation type = Fixed ring consolidometer
Before test
Mass of the ring(g) 61.19
Inside diameter of the ring (cm) 4.97
Height of specimen, Hi ( cm) 1.45
Area of specimen, A (cm2) 19.40
Mass of specimen + ring (g) 107.01
Initial moisture content of specimen, wi (%) 59.00
Specific gravity of solids, Gs 2.65
After test
Mass of wet sample + ring(g) 101.07
Mass of can(g) 49.81
Mass of can + wet soil (g) 61.18
Mass of wet specimen (g) 39.88
Mass of can + dry soil (g) 57.97
Mass of dry specimen, Md (g) 28.62
Final moisture content of specimen, wf % 0.393
Calculations
Mass of solids in specimen, Md (g)
28.6210
Mass of water in specimen before test, Mwi (g) Wi x Md 1688.6392
Mass of water in specimen after test, Mwf (g) Wf x Md 11.2590
ρw
1 g/cm3
Height of solids, Hs (cm) Md /(A*Gs* ρw) 0.55672
Height of water before test, Hwi (cm) Mwi/(A* ρw) 87.0431
Height of water after test, Hwf (cm) Mwf /(A* ρw) 0.5804
ΣΔH (cm)
0.3029
Height of specimen after test, (cm)
1.1491
Void ratio before test, eo (Hi-Hs)/Hs 1.6081
Void ratio after test, ef (Hf-Hs)/Hs 1.0641
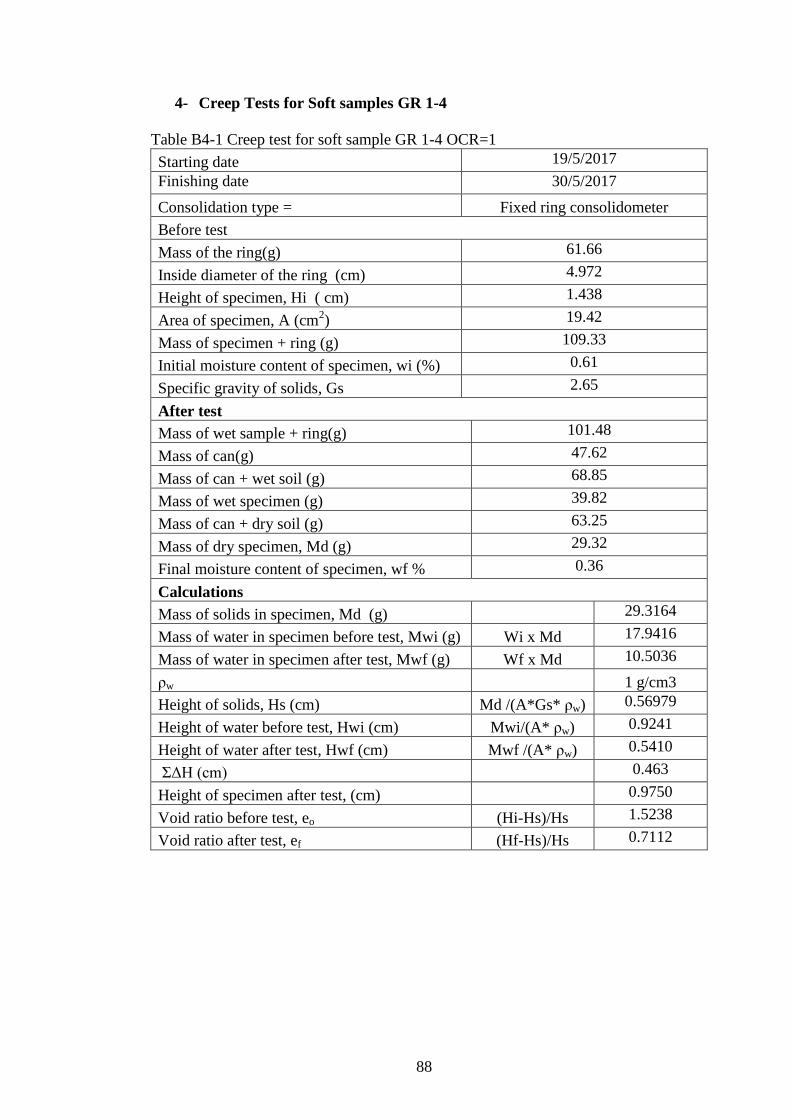
88
4- Creep Tests for Soft samples GR 1-4
Table B4-1 Creep test for soft sample GR 1-4 OCR=1
Starting date 19/5/2017
Finishing date
30/5/2017
Consolidation type = Fixed ring consolidometer
Before test
Mass of the ring(g) 61.66
Inside diameter of the ring (cm) 4.972
Height of specimen, Hi ( cm) 1.438
Area of specimen, A (cm2) 19.42
Mass of specimen + ring (g) 109.33
Initial moisture content of specimen, wi (%) 0.61
Specific gravity of solids, Gs 2.65
After test
Mass of wet sample + ring(g) 101.48
Mass of can(g) 47.62
Mass of can + wet soil (g) 68.85
Mass of wet specimen (g) 39.82
Mass of can + dry soil (g) 63.25
Mass of dry specimen, Md (g) 29.32
Final moisture content of specimen, wf % 0.36
Calculations
Mass of solids in specimen, Md (g)
29.3164
Mass of water in specimen before test, Mwi (g) Wi x Md 17.9416
Mass of water in specimen after test, Mwf (g) Wf x Md 10.5036
ρw
1 g/cm3
Height of solids, Hs (cm) Md /(A*Gs* ρw) 0.56979
Height of water before test, Hwi (cm) Mwi/(A* ρw) 0.9241
Height of water after test, Hwf (cm) Mwf /(A* ρw) 0.5410
ΣΔH (cm)
0.463
Height of specimen after test, (cm)
0.9750
Void ratio before test, eo (Hi-Hs)/Hs 1.5238
Void ratio after test, ef (Hf-Hs)/Hs 0.7112

89
Table B4-2 Creep test for soft sample GR 1-4 OCR=1.3
Starting date 19/5/2017
Finishing date
30/5/2017
Consolidation type = Fixed ring consolidometer
Before test
Mass of the ring(g) 60.27
Inside diameter of the ring (cm) 4.986
Height of specimen, Hi ( cm) 1.445
Area of specimen, A (cm2) 19.53
Mass of specimen + ring (g) 104.65
Initial moisture content of specimen, wi (%) 0.61
Specific gravity of solids, Gs 2.65
After test
Mass of wet sample + ring(g) 97.55
Mass of can(g) 82.69
Mass of can + wet soil (g) 107.61
Mass of wet specimen (g) 37.28
Mass of can + dry soil (g) 100.91
Mass of dry specimen, Md (g) 27.26
Final moisture content of specimen, wf % 0.37
Calculations
Mass of solids in specimen, Md (g)
27.2569
Mass of water in specimen before test, Mwi (g) Wi x Md 16.6812
Mass of water in specimen after test, Mwf (g) Wf x Md 10.0231
ρw
1 g/cm3
Height of solids, Hs (cm) Md /(A*Gs* ρw) 0.52679
Height of water before test, Hwi (cm) Mwi/(A* ρw) 0.8543
Height of water after test, Hwf (cm) Mwf /(A* ρw) 0.5133
ΣΔH (cm)
0.3994
Height of specimen after test, (cm)
1.0456
Void ratio before test, eo (Hi-Hs)/Hs 1.7430
Void ratio after test, ef (Hf-Hs)/Hs 0.9849
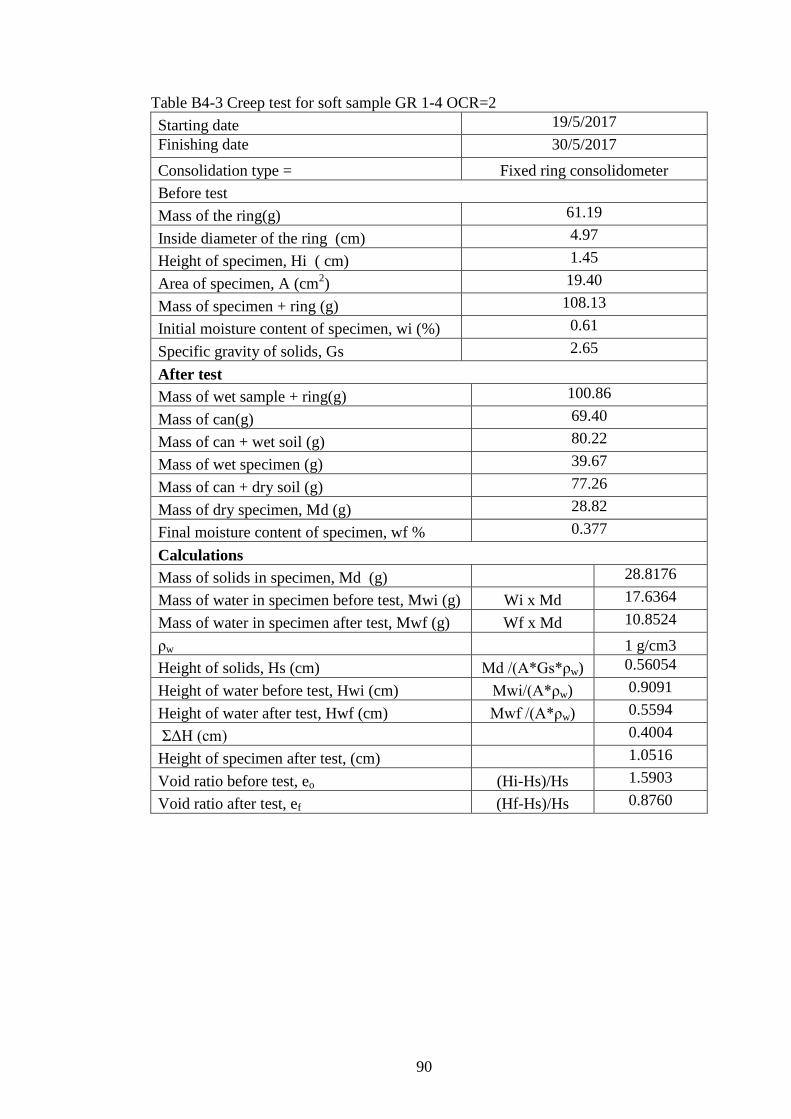
90
Table B4-3 Creep test for soft sample GR 1-4 OCR=2
Starting date 19/5/2017
Finishing date
30/5/2017
Consolidation type = Fixed ring consolidometer
Before test
Mass of the ring(g) 61.19
Inside diameter of the ring (cm) 4.97
Height of specimen, Hi ( cm) 1.45
Area of specimen, A (cm2) 19.40
Mass of specimen + ring (g) 108.13
Initial moisture content of specimen, wi (%) 0.61
Specific gravity of solids, Gs 2.65
After test
Mass of wet sample + ring(g) 100.86
Mass of can(g) 69.40
Mass of can + wet soil (g) 80.22
Mass of wet specimen (g) 39.67
Mass of can + dry soil (g) 77.26
Mass of dry specimen, Md (g) 28.82
Final moisture content of specimen, wf % 0.377
Calculations
Mass of solids in specimen, Md (g)
28.8176
Mass of water in specimen before test, Mwi (g) Wi x Md 17.6364
Mass of water in specimen after test, Mwf (g) Wf x Md 10.8524
ρw
1 g/cm3
Height of solids, Hs (cm) Md /(A*Gs*ρw) 0.56054
Height of water before test, Hwi (cm) Mwi/(A*ρw) 0.9091
Height of water after test, Hwf (cm) Mwf /(A*ρw) 0.5594
ΣΔH (cm)
0.4004
Height of specimen after test, (cm)
1.0516
Void ratio before test, eo (Hi-Hs)/Hs 1.5903
Void ratio after test, ef (Hf-Hs)/Hs 0.8760

91
Table B4-4 Creep test for soft sample GR 1-4 OCR=4
Starting date 19/5/2017
Finishing date
30/5/2017
Consolidation type = Fixed ring consolidometer
Before test
Mass of the ring(g) 61.66
Inside diameter of the ring (cm) 4.972
Height of specimen, Hi ( cm) 1.438
Area of specimen, A (cm2) 19.42
Mass of specimen + ring (g) 107.58
Initial moisture content of specimen, wi (%) 0.61
Specific gravity of solids, Gs 2.65
After test
Mass of wet sample + ring(g) 100.05
Mass of can(g) 71.55
Mass of can + wet soil (g) 90.75
Mass of wet specimen (g) 38.39
Mass of can + dry soil (g) 85.72
Mass of dry specimen, Md (g) 28.33
Final moisture content of specimen, wf % 0.35
Calculations
Mass of solids in specimen, Md (g)
28.3326
Mass of water in specimen before test, Mwi (g) Wi x Md 17.3396
Mass of water in specimen after test, Mwf (g) Wf x Md 10.0574
ρw
1 g/cm3
Height of solids, Hs (cm) Md /(A*Gs*ρw) 0.55067
Height of water before test, Hwi (cm) Mwi/(A*ρw) 0.8931
Height of water after test, Hwf (cm) Mwf /(A*ρw) 0.5180
ΣΔH (cm)
0.38324
Height of specimen after test, (cm)
1.0548
Void ratio before test, eo (Hi-Hs)/Hs 1.6114
Void ratio after test, ef (Hf-Hs)/Hs 0.9154

92
5- Creep Tests for Compacted samples GR 2
Table B5-1 Creep test for compacted sample GR-2 OCR=1
Starting date 13/6/2017
Finishing date
23/6/2017
Consolidation type = Fixed ring consolidometer
Before test
Mass of the ring(g) 60.76
Inside diameter of the ring (cm) 4.975
Height of specimen, Hi ( cm) 1.451
Area of specimen, A (cm2) 19.44
Mass of specimen + ring (g) 116.24
Initial moisture content of specimen, wi (%) 0.28
Specific gravity of solids, Gs 2.65
After test
Mass of wet sample + ring(g) 117.59
Mass of can(g) 49.80
Mass of can + wet soil (g) 59.00
Mass of wet specimen (g) 56.83
Mass of can + dry soil (g) 56.84
Mass of dry specimen, Md (g) 43.49
Final moisture content of specimen, wf % 0.31
Calculations
Mass of solids in specimen, Md (g)
43.4873
Mass of water in specimen before test, Mwi (g) Wi x Md 12.1764
Mass of water in specimen after test, Mwf (g) Wf x Md 13.3427
ρw
1 g/cm3
Height of solids, Hs (cm) Md /(A*Gs*ρw) 0.84419
Height of water before test, Hwi (cm) Mwi/(A*ρw) 0.6264
Height of water after test, Hwf (cm) Mwf /(A*ρw) 0.6864
ΣΔH (cm)
0.0045
Height of specimen after test, (cm)
1.4465
Void ratio before test, eo (Hi-Hs)/Hs 0.7188
Void ratio after test, ef (Hf-Hs)/Hs 0.7135
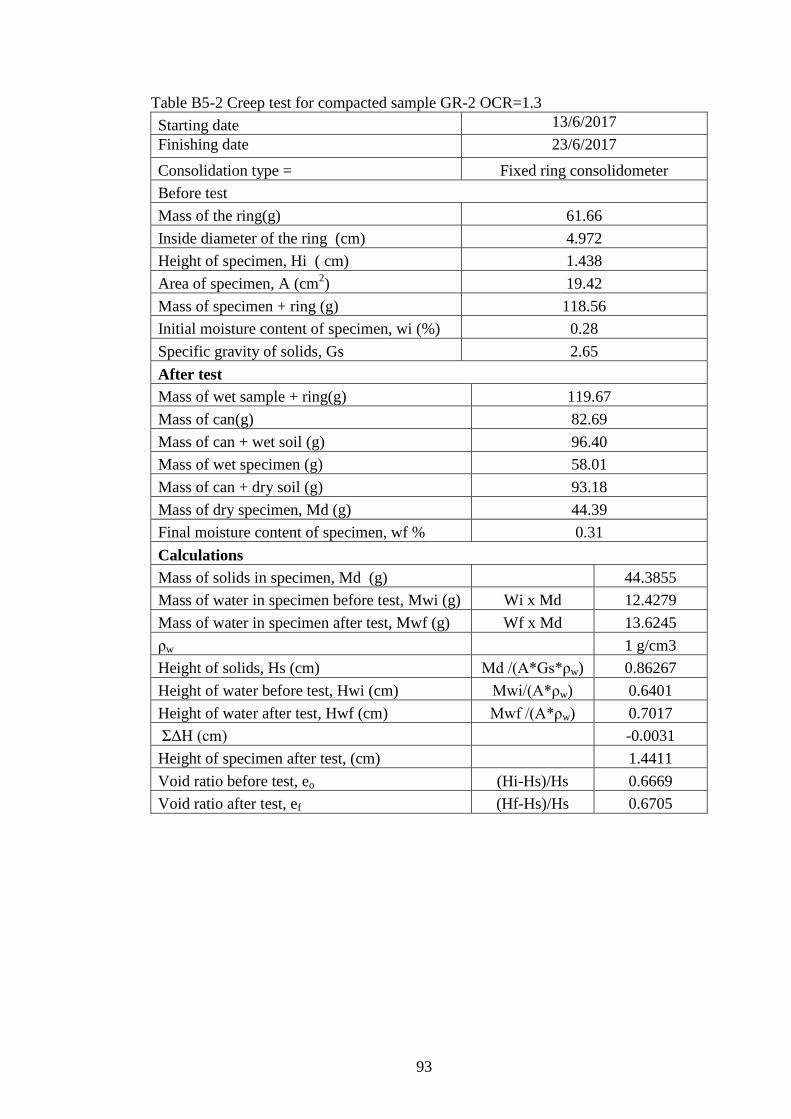
93
Table B5-2 Creep test for compacted sample GR-2 OCR=1.3
Starting date 13/6/2017
Finishing date
23/6/2017
Consolidation type = Fixed ring consolidometer
Before test
Mass of the ring(g) 61.66
Inside diameter of the ring (cm) 4.972
Height of specimen, Hi ( cm) 1.438
Area of specimen, A (cm2) 19.42
Mass of specimen + ring (g) 118.56
Initial moisture content of specimen, wi (%) 0.28
Specific gravity of solids, Gs 2.65
After test
Mass of wet sample + ring(g) 119.67
Mass of can(g) 82.69
Mass of can + wet soil (g) 96.40
Mass of wet specimen (g) 58.01
Mass of can + dry soil (g) 93.18
Mass of dry specimen, Md (g) 44.39
Final moisture content of specimen, wf % 0.31
Calculations
Mass of solids in specimen, Md (g)
44.3855
Mass of water in specimen before test, Mwi (g) Wi x Md 12.4279
Mass of water in specimen after test, Mwf (g) Wf x Md 13.6245
ρw
1 g/cm3
Height of solids, Hs (cm) Md /(A*Gs*ρw) 0.86267
Height of water before test, Hwi (cm) Mwi/(A*ρw) 0.6401
Height of water after test, Hwf (cm) Mwf /(A*ρw) 0.7017
ΣΔH (cm)
-0.0031
Height of specimen after test, (cm)
1.4411
Void ratio before test, eo (Hi-Hs)/Hs 0.6669
Void ratio after test, ef (Hf-Hs)/Hs 0.6705

94
Table B5-3 Creep test for compacted sample GR-2 OCR=2
Starting date 13/6/2017
Finishing date
23/6/2017
Consolidation type = Fixed ring consolidometer
Before test
Mass of the ring(g) 60.27
Inside diameter of the ring (cm) 4.986
Height of specimen, Hi ( cm) 1.445
Area of specimen, A (cm2) 19.53
Mass of specimen + ring (g) 117.13
Initial moisture content of specimen, wi (%) 0.28
Specific gravity of solids, Gs 2.65
After test
Mass of wet sample + ring(g) 118.55
Mass of can(g) 49.81
Mass of can + wet soil (g) 61.69
Mass of wet specimen (g) 58.28
Mass of can + dry soil (g) 58.86
Mass of dry specimen, Md (g) 44.40
Final moisture content of specimen, wf % 0.31
Calculations
Mass of solids in specimen, Md (g)
44.3968
Mass of water in specimen before test, Mwi (g) Wi x Md 12.4311
Mass of water in specimen after test, Mwf (g) Wf x Md 13.8832
ρw
1 g/cm3
Height of solids, Hs (cm) Md /(A*Gs*ρw) 0.85805
Height of water before test, Hwi (cm) Mwi/(A*ρw) 0.6367
Height of water after test, Hwf (cm) Mwf /(A*ρw) 0.7110
ΣΔH (cm)
0.0006
Height of specimen after test, (cm)
1.4444
Void ratio before test, eo (Hi-Hs)/Hs 0.6841
Void ratio after test, ef (Hf-Hs)/Hs 0.6834
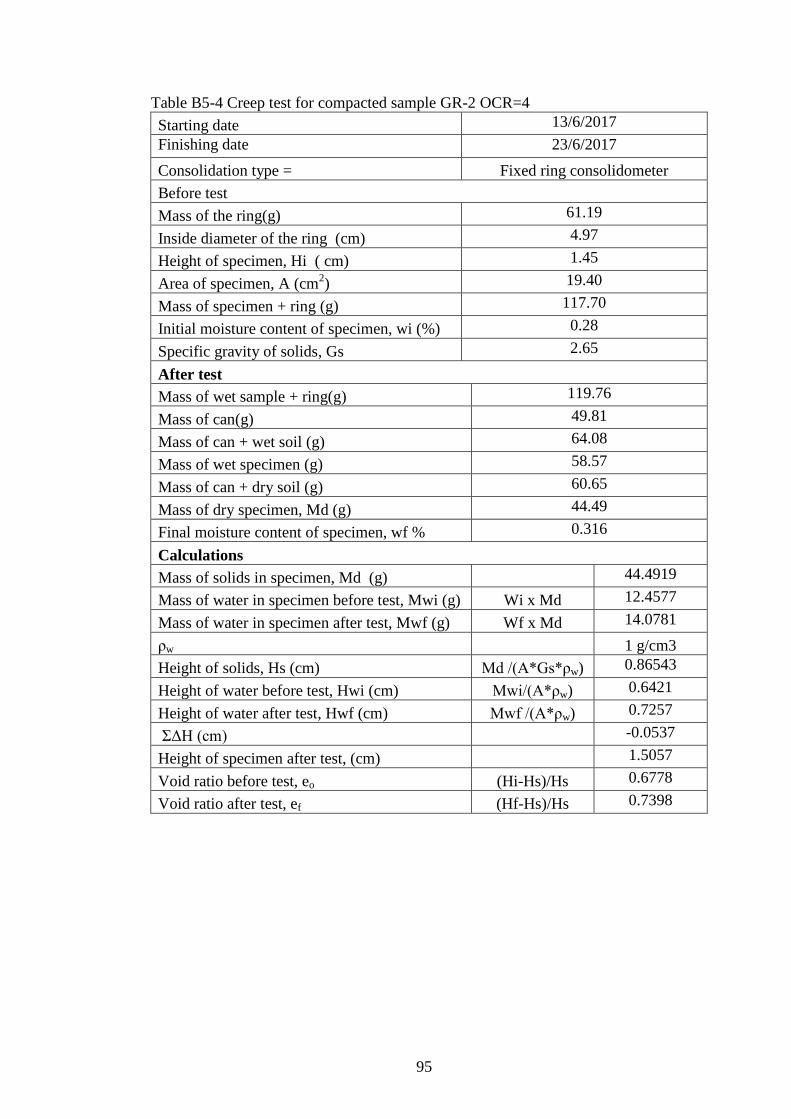
95
Table B5-4 Creep test for compacted sample GR-2 OCR=4
Starting date 13/6/2017
Finishing date
23/6/2017
Consolidation type = Fixed ring consolidometer
Before test
Mass of the ring(g) 61.19
Inside diameter of the ring (cm) 4.97
Height of specimen, Hi ( cm) 1.45
Area of specimen, A (cm2) 19.40
Mass of specimen + ring (g) 117.70
Initial moisture content of specimen, wi (%) 0.28
Specific gravity of solids, Gs 2.65
After test
Mass of wet sample + ring(g) 119.76
Mass of can(g) 49.81
Mass of can + wet soil (g) 64.08
Mass of wet specimen (g) 58.57
Mass of can + dry soil (g) 60.65
Mass of dry specimen, Md (g) 44.49
Final moisture content of specimen, wf % 0.316
Calculations
Mass of solids in specimen, Md (g)
44.4919
Mass of water in specimen before test, Mwi (g) Wi x Md 12.4577
Mass of water in specimen after test, Mwf (g) Wf x Md 14.0781
ρw
1 g/cm3
Height of solids, Hs (cm) Md /(A*Gs*ρw) 0.86543
Height of water before test, Hwi (cm) Mwi/(A*ρw) 0.6421
Height of water after test, Hwf (cm) Mwf /(A*ρw) 0.7257
ΣΔH (cm)
-0.0537
Height of specimen after test, (cm)
1.5057
Void ratio before test, eo (Hi-Hs)/Hs 0.6778
Void ratio after test, ef (Hf-Hs)/Hs 0.7398
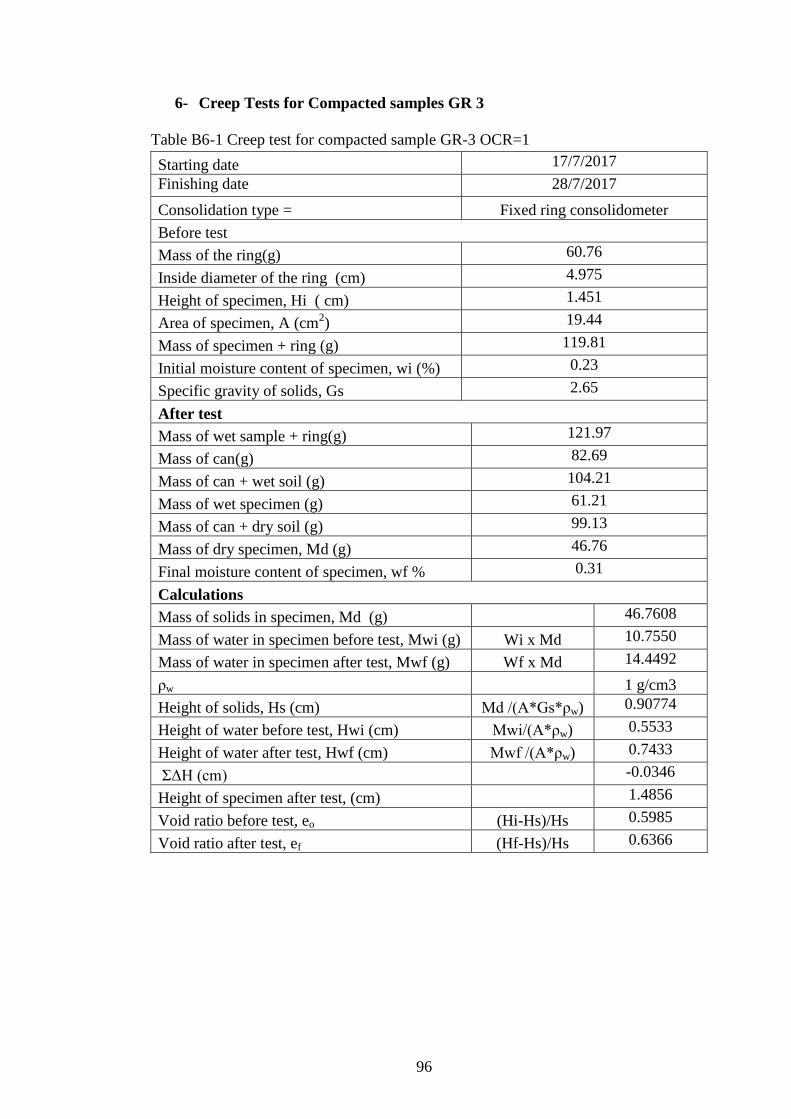
96
6- Creep Tests for Compacted samples GR 3
Table B6-1 Creep test for compacted sample GR-3 OCR=1
Starting date 17/7/2017
Finishing date
28/7/2017
Consolidation type = Fixed ring consolidometer
Before test
Mass of the ring(g) 60.76
Inside diameter of the ring (cm) 4.975
Height of specimen, Hi ( cm) 1.451
Area of specimen, A (cm2) 19.44
Mass of specimen + ring (g) 119.81
Initial moisture content of specimen, wi (%) 0.23
Specific gravity of solids, Gs 2.65
After test
Mass of wet sample + ring(g) 121.97
Mass of can(g) 82.69
Mass of can + wet soil (g) 104.21
Mass of wet specimen (g) 61.21
Mass of can + dry soil (g) 99.13
Mass of dry specimen, Md (g) 46.76
Final moisture content of specimen, wf % 0.31
Calculations
Mass of solids in specimen, Md (g)
46.7608
Mass of water in specimen before test, Mwi (g) Wi x Md 10.7550
Mass of water in specimen after test, Mwf (g) Wf x Md 14.4492
ρw
1 g/cm3
Height of solids, Hs (cm) Md /(A*Gs*ρw) 0.90774
Height of water before test, Hwi (cm) Mwi/(A*ρw) 0.5533
Height of water after test, Hwf (cm) Mwf /(A*ρw) 0.7433
ΣΔH (cm)
-0.0346
Height of specimen after test, (cm)
1.4856
Void ratio before test, eo (Hi-Hs)/Hs 0.5985
Void ratio after test, ef (Hf-Hs)/Hs 0.6366
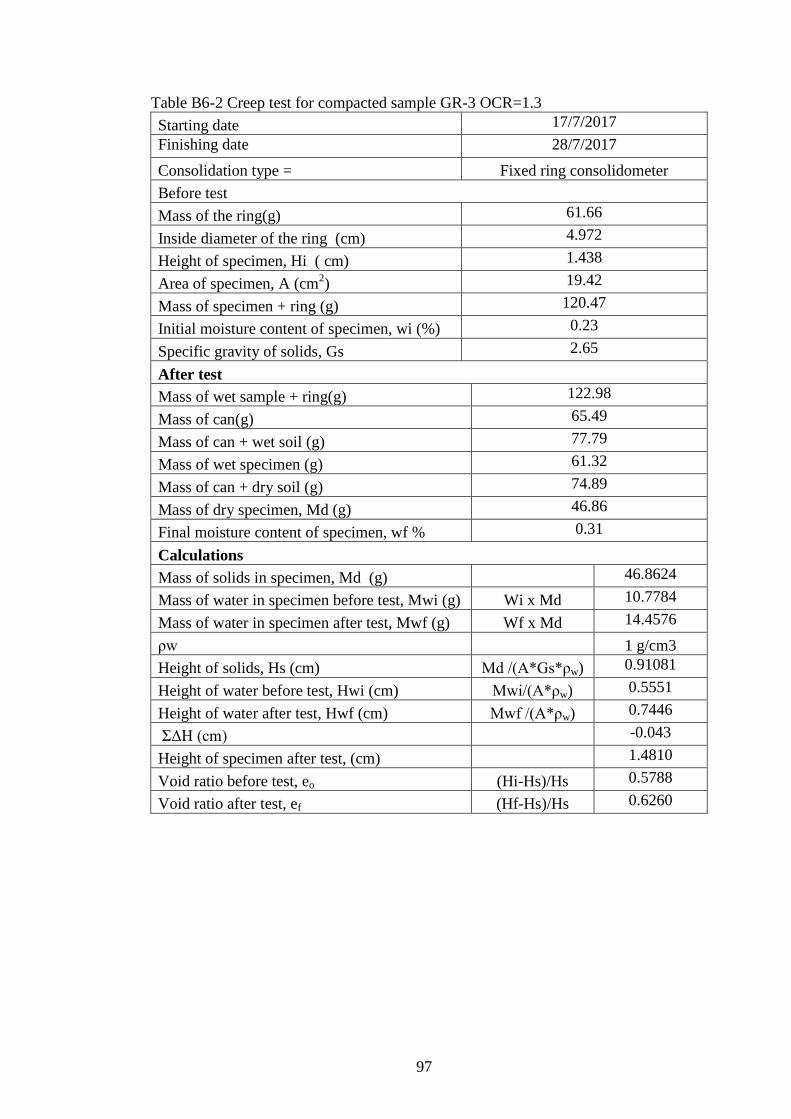
97
Table B6-2 Creep test for compacted sample GR-3 OCR=1.3
Starting date 17/7/2017
Finishing date
28/7/2017
Consolidation type = Fixed ring consolidometer
Before test
Mass of the ring(g) 61.66
Inside diameter of the ring (cm) 4.972
Height of specimen, Hi ( cm) 1.438
Area of specimen, A (cm2) 19.42
Mass of specimen + ring (g) 120.47
Initial moisture content of specimen, wi (%) 0.23
Specific gravity of solids, Gs 2.65
After test
Mass of wet sample + ring(g) 122.98
Mass of can(g) 65.49
Mass of can + wet soil (g) 77.79
Mass of wet specimen (g) 61.32
Mass of can + dry soil (g) 74.89
Mass of dry specimen, Md (g) 46.86
Final moisture content of specimen, wf % 0.31
Calculations
Mass of solids in specimen, Md (g)
46.8624
Mass of water in specimen before test, Mwi (g) Wi x Md 10.7784
Mass of water in specimen after test, Mwf (g) Wf x Md 14.4576
ρw
1 g/cm3
Height of solids, Hs (cm) Md /(A*Gs*ρw) 0.91081
Height of water before test, Hwi (cm) Mwi/(A*ρw) 0.5551
Height of water after test, Hwf (cm) Mwf /(A*ρw) 0.7446
ΣΔH (cm)
-0.043
Height of specimen after test, (cm)
1.4810
Void ratio before test, eo (Hi-Hs)/Hs 0.5788
Void ratio after test, ef (Hf-Hs)/Hs 0.6260
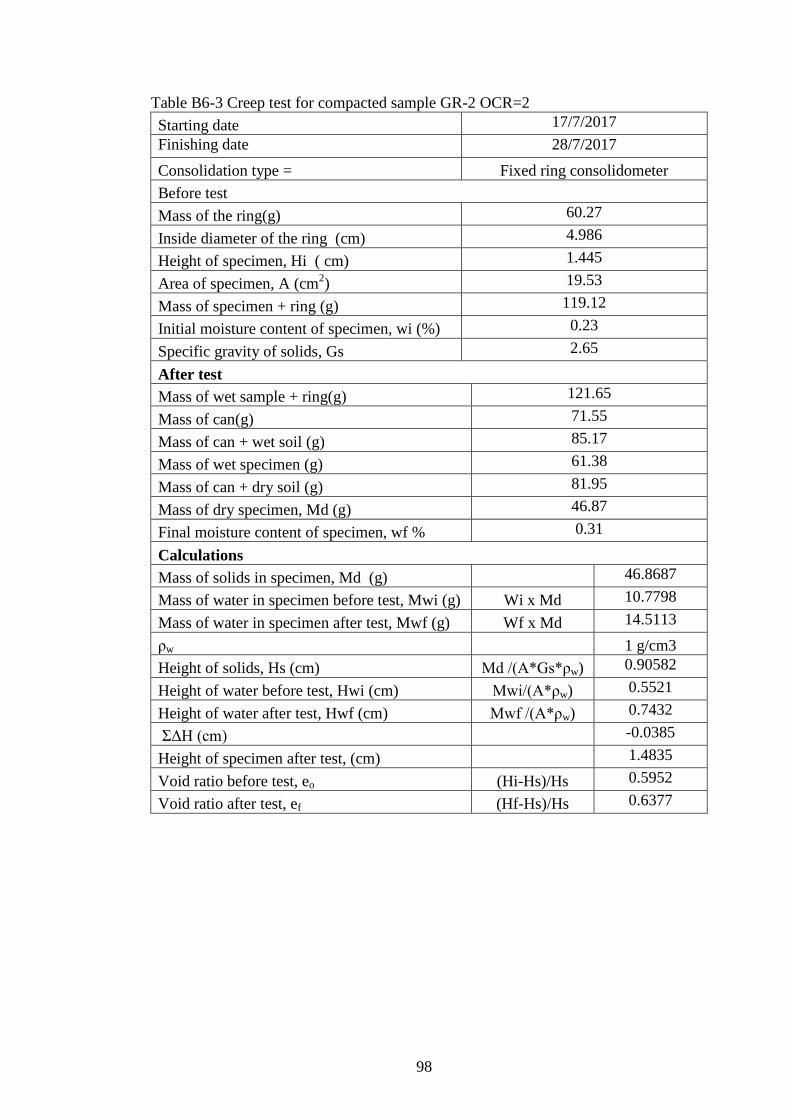
98
Table B6-3 Creep test for compacted sample GR-2 OCR=2
Starting date 17/7/2017
Finishing date
28/7/2017
Consolidation type = Fixed ring consolidometer
Before test
Mass of the ring(g) 60.27
Inside diameter of the ring (cm) 4.986
Height of specimen, Hi ( cm) 1.445
Area of specimen, A (cm2) 19.53
Mass of specimen + ring (g) 119.12
Initial moisture content of specimen, wi (%) 0.23
Specific gravity of solids, Gs 2.65
After test
Mass of wet sample + ring(g) 121.65
Mass of can(g) 71.55
Mass of can + wet soil (g) 85.17
Mass of wet specimen (g) 61.38
Mass of can + dry soil (g) 81.95
Mass of dry specimen, Md (g) 46.87
Final moisture content of specimen, wf % 0.31
Calculations
Mass of solids in specimen, Md (g)
46.8687
Mass of water in specimen before test, Mwi (g) Wi x Md 10.7798
Mass of water in specimen after test, Mwf (g) Wf x Md 14.5113
ρw
1 g/cm3
Height of solids, Hs (cm) Md /(A*Gs*ρw) 0.90582
Height of water before test, Hwi (cm) Mwi/(A*ρw) 0.5521
Height of water after test, Hwf (cm) Mwf /(A*ρw) 0.7432
ΣΔH (cm)
-0.0385
Height of specimen after test, (cm)
1.4835
Void ratio before test, eo (Hi-Hs)/Hs 0.5952
Void ratio after test, ef (Hf-Hs)/Hs 0.6377
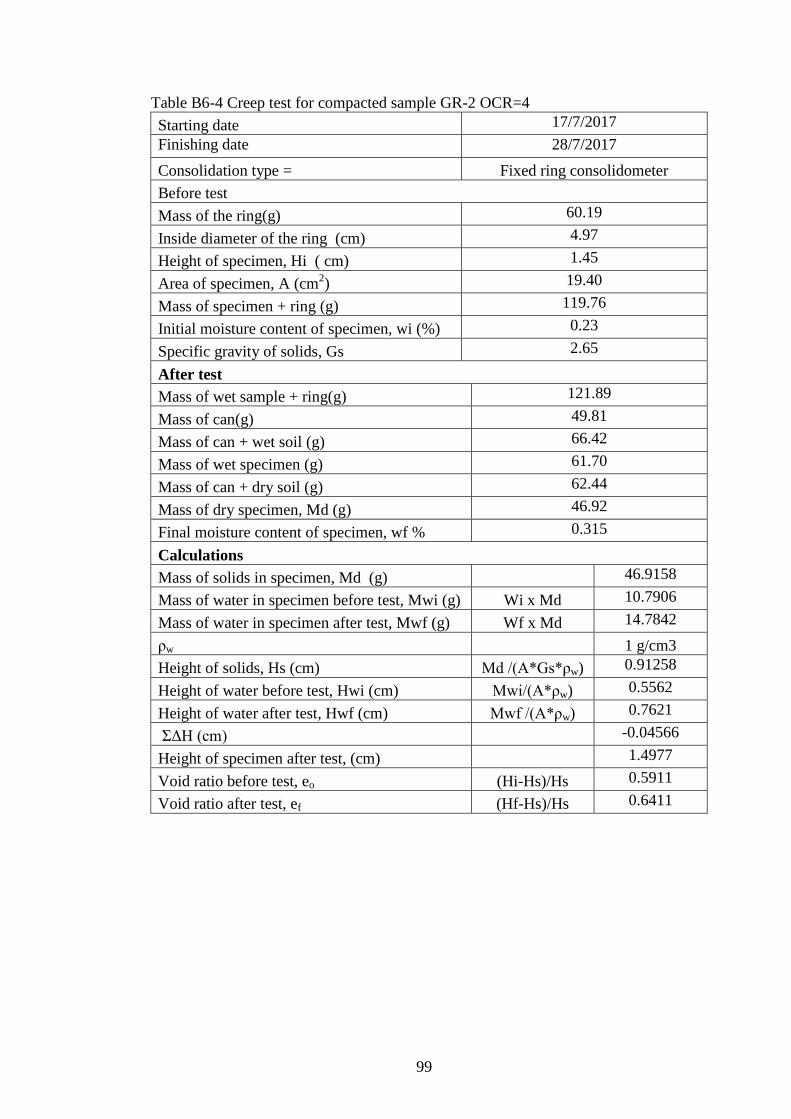
99
Table B6-4 Creep test for compacted sample GR-2 OCR=4
Starting date 17/7/2017
Finishing date
28/7/2017
Consolidation type = Fixed ring consolidometer
Before test
Mass of the ring(g) 60.19
Inside diameter of the ring (cm) 4.97
Height of specimen, Hi ( cm) 1.45
Area of specimen, A (cm2) 19.40
Mass of specimen + ring (g) 119.76
Initial moisture content of specimen, wi (%) 0.23
Specific gravity of solids, Gs 2.65
After test
Mass of wet sample + ring(g) 121.89
Mass of can(g) 49.81
Mass of can + wet soil (g) 66.42
Mass of wet specimen (g) 61.70
Mass of can + dry soil (g) 62.44
Mass of dry specimen, Md (g) 46.92
Final moisture content of specimen, wf % 0.315
Calculations
Mass of solids in specimen, Md (g)
46.9158
Mass of water in specimen before test, Mwi (g) Wi x Md 10.7906
Mass of water in specimen after test, Mwf (g) Wf x Md 14.7842
ρw
1 g/cm3
Height of solids, Hs (cm) Md /(A*Gs*ρw) 0.91258
Height of water before test, Hwi (cm) Mwi/(A*ρw) 0.5562
Height of water after test, Hwf (cm) Mwf /(A*ρw) 0.7621
ΣΔH (cm)
-0.04566
Height of specimen after test, (cm)
1.4977
Void ratio before test, eo (Hi-Hs)/Hs 0.5911
Void ratio after test, ef (Hf-Hs)/Hs 0.6411