Second Quarter Results - golarlngpartners.com/media/Files/G/Golar-Partners/documents/... · Unless...
15
© Golar LNG Partners LP Second Quarter 2018 Results 1
-
Upload
hoangkhanh -
Category
Documents
-
view
218 -
download
0
Transcript of Second Quarter Results - golarlngpartners.com/media/Files/G/Golar-Partners/documents/... · Unless...

© Golar LNG Partners LP
Second
Quarter
2018
Results1
© Golar LNG Partners LP
FORWARD
LOOKING
STATEMENTS
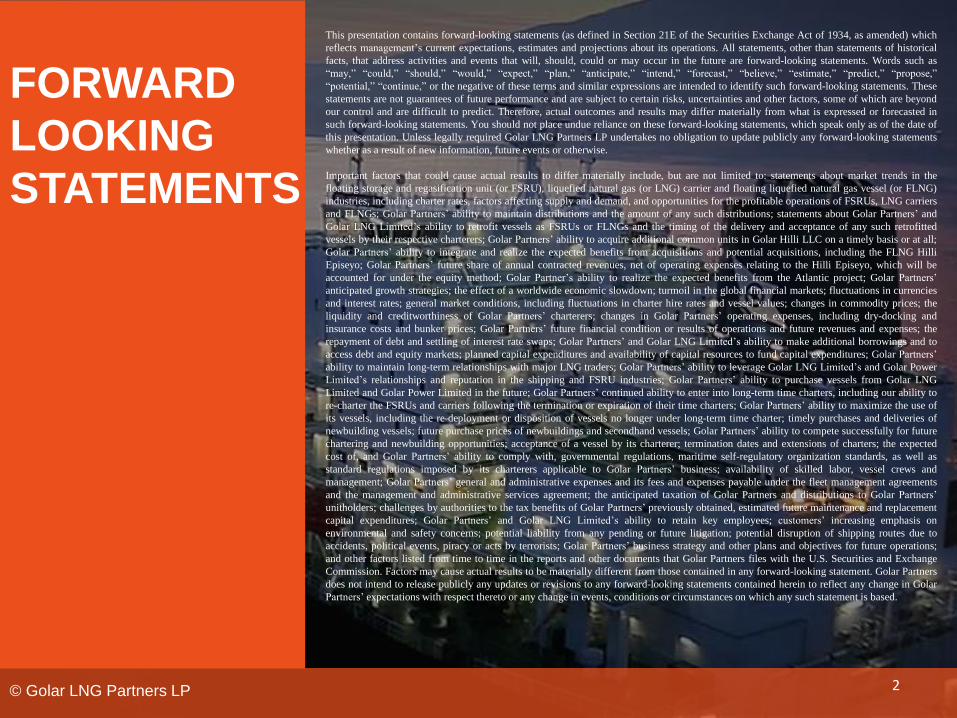
This presentation contains forward-looking statements (as defined in Section 21E of the Securities Exchange Act of 1934, as amended) which
reflects management’s current expectations, estimates and projections about its operations. All statements, other than statements of historical
facts, that address activities and events that will, should, could or may occur in the future are forward-looking statements. Words such as
“may,” “could,” “should,” “would,” “expect,” “plan,” “anticipate,” “intend,” “forecast,” “believe,” “estimate,” “predict,” “propose,”
“potential,” “continue,” or the negative of these terms and similar expressions are intended to identify such forward-looking statements. These
statements are not guarantees of future performance and are subject to certain risks, uncertainties and other factors, some of which are beyond
our control and are difficult to predict. Therefore, actual outcomes and results may differ materially from what is expressed or forecasted in
such forward-looking statements. You should not place undue reliance on these forward-looking statements, which speak only as of the date of
this presentation. Unless legally required Golar LNG Partners LP undertakes no obligation to update publicly any forward-looking statements
whether as a result of new information, future events or otherwise.
Important factors that could cause actual results to differ materially include, but are not limited to: statements about market trends in the
floating storage and regasification unit (or FSRU), liquefied natural gas (or LNG) carrier and floating liquefied natural gas vessel (or FLNG)
industries, including charter rates, factors affecting supply and demand, and opportunities for the profitable operations of FSRUs, LNG carriers
and FLNGs; Golar Partners’ ability to maintain distributions and the amount of any such distributions; statements about Golar Partners’ and
Golar LNG Limited’s ability to retrofit vessels as FSRUs or FLNGs and the timing of the delivery and acceptance of any such retrofitted
vessels by their respective charterers; Golar Partners’ ability to acquire additional common units in Golar Hilli LLC on a timely basis or at all;
Golar Partners’ ability to integrate and realize the expected benefits from acquisitions and potential acquisitions, including the FLNG Hilli
Episeyo; Golar Partners’ future share of annual contracted revenues, net of operating expenses relating to the Hilli Episeyo, which will be
accounted for under the equity method; Golar Partner’s ability to realize the expected benefits from the Atlantic project; Golar Partners’
anticipated growth strategies; the effect of a worldwide economic slowdown; turmoil in the global financial markets; fluctuations in currencies
and interest rates; general market conditions, including fluctuations in charter hire rates and vessel values; changes in commodity prices; the
liquidity and creditworthiness of Golar Partners’ charterers; changes in Golar Partners’ operating expenses, including dry-docking and
insurance costs and bunker prices; Golar Partners’ future financial condition or results of operations and future revenues and expenses; the
repayment of debt and settling of interest rate swaps; Golar Partners’ and Golar LNG Limited’s ability to make additional borrowings and to
access debt and equity markets; planned capital expenditures and availability of capital resources to fund capital expenditures; Golar Partners’
ability to maintain long-term relationships with major LNG traders; Golar Partners’ ability to leverage Golar LNG Limited’s and Golar Power
Limited’s relationships and reputation in the shipping and FSRU industries; Golar Partners’ ability to purchase vessels from Golar LNG
Limited and Golar Power Limited in the future; Golar Partners’ continued ability to enter into long-term time charters, including our ability to
re-charter the FSRUs and carriers following the termination or expiration of their time charters; Golar Partners’ ability to maximize the use of
its vessels, including the re-deployment or disposition of vessels no longer under long-term time charter; timely purchases and deliveries of
newbuilding vessels; future purchase prices of newbuildings and secondhand vessels; Golar Partners’ ability to compete successfully for future
chartering and newbuilding opportunities; acceptance of a vessel by its charterer; termination dates and extensions of charters; the expected
cost of, and Golar Partners’ ability to comply with, governmental regulations, maritime self-regulatory organization standards, as well as
standard regulations imposed by its charterers applicable to Golar Partners’ business; availability of skilled labor, vessel crews and
management; Golar Partners’ general and administrative expenses and its fees and expenses payable under the fleet management agreements
and the management and administrative services agreement; the anticipated taxation of Golar Partners and distributions to Golar Partners’
unitholders; challenges by authorities to the tax benefits of Golar Partners’ previously obtained, estimated future maintenance and replacement
capital expenditures; Golar Partners’ and Golar LNG Limited’s ability to retain key employees; customers’ increasing emphasis on
environmental and safety concerns; potential liability from any pending or future litigation; potential disruption of shipping routes due to
accidents, political events, piracy or acts by terrorists; Golar Partners’ business strategy and other plans and objectives for future operations;
and other factors listed from time to time in the reports and other documents that Golar Partners files with the U.S. Securities and Exchange
Commission. Factors may cause actual results to be materially different from those contained in any forward-looking statement. Golar Partners
does not intend to release publicly any updates or revisions to any forward-looking statements contained herein to reflect any change in Golar
Partners’ expectations with respect thereto or any change in events, conditions or circumstances on which any such statement is based.
2
© Golar LNG Partners LP
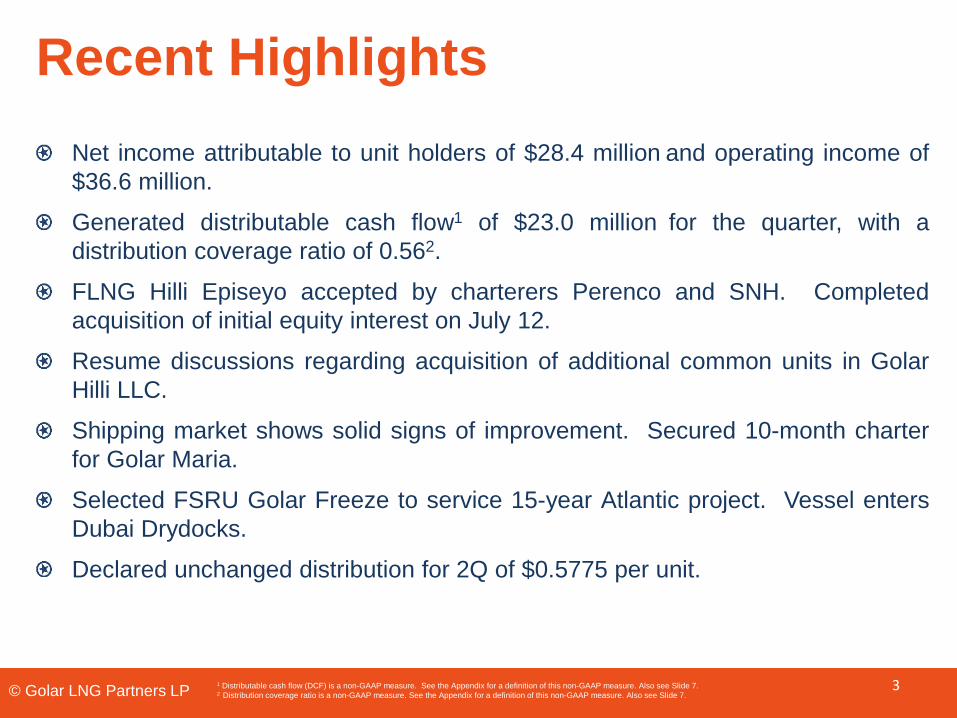
Recent Highlights
Net income attributable to unit holders of $28.4 million and operating income of
$36.6 million.
Generated distributable cash flow1 of $23.0 million for the quarter, with a
distribution coverage ratio of 0.562.
FLNG Hilli Episeyo accepted by charterers Perenco and SNH. Completed
acquisition of initial equity interest on July 12.
Resume discussions regarding acquisition of additional common units in Golar
Hilli LLC.
Shipping market shows solid signs of improvement. Secured 10-month charter
for Golar Maria.
Selected FSRU Golar Freeze to service 15-year Atlantic project. Vessel enters
Dubai Drydocks.
Declared unchanged distribution for 2Q of $0.5775 per unit.
1 Distributable cash flow (DCF) is a non-GAAP measure. See the Appendix for a definition of this non-GAAP measure. Also see Slide 7.2 Distribution coverage ratio is a non-GAAP measure. See the Appendix for a definition of this non-GAAP measure. Also see Slide 7.
3
© Golar LNG Partners LP
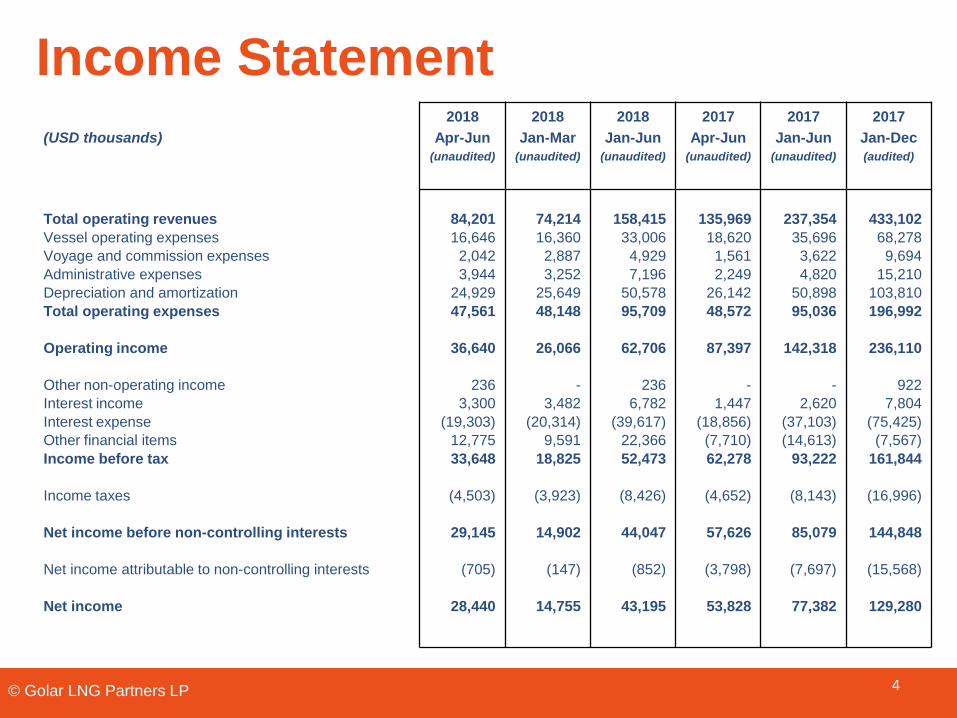
Income Statement
(USD thousands)
2018
Apr-Jun
(unaudited)
2018
Jan-Mar
(unaudited)
2018
Jan-Jun
(unaudited)
2017
Apr-Jun
(unaudited)
2017
Jan-Jun
(unaudited)
2017
Jan-Dec
(audited)
Total operating revenues
Vessel operating expenses
Voyage and commission expenses
Administrative expenses
Depreciation and amortization
Total operating expenses
Operating income
Other non-operating income
Interest income
Interest expense
Other financial items
Income before tax
Income taxes
Net income before non-controlling interests
Net income attributable to non-controlling interests
Net income
84,201
16,646
2,042
3,944
24,929
47,561
36,640
236
3,300
(19,303)
12,775
33,648
(4,503)
29,145
(705)
28,440
74,214
16,360
2,887
3,252
25,649
48,148
26,066
-
3,482
(20,314)
9,591
18,825
(3,923)
14,902
(147)
14,755
158,415
33,006
4,929
7,196
50,578
95,709
62,706
236
6,782
(39,617)
22,366
52,473
(8,426)
44,047
(852)
43,195
135,969
18,620
1,561
2,249
26,142
48,572
87,397
-
1,447
(18,856)
(7,710)
62,278
(4,652)
57,626
(3,798)
53,828
237,354
35,696
3,622
4,820
50,898
95,036
142,318
-
2,620
(37,103)
(14,613)
93,222
(8,143)
85,079
(7,697)
77,382
433,102
68,278
9,694
15,210
103,810
196,992
236,110
922
7,804
(75,425)
(7,567)
161,844
(16,996)
144,848
(15,568)
129,280
4
© Golar LNG Partners LP
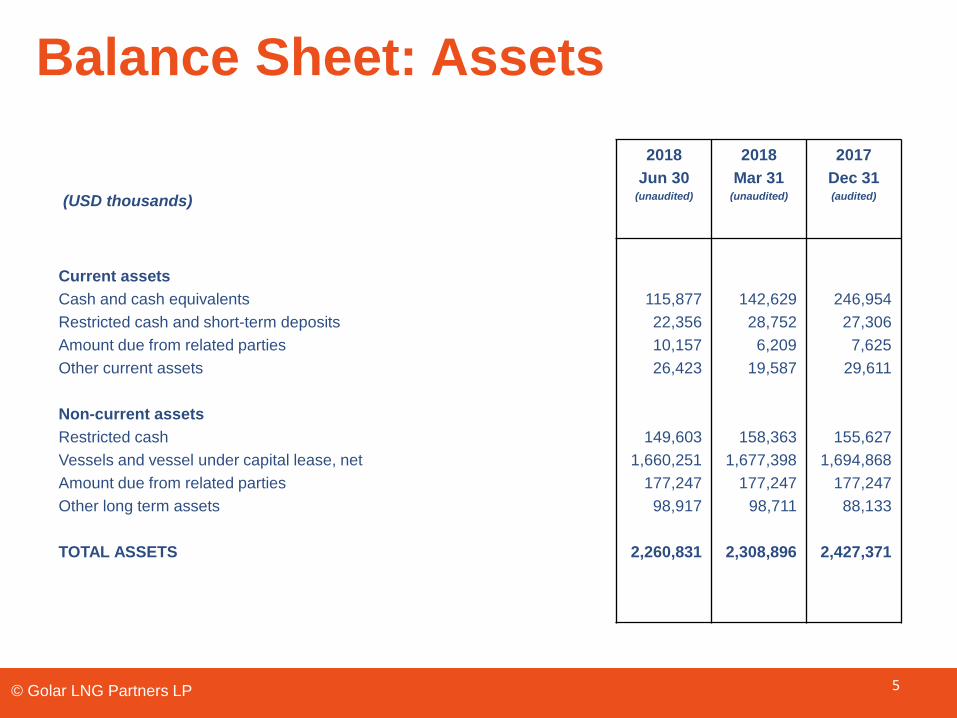
Balance Sheet: Assets
(USD thousands)
2018
Jun 30(unaudited)
2018
Mar 31(unaudited)
2017
Dec 31(audited)
Current assets
Cash and cash equivalents
Restricted cash and short-term deposits
Amount due from related parties
Other current assets
Non-current assets
Restricted cash
Vessels and vessel under capital lease, net
Amount due from related parties
Other long term assets
TOTAL ASSETS
115,877
22,356
10,157
26,423
149,603
1,660,251
177,247
98,917
2,260,831
142,629
28,752
6,209
19,587
158,363
1,677,398
177,247
98,711
2,308,896
246,954
27,306
7,625
29,611
155,627
1,694,868
177,247
88,133
2,427,371
5
© Golar LNG Partners LP
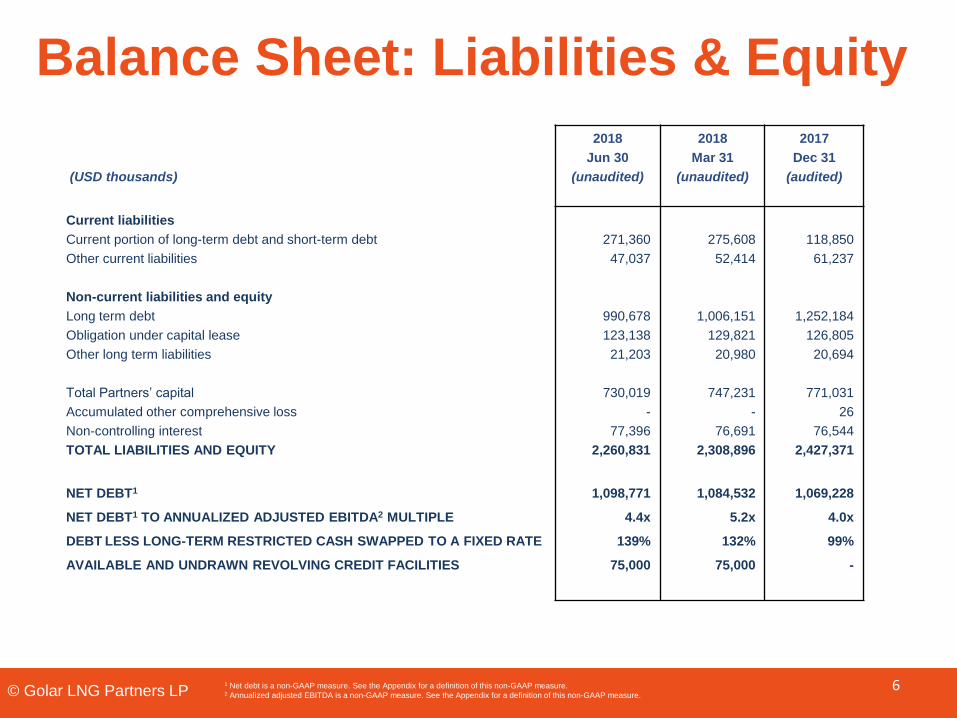
Balance Sheet: Liabilities & Equity
(USD thousands)
2018
Jun 30
(unaudited)
2018
Mar 31
(unaudited)
2017
Dec 31
(audited)
Current liabilities
Current portion of long-term debt and short-term debt
Other current liabilities
Non-current liabilities and equity
Long term debt
Obligation under capital lease
Other long term liabilities
Total Partners’ capital
Accumulated other comprehensive loss
Non-controlling interest
TOTAL LIABILITIES AND EQUITY
NET DEBT1
NET DEBT1 TO ANNUALIZED ADJUSTED EBITDA2 MULTIPLE
DEBT LESS LONG-TERM RESTRICTED CASH SWAPPED TO A FIXED RATE
AVAILABLE AND UNDRAWN REVOLVING CREDIT FACILITIES
271,360
47,037
990,678
123,138
21,203
730,019
-
77,396
2,260,831
1,098,771
4.4x
139%
75,000
275,608
52,414
1,006,151
129,821
20,980
747,231
-
76,691
2,308,896
1,084,532
5.2x
132%
75,000
118,850
61,237
1,252,184
126,805
20,694
771,031
26
76,544
2,427,371
1,069,228
4.0x
99%
-
1 Net debt is a non-GAAP measure. See the Appendix for a definition of this non-GAAP measure.2 Annualized adjusted EBITDA is a non-GAAP measure. See the Appendix for a definition of this non-GAAP measure.
6

© Golar LNG Partners LP
Distributable Cash Flow(USD thousands) Three months ended
Jun 30, 2018
Three months ended
Mar 31, 2018
Three months ended
Dec 31, 2017
Adjusted EBITDA1 61,805 51,715 67,053
Interest Income3,300 3,482 3,079
Interest expense (excluding amortization of deferred charges) (17,596) (17,734) (17,055)
Other cash financial items (224) (839) (1,625)
Current income tax charge (4,124) (3,483) (3,434)
Deferred (expenses)/income (234) (231) 332
Estimated maintenance & replacement capital expenditures (including drydocking reserve) (15,600) (15,796) (15,672)
Non-controlling interest’s share of DCF before maintenance and replacement capital expenditure (1,358) (800) (4,636)
Distributions relating to preferred units (3,019) (2,985) (2,080)
Distributable cash flow 22,950 13,329 25,962
Depreciation and amortization (24,929) (25,649) (26,556)
Unrealized net gain from interest rate derivatives7,829 10,693 9,222
Unrealized gain on IDR reset4,500 - 1,559
Unrealized foreign exchange gain / (loss)670 (262) (76)
Amortization of deferred charges(1,707) (2,580) (1,391)
Deferred expenses/(income)234 230 (332)
Movement in deferred tax liability(379) (440) (540)
Release of deferred tax asset- - (501)
Distributions relating to preferred units3,019 2,985 2,080
Estimated maintenance and replacement capital expenditures (including dry-docking reserve)15,600 15,796 15,672
Non-controlling interest’s share of DCF before maintenance and replacement capital expenditure1,358 800 4,636
Net income before non-controlling interests29,145 14,902 29,735
Distributions declared 41,169 41,224 41,478
Distribution coverage ratio2 0.56 0.32 0.63
1 Adjusted EBITDA is a non-GAAP measure. See the Appendix for a definition of this non-GAAP measure.2 Distributable cash flow is a non-GAAP measure. See the Appendix for a definition of this non-GAAP measure.
7

© Golar LNG Partners LP
$2.5bn of Effective Revenue Backlog(1)
Recent dropdown
2018 2019 2020 2021 2022 2023 2024 2025
Golar MariaSpot market
Golar Mazo (60% owned)Warm layup/spot market
Golar Eskimo10-year contract
Golar FreezeBalance of DUSUP + 15-year Atlantic charter
Golar SpiritCold layup
Methane Princess20-year contract
Nusantara Regas Satu11-year contract
Golar Winter10-year contract extended to 15 years
Golar Grand2-year contract
Hilli Episeyo (50% of common units)8-year contract
Golar Igloo5-year contract
Shell
Energy and
logistics
Company –
Atlantic basin
(1) See the Appendix for a definition of this non-GAAP measure.
Dusup = Dubai Supply Authority. Nusantara Regas = Joint venture between Pertamina and PGN (National Gas distribution company of Indonesia). KNPC = Kuwait
National Petroleum Company.
FS
RU
s
LN
G C
arr
iers
FL
NG
Base contract duration Options
Government of the
Hashemite
Kingdom of Jordan
International
Oil Major
Expected short-term trading
Spot & short-
term market
Spot market
8
Warm layupPeriod of duplicate hire Cold layup
© Golar LNG Partners LP
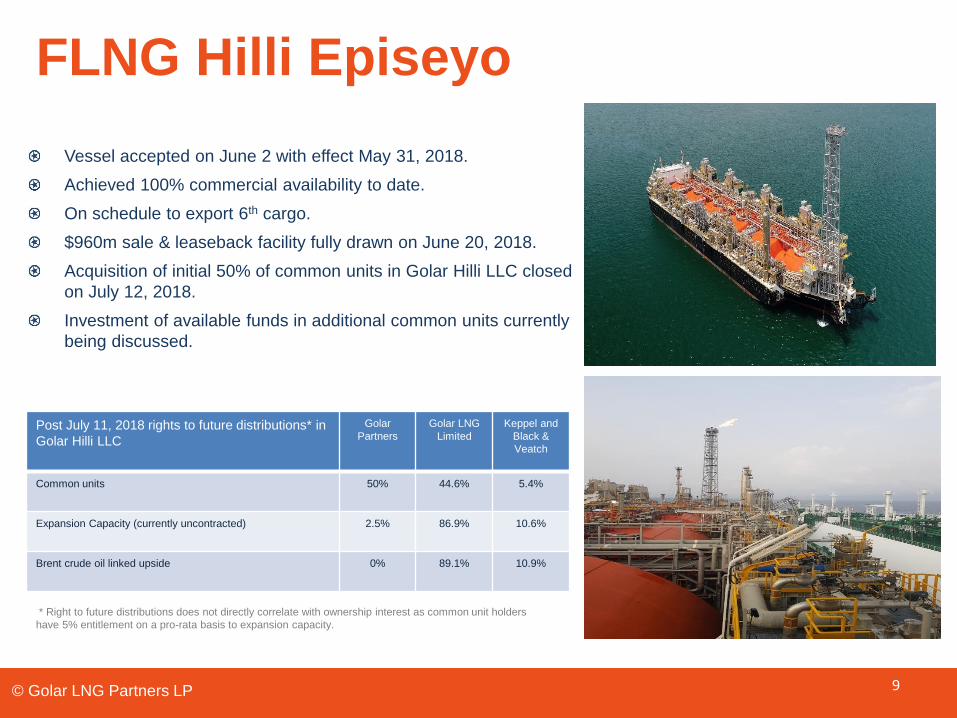
FLNG Hilli Episeyo
Vessel accepted on June 2 with effect May 31, 2018.
Achieved 100% commercial availability to date.
On schedule to export 6th cargo.
$960m sale & leaseback facility fully drawn on June 20, 2018.
Acquisition of initial 50% of common units in Golar Hilli LLC closed
on July 12, 2018.
Investment of available funds in additional common units currently
being discussed.
Post July 11, 2018 rights to future distributions* in
Golar Hilli LLC
Golar
Partners
Golar LNG
Limited
Keppel and
Black &
Veatch
Common units 50% 44.6% 5.4%
Expansion Capacity (currently uncontracted) 2.5% 86.9% 10.6%
Brent crude oil linked upside 0% 89.1% 10.9%
9
* Right to future distributions does not directly correlate with ownership interest as common unit holders
have 5% entitlement on a pro-rata basis to expansion capacity.
© Golar LNG Partners LP
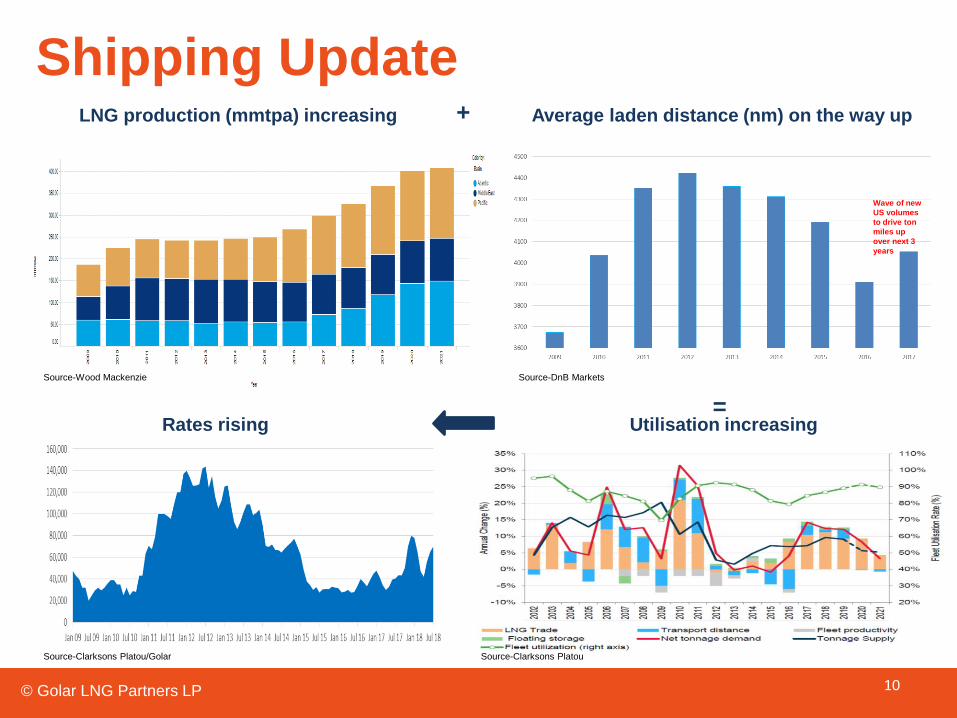
Shipping Update
10
LNG production (mmtpa) increasing Average laden distance (nm) on the way up+
Source-Clarksons Platou/Golar Source-Clarksons Platou
Source-Wood Mackenzie Source-DnB Markets
Utilisation increasing=
Rates rising
Wave of new
US volumes
to drive ton
miles up
over next 3
years

© Golar LNG Partners LP
FSRU UpdateFSRU Golar Freeze selected to service 15-year Atlantic contract:
Contract expected to commence around year-end.
Current charterer is obligated to pay charterhire until April 2019.
Vessel now in yard for dry-dock and necessary modifications. No offhire will be incurred.
Potential additional contracts: Lower capital cost of existing assets & access to low cost
conversion model allows Golar Partners to transact at rates that support other small-mid size
projects whilst still generating attractive returns:
Lebanon, Mexico, Columbia, Benin & Croatia recently issued tenders, some of which suit Golar
Partners smaller/cheaper assets. Golar Partners also in bilateral discussions for other projects.
Potential conversion contract for Maria or Mazo taking time to reach a final investment
decision.
Acquisition target: Golar Nanook represents a 2020 acquisition target:
25+1 year contract with forecast annual EBITDA1 $41 million adjusted annually for US CPI.
Attractive financing commitment received with long repayment profile.
Newbuild FSRU market highly competitive:
Golar Igloo charter likely to be re-tendered this year for commencement in 2019.
Current charterers very happy with Golar’s operations and 100% uptime – Partnership expects
to participate in tender.
If unsuccessful, Golar Igloo will trade in the increasingly attractive shipping market as a
conventional 170,000cbm TFDE carrier.
1 EBITDA is a non-GAAP measure. See the Appendix for a definition of this non-GAAP measure. 11
© Golar LNG Partners LP
Summary
Solid contract base – Effective revenue backlog1 of $2.5 billion equivalent to 7.4 revenue
backlog years2 including Atlantic FSRU contract and initial interest in FLNG Hilli Episeyo.
Excellent operating results – 100% utilization achieved for scheduled operations once again.
Fast growing LNG market – LNG share of total gas trade expected to increase from 33% to
40% by 2023.
Future acquisition and re-contracting opportunities – Additional common units in Golar Hilli
LLC and Hilli expansion; Golar Power 25-yr Sergipe project; Golar’s LNG carriers; new FLNG
and FSRU projects.
But first need to navigate transition period – 3Q distribution coverage ratio3 expected to be in
0.7 range. Improving shipping market expected to add some coverage in 4Q. Investment in
additional Golar Hilli LLC common units being considered but portion contemplated unlikely
to close gap to 1.0x.
Distribution therefore remains under review – Expect to provide clarity on future distribution
levels when 3Q distribution declared in October.
1 See the Appendix for a definition of this non-GAAP measure. 2 See the Appendix for a definition of this non-GAAP measure.
3 Distribution coverage ratio/coverage ratio is a non-GAAP measure. See the Appendix for a definition of this non-GAAP measure. Also see slide 7.
12
THANK
YOU
© Golar LNG Partners LP 13
© Golar LNG Partners LP
Appendix A – Non-GAAP measures
14
Adjusted EBITDA: Adjusted EBITDA is defined as earnings before interest, other financial items, taxes, depreciation and amortization and non-controlling interest.
Adjusted EBITDA is a non-GAAP financial measure. A non-GAAP financial measure is generally defined by the Securities and Exchange Commission as one that
purports to measure historical or future financial performance, financial position or cash flows, but excludes or includes amounts that would not be so adjusted in the
most comparable U.S. GAAP measure. We have presented Adjusted EBITDA as we believe it provides useful information to investors because it is a basis upon which
we measure our operations and efficiency. Adjusted EBITDA is not a measure of our financial performance under U.S. GAAP and should not be construed as an
alternative to net income (loss) or other financial measures presented in accordance with U.S. GAAP.
Distributable cash flow: Distributable cash flow is a non-GAAP measure used by investors to measure the performance of master limited partnerships. Refer to our
most recent quarterly earnings release on our investor relations section on our website (www.golarlngpartners.com) for a reconciliation to the most directly comparable
financial measure under US GAAP.
Distribution coverage ratio: Distribution coverage ratio represents the ratio of distributable cash flow to total cash distributions paid. Refer to our most recent
quarterly earnings release on our investor relations section on our website (www.golarlngpartners.com) for a reconciliation to the most directly comparable financial
measure under US GAAP.
Effective revenue backlog: Effective revenue backlog is defined as the contracted daily charter rate for each vessel multiplied by the number of scheduled hire days
for the remaining contract term, which includes GMLP's pro-rata share of Hilli Episeyo contractual billings which will be recorded as "Equity in net earnings of affiliates".
Net Debt: Net Debt is a non-GAAP financial measure and is defined as short-term debt and long-term debt, plus obligations under capital leases, less cash and cash
equivalents, less restricted cash and short-term deposits. Net Debt is used by investors to measure our performance and should not be considered as an alternative
to any other indicator of our performance calculated in accordance with U.S. GAAP. We believe that net debt assists our management and investors by increasing the
comparability of our combined indebtedness and cash position against other companies in our industry. Net Debt is not a measure of our financial performance under
U.S. GAAP and should not be construed as an alternative to other financial measures presented in accordance with U.S. GAAP.
Revenue backlog years: Revenue backlog years is defined as effective revenue backlog divided by annualized current quarter revenues. This includes the Atlantic
FSRU contracts and GMLP's pro-rata share of Hilli Episeyo contractual billings which will be recorded as "Equity in net earnings of affiliates".

© Golar LNG Partners LP
Appendix B
(USD thousands)
Three months
ended
June 30,
2018
Three months
ended
March 31,
2018
Three months
ended
June 30,
2017
Net Income 29,145 14,902 57,626
Depreciation and amortization 24,929 25,649 26,142
Interest Income (3,300) (3,482) (1,447)
Interest Expense 19,303 20,314 18,856
Other Financial Items (12,775) (9,591) 7,710
Tax 4,503 3,923 4,652
Adjusted EBITDA 61,805 51,715 113,539
Annualized Adjusted EBITDA (Adjusted EBITDA X 4) 247,220 206,860 454,156
Current portion of long-term debt and short term debt 271,360 275,608 115,758
Long-term debt 990,678 1,006,151 1,339,098
Obligation under capital lease 124,569 132,517 123,934
Total Debt 1,386,607 1,414,276 1,578,790
Cash and cash equivalents (115,877) (142,629) (301,486)
Restricted cash and short term deposits - current (22,356) (28,752) (16,845)
Restricted cash – non-current (149,603) (158,363) (121,206)
Total cash, cash equivalents and restricted cash (287,836) (329,744) (439,537)
Net Debt 1,098,771 1,084,532 1,139,253
Net Debt to Annualized Adjusted EBITDA 4.4 5.2 2.5
15