Second quarter results 2014 - kvaerner.com presentations/Q2... · Second quarter results 2014...
24
Second quarter results 2014 Edvard Grieg Martin Linge
-
Upload
duonghuong -
Category
Documents
-
view
223 -
download
7
Transcript of Second quarter results 2014 - kvaerner.com presentations/Q2... · Second quarter results 2014...

© Kvaerner 2014 16.07.2014
Second quarter results 2014
Edvard Grieg Martin Linge

© Kvaerner 2014 16.07.2014
Transocean Barents
2

© Kvaerner 2014 16.07.2014
Highlights
3
Second quarter 2014
Predictable performance –three projects delivered
Frame agreement and LoI for two Sverdrup jackets
Industrialising delivery model
Order backlog of NOK 21.5* billion
Subsequent events
Dividend of NOK 0.64 per share approved
* Including incorporated joint ventures.
The Eldfisk topside installed at the fieldPhoto: ConocoPhillips/Øyvind Sætre

© Kvaerner 2014 16.07.2014
Key financials
4
165 18
0
180
170
289
0
50
100
150
200
250
300
Q2'
13
Q3'
13
Q4'
13
Q1'
14
Q2'
14
RevenuesNOK million
-1 1
64
-570
-1 2
66
-1 1
62
-624
-1 400
-1 200
-1 000
-800
-600
-400
-200
Q2'
13
Q3'
13
Q4'
13
Q1'
14
Q2'
14
EBITDANOK million
Net current operating assetsNOK million
3 27
8
3 08
0 3 93
9
3 48
9
2 86
1
500
1 000
1 500
2 000
2 500
3 000
3 500
4 000
4 500
5 000
Q2'
13
Q3'
13
Q4'
13
Q1'
14
Q2'
14
EBITDA margin
* Reflecting 20 percent completion for one major project.Note: All historical figures restated after sale of the North American Construction business in Q4 2013.
5.0% 5.9% 4.6% 4.9% 10.1%
*

© Kvaerner 2014 16.07.2014
For execution in 2014
Order intake and -backlog
5
0
1 000
2 000
3 000
4 000
5 000
6 000
Q2'13 Q3'13 Q4'13 Q1'14 Q2'14
Order intakeNOK million
0
5 000
10 000
15 000
20 000
25 000
30 000
Q2'13 Q3'13 Q4'13 Q1'14 Q2'14
Order backlogNOK million
21 507
~35%
~45%
Note: All figures include incorporated joint ventures.
Estimated scheduling as of 30 June 2014:
5 360
For execution in 2016 and laterFor execution in 2015
~20%

© Kvaerner 2014 16.07.2014
0.0
1.0
2.0
3.0
4.0
Apr May Jun Jul Aug Sept Oct Nov Dec Jan Feb Mar Apr May Jun
LTIF TRIF
Health, safety, security and environment
6
One Lost time Injury (Burn injury on fingers)Six serious incidents Total of 9 recordable incidents
Lost time incident frequency (LTIF) and Total recorded incident frequency (TRIF)Per million work hours and 12 months rolling averages
Continued positive developments
Increase in risk observations
Highlights
2.14
0.21

© Kvaerner 2014 16.07.2014
Operational highlights
7
Living quarter for E. Grieg topside delivered to Stord facility
Fabrication start at Verdal for Nyhamna compressor houses
Preparing to move the Hebron GBS to deep water construction site
Sverdrup jackets FEED on-going
HEBRON GBS
EDVARD GRIEG TOPSIDE
SVERDRUP JACKETS
NYHAMNA ONSHORE
Photo: Magne Østby

© Kvaerner 2014 16.07.2014
Johan SverdrupFrame agreement and Letter of Intent for two jackets
8
Riser platform (RP) Drilling platform (DP)Illustration: Statoil
Frame agreement
Covers jackets to all Statoil operated fields
Regulates price level and work scope (EPC)
Future orders would be call-offs from existing agreement
Duration up to six years, until 2020
Letter of Intent
Project start-up: Q3 2014
Final contracts : Q4 14 (RP) and Q2 15 (DP)
Assembly start at Verdal in Q1 2016
Peak manning in 2017: 350 people
Deliveries: summer 2017 (RP) & spring 2018 (DP)

Second quarter financialsEiliv Gjesdal, Chief Financial Officer

© Kvaerner 2014 16.07.2014
Income statement
10
¹
Note: Following sale of operations, the Downstream & Industrials segment has been classified as discontinued operations, with comparative figures restated. Revenues excluding incorporated joint ventures.
Amounts in NOK million Q2 2014 Q1 2014Q2 2013
Restated YTD 2014YTD 2013 Restated FY 2013
Total revenue and other income 2 861 3 489 3 278 6 350 5 941 12 960 EBITDA 289 170 165 459 276 636 Depreciation and amortisation (17) (15) (15) (32) (30) (63)EBIT 272 155 150 427 246 573 Net financial income/(expense) (16) (20) (7) (36) (28) (96)Profit from associated companies and JVs and impairments (58) - (18) (58) (22) (78)
Profit before tax 198 135 124 333 196 399 Income tax expense (75) (40) (44) (115) (70) (160)Profit from continuing operations 123 95 80 218 126 239 Profit discontinued operations (27) (32) (5) (59) (14) 206 Net profit 96 63 75 159 112 445 EBITDA margin 10.1 % 4.9 % 5.0 % 7.2 % 4.6 % 4.9 %
Earnings per share (NOK)Basic and diluted EPS continuing operations 0.46 0.35 0.30 0.81 0.47 0.89 Basic and diluted EPS total operations 0.36 0.23 0.28 0.59 0.42 1.66
© Kvaerner 2014 16.07.2014
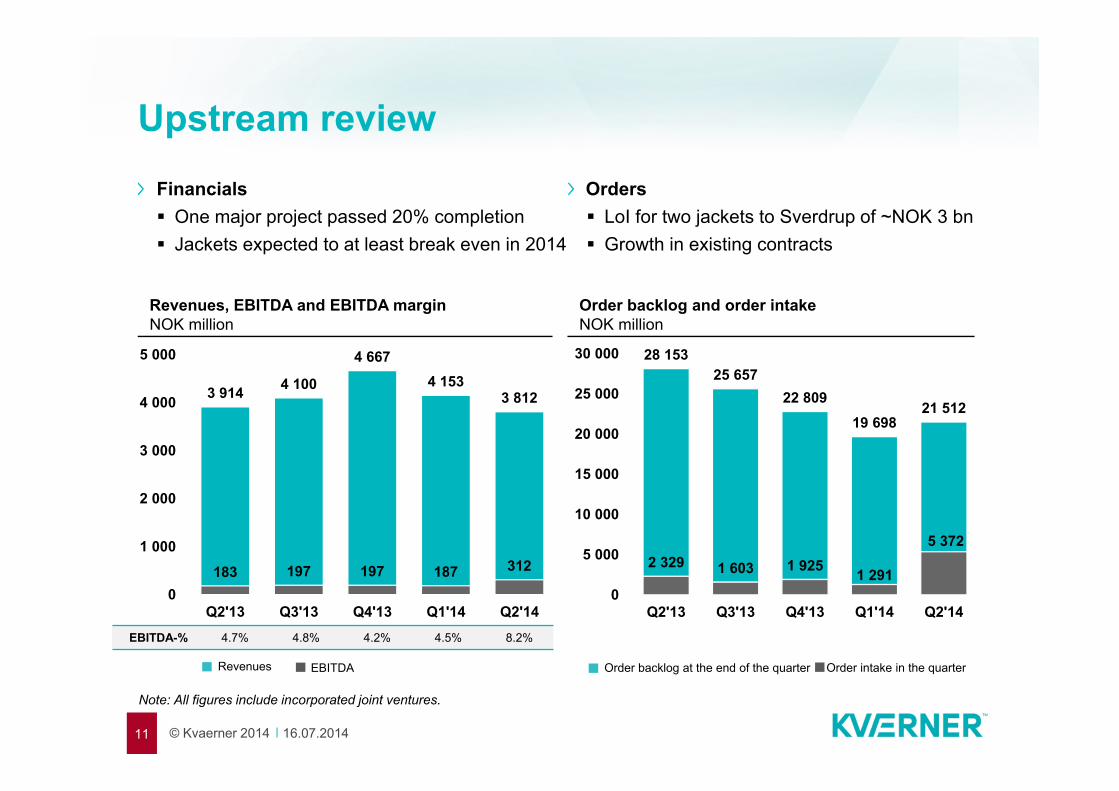
Upstream review
11
Financials One major project passed 20% completion Jackets expected to at least break even in 2014
Orders LoI for two jackets to Sverdrup of ~NOK 3 bn Growth in existing contracts
Revenues, EBITDA and EBITDA marginNOK million
Order backlog and order intakeNOK million
3 914 4 100
4 6674 153
3 812
183 197 197 187 312
0
1 000
2 000
3 000
4 000
5 000
Q2'13 Q3'13 Q4'13 Q1'14 Q2'14EBITDA-% 4.7% 4.8% 4.2% 4.5% 8.2%
Revenues EBITDA
Note: All figures include incorporated joint ventures.
28 15325 657
22 80919 698
21 512
2 329 1 603 1 925 1 291
5 372
0
5 000
10 000
15 000
20 000
25 000
30 000
Q2'13 Q3'13 Q4'13 Q1'14 Q2'14
Order backlog at the end of the quarter Order intake in the quarter

© Kvaerner 2014 16.07.2014
Increased revenue visibility
12
0
2 000
4 000
6 000
8 000
10 000
12 000
14 000
16 000
18 000
2011 2012 2013 2014 2015 2016+
Contractors Norway Concrete SolutionsJackets Contractors InternationalBacklog at 30 June 2014
Revenues and backlog by execution year (30 June 2014) NOK million
Upstream revenues 2014 NOK 15-16 billion
EBITDA margin 2014 Slower impact from improvements Procurement growth At least break even results in Jackets International business development
Q1&Q2 revenues

© Kvaerner 2014 16.07.2014
(1 500)
(1 000)
(500)
-
Q1'12 Q2'12 Q3'12 Q4'12 Q1'13 Q2'13 Q3'13 Q4'13 Q1'14 Q2'14
Cash flow and working capital development
13
Customer pre-payments² of NOK 23 millionFluctuations in working capital must be expectedCapital tied up in the Nordsee Ost project
Net current operating assets (NCOA) – Upstream segmentNOK million
¹ Q1 2014 restated with regards to cash transferred to discontinued operations² Invoicing in excess of cost and estimated earnings less amounts billed in advance but not received (on a project by project basis).
0
Amounts in NOK million Q2 2014 Q1 2014 1 Q2 2013 YTD 2014 YTD 2013 FY 2013Cash flow from operating activities (212) (62) 655 (274) 298 606 Cash flow from investing activities (75) (43) (40) (118) (61) 208 Cash flow from financing activities (172) (8) (176) (181) (181) (356)Translation adjustments 2 (2) 1 (0) 21 19 Net increase/(decrease) in cash and bank deposits (457) (115) 441 (573) 77 476

© Kvaerner 2014 16.07.2014
Balance sheet
14
30.06.2014 31.03.2014 30.06.2013 31.12.2013AssetsTotal non-current assets 2 137 2 137 2 232 2 150 Prepaid company tax 60 99 133 93 Current operating assets 2 363 3 533 2 874 3 121 Total cash and bank 972 1 430 1 146 1 545 Retained assets on business sold 744 884 - 916 Total assets 6 275 8 082 6 385 7 825
Total equity 2 511 2 547 2 267 2 511
Non-current interest bearing liabilities 483 480 474 479 Other non-current liabilities 184 172 189 170 Current operating liabilities 2 987 4 695 3 452 4 387 Current tax liabilities 61 39 4 56 Retained liabilities on business sold 50 148 - 223 Total liabilities 3 764 5 536 4 119 5 315 Total equity and liabilities 6 275 8 082 6 385 7 825
Equtiy ratio 40 % 32 % 35 % 32 %Net cash 493 953 723 1 069
Amounts in NOK million

© Kvaerner 2014 16.07.2014
Way forward and closing remarks
15
ENGINEERINGPROCUREMENT
CONSTRUCTION
Apprentices at Kvaerner Stord

© Kvaerner 2014 16.07.2014
2014 2015 2016 2017 2018 2019 Value at award
Eldfisk topside NOK 5.5 B
Edvard Grieg topside NOK 8 B
Aasta Hansteen compl. Undisclosed
Nyhamna onshore NOK 11 B
Edvard Grieg jacket NOK 1.1 B
Martin Linge jacket NOK 1.2 B
Sverdrup jackets NOK 3 B
Hebron GBS USD 1.5 B
Enping Phase II engineering Undisclosed
Balanced portfolio, solid platform for new contracts
16
Contractors InternationalConcrete Solutions
JacketsContractors Norway
Options

© Kvaerner 2014 16.07.2014
Two years of improvements are yielding results
17
© Kvaerner 2014 16.07.2014
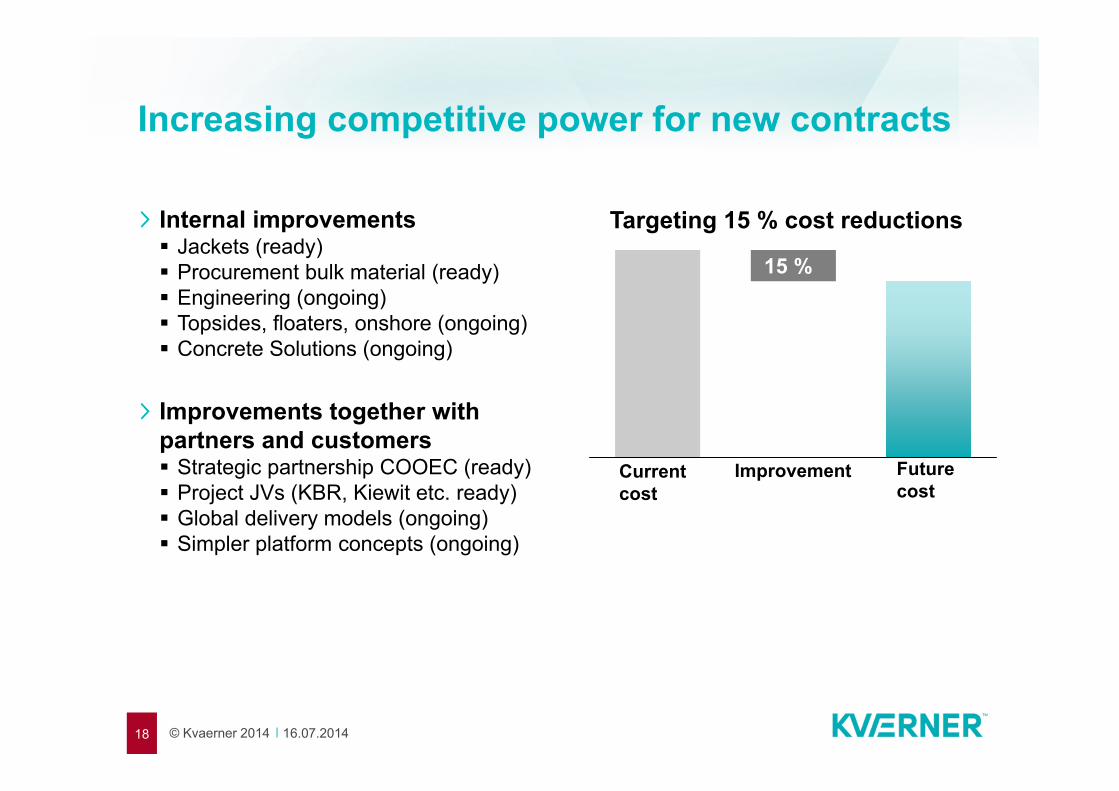
Increasing competitive power for new contracts
Internal improvements Jackets (ready) Procurement bulk material (ready) Engineering (ongoing) Topsides, floaters, onshore (ongoing) Concrete Solutions (ongoing)
Targeting 15 % cost reductions
15 %
Current cost
Improvement Future cost
Improvements together with partners and customers Strategic partnership COOEC (ready) Project JVs (KBR, Kiewit etc. ready) Global delivery models (ongoing) Simpler platform concepts (ongoing)
18

© Kvaerner 2014 16.07.2014
Several prospects well fit for our capabilities
19
Target markets
Arctic driller
Johan Sverdrup first phase
West White Rose extension
Subsea on a stick®
Studies finalised, positioning for pre-FEEDs
Frame agreement & LoI for two jackets
R&D project in Canada for concrete subsea tanks concepts
Illustration: Det Norske

© Kvaerner 2014 16.07.2014
Summary
20
Continued high activity, more balanced portfolio
Predictable execution of backlog
Gaining momentum in improvements - win new projects
Attractive market prospects
Sustained dividend policy
HSSE – core value and licence to operate
Maintain and develop home markets
International expansion
Hands-on management

© Kvaerner 2014 16.07.201422
APPENDIX

© Kvaerner 2014 16.07.2014
Revenue distribution – continuing operations
23
Share of revenues 2012Percent
Share of revenues last 12 monthsPercent
Share of revenues 2013Percent
NOK
8.9 billion
Contractors International Concrete Solutions Jackets Contractors Norway
NOK
13.4 billion
NOK
13.0 billion

© Kvaerner 2014 16.07.2014
CopyrightCopyright of all published material including photographs, drawings and images in this document remains vested in Kvaerner and third party contributors as appropriate. Accordingly, neither the whole nor any part of this document shall be reproduced in any form nor used in any manner without express prior permission and applicable acknowledgements. No trademark, copyright or other notice shall be altered or removed from any reproduction.
DisclaimerThis Presentation includes and is based, inter alia, on forward-looking information and statements that are subject to risks and uncertainties that could cause actual results to differ. These statements and this Presentation are based on current expectations, estimates and projections about global economic conditions, the economic conditions of the regions and industries that are major markets for Kværner ASA and Kværner ASA’s (including subsidiaries and affiliates) lines of business. These expectations, estimates and projections are generally identifiable by statements containing words such as “expects”, “believes”, “estimates” or similar expressions. Important factors that could cause actual results to differ materially from those expectations include, among others, economic and market conditions in the geographic areas and industries that are or will be major markets for Kvaerner’s businesses, oil prices, market acceptance of new products and services, changes in governmental regulations, interest rates, fluctuations in currency exchange rates and such other factors as may be discussed from time to time in the Presentation. Although Kværner ASA believes that its expectations and the Presentation are based upon reasonable assumptions, it can give no assurance that those expectations will be achieved or that the actual results will be as set out in the Presentation. Kværner ASA is making no representation or warranty, expressed or implied, as to the accuracy, reliability or completeness of the Presentation, and neither Kværner ASA nor any of its directors, officers or employees will have any liability to you or any other persons resulting from your use.
Copyright and disclaimer
24