Second Quarter Earnings Aug. 3, 2007 Jeff Sterba Chairman, President & CEO Chuck Eldred Executive...
34
Second Quarter Earnings Aug. 3, 2007 Jeff Sterba Chairman, President & CEO Chuck Eldred Executive Vice President & CFO
-
Upload
marybeth-white -
Category
Documents
-
view
219 -
download
3
Transcript of Second Quarter Earnings Aug. 3, 2007 Jeff Sterba Chairman, President & CEO Chuck Eldred Executive...

Second Quarter EarningsAug. 3, 2007
Jeff SterbaChairman, President & CEO
Chuck Eldred Executive Vice President & CFO
Preliminary and unaudited2 Aug. 3, 2007
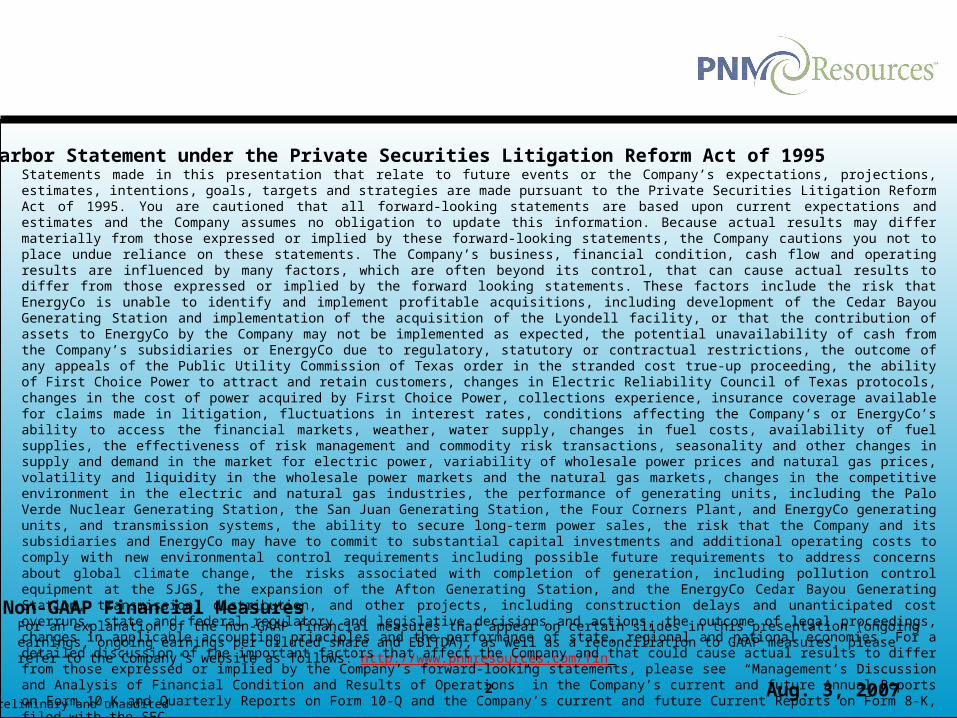
Safe Harbor Statement under the Private Securities Litigation Reform Act of 1995
Non-GAAP Financial MeasuresFor an explanation of the non-GAAP financial measures that appear on certain slides in this presentation (ongoing earnings, ongoing earnings per diluted share and EBITDA), as well as a reconciliation to GAAP measures, please refer to the Company's website as follows: http://www.pnmresources.com/fin
Statements made in this presentation that relate to future events or the Company’s expectations, projections, estimates, intentions, goals, targets and strategies are made pursuant to the Private Securities Litigation Reform Act of 1995. You are cautioned that all forward-looking statements are based upon current expectations and estimates and the Company assumes no obligation to update this information. Because actual results may differ materially from those expressed or implied by these forward-looking statements, the Company cautions you not to place undue reliance on these statements. The Company’s business, financial condition, cash flow and operating results are influenced by many factors, which are often beyond its control, that can cause actual results to differ from those expressed or implied by the forward looking statements. These factors include the risk that EnergyCo is unable to identify and implement profitable acquisitions, including development of the Cedar Bayou Generating Station and implementation of the acquisition of the Lyondell facility, or that the contribution of assets to EnergyCo by the Company may not be implemented as expected, the potential unavailability of cash from the Company’s subsidiaries or EnergyCo due to regulatory, statutory or contractual restrictions, the outcome of any appeals of the Public Utility Commission of Texas order in the stranded cost true-up proceeding, the ability of First Choice Power to attract and retain customers, changes in Electric Reliability Council of Texas protocols, changes in the cost of power acquired by First Choice Power, collections experience, insurance coverage available for claims made in litigation, fluctuations in interest rates, conditions affecting the Company’s or EnergyCo’s ability to access the financial markets, weather, water supply, changes in fuel costs, availability of fuel supplies, the effectiveness of risk management and commodity risk transactions, seasonality and other changes in supply and demand in the market for electric power, variability of wholesale power prices and natural gas prices, volatility and liquidity in the wholesale power markets and the natural gas markets, changes in the competitive environment in the electric and natural gas industries, the performance of generating units, including the Palo Verde Nuclear Generating Station, the San Juan Generating Station, the Four Corners Plant, and EnergyCo generating units, and transmission systems, the ability to secure long-term power sales, the risk that the Company and its subsidiaries and EnergyCo may have to commit to substantial capital investments and additional operating costs to comply with new environmental control requirements including possible future requirements to address concerns about global climate change, the risks associated with completion of generation, including pollution control equipment at the SJGS, the expansion of the Afton Generating Station, and the EnergyCo Cedar Bayou Generating Station, transmission, distribution, and other projects, including construction delays and unanticipated cost overruns, state and federal regulatory and legislative decisions and actions, the outcome of legal proceedings, changes in applicable accounting principles and the performance of state, regional and national economies. For a detailed discussion of the important factors that affect the Company and that could cause actual results to differ from those expressed or implied by the Company’s forward-looking statements, please see “Management’s Discussion and Analysis of Financial Condition and Results of Operations” in the Company’s current and future Annual Reports on Form 10-K and Quarterly Reports on Form 10-Q and the Company’s current and future Current Reports on Form 8-K, filed with the SEC.

Aug. 3, 20073Preliminary and unaudited
Highlights and Operational Review
2nd Quarter ongoing EPS $0.13, down from $0.25 in 2006
YTD ongoing EPS $0.52, down from $0.63 in 2006
Gas rate case appeal
Strong progress made on executing EnergyCo strategy
Lowering 2007 guidance

Aug. 3, 20074Preliminary and unaudited
Quarter-over-Quarter EPS Variances
Ongoing EPS: 2nd Quarter 2006 $0.25
Variance:Plant Performance 0.08 Regulated Load Growth 0.03 Weather Impact on Regulated Electric Business (0.03) Dilution (0.03) Coal Costs (0.03) First Choice Power (1) (0.07)
Mark-to-Market (0.11) All Other Variances 0.04
Total Variance ($0.12)
Ongoing EPS: 2nd Quarter 2007 $0.13
(1) Excludes mark-to-market changes

Aug. 3, 20075Preliminary and unaudited
2nd Quarter Plant Performance
48.1%
95.9%
72.1%
53.8%
89.1% 86.2%84.3%
93.2%
0%
20%
40%
60%
80%
100%
San Juan Four Corners Twin Oaks Palo Verde
Q2 2007 Q2 2006
Equivalent Availability Factor
Nuclear: 91%*Coal: 89%*
Lignite: 88%*
* Annual top quartile numbers from the North American Electricity Reliability Council

Aug. 3, 20076Preliminary and unaudited
First Choice Power 2nd Quarter Performance Drivers
Negative drivers: Overall weighted average use per customer was 12% lower than
same period 2006– Milder weather– Change in customer mix
Realized unit gross margins were lower than same period in 2006, but still in line with targeted expectations of mid-$20’s/MWh
Positive drivers: Overall 8.4% increase in customers 15.7% decrease in operating expenses Increase in delivered volume to Commercial and Industrial customers
Aug. 3, 20077Preliminary and unaudited
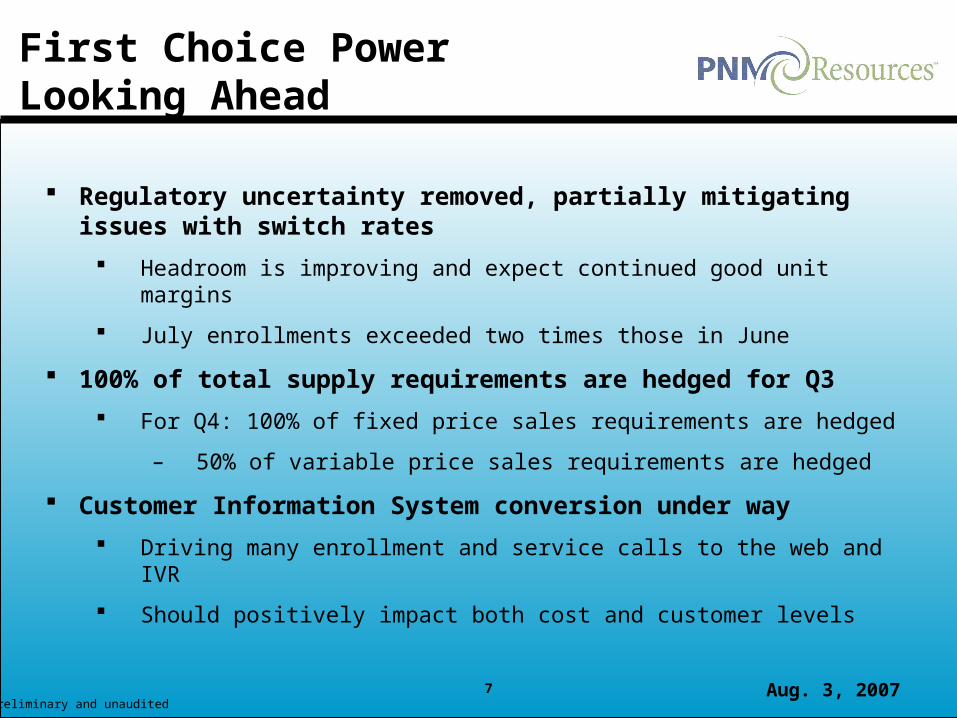
First Choice Power Looking Ahead
Regulatory uncertainty removed, partially mitigating issues with switch rates
Headroom is improving and expect continued good unit margins
July enrollments exceeded two times those in June
100% of total supply requirements are hedged for Q3
For Q4: 100% of fixed price sales requirements are hedged
– 50% of variable price sales requirements are hedged
Customer Information System conversion under way
Driving many enrollment and service calls to the web and IVR
Should positively impact both cost and customer levels
Aug. 3, 20078Preliminary and unaudited
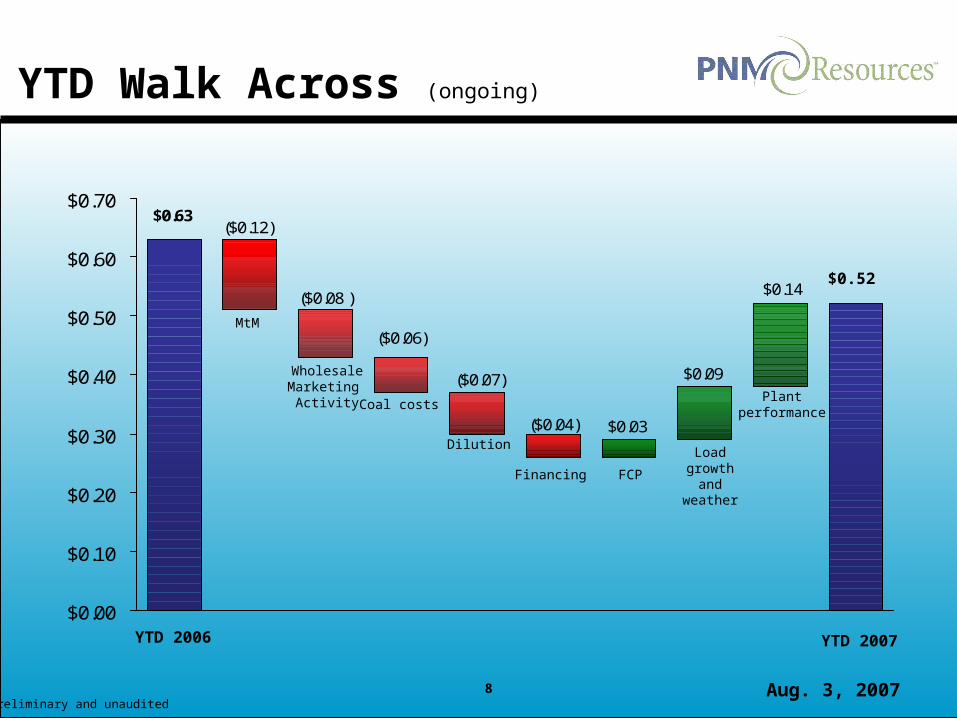
YTD Walk Across (ongoing)
$0.63
($0.04)
($0.12)
($0.08 )
($0.06)
($0.07)
$0.14
$0.09
$0.03
$0.00
$0.10
$0.20
$0.30
$0.40
$0.50
$0.60
$0.70
Load growth
and weather
Plant performance
Financing
Dilution
Coal costs
WholesaleMarketing
Activity
MtM
FCP
YTD 2006 YTD 2007
$0.52

Aug. 3, 20079Preliminary and unaudited
YTD Mark-to-Market Changes2007 vs. 2006
FCP Strategy: Hedge wholesale supply associated with retail load and optimize hedged positions
Q2 Impact: MtM essentially flat in 2007. Unfavorable variance versus last year reflects non-recurrence of 2006’s gain.
PNM Strategy: Hedge 2007 uncertainty around plant performance with forward purchases of gas and electricity
Q3/Q4 Impact: MtM will reverse, however higher energy costs are expected due to fixed-price hedged position
YTD MtM Gain/(Loss) - $M EPS2007 2006 Fav/(Unf) Variance
PNM ($11.2) ($2.0) ($9.2) ($0.07)First Choice (0.2) 5.6 (5.8) (0.05) Total PNMR ($11.4) $3.6 ($15.0) ($0.12)
EPS ($0.09) $0.03 ($0.12)

Aug. 3, 200710Preliminary and unaudited
YTD EPS by Segment (ongoing)
YTD 2007 YTD 2006 +/-
Total Diluted EPS $0.52 $0.63 ($0.11)
Regulated Operations:
PNM Electric $0.20 $0.22 ($0.02)
PNM Gas $0.12 $0.08 $0.04
TNMP Electric $0.07 $0.06 $0.01
Total Regulated $0.39 $0.36 $0.03
Unregulated Operations:
Wholesale $0.11 $0.21 ($0.10)
First Choice $0.16 $0.20 ($0.04)
EnergyCo $0.01 $0.00 $0.01
Total Unregulated $0.28 $0.41 ($0.13)
Corp/Other ($0.15) ($0.14) ($0.01)
Aug. 3, 200711Preliminary and unaudited
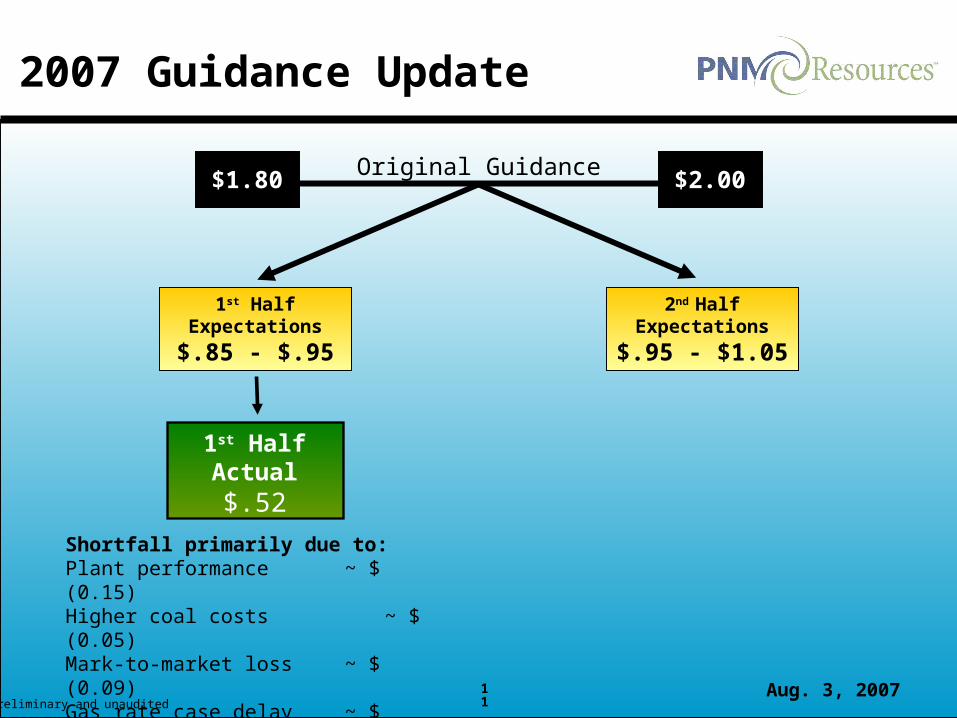
2007 Guidance Update
$1.80 $2.00Original Guidance
1st HalfExpectations
$.85 - $.95
Shortfall primarily due to:Plant performance ~ $ (0.15) Higher coal costs ~ $ (0.05)Mark-to-market loss ~ $ (0.09)Gas rate case delay ~ $ (0.04)
1st HalfActual$.52
2nd HalfExpectations
$.95 - $1.05

Aug. 3, 200712Preliminary and unaudited
2007 Guidance Update
$1.80 $2.00Original Guidance
1st HalfExpectations
$.85 - $.95
1st HalfActual$.52
2nd HalfExpectations
$.95 - $1.05
Drivers of ChangePlant performance ~ $ (0.07) Afton start-up ~ $ (0.04)Higher energy costs ~ $ (0.04)Gas rate increase ~ $ (0.02)
Revised 2nd HalfExpectations$.78 - $.88

Aug. 3, 200713Preliminary and unaudited
2007 Guidance Update
$1.80 $2.00Original Guidance
Revised 2nd HalfExpectations$.78 - $.88
$1.30 $1.40Revised Guidance
1st HalfActual$.52
Aug. 3, 200714Preliminary and unaudited
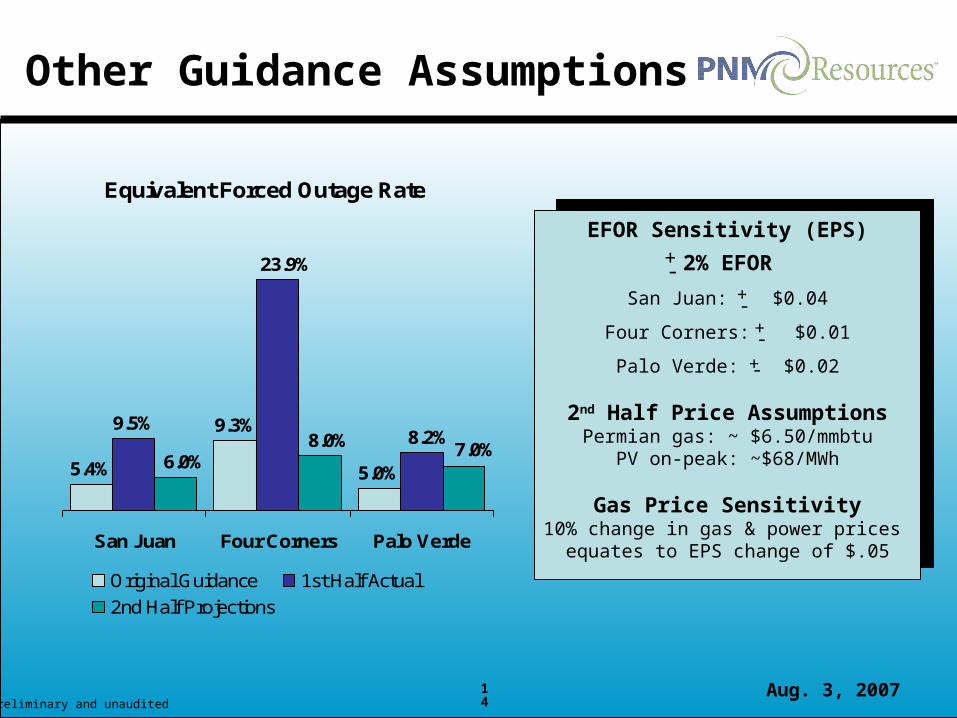
Other Guidance Assumptions
Equivalent Forced Outage Rate
5.4%
9.3%9.5%
5.0%
23.9%
8.2%7.0%8.0%
6.0%
San Juan Four Corners Palo Verde
Original Guidance 1st Half Actual
2nd Half Projections
EFOR Sensitivity (EPS)
2% EFOR
San Juan: $0.04
Four Corners: $0.01
Palo Verde: $0.02
2nd Half Price AssumptionsPermian gas: ~ $6.50/mmbtu
PV on-peak: ~$68/MWh
Gas Price Sensitivity10% change in gas & power prices
equates to EPS change of $.05
+-
+-
+-
+-

Aug. 3, 200715Preliminary and unaudited
EnergyCo Strategy
LocationConstrained zonesPrimarily ERCOT
Long-term goal of regional diversity
Financial CriteriaStrong cash flow
5 yr. avg. cash on cash returns of 13%+
Unlevered IRR in excess of 8.5%
OperationsStrong on-siteoperating team
Reliable low-costtechnology
Contracts/HedgesTarget 50%+ of portfolio
Protect against price declines& capture value of volatility
Fuel Mix & Technology
Base load assets for stability
Peaking in load-serving areas
State-of-art emissioncontrols
Measured, disciplined growth
Seek strong cash flow over short-term
accretion
2007 Targeted EBITDA: $14 million($0.07 EPS to PNMR)

Aug. 3, 200716Preliminary and unaudited
EnergyCo Development Project
Joint project with NRG Energy 550-MW unit at Cedar Bayou facility 275 MW available to EnergyCo by summer 2009 Existing site within Houston zone Approximate $390 million project costs(1) or $710/kW Use EnergyCo credit facility during construction $0.04 to $0.06 EPS accretion in first full year
Cedar Bayou Generating Station Unit 4
(1) Excludes interest during construction

Aug. 3, 200717Preliminary and unaudited
EnergyCo Update
(1) Online summer 2009
Purchased from Dynegy Acquisition completed Aug. 1 614 MW facility Two off-take contracts >400 MW available to market Purchase price: $467.5 million Slightly accretive in 2008
Altura Cogen (formerly Lyondell) EnergyCo’s Growing Portfolio1.Twin Oaks 305 MW2.Altura Cogen 614 MW3.Cedar Bayou 270 MW(1)
Total 1,189 MW
EnergyCo’s Growing Portfolio1.Twin Oaks 305 MW2.Altura Cogen 614 MW3.Cedar Bayou 270 MW(1)
Total 1,189 MW
1
23
Aug. 3, 200718Preliminary and unaudited
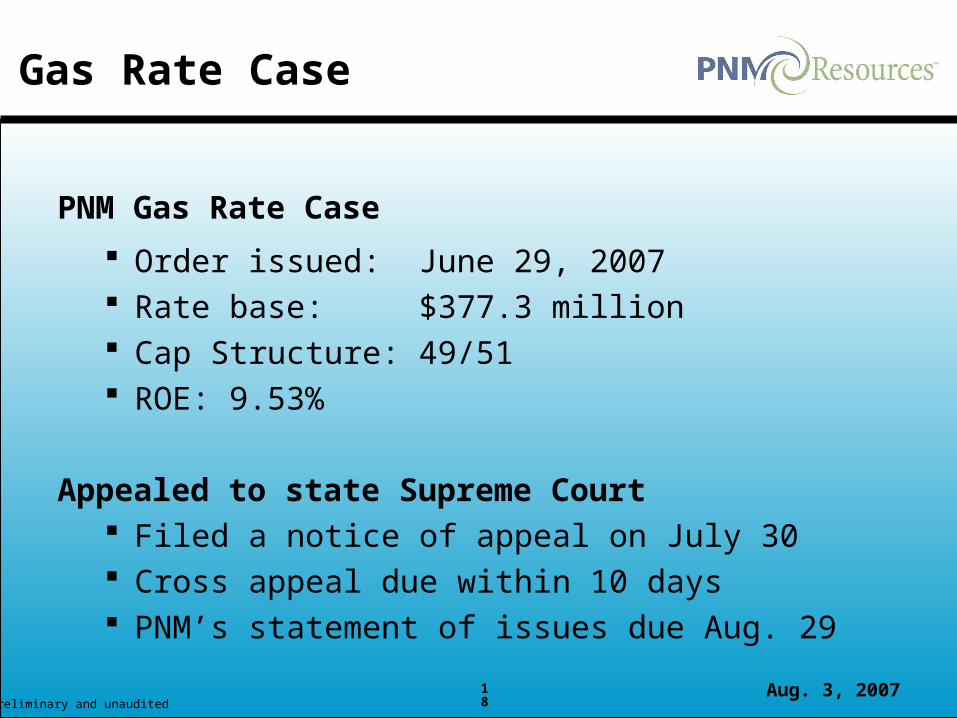
Gas Rate Case
PNM Gas Rate Case
Order issued: June 29, 2007 Rate base: $377.3 million Cap Structure: 49/51 ROE: 9.53%
Appealed to state Supreme Court Filed a notice of appeal on July 30 Cross appeal due within 10 days PNM’s statement of issues due Aug. 29
Aug. 3, 200719Preliminary and unaudited
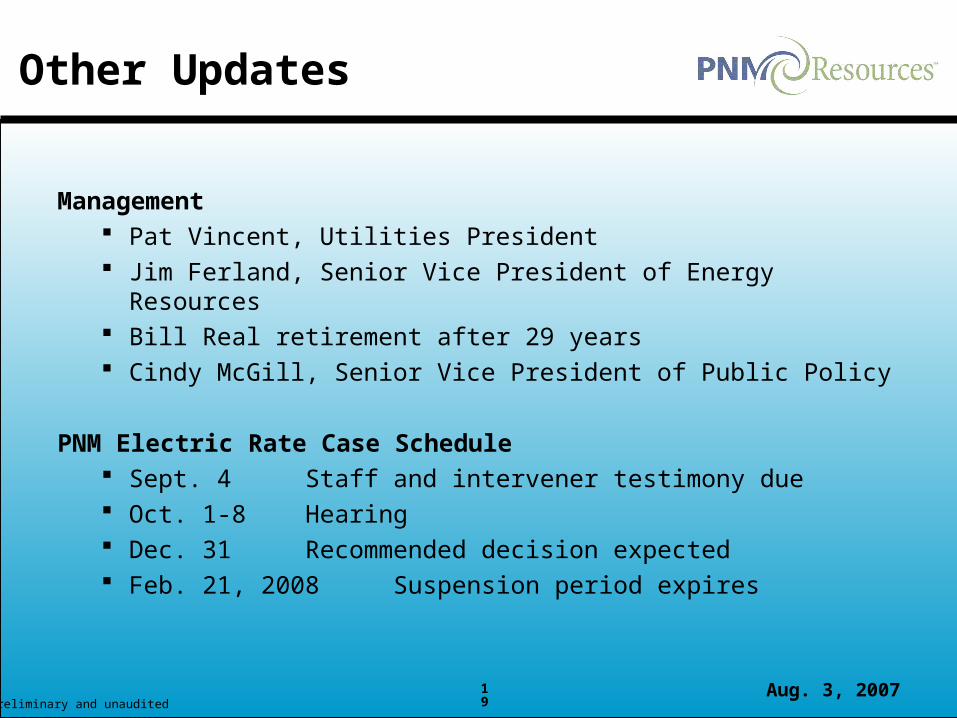
Other Updates
Management Pat Vincent, Utilities President Jim Ferland, Senior Vice President of Energy Resources Bill Real retirement after 29 years Cindy McGill, Senior Vice President of Public Policy
PNM Electric Rate Case Schedule Sept. 4 Staff and intervener testimony due Oct. 1-8 Hearing Dec. 31 Recommended decision expected Feb. 21, 2008 Suspension period expires

Aug. 3, 200720Preliminary and unaudited
Path Forward
Earn allowed regulated rate of return by addressing: Regulatory environment Legislative initiatives Operating efficiency Capital allocation
Achieve growth through unregulated investments: Focus on value of systems and portfolio optimization Apply conservative approach of future contributions to EnergyCo Seek long-term earnings and cash generation through EnergyCo
acquisitions
Aug. 3, 200721Preliminary and unaudited
Questions and Answers

Aug. 3, 200722Preliminary and unaudited
Second Quarter 2007
Appendix
Aug. 3, 200723Preliminary and unaudited
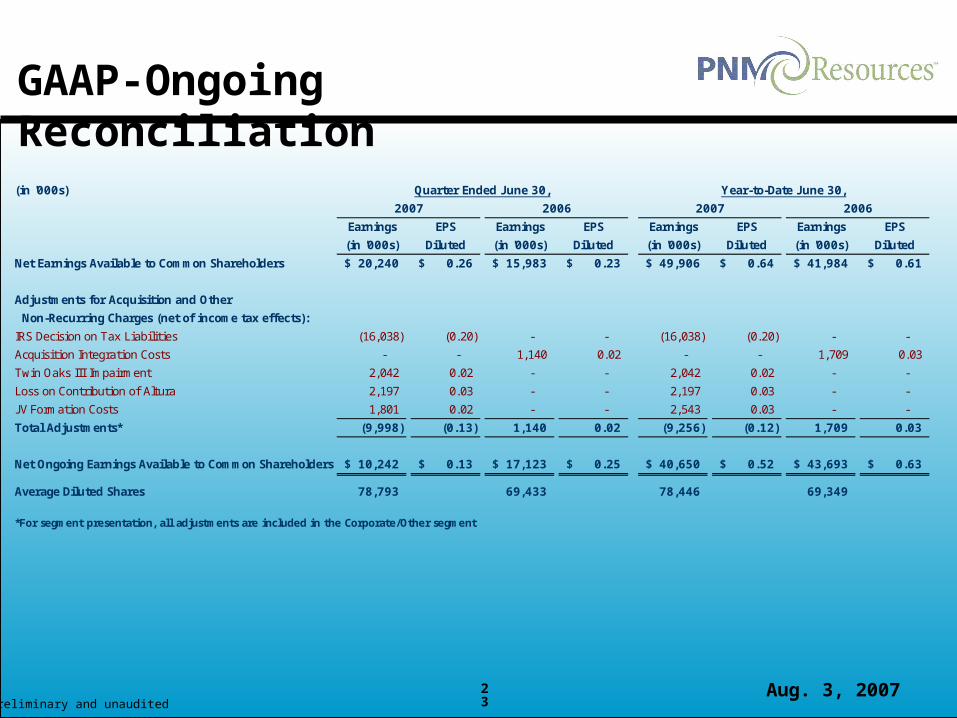
GAAP-Ongoing Reconciliation
(in '000s)
Earnings EPS Earnings EPS Earnings EPS Earnings EPS
(in '000s) Diluted (in '000s) Diluted (in '000s) Diluted (in '000s) Diluted
Net Earnings Available to Common Shareholders 20,240$ 0.26$ 15,983$ 0.23$ 49,906$ 0.64$ 41,984$ 0.61$
Adjustments for Acquisition and Other
Non-Recurring Charges (net of income tax effects):
IRS Decision on Tax Liabilities (16,038) (0.20) - - (16,038) (0.20) - -
Acquisition Integration Costs - - 1,140 0.02 - - 1,709 0.03
Twin Oaks III Impairment 2,042 0.02 - - 2,042 0.02 - -
Loss on Contribution of Altura 2,197 0.03 - - 2,197 0.03 - -
J V Formation Costs 1,801 0.02 - - 2,543 0.03 - -
Total Adjustments* (9,998) (0.13) 1,140 0.02 (9,256) (0.12) 1,709 0.03
Net Ongoing Earnings Available to Common Shareholders 10,242$ 0.13$ 17,123$ 0.25$ 40,650$ 0.52$ 43,693$ 0.63$
Average Diluted Shares 78,793 69,433 78,446 69,349
*For segment presentation, all adjustments are included in the Corporate/Other segment
Quarter Ended June 30,
2007 2006
Year-to-Date June 30,
2007 2006
Aug. 3, 200724Preliminary and unaudited
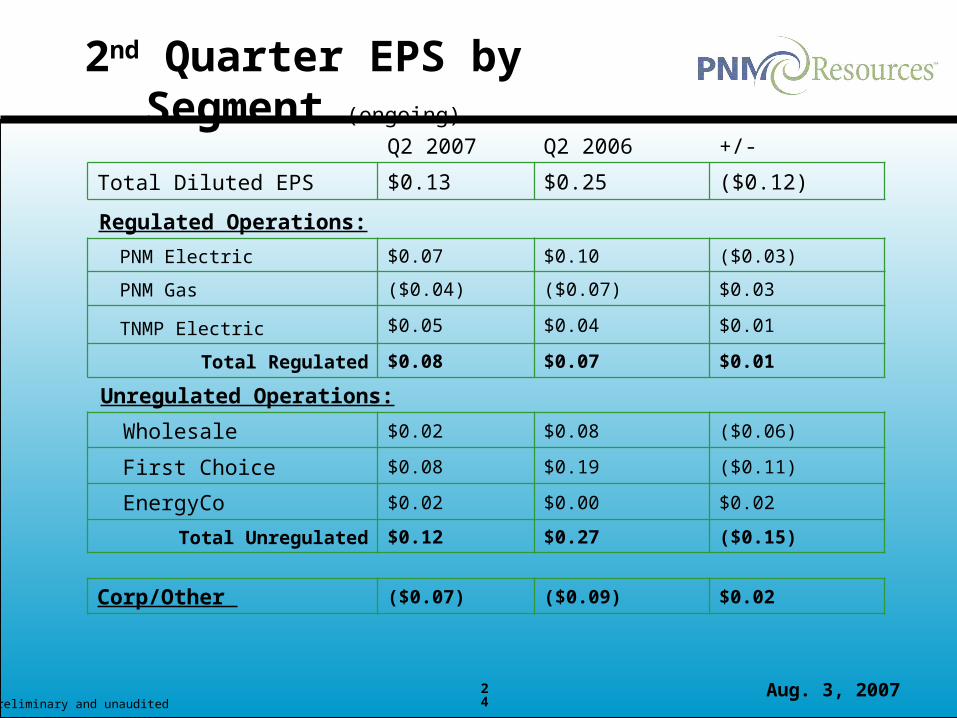
2nd Quarter EPS by Segment (ongoing)
Q2 2007 Q2 2006 +/-
Total Diluted EPS $0.13 $0.25 ($0.12)
Regulated Operations:
PNM Electric $0.07 $0.10 ($0.03)
PNM Gas ($0.04) ($0.07) $0.03
TNMP Electric $0.05 $0.04 $0.01
Total Regulated $0.08 $0.07 $0.01
Unregulated Operations:
Wholesale $0.02 $0.08 ($0.06)
First Choice $0.08 $0.19 ($0.11)
EnergyCo $0.02 $0.00 $0.02
Total Unregulated $0.12 $0.27 ($0.15)
Corp/Other ($0.07) ($0.09) $0.02
Aug. 3, 200725Preliminary and unaudited
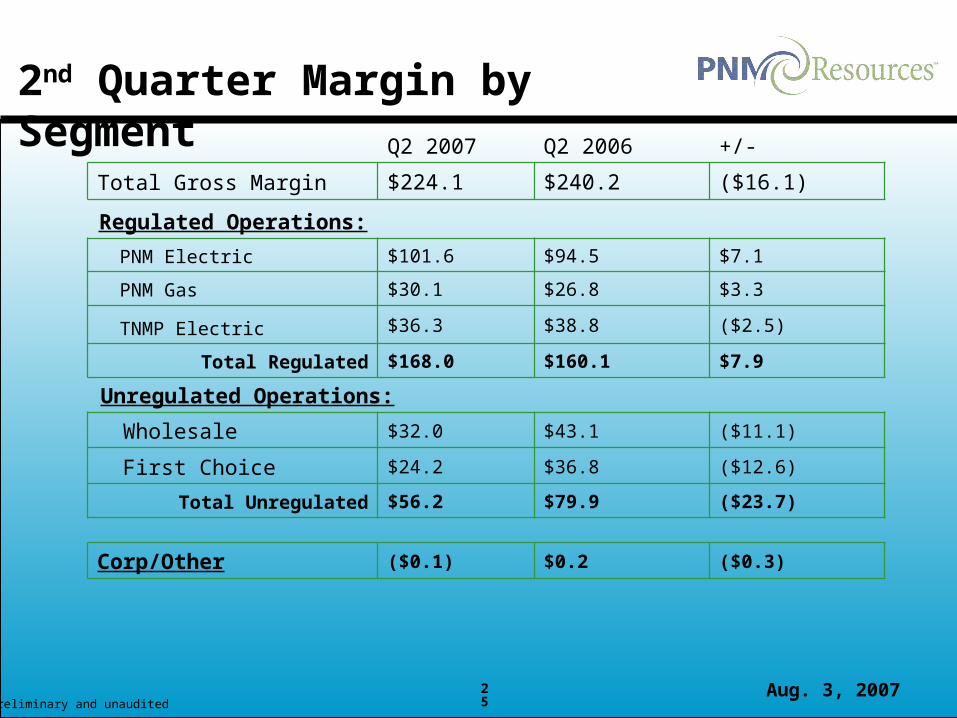
2nd Quarter Margin by SegmentQ2 2007 Q2 2006 +/-
Total Gross Margin $224.1 $240.2 ($16.1)
Regulated Operations:
PNM Electric $101.6 $94.5 $7.1
PNM Gas $30.1 $26.8 $3.3
TNMP Electric $36.3 $38.8 ($2.5)
Total Regulated $168.0 $160.1 $7.9
Unregulated Operations:
Wholesale $32.0 $43.1 ($11.1)
First Choice $24.2 $36.8 ($12.6)
Total Unregulated $56.2 $79.9 ($23.7)
Corp/Other ($0.1) $0.2 ($0.3)
Aug. 3, 200726Preliminary and unaudited
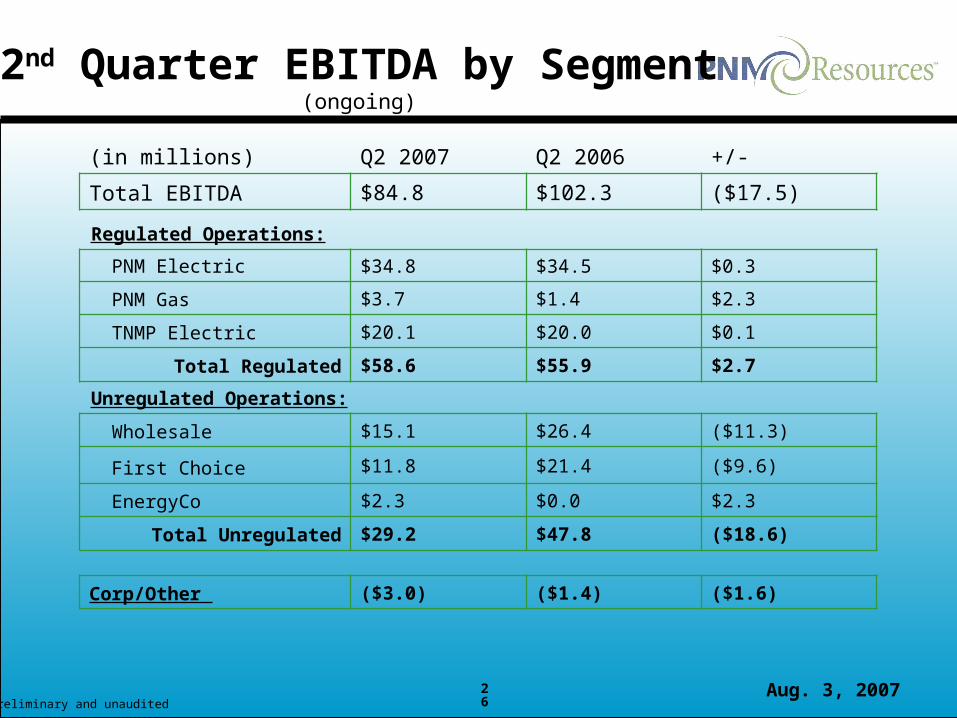
2nd Quarter EBITDA by Segment(ongoing)
(in millions) Q2 2007 Q2 2006 +/-
Total EBITDA $84.8 $102.3 ($17.5)
Regulated Operations:
PNM Electric $34.8 $34.5 $0.3
PNM Gas $3.7 $1.4 $2.3
TNMP Electric $20.1 $20.0 $0.1
Total Regulated $58.6 $55.9 $2.7
Unregulated Operations:
Wholesale $15.1 $26.4 ($11.3)
First Choice $11.8 $21.4 ($9.6)
EnergyCo $2.3 $0.0 $2.3
Total Unregulated $29.2 $47.8 ($18.6)
Corp/Other ($3.0) ($1.4) ($1.6)

Aug. 3, 200727Preliminary and unaudited
YTD Margin by SegmentYTD 2007 YTD 2006 +/-
Total Gross Margin $499.1 $470.0 $29.1
Regulated Operations:
PNM Electric $210.9 $193.0 $17.9
PNM Gas $84.9 $76.6 $8.3
TNMP Electric $70.1 $74.3 $(4.2)
Total Regulated $365.9 $343.9 $22.0
Unregulated Operations:
Wholesale $84.6 $74.6 $10.0
First Choice $48.9 $51.6 $(2.7)
Total Unregulated $133.5 $126.2 $7.3
Corp/Other ($0.3) $(0.1) ($0.2)

Aug. 3, 200728Preliminary and unaudited
YTD EBITDA by Segment(ongoing)
(in millions) YTD 2007 YTD 2006 +/-
Total EBITDA $211.9 $207.5 $4.4
Regulated Operations:
PNM Electric $77.6 $72.2 $5.4
PNM Gas $34.0 $27.5 $6.5
TNMP Electric $35.5 $36.4 ($0.9)
Total Regulated $147.1 $136.1 $11.0
Unregulated Operations:
Wholesale $43.7 $48.1 ($4.4)
First Choice $21.8 $23.3 ($1.5)
EnergyCo $1.6 $0.0 $1.6
Total Unregulated $67.1 $71.4 ($4.3)
Corp/Other ($2.3) $0.0 ($2.3)

Aug. 3, 200729Preliminary and unaudited
YTD Plant Performance
87.6%
59.2%
85.6%82.2%
66.9%
87.5%87.4%
92.4%
0%
20%
40%
60%
80%
100%
San Juan Four Corners Twin Oaks Palo Verde
YTD 2007 YTD 2006
Equivalent Availability Factor
Nuclear: 91%*Coal: 89%*
Lignite: 88%*
* Annual top quartile numbers from the North American Electricity Reliability Council

Aug. 3, 200730Preliminary and unaudited
Heating-Degree Days
The heating-degree day (HDD) value is the accumulation in degrees that the daily mean temperature was below 65 degrees F. The cooling-degree day (CDD) value is the accumulation in degrees that the daily mean temperature was above 65 degrees F.
2007Q2
2006Q2
Normal
PNM 338 145 301
TNMP 99 4 57
2nd Quarter Weather Data
2007Q2
2006Q2
Normal
PNM 412 601 477
TNMP 941 1,182 1,011
Cooling-Degree Days

Aug. 3, 200731Preliminary and unaudited
Heating-Degree Days
The heating-degree day (HDD) value is the accumulation in degrees that the daily mean temperature was below 65 degrees F. The cooling-degree day (CDD) value is the accumulation in degrees that the daily mean temperature was above 65 degrees F.
2007YTD
2006YTD
Normal
PNM 2,399 2,012 2,225
TNMP 1,112 730 1,049
YTD Weather Data
2007YTD
2006
YTDNormal
PNM 412 601 477
TNMP 1,052 1,309 1,091
Cooling-Degree Days
Aug. 3, 200732Preliminary and unaudited
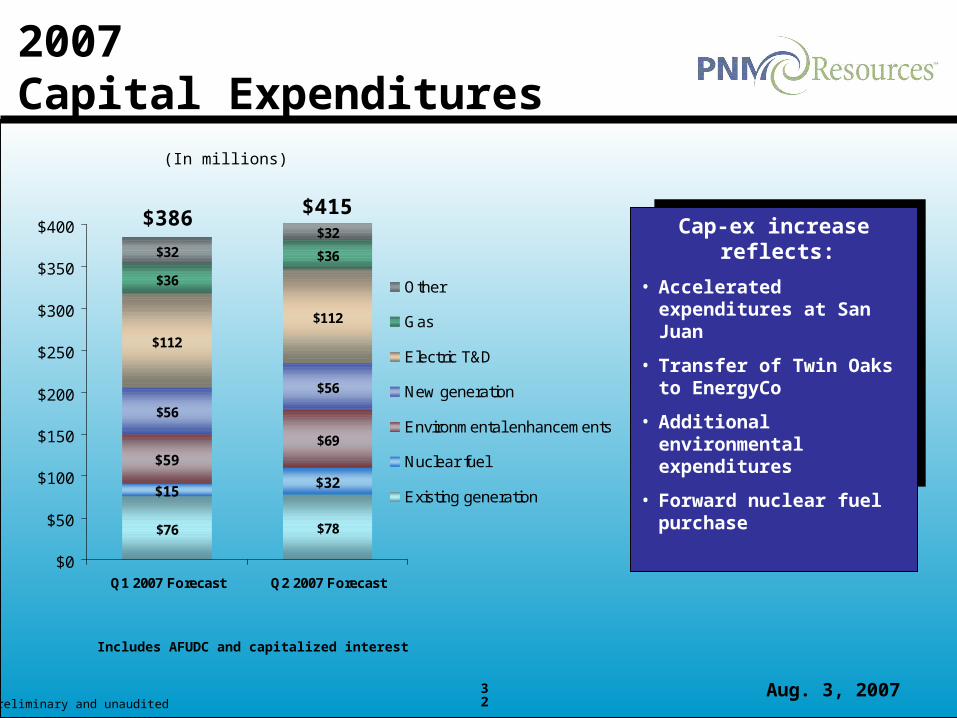
$76 $78
$32
$69
$56
$112
$112
$36
$36
$15
$59
$56
$32$32
$0
$50
$100
$150
$200
$250
$300
$350
$400
Q1 2007 Forecast Q2 2007 Forecast
Other
Gas
Electric T&D
New generation
Environmental enhancements
Nuclear fuel
Existing generation
Includes AFUDC and capitalized interest
2007 Capital Expenditures
$415
(In millions)
$386 Cap-ex increase reflects:
• Accelerated expenditures at San Juan
• Transfer of Twin Oaks to EnergyCo
• Additional environmental expenditures
• Forward nuclear fuel purchase
Aug. 3, 200733Preliminary and unaudited
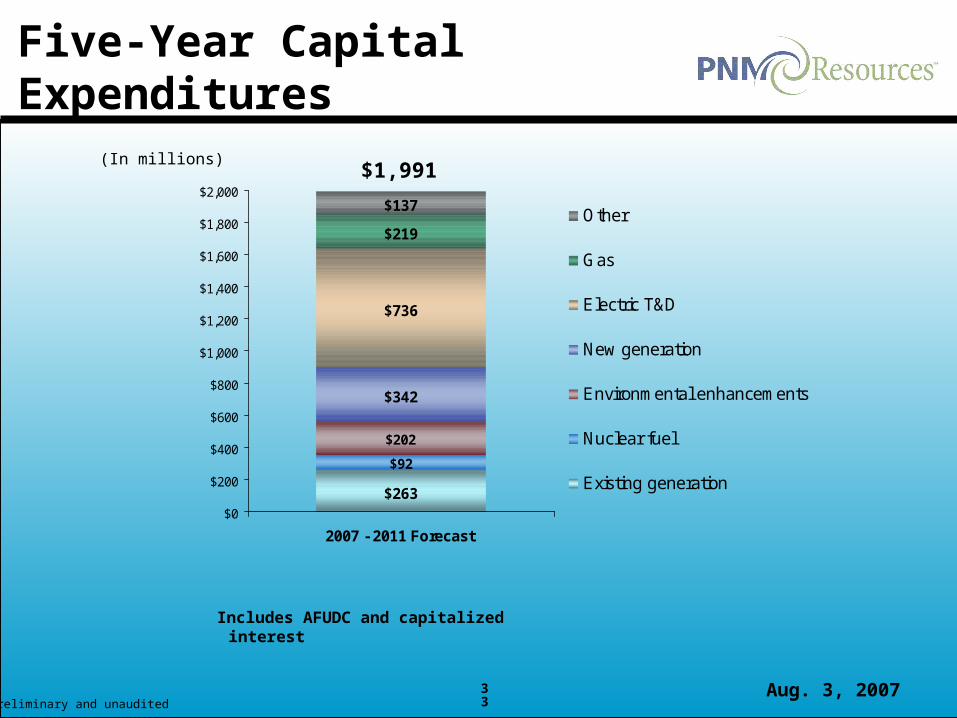
$263
$92
$202
$342
$736
$219
$137
$0
$200
$400
$600
$800
$1,000
$1,200
$1,400
$1,600
$1,800
$2,000
2007 - 2011 Forecast
Other
Gas
Electric T&D
New generation
Environmental enhancements
Nuclear fuel
Existing generation
Includes AFUDC and capitalized interest
Five-Year Capital Expenditures
$1,991(In millions)
Aug. 3, 200734Preliminary and unaudited
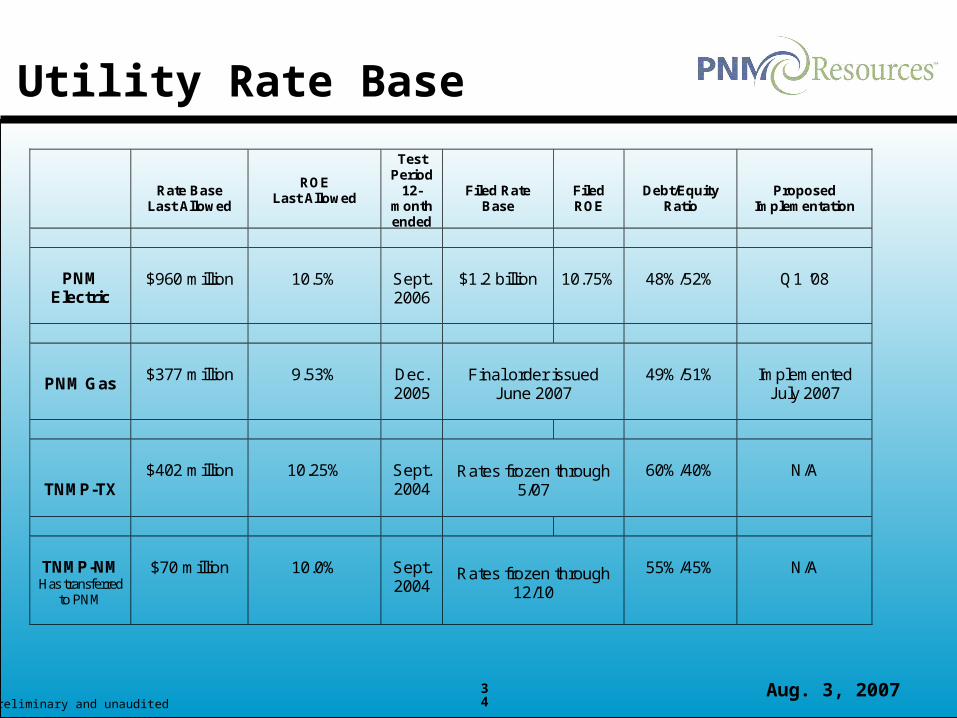
Utility Rate Base
Rate Base Last Allowed
ROE Last Allowed
Test Period
12-month ended
Filed Rate
Base
Filed ROE
Debt/Equity
Ratio
Proposed
Implementation
PNM Electric
$960 million
10.5%
Sept. 2006
$1.2 billion
10.75%
48%/52%
Q1 ‘08
PNM Gas
$377 million
9.53%
Dec. 2005
Final order issued June 2007
49%/51%
Implemented
July 2007
TNMP-TX
$402 million
10.25%
Sept. 2004
Rates frozen through 5/07
60%/40%
N/A
TNMP-NM Has transferred
to PNM
$70 million
10.0%
Sept. 2004
Rates frozen through 12/10
55%/45%
N/A