Second Quarter 2017 & Audited Financial Statements … Management Discussion & Analysis & Audited...
23
Second Quarter 2017
Transcript of Second Quarter 2017 & Audited Financial Statements … Management Discussion & Analysis & Audited...

2016 Management Discussion & Analysis & Audited Financial Statements
Second Quarter 2017

Interim Management Discussion & Analysis | 1
INTERIM MANAGEMENT DISCUSSION AND ANALYSIS For the Three and Six Month Periods Ended June 30, 2017
Dated July 28, 2017 The following interim Management Discussion and Analysis (“MD&A”) should be read in conjunction with Newfoundland Power Inc.’s (the “Company” or “Newfoundland Power”) interim unaudited financial statements and notes thereto for the three and six month periods ended June 30, 2017 and the MD&A and annual audited financial statements for the year ended December 31, 2016. The MD&A has been prepared in accordance with National Instrument 51-102 - Continuous Disclosure Obligations. Financial information herein, all of which is unaudited, reflects Canadian dollars and accounting principles generally accepted in the United States of America (“U.S. GAAP”), including certain accounting practices unique to rate-regulated entities. These accounting practices are disclosed in Notes 2 and 6 to the Company’s 2016 annual audited financial statements. FORWARD-LOOKING STATEMENTS Certain information herein is forward looking within the meaning of applicable securities laws in Canada (“forward-looking information”). All forward-looking information is given pursuant to the “safe harbour” provisions of applicable Canadian securities legislation. The words “anticipates”, “believes”, “budgets”, “could”, “estimates”, “expects”, “forecasts”, “intends”, “may”, “might”, “plans”, “projects”, “schedule”, “should”, “will”, “would” and similar expressions are often intended to identify forward-looking information, although not all forward-looking information contains these identifying words. The forward-looking information reflects management’s current beliefs and is based on information currently available to the Company’s management. The forward-looking information in this MD&A includes, but is not limited to, statements regarding: expectations to generate sufficient cash to complete required capital expenditures and to service interest and sinking fund payments on debt; the ability to meet pension funding requirements; the expectation that no material adverse credit rating actions will occur in the near term; the Company’s belief that it does not anticipate any difficulties in issuing bonds on reasonable market terms; the Company’s expectations for employee future benefit costs; forecast gross capital expenditures for 2017; and, the expectation that future sales and customer growth will be lower than in recent years. The forecasts and projections that make up the forward-looking information are based on assumptions, which include, but are not limited to: receipt of applicable regulatory approvals; continued electricity demand; no significant operational disruptions or environmental liability due to severe weather or other acts of nature; no significant decline in capital spending in 2017; sufficient liquidity and capital resources; the continuation of regulator-approved mechanisms that permit recovery of costs; no significant variability in interest rates; no significant changes in government energy plans and environmental laws; the ability to obtain and maintain insurance coverage, licences and permits; the ability to maintain and renew collective bargaining agreements on acceptable terms; and, sufficient human resources to deliver service and execute the capital program. The forward-looking information is subject to risks, uncertainties and other factors that could cause actual results to differ materially from historical results or results anticipated by the forward-looking information. The factors which could cause results or events to differ from current expectations include, but are not limited to: regulation; energy supply; purchased power cost; electricity prices; health, safety and environmental regulations; capital resources and liquidity; interest rates; economic conditions; cyber-security; labor relations; human resources; operating and maintenance investment requirements; weather; insurance; defined benefit pension plan performance; information technology infrastructure; and, continued reporting in accordance with U.S. GAAP. For additional information with respect to these risk factors, reference should be made to the section entitled “Business Risk Management” in this MD&A. All forward-looking information in this MD&A is qualified in its entirety by this cautionary statement and, except as required by law, the Company undertakes no obligation to revise or update any forward-looking information as a result of new information, future events or otherwise after the date hereof. Additional information, including the Company’s quarterly and annual financial statements and MD&A, annual information form and management information circular, is available on the System for Electronic Document Analysis and Retrieval (“SEDAR”) at www.sedar.com.
OVERVIEW
The Company
Newfoundland Power is a regulated electricity utility that owns and operates an integrated generation, transmission and distribution system throughout the island portion of the Province of Newfoundland and Labrador. The Company is a subsidiary of Fortis Inc. (“Fortis”). Fortis is a leader in the North American regulated electric and gas utility business, serving customers across Canada and in the United States and the Caribbean.

Interim Management Discussion & Analysis | 2
Newfoundland Power’s primary business is electricity distribution. It generates approximately 7% of its electricity needs and purchases the remainder from Newfoundland and Labrador Hydro (“Hydro”). Newfoundland Power serves approximately 265,000 customers, approximately 87% of all electricity consumers in the Province. Newfoundland Power’s vision is to be a leader among North American electricity utilities in terms of safety, reliability, customer service and efficiency. The key goals of the Company are to operate sound electricity distribution systems, deliver safe, reliable electricity to customers at the lowest reasonable cost, and conduct business in an environmentally and socially responsible manner.
Regulation
Newfoundland Power is regulated by the Newfoundland and Labrador Board of Commissioners of Public Utilities (the “PUB”). The Company operates under cost of service regulation whereby it is entitled the opportunity to recover, through customer rates, all reasonable and prudent costs incurred in providing electricity service to its customers, including a just and reasonable return on its rate base. The rate base is the value of the net assets required to provide electricity service. Newfoundland Power 2016/2017 General Rate Application On June 8, 2016, the PUB issued an Order on the Company’s 2016/2017 General Rate Application (“GRA”) which established the Company’s cost of capital for ratemaking purposes for 2016 through 2018 based upon an 8.50% return on equity (“ROE”) and 45% common equity. The Company’s rate of return on rate base for 2017 was set at 7.19%, with a range of 7.01% to 7.37%, compared to 7.21%, with a range of 7.03% to 7.39% for 2016. The operation of the Automatic Adjustment Formula, which historically adjusted the Company’s ratemaking ROE between GRAs, has been suspended pending a further Order of the PUB. Newfoundland Power is required to file its next GRA for 2019 on or before June 1, 2018. The implementation of the PUB’s Order related to the Company’s 2016/2017 GRA increased electricity rates by approximately 1.2% effective July 1, 2016. Hydro Rate Stabilization Plan (“RSP”) Refund Due to mismatches in Hydro’s customer pricing and actual costs of supply from 2007 through 2013, a balance of over $138 million had accumulated in the Hydro RSP as of January 31, 2017. On May 6, 2015, the Newfoundland and Labrador Court of Appeal issued a decision directing the Hydro RSP balance be refunded to Newfoundland Power’s customers and Hydro’s island grid customers. Approximately $129 million of the RSP balance was attributable to Newfoundland Power’s customers. On September 2, 2016, PUB approved the Company’s proposed refund program for its customers. In accordance with the approved refund program, $117.5 million of the Hydro RSP was transferred to Newfoundland Power, and processed as refunds to customers, in the first half of 2017.
Financial Highlights
Three Months Ended June 30 Six Months Ended June 30
2017 2016 Change 2017 2016 Change
Electricity Sales (gigawatt hours (“GWh”)) 1
1,357.5 1,342.7 14.8 3,417.6 3,381.2 36.4
Earnings Applicable to Common Shares
$ Millions 11.5 10.3 1.2 22.3 21.1 1.2
$ Per Share 1.11 1.00 0.11 2.16 2.04 0.12
Cash Flow from Operating Activities ($millions) 31.5 32.8 (1.3) 26.9 33.2 (6.3)
Total Assets ($millions) 1,544.2 1,495.9 48.3
1 Reflects normalized electricity sales.
Electricity sales for the second quarter of 2017 increased by 14.8 GWh, or 1.1%, compared to the second quarter of 2016. The increase was due to a 0.9% increase in the number of customers served by the Company and higher average consumption of 0.2%. The growth in average consumption in the second quarter was attributable to the Company’s residential customers, partially offset by lower average consumption by commercial customers. On a year-to-date basis, electricity sales increased by 36.4 GWh or 1.1% compared to the same period in 2016. This reflects a 0.9% increase in the number of customers and higher average consumption of 0.7% by residential customers. These factors

Interim Management Discussion & Analysis | 3
were partially offset by a decrease in sales of 0.5% as a result of one less day of electricity sales in 2017 due to 2016 being a leap year. Earnings for the second quarter of 2017 increased by $1.2 million compared to the second quarter of 2016. The increase reflects the timing of implementation of the Order on the 2016/2017 GRA, which included the combined impact of rate base growth and a lower ratemaking ROE. The cumulative impact of the Order on the 2016/2017 GRA, which was effective January 1, 2016, was recognized in the Company’s financial statements during the second quarter of 2016. Earnings for the second quarter of 2017 were also favorably impacted by higher sales and lower than anticipated finance charges. These factors were offset by higher demand charges from Hydro in 2017. On a year-to-date basis, earnings increased by $1.2 million compared to the same period in 2016. The increase in earnings was due to higher sales and lower than anticipated finance charges. These factors were offset by higher demand charges from Hydro. Cash flow from operating activities for the second quarter of 2017 decreased by $1.3 million compared to the second quarter of 2016. The decrease was due to a reduction in the Company’s income tax refund in 2017, related to the allocation of the unregulated Part VI.1 tax deduction from Fortis to Newfoundland Power. The decrease was partially offset by (i) the timing of the recovery of Harmonized Sales Tax on refunds issued to customers for the Hydro RSP; (ii) higher electricity sales; (iii) lower interest payments; and, (iv) the 1.2% customer rate increase effective July 1, 2016 associated with the 2016/2017 GRA. On a year-to-date basis, cash flow from operating activities decreased by $6.3 million compared to the same period in 2016 due to the reduction in the Company’s income tax refund in 2017 as discussed above. The decrease was partially offset by (i) higher electricity sales; (ii) lower interest payments; and, (iii) the 1.2% customer rate increase effective July 1, 2016 associated with the 2016/2017 GRA. Total assets as at June 30, 2017 increased by $48.3 million compared to June 30, 2016, reflecting continued investment in the electricity system and an increase in the defined benefit pension plan asset.
RESULTS OF OPERATIONS
Revenue Three Months Ended June 30 Six Months Ended June 30
($millions) 2017 2016 Change 2017 2016 Change
Revenue from Rates 152.6 149.9 2.7 379.0 373.6 5.4
Amortization of Regulatory Deferrals 1.0 1.4 (0.4) 2.0 0.8 1.2
Other Revenue 1 1.6 1.5 0.1 3.1 3.0 0.1
Total 155.2 152.8 2.4 384.1 377.4 6.7 1 Other revenue is composed largely of charges to various telecommunication companies, interest revenue associated with customer
accounts and other miscellaneous amounts.
Revenue from rates for the second quarter of 2017 increased by $2.7 million compared to the second quarter of 2016, and $5.4 million on a year-to-date basis. The increase reflects higher electricity sales and the 1.2% customer rate increase effective July 1, 2016 associated with the 2016/2017 GRA. The amortization of regulatory deferrals includes the pension expense variance deferral (“PEVDA”), the other post-employment benefits (“OPEBs”) cost variance deferral, and the amortization of annual customer energy conservation program costs. The amounts recorded are in accordance with PUB orders and are described in Notes 2 and 6 to the Company’s 2016 annual audited financial statements. Other revenue, for both the second quarter and year-to-date periods, was comparable to 2016.
Purchased Power: Purchased power expense for the second quarter of 2017 was $1.8 million higher compared to the second quarter of 2016, and $4.6 million higher on a year-to-date basis. The increase resulted from electricity sales growth and higher demand charges from Hydro.
Operating Expenses: Operating expenses for the second quarter of 2017 increased by $0.8 million compared to the second quarter of 2016. The increase reflects (i) the impact of regulatory deferrals and amortizations, due to the normal operation of

Interim Management Discussion & Analysis | 4
regulatory mechanisms; and, (ii) inflationary increases. These factors were partially offset by a reduction in labor costs reflecting advances in meter reading technology. Year-to-date operating expenses were $2.1 million higher than the same period in 2016. The increase was due to the factors described above, as well as higher labor costs associated with a severe wind storm that impacted the Company’s service territory in March 2017.
Employee Future Benefits: Employee future benefits for the second quarter of 2017 were $0.2 million lower than the second quarter of 2016, and $0.4 million lower on a year-to-date basis. The decrease primarily reflects a reduction in net benefit cost associated with the defined benefit pension plan, due to a decrease in the Company’s projected benefit pension obligation. The decrease in the obligation was due to a higher than expected return on plan assets, partially offset by a lower discount rate as at December 31, 2016.
Depreciation and Amortization: Depreciation and amortization expense for the second quarter of 2017 was $0.4 million higher compared to the second quarter of 2016. The increase reflects the Company’s capital expenditure program, as well as the timing of implementation of new depreciation rates approved as part of the 2016/2017 GRA. The cumulative impact of new depreciation rates, which were effective January 1, 2016 and reflect an overall composite depreciation rate of 3.42%, was recognized in the second quarter of 2016. On a year-to-date basis, depreciation and amortization expense was $1.3 million higher than the same period in 2016 reflecting the Company’s capital expenditure program.
Cost Recovery Deferral, net: As a result of the PUB’s Order on the 2016/2017 GRA and the related customer rate change on July 1, 2016, the Company recognized a $2.6 million over-recovery from customer rates in 2016, with approximately $1.5 million of the over-recovery recognized in the second quarter and year-to-date periods. The PUB approved the deferral of this cost over-recovery in 2016 and the related amortization over a 30-month period from July 1, 2016 through December 31, 2018. Amortization of $0.3 million and $0.5 million was recognized for the second quarter and year-to-date periods of 2017, respectively.
Finance Charges: Finance charges for the second quarter of 2017 were comparable to the second quarter of 2016. On a year-to-date basis, finance charges were $0.8 million lower compared to same period in 2016. The decrease was due to interest savings associated with the maturity of $30.4 million, 10.9% first mortgage sinking fund bonds in May 2016. These savings were partially offset by interest costs associated with the issuance of $75 million, 3.815% first mortgage sinking fund bonds in June 2017, as well as higher credit facility borrowings and related interest charges in 2017.
Income Taxes: Income taxes for the second quarter of 2017 were $0.3 million higher than the second quarter of 2016, and $0.7 million higher on a year-to-date basis. The increase reflects higher pre-tax earnings and an increase in the Company’s statutory income tax rate. In April 2016, the Government of Newfoundland and Labrador increased the provincial corporate income tax rate from 14% to 15% effective January 1, 2016.

Interim Management Discussion & Analysis | 5
FINANCIAL POSITION Explanations of the primary causes of significant changes in the Company’s balance sheets between December 31, 2016 and June 30, 2017 follow: ($millions)
Increase (Decrease)
Explanation
Accounts Receivable (9.5) Decrease reflects the seasonal nature of electricity consumption
for heating, and normal timing differences relating to both the operation of the Company’s equal payment plan for its customers, and the collection and payment of municipal taxes.
Property, Plant and Equipment 10.3 Increase due to investment in the electricity system, in accordance with the 2017 capital expenditure program, partially offset by depreciation and customer contributions in aid of construction.
Accounts Payable and Accrued Charges (37.5) Decrease reflects reduced purchased power costs related to lower energy consumption in June 2017 compared to December 2016, as well as the timing of payments.
Regulatory Liabilities
5.5 Increase due to the normal operation of various regulatory accounts. See Note 5 to the Company’s June 30, 2017 unaudited interim financial statements.
Long-term Debt, including Current Portion 22.8 Represents additional debt required to finance growth in rate base and ongoing operating activities.
Retained Earnings 9.4 Earnings in excess of dividends; retained to finance rate base growth.
LIQUIDITY AND CAPITAL RESOURCES
The primary sources of liquidity and capital resources are net funds generated from operations, debt capital markets and bank credit facilities. These funds are used primarily to satisfy capital and intangible asset expenditures, service and repay debt, and pay dividends. A summary of second quarter and year-to-date cash flows and cash position for 2017 and 2016 follows. Three Months Ended June 30 Six Months Ended June 30
($millions) 2017 2016 Change 2017 2016 Change
Cash, Beginning of Period - - - - - -
Operating Activities 31.5 32.8 (1.3) 26.9 33.2 (6.3)
Investing Activities (21.1) (20.8) (0.3) (35.8) (38.7) 2.9
Financing Activities
Net Credit Facility Proceeds (78.4) 23.9 (102.3) (52.3) 46.9 (99.2) Proceeds from Long-term Debt
75.0 - 75.0 75.0 - 75.0
Repayment of Long-term Debt - (30.4) 30.4 - (30.4) 30.4
Dividends on Common Shares (6.6) (5.4) (1.2) (13.2) (10.7) (2.5)
Other (0.4) (0.1) (0.3) (0.6) (0.3) (0.3)
(10.4) (12.0) 1.6 8.9 5.5 3.4
Cash, End of Period - - - - - -
Interim Management Discussion & Analysis | 6
Operating Activities
Cash flow from operating activities for the second quarter of 2017 decreased by $1.3 million compared to the second quarter of 2016. The decrease was due to a reduction in the Company’s income tax refund in 2017, related to the allocation of the unregulated Part VI.1 tax deduction from Fortis to Newfoundland Power. The decrease was partially offset by (i) the timing of the recovery of Harmonized Sales Tax on refunds issued to customers for the Hydro RSP; (ii) higher electricity sales; (iii) lower interest payments; and, (iv) the 1.2% customer rate increase effective July 1, 2016 associated with the 2016/2017 GRA. On a year-to-date basis, cash flow from operating activities decreased by $6.3 million compared to the same period in 2016 due to the reduction in the Company’s income tax refund in 2017 as discussed above. This decrease was partially offset by (i) higher electricity sales; (ii) lower interest payments; and, (iii) the 1.2% customer rate increase effective July 1, 2016 associated with the 2016/2017 GRA.
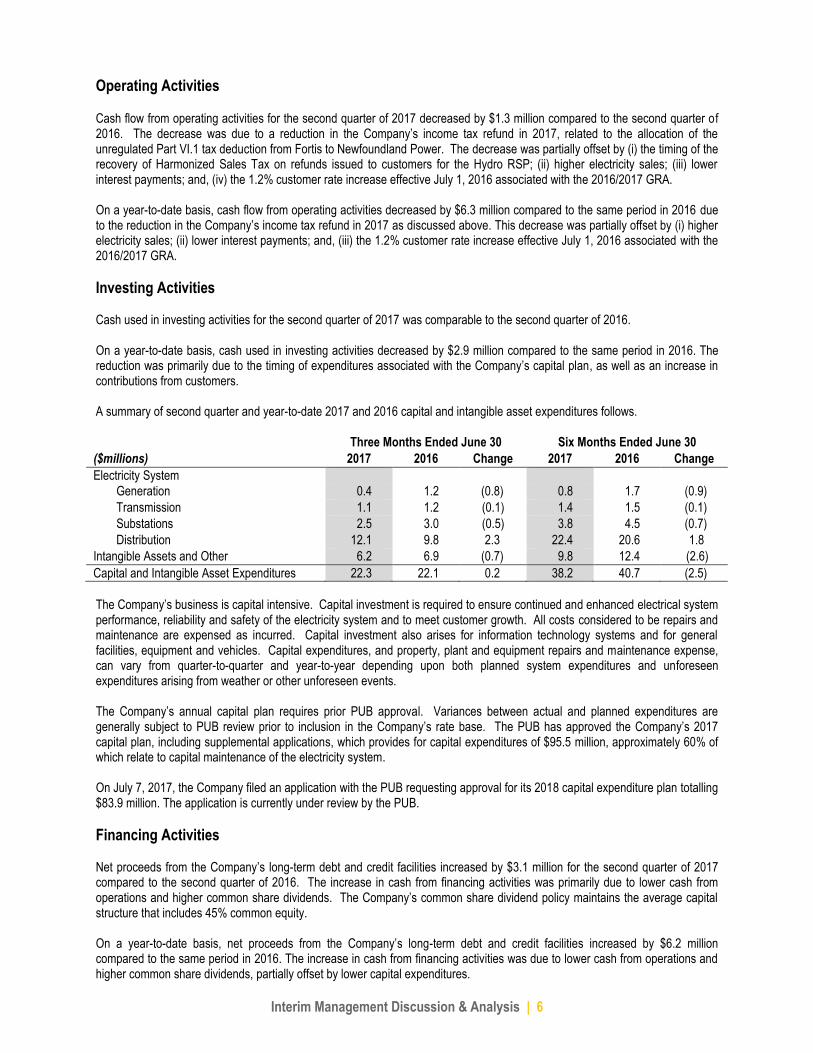
Investing Activities Cash used in investing activities for the second quarter of 2017 was comparable to the second quarter of 2016. On a year-to-date basis, cash used in investing activities decreased by $2.9 million compared to the same period in 2016. The reduction was primarily due to the timing of expenditures associated with the Company’s capital plan, as well as an increase in contributions from customers. A summary of second quarter and year-to-date 2017 and 2016 capital and intangible asset expenditures follows. Three Months Ended June 30 Six Months Ended June 30
($millions) 2017 2016 Change 2017 2016 Change
Electricity System
Generation 0.4 1.2 (0.8) 0.8 1.7 (0.9)
Transmission 1.1 1.2 (0.1) 1.4 1.5 (0.1)
Substations 2.5 3.0 (0.5) 3.8 4.5 (0.7)
Distribution 12.1 9.8 2.3 22.4 20.6 1.8
Intangible Assets and Other 6.2 6.9 (0.7) 9.8 12.4 (2.6)
Capital and Intangible Asset Expenditures 22.3 22.1 0.2 38.2 40.7 (2.5)
The Company’s business is capital intensive. Capital investment is required to ensure continued and enhanced electrical system performance, reliability and safety of the electricity system and to meet customer growth. All costs considered to be repairs and maintenance are expensed as incurred. Capital investment also arises for information technology systems and for general facilities, equipment and vehicles. Capital expenditures, and property, plant and equipment repairs and maintenance expense, can vary from quarter-to-quarter and year-to-year depending upon both planned system expenditures and unforeseen expenditures arising from weather or other unforeseen events. The Company’s annual capital plan requires prior PUB approval. Variances between actual and planned expenditures are generally subject to PUB review prior to inclusion in the Company’s rate base. The PUB has approved the Company’s 2017 capital plan, including supplemental applications, which provides for capital expenditures of $95.5 million, approximately 60% of which relate to capital maintenance of the electricity system. On July 7, 2017, the Company filed an application with the PUB requesting approval for its 2018 capital expenditure plan totalling $83.9 million. The application is currently under review by the PUB.
Financing Activities Net proceeds from the Company’s long-term debt and credit facilities increased by $3.1 million for the second quarter of 2017 compared to the second quarter of 2016. The increase in cash from financing activities was primarily due to lower cash from operations and higher common share dividends. The Company’s common share dividend policy maintains the average capital structure that includes 45% common equity. On a year-to-date basis, net proceeds from the Company’s long-term debt and credit facilities increased by $6.2 million compared to the same period in 2016. The increase in cash from financing activities was due to lower cash from operations and higher common share dividends, partially offset by lower capital expenditures.

Interim Management Discussion & Analysis | 7
The Company has historically generated sufficient annual cash flows from operating activities to service annual interest and sinking fund payments on debt, to fund pension obligations, to pay dividends and to finance a major portion of its annual capital program. Additional financing to fully fund the annual capital program is primarily obtained through the Company’s bank credit facilities and these borrowings are periodically refinanced, along with any maturing bonds, through the issuance of long-term first mortgage sinking fund bonds. The Company currently does not expect any material changes in these annual cash flow and financing dynamics over the foreseeable future.
Debt: On June 2, 2017, the Company issued $75 million 40-year, 3.815% first mortgage sinking fund bonds. Net proceeds
from the issuance were used to repay credit facility borrowings incurred principally to fund capital expenditures and for general corporate purposes. The issuance of bonds is subject to PUB approval and to an earnings test whereby the ratio of (i) annual earnings, before tax and bond interest, to (ii) annual bond interest incurred plus annual bond interest to be incurred on the contemplated bond issue, must be two times or higher. The Company’s credit facilities are comprised of a $100 million committed revolving term credit facility (“Committed Facility”) and a $20 million demand facility as detailed below.
($millions) June 30, 2017 December 31, 2016
Total Credit Facilities 120.0 120.0 Borrowing, Committed Facility (8.5) (60.5) Borrowing, Demand Facility (2.0) (2.3)
Credit Facilities Available 109.5 57.2
The Committed Facility matures in August 2021. Subject to lenders’ approval, the Company may request an extension for a further period of up to, but not exceeding, a five-year term.
Pensions: As at June 30, 2017, the fair value of the Company’s primary defined benefit pension plan assets was $413.7 million compared to $400.8 million as at December 31, 2016. Based on the latest actuarial valuation completed in April 2015, contributions for current service amounts are expected to be $3.4 million in 2017. The Company expects to have sufficient cash generated from operations to meet future pension funding requirements.
Contractual Obligations: Details, as at June 30, 2017, of all contractual obligations over the subsequent five years and thereafter, follow. ($millions)
Total
Due Within
1 Year
Due in
Years 2 & 3
Due in
Years 4 & 5
Due After 5 Years
Credit Facilities (unsecured) 10.5 10.5 - - - First Mortgage Sinking Fund Bonds 1 591.1 6.6 13.2 42.4 528.9 Interest obligations on long-term debt 577.7 35.9 70.8 65.0 406.0
Total 1,179.3 53.0 84.0 107.4 934.9 1 First mortgage sinking fund bonds are secured by a first fixed and specific charge on property, plant and equipment owned or to be
acquired by the Company, by a floating charge on all other assets and carry customary covenants.
Credit Ratings and Capital Structure: To ensure continued access to capital at reasonable cost, the Company endeavors to maintain its investment grade credit ratings. Details of the Company’s investment grade bond ratings follow.
June 30, 2017 December 31, 2016 Rating Agency Rating Outlook Rating Outlook
Moody’s Investors Service (“Moody’s”) A2 Stable A2 Stable DBRS A Stable A Stable
During the first quarter of 2017, Moody’s issued an updated credit rating report confirming the Company’s existing investment grade bond rating and rating outlook.

Interim Management Discussion & Analysis | 8
Newfoundland Power maintains an average annual capital structure composed of 55% debt and preference equity and 45% common equity. This capital structure is reflected in customer rates and is consistent with the Company’s current investment grade credit ratings. The Company’s capital structure follows.
June 30, 2017 December 31, 2016 $millions % $millions %
Total Debt 1 598.8 54.3 576.3 53.9 Common Equity 494.7 44.9 485.3 45.3 Preference Equity 8.9 0.8 8.9 0.8
Total 1,102.4 100.0 1,070.5 100.0 1 Includes bank indebtedness, or net of cash and debt issue costs, if applicable.
Capital Stock and Dividends: During the second quarter and year-to-date periods of 2017 and 2016, the weighted average number of common shares outstanding was 10,320,270. Dividends on common shares, for the second quarter and year-to-date periods, increased by $1.2 million and $2.5 million, respectively, compared to 2016. In 2017, the quarterly common share dividends increased to $0.64 per share compared to $0.52 per share in 2016. The Company’s common share dividend policy maintains the average capital structure that includes 45% common equity.
RELATED PARTY TRANSACTIONS The Company provides services to, and receives services from, its parent company, Fortis, and other subsidiaries of Fortis. The Company also incurs charges from Fortis for the recovery of general corporate expenses incurred by Fortis. These transactions are in the normal course of business and are recorded at their exchange amounts. Related party transactions included in operating expenses for the second quarter and year-to-date periods of 2017 were $0.6 million and $1.2 million, respectively (2016 - $0.6 million and $1.2 million, respectively).
FINANCIAL INSTRUMENTS The carrying values of financial instruments included in current assets, current liabilities, other assets, and other liabilities approximate their fair value, reflecting their nature, short-term maturity or normal trade credit terms. The fair value of long-term debt is calculated by discounting the future cash flows of each debt instrument at the estimated yield-to-maturity equivalent to benchmark government bonds, with similar terms to maturity, plus a credit risk premium equal to that of issuers of similar credit quality. Since the Company does not intend to settle its debt instruments before maturity, the fair value estimate does not represent the actual liability, and therefore, does not include settlement costs. The carrying and estimated fair values of the Company’s long-term debt follows.
June 30, 2017 December 31, 2016 ($millions)
Carrying Value
Estimated Fair Value
Carrying Value
Estimated Fair Value
Long-term debt, including current portion and committed credit facility 599.6 743.5 576.6 718.7
BUSINESS RISK MANAGEMENT There were no material changes to the Company’s business risks during the first half of 2017.
CHANGES IN ACCOUNTING POLICIES There were no changes to the Company’s accounting policies during the first half of 2017.

Interim Management Discussion & Analysis | 9
FUTURE ACCOUNTING CHANGES
Revenue from Contracts with Customers Accounting Standards Update (“ASU”) No. 2014-09 was issued in May 2014 and the amendments in this update create Accounting Standards Codification (“ASC”) Topic 606, Revenue from Contracts with Customers, and supersede the revenue recognition requirements in ASC Topic 605, Revenue Recognition, including most industry-specific revenue recognition guidance throughout the codification. In 2016 a number of additional ASUs were issued that clarify implementation guidance in ASC Topic 606. This standard, and all related ASUs, is effective for annual and interim periods beginning after December 15, 2017. The guidance permits two methods of adoption: (i) the full retrospective method, under which comparative periods would be restated, and the cumulative impact of applying the standard would be recognized as at January 1, 2017, the earliest period presented; and (ii) the modified retrospective method, under which comparative periods would not be restated and the cumulative impact of applying the standard would be recognized at the date of initial adoption, January 1, 2018. The Company expects to use the modified retrospective approach; however, it continues to monitor interpretative issues that remain outstanding. Any significant developments in interpretative issues could change the Company’s expected method of adoption. The majority of the Company’s revenue is generated from energy sales to customers based on published tariff rates, as approved by the PUB, and is expected to be in the scope of ASU No. 2014-09. Newfoundland Power does not expect that the adoption of this standard, and all related ASUs, will have a material impact on the recognition of revenue; however, the Company does expect it will impact its required disclosures. Certain specific interpretative issues remain outstanding and the conclusions reached, if different than currently anticipated, could have a material impact on the Company’s financial statements and related disclosures. Newfoundland Power continues to closely monitor developments related to the new standard. Improving the Presentation of Net Periodic Pension Cost and Net Periodic Post-retirement Benefit Cost ASU No. 2017-07, Improving the Presentation of Net Periodic Pension Cost and Net Periodic Post-retirement Benefit Cost, was issued in March 2017 and the amendments in this update require that an employer disaggregate the current service cost component of net benefit cost and present it in the same statement of earnings line item as other employee compensation costs arising from services rendered. The other components of net benefit cost are required to be presented separately from the service cost component and outside of operating income. Additionally, the amendments allow only the service cost component to be eligible for capitalization, when applicable. This update is effective for annual and interim periods beginning after December 15, 2017. The amendments in this update should be applied retrospectively for the presentation of net periodic benefit costs and prospectively, on and after the effective date, for the capitalization in assets of only the service cost component of net periodic benefit cost. The Company is assessing the impact that the adoption of this update will have on its financial statements and related disclosures.
CRITICAL ACCOUNTING ESTIMATES There were no material changes to the Company’s critical accounting estimates during the first half of 2017. Interim financial statements, however, tend to employ a greater use of estimates than the annual financial statements.
QUARTERLY RESULTS The following table sets forth unaudited quarterly information for each of the eight quarters ended September 30, 2015 through June 30, 2017. The quarterly information reflects Canadian dollars and has been obtained from the Company’s interim unaudited financial statements which have been prepared in accordance with U.S. GAAP. These financial results are not necessarily indicative of results for any future period and should not be relied upon to predict future performance.
Second Quarter June 30
First Quarter March 31
Fourth Quarter December 31
Third Quarter September 30
2017 2016 2017 2016 2016 2015 2016 2015
Electricity Sales (GWh) 1,357.5 1,342.7 2,060.0 2,038.5 1,618.0 1,613.1 950.9 965.8
Revenue ($millions) 155.2 152.8 228.9 224.6 182.4 181.0 112.3 112.4
Net Earnings Applicable to Common Shares ($millions)
11.5 10.3 10.8 10.8 11.0 9.8 7.9 6.9
Earnings per Common Share ($) 1 1.11 1.00 1.05 1.04 1.06 0.95 0.77 0.67 1 Basic and fully diluted.

Interim Management Discussion & Analysis | 10
Seasonality Sales and Revenue: Interim financial results reflect the seasonality of electricity sales for heating. Sales and revenue are significantly higher in the first quarter and significantly lower in the third quarter compared to the remaining quarters. This reflects the seasonality of electricity consumption for heating. Earnings: In addition to the seasonality of electricity consumption for heating, quarterly earnings are impacted by the purchased power rate structure. The Company pays more, on average, for each kilowatt hour (“kWh”) of purchased power in the winter months and less, on average, for each kWh of purchased power in the summer months. Overall, these sales, revenue and cost dynamics are such that earnings are generally expected to be lower in the third quarter than the remaining quarters in the year.
Trending
Sales and Revenue: Year-over-year quarterly electricity sales increases primarily reflect growth in the number of customers served by the Company. Future sales and customer growth is expected to be lower than in recent years.
Earnings: Beyond the impact of expected lower sales growth, future quarterly earnings and earnings per share are expected to trend with the ROE reflected in customer rates and rate base growth.
OUTLOOK The Company’s strategy will remain unchanged. Newfoundland Power is regulated under a cost of service regime. Cost of service regulation entitles the Company to an opportunity to recover its reasonable cost of providing service, including its cost of capital, in each year. Newfoundland Power expects to maintain its investment grade credit ratings in 2017.
Customer Rates: Effective July 1, 2017, there was an overall average increase in electricity rates charged to customers of approximately 8.5%. The rate increase is the net result of a flow through adjustment to Newfoundland Power’s customer electricity rates resulting from a final ruling on Hydro’s 2013 GRA and the annual operation of Hydro’s Rate Stabilization Plan (“Hydro RSP”) and the Company’s RSA. Among other things, Hydro’s 2013 GRA resulted in adjustments in the wholesale electricity rate paid to Hydro by Newfoundland Power to reflect changes in Hydro’s costs. Variances in Hydro’s cost of fuel used to generate electricity are captured in the Hydro RSP and flowed-through to the Company’s customers through the operation of the Company’s RSA. The primary reason for the rate increase was an increase in the forecast cost of fuel to be used at the Holyrood generating facility. The RSA also captures variances in Newfoundland Power’s cost such as energy supply cost variances and employee future benefit cost variances. This adjustment in customer rates has no impact on annual earnings for Newfoundland Power. 2018 Capital Plan: On July 7, 2017, the Company filed an application with the PUB requesting approval for its 2018 capital expenditure plan totaling $83.9 million. The application is currently under review by the PUB.
Supply Costs: Future changes in supply costs, including costs associated with Nalcor Energy’s Muskrat Falls hydroelectric generation development and associated transmission assets, may affect electricity prices in a manner that affects the Company’s sales. In June 2017 Nalcor Energy indicated that the cost of the project is now projected to be approximately $12.7 billion. Nalcor Energy has also indicated it is investigating the options available to moderate the impact of higher project costs on electricity prices. Inquiry and Hearing into Supply Issues and Power Outages on the Island Interconnected System: The Company experienced losses of electricity supply from Hydro in January 2013 and January 2014, which disabled the Company from meeting all of its customers’ requirements. The PUB is conducting an inquiry and hearing into these system supply issues and

Interim Management Discussion & Analysis | 11
power interruptions. The PUB issued its report on the supply issues and power interruptions on September 29, 2016. The report indicated that Newfoundland Power did not cause or contribute to the power outages. It also indicated significant concerns remain in relation to the adequacy and reliability of supply from Hydro. The second phase of the inquiry and hearing process is ongoing and will consider issues associated with adequacy and reliability on the Island Interconnected system before and after interconnection with Nalcor Energy’s Muskrat Falls project.
OUTSTANDING SHARES As at the filing date of this MD&A the Company had issued and outstanding 10,320,270 common shares; 179,225 first preference shares, Series A; 337,983 first preference shares, Series B; 192,640 first preference shares, Series D; and 182,900 first preference shares, Series G. Each of the common shares and first preference shares carry voting rights equal to one vote per share.
CORPORATE INFORMATION Additional information about Newfoundland Power, including its Annual Information Form and Management Information Circular, is available on SEDAR at www.sedar.com. All the common shares of Newfoundland Power Inc. are owned by Fortis Inc., a leader in the North American regulated electric and gas utility business with total assets of approximately $48 billion. More than 8,000 employees of Fortis Inc. serve utility customers in five Canadian provinces, nine U.S. states and three Caribbean countries. Fortis Inc. shares are listed on the TSX and NYSE and trade under the symbol FTS. Additional information can be accessed at www.fortisinc.com, www.sedar.com, or www.sec.gov. The information contained on, or accessible through, any of these websites is not incorporated by reference into this document. For further information, contact: Paige London, Vice President, Finance & CFO Newfoundland Power Inc. P.O. Box 8910, St. John’s, NL A1B 3P6 Tel: (709) 737-5409 Fax: (709) 737-5300 Email: [email protected] Share Transfer Agent and Registrar: Computershare Investor Services Inc. 100 University Street, 8th Floor Toronto, ON M5J 2Y1 Tel: (416) 263-9200 Fax: (888) 453-0330 www.computershare.com Website: www.newfoundlandpower.com

Revenue 155,203$ 152,790$ 384,102$ 377,408$
Expenses
Purchased power 95,335 93,526 264,250 259,646
Operating expenses 15,880 15,121 33,764 31,695
Employee future benefits 4,436 4,649 8,873 9,231
Depreciation and amortization 15,917 15,518 30,934 29,647
Cost recovery deferral, net (Note 5) (258) 1,459 (516) 1,459
Finance charges (Note 6) 8,853 8,991 17,546 18,391
Total Expenses 140,163 139,264 354,851 350,069
Earnings Before Income Taxes 15,040 13,526 29,251 27,339
Income tax expense (Note 7) 3,397 3,084 6,664 6,002
Net Earnings 11,643 10,442 22,587 21,337
Preference share dividends 139 139 278 278
Net Earnings Applicable to Common Shares 11,504$ 10,303$ 22,309$ 21,059$
Basic and Diluted Earnings per Common Share 1.11$ 1.00$ 2.16$ 2.04$
Retained
Earnings
Total
Equity
As at January 1, 2017 70,321$ 8,930$ 414,954$ 494,205$
Net earnings - - 22,587 22,587
Allocation of Part VI.1 tax - - 288 288
Dividends on common shares ($1.28 per share) - - (13,210) (13,210)
Dividends on preference shares - - (278) (278)
Redemption of preference shares - (3) - (3)
As at June 30, 2017 70,321$ 8,927$ 424,341$ 503,589$
As at January 1, 2016 70,321$ 8,939$ 395,934$ 475,194$
Net earnings - - 21,337 21,337
Allocation of Part VI.1 tax - - 7 7
Dividends on common shares ($1.04 per share) - - (10,733) (10,733)
Dividends on preference shares - - (278) (278)
As at June 30, 2016 70,321$ 8,939$ 406,267$ 485,527$
See accompanying notes to financial statements.
Common
Shares
Preference
Shares
Statements of Changes in Equity (Unaudited)For the Six Months Ended June 30
(in thousands of Canadian dollars, except per share amounts)
2017 2016 2017 2016
Statements of Earnings (Unaudited)For the Three and Six Months Ended June 30
(in thousands of Canadian dollars, except per share amounts)
Three Months Ended Six Months Ended
Interim Financial Statements | 1

December 31, 2016
Assets
Current assets
Accounts receivable 66,119$ 75,639$
Materials and supplies 1,554 1,419
Prepaid expenses 1,569 1,842
Regulatory assets (Note 5) 19,793 12,783
Total current assets 89,035 91,683
Property, plant and equipment, net 1,092,365 1,082,095
Intangible assets 21,330 21,168
Defined benefit pension plans 11,444 9,164
Regulatory assets (Note 5) 328,613 334,725
Other assets 1,371 1,488
Total assets 1,544,158$ 1,540,323$
Liabilities and Shareholders’ Equity
Current liabilities
Short-term borrowings 2,028$ 2,349$
Accounts payable and accrued charges 41,048 78,535
Interest payable 6,862 6,623
Income taxes payable 1,297 495
Defined benefit pension plans 240 233
Other post-employment benefits 3,533 3,388 Regulatory liabilities (Note 5) 1,673 1,032 Current instalments of long-term debt (Note 8) 15,100 66,350
Total current liabilities 71,781 159,005
Regulatory liabilities (Note 5) 149,331 144,451
Defined benefit pension plans 5,899 5,859
Other post-employment benefits 89,719 88,570
Other liabilities 738 786
Deferred income taxes 141,317 139,750
Long-term debt (Note 8) 581,784 507,697
Total liabilities 1,040,569 1,046,118
Commitments (Note 13)
Shareholders’ equity
Common shares, no par value, unlimited authorized shares,
10.3 million shares issued and outstanding 70,321
Preference shares 8,927 8,930
Retained earnings 424,341 414,954
Total shareholders' equity 503,589 494,205
Total liabilities and shareholders' equity 1,544,158$ 1,540,323$
See accompanying notes to financial statements.
70,321
June 30, 2017
Balance Sheets (Unaudited)As at
(in thousands of Canadian dollars)
Interim Financial Statements | 2

2017 2016 2017 2016
Cash From (Used in) Operating Activities
Net earnings 11,643$ 10,442$ 22,587$ 21,337$ Adjustments to reconcile net earnings to net cash
provided by operating activities:
Depreciation of property, plant and equipment 15,157 14,803 29,397 28,217
Amortization of intangible assets and other 820 770 1,655 1,542
Change in long-term regulatory assets and liabilities 1,889 1,444 5,734 3,071
Deferred income taxes 355 40 (689) (1,225)
Employee future benefits 565 1,111 1,351 2,047
Other 92 (129) 192 (150)
Change in non-cash operating working capital 984 4,349 (33,329) (21,651)
31,505 32,830 26,898 33,188
Cash From (Used In) Investing Activities
Capital expenditures (21,167) (20,040) (36,483) (37,545)
Intangible asset expenditures (1,158) (2,075) (1,699) (3,117)
Contributions from customers 1,127 1,398 2,308 1,959
Other 95 (63) 40 20
(21,103) (20,780) (35,834) (38,683)
Cash From (Used In) Financing Activities
Change in short-term borrowings 1,094 (145) (321) 406
Net (repayment) proceeds of committed credit facility (79,500) 24,000 (52,000) 46,500
Proceeds from long-term debt 75,000 - 75,000 -
Repayment of long-term debt - (30,400) - (30,400)
Redemption of preference shares - - (3) -
Payment of debt financing costs (252) - (252) -
Dividends
Preference shares (139) (139) (278) (278) Common shares (6,605) (5,366) (13,210) (10,733)
(10,402) (12,050) 8,936 5,495
Change in Cash - - - -
Cash, Beginning of the Period - - - -
Cash, End of the Period -$ -$ -$ -$
See accompanying notes to financial statements.
Six Months Ended
Statements of Cash Flows (Unaudited)For the Three and Six Months Ended June 30
(in thousands of Canadian dollars)
Three Months Ended
Interim Financial Statements | 3

Notes to Interim Financial Statements | 4
Notes to Interim Financial Statements (Unaudited) For the Three and Six Months Ended June 30, 2017 and 2016 (unless otherwise noted) Tabular amounts are in thousands of Canadian dollars unless otherwise noted.
1. Description of the Business Newfoundland Power Inc. (the “Company” or “Newfoundland Power”) is a regulated electricity utility that operates an integrated generation, transmission, and distribution system throughout the island portion of Newfoundland and Labrador. All of the common shares of the Company are owned by Fortis Inc. (“Fortis”). Newfoundland Power has an installed generating capacity of 139 megawatts (“MW”), of which approximately 97 MW is hydroelectric generation. The Company generates approximately 7% of its energy needs and purchases the remainder from Newfoundland and Labrador Hydro (“Hydro”). The Company is regulated by the Newfoundland and Labrador Board of Commissioners of Public Utilities (the “PUB”), and operates under cost of service regulation whereby it is entitled the opportunity to recover, through customer rates, all reasonable and prudent costs incurred in providing electricity service to its customers, including a just and reasonable return on its rate base. The rate base is the value of the net assets required to provide electricity service. On June 8, 2016, the PUB issued the Order on the Company’s 2016/2017 General Rate Application (“GRA”) which established the Company’s cost of capital for ratemaking purposes for 2016 through 2018 based upon an 8.50% return on equity (“ROE”) and 45% common equity. The Company’s rate of return on rate base for 2017 is 7.19%, with a range of 7.01% to 7.37%, compared to 7.21%, with a range of 7.03% to 7.39% for 2016. Newfoundland Power is required to file its next GRA for 2019 on or before June 1, 2018.
2. Basis of Presentation These interim financial statements have been prepared in accordance with accounting principles generally accepted in the United States of America (“U.S. GAAP”) for interim financial statements and do not include all of the disclosures provided in the annual audited financial statements. These interim financial statements should be read in conjunction with the Company’s 2016 annual audited financial statements. The accounting policies and methods of their application followed in the preparation of these interim financial statements are the same as those followed in the preparation of the Company’s 2016 annual audited financial statements. The preparation of financial statements in accordance with U.S. GAAP requires management to make estimates and judgments that affect the reported amounts of assets and liabilities and the disclosure of contingent assets and liabilities at the date of the financial statements, and the reported amounts of revenues and expenses during the reporting periods. There were no material changes to the Company’s significant accounting estimates during the three and six months ended June 30, 2017. An evaluation of subsequent events through July 28, 2017, the date these interim financial statements were issued, was completed and it was determined there were no circumstances that warranted recognition and disclosure of events or transactions in the interim financial statements as at June 30, 2017.

Notes to Interim Financial Statements | 5
3. Future Accounting Changes
Revenue from Contracts with Customers Accounting Standards Update (“ASU”) No. 2014-09 was issued in May 2014 and the amendments in this update create Accounting Standards Codification (“ASC”) Topic 606, Revenue from Contracts with Customers, and supersede the revenue recognition requirements in ASC Topic 605, Revenue Recognition, including most industry-specific revenue recognition guidance throughout the codification. In 2016 a number of additional ASUs were issued that clarify implementation guidance in ASC Topic 606. This standard, and all related ASUs, is effective for annual and interim periods beginning after December 15, 2017. The guidance permits two methods of adoption: (i) the full retrospective method, under which comparative periods would be restated, and the cumulative impact of applying the standard would be recognized as at January 1, 2017, the earliest period presented; and (ii) the modified retrospective method, under which comparative periods would not be restated and the cumulative impact of applying the standard would be recognized at the date of initial adoption, January 1, 2018. The Company expects to use the modified retrospective approach; however, it continues to monitor interpretative issues that remain outstanding. Any significant developments in interpretative issues could change the Company’s expected method of adoption. The majority of the Company’s revenue is generated from energy sales to customers based on published tariff rates, as approved by the PUB, and is expected to be in the scope of ASU No. 2014-09. Newfoundland Power does not expect that the adoption of this standard, and all related ASUs, will have a material impact on the recognition of revenue; however, the Company does expect it will impact its required disclosures. Certain specific interpretative issues remain outstanding and the conclusions reached, if different than currently anticipated, could have a material impact on the Company’s financial statements and related disclosures. Newfoundland Power continues to closely monitor developments related to the new standard. Improving the Presentation of Net Periodic Pension Cost and Net Periodic Post-retirement Benefit Cost ASU No. 2017-07, Improving the Presentation of Net Periodic Pension Cost and Net Periodic Post-retirement Benefit Cost, was issued in March 2017 and the amendments in this update require that an employer disaggregate the current service cost component of net benefit cost and present it in the same statement of earnings line item as other employee compensation costs arising from services rendered. The other components of net benefit cost are required to be presented separately from the service cost component and outside of operating income. Additionally, the amendments allow only the service cost component to be eligible for capitalization, when applicable. This update is effective for annual and interim periods beginning after December 15, 2017. The amendments in this update should be applied retrospectively for the presentation of net periodic benefit costs and prospectively, on and after the effective date, for the capitalization in assets of only the service cost component of net periodic benefit cost. The Company is assessing the impact that the adoption of this update will have on its financial statements and related disclosures.
4. Seasonality
Sales and Revenue: Interim financial results reflect the seasonality of electricity sales for heating. Sales and revenue are significantly higher in the first quarter and significantly lower in the third quarter compared to the remaining quarters. This reflects the seasonality of electricity consumption for heating. Earnings: In addition to the seasonality of electricity consumption for heating, quarterly earnings are impacted by the purchased power rate structure. The Company pays more, on average, for each kilowatt hour (“kWh”) of purchased power in the winter months and less, on average, for each kWh of purchased power in the summer months. Overall, these sales, revenue and cost dynamics are such that earnings are generally expected to be lower in the third quarter than the remaining quarters in the year.

Notes to Interim Financial Statements | 6
5. Regulatory Assets and Liabilities Regulatory assets and liabilities arise as a result of the rate-setting process. Regulatory assets represent future revenues associated with certain costs incurred in the current or prior periods that will be, or are expected to be, recovered from customers in future periods through the rate-setting process. Regulatory liabilities represent future reductions or limitations of increases in revenues associated with amounts that will be, or are expected to be, credited to customers through the rate-setting process. The regulatory assets and liabilities, and their eventual settlement through the rate-setting process, are prescribed by the PUB and impact the Company’s cash flows. The Company’s regulatory assets and liabilities which will be, or are expected to be, reflected in customer rates in future periods, follow:
June 30, 2017
December 31, 2016
Remaining Recovery Period (Years)
Regulatory assets
Rate stabilization account (“RSA”) $ 10,231 $ 4,763 2
Other post-employment benefits 29,784 31,536 9
Conservation and demand management deferral 15,974 15,999 7
Employee future benefits 96,674 100,757 Benefit payment
period Weather normalization account 962 2,458 2
Deferred GRA costs 512 682 2
Energy supply cost variance reserve 588 - 2
Demand management incentive 112 - 2
Deferred income taxes 193,569 191,313 Life of related assets
Total regulatory assets $ 348,406 $ 347,508
Less: current portion 19,793 12,783
Long-term regulatory assets
$ 328,613 $ 334,725
June 30, 2017
December 31, 2016
Remaining Settlement Period (Years)
Regulatory liabilities
Cost recovery deferral $ 1,548 $ 2,064 2
Pension expense variance deferral account (“PEVDA”) 584 - 2
OPEBs cost variance deferral account 57 - 2
Future removal and site restoration provision 148,815 143,419 Life of related assets
Total regulatory liabilities $ 151,004 $ 145,483
Less: current portion 1,673 1,032
Long-term regulatory liabilities $ 149,331 $ 144,451

Notes to Interim Financial Statements | 7
6. Finance Charges Three Months Ended June 30 Six Months Ended June 30
2017 2016 2017 2016
Interest - first mortgage sinking fund bonds $ 8,600 $ 8,739 $ 16,962 $ 18,026
Interest - committed credit facility and other 264 310 569 441
Total interest expense 8,864 9,049 17,531 18,467
Amortization – debt issue costs 45 45 89 93
Amortization – committed credit facility costs 14 9 29 19
Interest portion of allowance for funds used during construction (70) (112) (103) (188) $ 8,853 $ 8,991 $ 17,546 $ 18,391
7. Income Taxes The composition of the Company’s income tax expense follows:
Three Months Ended June 30 Six Months Ended June 30
2017 2016 2017 2016
Current income tax expense $ 3,042 $ 3,078 $ 7,353 $ 7,261
Deferred income tax expense 1,548 5,451 1,567 3,410
Regulatory adjustment (1,193) (5,445) (2,256) (4,669)
$ 3,397 $ 3,084 $ 6,664 $ 6,002
8. Long-term Debt
June 30, 2017 December 31, 2016
First mortgage sinking fund bonds $ 591,135 $ 516,135 Committed credit facility (Note 10) 8,500 60,500
599,635 576,635
Less: current portion 15,100 66,350
Less: deferred financing costs
$ 584,535 2,751
$ 510,285 2,588
$ 581,784 $ 507,697
First mortgage sinking fund bonds are secured by a first fixed and specific charge on property, plant and equipment owned or to be acquired by the Company and by a floating charge on all other assets. They require an annual sinking fund payment of 1% of the original principal balance. On June 2, 2017, the Company issued $75 million 40-year, 3.815% first mortgage sinking fund bonds. Net proceeds from the issuance were used to repay credit facility borrowings incurred principally to fund capital expenditures and for general corporate purposes. The committed credit facility is a syndicated $100 million revolving term credit facility that matures in August 2021. Borrowings under the committed credit facility are in the form of bankers acceptances that primarily have a maturity date of 30 days or less. Management intends to refinance these amounts in the future with the issuance of other long-term debt. Deferred financing costs are recorded at cost and are amortized to earnings using the effective interest rate method over the life of the related debt.

Notes to Interim Financial Statements | 8
9. Fair Value Measurement Fair value is the price at which a market participant could sell an asset or transfer a liability to an unrelated party. A fair value measurement is required to reflect the assumptions that market participants would use in pricing an asset or a liability based on the best available information. These assumptions include the risks inherent in a particular valuation technique, such as a pricing model, and the risks inherent in the inputs to the model. A fair value hierarchy exists which prioritizes the inputs used to measure fair value. The three levels of the fair value hierarchy are defined as follows:
Level 1: Fair value determined using unadjusted quoted prices in active markets; Level 2: Fair value determined using pricing inputs other than quoted prices in active markets that are either directly
or indirectly observable for the asset or liability; and Level 3: Fair value determined using unobservable inputs only when relevant observable inputs are not available.
The fair value of long-term debt, including current portion and committed credit facility, is estimated using Level 2 inputs. The fair value is calculated by discounting the future cash flows of each debt instrument at the estimated yield-to-maturity equivalent to benchmark government bonds, with similar terms to maturity, plus a credit risk premium equal to that of issuers of similar credit quality. Since the Company does not intend to settle its debt instruments before maturity, the fair value estimate does not represent an actual liability and, therefore, does not include settlement costs. The fair value of the Company’s financial instruments reflects a point-in-time estimate based on current and relevant market information about the instruments as at the balance sheet date. The estimates cannot be determined with precision as they involve uncertainties and matter of judgment, and therefore, may not be relevant in predicting the Company’s future earnings or cash flows. The fair value of long-term debt, including current portion and committed credit facility, at June 30, 2017 and December 31, 2016 is as follows:
June 30, 2017 December 31, 2016 Carrying
Value Estimated Fair Value
Carrying Value
Estimated Fair Value
Long-term debt, including current portion and committed credit facility (Note 8) $ 599,635 $ 743,496 $ 576,635 $ 718,740
As at June 30, 2017, the fair value of the Company’s primary defined benefit pension plan assets was $413.7 million compared to $400.8 million as at December 31, 2016. The Company’s funded defined benefit pension plan assets are measured using the market approach valuation technique. The fair value measurements for all of the pension plan assets, as held in various pooled funds, are classified as Level 2. The fair value of the Company’s remaining financial instruments included in current assets, current liabilities, other assets and other liabilities approximate their carrying value, reflecting their nature, short-term maturity or normal trade credit terms.

Notes to Interim Financial Statements | 9
10. Financial Risk Management The Company is primarily exposed to credit risk, liquidity risk and market risk as a result of holding financial instruments in the normal course of business. Credit Risk: There is a risk that Newfoundland Power may not be able to collect all of its accounts receivable and amounts owing under its customer finance plans. These financial instruments, which arise in the normal course of business, do not represent a significant concentration of credit risk as amounts are owed by a large number of customers on normal credit terms. The requirement for security deposits for certain customers, which are advance cash collections from customers to guarantee payment of electricity billings, further reduces the exposure to credit risk. The maximum exposure to credit risk is the net carrying value of these financial instruments. Newfoundland Power manages credit risk primarily by executing its credit and collection policy, including the requirement for security deposits. Liquidity Risk: The Company’s financial position could be adversely affected if it failed to arrange sufficient and cost-effective financing to fund, among other things, capital expenditures and repayment of maturing debt. The ability to arrange such financing is subject to numerous factors, including the results of operations and financial position of the Company, conditions in the capital and bank credit markets, ratings assigned by rating agencies, and general economic conditions. These factors are mitigated by the legal requirement as outlined in the Electrical Power Control Act, 1994 (Newfoundland and Labrador), which requires rates be set to enable the Company to achieve and maintain a sound credit rating in the financial markets of the world. The Company has historically generated sufficient annual cash flows from operating activities to service annual interest and sinking fund payments on debt, to fund pension obligations, to pay dividends and to finance a major portion of its annual capital program. Additional financing to fully fund the annual capital program is primarily obtained through the Company’s bank credit facilities and these borrowings are periodically refinanced, along with any maturing bonds, through the issuance of long-term first mortgage sinking fund bonds. The Company currently does not expect any material changes in these annual cash flow and financing dynamics over the foreseeable future. Newfoundland Power has unsecured bank credit facilities of $120 million comprised of the $100 million committed credit facility and a $20 million demand facility. The committed facility matures in August 2021. Subject to lenders’ approval, the Company has the option to extend the maturity for a period of up to, but not exceeding, a five-year term. Borrowings under the committed credit facility are in the form of bankers acceptances bearing interest based on the daily Canadian Deposit Offering Rate for the date of borrowing plus a stamping fee. Standby fees on the unutilized portion of the committed credit facility are payable quarterly in arrears at a fixed rate of 0.16%. Interest on borrowings under the demand facility is calculated at the daily prime rate and is payable monthly in arrears.
June 30, 2017 December 31, 2016
Total Credit Facilities $ 120,000 $ 120,000 Borrowings under committed facility (Note 8) (8,500) (60,500) Borrowings under demand facility (2,028) (2,349)
Credit Facilities Available $ 109,472 $ 57,151
To ensure continued access to capital at reasonable cost, the Company endeavours to maintain its investment grade credit ratings. Details of the Company’s investment grade bond ratings follow:
June 30, 2017 December 31, 2016 Rating Agency Rating Outlook Rating Outlook
Moody’s Investors Service (“Moody’s”) A2 Stable A2 Stable DBRS A Stable A Stable
During the first quarter of 2017, Moody’s issued an updated credit rating report confirming the Company’s existing investment grade bond rating and rating outlook.

Notes to Interim Financial Statements | 10
10. Financial Risk Management (cont’d) Market Risk: Market driven changes in interest rates and changes in the Company’s credit ratings can cause fluctuations in interest costs associated with the Company’s bank credit facilities. The Company periodically refinances its credit facilities in the normal course with fixed-rate first mortgage sinking fund bonds, thereby significantly mitigating exposure to interest rate changes. Changes in interest rates and/or changes in the Company’s credit ratings can affect the interest rate on first mortgage sinking fund bonds at the time of issue. The Company’s defined benefit pension plan is impacted by economic conditions. There is no assurance that the pension plan assets will earn the expected long-term rate of return in the future. Market driven changes impacting the performance of the pension plan assets may result in material variations from the expected long-term return on the assets. This may cause material changes in future pension liabilities and pension expense. The operation of the PUB approved PEVDA is expected to significantly mitigate the impact on the Company’s pension expense, whereby the difference between actual pension expense and the amounts approved in customer rates due to variations in assumptions is recovered from (returned to) customers through the Company’s RSA. Concentration of Supply: The Company is dependent on Hydro for approximately 93% of its energy requirements. The principal terms of the supply arrangements with Hydro are regulated by the PUB on a basis similar to that upon which the Company’s service to its customers is regulated.
11. Employee Future Benefits The Company’s employee future benefits cost includes both the net benefit costs of its defined benefit and defined contribution plans. The components of net benefit costs associated with the Company’s defined benefit plans, prior to capitalization, are as follows.
Three Months Ended June 30 2017 2016
Defined Benefit Pension Plans OPEBs
Defined Benefit Pension Plans OPEBs
Service costs $ 1,200 $ 544 $ 1,177 $ 474
Interest costs 3,805 880 3,918 891
Expected return on plan assets (5,142) - (5,358) -
Amortization of net actuarial losses 1,228 149 1,636 123
Amortization of past service costs (credits) 53 (323) 53 (323)
$ 1,144 $ 1,250 $ 1,426 $ 1,165
Regulatory adjustments
Amortization of transitional obligations 333 357 333 357
Amortization of pension deferrals 206 - 206 -
Amortization of OPEBs regulatory asset - 876 - 876
Net benefit cost $ 1,683 $ 2,483 $ 1,965 $ 2,398

Notes to Interim Financial Statements | 11
11. Employee Future Benefits (cont’d) Six Months Ended June 30 2017 2016
Defined Benefit Pension Plans OPEBs
Defined Benefit Pension Plans OPEBs
Service costs $ 2,398 $ 1,088 $ 2,353 $ 948
Interest costs 7,607 1,760 7,836 1,783
Expected return on plan assets (10,284) - (10,716) -
Amortization of net actuarial losses 2,456 298 3,273 246
Amortization of past service costs (credits) 106 (646) 106 (646)
$ 2,283 $ 2,500 $ 2,852 $ 2,331
Regulatory adjustments
Amortization of transitional obligations 667 714 667 714
Amortization of pension deferrals 412 - 412 -
Amortization of OPEBs regulatory asset - 1,752 - 1,752
Net benefit cost $ 3,362 $ 4,966 $ 3,931 $ 4,797
For the three months ended June 30, 2017, the Company expensed $0.5 million (2016 - $0.5 million) related to its defined contribution pension plans. For the six months ended June 30, 2017, the cost was $1.0 million (2016 - $1.0 million).
12. Related Party Transactions The Company provides services to, and receives services from, its parent company, Fortis, and other subsidiaries of Fortis. The Company also incurs charges from Fortis for the recovery of general corporate expenses incurred by Fortis. These transactions are in the normal course of business and are recorded at their exchange amounts. Related party transactions included in operating expenses for the three and six months ended June 30, 2017 were $0.6 million and $1.2 million, respectively (2016 - $0.6 million and $1.2 million, respectively).
13. Commitments There were no material changes in the nature and amount of the Company’s commitments as disclosed in the Company’s 2016 annual audited financial statements.