Second Quarter 2014 - RNS · PDF filebanglalink showed the results of its successful...
18
Global Telecom Holding 2Q14 | 0 Second Quarter 2014
Transcript of Second Quarter 2014 - RNS · PDF filebanglalink showed the results of its successful...

Global Telecom Holding 2Q14 | 0
Second Quarter 2014

Global Telecom Holding 2Q14 | 1
2Q14 Highlights1 Total customers
2 grew 6% YoY to exceed 91 million, mainly driven by strong additions in Bangladesh.
Revenue stood at USD 863 million, negatively impacted by slowdown in Algeria and Pakistan, partially offset by a
strong recovery in Bangladesh.
EBITDA amounted to USD 389 million. Strong group EBITDA margin of 45.1%. EBITDA margins for the major subsidiaries were: Djezzy 54.5%, Mobilink 38.9%, and banglalink 38.2%.
GTH generated USD 74 million of operating cash flow4 in 2Q14.
Net Debt5 stood at USD 2.6 billion, reflecting an increase of 12% when compared to 4Q13; Net Debt/EBITDA
6 increased
to 1.6x as at June 30, 2014.
Cairo/London (August 6, 2014), Global Telecom Holding S.A.E. (‘GTH’, or ‘the Group’) (EGX: GLTD.CA, GTHE EY. LSE:GTLD LI, GLTD:TQ), a leading provider of mobile telecommunications in Africa, Asia and North America, announces its consolidated financial and operating results for the second quarter ending June 30, 2014.
Vincenzo Nesci, Chief Executive Officer, comments:
Table 1: Group Key Indicators
Thousands 2Q14 2Q13 Change Organic Growth
1H14 1H13 Change
Total customers2
91,084 85,886 6% 91,084 85,885 6%
Revenue (USD) 863,330 903,756 (4%) (5%) 1,693,982 1,753,000 (3%)
EBITDA (USD)
388,991 438,066 (11%) (11%) 784,253 851,379 (8%)
EBITDA margin 45.1% 48.5% (3.4pp) 46.3% 48.6% (2.3pp)
Net income (USD) (173,073) (22,726) n.m. (130,256) (226,334) n.m.
EPS (USD per GDR) (0.16) (0.02) n.m. (0.12) (0.22) n.m.
Capex (USD) 315,411 68,976 357% 458,185 109,938 317%
In the second quarter of 2014, our customers increased 6% YoY to exceed 91 million, driven by strong additions in Bangladesh as well as steady growth in Algeria and Pakistan. Group revenue amounted to USD 863 million for the quarter, with an EBITDA of USD 389 million. We continued to deliver an industry leading EBITDA margin of 45.1%, and generated USD 74 million in operating cash flow
4 during the quarter. Net loss for the quarter stood at USD 173 million, negatively impacted by
financial expense of USD 151 million, foreign exchange losses of USD 109 million and impairment of assets held for sale by USD 22 million. Our CAPEX increased 357% YoY, driven by the 3G rollout and deployment in Algeria, Pakistan and Bangladesh, and the network modernization in Pakistan.
In Bangladesh, banglalink showed the results of its successful turnaround with 9% YoY growth in revenue and 12% YoY growth in EBITDA. On July 5, 2014, Djezzy launched 3G services in seven provinces including the largest four provinces in terms of population. Djezzy expects to stabilize its market-leading position in 2H14, now that it has launched 3G services. On July 18, 2014, Mobilink launched 3G services in eleven Pakistani cities. Mobilink had begun offering 3G services promptly after receiving its license in May 2014. On July 21, 2014, GTH’s minority shareholders authorized the amendment of the shareholders’ loan from VimpelCom. The amendment will encompass changes to certain terms of the loan agreement including an extension period of 37 months, change in security and a new interest rate of 12.5%. The extension will give GTH the necessary financial flexibility to complete the Algeria transaction.
1. Income Statement and Balance Sheet figures are in US dollars and are prepared in accordance with the International Financial Reporting Standards (IFRS). 2. As announced on July 1 2013, during an internal investigation with regards to Djezzy’s active customers, management found a technical bug that overstated Djezzy’s
customer base by 1.4 million. The customers’ base comparative figures for 2Q13 were adjusted accordingly. 3. Organic growth for revenue and EBITDA: non-IFRS financial measures that reflect changes in revenue and EBITDA excluding foreign currency movements and other
factors, which includes business under liquidation, disposals, mergers and acquisitions (Please refer to glossary of terms for the definition of “organic growth”). 4. Operating cash flow is EBITDA less CAPEX, excluding license fees. 5. Net Debt is calculated as a sum of short term debt, long term debt, less cash and cash equivalents. 6. Net Debt/EBITDA is calculated for the annualized figures for the six month ending June 30, 2014.

Global Telecom Holding 2Q14 | 2
CONTENTS
Performance Review 3
GTH Operations 8
Financial Statements 12
Appendix 15

Global Telecom Holding 2Q14 | 3
1. As announced on July 1 2013, during an internal investigation with regards to Djezzy’s active customers, management found a technical bug that overstated Djezzy’s customer base by 1.4 million. The customers’ base comparative figures for 2Q13 were adjusted accordingly. This event does not impact historical reported revenue or EBITDA, but positively affect MOU and ARPU.
1. Performance Review
1-1 Customers
Table 2: Customer base
Subsidiary/thousands 2Q14 2Q13 Change
Djezzy, Algeria1 17,502 16,828 4%
Mobilink, Pakistan 38,768 37,122 4%
banglalink, Bangladesh 29,751 27,076 10%
Sub-Saharan Africa
4,322 4,239 2%
Subtotal 90,343 85,266 6%
Operations accounted for under the equity method
2Q14 2Q13 Change
WIND Mobile, Canada 741 620 20%
Total 91,084 85,886 6%
Total customers grew 6% YoY to exceed 91 million by the end of 2Q14, driven by steady growth in Algeria and Pakistan, as well as strong additions in Bangladesh and Canada.
In Algeria, Djezzy grew its mobile customer base 4% YoY to 17.5 million. Djezzy expects to stabilize its market-leading position in 2H14, now that it has launched 3G services.
In Pakistan, Mobilink’s mobile customer base increased 4% YoY to 38.8 million, supported by the introduction of an attractive tariff plan for new customers and a competitive reactivation campaign.
In Bangladesh, banglalink’s customer base grew 10% YoY to 29.8 million, driven by revised start-up offers with an attractive tariff upon recharge, including data, voice and SMS, in addition to various campaigns such as bonus on recharge offers and bundle gifting service.
In Sub-Saharan Africa, customers increased by 2% YoY, driven by strong additions to Burundi’s customer base, where the number of customers grew 15% YoY. In Canada, customers of WIND Mobile increased by 20%, as WIND Mobile continued to deliver on its "value plus" strategy by adding both postpaid and prepaid subscribers while carefully managing economics for voice and mobile broadband customers, maintaining its position as the fourth largest wireless carrier in the Canadian market.
Global Telecom Holding 2Q14 | 4
1-2 Revenue
Table 3: Revenue in US dollars
Subsidiary/thousands 2Q14 2Q13 Change 1H14 1H13 Change
Mobile
Djezzy, Algeria 437,117 464,157 (6%) 866,277 897,908 (3%)
Mobilink, Pakistan 261,377 289,460 (10%) 507,174 567,236 (11%)
banglalink, Bangladesh 141,062 128,929 9% 274,723 246,670 11%
Telecel Globe, Africa
23,756 20,958 13% 45,673 39,589 15%
Total Mobile 863,312 903,504 (4%) 1,693,847 1,751,403 (3%)
Telecom Services
Ring 18 253 n.m. 135 1,598 n.m.
Total Consolidated Revenue 863,330 903,756 (4%) 1,693,982 1,753,000 (3%)
Table 4: Revenue in local currency
Subsidiary/billions 2Q14 2Q13 Change 1H14 1H13 Change
Mobile
Djezzy, Algeria (DZD) 34.5 36.7 (6%) 68.0 70.8 (4%)
Mobilink, Pakistan (PKR) 26.3 28.6 (8%) 52.3 55.8 (6%)
banglalink, Bangladesh(BDT) 10.9 10.1 8% 21.3 19.4 10%
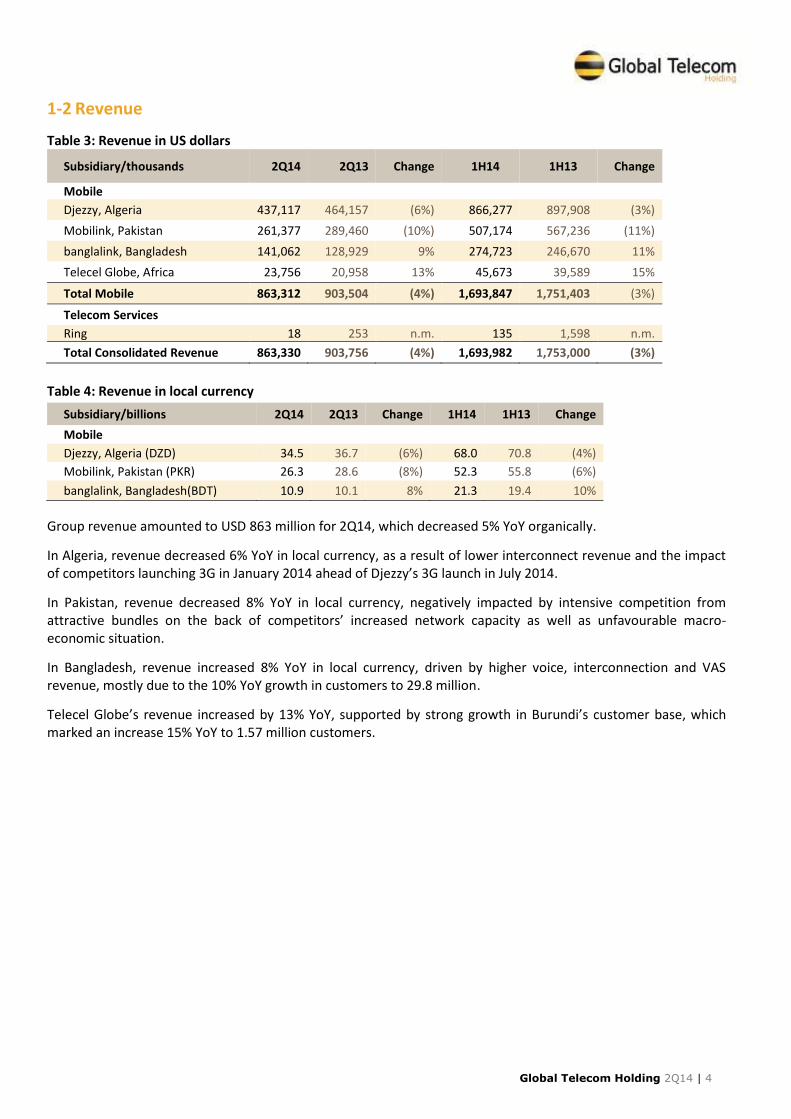
Group revenue amounted to USD 863 million for 2Q14, which decreased 5% YoY organically.
In Algeria, revenue decreased 6% YoY in local currency, as a result of lower interconnect revenue and the impact of competitors launching 3G in January 2014 ahead of Djezzy’s 3G launch in July 2014.
In Pakistan, revenue decreased 8% YoY in local currency, negatively impacted by intensive competition from attractive bundles on the back of competitors’ increased network capacity as well as unfavourable macro-economic situation.
In Bangladesh, revenue increased 8% YoY in local currency, driven by higher voice, interconnection and VAS revenue, mostly due to the 10% YoY growth in customers to 29.8 million.
Telecel Globe’s revenue increased by 13% YoY, supported by strong growth in Burundi’s customer base, which marked an increase 15% YoY to 1.57 million customers.

Global Telecom Holding 2Q14 | 5
1. As announced on July 1 2013, during an internal investigation with regards to Djezzy’s active customers, management found a technical bug that overstated Djezzy’s customer base by 1.4 million. The customers’ base comparative figures for 2Q13 were adjusted accordingly. This event does not impact historical reported revenue or EBITDA, but positively affect MOU and ARPU.
1-3 ARPU
Table 5: Blended average revenue per user (USD) Subsidiary 2Q14 2Q13 Change
Djezzy, Algeria1 8.3 9.2 (10%)
Mobilink, Pakistan 2.1 2.5 (16%)
banglalink, Bangladesh 1.6 1.6 (3%)
Table 6: Blended average revenue per user in local currency
Subsidiary 2Q14 2Q13 Change
Djezzy, Algeria (DZD)1 648 727 (11%)
Mobilink, Pakistan (PKR) 214 249 (14%)
banglalink, Bangladesh (BDT) 121 126 (4%)
In Algeria, Djezzy’s ARPU decreased 11% YoY in local currency, as a result of launch of 3G services by other operators in January 2014.
In Pakistan, Mobilink’s ARPU decreased 14% YoY in local currency, negatively impacted by decreased Average Price per Minute (“APPM”) due to aggressive on-net offerings from competition and the implementation of the additional withholding taxes.
In Bangladesh, banglalink’s ARPU decreased 4% YoY in local currency, due to lower APPM YoY driven by aggressive price competition, and a change in the mix of on-net/off-net call traffic. Furthermore, ARPU decreased as a result of the acquisition of lower ARPU segment customers.
Global Telecom Holding 2Q14 | 6
1-4 EBITDA1
Table 7: EBITDA in US dollars
Subsidiary/thousands 2Q14 2Q13 Change 1H14 1H13 Change
Mobile
Djezzy, Algeria 238,775 279,181 (14%) 485,239 535,789 (9%)
Mobilink, Pakistan 109,371 121,572 (10%) 208,694 238,864 (13%)
Banglalink, Bangladesh 53,879 47,459 14% 103,219 96,641 7%
Telecel Globe, Africa
7,209 4,118 75% 16,083 10,145 59%
Total Mobile 409,234 452,330 (10%) 813,235 881,439 (8%)
Ring (1,366) (1,375) n.m. (2,386) (2,647) n.m.
GTH and Other2
(18,876) (12,889) n.m. (26,595) (27,413) n.m.
Total Consolidated 388,991 438,066 (11%) 784,253 851,379 (8%)
Table 8: EBITDA in local currency
Subsidiary/billions 2Q14 2Q13 Change 1H14 1H13 Change
Mobile
Djezzy, Algeria (DZD) 18.8 22.1 (15%) 38.0 42.2 (10%)
Mobilink, Pakistan (PKR) 10.2 12.2 (16%) 20.5 23.7 (14%)
banglalink, Bangladesh (BDT) 4.2 3.7 12% 8.0 7.6 6%
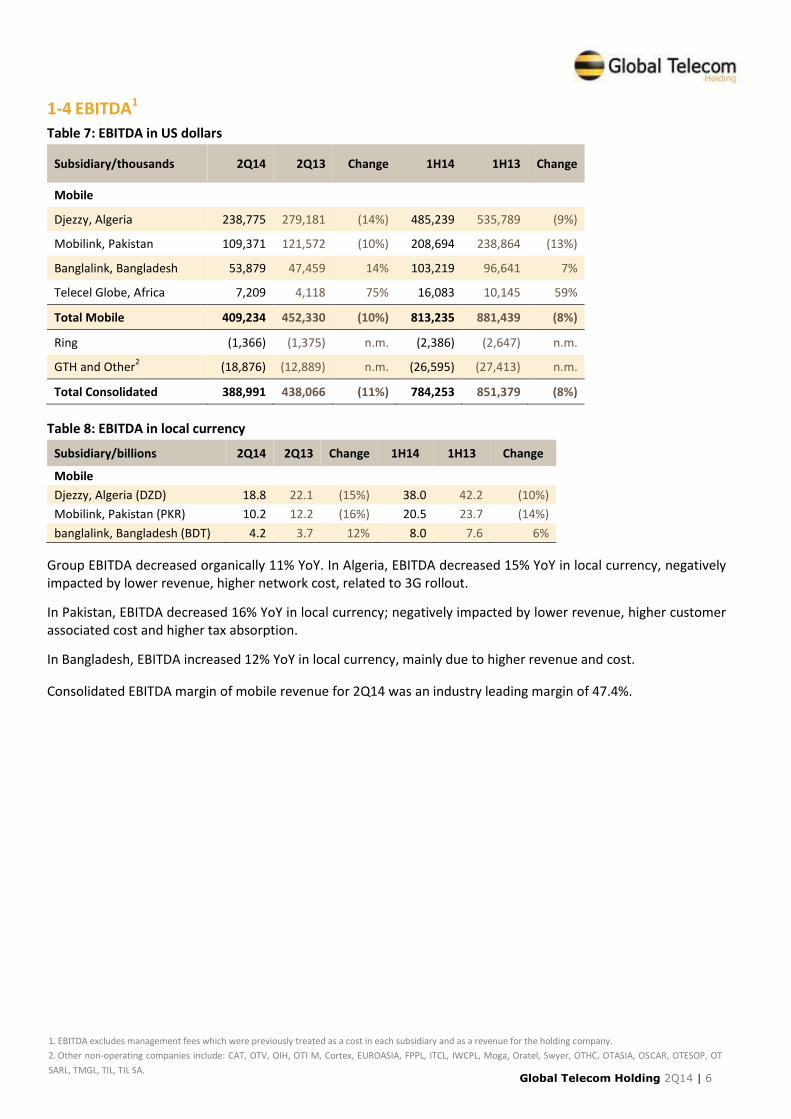
Group EBITDA decreased organically 11% YoY. In Algeria, EBITDA decreased 15% YoY in local currency, negatively impacted by lower revenue, higher network cost, related to 3G rollout.
In Pakistan, EBITDA decreased 16% YoY in local currency; negatively impacted by lower revenue, higher customer associated cost and higher tax absorption.
In Bangladesh, EBITDA increased 12% YoY in local currency, mainly due to higher revenue and cost.
Consolidated EBITDA margin of mobile revenue for 2Q14 was an industry leading margin of 47.4%.
1. EBITDA excludes management fees which were previously treated as a cost in each subsidiary and as a revenue for the holding company.
2. Other non-operating companies include: CAT, OTV, OIH, OTI M, Cortex, EUROASIA, FPPL, ITCL, IWCPL, Moga, Oratel, Swyer, OTHC, OTASIA, OSCAR, OTESOP, OT
SARL, TMGL, TIL, TIL SA.

Global Telecom Holding 2Q14 | 7
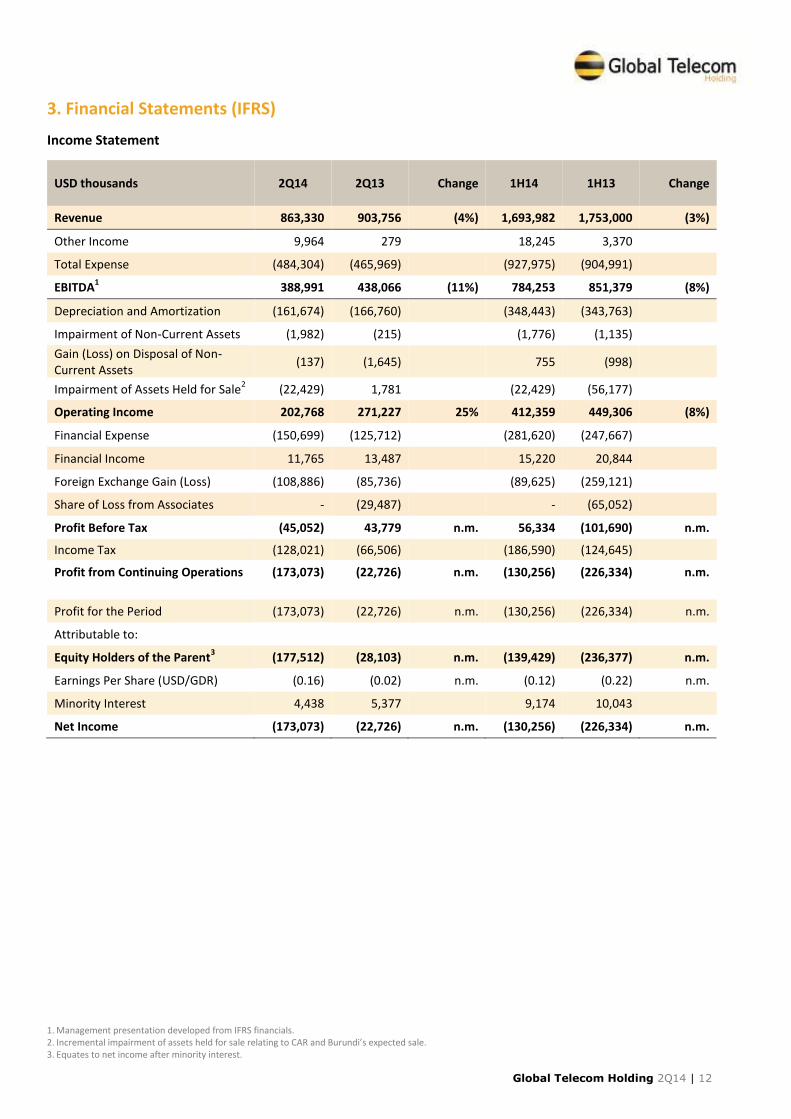
1-5 Net Income Net loss attributable to Equity Holders of the Parent amounted to USD 177 million, which was negatively impacted by financial expenses of USD 151 million, foreign exchange losses of USD 109 million and impairment of assets held for sale by USD 22 million. EPS for the three months ended June 30, 2014 amounted to USD (0.16)/GDR.
1-6 CAPEX1 Table 9: CAPEX in US dollars
Subsidiary/thousands 2Q14 2Q13 Change 1H14 1H13 Change
Djezzy, Algeria 162,092 17,420 830% 222,454 36,530 509%
Mobilink, Pakistan 109,603 38,664 183% 164,547 47,992 243%
Banglalink, Bangladesh 42,786 12,513 242% 69,439 24,616 182%
Telecel Globe 929 379 145% 1,745 800 118%
Total 315,411 68,976 357% 458,185 109,938 317%
Total CAPEX/Revenue 36.5% 7.6% 28.9pp 27.0% 6.3% 20.7pp
Total CAPEX for the quarter increased 357% YoY to USD 315 million. In Algeria, CAPEX increased 830% YoY mainly due to the investments in the high-speed 3G network. In Pakistan, CAPEX increased 183% YoY due to the network modernization project and 3G rollout. The network modernization project is delayed due to congestions in some of the already modernized areas due to a higher than forecasted traffic and is expected to be completed in 1Q15, to prioritize additional capacity deployment. In Bangladesh, CAPEX increased 242% YoY driven by the 3G rollout investments.
1-7 Cash and Debt Net debt increased 12% for the second quarter of 2014 to reach USD 2.6 billion in comparison to USD 2.3 billion as at December 31, 2013, leading to an increase in Net Debt/EBITDA2 to 1.6x as of June 30, 2014.
1. CAPEX excludes license fees.
2. Net Debt/EBITDA is calculated for the annualized figures for the six month ending June 30, 2014.

Global Telecom Holding 2Q14 | 8
2. GTH Operations
The Group operates in seven countries with favourable dynamics in Africa, Asia and North America. It is worth highlighting that GTH serves a population of 466 million people.
PAKISTAN Population: 196.2 million GDP Growth: 3.6% GDP/Capita PPP: USD 3,100 Pop. Under 15 years: 33%
BANGLADESH Population: 166.3 million GDP Growth: 5.8% GDP/Capita PPP: USD 2,100 Pop. Under 15 years: 32%
BURUNDI Population: 10.4 million GDP Growth: 4.5% GDP/Capita PPP: USD 600 Pop. Under 15 years: 46%
CENTRAL AFRICA REPUBLIC Population: 5.3 million GDP Growth: (14%) GDP/Capita PPP: USD 700 Pop. Under 15 years: 41%
ALGERIA Population: 38.8 million GDP Growth: 3.1% GDP/Capita PPP: USD 7,500 Pop. Under 15 years: 28%
CANADA Population: 34.8 million GDP Growth: 1.6% GDP/Capita PPP: USD 43,100 Pop. Under 15 years: 15%
ZIMBABWE Population: 13.8 million GDP Growth: 3.2% GDP/Capita PPP: USD 600 Pop. Under 15 years: 38%
Operations owned by Global Telecom (GTH has 65% indirect equity ownership in Globalive Canada but a minority voting stake)
Figures from CIA factbook.

Global Telecom Holding 2Q14 | 9
2-1 Djezzy, Algeria
Table 10: Djezzy key indicators
Financial data 2Q14 2Q13 Change
Operational data 2Q14 2Q13 Change
Revenue (USD 000) 437,117 464,157 (6%)
Customers (000)3 17,502 16,828 4%
Revenue (DZD bn) 34.5 36.7 (6%)
Market Share1&3
49.4% 52.5% (3.1pp)
EBITDA (USD 000) 238,775 279,181 (14%)
ARPU (USD)2&3
8.3 9.2 (10%)
EBITDA (DZD bn) 18.8 22.1 (15%)
ARPU (DZD)2&3
648 727 (11%)
EBITDA Margin 54.5% 60.1% (5.6pp)
MOU2&3
202 278 (27%) Capex (USD 000) 162,092 17,420 830%
Churn
2&3 6.1% 6.9% (0.8pp)
Orascom Telecom Algérie SpA (“OTA” or “the company”) operates a mobile network in Algeria and provides a
range of prepaid and postpaid products encompassing voice, data and multimedia, using the corporate brand
“Orascom Telecom Algerie” and the dual commercial brand of “Djezzy” and “Allo”. OTA is focusing on maintaining
value through key strategic pillars. These strategic pillars are oriented towards value segmentation, distribution
control, operational excellence, new revenue streams and assets monetization, control of regulatory risks, and
finally retaining key staff members as well as introducing new talent development programs.
During 2Q14, OTA launched several promotions targeting key customers’ segment. Djezzy launched attractive 2G
promotions including Ramadan B2C promotion launch (Djezzy Carte, Allo, Djezzy Control and Djezzy Classic),
Machine to Machine (M2M) solution, Liberty SMS offer (100 SMS for DZD 50 subscription per bundle), roaming
promotion special during the World Cup, Omra Ramadan promotion, special VAS animation Ramadan and World
Cup (RBT and Scoop).
On July 5, 2014, Djezzy launched 3G services in seven provinces including the largest four provinces in terms of
population. On July 7, 2014, the telecom regulator (“ARPT”) issued a regulation allowing for one number (mono-
numbering) for 2G and 3G, which is more convenient for customers; based on this Djezzy’s 2G customers can use
their SIM cards with their old number for 3G after signing a new contract. In July 2014, Djezzy launched a number
of commercial offers including Millennium 3G (a hybrid voice and data product), data dongle promotions, as well
as B2B and B2C offers.
OTA’s customer market share decreased to 49.4%, negatively impacted by strong competition following 3G launch
by peers in January 2014. Djezzy expects to stabilize its market-leading position in 2H14 now that it has launched
3G successfully.
OTA’s revenue decreased 6% YoY in local currency; as a result of lower interconnect revenue and the impact of
competitors launching 3G in January 2014 ahead of the Company’s 3G launch. Djezzy grew its mobile customer
base 4% YoY to 17.5 million. EBITDA decreased 15% YoY in local currency, negatively impacted by higher network,
related to the 3G rollout. CAPEX surged YoY mainly due to the investments in the high-speed 3G network.
1. Market share is calculated according to our data warehouse.
2. Figures for three month period.
3. As announced on July 1 2013, during an internal investigation with regards to Djezzy’s active customers, management found a technical bug that overstated
Djezzy’s customer base by 1.4 million. The customers’ base comparative figures for 2Q13 were adjusted accordingly. This event does not impact historical reported
revenue or EBITDA, but positively affect MOU and ARPU.

Global Telecom Holding 2Q14 | 10
2-2 Mobilink, Pakistan
Table 11: Mobilink key indicators
Financial data 2Q14 2Q13 Change
Operational data 2Q14 2Q13 Change
Revenue (USD 000) 261,377 289,460 (10%)
Customers (000) 38,768 37,122 4%
Revenue (PKR bn) 26.3 28.6 (8%)
Market Share1 27.6% 29.4% (1.8pp)
EBITDA (USD 000) 109,371 121,572 (10%)
ARPU (USD)2 2.1 2.5 (16%)
EBITDA (PKR bn) 10.2 12.2 (16%)
ARPU (PKR)2 214 249 (14%)
EBITDA Margin 38.9% 42.8% (3.9pp)
MOU2 230 233 (1%)
Capex (USD 000) 109,603 38,664 183% Churn2 6.4% 5.3% 1.1pp
Pakistan Mobile Company Limited (“PMCL”) operates under the brand “Mobilink” and has established itself as a
market leader amongst Pakistan’s Mobile network operators, providing prepaid and postpaid voice and data
services to individuals and corporate clients across Pakistan. Mobilink is focused on retaining and strengthening
its market share to achieve revenue growth, whilst continuing to reduce operational costs.
On July 18, 2014, Mobilink launched 3G services in eleven Pakistani cities. The operator had begun offering 3G
services on a free trial basis promptly after receiving its license in May 2014. 3G services are live for prepaid
customers, while post-paid customers are still running the free trial. To maintain its market leadership, Mobilink
retained its focus on subscriber engagement. An attractive dormant revival campaign was launched offering
upfront and recurring incentive; which led to improved reactivations. To further improve customer experience, a
new Above The Line (“ATL”) thematic was launched. The campaign was supported by voice and hybrid bundles at
competitive prices. Launch of pull based free usage summary notification, free end-of-call notification service for
new subscribers and conversion of multiple value added services to non-recursive charging cycle were some of
the steps taken to support complete charging transparency for users.
Mobilink’s revenue decreased 8% YoY in local currency, affected by strong competition from attractive bundles on
the back of increased network capacity by competitors as well as unfavourable macro-economic situation.
Mobilink’s mobile customer base increased 4% YoY to 38.8 million, supported by the introduction of an attractive
tariff plan for new customers and a competitive reactivation campaign. MFS witnessed strong growth driven by
multiple initiatives including continuation of sales channel engagement promotions, introduction of dedicated
MFS agents and launch of an (“ATL”) consumer promotion. EBITDA decreased 16% YoY, negatively impacted by
higher customer associated cost and higher tax absorption. CAPEX increased 183% YoY due to the network
modernization project and the 3G rollout. The network modernization project is delayed due to congestions in
some of the already modernized areas due to a higher than forecasted traffic and is expected to be completed in
1Q15, to prioritize additional capacity deployment.
1. Market share, as announced by the Regulator in Pakistan is based on information disclosed by the other operators which use different customer recognition
policies. The above figure reflects market share as of May 31, 2014.
2. Figures for three month period.

Global Telecom Holding 2Q14 | 11
2-3 banglalink, Bangladesh
Table 12: banglalink key indicators
Financial data 2Q14 2Q13 Change
Operational data 2Q14 2Q13 Change
Revenue (USD 000) 141,062 128,929 9%
Customers (000) 29,751 20,076 10%
Revenue (BDT bn) 10.9 10.1 8%
Market Share1 25.5% 25.7% (0.2pp)
EBITDA (USD 000) 53,879 47,459 14%
ARPU (USD)2 1.6 1.6 (3%)
EBITDA (BDT bn) 4.2 3.7 12%
ARPU (BDT)2 121 126 (4%)
EBITDA Margin 38.2% 37.2% (1.0pp)
MOU2 201 198 (2%)
Capex (USD 000) 42,786 12,513 242%
Churn2 5.2% 3.9% 1.3pp
Banglalink Digital Communications Limited (“BDCL”) provides its services under two brand names: “banglalink”
and “Icon”. BDCL’s marketing strategy is oriented towards targeting different consumer segments with tailored
products and services to cater for the needs of these segments.
On the regulatory front, the prices of new and reactivation SIMs were revised in June 2014. New SIM prices were
increased from BDT 180 to BDT 200 and the replacement SIM tax is being passed on to customers. The
governmental budget includes a SIM tax of BDT 300 for new customers (unchanged) and it introduced a SIM tax
for replacement SIM of BDT 100. Operators requested the withdrawal of the 10% customs duty along with the
proposed 15% VAT on mobile handset imports, which effectively represents 31.5% of taxes on imported mobile
devices. On June 28, 2014, the government imposed 1% surcharge on the price of imported and locally
manufactured mobile devices.
banglalink continued to focus on improving its 2G network coverage, expanding its 3G footprint with more than
2,100 3G sites in 62 districts out of 64 and delivering the best value for its customers. To attract new customers
and increase usage, start-up offers were revised with an attractive tariff upon recharge, which includes
unconditional data, voice and SMS, which helps to create loyalty and usage behaviour of customers. Various
campaigns such as bonus on recharge offers were introduced to drive revenue. banglalink introduced bundle
gifting service, enabling customers to gift bundle products to others such as friends and family.
During 2Q14, banglalink continued to focus on the mobile data market by offering different 3G offers to attract
more customers and increase usage in the current growing and competitive 3G data market. The offers include
new attractive 3G data packages, 3G handsets with bundle and a gratification campaign on the occasion of the
FIFA World Cup 2014.
banglalink’s revenue increased 8% YoY in local currency, was driven by higher voice, interconnection and VAS
revenue, mostly due growth in customers base which increased 10% YoY to 29.8 million, driven by revised start-
up offers with an attractive tariff upon recharge, including data, voice and SMS, in addition to various campaigns
such as bonus on recharge offers and bundle gifting service. EBITDA increased 12% YoY, mainly due to higher
revenue and cost savings. CAPEX increased 242% YoY driven by the 3G rollout investments.
On July 17, 2014, Moody's Investors Service assigned a definitive B1 corporate family rating to Banglalink Digital
Communications Limited and a B1 senior unsecured rating to its USD 300 million, five-year senior notes due in
2019. The ratings outlook is stable.
1. Market share, as announced by the Regulator in Bangladesh is based on information disclosed by the other operators which use different customer recognition
policies. The above figure reflects market share as of June 30, 2014. 2. Figures for three month period.
Global Telecom Holding 2Q14 | 12
1. Management presentation developed from IFRS financials. 2. Incremental impairment of assets held for sale relating to CAR and Burundi’s expected sale. 3. Equates to net income after minority interest.
3. Financial Statements (IFRS)
Income Statement
USD thousands 2Q14 2Q13 Change 1H14 1H13 Change
Revenue 863,330 903,756 (4%) 1,693,982 1,753,000 (3%)
Other Income 9,964 279
18,245 3,370
Total Expense (484,304) (465,969)
(927,975) (904,991)
EBITDA1 388,991 438,066 (11%) 784,253 851,379 (8%)
Depreciation and Amortization (161,674) (166,760) (348,443) (343,763)
Impairment of Non-Current Assets (1,982) (215) (1,776) (1,135)
Gain (Loss) on Disposal of Non-Current Assets
(137) (1,645) 755 (998)
Impairment of Assets Held for Sale2 (22,429) 1,781 (22,429) (56,177)
Operating Income 202,768 271,227 25% 412,359 449,306 (8%)
Financial Expense (150,699) (125,712)
(281,620) (247,667)
Financial Income 11,765 13,487 15,220 20,844
Foreign Exchange Gain (Loss) (108,886) (85,736) (89,625) (259,121)
Share of Loss from Associates - (29,487) - (65,052)
Profit Before Tax (45,052) 43,779 n.m. 56,334 (101,690) n.m.
Income Tax (128,021) (66,506)
(186,590) (124,645)
Profit from Continuing Operations (173,073) (22,726) n.m. (130,256) (226,334) n.m.
Profit for the Period (173,073) (22,726) n.m. (130,256) (226,334) n.m.
Attributable to:
Equity Holders of the Parent3 (177,512) (28,103) n.m. (139,429) (236,377) n.m.
Earnings Per Share (USD/GDR) (0.16) (0.02) n.m. (0.12) (0.22) n.m.
Minority Interest 4,438 5,377 9,174 10,043
Net Income (173,073) (22,726) n.m. (130,256) (226,334) n.m.

Global Telecom Holding 2Q14 | 13
1. The equity caption in 2013 balance sheet has been adjusted to reflect the impact of post balance sheet events, a one-off charge of USD 2 billion, as per the Share Purchase Agreement signed by VimpelCom and GTH with FNI, which oblige GTH upon completion to discontinue legal dispute with respect to the tax receivable and account for the fines imposed by the Algerian Treasury.
2. Net Debt is calculated as a sum of short term debt, long term debt, less cash and cash equivalents.
Balance Sheet
USD thousands 30 June
2014 31 December
20131
Assets
Property and Equipment (net) 2,244,686 2,043,998
Intangible Assets 1,671,534 1,425,596
Other Non-Current Assets 91,802 88,190
Total Non-Current Assets 4,008,022 3,557,784
Cash and Cash Equivalents 2,844,103 2,838,448
Trade Receivables 226,940 225,641
Assets Held for Sale 164,259 170,380
Other Current Assets 582,903 646,539
Total Current Assets 3,818,205 3,881,008
Total Assets 7,826,227 7,438,792
Equity Attributable to Equity Holders of the Company (1,145,246) (1,114,848)
Minority Share 46,998 38,344
Total Equity (1,098,248) (1,076,504)
Liabilities
Long Term Debt 635,749 150,904
Other Non-Current Liabilities 490,364 392,461
Total Non-Current Liabilities 1,126,113 543,365
Short Term Debt 4,824,453 5,033,197
Trade Payables 941,787 814,668
Other Current Liabilities 2,032,122 2,124,066
Total Current Liabilities 7,798,362 7,971,931
Total Liabilities 8,924,475 8,515,296
Total Liabilities and Shareholder’s Equity 7,826,227 7,438,792
Net Debt2
2,616,099 2,345,653

Global Telecom Holding 2Q14 | 14
Cash Flow Statement
USD thousands 30 June
2014 30 June
2013
Cash Flows from Operating Activities Profit (Loss) for the Period (130,256) (226,334) Depreciation, Amortization and Impairment of Non-Current Assets
350,219 344,898
Income Tax Expense 186,590 124,645 Net Financial Charges 356,025 485,944 Share of Loss (Profit) of Associates - 65,052 Impairment of Financial Assets 22,429 56,177 Other 10,002 (51,584) Changes in Assets Carried as Working Capital (230,822) (85,884) Changes in Other Liabilities Carried as Working Capital 27,028 30,607 Income Tax Paid (186,532) (187,491) Interest Expense Paid (39,332) (60,371)
Net Cash Generated by Operating Activities 365,351 495,659
Cash Flows from Investing Activities Cash Outflow for Investments in Property and Equipment, Intangible Assets, and Financial Assets and Consolidated Subsidiaries
(664,078) (159,472)
Proceeds from Disposal of Property and Equipment, Subsidiaries and Financial Assets
7,525 59,335
Dividends and Interest Received 6,751 4,328
Net Cash Used in Investing Activities (649,802) (95,809)
Cash Flows from Financing Activities Proceeds from loans, banks' facilities and bonds 1,500,560 461,054 Payments for loans, banks' facilities and bonds (1,185,125) (478,459) Net Payments from financial liabilities (3,714) (1,067) Net Change in Cash Collateral 351 -
Net Cash generated by Financing Activities 312,072 (18,472)
Net Increase in Cash and Cash Equivalents 27,621 381,378
Cash included in Assets Held for Sale 2,034 (17,368) Effect of Exchange Rate Changes on Cash and Cash Equivalents (23,936) (34,820) Cash and Cash Equivalents at the Beginning of the Period 2,838,432 2,025,773
Cash and Cash Equivalents at the End of the Period 2,844,151 2,354,963

Global Telecom Holding 2Q14 | 15
4. Appendix Foreign Exchange rates applied to the Financial Statements
Change3
Change3
Currency June 2013 March 2014
June 2014 June 2014
vs June 2014
vs
June 2013 Mar 2014
Egyptian Pound/USD
Income Statement1
6.8166 9.6613 7.0177 3% 2%
Balance Sheet2
7.0161 9.6901 7.1519 2% 3%
Algerian Dinar/USD
Income Statement1
78.8997 78.0133 78.4834 (1%) 1%
Balance Sheet2
80.2018 78.5396 79.2508 (1%) 1%
Pakistan Rupee/USD
Income Statement1
98.1946 103.5477 100.8990 3% (3%)
Balance Sheet2
99.6000 98.1850 98.7235 (1%) 1%
Bangladeshi Taka/USD
Income Statement1
78.4623 77.6683 77.6181 (1%) -
Balance Sheet2
77.7550 77.6000 77.6000 - -
Canadian Dollar/USD
Income Statement1 1.0156 1.1028 1.0965 8% (1%)
Balance Sheet2
1.0519 1.1050 1.0671 1% (3%)
1. Represents the average monthly exchange rate from the start of the year until the end of the period. 2. Represents the spot exchange rate at the end of the period. 3. Appreciation /Depreciation of US dollars in comparison to local currency.

Global Telecom Holding 2Q14 | 16
Ownership structure and consolidation methods
Subsidiary Ownership
June 30 Consolidation Method
June 30
2013 2014 2013 2014
Mobile Operations
International Wireless Communications Pakistan Limited
100.00% 100.00% Full Consolidation Full Consolidation
Orascom Telecom Algerie SPA1
96.81% 96.81% Full Consolidation Full Consolidation
Telecel Centrafrique SA 100.00% 100.00% Full Consolidation Full Consolidation
Telecel Globe Limited 100.00% 100.00% Full Consolidation Full Consolidation
Telecom Ventures Limited2
100.00% 100.00% Full Consolidation Full Consolidation
Non-Mobile Operations
Ring Distribution SAE 99.00% 99.00% Full Consolidation Full Consolidation
Telecom CS Limited 100.00% 100.00% Full Consolidation Full Consolidation
Telecom ESOP Limited 100.00% 100.00% Full Consolidation Full Consolidation
Moga Holding Limited 100.00% 100.00% Full Consolidation Full Consolidation
Oratel International Inc. Limited 100.00% 100.00% Full Consolidation Full Consolidation
Consortium Algerien de Telecommunications SPA
3 50.00% 50.00% Proportionate Consolidation
Equity Consolidation
Global Telecom Holding 100.00% 100.00% Full Consolidation Full Consolidation
Financial Powers Plan Limited 100.00% 100.00% Full Consolidation Full Consolidation
Iraq Holding Limited4
100.00% 100.00% Full Consolidation Full Consolidation
Global Telecom Finance SCA 100.00% 100.00% Full Consolidation Full Consolidation
Telecom Holding Canada (Malta) Limited
5 100.00% 100.00% Full Consolidation Full Consolidation
International Telecommunications Consortium Limited
50.00% 50.00% Proportionate Consolidation
Equity Consolidation
Sawyer Limited 100.00% 100.00% Full Consolidation Full Consolidation
Global Telecom Oscar SA 100.00% 100.00% Full Consolidation Full Consolidation
Telecom Management Group Limited 100.00% 100.00% Full Consolidation Full Consolidation
Global Telecom One S.à.r.l 100.00% 100.00% Full Consolidation Full Consolidation
Waseela Microfinance Bank Limited 100.00% 100.00% Full Consolidation Full Consolidation
Cortex for Services & Consultations SAE
100.00% 100.00% Full Consolidation Full Consolidation
1. Direct and Indirect stake through Moga Holding Limited and Oratel. 2. Telecom Ventures Limited owns 100% of Sheba Telecom which operates under the trade name banglalink. 3. Direct and indirect stake through International Telecommunications Consortium Limited. 4. Iraq Holding Limited owns 100% of Orascom Telecom Iraq, which sold Iraqna in December 2007. 5. The holding company for GTH’s Share in Globalive, which has been accounted for under the equity method.

Global Telecom Holding 2Q14 | 17
Glossary of Terms
Average Revenue per User (“ARPU”): Average monthly recurrent revenue per customer (excluding visitors roaming revenue and connection fee). This includes airtime revenue (national and international), as well as, monthly subscription fee, SMS, GPRS & data revenue. Quarterly ARPU is calculated as an average of the last three months.
Capital Expenditure (“CAPEX”): Tangible and Intangible fixed assets additions during the reporting period, includes work in progress, network, IT, and other tangible and intangible fixed assets additions but excludes license fees.
Churn: Disconnection rate. This is calculated as the number of disconnections during a month divided by the average customer base for that month.
Churn Rule: A customer is considered churned (removed from the customer base) if he exceeds the 90 days from the end of the validity period without recharging. It is worth noting that the validity period is a function of the scratch denomination. In cases where scratch cards have open validity, the customer is considered churned in case he has not made a single billable event in the last 90 days (i.e. outgoing or incoming call or sms, wap session). Open cards validity is applied for OTA, Mobilink and banglalink so far.
Minutes of Usage (“MOU”): Average airtime minutes per customer per month. This includes billable national and international outgoing traffic originated by customers (on-net, to land line & to other operators). Also, this includes incoming traffic to customers from landline or other operators.
GTH’s Market Share Calculation Method: The market share is calculated through the data warehouse of GTH’s subsidiaries. The number of SIM cards of competitors that appeared in the call detail record of each of GTH’s subsidiaries is collected. This reflects the number of customers of the competition. However, GTH deducts the number of SIM cards that did not appear in the call detail records for the last 90 days to account for churn. The same is applied to GTH subsidiaries. This method is used to calculate the market shares of Djezzy. In Pakistan and Bangladesh, market share as announced by the Regulators is based on disclosed information by the other operators which may use different customer recognition policy.
Organic Growth for Revenue and EBITDA: Are non-IFRS financial measures that reflect changes in Revenue and EBITDA excluding foreign currency movements and other factors, such as business under liquidation, disposals, mergers and acquisitions. We believe readers of this earnings release should consider these measures as it is more indicative of the Group’s ongoing performance. Management uses these measures to evaluate the Group’s operational results and trends.
Contact Information Investor Relations Mamdouh Abdel Wahab Head of Investor Relations Email: [email protected] Tel: +202 2461 5120 Fax: +202 2461 5055 Website: www.gtelecom.com
Disclaimer This presentation contains statements that could be construed as forward looking. These statements appear in a number of places in this presentation and include statements regarding the intent, belief or current expectations of the customer base, estimates regarding future growth in the different business lines and the global business, market share, financial results and other aspects of the activity and situation relating to the company. Such forward looking statements are no guarantees of future performance and involve risks and uncertainties, and actual results may differ materially from those in the forward looking statements as a result of various factors. You are cautioned not to place undue reliance on those forward looking statements, which speak only as of the date of this presentation, which is not intended to reflect Global Telecom Holding’s business or acquisition strategy or the occurrence of unanticipated events.