Second Quarter 2012 Earnings Call Supplemental Materials
30
July 17, 2012 Second Quarter 2012 Earnings Call Supplemental Materials
Transcript of Second Quarter 2012 Earnings Call Supplemental Materials

July 17, 2012
Second Quarter 2012
Earnings Call
Supplemental Materials

Agenda
2
Topic Speaker
Second Quarter 2012 Highlights Frank Martire, Chairman and CEO
Operations Review Gary Norcross President and Chief Operating Officer
Financial Summary Mike Hayford Chief Financial Officer
Q & A Martire, Norcross and Hayford
Forward Looking Statements This presentation and today’s conference call contain “forward-looking statements” within the meaning of the U.S. federal securities laws. Statements that are not historical facts, including statements about revenue, organic revenue, earnings before interest, taxes, depreciation and amortization (“EBITDA”), earnings per share and margin expansion, as well as other statements about our expectations, hopes, intentions, or strategies regarding the future, are forward-looking statements. These statements relate to future events and our future results, and involve a number of risks and uncertainties. Forward-looking statements are based on management’s beliefs, as well as assumptions made by, and information currently available to, management. Any statements that refer to beliefs, expectations, projections or other characterizations of future events or circumstances and other statements that are not historical facts are forward-looking statements.
Actual results, performance or achievement could differ materially from those contained in these forward-looking statements. The risks and uncertainties that forward-looking statements are subject to include without limitation: changes and conditions in general economic, business and political conditions, including the possibility of intensified international hostilities, acts of terrorism, and changes and conditions in either or both the United States and international lending, capital and financial markets; the effect of legislative initiatives or proposals, statutory changes, governmental or other applicable regulations and/or changes in industry requirements, including privacy regulations; the adequacy of our cash flow and earnings and other conditions which may affect our ability to pay our quarterly dividend at the planned level; the effects of our leverage which may limit the funds available to make acquisitions and invest in our business, pay dividends and repurchase shares; the risks of reduction in revenue from the elimination of existing and potential customers due to consolidation in or new laws or regulations affecting the banking, retail and financial services industries or due to financial failures or other setbacks suffered by firms in those industries; changes in the growth rates of the markets for core processing, card issuer, and transaction processing services; failures to adapt our services and products to changes in technology or in the marketplace; internal or external security breaches of our systems, including those relating to the theft of personal information and computer viruses affecting our software or platforms, and the reactions of customers, card associations and others to any such future events; the reaction of our current and potential customers to the regulatory letter we received about information security and to any future communications about such topics from our regulators; the failure to achieve some or all of the benefits that we expect from acquisitions; our potential inability to find suitable acquisition candidates or finance such acquisitions, which depends upon the availability of adequate cash reserves from operations or of acceptable financing terms and the variability of our stock price, or difficulties in integrating past and future acquired technology or business’ operations, services, clients and personnel; competitive pressures on product pricing and services including the ability to attract new, or retain existing, customers; completion of the sale of our healthcare business and reinvestment of the net proceeds; an operational or natural disaster at one of our major operations centers; and other risks detailed in “Risk Factors” and other sections of the Company’s Annual Report on Form 10-K for the fiscal year ended December 31, 2011 and other filings with the SEC.
Other unknown or unpredictable factors also could have a material adverse effect on our business, financial condition, results of operations and prospects. Accordingly, readers should not place undue reliance on these forward-looking statements. These forward-looking statements are inherently subject to uncertainties, risks and changes in circumstances that are difficult to predict. Except as required by applicable law or regulation, we do not undertake (and expressly disclaim) any obligation and do not intend to publicly update or review any of these forward-looking statements, whether as a result of new information, future events or otherwise.
3
Use of Non-GAAP Measures
Generally Accepted Accounting Principles (GAAP) is the term used to refer to the standard framework of guidelines for financial accounting. GAAP includes the standards, conventions, and rules accountants follow in recording and summarizing transactions and in the preparation of financial statements. In addition to reporting financial results in accordance with GAAP, the company has provided non-GAAP financial measures, which it believes are useful to help investors better understand its financial performance, competitive position and prospects for the future. These non-GAAP measures include:
• Organic revenue
• Adjusted earnings before interest, taxes, depreciation and amortization (EBITDA)
• Adjusted net earnings
• Free cash flow These non-GAAP measures should be considered in context with the GAAP financial presentation and should not be considered in isolation or as a substitute for GAAP financial measures. Further, FIS’ non-GAAP measures may be calculated differently from similarly titled measures of other companies. Additional information about these non-GAAP measures is provided in the appendix to this presentation. Reconciliations to the related GAAP measures are provided in the Investor Relations section of the FIS Web site, www.fisglobal.com.
4

Frank Martire
Chairman and CEO
Second Quarter
2012 Highlights
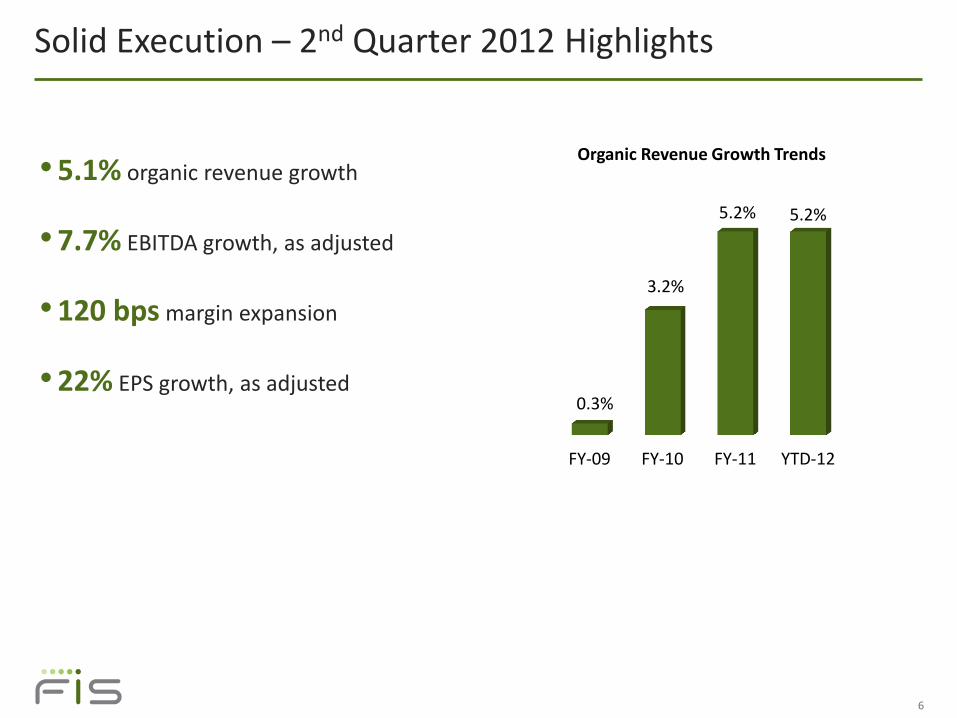
Solid Execution – 2nd Quarter 2012 Highlights
•5.1% organic revenue growth
•7.7% EBITDA growth, as adjusted
•120 bps margin expansion
•22% EPS growth, as adjusted
Organic Revenue Growth Trends
FY-09 FY-10 FY-11 YTD-12
0.3%
3.2%
5.2% 5.2%
6
Driving Performance
• Definitive agreement to divest healthcare business
• Maintaining strong client focus
• Investing for continued growth
• Ongoing commitment to improve information security and risk management
• Executing the strategy communicated at Investor Day
7
Gary Norcross
President and Chief Operating Officer
Operations
Review
North America
• Ongoing client engagement
• Continued demand for professional services, outsourced technology and consulting expertise
• Strength in global commercial services
9
Update on M&I Migration Plans
• FIS will retain a substantial relationship with the combined entity
• Anticipate core migration in Q4-2012
• Continue to negotiate service arrangements and terms
10
International
• Growth across all regions
• Less than one-half of one percent of consolidated revenue generated by clients in Portugal, Italy, Ireland, Greece and Spain
• Pursuing growth opportunities in emerging markets
11
Ongoing Focus on Information Security
• Ongoing investment in information security
• Continue to execute improvement plan
• Proactively engaging with regulated financial institution clients
12
Key Takeaways
• Delivering on plan to drive organic revenue growth and margin expansion
• Anticipate fourth quarter conversion of M&I accounts
• Information security and risk management are a top priority
• Remain focused on sales and driving value to clients
13

Mike Hayford
Chief Financial Officer
Financial
Summary
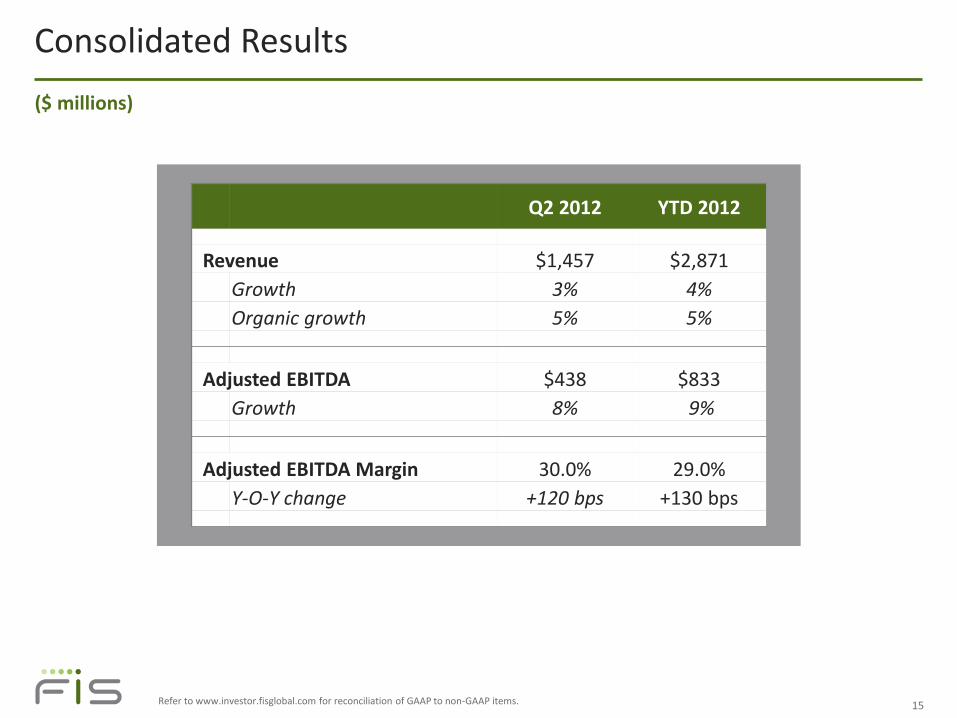
Q2 2012 YTD 2012
Revenue $1,457 $2,871
Growth 3% 4%
Organic growth 5% 5%
Adjusted EBITDA $438 $833
Growth 8% 9%
Adjusted EBITDA Margin 30.0% 29.0%
Y-O-Y change +120 bps +130 bps
Consolidated Results
15
($ millions)
Refer to www.investor.fisglobal.com for reconciliation of GAAP to non-GAAP items.
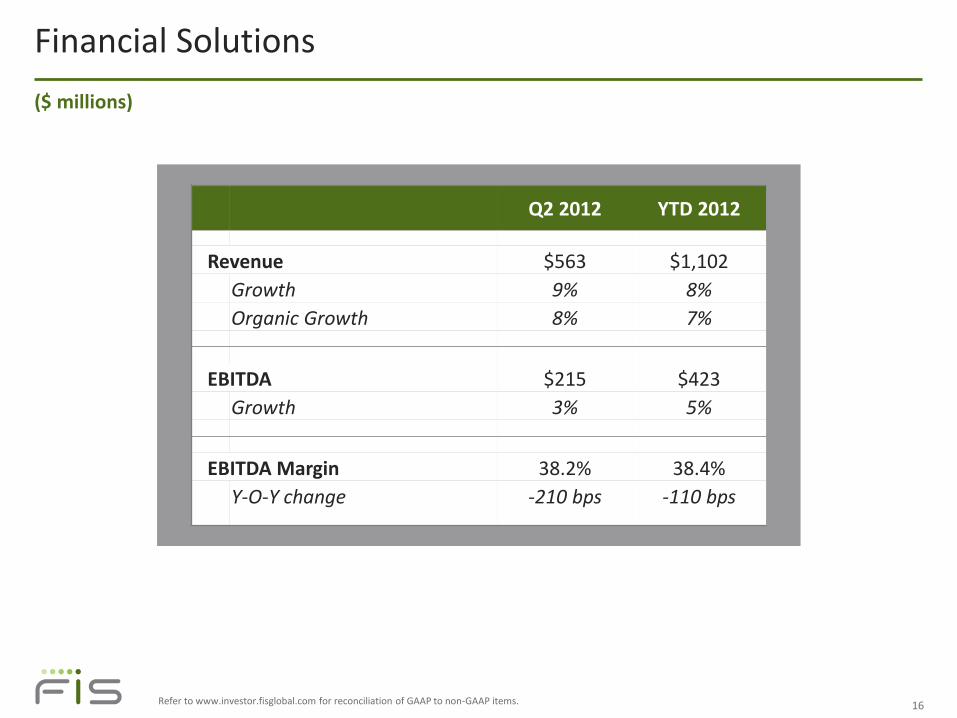
Q2 2012 YTD 2012
Revenue $563 $1,102
Growth 9% 8%
Organic Growth 8% 7%
EBITDA $215 $423
Growth 3% 5%
EBITDA Margin 38.2% 38.4%
Y-O-Y change -210 bps -110 bps
Financial Solutions
16
($ millions)
Refer to www.investor.fisglobal.com for reconciliation of GAAP to non-GAAP items.
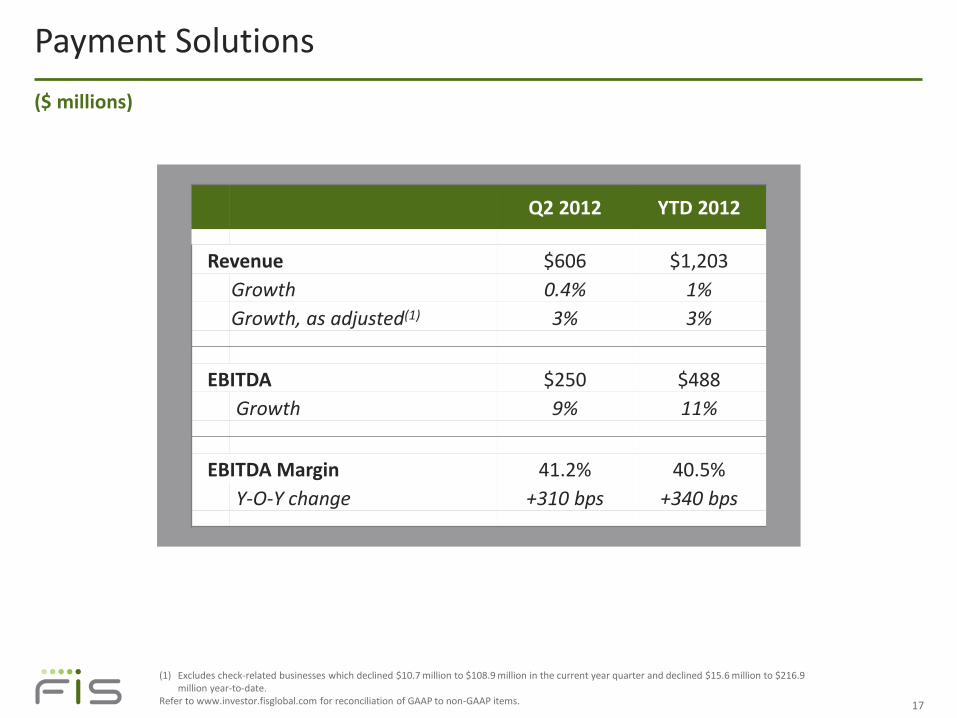
Q2 2012 YTD 2012
Revenue $606 $1,203
Growth 0.4% 1%
Growth, as adjusted(1) 3% 3%
EBITDA $250 $488
Growth 9% 11%
EBITDA Margin 41.2% 40.5%
Y-O-Y change +310 bps +340 bps
Payment Solutions
17
(1) Excludes check-related businesses which declined $10.7 million to $108.9 million in the current year quarter and declined $15.6 million to $216.9 million year-to-date.
Refer to www.investor.fisglobal.com for reconciliation of GAAP to non-GAAP items.
($ millions)
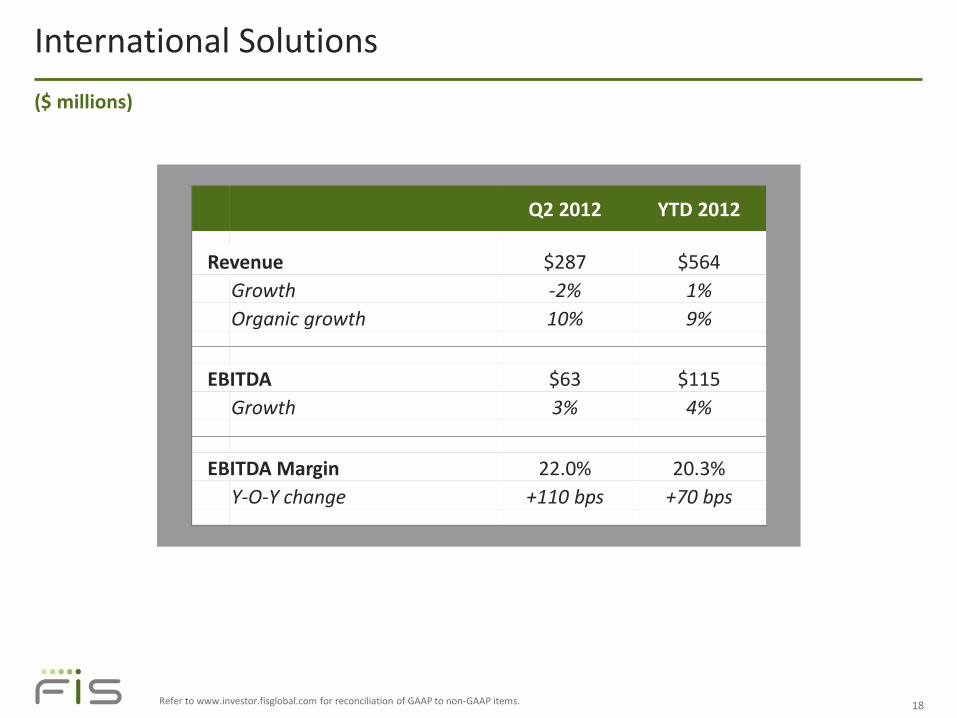
International Solutions
18
($ millions)
Q2 2012 YTD 2012
Revenue $287 $564
Growth -2% 1%
Organic growth 10% 9%
EBITDA $63 $115
Growth 3% 4%
EBITDA Margin 22.0% 20.3%
Y-O-Y change +110 bps +70 bps
Refer to www.investor.fisglobal.com for reconciliation of GAAP to non-GAAP items.
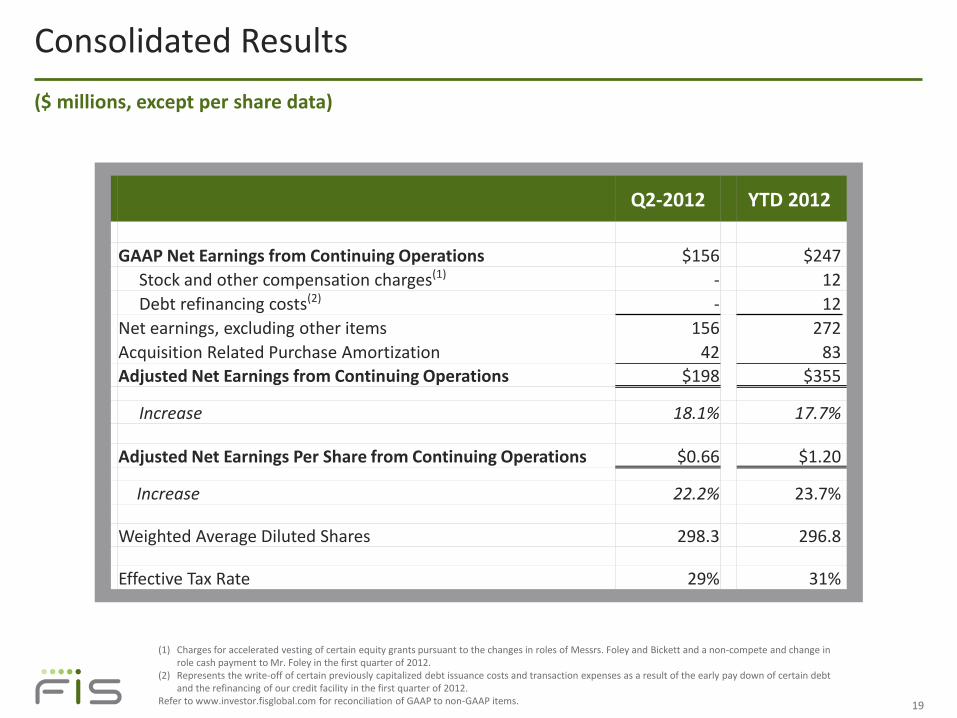
Consolidated Results
19
($ millions, except per share data)
Q2-2012 YTD 2012
GAAP Net Earnings from Continuing Operations $156 $247
Stock and other compensation charges(1) - 12
Debt refinancing costs(2) - 12
Net earnings, excluding other items 156 272
Acquisition Related Purchase Amortization 42 83
Adjusted Net Earnings from Continuing Operations $198 $355
Increase 18.1% 17.7%
Adjusted Net Earnings Per Share from Continuing Operations $0.66 $1.20
Increase 22.2% 23.7%
Weighted Average Diluted Shares 298.3 296.8
Effective Tax Rate 29% 31%
(1) Charges for accelerated vesting of certain equity grants pursuant to the changes in roles of Messrs. Foley and Bickett and a non-compete and change in role cash payment to Mr. Foley in the first quarter of 2012.
(2) Represents the write-off of certain previously capitalized debt issuance costs and transaction expenses as a result of the early pay down of certain debt and the refinancing of our credit facility in the first quarter of 2012.
Refer to www.investor.fisglobal.com for reconciliation of GAAP to non-GAAP items.
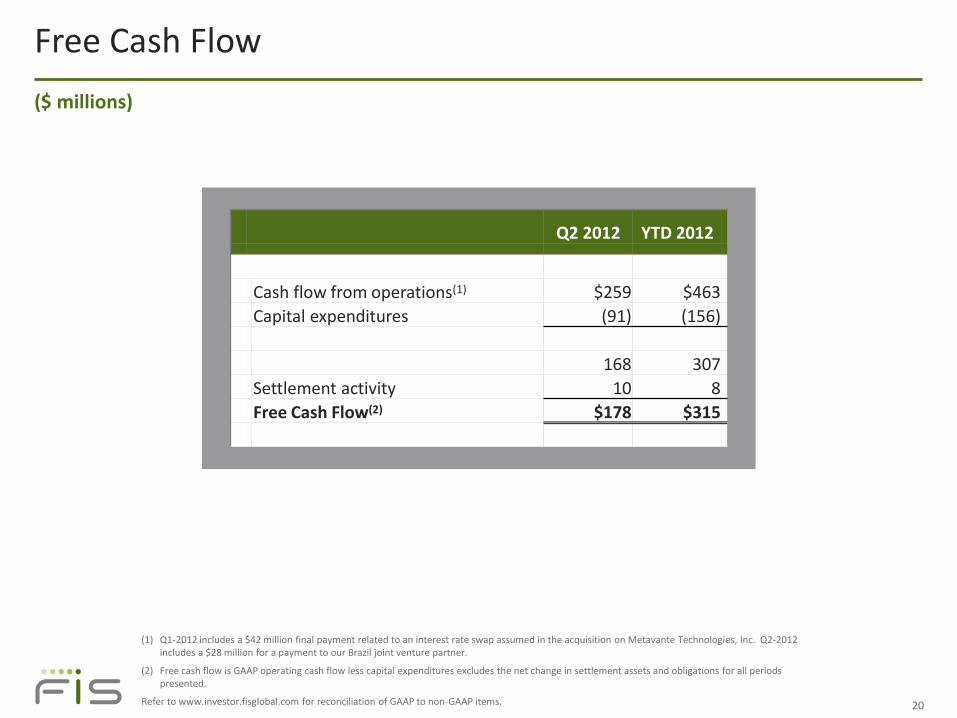
Q2 2012 YTD 2012
Cash flow from operations(1) $259 $463
Capital expenditures (91) (156)
168 307
Settlement activity 10 8
Free Cash Flow(2) $178 $315
Free Cash Flow
20
(1) Q1-2012 includes a $42 million final payment related to an interest rate swap assumed in the acquisition on Metavante Technologies, Inc. Q2-2012 includes a $28 million for a payment to our Brazil joint venture partner.
(2) Free cash flow is GAAP operating cash flow less capital expenditures excludes the net change in settlement assets and obligations for all periods presented.
Refer to www.investor.fisglobal.com for reconciliation of GAAP to non-GAAP items.
($ millions)
Executing Capital Allocation Strategy
• Investing for growth
• Focused on strengthening balance sheet
• Returning cash to shareholders
– $118 million in shareholder dividends year-to-date
– $151 million (5.2 million) shares repurchased year-to-date
• Continued focus on product acquisitions
21
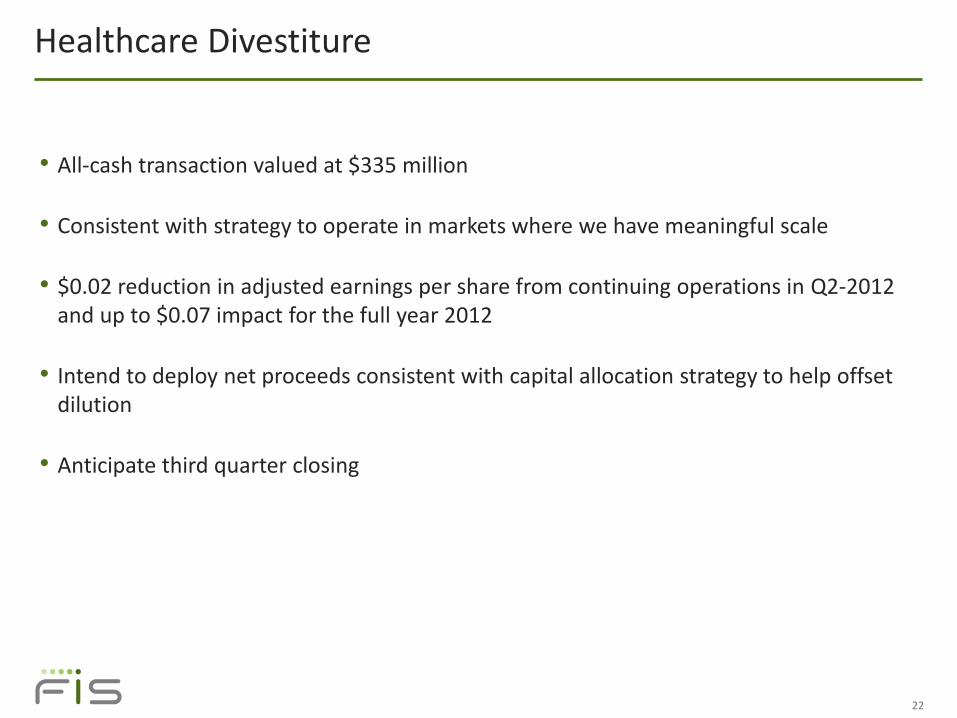
Healthcare Divestiture
• All-cash transaction valued at $335 million
• Consistent with strategy to operate in markets where we have meaningful scale
• $0.02 reduction in adjusted earnings per share from continuing operations in Q2-2012 and up to $0.07 impact for the full year 2012
• Intend to deploy net proceeds consistent with capital allocation strategy to help offset dilution
• Anticipate third quarter closing
22
23
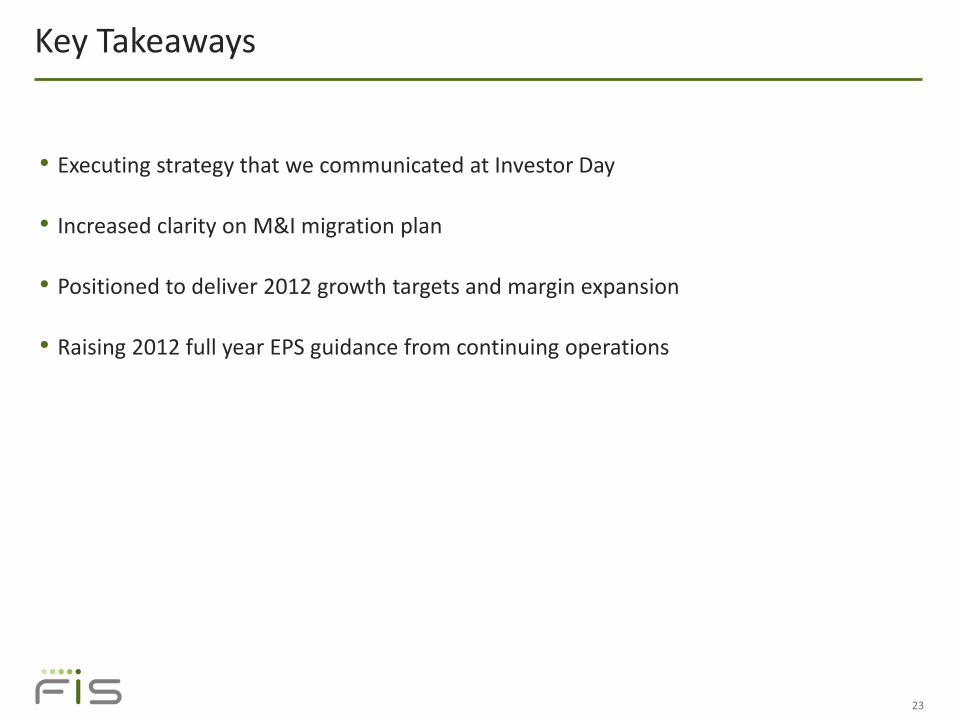
Key Takeaways
• Executing strategy that we communicated at Investor Day
• Increased clarity on M&I migration plan
• Positioned to deliver 2012 growth targets and margin expansion
• Raising 2012 full year EPS guidance from continuing operations
24
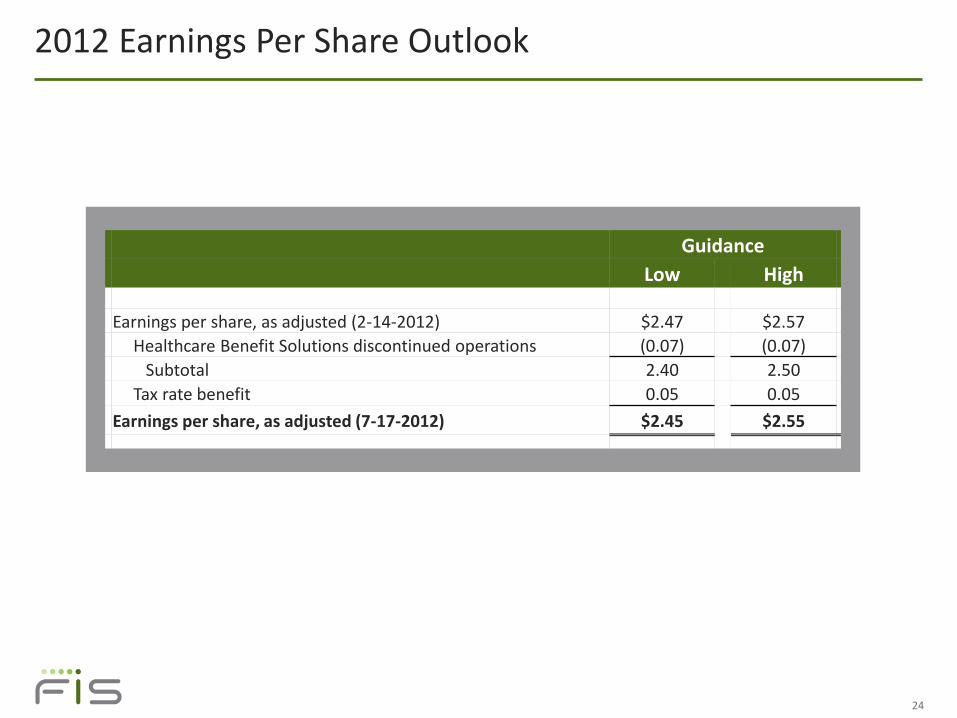
2012 Earnings Per Share Outlook
Guidance
Low High
Earnings per share, as adjusted (2-14-2012) $2.47 $2.57
Healthcare Benefit Solutions discontinued operations (0.07) (0.07)
Subtotal 2.40 2.50
Tax rate benefit 0.05 0.05
Earnings per share, as adjusted (7-17-2012) $2.45 $2.55

Q & A
Appendix
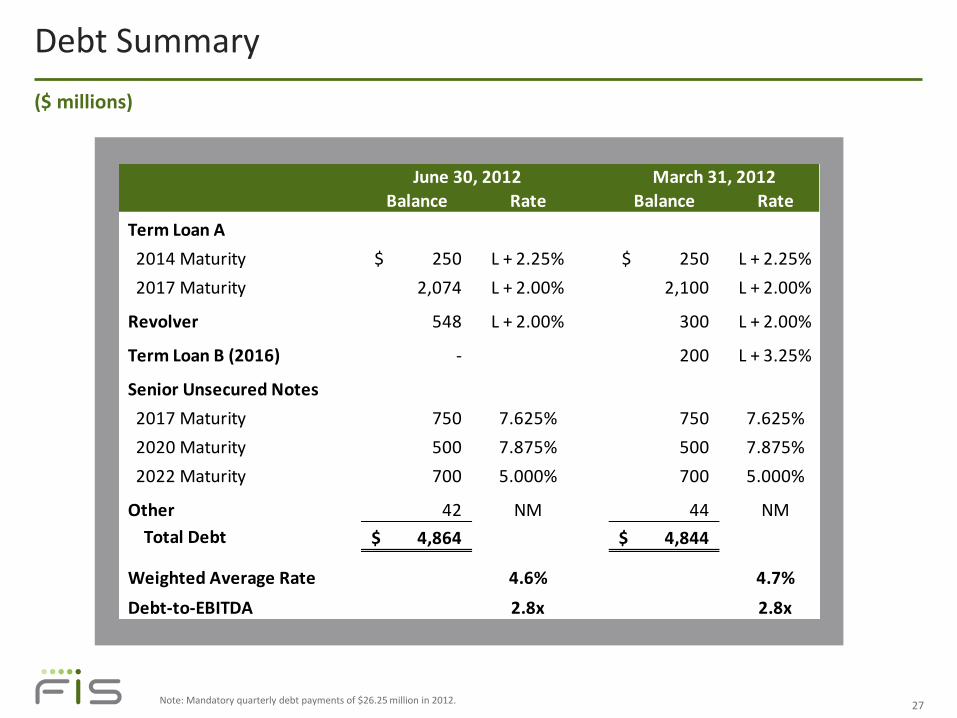
Debt Summary
27 Note: Mandatory quarterly debt payments of $26.25 million in 2012.
($ millions)
June 30, 2012 March 31, 2012
Balance Rate Balance Rate
Term Loan A
2014 Maturity 250$ L + 2.25% 250$ L + 2.25%
2017 Maturity 2,074 L + 2.00% 2,100 L + 2.00%
Revolver 548 L + 2.00% 300 L + 2.00%
Term Loan B (2016) - 200 L + 3.25%
Senior Unsecured Notes
2017 Maturity 750 7.625% 750 7.625%
2020 Maturity 500 7.875% 500 7.875%
2022 Maturity 700 5.000% 700 5.000%
Other 42 NM 44 NM
Total Debt 4,864$ 4,844$
Weighted Average Rate 4.6% 4.7%
Debt-to-EBITDA 2.8x 2.8x
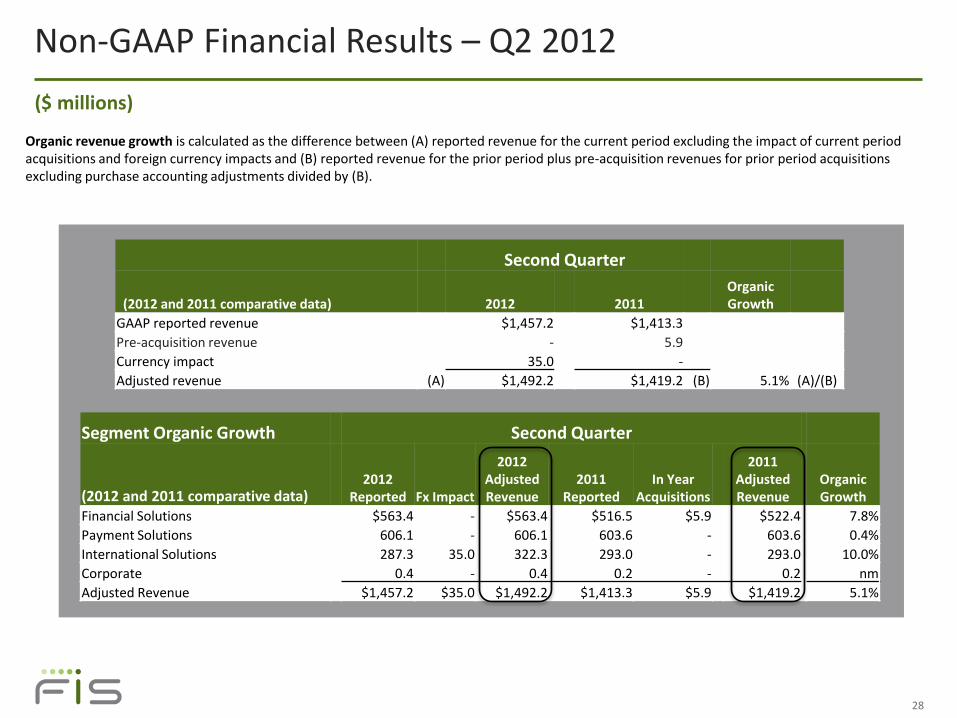
Organic revenue growth is calculated as the difference between (A) reported revenue for the current period excluding the impact of current period acquisitions and foreign currency impacts and (B) reported revenue for the prior period plus pre-acquisition revenues for prior period acquisitions excluding purchase accounting adjustments divided by (B).
Non-GAAP Financial Results – Q2 2012
28
Second Quarter
(2012 and 2011 comparative data) 2012 2011 Organic Growth
GAAP reported revenue $1,457.2 $1,413.3
Pre-acquisition revenue - 5.9
Currency impact 35.0 -
Adjusted revenue (A) $1,492.2 $1,419.2 (B) 5.1% (A)/(B)
Segment Organic Growth Second Quarter
(2012 and 2011 comparative data) 2012
Reported Fx Impact
2012 Adjusted Revenue
2011 Reported
In Year Acquisitions
2011 Adjusted Revenue
Organic Growth
Financial Solutions $563.4 - $563.4 $516.5 $5.9 $522.4 7.8%
Payment Solutions 606.1 - 606.1 603.6 - 603.6 0.4%
International Solutions 287.3 35.0 322.3 293.0 - 293.0 10.0%
Corporate 0.4 - 0.4 0.2 - 0.2 nm
Adjusted Revenue $1,457.2 $35.0 $1,492.2 $1,413.3 $5.9 $1,419.2 5.1%
($ millions)
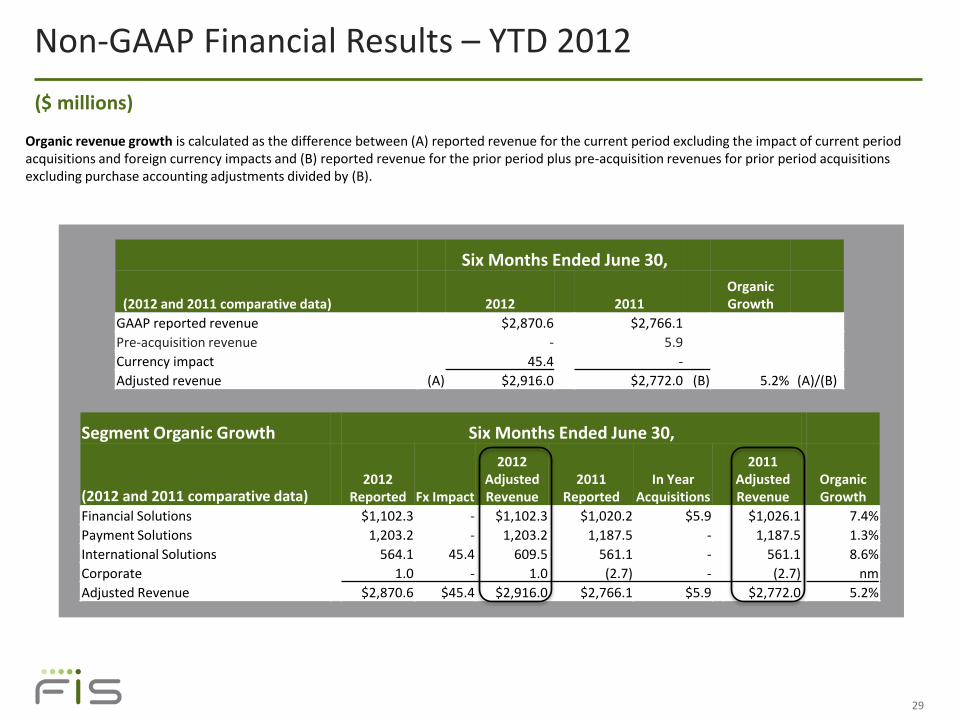
Organic revenue growth is calculated as the difference between (A) reported revenue for the current period excluding the impact of current period acquisitions and foreign currency impacts and (B) reported revenue for the prior period plus pre-acquisition revenues for prior period acquisitions excluding purchase accounting adjustments divided by (B).
Non-GAAP Financial Results – YTD 2012
29
Six Months Ended June 30,
(2012 and 2011 comparative data) 2012 2011 Organic Growth
GAAP reported revenue $2,870.6 $2,766.1
Pre-acquisition revenue - 5.9
Currency impact 45.4 -
Adjusted revenue (A) $2,916.0 $2,772.0 (B) 5.2% (A)/(B)
Segment Organic Growth Six Months Ended June 30,
(2012 and 2011 comparative data) 2012
Reported Fx Impact
2012 Adjusted Revenue
2011 Reported
In Year Acquisitions
2011 Adjusted Revenue
Organic Growth
Financial Solutions $1,102.3 - $1,102.3 $1,020.2 $5.9 $1,026.1 7.4%
Payment Solutions 1,203.2 - 1,203.2 1,187.5 - 1,187.5 1.3%
International Solutions 564.1 45.4 609.5 561.1 - 561.1 8.6%
Corporate 1.0 - 1.0 (2.7) - (2.7) nm
Adjusted Revenue $2,870.6 $45.4 $2,916.0 $2,766.1 $5.9 $2,772.0 5.2%
($ millions)
Non-GAAP Financial Measures
EBITDA is earnings from continuing operations before interest, taxes and depreciation and amortization.
Adjusted EBITDA (2012 full year comparative data) excludes accelerated vesting of certain stock options and restricted stock grants and for a non-compete and change in role payment.
Adjusted net earnings (2012 full year comparative data) exclude the after-tax impact of acquisition related amortization, debt refinancing costs, accelerated vesting of certain stock options and restricted stock grants and for a non-compete and change in role payment and the anticipated loss related to the pending sale of the company’s healthcare business.
Adjusted net earnings (2011 comparative data) exclude the after-tax impact of acquisition related amortization.
Adjusted net earnings per share is equal to adjusted net earnings divided by the weighted average diluted shares outstanding.
Free cash flow is GAAP operating cash flow less capital expenditures and excludes the net change in settlement assets and obligations.
30