Second Quarter 2006 - Banque Laurentienne · Second Quarter 2006 Institutional Investor & Analyst...
49
Second Quarter 2006 Institutional Investor & Analyst Meetings June 2006 RAYMOND MCMANUS President & CEO
Transcript of Second Quarter 2006 - Banque Laurentienne · Second Quarter 2006 Institutional Investor & Analyst...
Second Quarter 2006
Institutional Investor & Analyst MeetingsJune 2006
RAYMOND MCMANUSPresident & CEO
2
This presentation and related communications may contain forward-looking statements, includingstatements regarding the business and anticipated financial performance of Laurentian Bank.These statements typically use the conditional and words such as prospects, believe, estimate,forecast, project, should, could and would. By their very nature, forward-looking statementsinvolve inherent risks and uncertainties, and it is possible that the forecasts, projections andother forward-looking statements will not be achieved. The Bank cautions readers against placingundue reliance on these statements when making decisions, as the actual results could differappreciably from the opinions, plans, objectives, expectations, forecasts, estimates and intentionsexpressed in such forward-looking statements due to various material factors. These factorsinclude, among other things, capital market activity, changes in government monetary, economicand ?scal policies, changes in interest rates, in?ation levels and general economic conditions,legislative and regulatory developments, competition, credit ratings, scarcity of human resourceand technological change. The Bank cautions that the foregoing list of factors is not exhaustive.The Bank does not undertake to update any forward-looking statements, oral or written, madeby itself or on its behalf, except if required by applicable securities legislations.
For questions on this presentation, please contact:Gladys Caron, Vice-President, Public Affairs, Communications and Investor RelationsTel: (514) 284-4500, extension 7511Cel: (514) [email protected]
Forward Looking Statements
Symbol: LB, TSX
3
Highlights
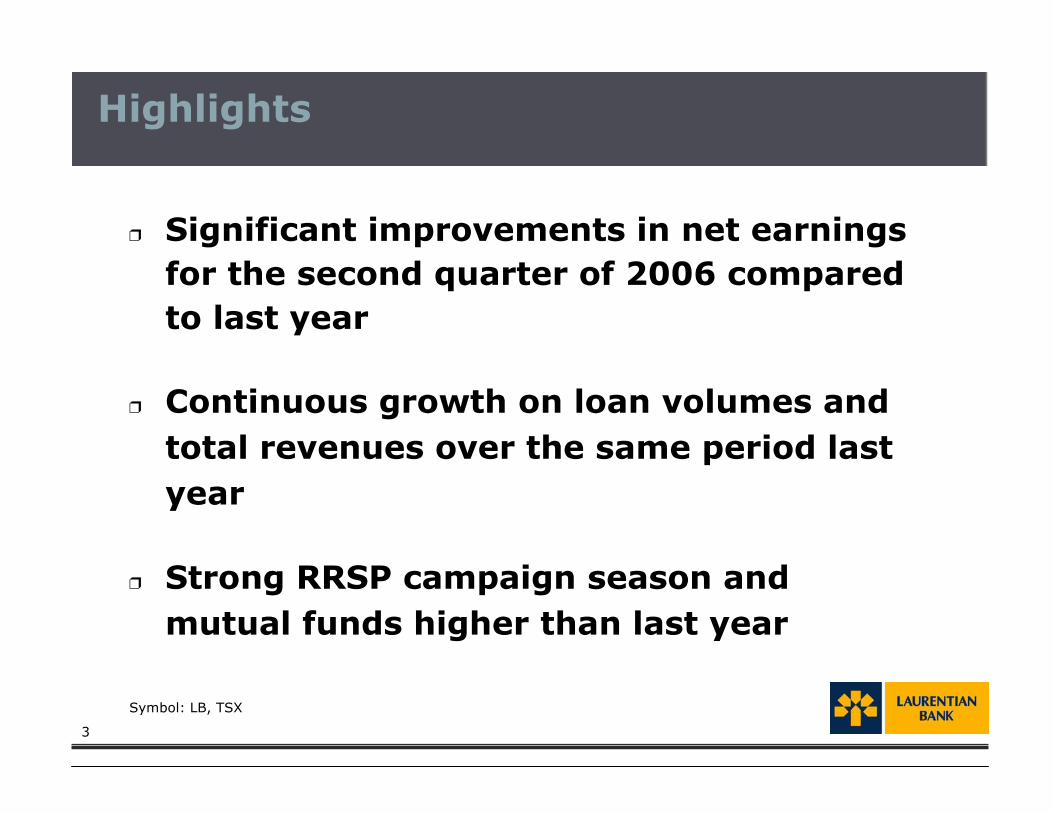
� Significant improvements in net earningsfor the second quarter of 2006 comparedto last year
� Continuous growth on loan volumes andtotal revenues over the same period lastyear
� Strong RRSP campaign season andmutual funds higher than last year
Symbol: LB, TSX
4
Laurentian Bank’s Vision
After building solid foundations, weare developing the Bank throughmany actions and initiatives in orderto become the undisputed #3banking institution in Quebec andcontinue to be a performing player inspecific market segments elsewherein Canada
Symbol: LB, TSX

5
A Focussed Strategy Based on 4 Pillars
� Development of our network and partners
� Development of our people(entrepreneurship model, training, more sales-oriented culture)
� Emphasis on internal growth via improvedefficiency and profitable development
� Increase synergies between our 4 business lines
Symbol: LB, TSX

Symbol: LB, TSX

7
Up to date 2006 Performance and 2006Objectives
(1) PCL ratio is calculated over Average Assets
Symbol: LB, TSX
Performance Measure3 Months Period Ended
April 30, 20066 Months Period Ended
April 30, 20062006
Actual Actual Objectives
Return on Equity 12.5% 10.1%
Diluted Net Income per Share $0.91 $1.51
Total Revenue $128.5M $260.0M $522M to $532M
Efficiency Ratio 75.9% 76.2% 75% to 73.5%
Capital Ratios
- Tier 1 10.3% 10.3% Min of 9.5%
- Total 13.9% 13.9% Min of 12.0%
Credit Quality (PCL Ratio)1 0.25% 0.24% 0.25% to 0.22%
7% to 8%
$2.05 to $2.35

8
Improved Operating Performance
Symbol: LB, TSX
Q2 06 versus Q2 05
Total Gross Loan Growth 2%
Personal Loan Growth 9%
Personal Deposit Growth 2%
Total Revenue Growth 9%
Non-Interest Expenses Growth 5%
Efficiency Ratio Improvement -270 b.p. (favorable)

9
Efficiency Ratio Evolution
Symbol: LB, TSX
$502 M$466 M
$622 M$592 M
$260 M$198 M
$382 M$442 M
$370 M$407 M
75%76.1%
79.3%
71.0%68.8% 73.5%
76.2%
$0
$200
$400
$600
$800
2002 2003 2004 2005 6 months 2006 2006E30%35%40%45%50%55%60%65%70%75%80%
Total Revenue Non-Interest Expenses Efficiency ratio
Sale of Ontario Branches
Target for 2006: 75% to 73.5%
Target for 2006: $522M to $532M

10
Revenue versus Non-Interest Expenses
Symbol: LB, TSX
Period Revenue Growth Non-Interest Expenses GrowthQ2 06 vs Q2 05: 8.9% 5.1%Q1 06 vs Q1 05: 10.4% 9.6%Q4 05 vs Q4 04: 22.8% 8.5%Q3 05 vs Q3 04: 11.9% 7.6%
118.0
128.5131.5
118.5
121.5117.2
108.9
119.2
131.1 133.8
97.5
100.599.098.592.8
91.791.391.592.894.2
80.0
100.0
120.0
140.0
Q1 04 Q2 04 Q3 04 Q4 04 Q1 05 Q2 05 Q3 05 Q4 05 Q1 06 Q2 06
Total Revenue Total Non-Interest Expenses
11
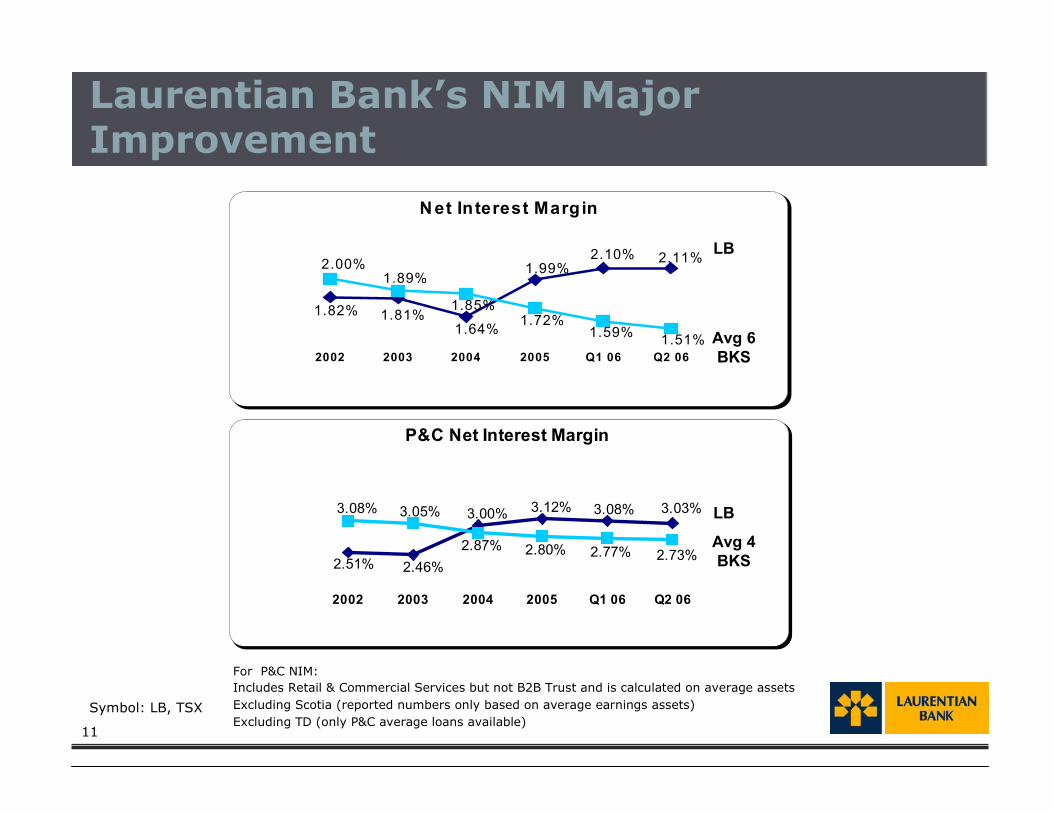
For P&C NIM:Includes Retail & Commercial Services but not B2B Trust and is calculated on average assetsExcluding Scotia (reported numbers only based on average earnings assets)Excluding TD (only P&C average loans available)
Laurentian Bank’s NIM MajorImprovement
N et Interest Margin
2.10%
1.82% 1.81%
2.11%1.99%
1.64%
2.00%1.89%
1.59%1.72%
1.51%
1.85%
2002 2003 2004 2005 Q1 06 Q2 06
LB
Avg 6BKS
P&C Net Interest Margin
3.08%3.12%3.00%
2.46%2.51%
3.03%
2.77%2.80%2.87%
3.05%3.08%
2.73%
2002 2003 2004 2005 Q1 06 Q2 06
LB
Avg 4BKS
Symbol: LB, TSX

12
Loan Portfolio Mix
At October 31st, 2005, 36% of our loan portfolio were originated from outside ofQuebec.
Our loan portfolio is diversified geographically and by loan types.
Diversification of Loan Portfolio
Loan Porfolio As of April 30, 2006
Personal Loans34%
Residential Mortgages
47%
Commercial Mortgages
5%
Commercial Loans and
BA's14%
Symbol: LB, TSX

13
Evolution of gross and net impaired loans
Credit Quality
Symbol: LB, TSX
Impaired Loans(in millions of $)
227185
127 121 122 124
9 22
-4-13 -9 -3
2002 2003 2004 2005 Q1 06 Q2 06
Gross impaired loans Net impaired loans

14
Provision for Credit Losses
Symbol: LB, TSX
in millions of $ 2002 2003 2004 2005 6 months 2006
Personal loans 23.2 26.3 25.6 25.1 12.7Residential mortgage loans 2.9 1.2 1.7 0.6 0.2Commercial mortgage loans 2.6 1.6 3.1 1.6 0.4Commercial and other loans 82.3 28.9 21.6 12.7 6.7Total - Provision for credit losses 111.0 58.0 52.0 40.0 20.0Reversal of general allowances 0.0 4.0 12.0 - -Net losses 111.0 54.0 40.0 40.0 20.0

15
Deposits
Symbol: LB, TSX
Composition of October 31, 2005deposits
LBC Average LBCBig 6
Personal 83.1% 41.4% 77.2%
Business and other 16.9% 58.6% 22.8%
Total of deposits 100.0% 100.0% 100.0%
April 30, 2006
16
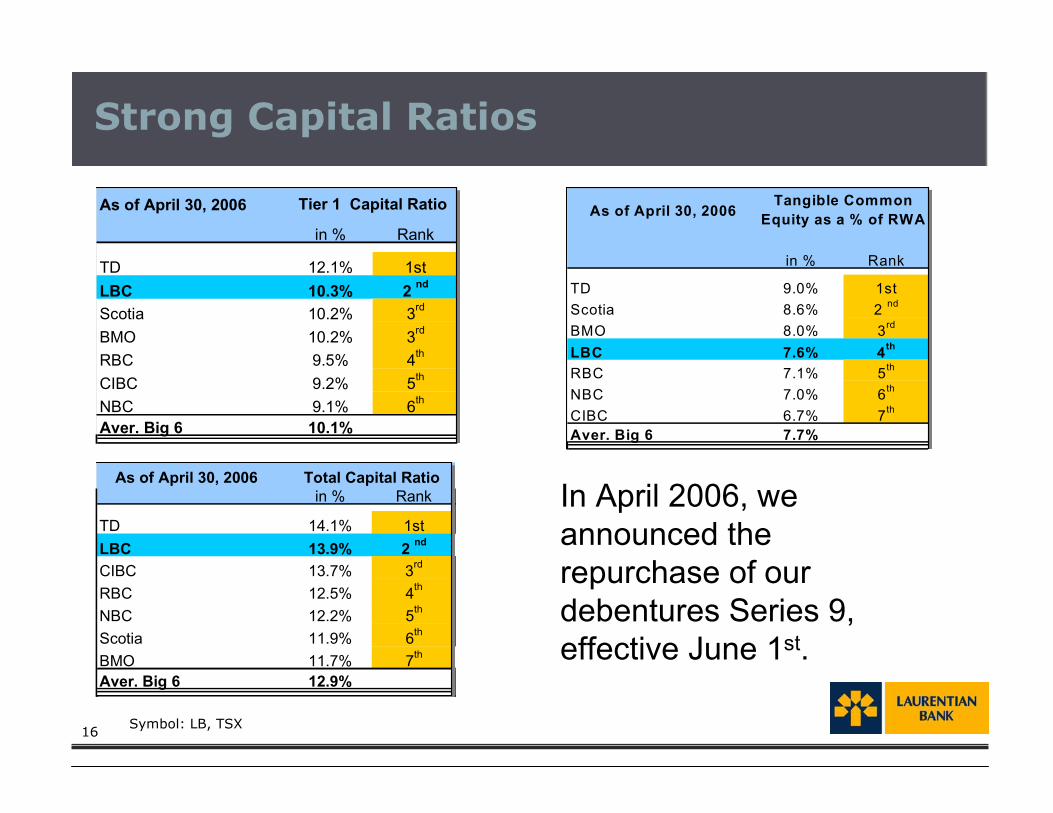
In April 2006, weannounced therepurchase of ourdebentures Series 9,effective June 1st.
Strong Capital Ratios
As of April 30, 2006
in % Rank
TD 12.1% 1stLBC 10.3% 2 nd
Scotia 10.2% 3rd
BMO 10.2% 3rd
RBC 9.5% 4th
CIBC 9.2% 5th
NBC 9.1% 6th
Aver. Big 6 10.1%
Tier 1 Capital Ratio
Symbol: LB, TSX
in % Rank
TD 9.0% 1stScotia 8.6% 2 nd
BMO 8.0% 3rd
LBC 7.6% 4th
RBC 7.1% 5th
NBC 7.0% 6th
CIBC 6.7% 7th
Aver. Big 6 7.7%
As of April 30, 2006Tangible Common
Equity as a % of RWA
in % Rank
TD 14.1% 1stLBC 13.9% 2 nd
CIBC 13.7% 3rd
RBC 12.5% 4th
NBC 12.2% 5th
Scotia 11.9% 6th
BMO 11.7% 7th
Aver. Big 6 12.9%
As of April 30, 2006 Total Capital Ratio

17
Assets Under Administration
Symbol: LB, TSX
( in billions of $) Q2 05 Q2 06
Self-directed RRSPs and RRIFs 7.9 8.3Institutional 1.9 1.8Client's brokerage assets 1.7 1.9Mutual Funds 1.2 1.4Mortgage loans under management 0.8 1.3Other - Personal 0.3 0.3
Total 13.7 15.0
18
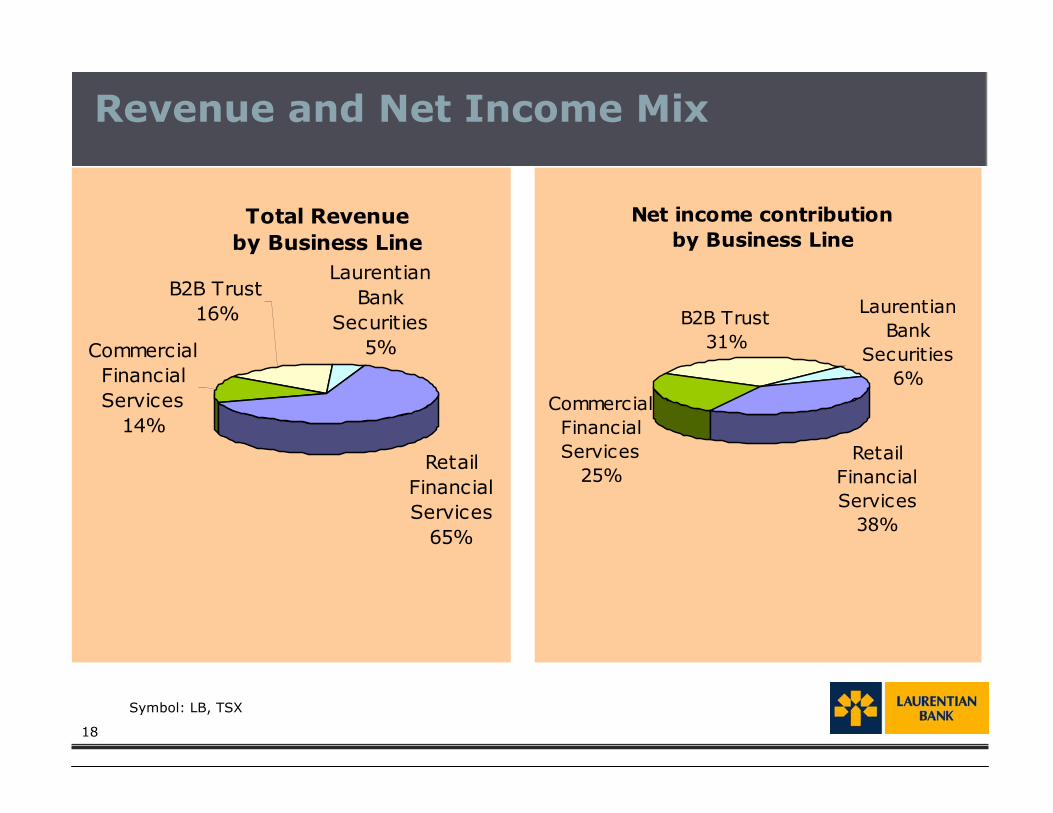
Revenue and Net Income Mix
Net income contribution by Business Line
Retail Financial Services
38%
Commercial Financial Services
25%
B2B Trust31%
Laurentian Bank
Securities6%
Symbol: LB, TSX
Total Revenue by Business Line
B2B Trust16%
Laurentian Bank
Securities5%Commercial
Financial Services
14%
Retail Financial Services
65%

Symbol: LB, TSX
20
Retail Financial Services
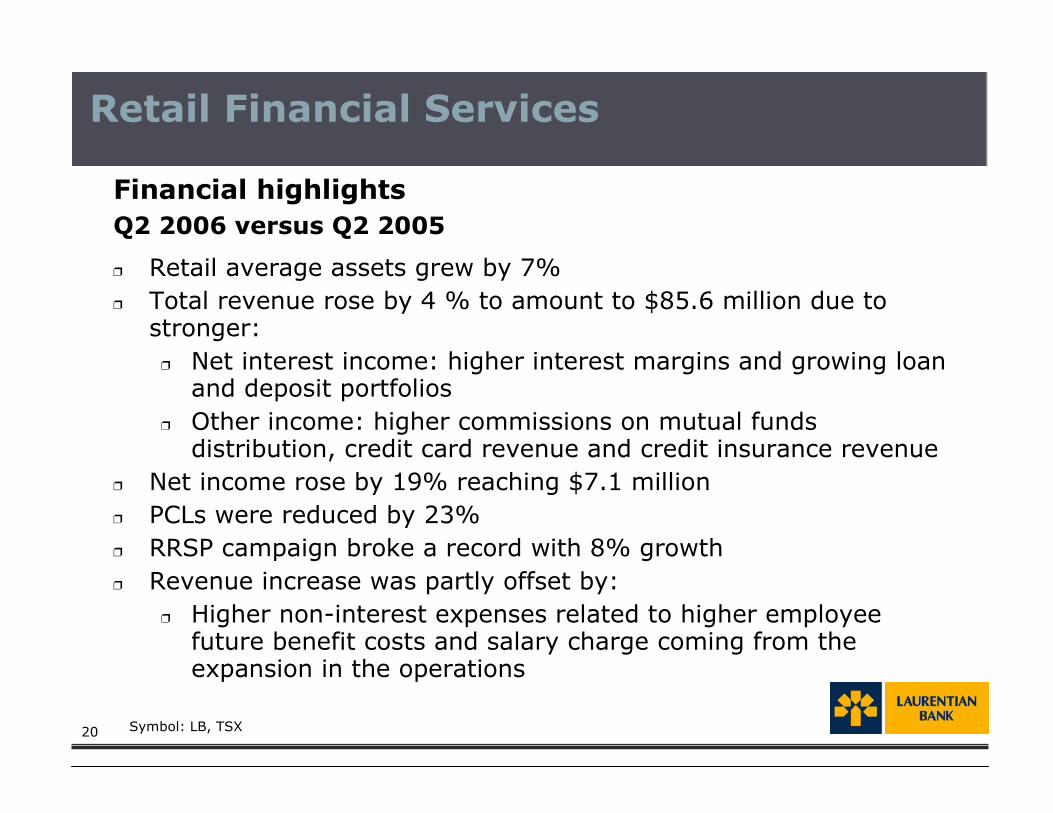
Financial highlightsQ2 2006 versus Q2 2005
� Retail average assets grew by 7%� Total revenue rose by 4 % to amount to $85.6 million due to
stronger:� Net interest income: higher interest margins and growing loan
and deposit portfolios� Other income: higher commissions on mutual funds
distribution, credit card revenue and credit insurance revenue� Net income rose by 19% reaching $7.1 million� PCLs were reduced by 23%� RRSP campaign broke a record with 8% growth� Revenue increase was partly offset by:
� Higher non-interest expenses related to higher employeefuture benefit costs and salary charge coming from theexpansion in the operations
Symbol: LB, TSX

21
� Acquire new customers
� Optimization of the Branch and ABMs Network� 8 new branches with the Financial Services Boutiques
concept since November 2004� 15 major branch renovations and 2 branch relocations (since
September 2004)� 28 new ABMs (since November 2004)
� Improve product and service offering� Laurentian’s Bank Complicité Program offered to FTQ
members� New mortgages and investments products
Retail Financial Services’ Strategy
Symbol: LB, TSX

22
� Entrepreneurship Model� Empowerment - Accountability- Rewards� 26 Local Area Markets with a manager in each branch� Continued Measure (Profitability, sales, quality of service,
compliance…)
� Training
� Management skills
� Sales skills
� Product knowledge
� Capitalize on our human resources
Retail Financial Services’ Strategy
Symbol: LB, TSX

23
� Increase the share of wallet of our customersExtensive use of datawarehouse to increase cross-sellingFor the past 3 years, we have put in place a robust analytical CRMenvironment in order to better understand our customers and increase theshare of wallet …… and making sure that we are the main financial institution for ourcustomers day-to-day banking transactions
Product Penetration Increase among Customer Base
Credit Insurance VISA Card Personal Line ofCredit
+ 5.3%
+ 10.3% + 10.4%
January 2006 versus October 2004
Checking Accounts Net Growth Quebec Retail Branches
-15000
-10000
-5000
0
5000
10000
15000
2003 2004 2005
Retail Financial Services’ Strategy
Symbol: LB, TSX
24
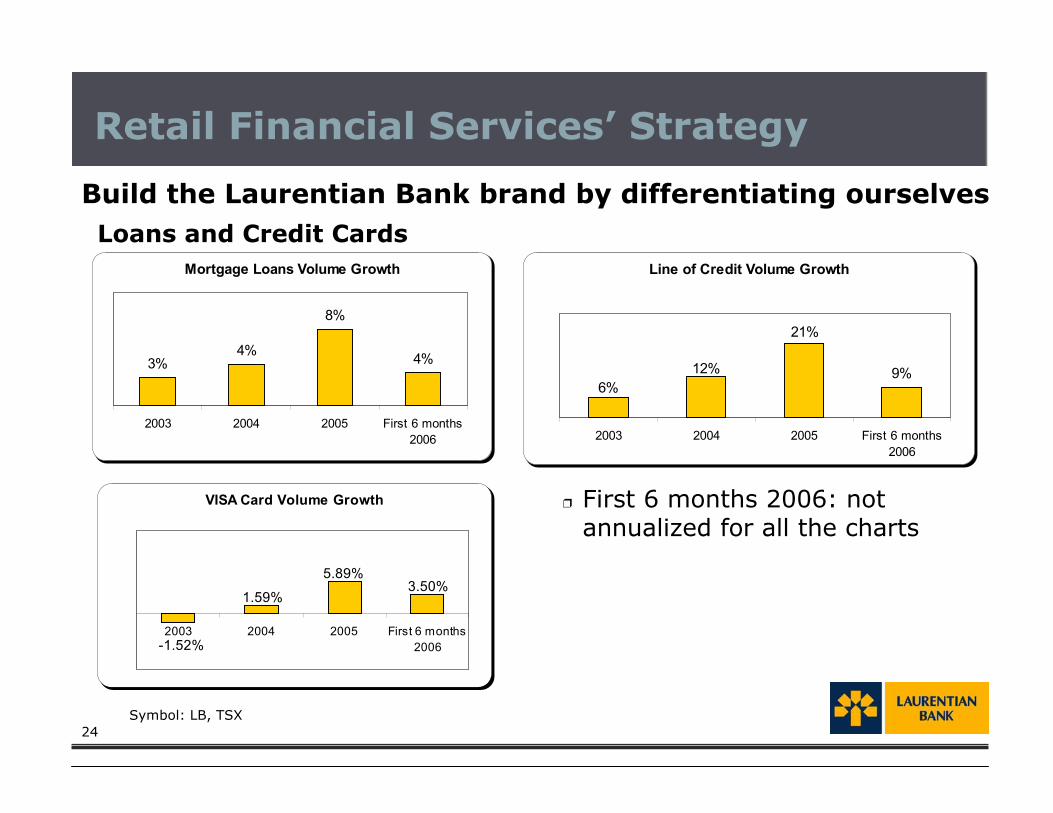
Loans and Credit Cards
Build the Laurentian Bank brand by differentiating ourselves
Retail Financial Services’ Strategy
� First 6 months 2006: notannualized for all the charts
Symbol: LB, TSX
Mortgage Loans Volume Growth
3%4%
8%
4%
2003 2004 2005 First 6 months2006
Line of Credit Volume Growth
9%6%
12%
21%
2003 2004 2005 First 6 months2006
VISA Card Volume Growth
-1.52%
1.59%
5.89%3.50%
2003 2004 2005 First 6 months2006

25
Growth in major products
Retail Financial Services’ Growth
R R S P C am p a ig n N e t S a les G ro w thon a year over year bas is
2003 2004 2005 2006
+ 19%+ 7%
+ 5% + 8%
Symbol: LB, TSX
First 6 months 2006: not annualized
Mutual Funds Volume Growth
17%14%
27%
-6%2003 2004 2005 First 6 months
2006
All funds

Symbol: LB, TSX

27
Commercial Financial Services
Financial highlightsQ2 2006 versus Q2 2005
� Loan portfolio increased by close to $100 million compared to ayear ago
� Excluding the lost stream of $1.9 million revenue related to thesale of Brome Financial Corporation (sold in Q1 2006), revenuesof $19.2 million were up by $0.3 million resulting mainly fromhigher loan volume
� Net income was $4.6 million versus $6.9 million in the sameperiod last year
� Non-interest expenses decreased by $0.8 million resultingmainly from the effect of the sale of Brome
� Loan losses rose by $3.0 million due to the fact that during Q22005 results benefit from significant recoveries and a provisionon a specific loan was incurred during Q2 2006
Symbol: LB, TSX

28
Concentrating on our core activities
� Focus on relationship approach instead of asset basedapproach
� Restructuring of sales forces in Quebec
� Launching of commercial signature “MaxAffaires”
� Continue to grow the small and medium sized business sector,as well as agriculture by loan development activities
� Improve our product and service offering
Commercial Financial Services
Symbol: LB, TSX

29
Commercial Financial Services
We are seeing the results of our efforts
Growth based on average assets, except for Real Estate which is based on year-end balances
(1) Mid-Market Quebec: excluding micro business and corporate assets
Symbol: LB, TSX
Asset Growth
2005 vs 2004 First 6 months 2006 vs First 6 months 2005
Real estate
+ 17%
+ 5%
Mid-Market Quebec1
+ 6% + 8%
+ 5%
- 6%
Mid-Market Ontario
Farm lending
+ 10%+ 12%
Symbol: LB, TSX
31
B2B Trust’ Strategy
Financial highlightsQ2 2006 versus Q2 2005
� Total revenue went up by 13% coming from higher loan volumeand net interest margins
� Net income strongly rose by 43% coming from higher totalrevenue and lower provisions for credit losses
Q2 2006 versus Q1 2006
� Loan volumes increase: investment loans (+$136 million),mortage loans (+$9 million) and deposit volumes ($152 million)
Symbol: LB, TSX

32
� Focus on primary markets
� 5 core distribution channels: mutual fund industry,insurance industry, investment industry, mortgagebrokerage and deposit brokerage
� Build a solid organizational foundation
� Sell by cultivating organic growth within highest profitcategories
� Evaluate new market opportunities
B2B Trust deals with more than 14,000 financialprofessionals and has more than 40 distributionalliances for investment loans, RSP loans andbanking products
B2B Trust
Symbol: LB, TSX
33
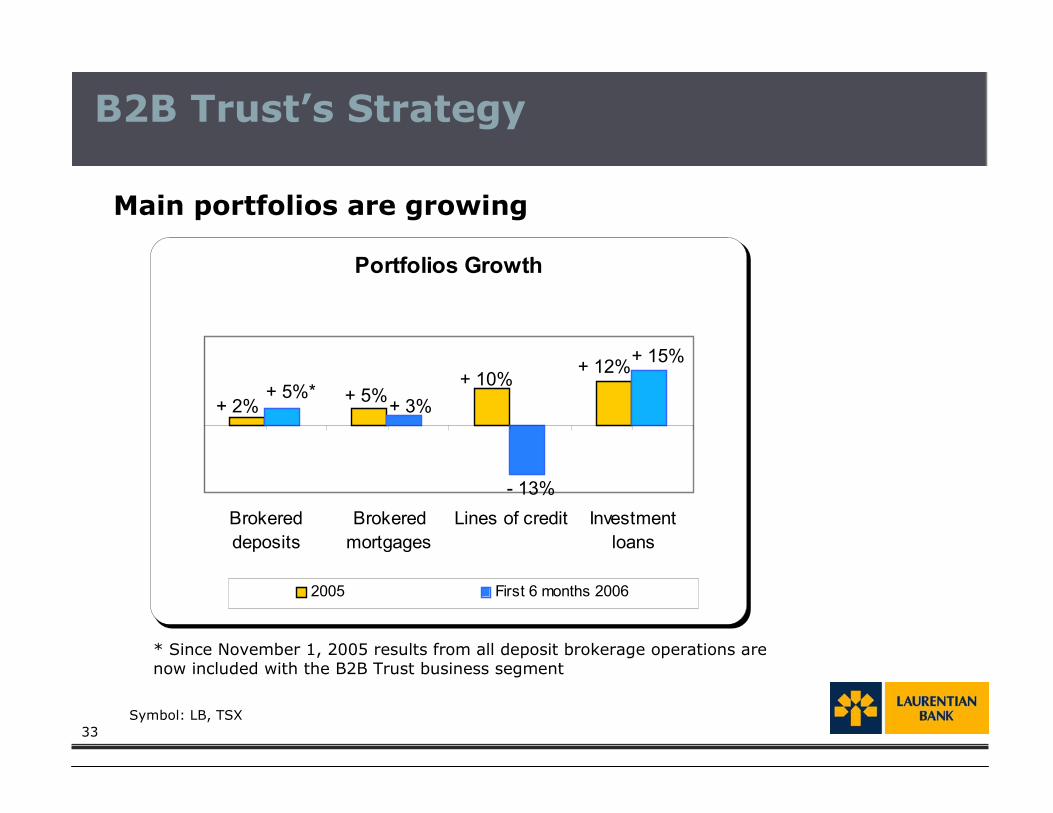
Main portfolios are growing
B2B Trust’s Strategy
Symbol: LB, TSX
Portfolios Growth
Brokereddeposits
Brokeredmortgages
Lines of credit Investmentloans
2005 First 6 months 2006
+ 2% + 3%+ 5%
- 13%
+ 10% + 12% + 15%
+ 5%*
* Since November 1, 2005 results from all deposit brokerage operations arenow included with the B2B Trust business segment
Symbol: LB, TSX

35
Laurentian Bank Securities
Financial highlightsQ2 2006 versus Q2 2005
� 17% rise in total revenue amounting to $6.2 million coming fromboth institutional and retail division over Q2 2005
� Non-interest expenses grew by 10% to reach $4.6 millionreflecting hiring of employees and other business developmentinitiatives
� 47% growth in net income that amounted to $1.1 million
Symbol: LB, TSX

36
� Pursue consolidation of network and team� After opening 4 new offices and hired
approximately 30 investment advisors and staff since October 31st, 2004
� Pursue the development of institutional brokerageactivities - fixed income
� Develop synergies between business segments
� Develop retail brokerage operations
� Develop institutional services in equity markets andfinancing of SME
Laurentian Bank Securities
Symbol: LB, TSX

37
Laurentian Bank’s Strengths
� Conservative financial position� Strong balance sheet and capital ratios� Strong proportion of insured mortgages� Limited capital market exposure compared to peer group� Large proportion of personal loans secured
� Strategic focus and flexibility� Selective regional positioning� Specific market segments outside Quebec� Partnership approach� Experienced management team and committed employees� Quality and efficiency of our products and services
Symbol: LB, TSX

38
Conclusion
� Employees are committed and have fullybought into the plan
� Using our strenghts and a very focusedstrategy, we intend to continue to buildon our accomplishement
� Laurentian Bank is being managed in aconservative manner with a long termvision
Symbol: LB, TSX

40
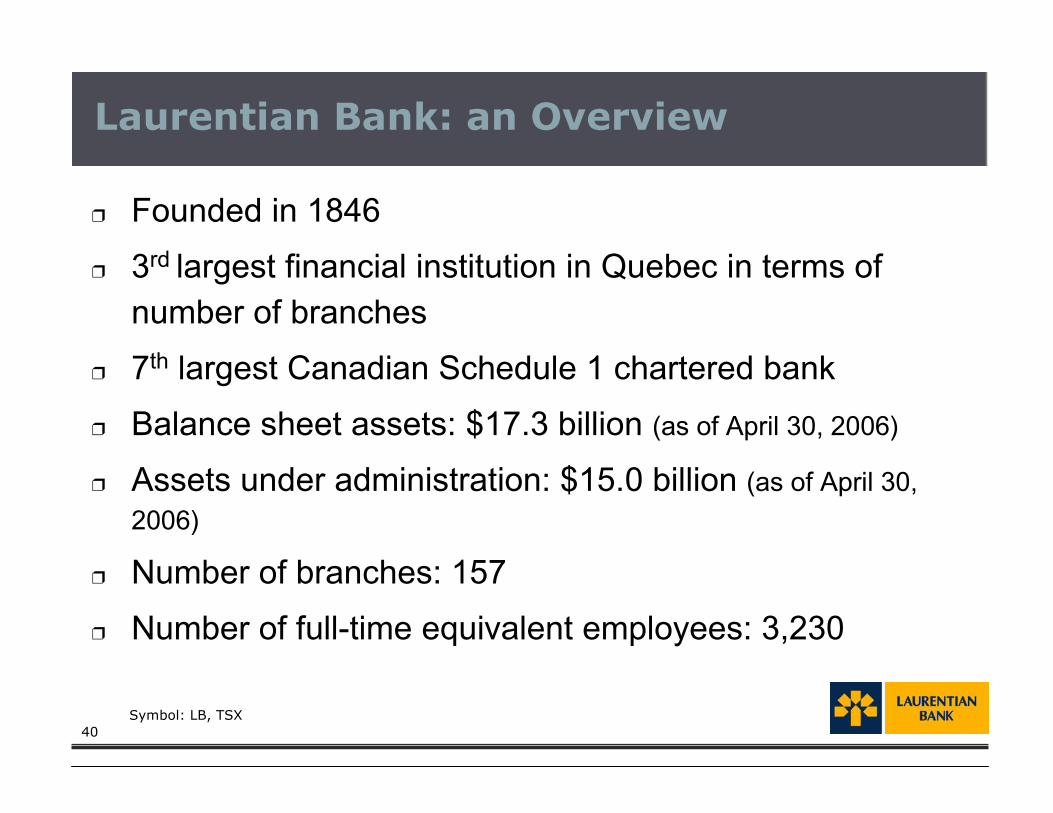
Laurentian Bank: an Overview
� Founded in 1846� 3rd largest financial institution in Quebec in terms of
number of branches� 7th largest Canadian Schedule 1 chartered bank� Balance sheet assets: $17.3 billion (as of April 30, 2006)
� Assets under administration: $15.0 billion (as of April 30,2006)
� Number of branches: 157� Number of full-time equivalent employees: 3,230
Symbol: LB, TSX

41
� Laurentian Bank’s main market is Quebec
� With 157 retail, 20 commercial and 14 brokeragebranches, Quebec is LBC’s main market. All ourbusiness lines are active in this market.
� A performing player across Canada
� In the sectors and markets in which LBC excels and hasa competitive edge, that is B2B Trust, CommercialFinancial Services and our indirect points-of-salenetwork, Laurentian Bank Securities as well asmortgages and deposits through brokers.
�36% of LBC’s total loans are outside Quebec (as ofOctober 31st, 2005)
A Clear Geographical and Business Focus

42
Four Business Lines
LBCLBC
Retail Financial Services
Retail Financial Services B2B TrustB2B TrustCommercial Financial
ServicesCommercial Financial
Services
�� Provider of financial productsProvider of financial productsfor independent financialfor independent financialadvisors, planners and brokersadvisors, planners and brokers
�� Leader in self-directed Leader in self-directed RSP’sRSP’s�� More than 40 distributionMore than 40 distribution
agreements signed withagreements signed withfinancial intermediariesfinancial intermediaries
�� Four of the fifteen largestFour of the fifteen largestmutual fund manufacturersmutual fund manufacturershave investment loanshave investment loansprograms with B2B Trust: CI,programs with B2B Trust: CI,FranklinFranklin Templeton Templeton, Dynamic, Dynamicand AICand AIC
�� Main portfolios: $4.8 billionMain portfolios: $4.8 billionthrough deposit brokers, $1.5through deposit brokers, $1.5billion in investment and RRSPbillion in investment and RRSPloans and $1.1 billion inloans and $1.1 billion inbrokered mortgages as atbrokered mortgages as atApril 30, 2006April 30, 2006
�� Relationship bankingRelationship bankingapproachapproach
�� Business: small and mid-Business: small and mid-market, real estate and farmmarket, real estate and farmproducersproducers
�� QueQuebecbec: present in all: present in allsegmentssegments
�� Ontario and WesternOntario and WesternCanada:Canada: present in present in realrealestate and mid-marketestate and mid-market
�� Branch network - QuebecBranch network - Quebeconlyonly
�� 33rdrd position in position in QueQuebecbec in interms of number ofterms of number ofbranchesbranches
�� Point-of-sales acrossPoint-of-sales acrossCanadaCanada
�� Partnerships, alliance andPartnerships, alliance andcontracts (Espresso Bank-contracts (Espresso Bank-CafCaféé with Van with Van HoutteHoutte,,Industrial Alliance, FTQ,Industrial Alliance, FTQ,Western Union, exclusiveWestern Union, exclusivebanking ABMs in Montrealbanking ABMs in MontrealMetro)Metro)
Laurentian Bank Securities
Laurentian Bank Securities
�� Institutional fixedInstitutional fixedincomeincome
�� Full-service brokerFull-service broker�� Discount brokerDiscount broker�� Carrying brokerCarrying broker
Symbol: LB, TSX

43
Retail Financial Services Performance
Totalrevenue
Q2 06
Netincome
Q1 06
Q2 05 Q1 06
� In Q2 2006, 4% rise in total revenue over Q2 2005 coming from higher interest margins and growing loanand deposit portfolios. Also, other income increased over the same period last year due to highercommissions on credit insurance and mutual funds distribution as well as credit card revenue
Q2 05
Per Year Per quarter
2004 2005
Q2 0620052004
Per quarterPer Year 2003
Total revenue as a % of avg assets
2003
2003
2004 2005 Q2 05 Q1 06 Q2 06
Per quarterPer Year
4 .3 3 %4 .4 3 %4 .3 6 %
3 .3 6 %
4 .4 5 %4 .3 2 %
87.4
369.4319.4
340.1
82.1 85.6
6.516.8
22.2
34.5
6.0 7.1
� Over the same period lastyear, average assets rose by7% (Q2 2006 vs Q2 2005)partly due to a record RRSPcampaign
� Net income was impacted by higher non-interest expense coming mainly from futurebenefit costs and higher salary charge related to the expansion. This was partly offset bylower provisions for credit losses
Symbol: LB, TSX

44
Commercial Financial Services Performance
Totalrevenue
Q2 06
Netincome
� Total revenue decreased in Q2 2006 versus Q2 2005 resulting from the sale of 51% stake in BromeFinancial Corporation in Q1 2006. Excluding the lost stream of revenues of $1.9 million from Brome,total revenue would have slightly increased
� Higher provisions for credit losses (PCLs) in Q2 2006 versus Q2 2005 can be explained by someelements: 1) significant recoveries on certain loans during Q2 2005
2) provision on a specific loan which was resolved in May 2006 at no additional cost� Higher PCLs were partly offset by lower non-interest expenses and taxes
Q2 05 Q1 06
Total revenue as a % of avg assets
2005 20042003
Q2 06 Q1 06 Q2 05 2005 20042003
Per quarterPer Year
Q2 06 Q1 06 Q2 05 2005 20042003
Per quarterPer Year
Per quarterPer Year
� Average assets remainrelatively stable compared toQ2 2005 even with thestrategic actions to decreaseour corporate lending portfolio
3.54%
3.84%3.76%
3.44%
3.84% 3.85%
21.9
92.6 89.2 85.3
20.8 19.2
4.66.9
21 .524.4
20.8
5.6
Symbol: LB, TSX

45
Commercial Financial Services
� Real Estatecontinues toperform very well
� Small and mid-markets segmentremains stable
Geographical Distribution - Q2 2006
Relative ContributionApril 30, 2006
% of Net Income
Efficiency Ratio
Avg Assets
($M)
PCL (%)3
Real Estate1 55% 30.8% 959 0.05%
Mid-Market Quebec2 15% 46.0% 583 0.62%
Mid-Market Ontario 30% 32.2% 444 0.04%
Agriculture 0% 64.2% 163 0.95%(1) Real estate assets are based on ending period.
(2) Excludes small business lending and corporate lending
(3) PCL as of % of business lines average assets
Symbol: LB, TSX
Quebec Ontario Western Cda
Real Estate 33% 54% 13%
Mid-Market 60% 40% -
Agriculture 100% - -
Corporate lending was transferred to treasury in Q1-2005
46
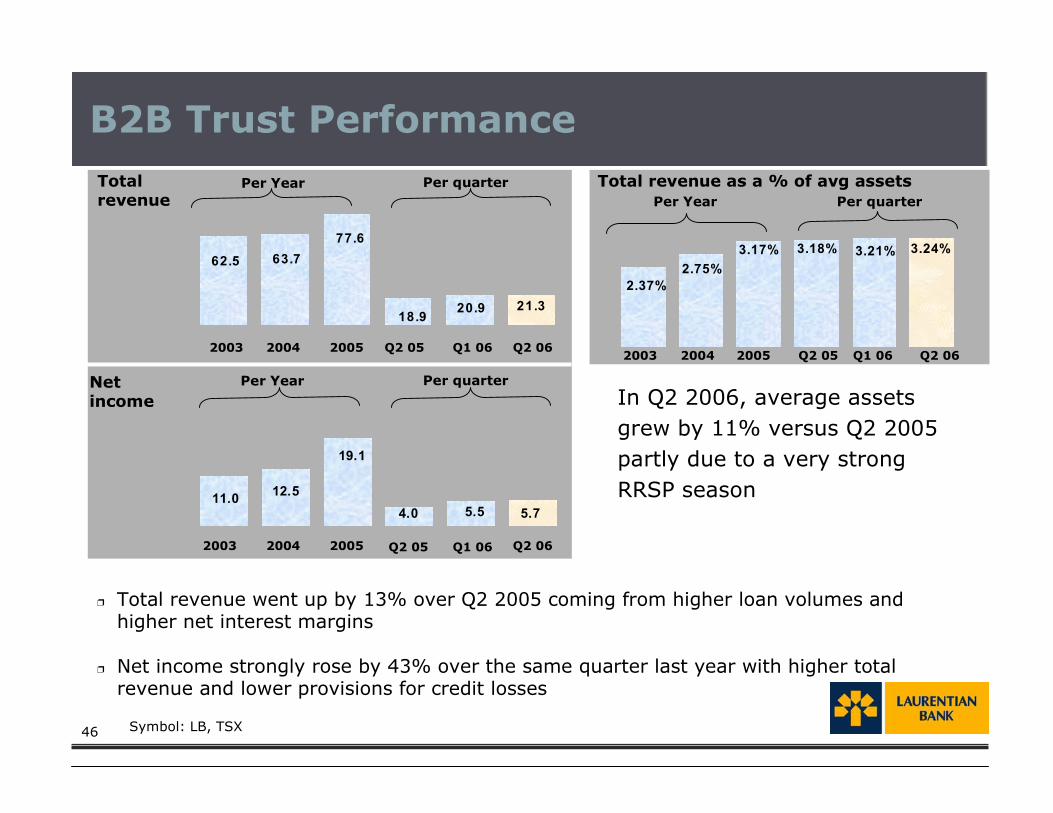
B2B Trust PerformanceTotalrevenue
Netincome � In Q2 2006, average assets
grew by 11% versus Q2 2005partly due to a very strongRRSP season
Total revenue as a % of avg assets
� Total revenue went up by 13% over Q2 2005 coming from higher loan volumes andhigher net interest margins
� Net income strongly rose by 43% over the same quarter last year with higher totalrevenue and lower provisions for credit losses
Per Year Per quarter
2003 2004 2005 Q2 05 Q1 06 Q2 06 2003 2004 2005 Q2 05 Q1 06 Q2 06
2003 2004 2005 Q2 05 Q1 06 Q2 06
Per Year Per quarter
Per quarterPer Year
3.24%3.17%2.75%
2.37%
3.18% 3.21%
21.318.9
77.663.762.5
20.9
5.511.0 12.5
19.1
4.0 5.7
Symbol: LB, TSX
47
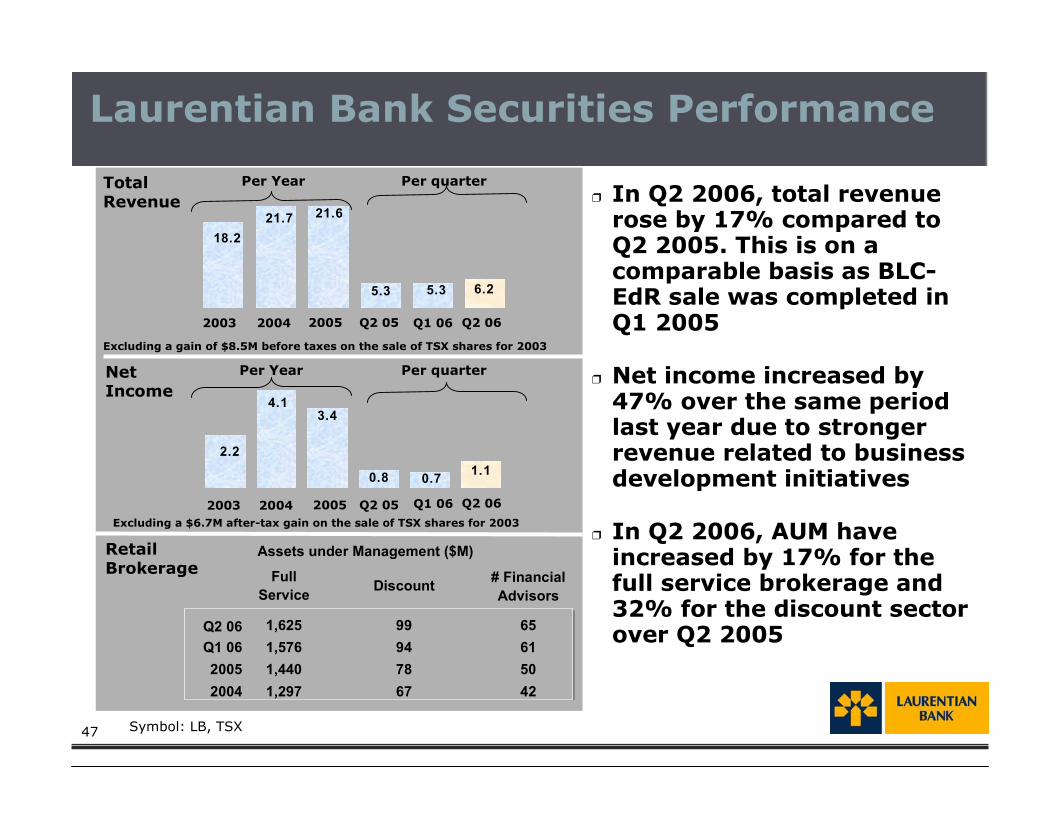
Laurentian Bank Securities Performance
TotalRevenue
NetIncome
� In Q2 2006, total revenuerose by 17% compared toQ2 2005. This is on acomparable basis as BLC-EdR sale was completed inQ1 2005
� Net income increased by47% over the same periodlast year due to strongerrevenue related to businessdevelopment initiatives
� In Q2 2006, AUM haveincreased by 17% for thefull service brokerage and32% for the discount sectorover Q2 2005
2004
Excluding a gain of $8.5M before taxes on the sale of TSX shares for 2003
Excluding a $6.7M after-tax gain on the sale of TSX shares for 2003
Q2 05
RetailBrokerage
Q1 06 Q2 06 2005
Per Year Per quarter
Per Year Per quarter
2003
Q2 06 Q1 06 Q2 05 2005 2004 2003
5.35.3
18.221.7 21.6
6.2
1.1
3.44.1
2.2
0.8 0.7
Full Service Discount
Q2 06 1,625 99 65Q1 06 1,576 94 612005 1,440 78 502004 1,297 67 42
Assets under Management ($M)
# Financial Advisors
Symbol: LB, TSX
48
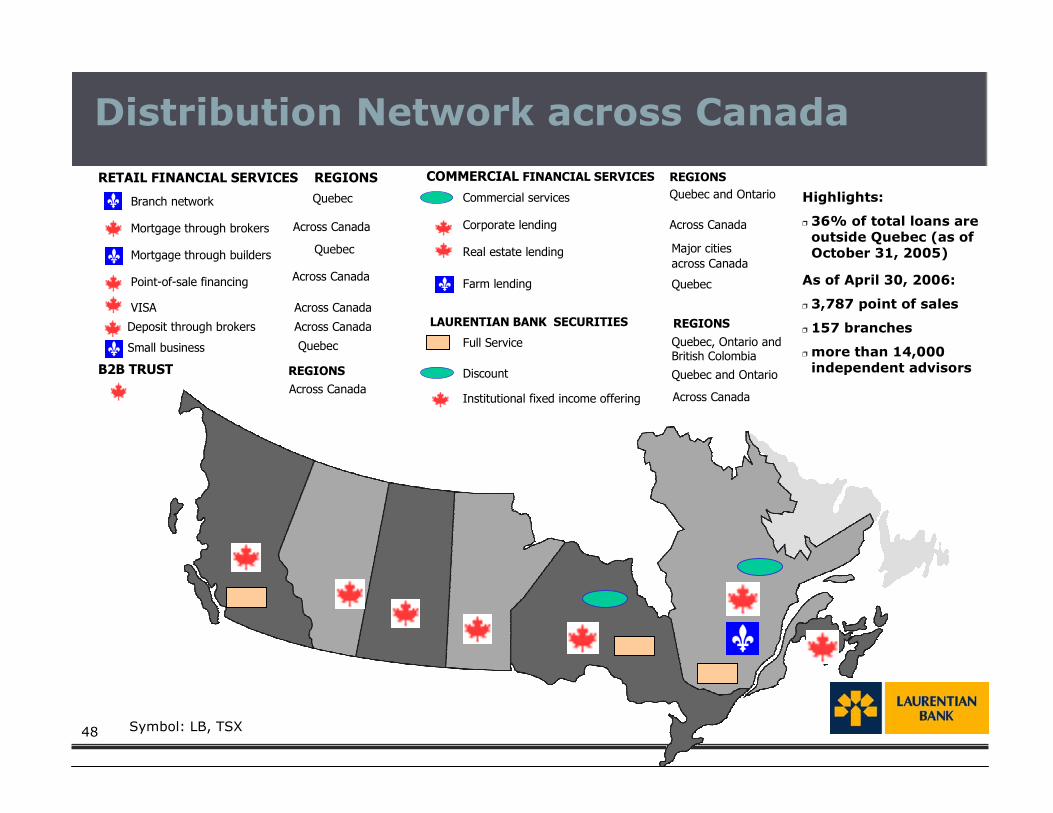
RETAIL FINANCIAL SERVICES REGIONS
Branch network Quebec
Mortgage through brokers Across Canada
Mortgage through builders Quebec
Point-of-sale financing Across Canada
VISA Across Canada
Deposit through brokers Across Canada
Small business Quebec
COMMERCIAL FINANCIAL SERVICES REGIONS
Commercial services Quebec and Ontario
Corporate lending Across Canada
Real estate lending Major citiesacross Canada
Farm lending Quebec
LAURENTIAN BANK SECURITIES REGIONS
Discount
Quebec, Ontario andBritish Colombia
B2B TRUSTAcross Canada
Highlights:
� 36% of total loans areoutside Quebec (as ofOctober 31, 2005)
As of April 30, 2006:
� 3,787 point of sales
� 157 branches
� more than 14,000independent advisors
Full Service
Quebec and Ontario
Institutional fixed income offering Across Canada
Distribution Network across Canada
Symbol: LB, TSX
REGIONS
49
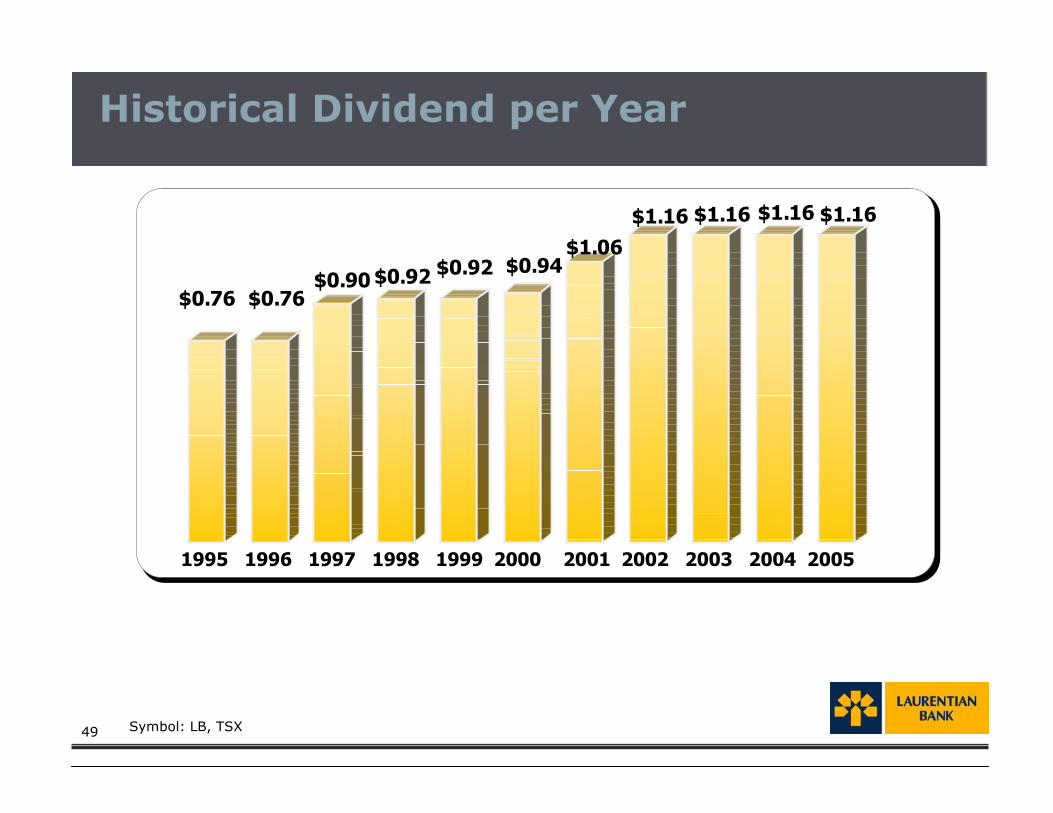
$0.76 $0.76$0.90 $0.92 $0.92 $0.94
$1.06$1.16 $1.16 $1.16 $1.16
1995 1996 1997 1998 1999 2000 2001 2002 2003 2004 2005
Historical Dividend per Year
Symbol: LB, TSX