Second Annual Report of the Crash Avoidance Metrics ... · PDF file3 PROGRAM OVERVIEW Ford...
46
DOT HS 809 663 January 2003 Second Annual Report of the Crash Avoidance Metrics Partnership, April 2002 - March 2003
Transcript of Second Annual Report of the Crash Avoidance Metrics ... · PDF file3 PROGRAM OVERVIEW Ford...

DOT HS 809 663 January 2003
Second Annual Report of the CrashAvoidance Metrics Partnership,
April 2002 - March 2003

This publication is distributed by the U.S. Department of Transportation, National Highway Traffic Safety Administration, in the interest of information exchange. The opinions, findings and conclusions expressed in this publication are those of the author(s) and not necessarily those of the Department of Transportation or the National Highway Traffic Safety Administration. The United States Government assumes no liability for its contents or use thereof. If trade or manufacturer’s name or products are mentioned, it is because they are considered essential to the object of the publication and should not be construed as an endorsement. The United States Government does not endorse products or manufacturers.

1. Report No.
DOT HS 809 663
2. Government Accession No.
3. Recipient's Catalog No.
5. Report Date January 2004
4. Title and Subtitle
Second Annual Report of the Crash Avoidance Metrics Partnership, April 2002 - March 2003 6. Performing Organization Code
7. Author(s)
Shulman, Mike; Deering, Richard K.
8. Performing Organization Report No.
10. Work Unit No. (TRAIS)
9. Performing Organization Name and Address
Crash Avoidance Metrics Partnership Discovery Center, Suite B-30 39255 Country Club Drive Farmington Hills, Michigan 48331
11. Contract or Grant No. DTFH61-01-X-00014
13. Type of Report and Period Covered Annual Report April 2002 - March 2003
12. Sponsoring Agency Name and Address
National Highway Traffic Safety Administration Office of Advanced Safety Research Advanced Technology Division, NPO 113 Room 6220 400 Seventh Street SW Washington, DC 20590
14. Sponsoring Agency Code NHTSA/ NPO 113
15. Supplementary Notes
16. Abstract
The Crash Avoidance Metrics Partnership (CAMP) was formed by Ford and General Motors in 1995 to accelerate the implementation of crash avoidance countermeasures in passenger vehicles to improve traffic safety. The CAMP Light Vehicle Enabling Research Program brings together BMW, DaimlerChrysler, Ford, General Motors, Navigation Technologies, Nissan, Toyota and Volkswagen in four cooperative research projects with the National Highway Traffic Safety Administration (NHTSA) to advance the safety research objectives of the Department's Intelligent Vehicle Initiative. This report describes the progress made in the second year of this three-year cooperative research program. Progress in the four projects is described in this report: Forward Crash Warning Requirements, Driver Workload Metrics, Enhanced Digital Maps for Safety, and a new project, Vehicle Safety Communications. The first project continued development of human factors for a Forward Collision Warning system. The second project completed development of test vehicles and facilities and pilot testing. The third project continued map data collection and application vehicle development. The fourth project completed a literature review and identified vehicle safety applications enabled by DSRC. 17. Key Words Rear-end crashes, digital maps, distraction, workload, CAMP, traffic safety, DSRC, intersection crashes, road departure crashes
18. Distribution Statement Document is available through the National Technical Information Service Springfield, VA 22161
19. Security Classif. (of this report)
Unclassified
20. Security Classif. (of this page)
Unclassified
21. No. of Pages
65 22. Price
Form DOT F 1700.7 (8-72) Reproduction of completed page authorized

CONTENTS
PROGRAM OVERVIEW …………………………………………………………… 3 Driver Workload Metrics Project Scope ……………..……………………………………………….………………………. 5 Activities & Accomplishments …………………………………………………………… 5 Timeline ………………………………………………………….……………….………. 9 Enhanced Digital Maps Project Scope ……………………………………………………………………………………… 10 Activities & Accomplishments …………………………………………………………… 10 Timeline ………………………………………………………...………………………… 18 Forward Collision Warning Requirements Project Scope ……………………………………………………………………………………… 19 Activities & Accomplishments …………………………………………………………… 19 Timeline ………………………………………………………….……………….………. 27 Vehicle Safety Communications Consortium Scope……………………………………………………………………………………… 28 Activities & Accomplishments …………………………………………………………… 28 Timeline ………………………………………………………….……………….………. 40 References ………………………………………………………………………………. 41

3
PROGRAM OVERVIEW Ford Motor Company and General Motors Corporation formed the Crash Avoidance Metrics Partnership (CAMP) in 1995. The objective of the partnership is to accelerate the implementation of crash avoidance countermeasures to improve traffic safety by defining and developing necessary pre-competitive enabling elements of future systems. CAMP provides a flexible mechanism to facilitate interaction among additional participants as well, such as the US DOT and other OEMs, in order to execute cooperative research projects. The CAMP Intelligent Vehicle Initiative (IVI) Light Vehicle Enabling Research Program brings together seven light-vehicle OEMs and a major automotive supplier to work cooperatively with the United States Department of Transportation (US DOT) on four separate pre-competitive projects. A single cooperative agreement covering all four projects spans 42 months beginning April 1, 2001 for a total program cost of $25,185,882. Each project involves a different subset of participants. CAMP’s role is to manage the agreement, coordinate overall activities and provide program administration support to each of the projects. Three CAMP Intelligent Vehicle Initiative (IVI) Light Vehicle Enabling Research Program projects were initiated during the prior program year, and were continued during this year: The Driver Workload Metrics Project brings together Ford, General Motors (GM), Nissan Technical Center North America (NCTNA) and the Toyota Technical Center (TTC) to work cooperatively with the National Highway Traffic Safety Administration (NHTSA). The goal of this project is to develop metrics and test procedures that assess driver performance degradation related to driver workload from telematics systems. The Enhanced Digital Maps Project brings together DaimlerChrysler Research and Technology North America (DCRTNA), Ford, GM, TTC and Navigation Technologies (NavTech) to work cooperatively with the Federal Highway Administration (FHWA) and the NHTSA. This effort is examining the feasibility of expanding the content and / or enhancing the resolution of present digital maps as an enabling technology for various collision avoidance systems. The Forward Collision Warning Requirements Project is being conducted by Ford and GM in cooperation with the NHTSA. Driver performance and alert function / interface requirements associated with rear-end crash scenarios are being examined in proving grounds testing of naive subjects under a wide variety of conditions which include time of day, lead vehicle deceleration profile, last-second lane change maneuvers and a variety of secondary distractions. In addition, testing is being conducted on the National Advanced Driving Simulator (NADS) to examine the correlation between driver’s responses on a track and in the simulator, and to expand the scope of the database beyond that possible using controlled proving grounds testing.

4
The Annual Report for the CAMP Intelligent Vehicle Initiative (IVI) Light Vehicle Enabling Research Program for the previous Program year may be found at: http://www-nrd.nhtsa.dot.gov/pdf/nrd-12/CAMPS.pdf In addition to the three projects that were begun in the prior reporting period, during this program year a fourth CAMP Intelligent Vehicle Initiative (IVI) Light Vehicle Enabling Research Program project was initiated. The Vehicle Safety Communications project brings together BMW, DCRTNA, Ford, GM, Nissan, Toyota and VW to work cooperatively with the FHWA and the NHTSA. The Vehicle Safety Communications (VSC) Project is a two-year program to identify vehicle safety applications enhanced or enabled by external communications, determine their respective communications requirements, evaluate emerging 5.9 GHz DSRC vehicle communications technology and influence proposed DSRC communications protocols to meet the needs of vehicle safety applications.

Driver Workload Metrics Project
5
PROJECT SCOPE The objective of the Driver Workload Metrics project is to develop practical, meaningful, and repeatable metrics and test procedures to assess in-vehicle task demands on drivers. These metrics and test procedures may be used by Original Equipment Manufacturers (OEMs) to estimate in-vehicle task demands during product development. This information might be used, for example, to decide which in-vehicles tasks a driver might reasonably be allowed to access and perform while driving. The project consists of five tasks. Task 1 (completed) set the stage by means of a literature review on criterion measures and methods with which to characterize driver workload; candidate models, simulations, and laboratory metrics and methods that might serve as practical, meaningful, and reliable surrogates for the criterion methods and measures obtained in driving; candidate in-vehicle tasks that span the range of driver demands to which metrics and methods should be responsive; and test scenarios. Task 2 (under way) focuses on the development of workload metrics and methods through laboratory, on-road, and test track testing. Task 3 (not yet started) will validate the practicality, meaningfulness, and reliability of the proposed metrics and methods by use of a new sample of test participants, new tasks, and new evaluators without extensive prior exposure to this project. Task 4 will document the workload metrics and methods for use by OEMs and others. Task 5 is a project management task. ACTIVITIES AND ACCOMPLISHMENTS During the period of performance from April 1, 2002 to March 31, 2003, the following activities and accomplishments took place, as part of Task 2: • Completion of nine instrumented vehicles (three platoons of 3 vehicles each), • Development of a laboratory facility with 4 test stations for task training and
surrogates testing, • Selection and development of a set of in-vehicle tasks for study, • Extensive pilot testing to verify procedures and methods, and • Data collection activities Each of these will be discussed in turn. Vehicle Instrumentation: The instrumentation of three platoons of three vehicles each was completed. These instrumented vehicles provide state-of-the-art data acquisition for lane keeping, car following, driver eye glance behavior, and object-and-event detection performance while driving on public roads or on a test track. Digital video is also recorded of the road scene around the subject vehicle as well as of the vehicle interior and of the driver's face for manual data reduction when needed. The subject vehicle in each platoon is most heavily instrumented; lead and follow vehicles are lightly instrumented. This instrumentation task was challenging due to the

Driver Workload Metrics Project
6
complexity of the instrumentation and the necessary interactions between vehicles within a platoon. For example, testing revealed an issue with overheating in the trunk under summer temperatures and a special cooling system was created and installed. Sensor operation and integration into the data acquisition system was more complex than originally expected. An eye tracker system was procured for each platoon but will not be fully integrated until on-road testing scheduled for May 2003. Data acquisition software was tested extensively and needed changes were identified. Data reduction software for both laboratory and on-road data collection has either been completed or is under development. Laboratory Facilities: CAMP developed a laboratory facility for training and surrogates testing. The facility contains four cubicles, or stations, surrounded by sound-attenuating material. The surrogates that will be evaluated are:
1. Static task completion (i.e., in-vehicle tasks performed alone and without additional concurrent task demands imposed on the test participant),
2. Peripheral detection task (i.e., in-vehicle tasks performed while the test participant watches for and responds to a brief light stimulus),
3. Sternberg∗ memory task with spatial stimuli, 4. Sternberg* memory task with verbal stimuli, 5. Visual occlusion (i.e., in-vehicle tasks performed while wearing goggles that
periodically open and shut, occluding vision to the task), 6. Peripheral detection task performed during simulated driving, and 7. Driving a low-cost, part-task simulator (i.e., in-vehicle tasks performed while the
participant concurrently drives a car-following scenario).
∗ The Sternberg memory task is a paradigm for investigating how information is retrieved from
working memory. This methodology has previously been used as an indicator of operator workload.
See Wickens, C. D., Hyman, F., Dellinger, J., Taylor, H., and Meador, M. (1986). The Sternberg
memory task as an index of pilot workload. Ergonomics, 29(11), 1371-1383.
In the Sternberg task as implemented by CAMP, the test participant first memorizes a set of three
spatial (road geometry signs) or three verbal (route number signs) stimuli. This is known as the
memory set. After storing the memory set in working memory, the in-vehicle task is introduced and
started. During in-vehicle task execution, probe stimuli (e.g., a single route number sign, a single road
geometry sign) are presented one at a time on an LCD display. Following each probe, the participant
decides whether or not the probe was or was not contained in the memory set and responds "yes" or
"no" accordingly by means of button presses. Typically, half of the probes are contained in the
memory set and require positive or "yes" responses, the other half of the probes require "No"
responses. Reaction time, accuracy of response, and number of missed (non-responded) probes may
be measured.

Driver Workload Metrics Project
7
Individual stations are equipped with a test buck consisting of a steering wheel, floor-mounted pedals, and adjustable power seat. Each station is a fixed-base, part-task driving simulator with scenes projected onto a wall-mounted screen in front of the test participant during the simulated driving runs. In addition, a mock-up of a vehicle console and instrument panel center stack were fabricated for each cubicle, and installed to the right of the steering wheel and pedals. An initial set of 14 in-vehicle activities was selected for testing (described below). Devices were installed and electrically connected in the center stack. These devices included a heating, ventilation, and air-conditioning control unit, a radio/cassette unit, a radio with CD player, and an after-market navigation system. In addition, a “flip-phone” style cellular phone with headset and voice access for use in the voice-dialing tasks was selected for use in the study. The cell phone was placed on the mock center console, along with a cup holder containing coins, and a cassette tape in its case. All test stations have headsets for managing noise. Also, an MP3 player is provided for each cubicle for use in playing instructions and task materials to the test participants. Test cubicles have also been equipped with several surrogate test set-ups, each with custom software to run them from PCs or laptops. Some of the features of the surrogate test set-ups include: • STISIM Drive software for generating the simulator scenarios; • Visual occlusion goggles for running occlusion trials; • A 6-inch, high-resolution, color LCD display for presenting stimuli in the Sternberg
trials; • Custom timing software for running static completion time trials; • High-intensity LEDS for presenting peripheral detection task (PDT) stimuli on the
projection screen; and • An evaluator’s workstation with controls for all computers, procedures manuals, and
any paper-and-pencil materials that might be needed for testing. A small room inside the laboratory was equipped with a vision tester and work surfaces for administering various paper-and-pencil health/medical screeners, individual differences tests, and subjective evaluation questionnaires. In-Vehicle Tasks and Protocols: A variety of tasks have been developed for use in Task 2 testing, including training and test protocols, and the materials themselves. An initial set of 13 in-vehicle tasks plus a null "just driving" task were prepared to span a range of visual-manual, auditory-vocal, spatial, and verbal task types. Visual-manual tasks included coin selection, HVAC adjustment, two radio-tuning tasks (each with a different number of steps), dialing home on a hand-held cell phone, dialing home digit-by-digit by voice, and inserting a cassette. Auditory-vocal tasks included listening to a sports broadcast for a specific team's performance, listening to and summarizing a book-on-tape (two-minute mystery), engaging in biographical question-and-answer dialogue, performing mental trip computations (e.g., total miles traveled across multiple legs of a trip), recalling spoken routing instructions, and indicating one's cardinal direction of travel given directions to

Driver Workload Metrics Project
8
turn right or left. These tasks have recently been expanded with additional tasks that include: entering a destination into a navigation system, obtaining flight information from an interactive voice response system (IVR), inserting a specified CD and playing a specified track number, tracing a route from a point of origin to a point of destination, reading text (both shorter and longer text passages), searching maps as well as performing "just" the primary testing tasks (e.g., PDT, Sternberg, just simulated driving). These tasks provide a wide range of demands to measure. Pilot testing: The purpose of the pilot data study was to evaluate and revise data collection methods, materials and equipment intended for Task 2 data collection. On-road and static surrogate testing commenced in September 2002. From September through October, 30 participants were tested. During this period, equipment, procedures, and staff training were reviewed, evaluated and, in many cases, modified. In addition, NHTSA personnel were able to participate and critique the equipment and protocols as well. The pilot study exposed that some fundamental aspects of the data collection and experimental design needed to be restructured to achieve the necessary data quality. Therefore, data collection and testing was halted on October 23, 2002, to allow the necessary revisions to be thoroughly developed and implemented. Numerous hardware, software, and procedural improvements were identified and implemented. A revised data collection strategy was developed that increases the number of test participants overall. It provides for between-subjects testing in laboratory, on-road, and test-track venues (rather than attempting to do everything within a single participant’s data collection period). A one-in-reserve strategy was implemented for instrumented vehicles so as to increase CAMP's ability to respond to any equipment or software problems with immediate replacement if needed. Data Collection Activities: Laboratory data collection (N=56 test participants) began in March 2003 and will conclude in early May, 2003. On-road testing (N=98 test participants) will commence in late May, 2003 and be completed by early August, 2003. Test track testing (N=56 test participants) is slated to begin in mid-August, 2003 and conclude by September 30, 2003. All Task 2 data collection will be completed by September 30, 2003. Data analysis and report writing will be ongoing with a targeted completion date of December 2003.

DR
IVER
WO
RK
LOA
D M
ETRIC
S PRO
JECT SC
HED
ULE
9

Enhanced Digital Maps Project
10
PROJECT SCOPE The Enhanced Digital Maps Project brings together DaimlerChrysler Research and Technology North America (DCRTNA), Ford, GM, Navigation Technologies (NavTech) and the Toyota Technical Center (Toyota). The Enhanced Digital Map (EDMap) Project is a three-year effort launched in April, 2001 to develop a range of digital map database enhancements that enable or improve the performance of driver assistance systems currently under development or consideration by U. S. automakers. This effort is examining the feasibility of expanding the content and / or enhancing the resolution of current digital maps as an enabling technology for various collision avoidance systems. Digital map navigation may be able to act as an additional sensor for various driver assistance systems, providing information about the vehicle’s relationship to the roadway infrastructure that is not feasible to obtain with other sensors such as radar or computer vision. It will not preclude the need for these other sensors, but may add a necessary component for successful implementation of future systems. The project began with identification of safety related applications, from near term to long term that would benefit from or be enabled by map database improvements. The map database requirements for each application were then determined using feedback from the map database supplier with regard to data collection feasibility and database maintainability. Using the application requirements, the map database supplier is constructing map databases for two specified test areas. The participating automakers will each evaluate and demonstrate implementations of selected driver assistance systems in 2003 and early 2004. The results of this effort will provide direction to map suppliers regarding enhancements needed to enable future driver assistance systems and establish the preliminary technical and commercial feasibility of generating and maintaining these enhancements. During the first program year, Task 1 – Identify Safety Applications, Task 2 – Application Attribute Requirements, Task 3 – Determine Final Demonstration and Task 8a – Deployment Analysis were completed. During this program year, Task 4 –Data Collection and Maintainability, was completed and significant progress was made on Task 5 – Test Site Mapping and Task 6 – Demonstrator Vehicles. ACTIVITIES & ACCOMPLISHMENTS TASK 1 – IDENTIFY SAFETY APPLICATIONS In Task 1, near and mid term applications that would be enabled or enhanced with a map database and having significant safety potential were selected for the near term (2004-2006) and in the mid term (2007-2011): Near Term: Speed Limit Advisor, Curve Speed Warning, and Stop Sign Warning Mid Term: Curve Speed Control, Stop Sign Control, Forward Collision Warning, Lane Following Warning, and Traffic Signal Warning.

Enhanced Digital Maps Project
11
For each of the applications, map database derived information, called mapplets, were defined based on the application requirements. The mapplet specifications were then used to drive the processes needed to build the EDMap databases. Near term applications can be supported by databases with information at the road level of granularity, the granularity of current navigation level databases. For example, navigation and near term databases represent geometry as the centerline of the road in the case of a two lane road and the centerline of each side of the road in the case of a multi-lane divided highway. The attribution for near term databases became more definitive compared to navigation databases, but remained at the road level. For example, navigation databases store speed ranges and a range for the number of lanes to determine traversal time estimates. Near term databases store actual speed limits and the exact number of lanes, still as road attributes. Stop sign attributes are not in today's navigation level database, and have been added for near term database requirements. Mid term applications such as Lane Following Warning and Forward Collision Warning, require a database with increased accuracy and information at a lane level of granularity. For example, mid term applications require information about the centerline and width of each lane so that position in the lane can be determined. Mid term databases require lane centerline representation with the precision and accuracy at the decimeter level. Storing lane information not only requires road type attributes about each lane, but also requires additional attributes, such as lane striping and shoulder information that were not required at the road level. TASK 2 – DETERMINE APPLICATION ATTRIBUTE REQUIREMENTS The main output of this task was an engineering evaluation of the map database and positioning requirements for the applications identified in Task 1. Fifty-three instances of map-derived information (mapplets) were identified to support the set of safety related vehicle applications. Near-term mapplet requirements are a superset of currently planned map database enhancements. Mid-term mapplets specify lane level instead of road level geometry and attributes. This is a significant change over the near-term database. Long-term mapplets are similar to that of the mid-term, but have higher accuracy constraints. An example of the requirements for a Stop Sign Assistant Application: The following is an attempt to identify the map related requirements for an SSA (Stop Sign Assistant) warning application in the “Near-Term” 2004 - 2006 timeframe, and a control application in the “Mid-Term” 2006 - 2010 timeframe as well.
Positioning Requirements
Assumption • Driving speed: 55 MPH (88Km/h) 24.444m/s - Maximum speed at non-posted section • Maximum Deceleration: 0.3G (2.94m/s2)

Enhanced Digital Maps Project
12
• Stop line width: 0.3m • Stop line offset: 3m
Positioning Requirements for Stop Sign Assist (Warning)
• Absolute map position error in longitudinal direction: 1m • Vehicle positioning error in longitudinal direction: 5m • 10Hz data update rate will cause up to 2.5m additional errors.
Positioning Requirements for Stop Sign Assist (Control)
• Absolute Map position error in longitudinal direction: 0.3m • Vehicle positioning error in longitudinal direction: 0.5m • GPS outage error: 0.1m (in last 10s prior to reaching the stopping point) • Brake Actuator Response delay: 100ms 2.5m at 24.444m/s • Data update rate will directly relate to the response delay. At least 50Hz is expected. An example of the requirements for a Traffic Signal Assistant Application:
Positioning Requirements for Traffic Signal Assistant
For finding the traffic signal with its known position, the positioning system should have an accuracy of 1m to 2m. It is important to achieve this positioning reliably, even in cities with high buildings around. Road/Lane Attributes Traffic Signal Location
For a vision-based Traffic Signal Assistant there are three problems to solve. The first is to find all traffic signals at an intersection. After finding the signal, a direction/lane has to be connected to each signal and then the color of the signal has to be determined. Various statistical pattern classification algorithms can solve the last problem. For the first and second problem, a highly accurate digital map is valuable. A vision system can search for traffic signals on its own, but there is no guarantee that it will find them all. In addition, it is very difficult to determine which traffic signal is responsible for which direction. The digital map should provide the x/y position (lateral/longitudinal) of all traffic signals. The accuracy needed in the x-direction is 2m, and in the y-direction 3m. The restriction for the accuracy is in the order of the traffic signals: the relative position of the traffic signals has to be retained. Based on these accuracy requirements the vision system can

Enhanced Digital Maps Project
13
extract the needed information very well and therefore it is possible to classify the status of the signal reliably. There is no need in providing the height of the signal. With the x/y position, the area to search for the signal is already very small, so it should be possible to determine the z position automatically. Each traffic signal should be connected to a lane and/or driving direction. In addition, it is very useful to know especially about left turn signals, when the driver has to yield for oncoming traffic. A green arrow within the traffic signal usually provides this information. However, with today’s camera technology it is almost impossible to see the difference between a plain green light and green arrow. Therefore, this should be included in the map as well. An example of the requirements for an Intersection Collision Avoidance System (ICAS) Application:
Positioning Requirements for ICAS
The infrastructure is stationary but vehicles are not, therefore, positioning requirements should be a concern for vehicles. ICAS assists in avoiding “inattentive” or “aggressive” driving. To do so, the ICAS will transmit warnings/control commands to vehicles to stop/reduce speed and/or control the drive path when the vehicle is likely to run past defined stopping locations or likely to get into a collision. The functionality of the ICAS is quite similar to the “Stop Sign Assistant (Control)” in terms of making a stop. The key difference is the interaction with the infrastructure. Regarding communication capability, shorter communication latency would be required (ex. the distance traveled in 20ms corresponds to 0.2m when driven at 40km/h (25MPH)). Summary of Vehicle Positioning Requirements Vehicle Positioning Accuracy:
Longitudinal absolute positioning error for ICAS: • Less than 0.5m for control Lateral absolute positioning error for ICAS • Less than 0.2m for control GPS outage error:
• Less than 0.1m for control Data update rate: • at least 50Hz Communication latency:

Enhanced Digital Maps Project
14
• less than 20ms (at least 50Hz) Road/Lane Geometry The travel distance to the stopping point or road signs could be obtained from this attribution. The ICAS is capable of providing precise lane guidance. Lane-by-lane representations of each mapplet would be required because restrictions are lane dependent. The centerline represents the lane. Expected absolute accuracy: • 0.3m TASK 3 – DEFINE FINAL DEMONSTRATION Two key deliverables were established in Task 3. The first was the selection of the specific applications that will be demonstrated. The applications come from near and mid-term time periods, and represent good coverage of applications that were identified as having high safety potential in Task 1. Demonstration applications include Stop Sign Assist (warning) and Curve Speed Assist (warning) from the near-term grouping and Stop Sign Assist (control), Curve Speed Assist (control), Traffic Signal Assist (warning), Lane Following Assist (warning) and Forward Collision Warning from the mid-term grouping. Several applications are in family form, i.e., both warning and control modes. The second deliverable was the definition of the test site areas to be mapped, one located in southeast Michigan and one in Palo Alto, California. Test area statistics such as miles of road and percentage of varying levels of road curvature were generated. Details of the test areas to be mapped were selected in order to provide suitable test scenarios for each of the selected demonstration applications and to explore the issues of Map database collection techniques and scalability. SECOND PROGRAM YEAR With the completion of application mapplet and test area requirements, the EDMap team goals for the second program year were to build the actual map databases, and develop the vehicle applications. For the second program year, the EDMap project has worked on Tasks 4, 5, and 6. Navigation Technologies is the lead on Task 4, Data Collection and Maintainability, a mostly analytical task that involves map database structure, collection and maintainability topics. Task 5, Test Site Mapping, is the database collection task, and involves development of data collection tools, the actual data collection, and compilation of the collected data into the structure to support the mapplets defined in Task 2. Task 6, Demonstrator Vehicles, is the OEM task of developing and implementing the vehicle demonstration applications.

Enhanced Digital Maps Project
15
TASK 4 – DATA COLLECTION AND MAINTAINABILITY The approach taken for Task 4 is to analyze each step of the database creation process, shown in the diagram above, from the perspective of creating near and mid term
databases and to determine the most cost effective and scaleable means for the execution of each process step. The effort to produce the safety-purposed near and mid term map databases at each process step will be measured relative to the effort to produce today’s commercially available navigation-purposed map databases, to gain an initial perspective of the relative costs to build databases to support the identified safety applications. Input and collection candidates were categorized as Mobile Mapping, Probe Data, and Remote Sensing. Mobile Mapping is characterized by the use of vehicles specially equipped with DGPS and positioning sensors, along with a trained analyst operating a mobile mapping workstation. Probe Data refers to the use of passive sensors and recording devices on consumer/fleet vehicles; data collection does not require interaction with the driver, nor operation by trained personnel. Remote Sensing is used to describe any number of image sources from satellite or aerial sources, such as photography, LIDAR, radar, etc. A significant part of Task 4 is a study of the maintainability of the various EDMap database entities & attributes. During this Task, a maintainability analysis is being performed covering each of the EDMap database attributes. The investigation will cover reasons that map data becomes out of date, and also methods for detecting that changes have occurred in the real word that need to be reflected in the database. TASK 5 – TEST SITE MAPPING During this program year, a substantial portion of the near-term database was delivered to the OEMs. A small section of the mid-term database has been distributed as well.
ImageProcessing
tools
Probe Data Analysis
Mobile MappingData
Edit Tool
Geodatabase
OEMApplication
CAN Bus
Collection Processing DeliveryInputs
Da t
abas
e AP
I
In-VehicleDatabase
ImageProcessing
tools
Probe Data Analysis
Mobile MappingData
Edit Tool
Geodatabase
OEMApplication
CAN Bus OEMApplication
CAN Bus
Collection Processing DeliveryInputs
Da t
abas
e AP
I
In-VehicleDatabase
Dat
abas
e AP
I
In-VehicleDatabase

Enhanced Digital Maps Project
16
Completion of these two databases was originally anticipated by the end of the second program year. However, the unexpected difficulty in collecting, processing and editing this information (as discussed in Task 4) has delayed the completion of this task. TASK 6 – DEMONSTRATOR VEHICLES In this program year, OEMs continued intensive work on the demonstrator vehicles and applications. Much of the application development is proprietary; therefore, reporting is limited at this time. At the end of this program year, development of the near-term applications was nearly completed. Effort will continue in the next program year on the mid-term applications, partially due to the current unavailability of the mid-term database (see the Task 5 discussion above). Some common Task 6 activities were:
Database Mapplet Access
The mapplet interface that connects the map database to the vehicle applications is a common capability the team completed this program year. The mapplet interface involves both Navigation Technologies (Task 5) and the OEMs (Task 6). On the database side, the database access application called ADASRP (Advanced Driver Assistance System Research Platform) is being modified by Navigation Technologies in order for all the mapplet specific data to be transmitted from the ADASRP to the OEM vehicle applications.
Both near-term and mid-term ADASRP message structure and content was completed in this program year. The OEMs and NavTech worked together to define key components of the lane level map representation required of mid-term applications. It is important to note that lane level constructs require a significant advance in map databases and map database access tools.
Base Stations
CAMP, DCX, Ford, GM and Toyota have established dual frequency base stations. A cell phone modem method of transmitting and receiving DGPS corrections, used at DCRTNA, was selected for use in EDMap. Multiple vehicle functionality for the cell modem correction transmission scheme was rolled out across the four base stations in the southeast Michigan test site area (one at Toyota, GM Research, Ford Research, and CAMP). A network survey using Continuous Operating Receiver Sites (CORS) and network processing software was conducted to determine base station antenna locations across the four southeast Michigan base station sites. The result is 1 cm confidence in the base station position.

Enhanced Digital Maps Project
17
Honeywell Inertial Navigation System (INS)
The mid-term applications are utilizing a positioning system from Honeywell. This system is expected to satisfy the mid-term positioning requirements (lane-level), yet be vehicle affordable in the mid-term. The high-accuracy, reduced cost system relies on a silicon micro machined inertial measurement unit (IMU). This technology is controlled by the US State Department ITAR export restrictions. Nevertheless, all program participants were able to gain access during this program year. Honeywell INS installation is complete for the six units (one to each OEM and two to NavTech) with each sensor having been mounted in vehicles. In this program year, the OEMs and NavTech began real-time operation and data collection. Some amount of INS fine tuning remains to be done by Honeywell/Novatel before the INS is complete and "ready" to be used by the EDMap team.

ED
MA
P PRO
JECT SC
HED
ULE
18

Forward Collision Warning Project
19
PROJECT SCOPE Ford and GM are conducting the Forward Collision Warning Requirements Project in cooperation with the NHTSA. This project extends the work completed in 1999 under a previous CAMP / NHTSA Cooperative Agreement1. Utilizing the ‘surrogate target’ methodology developed in the first program, driver performance and alert timing / interface requirements associated with rear-end crash scenarios are being studied in proving grounds testing of naive subjects to examine effects associated with last-second lane change maneuvers, alert presence, number of alert stages, auditory alert type, false alarm presence/number of false alarms, distraction type, vehicle-to-vehicle kinematic conditions, lead vehicle deceleration profile, time of day, driver age, and driver gender. In addition, testing is being conducted on the National Advanced Driving Simulator (NADS) to examine the correlation between driver’s responses on a track and in the simulator, and to expand the scope of the database beyond that reasonably possible using controlled proving grounds testing. ACTIVITIES & ACCOMPLISHMENTS During this program year: • The first closed-course study, Task 1, Refining the CAMP Crash Alert Timing
Approach by Examining “Last-Second” Braking and Lane-Change Maneuvers Under Various Kinematic Conditions, was completed.
• Data collection for the second closed-course study, Examining the Robustness of the CAMP Recommended Minimum Crash Alert Timing Approach, Last-Second Maneuver Behavior Under Simulated Surprise Conditions, and Time-to-Collision Judgments was underway.
• Data collection for Task 4, the first study involving the NADS, Simulator Replication of Baseline Data, was also underway.
TASK 1: REFINING THE CAMP CRASH ALERT TIMING APPROACH BY EXAMINING “LAST-SECOND” BRAKING AND LANE-CHANGE MANEUVERS UNDER VARIOUS KINEMATIC CONDITIONS A final report documenting the Task 1 efforts was recently completed, and is publicly available as a DOT Task 1 Final Report. It may be found at: http://www-nrd.nhtsa.dot.gov/pdf/nrd-12/HS809574Report.pdf A summary of this work is provided below. The Task 1 study builds upon the foundation provided by the human factors work conducted in the previous Crash Avoidance Metrics Partnership (CAMP) / NHTSA Forward Collision Warning system program. This task is aimed at evaluating and refining the preliminary crash alert timing approach developed in the previous CAMP Forward Collision Warning (FCW) project under a wider range of conditions. This task

Forward Collision Warning Project
20
employed the surrogate target (closed-course) methodology developed in this previous program. This methodology allows experimenters to safely place naive drivers in realistic rear-end crash scenarios on a closed test track and observe their behavior. The surrogate target consists of a molded composite mock-up of the rear half of a passenger car mounted on an impact-absorbing trailer that is towed via a collapsible beam. The surrogate target is able to absorb impacts of up to 10 miles per hour velocity differential without sustaining permanent damage. In developing a FCW crash alert timing approach, two fundamental driver behavior parameters should be considered. These parameters serve as input into vehicle-to-vehicle kinematic equations that determine, given a set of assumptions, the alert range necessary to warn the driver to avoid a potential crash. The first driver behavior parameter is the time duration required for the driver to respond to the crash alert and begin braking, referred to as driver brake reaction time. (This brake reaction time assumption is added to other system delay times, such as interface delay times and brake system delay times.) This parameter was developed in the previous CAMP FCW work under conditions in which drivers experienced an unexpected, or surprise, rear-end crash scenario. The second driver behavior parameter needed for a crash alert timing approach is the driver deceleration (or braking) behavior in response to the FCW alert under a wide range of vehicle-to-vehicle kinematic conditions and scenarios. This parameter was developed in the previous CAMP FCW work under conditions in which alerted drivers made last-second braking maneuvers. Continuing to develop this second fundamental driver behavior parameter for FCW crash alert timing was the focus of the Task 1 study. Unlike the previous CAMP FCW human factors work, Task 1 examined not only “last-second” braking, but also “last-second” steering (or lane-change) maneuvers. Drivers performed last-second braking maneuvers using two different braking instructions. The first instruction asked drivers to maintain their speed and brake at the last second possible in order to avoid colliding with the target using “normal” braking intensity or pressure. The second instruction asked drivers to maintain their speed and brake at the last second possible to avoid colliding with the target using “hard” braking intensity or pressure. Similarly, drivers performed last-second steering maneuvers using two different steering instructions. The first instruction asked drivers to maintain their speed and change lanes at the last second they “normally would to go around the target”. The second instruction asked drivers to maintain their speed and change lanes at the last second they “possibly could to avoid colliding with the target”. This strategy of varying instruction during these last-second maneuvers was taken so that drivers’ perceptions of “normal” and “non-normal” kinematic situations (or envelopes) could be properly identified and modeled for crash alert timing purposes. In addition, unlike the previous CAMP work which only examined lead vehicle stationary and lead vehicle braking scenarios, the current study also included kinematic scenarios where the lead vehicle was moving at a slower but constant speed prior to the last-second maneuver. Finally, it should be noted that the current data set was gathered at the Transportation Research Center in East Liberty, Ohio, whereas previous work was conducted at the GM Proving Ground in Milford, Michigan.
Forward Collision Warning Project
21
There were two key findings that emerged from the observed last-second maneuver (braking and steering) onset behavior. First, the differences observed in last-second braking behavior as a function of test site (Milford Proving Ground versus Transportation Research Center), age (20-30, 40-50, and 60-70 year olds), and gender (male, female) were relatively small in magnitude. Second, differences were observed between last-second braking onsets and last-second steering onsets, and these differences clearly indicate that the relative timing of last-second braking onsets versus last-second steering onsets is highly dependent on the kinematic conditions. Under nearly all 60 MPH conditions examined, mean steering onsets when drivers were instructed to change lanes at the last second possible tended to occur later (i.e., were more aggressive) than mean braking onsets when drivers were instructed to brake at the last second possible using hard braking pressure. (This difference was not observed under the 30 MPH speed conditions examined.) Furthermore, the magnitude of this effect under the 60 MPH condition increased as the difference in speed between the lead and following vehicles (or delta velocity) increased. These results suggest that an FCW alert timing approach based only on last-second braking situations may result in alerts occurring before some drivers would execute normal (albeit aggressive) lane-change maneuvers. These observed last-second maneuver data were modeled for predicting hard braking onset (or driver deceleration behavior), which as indicated above, is one of two driver behavior parameters needed for a crash alert timing approach. The database modeled includes 3,536 last-second braking judgment trials and 790 last-second steering (or lane-change) judgment trials. Two braking onset models were developed using this database. The first model was developed using linear regression techniques and the second model was developed using logistic regression techniques. The first model developed for predicting hard braking onset is nearly identical to the Required Deceleration Model developed in the first CAMP FCW project. This lack of change in the Required Deceleration Model provides validation for the previous model, and indicates that this model is robust and relatively unaffected by the new vehicle-to-vehicle kinematic conditions that were included in this expanded data set. This model predicts a required deceleration value at brake onset above which the driver is assumed to be in a last-second, hard braking onset (alert appropriate) condition. This model uses as inputs closing speed between the following and lead vehicle, lead vehicle deceleration rate, and knowledge of whether or not the lead vehicle is moving or stationary. The second braking onset model developed is referred to as the “3-Tiered Inverse Time-to-Collision” Model. This model predicts the probability that a driver is in a last-second, “hard” braking onset situation (and hence, not in a last-second, “normal” braking onset situation). This model includes inverse time-to-collision or TTC (i.e., the difference in speeds between the following and lead vehicles divided by the range between these two vehicles) as a key component. The three tiers of the model refer to the three separate equations which were developed for lead vehicle stationary, lead vehicle moving and braking, and lead vehicle moving and not braking cases. Note that this model, unlike the Required Deceleration Model needs only coarse (rather than accurate) knowledge of lead

Forward Collision Warning Project
22
vehicle deceleration. This is a potential advantage of this model since sensing lead vehicle deceleration in an accurate, real-time fashion is technologically challenging. This 3-Tiered Inverse TTC model can be elegantly described as a model that assumes the driver deceleration response (in response to the crash alert) is based on an inverse TTC threshold that decreases linearly with speed. These two models were compared on several criteria, including predictions under “nominal” vehicle-to-vehicle kinematic conditions observed in the database, differences between predicted and observed braking onset values, estimates of the number of predicted hard braking onsets which were considered as either “early” or “late” (based on certain assumptions), and predicted performance under conditions beyond the scope of the current database. Results showed that the new 3-Tiered Inverse TTC Model provided very comparable (and in some cases, more favorable) performance relative to the slightly revised Required Deceleration Model. A domain of validity check performed with a large range of vehicle-to-vehicle kinematic conditions beyond the current database also showed both models behaved very comparably and “sensibly” (e.g., predicted required deceleration values at braking onset were less than 0.45 g’s, with the exception of some extreme kinematic conditions). The newly developed 3-Tiered Inverse TTC Model offers the advantage of the greater flexibility afforded by operating in the “probability of hard braking onset” domain, since the “probability of hard braking” value inherent to this model can be altered in a straightforward manner with relatively clear supporting underlying rationale. This value could be potentially altered to address driver characteristics, weather and environmental conditions, and potential nuisance alerts during normal, intentional lane-change maneuvers. Finally, although the Required Deceleration Model may perform comparably from a predictive sense, additional considerations suggest the 3-Tiered Inverse TTC Model may better represent the underlying mental process drivers use in deciding when to brake hard. TASK 2: EXAMINING THE ROBUSTNESS OF THE CAMP RECOMMENDED MINIMUM CRASH ALERT TIMING APPROACH, LAST-SECOND MANEUVER BEHAVIOR UNDER SIMULATED SURPRISE CONDITIONS, AND TIME-TO-COLLISION JUDGMENTS The team reviewed the closed-course testing originally planned for Tasks 2, 3, and 5, and in light of recent progress in FCW technology, concluded that it was no longer an efficient or best use of resources. Hence, a revised Task 2 closed-course work plan was created, reviewed, and approved by the DOT. Data collection for Task 2 is ongoing, with portions of data collection completed (which are explained below). The Task 2 study has two major goals. Similar to Task 1, these goals are being addressed under closed-course conditions employing the surrogate target methodology developed in the first CAMP FCW Project.

Forward Collision Warning Project
23
The first goal of Task 2 is to address the extent to which a wide range of factors impact the effectiveness of the CAMP recommended “minimum” (i.e., most imminent) alert timing approach for an FCW system. The factors which are being explored include alert presence, number of alert stages, auditory alert type, false alarm presence/number of false alarms, distraction type, vehicle-to-vehicle kinematic conditions, lead vehicle deceleration profile, time of day, driver age, and driver gender. The alert timing approach employed was based on the Required Deceleration approach developed in the first CAMP FCW Project and slightly revised under Task 1 of the current FCW project. In order to address this first goal of Task 2, the Surprise Trial Methodology Technique fruitfully employed in first CAMP FCW Project was used. In this technique, the driver is distracted intentionally by the experimenter immediately prior to an unexpected rear-end crash scenario, which inevitably leads to an FCW alert presentation. The key driver performance measures examined during these trials include passenger-side experimenter brake assists, driver brake RT to the alert, (constant) required deceleration level to avoid impact at brake onset, TTC at brake onset, time headway at brake onset, peak deceleration throughout the maneuver, alert timing rating, and alert noticeability. The major impetus for this work is ensuring that the CAMP recommended “minimum” alert timing approach continues to remain effective under a wider range of conditions than were previously examined in the first CAMP FCW Project. Furthermore, this data will be used to assess the degree to which knowledge of a subset of the factors described above would be useful for modifying the CAMP “minimum” recommended alert timing. Data collection for this portion of Task 2 is completed, and analysis of these results is currently underway. The second goal of Task 2 is to provide a useful set of data for comparison purposes for work conducted in the NADS as part of the Task 6 effort planned under this project. Since NADS will be used as a tool for examining the effectiveness of FCW systems (as well as other crash alert systems), it is important to understand how driver behavior and judgments compare under on-road versus NADS conditions. An important strength of NADS is that it provides a tool for examining driver behavior under more complex traffic and crash scenarios than may be possible to logistically or safely stage under on-road conditions. However, before complex driving scenarios are used in NADS for FCW system evaluations, it is important to gain a more fundamental understanding of the relationship between on-road and NADS data under relatively simple rear-end crash scenarios. These simpler scenarios can be used as a starting point for understanding how driver’s perception of the forward roadway scene in the simulator (which has reduced visual cues relative to real-world scenes) impacts the driver’s ability to quickly perceive and interpret the scene (e.g., the looming properties of the lead vehicle), project vehicle-to-vehicle kinematic conditions (e.g., TTC), decide on an appropriate crash avoidance maneuver (e.g., steer or brake), and decide the onset and aggressiveness of the last-second, crash avoidance maneuver. In order to address this second goal of Task 2, two different experimental techniques will be employed, both which involve use visual occlusion devices. The first technique

Forward Collision Warning Project
24
employed, the TTC Judgment Occlusion Technique, involves occluding the driver’s vision during various in-lane approaches to a lead vehicle under a wide range of vehicle-to-vehicle kinematic conditions. The driver’s vision is clear (or “open”) during the initial phase of this in-lane approach, and then is occluded via liquid-crystal shutter glasses worn by the driver the latter phase of this approach. After this visual occlusion, the driver’s task will be to press a button at the instant they feel that they would have collided with the vehicle ahead (i.e., the driver will be asked to provide a TTC judgment). The driver’s vehicle is equipped with both an add-on brake and add-on steering wheel for use by the passenger-side, front seat test driver experimenter. During the driver’s relatively brief visual occlusion period, the passenger-side experimenter will control the steering and braking of the vehicle, and the lead driver will quickly move out of the driver’s lane. Data collection employing this technique is underway, and involves testing subjects who will be evenly divided by age (20-30, 40-50, 60-70) and gender. The driver performance measures examined will include measured TTC and perceived TTC. The second experimental technique employed to address the second goal of Task 2, the Simulated Surprise Occlusion Technique, again involves occluding the driver’s vision during various in-lane approaches to a lead vehicle under a wide range of vehicle-to-vehicle kinematic conditions. However, unlike with the TTC Judgment Occlusion Technique described above, in this technique the driver’s vision is occluded during the initial phase of this in-lane approach via a large vertical occlusion device mounted on the front hood, and then is cleared (or “opened”) during the last phase of this approach. Drivers will experience a wide range of kinematic conditions during these in-lane approaches, and will never experience the exact same condition twice (which should minimize any learning effects across trials). After this vision “opening”, the driver will have to decide as quickly and accurately as possible to brake, steer, or to not brake or steer (i.e., do nothing). Drivers will be encouraged not to brake or steer unless it is appropriate (i.e., they are closing on a vehicle ahead). This vision “opening” will occur at a point that represents when a driver would look ahead if they received an alert while dialing a cellular phone mounted on the center console, which is based on earlier Surprise Trial data from Task 2. This interval is referred to as the alert-look up delay. The timing of the alert which is used in deciding the opening timing (along with the alert-look up delay time) corresponds closely to either the CAMP recommended “minimum” alert timing approach (for braking trials) or observed higher percentile last-second “hard” steering onsets (from Task 1). (Note the CAMP recommended “minimum” alert timing was developed from last-second “hard” braking onset data.) This technique is intended to simulate a “surprised” distracted driver, who immediately following a FCW alert presentation, is suddenly faced with a decision about whether to perform an aggressive maneuver, what type of maneuver to perform, and the degree of the aggressiveness of this maneuver. It is felt this technique will generate driver behavior that is representative of drivers in real world conditions, since a driver is presumed to be alert shortly after the FCW alert is presented under real world conditions.

Forward Collision Warning Project
25
An underlying rationale for this technique is that it is a considerably more efficient means for gathering “Surprise Trial-like” data, since repeated observations can be obtained from a given subject across a number of different experimental conditions (in sharp contrast to the relatively inefficient “single Surprise Trial per subject” approach). Just as importantly, this technique allows assessing for a given driver (as well as across drivers), the robustness of the CAMP recommended “minimum” alert timing approach under a wide range of vehicle-to-vehicle kinematic conditions . Data collection employing this technique has not yet begun, and will involves testing subjects who will be evenly divided by age (20-30, 40-50, 60-70) and gender. The driver performance measures examined with this technique will be similar to those examined with the Surprise Trial Methodology Technique. These measures will include passenger-side experimenter brake assists, maneuver decision RT, maneuver decision accuracy, (constant) required deceleration level to avoid impact at brake onset, TTC at brake onset, inverse TTC at brake onset, time headway at brake onset, peak deceleration throughout the maneuver, and minimum TTC throughout the maneuver. It is anticipated that part of the work employing these two occlusion techniques will be replicated in the NADS for comparison purposes as part of the Task 6 effort. This comparison would be done to systematically assess the extent to which the driver’s ability to quickly perceive and interpret the scene, project vehicle-to-vehicle kinematic conditions (e.g., TTC), decide on an appropriate crash avoidance maneuver (e.g., steer or brake), and decide the onset and aggressiveness of this maneuver differs across simulator versus on-road conditions. TASK 4: INVESTIGATING OF LAST-SECOND BRAKING AND STEERING MANEUVERS ON THE NATIONAL ADVANCED DRIVING SIMULATOR (NADS) The focus of this task is to replicate a subset of the braking and steering scenarios run in Task #1 and the previous CAMP FCW project to better understand the relationship between data obtained on a closed course using the CAMP surrogate target methodology and data obtained with the NADS. This study involves replicating last-second braking and last-second lane-change maneuvers (as described above) under simulated driving conditions using the NADS, and comparing driver behavior and performance to the closed-course results. As mentioned above, assuming there is a reasonable correspondence between these closed-course and NADS findings, further work would be conducted to examine more alert timing and modality issues under more complex rear-end crash scenarios using the NADS in Task #6. The selected subset of last-second conditions includes 34 braking and 22 steering trials (for a total 56) will be completed by each driver. The braking and steering sets are equally divided between normal and last-second braking/steering as described in the Task #1 description above.

Forward Collision Warning Project
26
The virtual environment for this simulated drive consists of a flat, three-lane roadway with lanes that are 4-meters wide. The lanes are be separated by dashed white lines and there are shoulders on both sides of the road. The road surface has a texture that resembles concrete and the cultural features along the roadway are rich enough to give drivers a sense of speed. After schedule delays related to NADS system failures and safety re-certification in the last two quarters of 2002, Task #4 testing began on February 5th, 2003. A total of 72 drivers will participate in this study, equally divided among age group (20-30, 40-50, 60-70) and gender. Results from both Task #2 and Task #4 are being integrated into the Task #6 planning that will include two phases of testing. Phase I: The Task #2 occlusion scenarios will be replicated on the NADS to establish time-to-collision (TTC) results and compare them to the on-road results to determine perception and reaction time correspondence when simulated. Results from these trials will feed into Phase II. Phase II: The focus will be on implementing complex rear-end crash scenarios (such as complex intersections), too difficult to stage on a closed course, but appropriate for the NADS.

FOR
WA
RD
CR
ASH
WA
RN
ING
PRO
JECT SC
HED
ULE
27
Vehicle Safety Communications Project
28
PROJECT SCOPE The Vehicle Safety Communications (VSC) project is a two-year program to identify vehicle safety applications enhanced or enabled by external communications, determine their respective communications requirements, evaluate emerging 5.9 GHz DSRC vehicle communications technology and influence proposed DSRC communications protocols to meet the needs of vehicle safety applications. Seven light-vehicle automobile manufacturers formed the VSC Consortium (VSCC) to participate with the Department of Transportation in this cooperative project: BMW, DaimlerChrysler, Ford, GM, Nissan, Toyota, and VW. The VSC project goals are to: • Estimate the potential opportunity for safety benefits of communication-based vehicle
safety applications in terms of reductions in vehicle crashes and functional years saved.
• Clearly define the communications requirements of selected vehicle safety applications.
• Assess the ability of proposed DSRC communications protocols to meet the needs of safety applications.
• Work with standards development organizations to influence proposed DSRC communications protocols to meet the needs of vehicle safety applications.
• Investigate specific technical issues that may affect the ability of DSRC (as defined by the standards) to support deployment of vehicle safety applications.
• Estimate the deployment feasibility of communications-based vehicle safety applications.
ACTIVITIES & ACCOMPLISHMENTS During this program year, Task 1: Review of Literature and Ongoing Activities, Task 2: Analysis of the DSRC Standards Development Process, and Task 3: Identify Intelligent Vehicle Safety Applications Enabled by DSRC were successfully completed. Task 4: Refinement of Vehicle Safety Application Communication Requirements made very good progress with the development and distribution of DSRC test kits to all VSCC member companies. Task 5: Participation in, and Coordination with, DSRC Standards Committees and Groups has been successful during this program year, having established a good working relationship with the DSRC Standards Writing Group, and provided technical input to the standards development on an ongoing basis. During this program year, the VSC project produced the following significant results: • Determined that vehicle communications is an important enabler for a large number
of vehicle safety applications, and that many of these applications offer significant potential safety benefits.

Vehicle Safety Communications Project
29
• Determined the preliminary communication requirements for these safety applications, and assessed that DSRC appears to have the ability to satisfy these requirements.
• Identified recurring safety-related issues within the DSRC standards development process that need to be favorably resolved in order to ensure that potential future vehicle safety applications are adequately supported. These issues include latency, channel capacity and channel availability associated with the preliminary control channel scheme.
• Established that the two-year time frame for the VSC program was very well synchronized with the expected time line for the development of the DSRC standards necessary to support vehicle safety applications.
• Identified and assembled test hardware in order to provide each VSCC member with two prototype DSRC evaluation units.
• Developed an effective working relationship with the members of the DSRC Standards Writing Group. As a result of active participation, the VSCC has secured substantial and necessary accommodations from the standards group.
• Developed a consensus technical position in relation to the FCC Notice of Proposed Rule Making for 5.9 GHz DSRC that formed the basis for a formal comment to the FCC from the Alliance of Automobile Manufacturers.
The project began with development of a comprehensive list of safety applications that are improved or made possible with external vehicle communications. These applications were then ranked by their anticipated safety benefits and levels of key communications parameters. Top safety applications with significant safety prospects and stressing communications requirements were then selected for further refinement and analysis. Separate subtasks will further define communications parameters via testing or analysis, where current research is lacking. VSCC member companies will build test beds for verification and validation that will consist of Original Equipment Manufacturer (OEM) vehicles and a communications infrastructure. Validated parameters will then be coalesced into a combined set of maximum conditions that DSRC must meet to support specific safety applications. The VSCC will work with the DSRC Standards committees throughout this project to promote and validate protocol limits that satisfy vehicle safety application communication requirements.
TASK 1 – REVIEW OF LITERATURE AND ONGOING ACTIVITIES
This primary objective of this task was to review the existing research results that were utilized to develop DSRC standards. Available documentation on potentially relevant projects involving communications-based vehicle safety applications sponsored by USDOT, State DOTs, automotive OEMs and others worldwide was gathered and

Vehicle Safety Communications Project
30
reviewed. In particular, projects on intersection collision avoidance systems conducted by Veridian, ARINC and the Infrastructure Consortium formed the focal point of this literature review. This task summarized vehicle safety applications that were identified in prior automotive OEM research and assessed their initial communications requirements. Based upon a preliminary analysis of communications requirements, all but one of the applications identified by automotive OEMs, namely “Platooning”, appeared to have at least the potential to be effectively supported by 5.9 GHz DSRC technology. Actual realization of this potential depends upon the future development of the DSRC upper layer protocol and other associated DSRC standards. Task 1 identified recurring safety-related issues within the DSRC standards development process that need to be favorably resolved in order to ensure that potential future vehicle safety applications are adequately supported. These issues include latency, channel capacity and channel availability associated with the preliminary control channel scheme. TASK 2: ANALYSIS OF THE DSRC STANDARDS DEVELOPMENT PROCESS Task 2 provided an assessment of the DSRC standards that have already been developed and an initial evaluation of their impact on the future deployment of vehicle safety applications. Besides the fundamental ASTM lower layer DSRC standard, much more standardization work remains to be done before reliable, inter-operable DSRC systems can be effectively deployed to support vehicle safety applications. The required upper layer standards are being developed within the IEEE subcommittees. A complete roadmap for the entire DSRC standards process, including milestones and interactions between groups, for the entire DSRC standards process, was also developed within Task 2. The IEEE and ASTM subcommittees expect to complete their DSRC standards, including system-level testing and possible resulting revisions, by the end of 2003. The IEEE and ASTM DSRC standards will define the core capabilities of the DSRC systems. These core capabilities must support the basic communications requirements of vehicle safety applications. Development activities for standards to integrate DSRC equipment into vehicles, and standards that directly define DSRC-based vehicle safety applications, are expected to be completed in 2004. The two-year time frame for the VSC program was determined to be very well synchronized with the expected time line for the development of the DSRC standards necessary to support vehicle safety applications. A project timeline was developed in this task that synchronized the results of the VSC project with the DSRC standards development process. Besides assessing the existing DSRC standards, Task 2 identified additional standards that are necessary for DSRC-based vehicle safety systems applications, and issues related to the development of these standards. The planned IEEE security standard for DSRC was highlighted as a potential issue area, since it may not cover needed vehicle-specific security requirements. If these needs are not met in the IEEE security standard, then
Vehicle Safety Communications Project
31
another SDO may need to develop the security standard for DSRC vehicle safety applications. In addition, this task identified the need for global harmonization of DSRC standards. In particular, it was pointed out that the automobile manufacturers’ perspective did not seem to be effectively represented in the ongoing development of international ISO DSRC standards. Task 2 included a determination of how the OEMs can most effectively participate in, and influence, the standards activities. Direct participation in the DSRC Standards Writing Group was determined to be the most effective way for the VSCC to understand, analyze and influence the development of necessary DSRC standards to support vehicle safety applications. This task also recommended that the VSCC support its positions on standards issues with actual test data or simulation results, wherever possible, to promote acceptance. TASK 3: IDENTIFY INTELLIGENT VEHICLE SAFETY APPLICATIONS ENABLED BY DSRC In Task 3 of the VSC project, a more comprehensive list of vehicle safety application scenarios was identified, based upon the vehicle safety applications previously compiled under Task 1. More than 75 applications scenarios were identified. A preliminary analysis was completed, and 45 applications scenarios were described. Preliminary communications requirements were developed for these application scenarios. Based upon these preliminary requirements, an analysis of alternative wireless technologies was completed. Each safety application scenario was further defined during Task 3 research, and an initial estimate of potential safety benefits was derived. The summary of significant crashes and crash factors was used to estimate the ability of the selected application to reduce vehicle crashes and functional years lost, utilizing the GM “44 Crashes” analysis2. The VSC project team defined a set of analysis categories by which the potential safety benefits of each application scenario could be compared. Each application scenario was rated with respect to the analysis categories. Estimates for market penetration were used to determine the estimated number of vehicles in the U.S market that would be equipped with the application scenario in each year after initial deployment. Near-term application systems were considered to be deployable in the U.S market between the years 2007 to 2011, mid-term application systems between the years 2012 to 2016, and long-term beyond the year 2016. The VSCC and the DOT jointly selected a subset of safety applications of mutual interest from the comprehensive list. Safety applications were selected based on potential safety benefit and were representative of the total range of identified safety applications. In order to rank the near-term, mid-term and long-term applications, Functional Years Saved was used as the most important benefits distribution. The fifth year after deployment was chosen for computation of benefit opportunity and estimated benefits of the application scenarios. Upon analysis, the near- and mid-term applications were found to form specific components of the long-term applications, since the long-term

Vehicle Safety Communications Project
32
applications are defined at a higher level of abstraction. Therefore, the highest-ranking near- and mid-term applications, in terms of estimated Functional Years Saved in the fifth year after deployment, were selected as high-priority applications for more detailed analysis in the VSC project. In the near-term category, there was a noticeable spread between the estimated benefits of the third- and fourth-ranking safety applications. Consequently, the top three applications were selected.
High Potential Benefit Near-term Applications:
Application System Communications Mode Benefit Opportunity (Functional Years Saved)
Traffic Signal Violation Warning
Infrastructure – to –Vehicle 17,627 (0.86 %)
Curve Speed Warning Infrastructure – to –Vehicle 11,189 (0.54 %)
Emergency Electronic Brake Lights
Vehicle – to – Vehicle 4,284 (0.21 %)
For the mid-term safety applications, there was a noticeable spread between the estimated benefits of the sixth- and seventh-ranking safety applications. However, the sixth-ranking application – Blind Spot Warning – is extremely similar to the fourth-ranking application – Lane Change Warning. Therefore, the top five applications were selected as high-priority applications. High Potential Benefit Mid-term Applications:
Application System
Communications Mode
Benefit Opportunity (Functional Years Saved)
Pre-Crash Warning
Vehicle – to – Vehicle 34,172 (1.66 %)
Cooperative Forward Collision Warning
Vehicle – to – Vehicle 19,160 (0.93 %)
Left Turn Assistant
Infrastructure – to/from - Vehicle 8,534 (0.42 %)
Lane Change Warning
Vehicle – to – Vehicle 7,354 (0.36 %)
Stop Sign Movement Assistance
Infrastructure – to/from - Vehicle 7,217 (0.35 %)

Vehicle Safety Communications Project
33
The eight high-priority vehicle safety applications were further analyzed, and more detailed communications requirements were developed. As examples of these more detailed communications requirements, the requirements for three of the high-priority applications that relate to intersection collision avoidance are summarized in the following sections.
Traffic Signal Violation Warning
General Communication Requirements: • Communication from infrastructure-to-vehicle
• One-way communication
• Point-to-multipoint communication
• Transmission mode: periodic
• Minimum frequency (update rate): ~ 10 Hz
• Allowable latency ~ 100 msec
• Data to be transmitted and/or received: traffic signal status, timing, directionality, position of the traffic signal stopping location, weather condition (if data is available), road surface type near traffic signal
• Maximum required range of communication: ~ 250 m Data Message Set Requirements: Description Number of bits Traffic signal status information Current phase 8 Date and time of current phase 56 Next phase 8 Time remaining until next phase 24 Road shape information Data per node 32 Data per link to node 72 Road condition/surface 8 Intersection information Data per link 120 Location (lat/long/elevation) 96 Stopping Location (offset) 32 Directionality 16 Traffic signal identification 48 Message type 8

Vehicle Safety Communications Project
34
Left Turn Assistant
General Communication Requirements:
• Communication from vehicle-to-infrastructure, and infrastructure-to-vehicle
• One-way communication
• Point-to-multipoint communication
• Transmission mode: periodic
• Minimum frequency (update rate): ~10 Hz
• Allowable latency: ~100 msec
• Data to be transmitted and/or received: traffic signal status, timing, and directionality; road shape and intersection information; vehicle position, velocity, and heading
• Maximum required range of communication: ~300 m

Vehicle Safety Communications Project
35
Data Message Set Requirements: Infrastructure-to-Vehicle
Description Number of bits Traffic signal status information Current phase 8 Date and time of current phase 64 Next phase 8 Time remaining until next phase 24 Road shape information Data per node 32 Data per link to node 72 Intersection information Data per link 120 Oncoming vehicle information Date and time vehicles detected 64 Link information for in-lane vehicles 48 Data per lane 16 Data per vehicle: Position Speed Acceleration Directionality Distance from intersection
96 16 16 16 16
Link information for between-lane vehicles (motorcycle, etc.)
48
Data per lane 16 Data per vehicle: Position Speed Acceleration Directionality Distance from intersection
96 16 16 16 16
Vehicle-to-Infrastructure
Description Number of bits GPS coordinates 96 Date and time of current location 64 Vehicle speed 16 Vehicle acceleration 16 Vehicle directionality 16

Vehicle Safety Communications Project
36
Stop Sign Movement Assistant
General Communication Requirements: • Communication from vehicle-to-infrastructure and infrastructure-to-vehicle
• One-way communication
• Point-to-multipoint communication
• Transmission mode: periodic
• Minimum frequency (update rate): ~10 Hz
• Allowable latency: ~100 msec
• Data to be transmitted and/or received: vehicle position, velocity, and heading; warning
• Maximum required range of communication: ~300 m

Vehicle Safety Communications Project
37
Data Message Set Requirements:
Infrastructure-to-Vehicle
Description Size (bits) Intersection information, per link 120 Time stamp 64 Link information, per link 48 Data per lane 16 Data per vehicle: Temporary vehicle ID 8 GPS coordinates 96 Vehicle speed 16 Vehicle acceleration 16 Vehicle heading 16 Distance from intersection 16

Vehicle Safety Communications Project
38
Vehicle-to-Infrastructure
Description Size (bits) GPS coordinates 96 Time stamp 64 Vehicle speed 16 Vehicle acceleration 16 Vehicle heading 16 This more detailed view of communications requirements reinforced the general 100-millisecond latency requirement, and the broadcast nature of the communications required. In addition, the data packets to support most vehicle-to-vehicle communications were determined to be less than 100 bytes. Infrastructure-to-vehicle packets were generally a bit larger, with a maximum size of around 430 bytes required for the left turn assistant application scenario. The communications requirements identified for each high-priority vehicle safety application scenario should be further evaluated against the expected DSRC capabilities through field-testing and simulation during Task 4 research. The main conclusion from Task 3 is that DSRC is potentially an important enabler of a large number of vehicle safety applications, and that many of these applications offer significant potential safety benefits in the longer term. Having such a range of potentially enabled safety applications means that the installed cost of DSRC (and other required) hardware in vehicles may be able to be balanced by the benefits of the multiple applications, thus substantially reducing the effective cost-per-application. TASK 4: REFINEMENT OF VEHICLE SAFETY APPLICATION COMMUNICATION REQUIREMENTS Task 4 is refining the communications requirements for vehicle safety applications jointly selected with the US DOT from the rough requirements developed in Task 3. This task will also be further analyzing possible weaknesses and issues within the DSRC standards that may limit the ability to support high-priority vehicle safety applications identified in Task 3. As potential weaknesses are identified, direction may be provided to Task 6 in order to characterize DSRC performance. This Task will be accomplished by a combination of vehicle testing and communication simulation. Task 4 has already identified and assembled test hardware in order to provide each VSCC member with two prototype DSRC evaluation units, currently using modified 802.11a hardware. Differential GPS units were integrated into the test units to provide vehicle-positioning information that can be used for post processing and data analysis. Data collection software and analysis tools have been developed and included in each of the test units. These units are intended to allow each member to conduct testing to uncover potential limitations of specific implementations of DSRC communications. Basic testing will be done as part of this task, while more extensive testing of specific topics will be conducted in Task 6.

Vehicle Safety Communications Project
39
Task 4 is currently on schedule to complete a set of test scenarios for all the high-priority vehicle safety applications identified in Task 3. Initial testing has begun, with the rough validation of the test kits being the first priority. A communications-based simulation model was constructed to analyze possible weaknesses and issues with existing and proposed DSRC standards that may limit the ability to support vehicle safety applications. The simulator data will be used, when appropriate, to substantiate any theoretical findings based on system analysis. The results of the simulations will be used to intelligently critique the DSRC standards as they are being developed. The first generation of Task 4 simulation runs is currently under way. The requirements for the first generation simulation runs have been based upon DSRC standards developments and issues. As a result, these simulation studies are focused on the evaluation of channel capacity, which depends on the transmission packet size, frequency, and power, and the robustness of power control. TASK 5: PARTICIPATION IN, AND COORDINATION WITH, DSRC STANDARDS COMMITTEES AND GROUPS Under Task 5, the VSCC participates in the development of the DSRC standards currently underway through organizations such as the American Society for Testing and Materials (ASTM), and the Institute of Electrical and Electronic Engineers (IEEE). The VSCC provides regular status updates at all DSRC Standards Writing Group meetings. The focus of VSCC participation in the DSRC standards writing group meetings is to ensure that vehicle safety applications requirements are met by standards under development. This focus will also be used to identify any potential impediments to the use of DSRC to support vehicle safety applications. The VSCC has developed an effective working relationship with the members of the DSRC Standards Writing Group. As a result of active participation, the VSCC has secured substantial and necessary accommodations from the standards group. The VSCC is generally satisfied with the DSRC Standards Writing Group’s consideration and acceptance. VSCC identification of communications requirements for vehicle safety applications has generally been reflected in the DSRC plans and recommendations for standardization. The VSCC plans to continue its active participation with the DSRC standards group to ensure that the eventual DSRC standards support automotive communication requirements for safety applications at all levels. The VSCC technical committee has been meeting consistently on a weekly basis at two physical locations (one in the Detroit area and one in the Silicon Valley area), linked by teleconference, to discuss DSRC standards progress, significant developments, issues encountered, recommended actions, and in support of other VSC tasks. A consensus position on technical issues has been developed through discussions at these weekly technical committee meetings. These consensus positions have been, and will continue to be, input and promoted to the appropriate standards processes in accordance with the recommended approaches from Task 2.
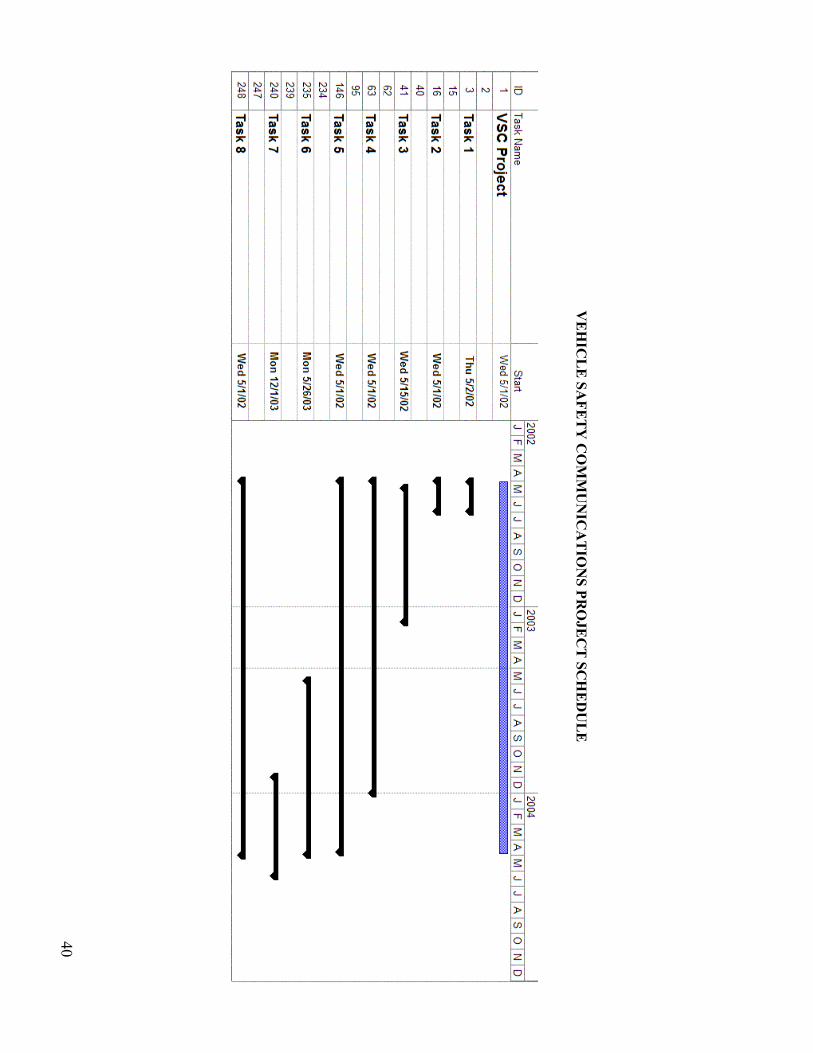
VEH
ICLE SA
FETY C
OM
MU
NIC
ATIO
NS PR
OJEC
T SCH
EDU
LE
40

41
REFERENCES 1 General Motors (1996), ’44 Crashes’, version 3.0, Warren, Michigan, Crash Avoidance Department, North American Operations 2 Kiefer, R., LeBlanc, D., Palmer, M., Salinger, J., Deering, R., Shulman, M. (1999), ‘Development and Validation of Functional Definitions and Evaluation Procedures for Collision Warning / Avoidance Systems, DOT HS 808 964, Washington, DC, National Highway Traffic Safety Administration, U.S. Department of Transportation.


DOT HS 809 663January 2004