
SECARB Peters 3-9-11 - Transcending · PDF fileDwight Peters North America Business Manager...
24
Commercial Sequestration Commercial Sequestration Dwight Peters Dwight Peters North America Business Manager Mar 9, 2011
Transcript of SECARB Peters 3-9-11 - Transcending · PDF fileDwight Peters North America Business Manager...

Commercial SequestrationCommercial Sequestration
Dwight PetersDwight PetersNorth America Business Manager
Mar 9, 2011

Acknowledgements
Some graphics in this material is based upon work supported by the U.S. g p p pp yDepartment of Energy (DOE) National Energy Technology Laboratory (NETL). This work is managed and administered by the Regional Carbon Sequestration Partnerships and funded by DOE/NETL and Carbon Sequestration Partnerships and funded by DOE/NETL and cost-sharing partners.
2

The Commercial CO2 Storage WorkflowPost-Operation Phase20+ years
Operation Phase10-50 years
PrePre--Operation PhaseOperation Phase2-5 years
MonitoringConstruction Preparation
Certification at start
Monitoring
CO2 InjectionDesign
Performance Management & Risk Control
DecommissioningTransfer of
Liability
Characterization
Risk Control
SurveillanceSite Selection

Current Knowledge
• Scientific work has identified many potential storage sites in the US and rest of world• Only some of these sites can provide low risk, low cost commercial storagey p g• Injection pilots build acceptance but leave many unknowns about commerciality• Today’ s best practices manuals have been derived from small scale experiences • Many important pilot project experiences are not completely understood• Many important pilot project experiences are not completely understood• Scale-up will require commercial processes adapted from the oil and gas industry.

Important Variables
Construction Injection Equalization ClosurePossible site Probable site Appoved site
?$500M – $1B
Cume Cost
ton)
ate)
monitor
models
Property rights?
es
(pen
nies p
er
ost ?
( su
cces
s ra
gatherdata
updatemodelswells and seismic
Ownership,Liability ?
$50M
$150M
Design andPermit UncertaintyDe
sktop
Stud
ie
Explo
ratio
n Co
EnvironmentalMonitoring
( pennies / ton )
Operate Site3 Mton/yr( dollars / ton )
Collect DataBuild Models BuildPermit
(<10 cents / ton)
Risk Control & Performance Assessment5 yrs 100+0 30 yrs 35 yrs
Uncertainty$1M
Build Models(~50 cents / ton)
Build(~$1 / ton)
* Per ton estimates and total costs (in current day $USD) are based on 100 Mton lifetime storage volume

NATCarb Data “Blobs”

An Oil and Gas Analogy
Decades ago, potential oil & gas fields were mapped i i il th t t ti l t it b i in a similar way that potential storage sites are being mapped today

The Importance of Data
Here’s what we learned after decades of oil & gas related data collection

Scale Up Challenges for CO2 Storage
• Data integrationg• Risk management• Monitoring and validation• Operational challenges and HSE

Data Integration
• Pilot projects have followed hypothesis driven scientific experimentation• Subsurface models should represent a range of possibilities not a best estimate.• Integration enables us to continually restrict possible scenarios and lessen risk• Multiple disciplines must converge on a shared earth modelMultiple disciplines must converge on a shared earth model• New information must be rapidly added into the decision process
Schlumberger Petrel Model

CCS Full System Integration
Capture plant plot sCapture plant plot s
Capture Island
Transport
CO2 Source
• CO2 quality matched to reservoir • Fluid behavior through network• Operational integration
• alarming• shut downs• back up• back up Storage
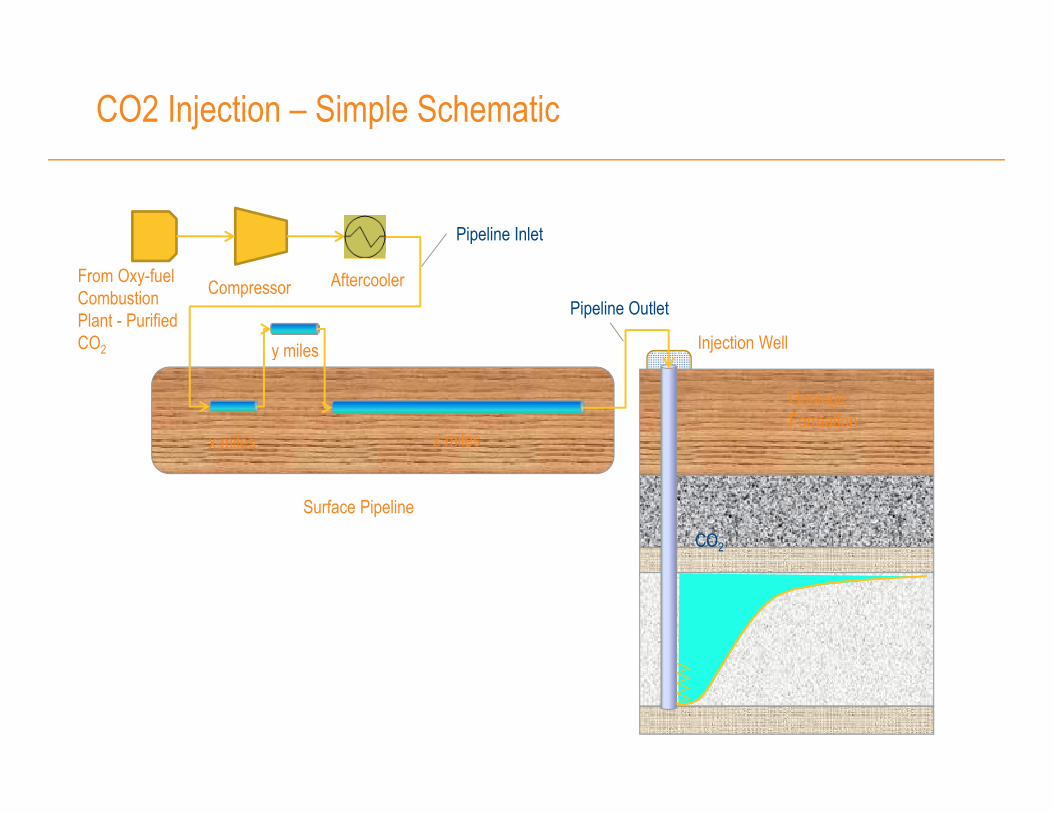
CO2 Injection – Simple Schematic
Pipeline Inlet
From Oxy-fuel Combustion Plant - Purified CO2
Compressor Aftercooler
Injection Well y miles
Pipeline Outlet
Geologic Formation
x miles
y miles
z miles
Surface Pipeline
CO2

Surface Pipeline – Effect of Pipeline Diameter200 miles long, 10 miles elevated, 190 miles buried. Inlet temperature 100 °F, inlet pressure 1200 psia, ambient temperature 60 °F, pure carbon dioxide, one million tonnes per year, 18” pipeline
100 100
80 80
60 60
40 40
or F
ract
ion,
%
100
90°F
35
°C
20 20
0 0
Vapo
OLGA S, 2000, V5.3
ΔP 4.1%90
80
70
60
Tem
pera
ture
,
30
25
20 Tem
pera
ture
,
Lower Heat Transfer Coefficient
ΔP 4.1%
1200
1190
1180
1170
ress
ure,
psi
a 8.2
8.1
8 0 ress
ure,
MP
a
OLGA S, 2000, V 5.3
Beggs and Brill
60
300250200150100500
Pipeline length, km
1160Pr 8.0 Pr

Surface Pipeline – Effect of Pipeline Size200 miles long, 10 miles elevated, 190 miles buried. Inlet temperature 100 °F, inlet pressure 1200 psia, ambient temperature 60 °F, pure carbon dioxide, one million tonnes per year, 12” pipeline
100
80
60
40
or F
ract
ion,
%
100
80
60
40
Beggs and Brill
100
90°F
35
°C
20
0
Vapo
20OLGA S, 2000, V5.3
ΔP 26.3%80
70
60
Tem
pera
ture
,
30
25
20 Tem
pera
ture
,
Beggs and Brill
OLGA S, 2000, V5.3
ΔP 26.3%
1200
1100
1000
ress
ure,
psi
a 8.0
7.5
7.0
6
ress
ure,
MP
a
Beggs and Brill
OLGA S, 2000, V5.3
300250200150100500
Pipeline length, km
900
P 6.5 P

Surface Pipeline – Effect of Temperature200 miles long, 10 miles elevated, 190 miles buried. Inlet temperature 100 °F, inlet pressure 1200 psia, ambient temperature 75 °F, pure carbon dioxide, one million tonnes per year, 12” pipeline
100 100
80 80
60 60
40 40
or F
ract
ion,
%
100
90°F
35
30
°C
20 20
0 0
Vap
o
ΔP 42.5%80
70
60
Tem
pera
ture
, 30
25
20
15
Tem
pera
ture
, ΔP 42.5%
1200
1100
1000
900
800ress
ure,
psi
a
8
7
6
ress
ure,
MP
a
Beggs and Brill
300250200150100500
Pipeline length, km
800
700
Pr
5
Pr

Surface Pipeline – Effect of 4 mole% Argon Addition
200 miles long, 10 miles elevated, 190 miles buried. Inlet temperature 100 °F, inlet pressure 1211 psia, ambient temperature 60 °F, one million tonnes per year, 12” pipeline
1.0
0.8
0.6
0 4apor
Fra
ctio
n
0.4
0.2
Va
300x103250200150100500Distance, m
3020C
100
80
eg. F ΔP 82.2%20
100
-10-20-30Te
mpe
ratu
re, d
eg. 60
40
20
0
-20
Tem
pera
ture
, de ΔP 82.2%
300x103250200150100500Distance, m 1200
1000
800
600 ssur
e, p
sia
87654su
re, M
Pa
600
400 Pres
300x103250200150100500Distance, m
432
Pre
s

Full Integration
Economics Model Petrel
Integrated Asset ModelGeologic Model
gFacilities Model
Pipeline Model
Wellbore Model
GeoChemicalModel
Reservoir Simulators
GeoMechanicsModel
W ll d tE i t d t
Seismic data (characterization)
Well dataEnvironment data
Monitoring data (all types)
HSE risk evaluation
Monitoring data (all types)
Leakage risk evaluation

The Risk Management Matrix
ResponsesRED
YELLOWINTOLERABLE: Do not take this risk
UNDESIRABLE: Demonstrate ALARP before proceeding
-16 to -10
-9 to -5
BLACK NON-OPERABLE: Evacuate the zone and or area/country-25 to -20
p• reduce likelihood (PREVENT)• reduce severity (MITIGATE).P
ossible
Unlikely
Improbab
Probable
Likely
MITIGATION
ControlM
BLUEGREEN ACCEPTABLE: Proceed carefully, with continuous improvement
NEGLIGIBLE: Safe to proceed
-4 to -2
-1
Tasks:• Intelligently construct “Scenarios”
that can be modeled.Effi i tl l i l ti
-11L
-22L
-33L
-44L
-55L
-1Light
321
ble
54
LIKELIHOODPREVENTION
Measures
• Efficiently apply simulation resources.SEVER
I
-21S
-31M
-41S
-62M
-63S
-93M
-84S
-124M
-105S
-155M
-2
-3
Serious
Major
Hazard Analysis and Risk ControlSt d d SLB QHSE S020
ITY
-41C
-51MC
-82C
-102MC
-123C
-153MC
-164C
-204MC
-205C
-255MC
-4
-5
Catastrophic
Multi-Catastrophic
Standard SLB-QHSE-S020White arrow indicates decreasing risk

Risk Management Tools
Rank by Risk

CO2 Monitoring – 3 objectives
#3 M it th i t
ContainmentContainment #2: Watch possible leakage paths
#3: Monitor the environmentWell Integrity
S l d f lt
Freshwateraquifer
BoundariesBoundaries#1: Watch stored CO2
Sealed fault
Monitoringwell
Abandonedwell
Monitoringwell
CO2injectionwell

Operational Challenges and HSE
• The ability to execute a plan in real-time is as important as the plan itself• A proven methodology for decision making, in a dynamic environment, is critical.• When we drill and inject into the subsurface we create:
• predictable events that we can validate• Indicators for unpredicted events that could lead toward negative consequences
• Our ability to anticipate scenarios and respond, prior to incident, is crucial• Response capability is the key ingredient in overall cost minimizationp p y y g• All of the above impact HSE

What is Needed for Project Success
CO2 Technology
People + TechnologyPeoplePeople CO2 Technology
All Seismic ServicesWellbore Integrity EvaluationD illi & C l ti&
p
Geology Geophysics
Reservoir Engineer Drilling Engineer
p
Geology Geophysics
Reservoir Engineer Drilling Engineer Drilling & CompletionCementing Logging, Testing & SamplingL b A l i
&g g g
Petrophysics Completion Engineer
Geomechanics Geochemistry
g g g
Petrophysics Completion Engineer
Geomechanics GeochemistryLab AnalysisData ProcessingModeling & Plume PredictionD t M t
y
Hydrogeology Economics
HSE Injection
y
Hydrogeology Economics
HSE InjectionData ManagementOperational MonitoringVerification MonitoringC li M it i
Project ManagementProject Management
Tools for Team IntegrationCompliance Monitoring

The Operational Team Needs:
Significant commercial e perience ith field operations and asset de elopment• Significant, commercial experience with field operations and asset development• CO2 specific experience• Organizational alignment and motivation – culture, training, HSE• Understanding of and access to key technologies and tools• Support infrastructure, HSE

Lessons Learned Through Demonstrations
● Geologic uncertainty is scary to some (esp. engineers)g y y ( p g )● CO2 moves farther, faster, and with fingering● CO2 stands out from brine on most monitoring techniques―No chance of 100% accounting
● Old wells will need special focusL bl i d l t d il fi ld―Large problem in depleted oil fields
● Need to consider the entire system or suffer the consequences


