LT I forum Online Distance Learning at UH and the MOOC Revolution
MATH 1342Section 4.3

Standard Normal Calculations
As suggested in the previous section, all normal distributions share many common properties. In fact, if change the units to σ and center the graph at μ=0, all normal distributions would be exactly the same. This is called standardizing. If x is an observation from a normal distribution with mean μ and standard deviation σ, the standardized value of x is called the z‐score and is computed with the formula below.

The Z‐Score
A z‐score tells us how many standard deviations the observed value falls from the mean.
We can use z‐scores to “standardize” values that are on different scales to compare them.

Example:
Bon took the ACT and scored 31. Craig took the SAT and scored (CR+M) 1390. If both tests are normally distributed, who did better? The ACT has a mean of 21.1 and a standard deviation of 4.7. The SAT has a mean of 1010 and a standard deviation of 174.5.

The standard normal distribution is the normal distribution with N(0,1):

Little known fact:
The Normal Distribution Curve has an equation of the following:
𝑦12𝜋
𝑒
This is just in case you are ever asked on a game show. You do not need to know this formula

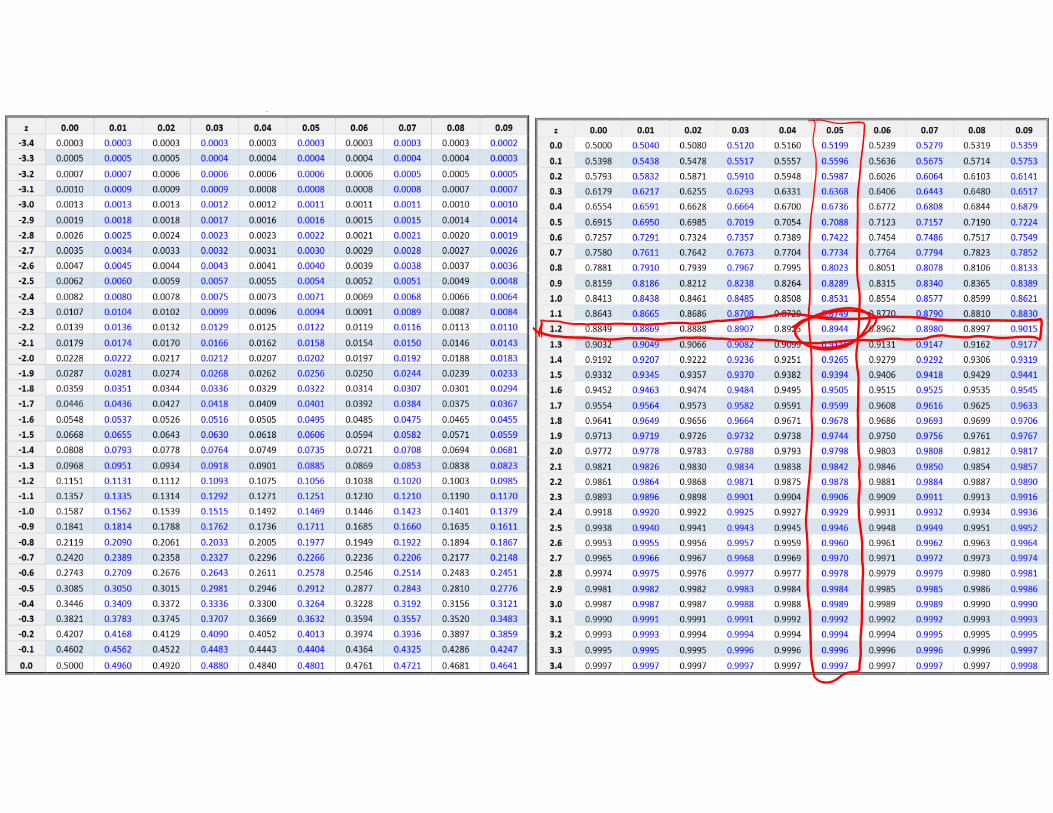
Using Tables from the Textbook:
Table A in your appendix gives areas under the standard normal curve for values of z. The table entry for each value of z gives the area under the curve to the left of z – in other words, it gives p(Z < z) .
https://www.casa.uh.edu/CourseWare2008/Books/p/Math/2311/TB/index.html

Example: Using Table A, find the following probabilities:A. p(Z < −1.06)
B. p(Z < 2.15)
C. p(Z > 2.15)
D. p(−1.06 < Z < 2.15)
Now let’s repeat with calculator and R‐Studio.

If we want to use the table for probabilities and are not given z, we must compute the z‐score using the formula above.

Example: Popper 10
If X has distribution N(100,15), standardize X and use Table A to find the following probabilities:1. Find the z‐score corresponding to x = 80.2. Find the z‐score corresponding to x = 105.a. 0.333 b. ‐0.333 c. ‐1.333 d. 1.3333. p(X < 80)
a. 0.9082 b. 0.9999 c. 0.1333 d. 0.09124. p(X >105)
a. 0.6298 b. 0.0004 c. 0.3694 d. 0.99965. p(80 < X <105)
a. 0.6298 b. 0.0000 c. 0.5393 d. 0.0918


Known Percentile Rank
Now, let’s suppose we know the percentile rank or the probability and want to find the corresponding z‐score.We can use Table A and look up the percentile (remember, it shows the area to the left) or we can use the command invNorm(percent) on the TI or qnorm(percent) in R.
If you know the probability, but you want to find the x or z values that produced it. Use this method.

Example: Find the value of c so that
A. P(Z < c) = 0.7704
B. P(Z > c) = 0.006
C. P(−c < Z < c) = 0.966
When using a p‐command (greater than), the 1‐ goes outside, when using a q‐command (greater than) the 1‐ goes inside.

Another example:
Suppose you rank in the top 10% of your class. If the mean gpa is 2.7 and the standard deviation is 0.59, what is your gpa? (Assume a normal distribution).
Deciding to use qnorm versus pnorm has NOTHING to do with z or x. It has to do with what you are looking for as an answer. If you are finding a probability, use pnorm. If you finding a c‐value, use qnorm.