SEC Number: CS200321240 File Number: CEBU …
71
SEC Number: CS200321240 File Number: ________ CEBU LANDMASTERS, INC. ___________________________________ (Company’s Full Name) 10TH FLOOR, PARK CENTRALE, B2 L3, JOSE MA. DEL MAR ST., CEBU IT PARK, APAS, CEBU CITY ___________________________________ (Company Address) (032) 231-4914 ___________________________________ (Telephone Number) June 30, 2017 ___________________________________ (Quarter Ending) SEC Form 17-Q Quarterly Report ___________________________________ (Form Type) - ___________________________________ (Amendments)
Transcript of SEC Number: CS200321240 File Number: CEBU …
SEC Number: CS200321240 File Number: ________
CEBU LANDMASTERS, INC. ___________________________________
(Company’s Full Name)
10TH FLOOR, PARK CENTRALE, B2 L3, JOSE MA. DEL MAR ST.,
CEBU IT PARK, APAS, CEBU CITY ___________________________________
(Company Address)
(032) 231-4914 ___________________________________
(Telephone Number)
June 30, 2017 ___________________________________
(Quarter Ending)
SEC Form 17-Q Quarterly Report ___________________________________
(Form Type)
- ___________________________________
(Amendments)

SECURITIES AND EXCHANGE COMMISSION SEC FORM 17-Q
QUARTERLY REPORT PURSUANT TO SECTION 17 OF THE SECURITIES REGULATION CODE AND SRC RULE 17(2)(b) THEREUNDER
1. For the quarterly period ended June 30, 2017 2. Commission Identification Number CS200321240 3. BIR Tax Identification No. 277-599-320 4. Exact name of issuer as specified in its charter: CEBU LANDMASTERS, INC 5. Province, Country or other jurisdiction of incorporation or
organization: CEBU CITY, CEBU, PHILIPPINES 6. Industry Classification Code: _______ (SEC Use Only)
7. Address of the issuer’s principal office and postal code:
10TH FLOOR, PARK CENTRALE, B2 L3, JOSE MA. DEL MAR ST., CEBU IT PARK, APAS, CEBU CITY Postal code: 6000
9. Issuer’s telephone number, inclusing area code: (032) 231-4914 10. Former name, former address, former fiscal year: not applicable 11. Securities registered pursuant to Sections 8 and 12 of the Code, or Sections 4 and 8 of the RSA
Title of each class Number of shares issued and
outstanding
COMMON SHARES 1,714,000,000
Stock Exchange: Philippine Stock Exchange Securities listed: Common shares
12. Indicate by check mark whether the registrant:
(a) has filed all reports required to be filed by Section 17 of the Code and SRC Rule 17
thereunder or Sections 11 of the RSA and RSA Rule 11(a)-1 thereunder, and Sections 26
and 141 of the Corporation Code of the Philippines, during the preceding 12 months (or
for such shorter period that the registrant was required to file such reports): Yes [x] No [ ]
(b) has been subject to such filing requirements for the past 90 days:
Yes [x] No [ ]

PART I -- FINANCIAL INFORMATION
Item 1 FINANCIAL STATEMENTS
The following Financial Statements period ended June 30, 2017 are attached herewith:
▪ Unaudited Consolidated Statements of Financial Position as of June 30, 2017
and December 31, 2016
▪ Unaudited Consolidated Statements of Profit or loss for the six months ended
June 30, 2017 and 2016
▪ Unaudited Consolidated Statements of Comprehensive Income for the six
months ended June 30, 2017 and 2016
▪ Unaudited Consolidated Statement of Changes in Equity for the six months
ended June 30, 2017 and 2016
▪ Unaudited Consolidated Statements of Cash Flows for the six months ended
June 30, 2017 and 2016
▪ Notes to Consolidated Financial Statements
Item 2 MANAGEMENT’S DISCUSSION AND ANALYSIS OF THE FINANCIAL
CONDITION AND RESULTS OF OPERATIONS
The following discussion and analysis of the financial condition and results of
operations of Cebu Landmasters, Inc. should be read in conjunction with the
unaudited financial statements and accompanying notes set forth elsewhere in this
report.
▪ Key Performance Indicators
▪ Review on the company’s 1st Half 2017 vs 1st Half 2016 Results of operation
▪ Review on the company’s Financial condition as of June 30, 2017 vs Dec 31,
2016

KEY PERFORMANCE INDICATORS
Management uses the following indicators to evaluate the performance of the company:
Note:
1. Gross Profit Margin - is calculated by dividing gross profit by revenues. The ratio measures how much of every peso of revenues is left over after paying cost of goods sold (COGS)
2. Net Income Margin- is calculated by dividing Net Income after taxes by the total revenues. The said financial ratio tells investors the percentage of money a company actually earns per peso of revenues.
3. Return on Equity (ROE) - is the amount of net income returned as a percentage of shareholders equity. ROE measures a corporation's profitability by revealing how much profit a company generates with the money shareholders have invested.
4. Return on Assets (ROA)- indicator of how profitable a company is relative to its total assets. ROA gives an idea as to how efficient management is at using its assets to generate earnings. This is calculated by dividing a company's earnings by its total assets
5. Debt/Equity- the ratio indicates how much debt a company is using to finance its assets relative to the amount of value represented in shareholders' equity. This is calculated by dividing a company's total liabilities by its stockholders' equity.
6. Interest Coverage Ratio - is used to determine how easily a company can pay their interest expenses on outstanding debt. The ratio is calculated by dividing a company's earnings before interest and taxes (EBIT) by the company's interest expenses for the same period.
7. Current Ratio- is a liquidity ratio that measures a company's ability to pay short-term and long-term obligations. To gauge this ability, the current ratio considers the current total assets of a company (both liquid and illiquid) relative to that company's current total liabilities.
Cebu Landmasters reports higher profitability margins for the 1st Half 2017 (Y-O-Y). The
Gross Profit Margin of the real estate business increased from 46% to 51% due to moderate price
escalations and cost control procedures enhancing the company’s work efficiency and output.
NIAT margin on the other hand further improved, from 27% to 35% as revenues increased faster
than the rise in costs and expenses.
Jan to Jun 2017 Jan to Jun 2016
PROFITABILITY
Gross Profit Margin 51% 46%
NIAT Margin 35% 27%
ROE (1H) 15% 16%
ROA (1H) 7% 4%
As of June 30, 2017 As of Dec 30, 2016
STABILITY
Debt/ Equity 1.14 2.48
Interest Coverage Ratio 39.62 46.45
LIQUIDITY
Current Ratio 2.95 2.13
Aside from the profitability measures, all ratios remain healthy and stable. Return on
Equity (ROE) maintained a 15% level while Return on Assets (ROA) increased from 4% to 7%
due to higher net income. Debt to Equity ratio is now at 1.14 as of June 30, 2017 compared to last
December’s DE Ratio of 2.48. This is due to the increase in equity from the company’s issuances
of additional 430 million shares at Php5.00/share during its Initial Public Offering. Additionally,
the company’s current ratio also increased from 2.13 to 2.95 due to the IPO cash proceeds.
Interests expenses remain covered, with an ICR of 39.62. This posted a slight decrease
from the previous ICR of 46.45 as the company incur higher interest expense for the current
period. Such increase is from the additional long-term debt availments to fund the construction
and development of its projects.
These KPI values mentioned were within management's expectation during the period in
review. Management together with key officers of the company continue to effectively handle their
respective operations and financial requirements. As a result, profitability had been sustained and
financial position remains strong and liquid.

REVIEW ON THE COMPANY’S RESULTS OF OPERATION
1ST Half 2017 vs 1ST Half 2016
Cebu Landmasters, Inc. posted net income after tax of Php 633 million for the 1st Half of
2017. This is 164% higher than last year’s net income for the same period which amounted to Php
240 million. This translates to earnings per share of Php 0.36 as of June 30, 2017.
REVENUES
Cebu Landmasters, Inc. reported outstanding financial growth for the 1st Half 2017 as its
total revenues reached Php1.807 billion, a 107% year-on-year growth driven by strong
performance across all business units. The real estate segment of the company which comprised
a big chuck of revenue increased by 108%, from Php859 million in the 1st Half 2016 to Php1.79
billion in 1st Half 2017. The said increase was primarily attributable to the robust sales and on time
construction progress from newly constructed projects, Casa Mira Linao, Mivesa Residences
building 5, Casa Mira Towers, Mesaverte Residences, Baseline Center and Citadines. The
Company now uses the Percentage of Completion Method of revenue recognition to align with
the industry practice and adapt in advance the Philippine Financial Reporting Standards (PFRS)
15 dictating that revenue from contracts be recognized in reference to the stages of development
of the properties.
The demand for real estate in selected growth areas increased reservation sales to Php2.87
billion, a 155% Year-on-Year growth. The notable performance almost breached 2016’s entire
sales figure of Php2.94 billion. This was primarily caused by the robust sales across various projects
particularly from the company’s new launches: 38 Park Avenue in IT Park Cebu, MesaTierra in
Davao and Casa Mira in Naga, Cebu. Currently these projects are nearing fully sold status.
Furthermore, rental income increased by 21% from Php15.95 million in the 1st Half of
2016 to Php 19.29 million in during the first Half of 2017. The growth was attained due to higher
occupancy rates and rental rate increases during the period.
COST AND EXPENSES
Cost of real estate sales increased to Php889.59 million – 90% more than last year’s figures
(Php468.02 million). This is primarily due to the increase in the overall recorded revenue of the
company.
Total operating expenses for the 1st Half of 2017 amounted to Php 233.67 million, 51.6%
more than the Php154.13 million incurred in the same period last year. The increase can be
attributed to the higher manpower related expenses this year as the company welcomed more
employees to support its expansion into new growth areas in Visayas and Mindanao. The increase
in commissions and incentives also contributed to the growth in operating expenses. This resulted

from the higher sales and more launches of the company. Despite the increase in operating
expenses, CLI was still able to improve on efficiency as OPEX ratio declined from 18% to 13%
during the period.
Interest and other financing charges increased by 205% year on year, from Php5.54 million
in the 1st Half of last year to Php16.91 million in the 1st Half of 2017 as more debt was availed by
the company to support its project development.
Subsequently, income tax for the 1st Half 2017 also increased, from Php11.95 million to
Php19.76 million. The 65% increase year on year can be traced back to the higher taxable income
as the company posted higher earnings for the period.
REVIEW ON THE COMPANY’S FINANCIAL CONDITION
As of June 30, 2017 vs Dec 31, 2016
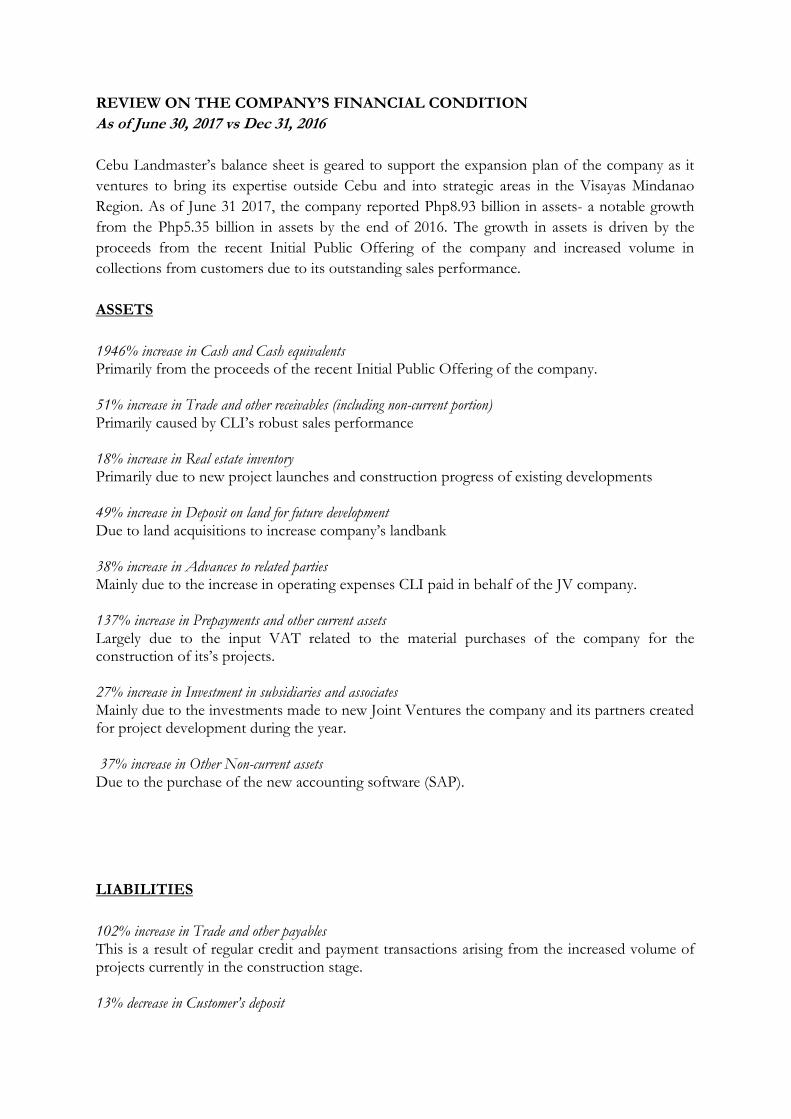
Cebu Landmaster’s balance sheet is geared to support the expansion plan of the company as it
ventures to bring its expertise outside Cebu and into strategic areas in the Visayas Mindanao
Region. As of June 31 2017, the company reported Php8.93 billion in assets- a notable growth
from the Php5.35 billion in assets by the end of 2016. The growth in assets is driven by the
proceeds from the recent Initial Public Offering of the company and increased volume in
collections from customers due to its outstanding sales performance.
ASSETS
1946% increase in Cash and Cash equivalents Primarily from the proceeds of the recent Initial Public Offering of the company. 51% increase in Trade and other receivables (including non-current portion) Primarily caused by CLI’s robust sales performance 18% increase in Real estate inventory Primarily due to new project launches and construction progress of existing developments 49% increase in Deposit on land for future development Due to land acquisitions to increase company’s landbank 38% increase in Advances to related parties Mainly due to the increase in operating expenses CLI paid in behalf of the JV company. 137% increase in Prepayments and other current assets Largely due to the input VAT related to the material purchases of the company for the construction of its’s projects. 27% increase in Investment in subsidiaries and associates Mainly due to the investments made to new Joint Ventures the company and its partners created for project development during the year. 37% increase in Other Non-current assets Due to the purchase of the new accounting software (SAP). LIABILITIES
102% increase in Trade and other payables This is a result of regular credit and payment transactions arising from the increased volume of projects currently in the construction stage. 13% decrease in Customer’s deposit
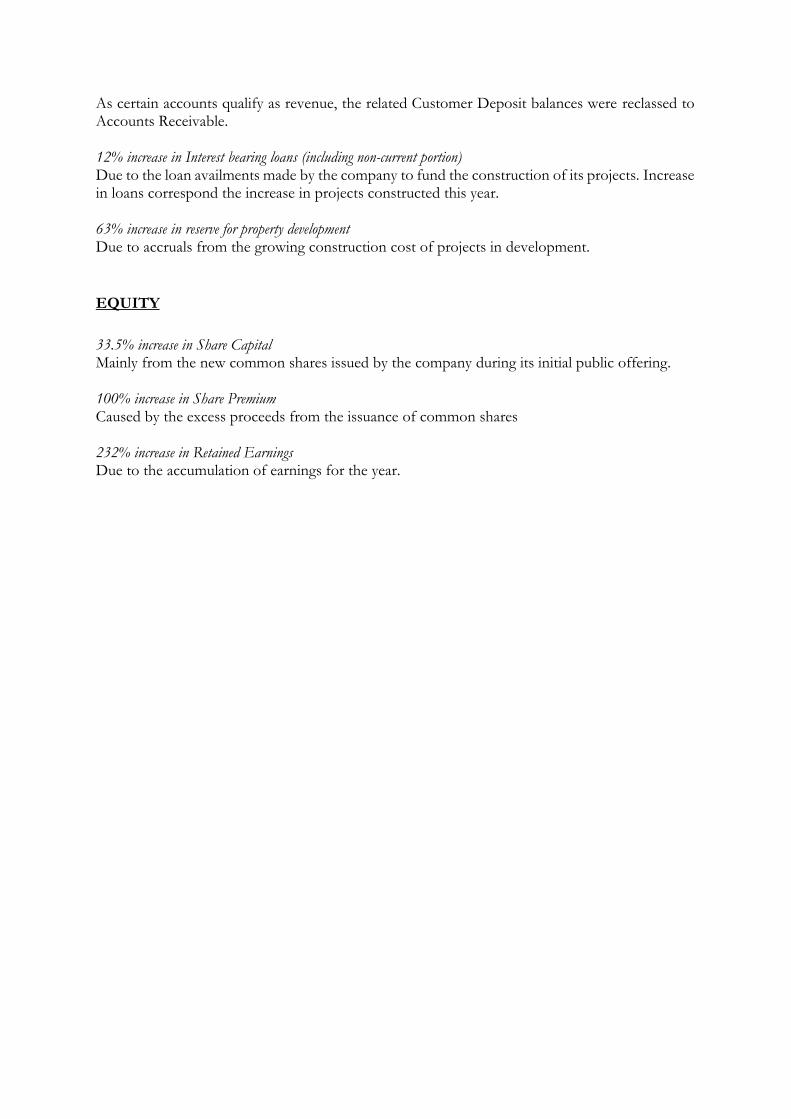
As certain accounts qualify as revenue, the related Customer Deposit balances were reclassed to Accounts Receivable. 12% increase in Interest bearing loans (including non-current portion) Due to the loan availments made by the company to fund the construction of its projects. Increase in loans correspond the increase in projects constructed this year. 63% increase in reserve for property development Due to accruals from the growing construction cost of projects in development.
EQUITY
33.5% increase in Share Capital Mainly from the new common shares issued by the company during its initial public offering. 100% increase in Share Premium Caused by the excess proceeds from the issuance of common shares 232% increase in Retained Earnings Due to the accumulation of earnings for the year.

PART II -- OTHER INFORMATION
Item 3 1st HALF 2017 DEVELOPMENTS
A. New Projects or Investments in another line of business or corporation.
None
B. Composition of Board of Directors
Name Position
Jose R. Soberano III Chairman of the Board, CEO and President
Ma. Rosario B. Soberano Director, Treasurer and Executive Vice- President
Jose P. Soberano, Jr. Director and Corporate Secretary
Jose Franco B. Soberano Director, Chief Operating Officer and Senior Vice-President
Joanna Marie B. Soberano Director
Janella Mae B. Soberano Director
Jesus N. Alcordo Independent Director
Rufino Luis Manotok Independent Director
Ma. Aurora D, Geotina-Garcia Independent Director
C. Performance of the corporation or result/progress of operations.
Please see unaudited Financial Statements and Management’s Discussion and
Analysis.
D. Declaration of Dividends.
None
E. Contracts of merger, consolidation or joint venture; contract of
management, licensing, marketing, distributorship, technical assistance or
similar agreements.
Cebu Landmaster’s newly-launched projects are the result of the Company’s
strategic collaboration with joint venture partners, which enabled the Company to
position itself in strategic locations and obtain the necessary funding for prime
property acquisitions, without straining its finances and limiting its capability to
continue existing projects.
Latitude Corporate Center is a project of BL CBP Ventures, Inc., a joint venture
between CLI and Borromeo Bros. Estate Inc with CLI owning 50% interest.
Meanwhile, 38 Park Avenue at the Cebu IT Park is a project of El Camino
Developers Cebu, Inc. (“El Camino”), a joint venture between the Company and

several individual partners. According to the agreements, CLI will have a 35%
share of the partnership. Lastly, MesaTierra Garden Residences Davao is a project
of Yuson Excellence Soberano, Inc., a joint venture between CLI and Yuson
Comm. Investments, Inc. (“Yuson”) where the CLI will have 50% interest of the
JV company. In all these JV projects, CLI has been appointed as the project
developer and manager and is entitled to receive management fees.
As of June 30, 2017, the Company holds ownership interests in the following
subsidiaries and associates:
F. Offering of rights, granting of Stock Options and corresponding plans
thereof.
None
G. Acquisition of additional mining claims or other capital assets or patents,
formula, real estate.
Not Applicable
H. Other information, material events or happenings that may have affected or
may affect market price of security.
None
I. Transferring of assets, except in normal course of business.
None
Subsidiaries/ Associates Percent of Ownership
2017 2016
CLI Premier Hotels Int’l. Inc. 100% 100%
Cebu Landmasters Property Management, Inc. 100% -
BL CBP Ventures 50% 50%
El Camino Developers Cebu 35% 35%
Yuson Excellence Soberano 50% 50%
Ming-Mori Development Corporation 19% 19%
Magspeak Nature Park Inc. 25% 25%
Mivesa Garden Residences, Inc. 45% -
AS Fortuna Property Ventures 40% -
Item 4 OTHER NOTES TO 1ST HALF 2017 OPERATIONS AND FINANCIALS
J. Nature and amount of items affecting assets, liabilities, equity, net income,
or cash flows that is unusual because of their nature, size, or incidents.
On June 2, 2017, the company sold 430,000,000 shares at Php5 per share during
its initial public offering. This increased the Equity and the Cash account by
Php2.02 billion after deducting IPO related expenses.
The Company will use these proceeds to for key land acquisitions and investments
in joint ventures to realize the company’s vision to be the No. 1 Real Estate
Developer in the Visayas-Mindanao region.
K. Nature and amount of changes in estimates of amounts reported in prior
periods and their material effect in the current period.
The company has changed its revenue recognition principle from Full Accrual to
Percentage of Completion method. The newly adopted principle requires the
company
to record revenue in reference to the stages of development of the properties. The
change was pursued to be in line with industry practice and adapt earlier
Philippines Financial Reporting Standards 15: Revenue from contracts with
customers which will be effective on January 1, 2018.
The financial statements attached herewith already uses Percentage of Completion
method both in current and prior year. The restated prior year numbers do not
reflect any material change in the previously reported revenue and net income.
L. New financing through loans/ issuances, repurchases and repayments of
debt and equity securities.
See Notes to Financial Statements and Management Discussion and Analysis.
M. Material events subsequent to the end of the interim period that have not
been reflected in the financial statements for the interim period.
None
N. The effect of changes in the composition of the issuer during the interim
period including business combinations, acquisition or disposal of
subsidiaries and long-term investments, restructurings, and discontinuing
operations.
None
O. Changes in Contingent Liabilities or contingent assets since the last annual
balance sheet date.
None
P. Other material events or transactions during the interim period
The company received Php2.02 billion worth of net proceeds from its initial Public
Offering which increased the company’s cash and equity. The proceeds will be
used for JV investments and pre-identified land purchases in key strategic areas of
Davao, Cagayan de Oro, Bohol, Iloilo, Bacolod and Dumaguete.
Details on the use of IPO proceeds are found in the company’s prospectus.
Q. Existence of material contingencies during the interim period; events that
will trigger direct or contingent financial obligation that is material to the
company, including any default or acceleration of an obligation.
None
R. Material off-balance sheet transactions, arrangements, obligations
(including contingent obligations), and other relationships of the company
with unconsolidated entities or other persons created during the reporting
period.
None
S. Material commitments for capital expenditures, general purpose and
expected sources of funds
Cebu Landmasters Inc. aims to launch 14 projects in 2017. This translates to a
Php17.7 billion worth of capital expenditure within the next 2 to 3 years. By the
end of the 1st Half of 2017, Php7.09 billion worth of projects was already launched.
Seven more projects will be introduced to the market by the 2nd Half of the year.
The company will use the proceeds from the recent IPO for the pre-identified land
acquisitions while the project development and construction will be funded
through long-term loans and payments from customers.
T. Known trends, events or uncertainties that have had or that are reasonably
expected to have impact on sales/revenues/ income from continuing
operations.
Cebu Landmasters’ performance will remain to be in line with the strength of the
country’s economic performance and overall levels of business activity. The
company may be affected by any economic and political uncertainties both locally
and internationally that could have adverse effects on the real estate industry.
CLI however believes that through its key strengths and competitive advantages,
the company will continue to operate and deliver its promise under any
circumstances.
U. Significant elements of income or loss that did not arise from continuing
operations
None
V. Causes for any material change/s from period to period in one or more line
items of the financial statements.
None
W. Seasonal aspects that had material effect on the financial condition or
results of operations.
None
X. Disclosures not made under SEC Form 17-C
None

SIGNATURES
Pursuant to the requirements of the Securities Regulation Code, the registrant has duly caused
this
report to be signed on its behalf by the undersigned thereunto duly authorized.
ISSUER CEBU LANDMASTERS, INC.
PRINCIPAL ACCOUNTING OFFICER
Chief Finance Officer
DATE August 15, 2017

June 30, 2017 December 31, 2016
Notes (Unaudited) (Audited)
CURRENT ASSETS
Cash and cash equivalents 4 1,853,657,393 P 90,617,743 P
Receivables - net (current) 5 3,220,670,161 2,069,449,137
Real estate inventory 6 2,157,769,728 1,831,424,419
Deposits on land for future development 7 387,397,128 259,897,127
Advances to related parties - net 22 36,966,451 26,739,222
Prepayments and other current assets 8 242,924,453 102,631,805
Total Current Assets 7,899,385,314 4,380,759,453
NON-CURRENT ASSETS
Receivables - net (Noncurrent) 5 179,673,339 184,374,872
Available-for-sale financial assets 9 54,133,275 54,133,275
Investments in associates and joint ventures 12 309,368,602 242,935,316
Property and equipment - net 10 160,108,698 164,166,429
Investment properties - net 11 296,944,567 297,664,109
Other non-current assets - net 13 31,347,832 22,878,048
Total Non-current Assets 1,031,576,313 966,152,049
TOTAL ASSETS 8,930,961,627 P 5,346,911,502 P
CURRENT LIABILITIES
Interest-bearing loans (Current) 14 744,442,207 P 787,980,146 P
Trade and other payables (Current) 15 1,003,023,135 487,447,566
Customers' deposits 16 396,011,245 456,968,051
Reserve for property development 6 533,655,692 327,236,408
Total Current Liabilities 2,677,132,279 2,059,632,171
NON-CURRENT LIABILITIES
Interest-bearing loans (Noncurrent) 14 1,933,678,367 1,604,059,047
Trade and other payables (Noncurrent) 15 16,956,129 16,956,129
Post-employment defined benefit obligation 20 2,105,858 2,105,858
Deferred tax liabilities - net 21 125,919,779 125,919,779
Total Non-current Liabilities 2,078,660,133 1,749,040,813
Total Liabilities 4,755,792,412 3,808,672,984
EQUITY 23
Share Capital 1,714,000,000 1,284,000,000
Share Premium 1,616,503,451 -
Revaluation reserves 625,202 )( 625,202 )(
Retained earnings 845,290,966 254,863,720
Total Equity 4,175,169,215 1,538,238,518
TOTAL LIABILITIES AND EQUITY 8,930,961,627 P 5,346,911,502 P
LIABILITIES AND EQUITY
See Notes to Financial Statements.
CEBU LANDMASTERS, INC. AND SUBSIDIARY
UNAUDITED CONSOLIDATED STATEMENTS OF FINANCIAL POSITION
JUNE 30, 2017 AND DECEMBER 31, 2016
A S S E T S
(With Corresponding Figures as of January 1, 2016)
(A Subsidiary of A B Soberano Holdings Corp.)
(Amounts in Philippine Pesos)
Notes
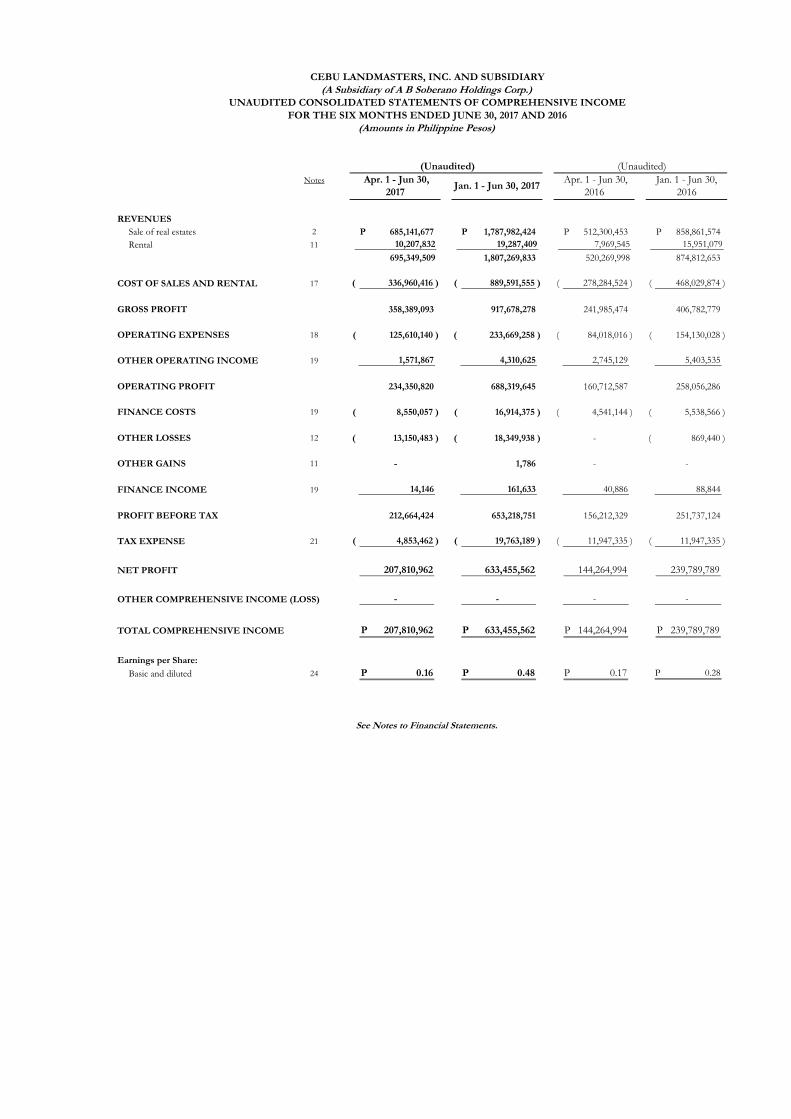
REVENUES
Sale of real estates 2 685,141,677 P 1,787,982,424 P 512,300,453 P 858,861,574 P
Rental 11 10,207,832 19,287,409 7,969,545 15,951,079
695,349,509 1,807,269,833 520,269,998 874,812,653
COST OF SALES AND RENTAL 17 336,960,416 )( 889,591,555 )( 278,284,524 )( 468,029,874 )(
GROSS PROFIT 358,389,093 917,678,278 241,985,474 406,782,779
OPERATING EXPENSES 18 125,610,140 )( 233,669,258 )( 84,018,016 )( 154,130,028 )(
OTHER OPERATING INCOME 19 1,571,867 4,310,625 2,745,129 5,403,535
OPERATING PROFIT 234,350,820 688,319,645 160,712,587 258,056,286
FINANCE COSTS 19 8,550,057 )( 16,914,375 )( 4,541,144 )( 5,538,566 )(
OTHER LOSSES 12 13,150,483 )( 18,349,938 )( - 869,440 )(
OTHER GAINS 11 - 1,786 - -
FINANCE INCOME 19 14,146 161,633 40,886 88,844
PROFIT BEFORE TAX 212,664,424 653,218,751 156,212,329 251,737,124
TAX EXPENSE 21 4,853,462 )( 19,763,189 )( 11,947,335 )( 11,947,335 )(
NET PROFIT 207,810,962 633,455,562 144,264,994 239,789,789
OTHER COMPREHENSIVE INCOME (LOSS) - - - -
TOTAL COMPREHENSIVE INCOME 207,810,962 P 633,455,562 P 144,264,994 P 239,789,789 P
Earnings per Share:
Basic and diluted 24 0.16 P 0.48 P 0.17 P 0.28 P
(Unaudited)
CEBU LANDMASTERS, INC. AND SUBSIDIARY
UNAUDITED CONSOLIDATED STATEMENTS OF COMPREHENSIVE INCOME
FOR THE SIX MONTHS ENDED JUNE 30, 2017 AND 2016
(Amounts in Philippine Pesos)
See Notes to Financial Statements.
(A Subsidiary of A B Soberano Holdings Corp.)
Apr. 1 - Jun 30,
2017 Jan. 1 - Jun 30, 2017
Apr. 1 - Jun 30,
2016
Jan. 1 - Jun 30,
2016
(Unaudited)

Share Share Revaluation Retained
Note Capital Premium Reserves Earnings Total
Balance at January 1, 2017
As previously reported 1,284,000,000 P - 625,202 )( P 254,863,720 P 1,538,238,518 P
Prior period adjustment 23 - - - 43,028,316 )( 43,028,316 )(
As restated 1,284,000,000 - 625,202 )( 211,835,404 1,495,210,202
Transactions with owners
Issuance of capital stock 23 430,000,000 1,616,503,451 - - 2,046,503,451
Collection of subscription receivable 23 - - - - -
Cash dividends 23 - - - - -
430,000,000 1,616,503,451 - - 2,046,503,451
Total comprehensive income for the year
Net profit for the year - - - 633,455,562 633,455,562
Other comprehensive income 23 - - - - -
- - - 633,455,562 633,455,562
Balance at June 30, 2017 (Unaudited) 1,714,000,000 P 1,616,503,451 P 625,202 )( P 845,290,966 P 4,175,169,215 P
Balance at January 1, 2016
As previously reported 837,690,000 P - 2,718,140 )( P 373,543,487 P 1,208,515,347 P
Prior period adjustment 23 - - - 35,089,736 35,089,736
As restated 837,690,000 - 2,718,140 )( 408,633,223 1,243,605,083
Transactions with owners
Issuance of capital stock 23 - - - -
Collection of subscription receivable 23 - - - -
Stock dividend 23 - - - -
Cash dividend 23 - - - 20,000,000 )( 20,000,000 )(
- - - 20,000,000 )( 20,000,000 )(
Total comprehensive income for the year
Net profit for the year - - - 239,789,789 239,789,789
Other comprehensive loss 23 - - - - -
- - - 239,789,789 239,789,789
Balance at June 30, 2016 (Unaudited) 837,690,000 P - 2,718,140 )( P 628,423,012 P 1,463,394,872 P
CEBU LANDMASTERS, INC. AND SUBSIDIARY
UNAUDITED CONSOLIDATED STATEMENTS OF CHANGES IN EQUITY
FOR THE SIX MONTHS ENDED JUNE 30, 2017 AND 2016
(Amounts in Philippine Pesos)
See Notes to Financial Statements.
(A Subsidiary of A B Soberano Holdings Corp.)
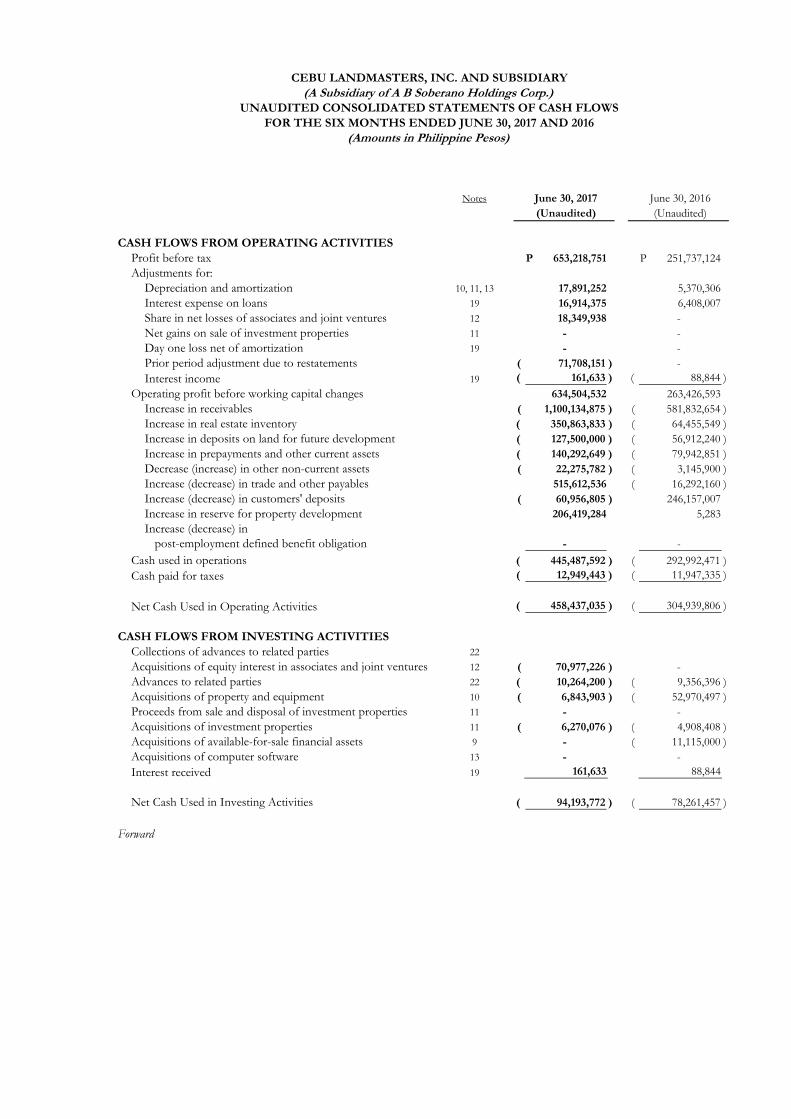
Notes June 30, 2017 June 30, 2016
(Unaudited) (Unaudited)
CASH FLOWS FROM OPERATING ACTIVITIES
Profit before tax 653,218,751 P 251,737,124 P
Adjustments for:
Depreciation and amortization 10, 11, 13 17,891,252 5,370,306
Interest expense on loans 19 16,914,375 6,408,007
Share in net losses of associates and joint ventures 12 18,349,938 -
Net gains on sale of investment properties 11 - -
Day one loss net of amortization 19 - -
Prior period adjustment due to restatements 71,708,151 )( -
Interest income 19 161,633 )( 88,844 )(
Operating profit before working capital changes 634,504,532 263,426,593
Increase in receivables 1,100,134,875 )( 581,832,654 )(
Increase in real estate inventory 350,863,833 )( 64,455,549 )(
Increase in deposits on land for future development 127,500,000 )( 56,912,240 )(
Increase in prepayments and other current assets 140,292,649 )( 79,942,851 )(
Decrease (increase) in other non-current assets 22,275,782 )( 3,145,900 )(
Increase (decrease) in trade and other payables 515,612,536 16,292,160 )(
Increase (decrease) in customers' deposits 60,956,805 )( 246,157,007
Increase in reserve for property development 206,419,284 5,283
Increase (decrease) in
post-employment defined benefit obligation - -
Cash used in operations 445,487,592 )( 292,992,471 )(
Cash paid for taxes 12,949,443 )( 11,947,335 )(
Net Cash Used in Operating Activities 458,437,035 )( 304,939,806 )(
CASH FLOWS FROM INVESTING ACTIVITIES
Collections of advances to related parties 22
Acquisitions of equity interest in associates and joint ventures 12 70,977,226 )( -
Advances to related parties 22 10,264,200 )( 9,356,396 )(
Acquisitions of property and equipment 10 6,843,903 )( 52,970,497 )(
Proceeds from sale and disposal of investment properties 11 - -
Acquisitions of investment properties 11 6,270,076 )( 4,908,408 )(
Acquisitions of available-for-sale financial assets 9 - 11,115,000 )(
Acquisitions of computer software 13 - -
Interest received 19 161,633 88,844
Net Cash Used in Investing Activities 94,193,772 )( 78,261,457 )(
Forward
CEBU LANDMASTERS, INC. AND SUBSIDIARY
UNAUDITED CONSOLIDATED STATEMENTS OF CASH FLOWS
FOR THE SIX MONTHS ENDED JUNE 30, 2017 AND 2016
(Amounts in Philippine Pesos)
(A Subsidiary of A B Soberano Holdings Corp.)

Consolidated Parent Company
June 30, 2017 June 30, 2016
Notes (See Note 2) (See Note 2)
CASH FLOWS FROM FINANCING ACTIVITIES
Proceeds of interest-bearing loans 14 286,081,381 P 376,827,158 P
Cash dividends paid 23 - 20,000,000 )(
Repayments of interest-bearing loans 14 - -
Proceeds from share issuance - initial public offering 23 2,150,000,000 -
IPO Costs charged to APIC 23 103,496,549 )( -
Interest paid 19 16,914,375 )( 6,408,007 )(
Repayments of advances from related parties 22 - -
Advances from related parties 22 - -
Net Cash From Financing Activities 2,315,670,457 350,419,151
NET INCREASE (DECREASE)
IN CASH AND CASH EQUIVALENTS 1,763,039,650 32,782,112 )(
CASH AND CASH EQUIVALENTS
AT BEGINNING OF PERIOD 90,617,743 123,644,624
CASH AND CASH EQUIVALENTS AT END OF PERIOD 1,853,657,393 P 90,862,512 P
See Notes to Financial Statements.
- 2 -

CEBU LANDMASTERS, INC. AND SUBSIDIARY (A Subsidiary of A B Soberano Holdings Corp.)
UNAUDITED CONSOLIDATED NOTES TO FINANCIAL STATEMENTS JUNE 30, 2017 AND DECEMBER 31, 2016
(Amounts in Philippine Pesos) 1. CORPORATE INFORMATION
1.1 General
Cebu Landmasters, Inc. (the Parent Company or CLI) was incorporated in the Republic of
the Philippines and registered with the Securities and Exchange Commission (SEC) on
September 26, 2003. CLI is presently engaged in real estate-related activities such as real estate
development, sales, leasing and property management. The company’s real estate portfolios
include residential condominium units, subdivision house & lots and townhouses as well as
office projects and retail spaces.
The Parent Company’s registered office address and principal place of business is at 10th
Floor, Park Centrale Tower, J.M. del Mar Street, Cebu I.T. Park, Brgy. Apas, Cebu City after
the exchange granted its approval of the change in address last October 24, 2016.
In June 2, 2017, The Parent Company became publicly listed under the ticker name – CLI
which is 66.2% collectively owned by AB Soberano Holdings Corporation (ultimate Parent
Company) , Soberano Family and a number of key management while 33.8%(Public float) is
owned by PCD Nominee Corporations, other entities and Individuals.
As of June 30, 2017, the Company holds ownership interests in the following subsidiaries and
associates:
Subsidiaries/ Associates Percent of Ownership
2017 2016
CLI Premier Hotels Int’l. Inc. 100% 100%
Cebu Landmasters Property Management, Inc. 100% -
BL CBP Ventures 50% 50%
El Camino Developers Cebu 35% 35%
Yuson Excellence Soberano 50% 50%
Ming-Mori Development Corporation 19% 19%
Magspeak Nature Park Inc. 25% 25%
Mivesa Garden Residences, Inc. 45% -
AS Fortuna Property Ventures 40% -
- 2 -
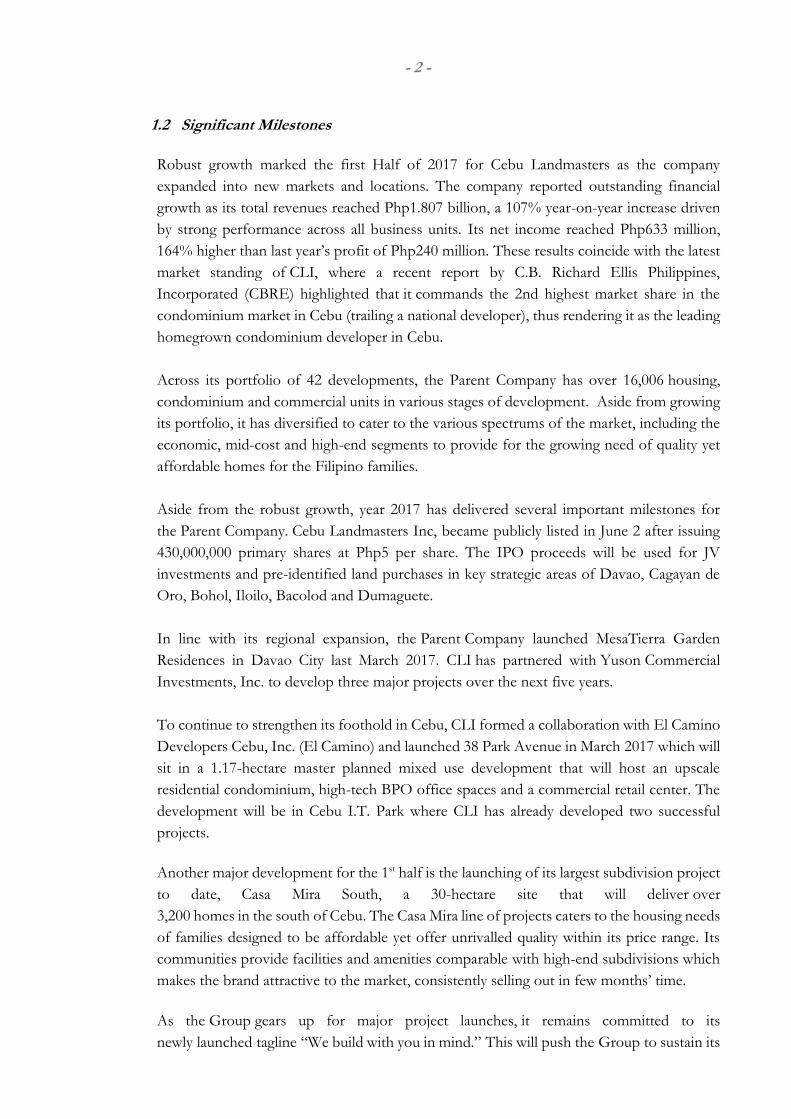
1.2 Significant Milestones
Robust growth marked the first Half of 2017 for Cebu Landmasters as the company
expanded into new markets and locations. The company reported outstanding financial
growth as its total revenues reached Php1.807 billion, a 107% year-on-year increase driven
by strong performance across all business units. Its net income reached Php633 million,
164% higher than last year’s profit of Php240 million. These results coincide with the latest
market standing of CLI, where a recent report by C.B. Richard Ellis Philippines,
Incorporated (CBRE) highlighted that it commands the 2nd highest market share in the
condominium market in Cebu (trailing a national developer), thus rendering it as the leading
homegrown condominium developer in Cebu.
Across its portfolio of 42 developments, the Parent Company has over 16,006 housing,
condominium and commercial units in various stages of development. Aside from growing
its portfolio, it has diversified to cater to the various spectrums of the market, including the
economic, mid-cost and high-end segments to provide for the growing need of quality yet
affordable homes for the Filipino families.
Aside from the robust growth, year 2017 has delivered several important milestones for
the Parent Company. Cebu Landmasters Inc, became publicly listed in June 2 after issuing
430,000,000 primary shares at Php5 per share. The IPO proceeds will be used for JV
investments and pre-identified land purchases in key strategic areas of Davao, Cagayan de
Oro, Bohol, Iloilo, Bacolod and Dumaguete.
In line with its regional expansion, the Parent Company launched MesaTierra Garden
Residences in Davao City last March 2017. CLI has partnered with Yuson Commercial
Investments, Inc. to develop three major projects over the next five years.
To continue to strengthen its foothold in Cebu, CLI formed a collaboration with El Camino
Developers Cebu, Inc. (El Camino) and launched 38 Park Avenue in March 2017 which will
sit in a 1.17-hectare master planned mixed use development that will host an upscale
residential condominium, high-tech BPO office spaces and a commercial retail center. The
development will be in Cebu I.T. Park where CLI has already developed two successful
projects.
Another major development for the 1st half is the launching of its largest subdivision project
to date, Casa Mira South, a 30-hectare site that will deliver over
3,200 homes in the south of Cebu. The Casa Mira line of projects caters to the housing needs
of families designed to be affordable yet offer unrivalled quality within its price range. Its
communities provide facilities and amenities comparable with high-end subdivisions which
makes the brand attractive to the market, consistently selling out in few months’ time.
As the Group gears up for major project launches, it remains committed to its
newly launched tagline “We build with you in mind.” This will push the Group to sustain its

- 3 -
robust financial and operational growth, while maintaining its customer-first approach in
delivering its projects in a timely and quality manner.
In over 14 years, CLI has become a leading homegrown developer in Cebu with its growing
mix of residential, commercial, hospitality, industrial and mixed-use product offerings. This
is enabled by its fully-integrated real estate set-up encompassing acquisitions, business
development, technical planning, engineering and project management, sales and marketing,
documentation and licensing, accounting and finance, legal, human resource and
administration, customer care and property management. CLI prides itself on its hands-on
and personalized approach which allows itself to respond effectively to its clients and
industry partners.
Looking ahead, the company believes that despite the challenges in the industry, Cebu Landmasters will be at the forefront, surpassing old limits, setting new standards and introducing new trends that will further bring it closer to its vision to be the no. 1 Real estate developer in the Visayas and Mindanao Region.
1.3 Listing Shares of Stock in the Philippine Stock Exchange On June 2, 2017, the Parent Company was officially listed at the Philippine Stock Exchange (PSE). Its initial public offering (IPO) of 430,000,000 common shares at PhP5.00 per share by way of primary offer with optional shares of up to 75,000,000 common shares by way of secondary offer culminated the listing and trading in the PSE.
2. SUMMARY OF SIGNIFICANT ACCOUNTING POLICIES
The significant accounting policies that have been used in the preparation of these financial statements are summarized below and in the succeeding pages. These policies have been consistently applied to all the years presented, unless otherwise stated. 2.1 Basis of Preparation of Consolidated Financial Statements
These interim financial statements are for six months ended June 30, 2017 and 2016. They have been prepared in accordance with Philippine Accounting Standard (PAS) 34, Interim Financial Reporting. They do not include all the information and disclosures required in the annual consolidated financial statements and should be read in conjunction with the audited consolidated financial statements of the Group as at and for the year ended December 31, 2016. The preparation of interim condensed consolidated financial statements in accordance with Philippine Financial Reporting Standards (PFRS) requires management to make judgments, estimates and assumptions that affect the application of policies and reported amounts of assets and liabilities, income and expenses. Although these estimates are based on management’s best knowledge of current events and actions, actual results may ultimately differ from those estimates. As discussed in Note 1, CPH became a subsidiary of CLI in 2016. Accordingly, in 2016, the Group started preparing consolidated financial statements. The statements of financial position as at and for the period ended June 30, 2017 and December 31,
- 4 -
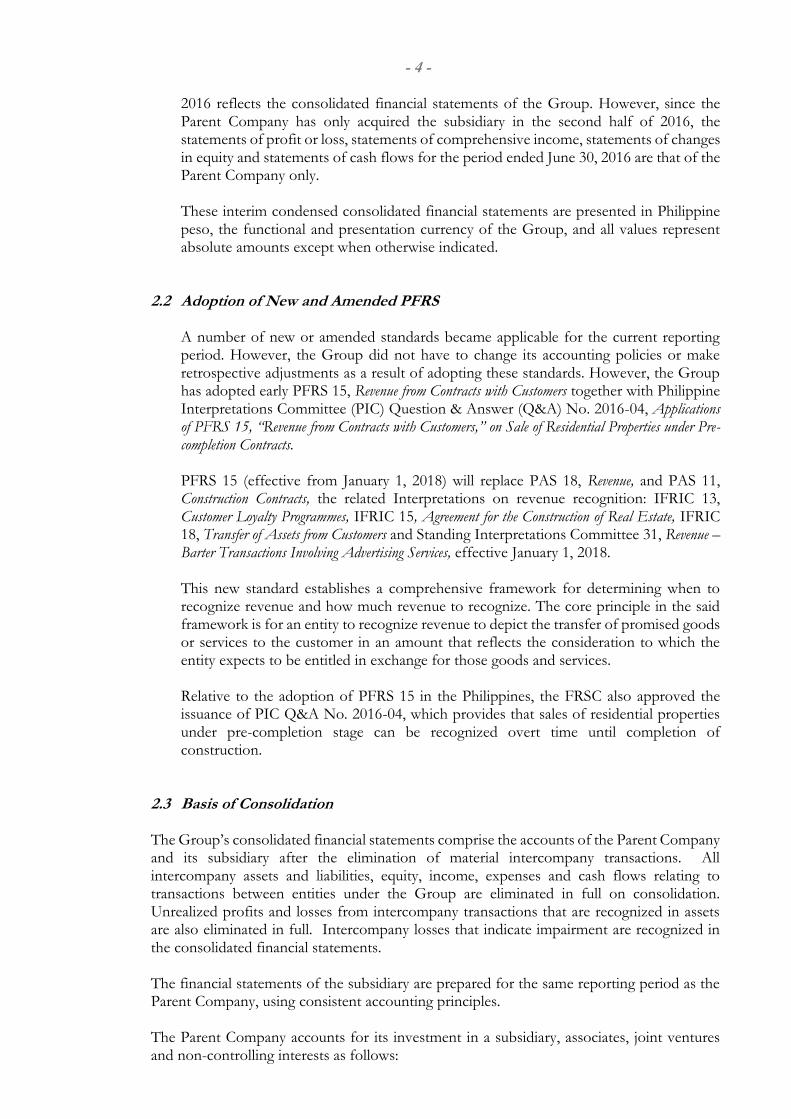
2016 reflects the consolidated financial statements of the Group. However, since the Parent Company has only acquired the subsidiary in the second half of 2016, the statements of profit or loss, statements of comprehensive income, statements of changes in equity and statements of cash flows for the period ended June 30, 2016 are that of the Parent Company only. These interim condensed consolidated financial statements are presented in Philippine peso, the functional and presentation currency of the Group, and all values represent absolute amounts except when otherwise indicated.
2.2 Adoption of New and Amended PFRS
A number of new or amended standards became applicable for the current reporting period. However, the Group did not have to change its accounting policies or make retrospective adjustments as a result of adopting these standards. However, the Group has adopted early PFRS 15, Revenue from Contracts with Customers together with Philippine Interpretations Committee (PIC) Question & Answer (Q&A) No. 2016-04, Applications of PFRS 15, “Revenue from Contracts with Customers,” on Sale of Residential Properties under Pre-completion Contracts. PFRS 15 (effective from January 1, 2018) will replace PAS 18, Revenue, and PAS 11, Construction Contracts, the related Interpretations on revenue recognition: IFRIC 13, Customer Loyalty Programmes, IFRIC 15, Agreement for the Construction of Real Estate, IFRIC 18, Transfer of Assets from Customers and Standing Interpretations Committee 31, Revenue – Barter Transactions Involving Advertising Services, effective January 1, 2018. This new standard establishes a comprehensive framework for determining when to recognize revenue and how much revenue to recognize. The core principle in the said framework is for an entity to recognize revenue to depict the transfer of promised goods or services to the customer in an amount that reflects the consideration to which the entity expects to be entitled in exchange for those goods and services. Relative to the adoption of PFRS 15 in the Philippines, the FRSC also approved the issuance of PIC Q&A No. 2016-04, which provides that sales of residential properties under pre-completion stage can be recognized overt time until completion of construction.
2.3 Basis of Consolidation The Group’s consolidated financial statements comprise the accounts of the Parent Company and its subsidiary after the elimination of material intercompany transactions. All intercompany assets and liabilities, equity, income, expenses and cash flows relating to transactions between entities under the Group are eliminated in full on consolidation. Unrealized profits and losses from intercompany transactions that are recognized in assets are also eliminated in full. Intercompany losses that indicate impairment are recognized in the consolidated financial statements. The financial statements of the subsidiary are prepared for the same reporting period as the Parent Company, using consistent accounting principles. The Parent Company accounts for its investment in a subsidiary, associates, joint ventures and non-controlling interests as follows:
- 5 -
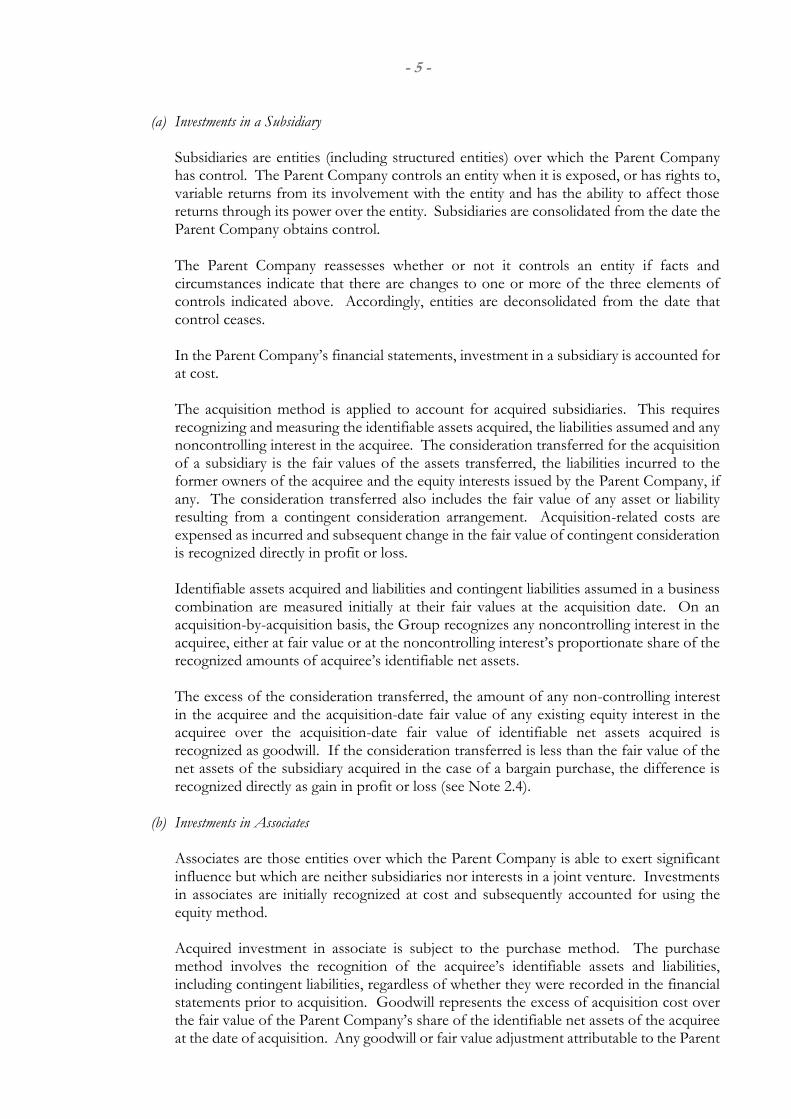
(a) Investments in a Subsidiary
Subsidiaries are entities (including structured entities) over which the Parent Company has control. The Parent Company controls an entity when it is exposed, or has rights to, variable returns from its involvement with the entity and has the ability to affect those returns through its power over the entity. Subsidiaries are consolidated from the date the Parent Company obtains control.
The Parent Company reassesses whether or not it controls an entity if facts and circumstances indicate that there are changes to one or more of the three elements of controls indicated above. Accordingly, entities are deconsolidated from the date that control ceases. In the Parent Company’s financial statements, investment in a subsidiary is accounted for at cost.
The acquisition method is applied to account for acquired subsidiaries. This requires recognizing and measuring the identifiable assets acquired, the liabilities assumed and any noncontrolling interest in the acquiree. The consideration transferred for the acquisition of a subsidiary is the fair values of the assets transferred, the liabilities incurred to the former owners of the acquiree and the equity interests issued by the Parent Company, if any. The consideration transferred also includes the fair value of any asset or liability resulting from a contingent consideration arrangement. Acquisition-related costs are expensed as incurred and subsequent change in the fair value of contingent consideration is recognized directly in profit or loss. Identifiable assets acquired and liabilities and contingent liabilities assumed in a business combination are measured initially at their fair values at the acquisition date. On an acquisition-by-acquisition basis, the Group recognizes any noncontrolling interest in the acquiree, either at fair value or at the noncontrolling interest’s proportionate share of the recognized amounts of acquiree’s identifiable net assets. The excess of the consideration transferred, the amount of any non-controlling interest in the acquiree and the acquisition-date fair value of any existing equity interest in the acquiree over the acquisition-date fair value of identifiable net assets acquired is recognized as goodwill. If the consideration transferred is less than the fair value of the net assets of the subsidiary acquired in the case of a bargain purchase, the difference is recognized directly as gain in profit or loss (see Note 2.4).
(b) Investments in Associates
Associates are those entities over which the Parent Company is able to exert significant influence but which are neither subsidiaries nor interests in a joint venture. Investments in associates are initially recognized at cost and subsequently accounted for using the equity method. Acquired investment in associate is subject to the purchase method. The purchase method involves the recognition of the acquiree’s identifiable assets and liabilities, including contingent liabilities, regardless of whether they were recorded in the financial statements prior to acquisition. Goodwill represents the excess of acquisition cost over the fair value of the Parent Company’s share of the identifiable net assets of the acquiree at the date of acquisition. Any goodwill or fair value adjustment attributable to the Parent
- 6 -
Company’s share in the associate is included in the amount recognized as investment in an associate. All subsequent changes to the ownership interest in the equity of the associates are recognized in the Parent Company’s carrying amount of the investments. Changes resulting from the profit or loss generated by the associates are credited or charged to Share in Net Earnings (Losses) of Associates and presented as Other Gains or Other Losses in the statement of profit or loss. Impairment loss is provided when there is objective evidence that the investment in an associate will not be recovered.
Changes resulting from other comprehensive income of the associate or items recognized directly in the associate’s equity are recognized in other comprehensive income or equity of the Parent Company, as applicable. However, when the Parent Company’s share of losses in an associate equals or exceeds its interest in the associate, including any other unsecured receivables, the Parent Company does not recognize further losses, unless it has incurred obligations or made payments on behalf of the associate. If the associate subsequently reports profits, the investor resumes recognizing its share of those profits only after its share of the profits exceeds the accumulated share of losses that has previously not been recognized. Distributions received from the associates are accounted for as a reduction of the carrying value of the investment.
(b) Investments in Joint Ventures A joint venture pertains to a joint arrangement whereby the parties that have joint control of the arrangement have rights to the net assets of the arrangement. A joint venture entity pertains to whose economic activities are jointly controlled by the Group and by other venturers independent of the Group (joint venturers). Investment in joint venture is accounted for using the equity method of accounting. Under this method, on initial recognition, the investment in joint venture is recognized at cost and the carrying amount is increased or decreased to recognize the investor’s share in the profit or loss of the investee after the date of the acquisition. The investor’s share of the investee’s profit or loss is recognized in the investor’s profit or loss. Distributions received from an investee reduce the carrying amount of the investment. Adjustments to the carrying amount may also be necessary for a change in the investor’s proportionate interest in the investee arising from changes in the investee’s other comprehensive income.
(c) Transactions with Noncontrolling Interests The Group’s transactions with noncontrolling interests that do not result in loss of control are accounted for as equity transactions – that is, as transaction with the owners of the Group in their capacity as owners. The difference between the fair value of any consideration paid and the relevant share acquired of the carrying value of the net assets of the subsidiary is recognized in equity. Disposals of equity investments to noncontrolling interests result in gains and losses for the Group that are also recognized in equity. When the Group ceases to have control over a subsidiary, any retained interest in the entity is remeasured to its fair value at the date when control is lost, with the change in

- 7 -
carrying amount recognized in profit or loss. The fair value is the initial carrying amount for the purposes of subsequently accounting for the retained interest as an associate, joint venture or financial asset. In addition, any amounts previously recognized in other comprehensive income in respect of that entity are accounted for as if the Group had directly disposed of the related assets or liabilities. This may mean that amounts previously recognized in other comprehensive income are reclassified to profit or loss.
2.4 Business Combination
Business acquisitions are accounted for using the acquisition method of accounting.
Goodwill represents the excess of the cost of an acquisition over the fair value of the Group’s
share of the net identifiable assets of the acquired subsidiary at the date of acquisition.
Subsequent to initial recognition, goodwill is measured at cost less any accumulated
impairment losses. Goodwill is tested annually for impairment and carried at cost less
accumulated impairment losses. Impairment losses on goodwill are not reversed (see Note
2.17).
Negative goodwill which is the excess of the Group’s interest in the net fair value of net
identifiable assets acquired over acquisition cost is charged directly to income.
For the purpose of impairment testing, goodwill is allocated to cash-generating units or
groups of cash-generating units that are expected to benefit from the business combination
in which the goodwill arose. The cash-generating units or groups of cash-generating units
are identified according to operating segment. Gains and losses on the disposal of an interest
in a subsidiary include the carrying amount of goodwill relating to it.
If the business combination is achieved in stages, the acquirer is required to remeasure its
previously held equity interest in the acquiree at its acquisition-date fair value and recognize
the resulting gain or loss, if any, in the profit or loss or other comprehensive income, as
appropriate.
Any contingent consideration to be transferred by the Group is recognized at fair value at the
acquisition date. Subsequent changes to the fair value of the contingent consideration that is
deemed to be an asset or liability is recognized in accordance with PAS 37, Provisions, Contingent
Liabilities and Contingent Assets, either in profit or loss or as a change to other comprehensive
income. Contingent consideration that is classified as equity is not remeasured, and its
subsequent settlement is accounted for within equity.
2.5 Financial Assets
Financial assets are recognized when the Group becomes a party to the contractual terms of
the financial instrument. For purposes of classifying financial assets, an instrument is
considered as an equity instrument if it is non-derivative and meets the definition of equity
for the issuer in accordance with the criteria of PAS 32. All other non-derivative financial
instruments are treated as debt instruments.
(a) Classification and Measurement of Financial Assets
Financial assets other than those designated and effective as hedging instruments are classified into the following categories: FVTPL, loans and receivables, held-to-maturity
- 8 -
investments and available-for-sale (AFS) financial assets. Financial assets are assigned to the different categories by management on initial recognition, depending on the purpose for which the investments were acquired.
Regular purchases and sales of financial assets are recognized on their trade date. All financial assets that are not classified as at FVTPL are initially recognized at fair value plus any directly attributable transaction costs. Financial assets carried at FVTPL are initially recorded at fair value and the related transaction costs are recognized in profit or loss. Currently, the Group’s financial assets are categorized as loans and receivables and AFS financial assets. A more detailed description of the two categories of financial assets follows. (i) Loans and Receivables
Loans and receivables are non-derivative financial assets with fixed or determinable payments that are not quoted in an active market. They arise when the Group provides money, goods or services directly to a debtor with no intention of trading the receivables. They are included in current assets, except those with maturities greater than 12 months after the end of each reporting period, which are classified as non-current assets. The Group’s financial assets categorized as loans and receivables are presented as Cash and Cash Equivalents, Receivables (except for advances to subcontractors and advances to officers and employees), Advances to Related Parties, and as part of Other Non-current Assets (with respect to refundable deposits) in the statement of financial position. Cash and cash equivalents include cash on hand, savings and demand deposits and short-term, highly liquid investments with original maturities of three months or less, readily convertible to known amounts of cash and which are subject to insignificant risk of changes in value. Loans and receivables are subsequently measured at amortized cost using the effective interest method, less impairment loss, if any.
(ii) AFS Financial Assets This category includes non-derivative financial assets that are either designated to this category or do not qualify for inclusion in any of the other categories of financial assets. They are presented as AFS Financial Assets in the statement of financial position unless management intends to dispose of the investment within 12 months from the reporting period. The Group’s AFS financial assets consist of golf club shares. All financial assets within this category are subsequently measured at fair value. Gains and losses from changes in fair value are recognized in other comprehensive income, net of any income tax effects, and are reported as part of the Revaluation Reserves account in equity, except for interest and dividend income, impairment losses and foreign exchange differences on monetary assets, which are recognized in profit or loss. When the financial asset is disposed of or is determined to be impaired, that is, when there is a significant or prolonged decline in the fair value of the security below its cost, the cumulative fair value gains or losses recognized in other comprehensive income is reclassified from equity to profit or loss and is presented as reclassification

- 9 -
adjustment within other comprehensive income even though the financial asset has not been derecognized.
(b) Impairment of Financial Assets
The Group assesses at the end of each reporting period whether there is objective evidence that a financial asset or group of financial assets is impaired. The Group recognizes impairment loss based on the category of financial assets as discussed: (i) Carried at Amortized Cost – Loans and Receivables
If there is objective evidence that an impairment loss on loans and receivables has been incurred, the amount of the impairment loss is determined as the difference between the assets’ carrying amount and the present value of estimated future cash flows (excluding future credit losses that have not been incurred), discounted at the financial asset’s original effective interest rate or current effective interest rate determined under the contract if the loan has a variable interest rate. The carrying amount of the asset shall be reduced either directly or through the use of an allowance account. The amount of the loss shall be recognized in profit or loss. If in a subsequent period, the amount of the impairment loss decreases and the decrease can be related objectively to an event occurring after the impairment was recognized (such as an improvement in the debtor’s credit rating), the previously recognized impairment loss is reversed by adjusting the allowance account. The reversal shall not result in a carrying amount of the financial asset that exceeds what the amortized cost would have been had the impairment not been recognized at the date the impairment is reversed. The amount of the reversal is recognized in profit or loss.
(ii) Carried at Cost – AFS Financial Assets If there is objective evidence of impairment for any of the unquoted equity instruments that is not carried at fair value because its fair value cannot be reliably measured, or on a derivative asset that is linked to and required to be settled by delivery of such an unquoted equity instrument, impairment loss is recognized. The amount of impairment loss is the difference between the carrying amount of the financial asset and the present value of estimated future cash flows discounted at the current market rate of return for a similar financial asset. Such impairment losses are not reversed.
(iii) Carried at Fair Value – AFS Financial Assets When a decline in the fair value of an AFS financial asset has been recognized in other comprehensive income and there is objective evidence that the asset is impaired, the cumulative loss – measured as the difference between the acquisition cost (net of any principal repayment and amortization) and current fair value, less any impairment loss on that financial asset previously recognized in profit or loss – is reclassified from Revaluation Reserves to profit or loss as a reclassification adjustment even though the financial asset has not been derecognized.
- 10 -
Impairment losses recognized in profit or loss on equity instruments are not reversed through profit or loss. Reversal of impairment losses are recognized in other comprehensive income, except for financial assets that are debt securities which are recognized in profit or loss only if the reversal can be objectively related to an event occurring after the impairment loss was recognized.
(c) Items of Income and Expense Related to Financial Assets All income and expenses, except those arising from operating activities, relating to financial assets that are recognized in profit or loss are presented as part of Finance Income or Finance Costs in the statement of profit or loss. Non-compounding interest and other cash flows resulting from holding financial assets are recognized in profit or loss when earned, regardless of how the related carrying amount of financial assets is measured.
(d) Derecognition of Financial Assets The financial assets (or where applicable, a part of a financial asset or part of a group of financial assets) are derecognized when the contractual rights to receive cash flows from the financial instruments expire, or when the financial assets and all substantial risks and rewards of ownership have been transferred to another party. If the Group neither transfers nor retains substantially all the risks and rewards of ownership and continues to control the transferred asset, the Group recognizes its retained interest in the asset and an associated liability for amounts it may have to pay. If the Group retains substantially all the risks and rewards of ownership of a transferred financial asset, the Group continues to recognize the financial asset and also recognizes a collateralized borrowing for the proceeds received.
2.6 Real Estate Inventory This pertains to cost of land and development costs of real estate properties that are being developed and those that are already available for sale. Interest incurred during the development of the project is capitalized (see also Note 2.15). Cost of real estate property sold before completion of the development is determined based on the actual costs incurred to date plus estimated costs to complete the development of the property, if any. The estimated expenditures for the completion of sold real estate property, as determined by the project engineers, are charged to cost of real estate sales with a corresponding credit to the Reserve for Property Development account. Real estate inventory is valued at the lower of cost and net realizable value. Net realizable value is the estimated selling price in the ordinary course of business, less estimated costs of completion and the estimated costs necessary to make the sale. The effect of revisions in the total project cost estimates is recognized in the year in which these changes become known. Any probable loss from a real estate project is charged to current operations when determined.
- 11 -
2.7 Deposits on Land for Future Development Deposits on land for future development pertain to advance cash payments made to sellers of properties purchased by the Group but title over the properties have not yet been transferred to the Group. Once sale is consummated which is usually within 12 months from the date the deposit is made, such advance payments are applied to the full amount of the contract price and debited to the Real Estate Inventory account. 2.8 Prepayments and Other Assets Prepayments and other assets pertain to other resources controlled by the Group as a result of past events. They are recognized in the consolidated financial statements when it is probable that the future economic benefits will flow to the Group and the asset has a cost or value that can be measured reliably. Other recognized assets of similar nature, where future economic benefits are expected to flow to the Group beyond one year after the end of the reporting period are classified as part of non-current assets.
2.9 Property and Equipment Items of property and equipment are measured at cost less accumulated depreciation and any impairment in value. The cost of an asset comprises its purchase price and directly attributable costs of bringing the asset to working condition for its intended use. Expenditures for additions, major improvements and renewals are capitalized while expenditures for repairs and maintenance are charged to expense as incurred. Cost also includes capitalized borrowing costs (see also Note 2.15).
Depreciation is computed on the straight-line basis over the estimated useful lives of the assets as follows:
Buildings 20 years Transportation equipment 5 years Office equipment 3-5 years Furniture and fixtures 2-5 years
Leasehold improvements are amortized over the useful life of the improvements of 10 years or the lease term, whichever is shorter. Fully-depreciated assets are retained in the accounts until they are no longer in use and no further charge for depreciation is made in respect of those assets.
An asset’s carrying amount is written down immediately to its recoverable amount if the asset’s carrying amount is greater than its estimated recoverable amount (see Note 2.17). The residual values, estimated useful lives and method of depreciation of property and equipment are reviewed, and adjusted if appropriate, at the end of each reporting period.
- 12 -
An item of property and equipment, including the related accumulated depreciation and impairment losses, if any, is derecognized upon disposal or when no future economic benefits are expected to arise from the continued use of the asset. Any gain or loss arising on derecognition of the asset (calculated as the difference between the net disposal proceeds and the carrying amount of the item) is included in profit or loss in the year the item is derecognized. 2.10 Investment Properties Investment properties are properties held either to earn rental income or for capital appreciation or for both, but not for sale in the ordinary course of business, use in the production or supply of goods or services or for administrative purposes. Cost of the asset includes cost of construction and capitalized borrowing costs (see also Note 2.15). Investment properties are carried at cost, net of accumulated depreciation and any impairment in value, except for land which is not subjected to depreciation (see Note 2.17). Depreciation of investment properties that are subject to depreciation is computed using the straight-line method over the estimated useful lives of the assets of 20 years. Investment properties are derecognized upon disposal or when permanently withdrawn from use and no future economic benefit is expected from their disposal.
2.11 Financial Liabilities Financial liabilities, which include interest-bearing loans and trade and other payables [except government-related obligations, advance rental and deferred output value-added tax (VAT) and output VAT], are recognized when the Group becomes a party to the contractual terms of the instrument. All interest-related charges incurred on a financial liability, except those that are capitalized are recognized as an expense in profit or loss as Finance Costs in the statement of profit or loss.
Interest-bearing loans are raised for support of funding of operations. Finance charges, including premiums payable on settlement or redemption and direct issue costs, are charged to profit or loss on an accrual basis using the effective interest method and are added to the carrying amount of the instrument to the extent that these are not settled in the period in which they arise. Trade and other payables are recognized initially at their fair values and subsequently measured at amortized cost, using effective interest method for maturities beyond one year, less settlement payments. Financial liabilities are classified as current liabilities if payment is due to be settled within one year or less after the end of the reporting period (or in the normal operating cycle of the business, if longer) or the Group does not have an unconditional right to defer settlement of the liability for at least 12 months after the end of the reporting period. Otherwise, these are presented as non-current liabilities.
Financial liabilities are derecognized from the statement of financial position only when the obligations are extinguished either through discharge, cancellation or expiration. The difference between the carrying amount of the financial liability derecognized and the consideration paid or payable is recognized in profit or loss.

- 13 -
2.12 Offsetting Financial Instruments Financial assets and financial liabilities are offset and the resulting net amount, considered as a single financial asset or financial liability, is reported in the statement of financial position when the Group currently has a legally enforceable right to set off the recognized amounts and there is an intention to settle on a net basis, or realize the asset and settle the liability simultaneously. The right of set-off must be available at the end of the reporting period, that is, it is not contingent on future event. It must also be enforceable in the normal course of business, in the event of default, and in the event of insolvency or bankruptcy; and must be legally enforceable for both entity and all counterparties to the financial instruments.
2.13 Provisions and Contingencies Provisions are recognized when present obligations will probably lead to an outflow of economic resources and they can be estimated reliably even if the timing or amount of the outflow may still be uncertain. A present obligation arises from the presence of a legal or constructive obligation that has resulted from past events. Provisions are measured at the estimated expenditure required to settle the present obligation, based on the most reliable evidence available at the end of the reporting period, including the risks and uncertainties associated with the present obligation. Where there are a number of similar obligations, the likelihood that an outflow will be required in settlement is determined by considering the class of obligations as a whole. When time value of money is material, long-term provisions are discounted to their present values using a pretax rate that reflects market assessments and the risks specific to the obligation. The increase in the provision due to passage of time is recognized as interest expense. Provisions are reviewed at the end of each reporting period and adjusted to reflect the current best estimate.
In those cases where the possible outflow of economic resource as a result of present obligations is considered improbable or remote, or the amount to be provided for cannot be measured reliably, no liability is recognized in the consolidated financial statements. Similarly, possible inflows of economic benefits to the Group that do not yet meet the recognition criteria of an asset are considered contingent assets, hence, are not recognized in the consolidated financial statements. On the other hand, any reimbursement that the Group can be virtually certain to collect from a third party with respect to the obligation is recognized as a separate asset not exceeding the amount of the related provision.
2.14 Revenue and Expense Recognition Revenue is measured by reference to the fair value of consideration received or receivable by the Group for goods sold and services rendered, excluding VAT, if applicable, and trade discounts. Revenue is recognized to the extent that the revenue can be reliably measured; it is probable that future economic benefits will flow to the Group; and the costs incurred or to be incurred can be measured reliably. In addition, the specific recognition criteria that follows must also be met before revenue is recognized:
(a) Sale of real estates – The Group now applies the percentage-of-completion method of revenue recognition. Under this method, revenue is recognized as the related obligations are fulfilled, measured principally on the basis of the proportion of work completed in a period to total work of the contract. This change of policy is in accordance with PFRS 15, Revenue from Contract with Customers and Philippine Interpretations Committee Question & Answer No. 2016-04, Application
- 14 -
of PFRS 15, "Revenue from Contracts with Customers," on Sale of Residential Properties under Pre-completion Contracts, which provides that sales of residential properties under pre-completion stage can be recognized over time until completion of construction. Management intends to adopt this standard this year after carefully assessing its impact on the Group’s consolidated statements of comprehensive income. Prior to this change in policy, the Group uses the full accrual method of revenue recognition on real estate sales wherein, revenue is recognized in the year when the earning process is virtually complete and the economic benefits to the Group is reasonably assured [see also Note 3.1(a)]. Cost of real estate sales is recognized consistent with the revenue recognition method applied. Cost of residential and commercial lots and units sold before the completion of the development is determined on the basis of the acquisition cost of the land plus its full development costs, which include estimated costs for future development works.
If the transaction does not qualify yet as sale, cash collections from buyers are accounted for using the deposit method and are recorded as Customers’ Deposits which is presented under current liabilities in the statement of financial position.
Subsequent cancellations of prior year sales are deducted from real estate sales and costs in the year in which such cancellations are made.
For tax reporting purposes, the taxable income for the year is based on the provisions of Section 49 of the National Internal Revenue Code (NIRC), as amended, which governs installment sales. Under the NIRC, revenue on sale and cost of real estate sold are recognized in full when the initial payments collected in the year of sale exceed 25% of the selling price; otherwise, revenue and cost of real estate sold are recognized based on the collections.
(b) Rental income – Revenue is recognized on a straight-line basis over the lease term (see also Note 2.16).
(d) Interest income – Income is recognized as the interest accrues taking into account the effective yield on the asset.
(e) Management fee – Revenue is recognized when service is rendered. This includes the management services rendered by CLI to the homeowners’ associations and condominium corporation. These are included as part of Other Operating Income in the statement of profit or loss.
(f) Other income – Revenue is recognized when earned. This includes foregone reservation fees from customers which is reverted to income, mark-up on utilities charged to lessees, and penalties for late payment by customers. These are included as part of Other Operating Income in the statement of profit or loss.
Costs and expenses are recognized in profit or loss upon utilization of goods or services or at the date they are incurred. All finance costs are reported in profit or loss on an accrual basis, except capitalized borrowing costs which are included as part of the cost of the related qualifying asset (see also Note 2.15).
2.15 Borrowing Costs

- 15 -
Borrowing costs are recognized in the period in which they are incurred, except to the extent that they are capitalized. Borrowing costs that are directly attributable to the acquisition, construction or production of a qualifying asset (i.e., an asset that takes a substantial period of time to get ready for its intended use or sale) are capitalized as part of cost of such asset. The capitalization of borrowing costs commences when expenditures for the asset and borrowing costs are being incurred and activities that are necessary to prepare the asset for its intended use or sale are in progress. Capitalization ceases when substantially all such activities are complete.
2.16 Leases The Group accounts for its leases as follows: (a) Group as Lessee
Leases which do not transfer to the Group substantially all the risks and benefits of ownership of the asset are classified as operating leases. Operating lease payments (net of any incentive received from the lessor) are recognized as expense in profit or loss on a straight-line basis over the lease term. Associated costs, such as repairs and maintenance and insurance, are expensed as incurred.
(b) Group as Lessor Leases which do not transfer to the lessee substantially all the risks and benefits of ownership of the asset are classified as operating leases. Lease income from operating leases is recognized in profit or loss on a straight-line basis over the lease term.
The Group determines whether an arrangement is, or contains, a lease based on the substance of the arrangement. It makes an assessment of whether the fulfillment of the arrangement is dependent on the use of a specific asset or assets and the arrangement conveys a right to use the asset. 2.17 Impairment of Non-financial Assets The Group’s property and equipment, investment properties, investment in associates and joint ventures, computer software and other non-financial assets are subject to impairment testing. All other individual assets are tested for impairment whenever events or changes in circumstances indicate that the carrying amount of those assets may not be recoverable. For purposes of assessing impairment, assets are grouped at the lowest levels for which there are separately identifiable cash flows (cash-generating units). As a result, assets are tested for impairment either individually or at the cash-generating unit level. Impairment loss is recognized in profit or loss for the amount by which the asset’s or cash-generating unit’s carrying amount exceeds its recoverable amounts which is the higher of its fair value less costs to sell and its value in use. In determining value in use, management estimates the expected future cash flows from each cash-generating unit and determines the suitable interest rate in order to calculate the present value of those cash flows. The data used for impairment testing procedures are directly linked to the Group’s latest approved budget, adjusted as necessary to exclude the effects of asset enhancements. Discount factors are determined individually for each cash-generating unit and reflect management’s assessment of respective risk profiles, such as market and asset-specific risk factors.

- 16 -
All assets are subsequently reassessed for indications that an impairment loss previously recognized may no longer exist. An impairment loss is reversed if the asset’s or cash-generating unit’s recoverable amount exceeds its carrying amount.
2.18 Employee Benefits The Group provides post-employment benefits to employees through a defined benefit plan and defined contribution plans, and other employee benefits which are recognized as follows: (a) Post-employment Defined Benefit Plan
A defined benefit plan is a post-employment plan that defines an amount of post-employment benefit that an employee will receive on retirement, usually dependent on one or more factors such as age, years of service and salary. The legal obligation for any benefits from this kind of post-employment plan remains with the Group, even if plan assets for funding the defined benefit plan have been acquired. Plan assets may include assets specifically designated to a long-term benefit fund, as well as qualifying insurance policies. The Group’s defined benefit post-employment plan, which became effective on January 1, 2015, covers all regular full-time employees. The pension plan is noncontributory and administered by a trustee. The liability recognized in the statement of financial position for a defined benefit plan is the present value of the defined benefit obligation at the end of the reporting period less the fair value of plan assets. The defined benefit obligation is calculated annually by independent actuaries using the projected unit credit method. The present value of the defined benefit obligation is determined by discounting the estimated future cash outflows for expected benefit payments using a discount rate derived from the interest rates of a zero coupon government bonds as published by Philippine Dealing & Exchange Corp., that are denominated in the currency in which the benefits will be paid and that have terms to maturity approximating to the terms of the related post-employment liability. Remeasurements, comprising of actuarial gains and losses arising from experience adjustments and changes in actuarial assumptions and the return on plan assets (excluding amount included in net interest) are reflected immediately in the statement of financial position with a charge or credit recognized in other comprehensive income in the period in which they arise. Net interest is calculated by applying the discount rate at the beginning of the period, taking account of any changes in the net defined benefit liability or asset during the period as a result of contributions and benefit payments. Net interest is reported as part of Finance Costs or Finance Income in the statement of profit or loss. Past-service costs are recognized immediately in profit or loss in the period of a plan amendment and curtailment, if any.
(b) Post-Employment Defined Contribution Plans A defined contribution plan is a post-employment plan under which the Group pays fixed contributions into an independent entity (i.e. Social Security System). The Group has no legal or constructive obligations to pay further contributions after payment of the fixed contribution. The contributions recognized in respect of defined contribution plans are expensed as they fall due. Liabilities or assets may be recognized if underpayment or prepayment has occurred and are included in current liabilities or current assets as they are normally of a short-term nature.

- 17 -
(c) Termination Benefits Termination benefits are payable when employment is terminated by the Group before the normal retirement date, or whenever an employee accepts voluntary redundancy in exchange for these benefits. The Group recognizes termination benefits at the earlier of when it can no longer withdraw the offer of such benefits and when it recognizes costs for a restructuring that is within the scope of PAS 37 and involves the payment of termination benefits. In the case of an offer made to encourage voluntary redundancy, the termination benefits are measured based on the number of employees expected to accept the offer. Benefits falling due more than 12 months after the reporting period are discounted to their present value.
(d) Performance Bonus The Group recognizes a liability and an expense for bonuses. The Group recognizes a provision where it is contractually obliged to pay the benefits, or where there is a past practice that has created a constructive obligation.
(e) Compensated Absences Compensated absences are recognized for the number of paid leave days (including holiday entitlement) remaining at the end of each reporting period. They are included in the Trade and Other Payables account in the statement of financial position at the undiscounted amount that the Group expects to pay as a result of the unused entitlement.
2.19 Income Taxes Tax expense recognized in profit or loss comprises the sum of deferred tax and current tax not recognized in other comprehensive income or directly in equity, if any. Current tax assets or liabilities comprise those claims from, or obligations to, fiscal authorities relating to the current or prior reporting period, that are uncollected or unpaid at the end of the reporting period. They are calculated using the tax rates and tax laws applicable to the fiscal periods to which they relate, based on the taxable profit for the year. All changes to current tax assets or liabilities are recognized as a component of tax expense in profit or loss. Deferred tax is accounted for using the liability method, on temporary differences at the end of each reporting period between the tax base of assets and liabilities and their carrying amounts for financial reporting purposes. Under the liability method, with certain exceptions, deferred tax liabilities are recognized for all taxable temporary differences and deferred tax assets are recognized for all deductible temporary differences and the carry-forward of unused tax losses and unused tax credits to the extent that it is probable that taxable profit will be available against which the deductible temporary differences can be utilized. Unrecognized deferred tax assets are reassessed at the end of each reporting period and are recognized to the extent that it has become probable that future taxable profit will be available to allow such deferred tax assets to be recovered. Deferred tax assets and liabilities are measured at the tax rates that are expected to apply in the period when the asset is realized or the liability is settled provided such tax rates have been enacted or substantively enacted at the end of the reporting period. The carrying amount of deferred tax assets is reviewed at the end of each reporting period and reduced to the extent that it is probable that sufficient taxable profit will be available to allow all or part of the deferred tax asset to be utilized.

- 18 -
The measurement of deferred tax liabilities and assets reflects the tax consequences that would follow from the manner in which the Group expects, at the end of the reporting period, to recover or settle the carrying amount of its assets and liabilities.
Most changes in deferred tax assets or liabilities are recognized as a component of tax expense in profit or loss, except to the extent that it relates to items recognized in other comprehensive income or directly in equity. In this case, the tax is also recognized in other comprehensive income or directly in equity, respectively. Deferred tax assets and deferred tax liabilities are offset if the Group has a legally enforceable right to set off current tax assets against current tax liabilities and the deferred taxes relate to the same entity and the same taxation authority.
2.20 Related Party Relationships and Transactions
Related party transactions are transfers of resources, services or obligations between the Group and its related parties, regardless whether a price is charged. Parties are considered to be related if one party has the ability to control the other party or exercise significant influence over the other party in making financial and operating decisions. These parties include: (a) individuals owning, directly or indirectly through one or more intermediaries, control or are controlled by, or under common control with the Group; (b) associates; (c) individuals owning, directly or indirectly, an interest in the voting power of the Group that gives them significant influence over the Group and close members of the family of any such individual; and, (d) the Group’s funded retirement plan. In considering each possible related party relationship, attention is directed to the substance of the relationship and not merely on the legal form.
2.21 Segment Reporting Operating segments are reported in a manner consistent with the internal reporting provided to the Group’s executive committee, its chief operating decision maker. The executive committee is responsible for allocating resources and assessing performance of the operating segments. In identifying its operating segments, management generally follows the Group’s products and service lines as well as geographical location of its operation. As indicated in Note 1.2, the Group has only one segment; hence, it does not present any segment-related disclosures. 2.22 Equity Capital stock represents the nominal value of shares that have been issued. Revaluation reserves comprise gains and losses arising from the revaluation of AFS financial assets and remeasurements of post-employment defined benefit plan. Retained earnings represent all current and prior period results of operations as reported in the profit or loss section of the statement of comprehensive income, reduced by the amounts of dividends declared.

- 19 -
2.23 Earnings Per Share Basic earnings per share (EPS) is computed by dividing net profit attributable to equity holders of the Parent Company by the weighted average number of shares issued and outstanding, adjusted retroactively for any stock dividend, stock split or reverse stock split declared during the current period. Diluted EPS is computed by adjusting the weighted average number of ordinary shares outstanding to assume conversion of dilutive potential shares. Currently, the Group does not have dilutive potential shares outstanding, hence, the diluted earnings per share is equal to the basic earnings per share.
2.24 Events After the End of the Reporting Period Any post-year-end event that provides additional information about the Group’s or the Parent Company’s financial position at the end of the reporting period (adjusting event) is reflected in the financial statements. Post-year-end events that are not adjusting events, if any, are disclosed when material to the financial statements.
3. SIGNIFICANT ACCOUNTING JUDGMENTS AND ESTIMATES In preparing the interim condensed consolidated financial statements, management undertakes a number of judgments, estimates and assumptions about recognition and measurement of assets, liabilities, income and expenses. The actual results may differ from the judgments, estimates and assumptions made by management, and will seldom equal the estimated results. The judgments, estimates and assumptions applied in the interim financial statements, including the key sources of estimation uncertainty, were the same as those applied in the Group’s last annual financial statements as of and for the year ended December 31, 2016.
4. CASH AND CASH EQUIVALENTS
Cash and cash equivalents include the following components as at June 30, 2017 and December 31, 2016:
Cash in banks (savings and demand deposits) generally earn interest at rates based on daily bank deposit rates. Short-term placements are made for varying period from 10 to 90 days and earn effective interest ranging from 0.38% to 1.50% per annum for all years presented. Interest income earned from cash and cash equivalents amounted to P161,633 and P 88,844 for the period ended June 2017 and 2016, respectively (see Note 19.3).
June 30, 2017 December 31, 2016
Cash in banks 1,853,412,393 P 82,918,355 P
Cash on hand 245,000 245,000
Short-term placements - 7,454,388
1,853,657,393 P 90,617,743 P
Consolidated

- 20 -
5. RECEIVABLES
This account includes the following:
All of the Group’s receivables have been reviewed for indicators of impairment. Certain contract receivables and other receivables, which are mostly due from various customers but with small amounts, were found to be impaired; hence, adequate amount of allowance for impairment has been recognized. A reconciliation of the allowance for impairment is shown below.
Buyers of real estate properties are given two to three years to complete the amortization of their down payment which ranges from 15% to 20% of the contract price of the real estate being purchased. Contracts receivables, which are all covered by postdated checks, are only recognized upon meeting the criteria for revenue recognition (see Note 2.14). Generally, full payment by buyers of their equity payments is made within 24 months following the recognition of sale which is then followed by full settlement by the buyer’s chosen financing institution of the buyer’s account. Title to real estate properties are transferred to the buyers once full payment has been made. Non-current contract receivables, which are noninterest-bearing, are receivables from buyers whose equity payments are expected to be fully paid after 12 months following the end of the reporting period and those that availed of in-house financing. These are measured at amortized cost which is determined by discounting future cash flows using the applicable
Note June 30, 2017 December 31, 2016
Current:
Contract receivables 22.4, 22.7 3,080,158,076 P 1,990,958,955 P
Advances to subcontractors 93,922,116 66,922,721
Loans to employees 9,979,562 7,935,635
Advances to officers and employees 25,704,322 5,069,748
Other receivables 13,613,780 1,269,773
3,223,377,856 2,072,156,832
Allowance for impairment 2,707,695 )( 2,707,695 )(
3,220,670,161 2,069,449,137
Non-current:
Contract receivables - net 179,673,339 184,374,872
3,400,343,500 P 2,253,824,009 P
Consolidated as of
Note June 30, 2017 December 31, 2016
Balance at beginning of period 2,707,695 P 302,806 P
Impairment losses 18 - 2,404,889
Balance at end of period 2,707,695 P 2,707,695 P
Consolidated

- 21 -
rates of similar types of instruments. The aggregate unamortized discount on non-current contracts receivables amounts to P4,701,533 both as of June 30, 2017 and December 31, 2016. Those buyers that opted to use the in-house financing facility of the Parent Company are usually given a term of 60 months to fully pay their outstanding amortization of the purchase price of the real estate property purchased. These receivables, which are covered by a real estate mortgaged on the related real estate properties, earn annual interest ranging from 15% to 18% per annum. Advances to subcontractors include advance payments for materials, payment of labor and overhead expenses that were paid in behalf of subcontractors. These are applied against the progress billings of subcontractors. Advances to officers and employees are composed of advances for liquidation. Loans to employees are usually personal loans such as medical loans and emergency cash loans which has a term of less than one year. These are unsecured and noninterest-bearing loans that are settled through salary deduction.
6. REAL ESTATE INVENTORY
This account includes the following:
An analysis of the cost of real estate inventory included in cost of sales for the year is presented in Note 17. Condominium building costs consist of the cost of acquisition of land and the cost to construct the units of the vertical projects of the Parent Company. Land development costs pertain to the cost of acquisition of land and site development costs of subdivision projects and other future site projects of the Parent Company.
June 30, 2017 December 31, 2016
Condominium units 38,327,607 P 54,995,751 P
Subdivision units 436,932 436,932
38,764,539 55,432,683
Construction-in-progress (CIP):
Condominium building costs 1,216,077,212 970,182,417
Land development costs 538,902,984 446,243,879
Housing costs 219,416,887 215,588,491
1,974,397,083 1,632,014,787
Raw land inventory 144,608,106 143,976,949
2,157,769,728 P 1,831,424,419 P
Consolidated
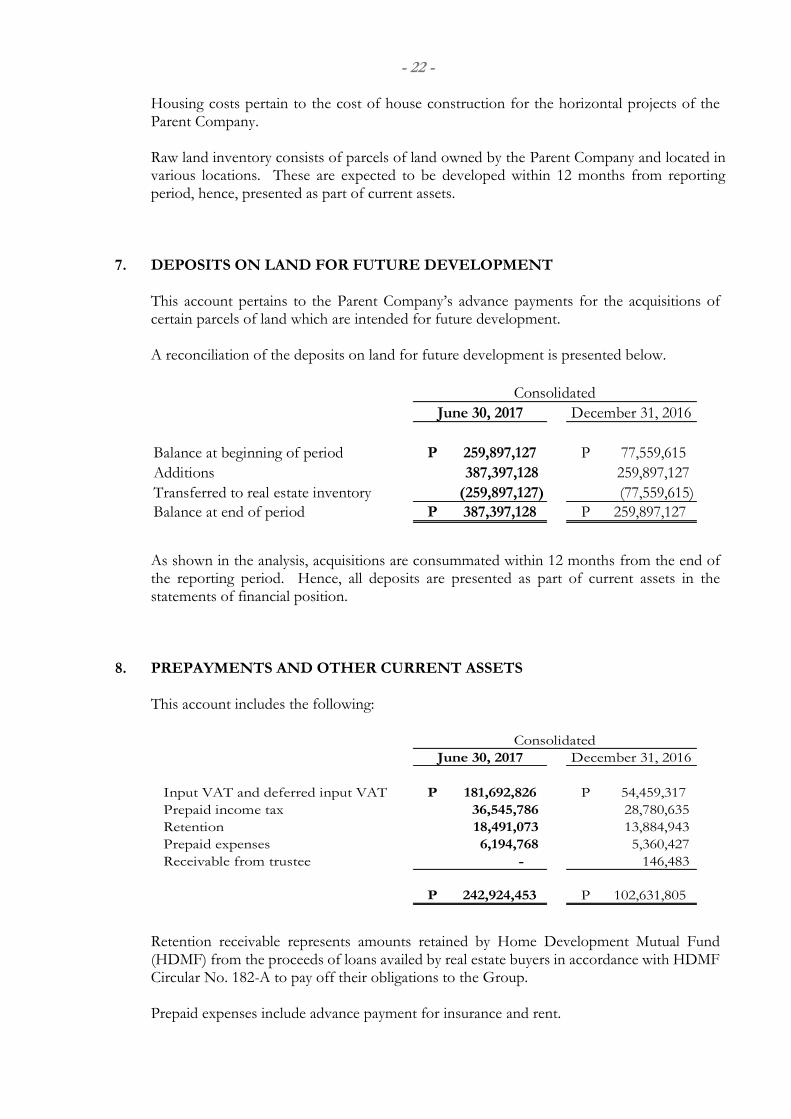
- 22 -
Housing costs pertain to the cost of house construction for the horizontal projects of the Parent Company. Raw land inventory consists of parcels of land owned by the Parent Company and located in various locations. These are expected to be developed within 12 months from reporting period, hence, presented as part of current assets.
7. DEPOSITS ON LAND FOR FUTURE DEVELOPMENT This account pertains to the Parent Company’s advance payments for the acquisitions of certain parcels of land which are intended for future development.
A reconciliation of the deposits on land for future development is presented below.
As shown in the analysis, acquisitions are consummated within 12 months from the end of the reporting period. Hence, all deposits are presented as part of current assets in the statements of financial position.
8. PREPAYMENTS AND OTHER CURRENT ASSETS This account includes the following:
Retention receivable represents amounts retained by Home Development Mutual Fund (HDMF) from the proceeds of loans availed by real estate buyers in accordance with HDMF Circular No. 182-A to pay off their obligations to the Group. Prepaid expenses include advance payment for insurance and rent.
June 30, 2017 December 31, 2016
Balance at beginning of period 259,897,127 P 77,559,615 P
Additions 387,397,128 259,897,127
Transferred to real estate inventory (259,897,127) (77,559,615)
Balance at end of period 387,397,128 P 259,897,127 P
Consolidated
June 30, 2017 December 31, 2016
Input VAT and deferred input VAT 181,692,826 P 54,459,317 P
Prepaid income tax 36,545,786 28,780,635
Retention 18,491,073 13,884,943
Prepaid expenses 6,194,768 5,360,427
Receivable from trustee - 146,483
242,924,453 P 102,631,805 P
Consolidated
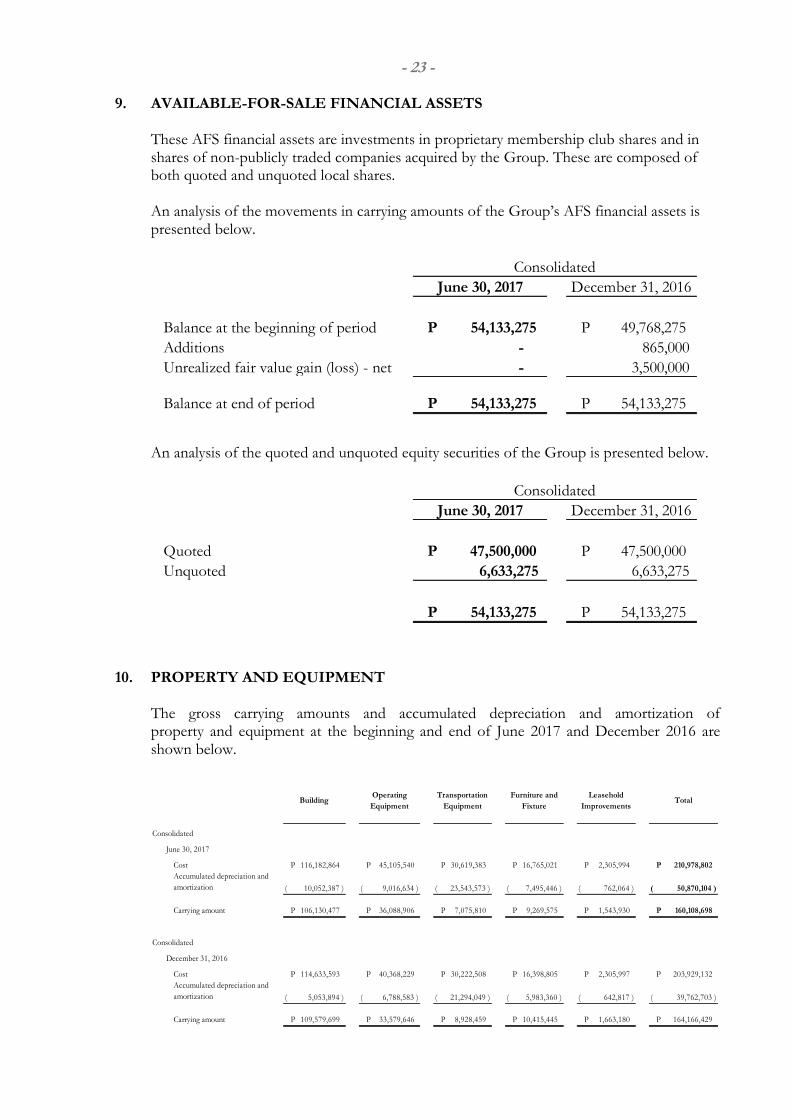
- 23 -
9. AVAILABLE-FOR-SALE FINANCIAL ASSETS These AFS financial assets are investments in proprietary membership club shares and in shares of non-publicly traded companies acquired by the Group. These are composed of both quoted and unquoted local shares.
An analysis of the movements in carrying amounts of the Group’s AFS financial assets is presented below.
An analysis of the quoted and unquoted equity securities of the Group is presented below.
10. PROPERTY AND EQUIPMENT
The gross carrying amounts and accumulated depreciation and amortization of property and equipment at the beginning and end of June 2017 and December 2016 are shown below.
June 30, 2017 December 31, 2016
Balance at the beginning of period 54,133,275 P 49,768,275 P
Additions - 865,000
Unrealized fair value gain (loss) - net - 3,500,000
Balance at end of period 54,133,275 P 54,133,275 P
Consolidated
June 30, 2017 December 31, 2016
Quoted 47,500,000 P 47,500,000 P
Unquoted 6,633,275 6,633,275
54,133,275 P 54,133,275 P
Consolidated
BuildingOperating
Equipment
Transportation
Equipment
Furniture and
Fixture
Leasehold
ImprovementsTotal
Consolidated
June 30, 2017
Cost 116,182,864 P 45,105,540 P 30,619,383 P 16,765,021 P 2,305,994 P 210,978,802 P
Accumulated depreciation and
amortization 10,052,387 )( 9,016,634 )( 23,543,573 )( 7,495,446 )( 762,064 )( 50,870,104 )(
Carrying amount 106,130,477 P 36,088,906 P 7,075,810 P 9,269,575 P 1,543,930 P 160,108,698 P
Consolidated
December 31, 2016
Cost 114,633,593 P 40,368,229 P 30,222,508 P 16,398,805 P 2,305,997 P 203,929,132 P
Accumulated depreciation and
amortization 5,053,894 )( 6,788,583 )( 21,294,049 )( 5,983,360 )( 642,817 )( 39,762,703 )(
Carrying amount 109,579,699 P 33,579,646 P 8,928,459 P 10,415,445 P 1,663,180 P 164,166,429 P
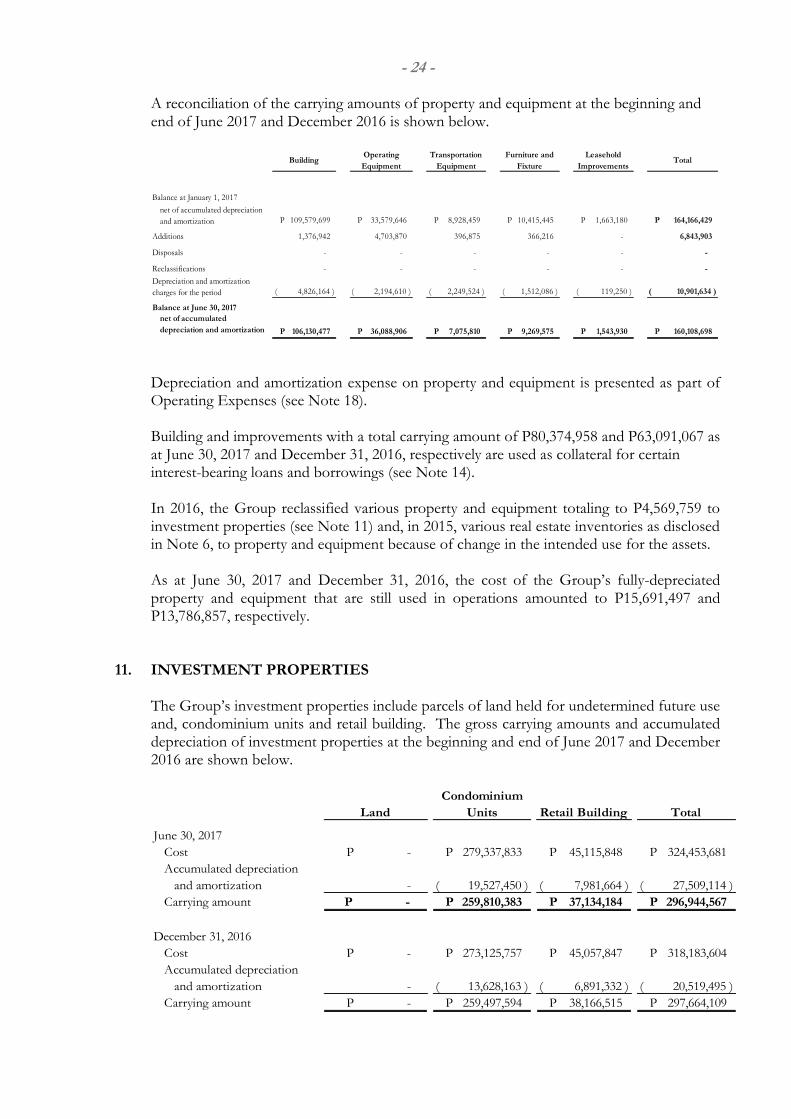
- 24 -
A reconciliation of the carrying amounts of property and equipment at the beginning and end of June 2017 and December 2016 is shown below.
Depreciation and amortization expense on property and equipment is presented as part of Operating Expenses (see Note 18). Building and improvements with a total carrying amount of P80,374,958 and P63,091,067 as at June 30, 2017 and December 31, 2016, respectively are used as collateral for certain interest-bearing loans and borrowings (see Note 14). In 2016, the Group reclassified various property and equipment totaling to P4,569,759 to investment properties (see Note 11) and, in 2015, various real estate inventories as disclosed in Note 6, to property and equipment because of change in the intended use for the assets. As at June 30, 2017 and December 31, 2016, the cost of the Group’s fully-depreciated property and equipment that are still used in operations amounted to P15,691,497 and P13,786,857, respectively.
11. INVESTMENT PROPERTIES The Group’s investment properties include parcels of land held for undetermined future use and, condominium units and retail building. The gross carrying amounts and accumulated depreciation of investment properties at the beginning and end of June 2017 and December 2016 are shown below.
BuildingOperating
Equipment
Transportation
Equipment
Furniture and
Fixture
Leasehold
ImprovementsTotal
Balance at January 1, 2017
net of accumulated depreciation
and amortization 109,579,699 P 33,579,646 P 8,928,459 P 10,415,445 P 1,663,180 P 164,166,429 P
Additions 1,376,942 4,703,870 396,875 366,216 - 6,843,903
Disposals - - - - - -
Reclassifications - - - - - -
Depreciation and amortization
charges for the period 4,826,164 )( 2,194,610 )( 2,249,524 )( 1,512,086 )( 119,250 )( 10,901,634 )(
Balance at June 30, 2017
net of accumulated
depreciation and amortization 106,130,477 P 36,088,906 P 7,075,810 P 9,269,575 P 1,543,930 P 160,108,698 P
Land
Condominium
Units Retail Building Total
June 30, 2017
Cost P - 279,337,833 P 45,115,848 P 324,453,681 P
Accumulated depreciation
and amortization - 19,527,450 )( 7,981,664 )( 27,509,114 )(
Carrying amount P - 259,810,383 P 37,134,184 P 296,944,567 P
December 31, 2016
Cost P - 273,125,757 P 45,057,847 P 318,183,604 P
Accumulated depreciation
and amortization - 13,628,163 )( 6,891,332 )( 20,519,495 )(
Carrying amount P - 259,497,594 P 38,166,515 P 297,664,109 P

- 25 -
A reconciliation of the carrying amounts of investment properties at the beginning and end of June 2017 and December 2016 is shown below.
The Group reclassified various real estate inventories in 2016 and 2015 (see Note 6) to investment properties and various property and equipment in 2016 to investment properties (see Note 10) because of change in the intended use for the assets. Income and expenses from investment properties for the period ended June 30, 2017 and December 31, 2016, 2015 and 2014 are presented below.
The expenses are included as part of Cost of Sales and Rental in the statements of profit or loss for the period ended June 30, 2017 and 2016 (see Note 17).
Land
Condominium
Units Retail Building Total
Balance at January 1, 2017
net of accumulated
depreciation and amortization P - 259,497,594 P 38,166,515 P 297,664,109 P
Additions - 6,175,961 94,115 6,270,076
Disposals - - - -
Reclassifications - - - -
Depreciation and amortization
charges for the period - 5,863,172 )( 1,126,446 )( 6,989,618 )(
Balance at June 30, 2017
net of accumulated
depreciation and amortization P - 259,810,383 P 37,134,184 P 296,944,567 P
Consolidated Parent Company
Note June 30, 2017 June 30, 2016
Rental income 25.1 19,287,409 P 15,951,079 P
Expenses:
Depreciation 6,989,618 1,721,753
Real property taxes - -
17 6,989,618 P 1,721,753 P

- 26 -
12. INVESTMENTS IN ASSOCIATES AND JOINT VENTURES This account comprises the following as at reporting date:
The Group’s investment in associates and its corresponding equity interest as at June 30, 2017 is presented below.
The Group’s investment in joint ventures and its corresponding equity interest as at June 30, 2017 is presented below.
The Group’s associates and joint ventures were all incorporated and they all operate in the Philippines. Their registered office addresses, which are also their principal place of business, are as follows:
Associates: a) El Camino – Baseline Center, Juana Osmeña St., Kamputhaw, Cebu City; b) Magspeak – Don Carlos A. Gothong Port Centre, Quezon Blvd Pier 4, North
Reclamation Area, Cebu City; and, c) Ming-Mori – 10th Floor Park Centrale, Jose Ma. Del Mar St., Cebu IT Park, Apas,
Cebu City. d) AS Fortuna Property Ventures, Inc. - 10th Floor Park Centrale, Jose Ma. Del Mar
St., Cebu IT Park, Apas, Cebu City e) Mivesa Garden Residences, Inc. - 10th Floor Park Centrale, Jose Ma. Del Mar St.,
Cebu IT Park, Apas, Cebu City.
Joint Ventures: a) BL Ventures – AB Soberano Bldg., Salvador Extention, Labangon, Cebu City; and b) YES, Inc. – Suite A, 204 Pladez de Luisa Complex, 140 R. Magsaysay Ave.
Brgy. 30-C, Davao City
June 30, 2017 December 31, 2016
Investments in associates 229,907,797 P 227,436,649 P
Investments in joint ventures 79,460,804 15,498,667
309,368,602 P 242,935,316 P
Consolidated
El Camino Developers Cebu, Inc. (El Camino) 35%
Magspeak Nature Park, Inc. (Magspeak) 25%
Ming-mori Development Corporation (Ming-mori) 20%
AS Fortuna Property Ventures, Inc. 40%
Mivesa Garden Residences, Inc. 45%
BL CBP Ventures, Inc. (BL Ventures) 50%
Yuson Excellence Soberano, Inc. (YES, Inc.) 50%

- 27 -
An analysis of the carrying amount of investments in associates as at June 30, 2017 and December 31, 2016 is shown below.
In 2016, an additional investment of P4,000,000 was made by the Parent Company to Ming-mori. It also acquired equity interests in El Camino amounting to P217,812,800. An analysis of the carrying amount of investments in joint ventures, which were both acquired only in 2016, as at June 30, 2017 and December 31, 2016 is shown below.
Share in net losses of associates and joint ventures totaling P18,349,938 was recognized in 2017 and presented as part of Other Losses in the 2017 consolidated statement of profit or loss. There were no dividends received from the Group’s associates and joint ventures in 2017 and 2016.
El Camino Ming-mori Magspeak ASF Property
Ventures
Mivesa Garden
Residences, Inc. Total
Consolidated
June 30, 2017
Balance at beginning of period 214,290,472 P 8,071,698 P 5,074,479 P P - P - 227,436,649 P
New / additional investments - - - 14,004,856 342,788 14,347,644
Share in net losses during the
period 10,763,743 )( 526,717 )( 8,746 )( 254,084 )( 287,561 )( 11,840,850 )(
Balance at end of period 203,526,729 P 7,544,981 P 5,065,733 P 13,750,772 P 55,227 P 229,943,443 P
Consolidated
December 31, 2016
Balance at beginning of period P - 7,600,000 P 5,080,055 P P - P - 12,680,055 P
New / additional investments 217,812,800 4,000,000 - - - 221,812,800
Share in net losses during the
period 3,522,328 )( 3,528,302 )( 5,576 )( - - 7,056,206 )(
Balance at end of period 214,290,472 P 8,071,698 P 5,074,479 P P - P - 227,436,649 P
BL Ventures YES, Inc. Total
Consolidated
June 30, 2017
Balance at beginning of period 9,716,889 P 5,781,778 P 15,498,667 P
New / additional investments - 70,434,253 70,434,253
Share in net losses during the
period 2,314,495 )( 4,157,621 )( 6,472,116 )(
Balance at end of period 7,402,395 P 72,058,410 P 79,460,804 P
Consolidated
December 31, 2016
Balance at beginning of period 12,500,000 P 6,250,000 P 18,750,000 P
New / additional investments - - -
Share in net losses during the
period 2,783,111 )( 468,222 )( 3,251,333 )(
Balance at end of period 9,716,889 P 5,781,778 P 15,498,667 P
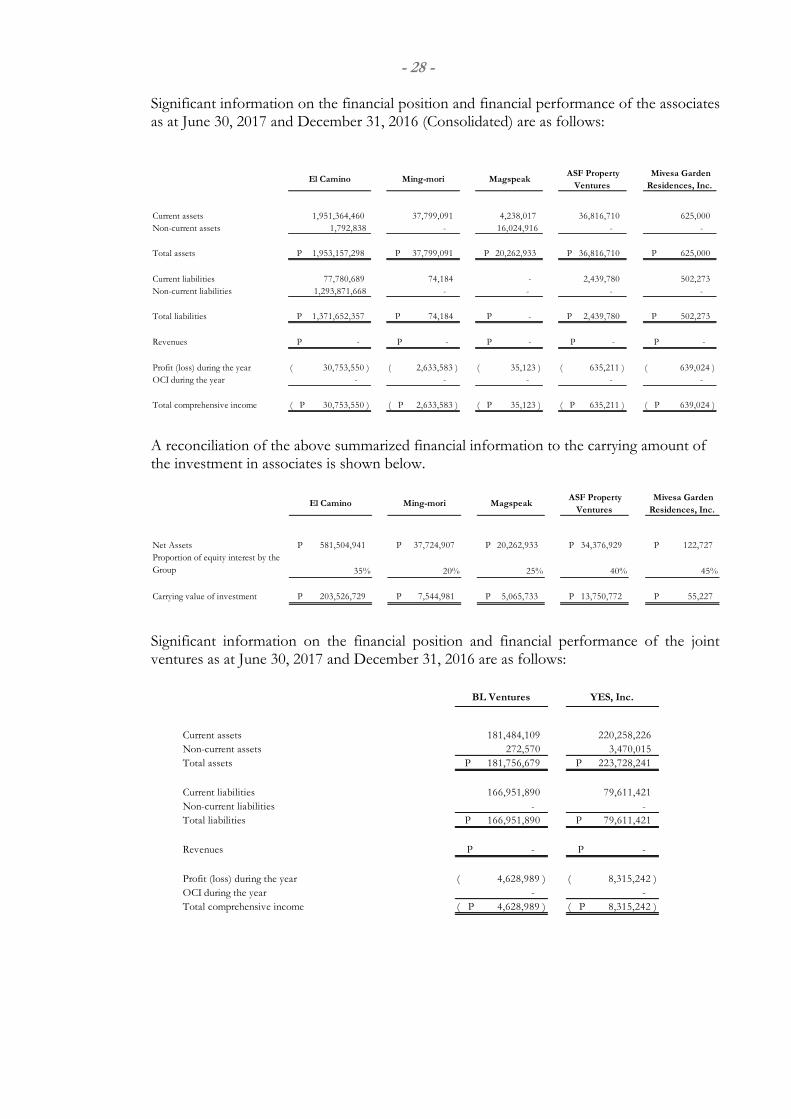
- 28 -
Significant information on the financial position and financial performance of the associates as at June 30, 2017 and December 31, 2016 (Consolidated) are as follows:
A reconciliation of the above summarized financial information to the carrying amount of the investment in associates is shown below.
Significant information on the financial position and financial performance of the joint ventures as at June 30, 2017 and December 31, 2016 are as follows:
El Camino Ming-mori Magspeak ASF Property
Ventures
Mivesa Garden
Residences, Inc.
Current assets 1,951,364,460 37,799,091 4,238,017 36,816,710 625,000
Non-current assets 1,792,838 - 16,024,916 - -
Total assets 1,953,157,298 P 37,799,091 P 20,262,933 P 36,816,710 P 625,000 P
Current liabilities 77,780,689 74,184 - 2,439,780 502,273
Non-current liabilities 1,293,871,668 - - - -
Total liabilities 1,371,652,357 P 74,184 P P - 2,439,780 P 502,273 P
Revenues P - P - P - P - P -
Profit (loss) during the year 30,753,550 )( 2,633,583 )( 35,123 )( 635,211 )( 639,024 )(
OCI during the year - - - - -
Total comprehensive income 30,753,550 )( P 2,633,583 )( P 35,123 )( P 635,211 )( P 639,024 )( P
El Camino Ming-mori Magspeak ASF Property
Ventures
Mivesa Garden
Residences, Inc.
Net Assets 581,504,941 P 37,724,907 P 20,262,933 P 34,376,929 P 122,727 P
Proportion of equity interest by the
Group 35% 20% 25% 40% 45%
Carrying value of investment 203,526,729 P 7,544,981 P 5,065,733 P 13,750,772 P 55,227 P
BL Ventures YES, Inc.
Current assets 181,484,109 220,258,226
Non-current assets 272,570 3,470,015
Total assets 181,756,679 P 223,728,241 P
Current liabilities 166,951,890 79,611,421
Non-current liabilities - -
Total liabilities 166,951,890 P 79,611,421 P
Revenues P - P -
Profit (loss) during the year 4,628,989 )( 8,315,242 )(
OCI during the year - -
Total comprehensive income 4,628,989 )( P 8,315,242 )( P
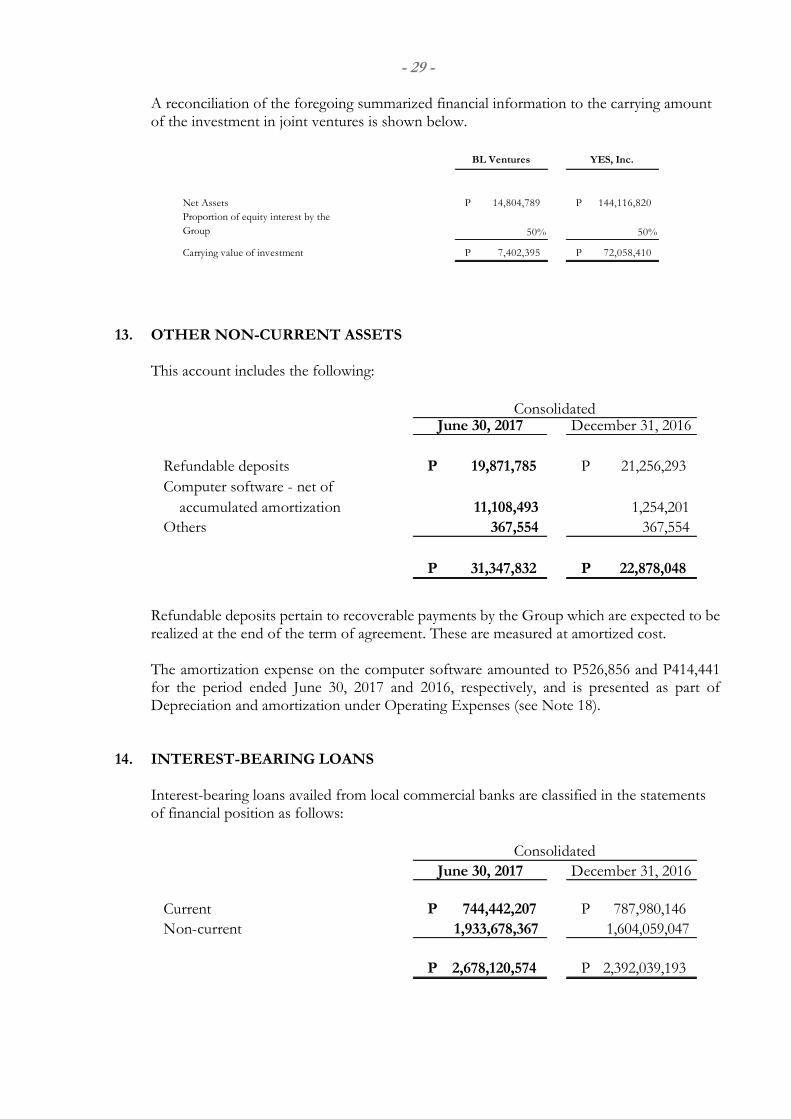
- 29 -
A reconciliation of the foregoing summarized financial information to the carrying amount of the investment in joint ventures is shown below.
13. OTHER NON-CURRENT ASSETS
This account includes the following:
Refundable deposits pertain to recoverable payments by the Group which are expected to be realized at the end of the term of agreement. These are measured at amortized cost. The amortization expense on the computer software amounted to P526,856 and P414,441 for the period ended June 30, 2017 and 2016, respectively, and is presented as part of Depreciation and amortization under Operating Expenses (see Note 18).
14. INTEREST-BEARING LOANS Interest-bearing loans availed from local commercial banks are classified in the statements of financial position as follows:
BL Ventures YES, Inc.
Net Assets 14,804,789 P 144,116,820 P
Proportion of equity interest by the
Group 50% 50%
Carrying value of investment 7,402,395 P 72,058,410 P
June 30, 2017 December 31, 2016
Refundable deposits 19,871,785 P 21,256,293 P
Computer software - net of
accumulated amortization 11,108,493 1,254,201
Others 367,554 367,554
31,347,832 P 22,878,048 P
Consolidated
June 30, 2017 December 31, 2016
Current 744,442,207 P 787,980,146 P
Non-current 1,933,678,367 1,604,059,047
2,678,120,574 P 2,392,039,193 P
Consolidated
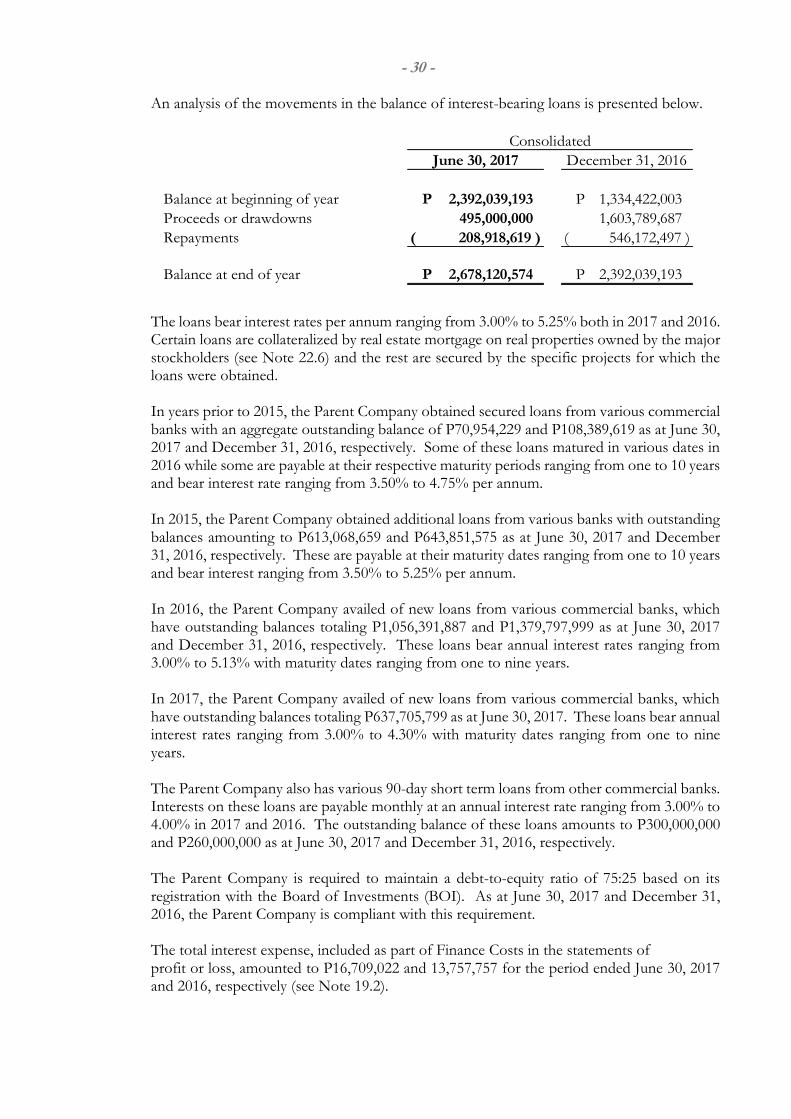
- 30 -
An analysis of the movements in the balance of interest-bearing loans is presented below.
The loans bear interest rates per annum ranging from 3.00% to 5.25% both in 2017 and 2016. Certain loans are collateralized by real estate mortgage on real properties owned by the major stockholders (see Note 22.6) and the rest are secured by the specific projects for which the loans were obtained. In years prior to 2015, the Parent Company obtained secured loans from various commercial banks with an aggregate outstanding balance of P70,954,229 and P108,389,619 as at June 30, 2017 and December 31, 2016, respectively. Some of these loans matured in various dates in 2016 while some are payable at their respective maturity periods ranging from one to 10 years and bear interest rate ranging from 3.50% to 4.75% per annum. In 2015, the Parent Company obtained additional loans from various banks with outstanding balances amounting to P613,068,659 and P643,851,575 as at June 30, 2017 and December 31, 2016, respectively. These are payable at their maturity dates ranging from one to 10 years and bear interest ranging from 3.50% to 5.25% per annum. In 2016, the Parent Company availed of new loans from various commercial banks, which have outstanding balances totaling P1,056,391,887 and P1,379,797,999 as at June 30, 2017 and December 31, 2016, respectively. These loans bear annual interest rates ranging from 3.00% to 5.13% with maturity dates ranging from one to nine years. In 2017, the Parent Company availed of new loans from various commercial banks, which have outstanding balances totaling P637,705,799 as at June 30, 2017. These loans bear annual interest rates ranging from 3.00% to 4.30% with maturity dates ranging from one to nine years. The Parent Company also has various 90-day short term loans from other commercial banks. Interests on these loans are payable monthly at an annual interest rate ranging from 3.00% to 4.00% in 2017 and 2016. The outstanding balance of these loans amounts to P300,000,000 and P260,000,000 as at June 30, 2017 and December 31, 2016, respectively. The Parent Company is required to maintain a debt-to-equity ratio of 75:25 based on its registration with the Board of Investments (BOI). As at June 30, 2017 and December 31, 2016, the Parent Company is compliant with this requirement.
The total interest expense, included as part of Finance Costs in the statements of profit or loss, amounted to P16,709,022 and 13,757,757 for the period ended June 30, 2017 and 2016, respectively (see Note 19.2).
June 30, 2017 December 31, 2016
Balance at beginning of year 2,392,039,193 P 1,334,422,003 P
Proceeds or drawdowns 495,000,000 1,603,789,687
Repayments 208,918,619 )( 546,172,497 )(
Balance at end of year 2,678,120,574 P 2,392,039,193 P
Consolidated
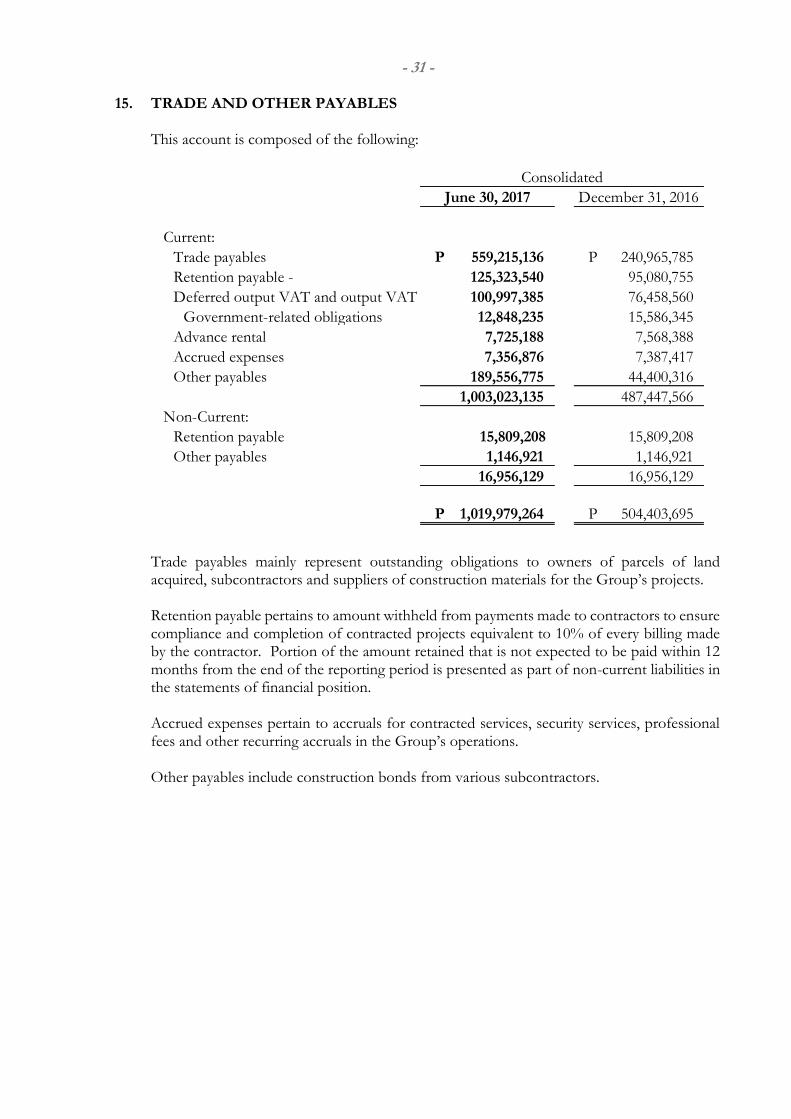
- 31 -
15. TRADE AND OTHER PAYABLES This account is composed of the following:
Trade payables mainly represent outstanding obligations to owners of parcels of land acquired, subcontractors and suppliers of construction materials for the Group’s projects. Retention payable pertains to amount withheld from payments made to contractors to ensure compliance and completion of contracted projects equivalent to 10% of every billing made by the contractor. Portion of the amount retained that is not expected to be paid within 12 months from the end of the reporting period is presented as part of non-current liabilities in the statements of financial position. Accrued expenses pertain to accruals for contracted services, security services, professional fees and other recurring accruals in the Group’s operations. Other payables include construction bonds from various subcontractors.
June 30, 2017 December 31, 2016
Current:
Trade payables 559,215,136 P 240,965,785 P
Retention payable - 125,323,540 95,080,755
Deferred output VAT and output VAT 100,997,385 76,458,560
Government-related obligations 12,848,235 15,586,345
Advance rental 7,725,188 7,568,388
Accrued expenses 7,356,876 7,387,417
Other payables 189,556,775 44,400,316
1,003,023,135 487,447,566
Non-Current:
Retention payable 15,809,208 15,809,208
Other payables 1,146,921 1,146,921
16,956,129 16,956,129
1,019,979,264 P 504,403,695 P
Consolidated

- 32 -
16. CUSTOMERS’ DEPOSITS This account is composed of the following:
Advances from buyers for contract price represent collections from customers whose contract price revenue are not yet recognized because the criteria for revenue recognition are yet to be met. Those that relate to transfer charges, which are cost to be incurred for the transfer of title to the buyers of real estate properties, are collections from customers for various variable and fixed charges shouldered by them. The Group requires a reservation fee from its prospective buyers for the reservation of the properties they wanted to own. The reservation fee will form part of the payments for the contract price collections if the buyer will pursue the purchase of the properties. Reservation fees foregone by prospective buyers amounted to P2,734,147 and P3,659,850 for the period ended June 30, 2017 and 2016, respectively are reported as part of Other Operating Income in the statements of profit or loss (see Note 19.1).
17. COST OF SALES AND RENTAL Components of cost of sales and rental are analyzed below (see also Note 18).
June 30, 2017 December 31, 2016
Advances from buyers:
List price 188,652,724 P 283,272,845 P
Transfer charges 174,280,973 148,494,427
Reservation fees 33,077,548 25,200,779
396,011,245 P 456,968,051 P
Consolidated
June 30, 2017 June 30, 2016
Cost of real estate sales
Actual costs 348,946,245 P 323,345,873 P
Estimated costs 533,655,692 142,962,248
882,601,937 466,308,121
Cost of rental services
Depreciation 6,989,618 1,721,753
Real estate taxes - -
6,989,618 1,721,753
889,591,555 P 468,029,874 P

- 33 -
18. OPERATING EXPENSES BY NATURE The details of operating expenses by nature are shown below:
Real estates sold includes the cost of land, construction contracts, materials and other costs incidental to housing and condominium projects development as shown in Note 17. A portion of donations in 2016 pertains to donation to Habitat for Humanity, an accredited non-government organization, which focuses on building houses for the average and low income earners in urban and rural areas. The expenses are classified in the statements of profit or loss as follows:
Notes June 30, 2017 June 30, 2016
Real estates sold 17 882,601,937 P 466,308,121 P
Salaries and employee benefits20.1 65,937,498 39,554,014
Advertising 38,102,023 4,589,231
Commissions 36,726,345 35,800,261
Taxes and licenses 18,060,410 9,533,169
Depreciation and 10,11,13 17,891,252 7,092,060
Professional and legal fees 11,992,732 6,618,689
Repairs and maintenance 11,568,268 1,662,077
Transportation and travel 8,766,211 2,720,728
Rent 22.3, 25.2 4,722,036 2,315,040
Utilities 4,068,626 3,247,499
Representation and entertainment 2,928,275 8,308,524
Insurance 2,143,779 1,945,980
Supplies 2,028,853 888,618
Communications 1,504,489 703,071
Security services 1,372,478 1,136,994
Fuel and lubricants 784,610 622,151
Donations 580,000 13,653,711
Trainings 166,069 280,736
Penalties 111,895 9,871,102
Others - Operating expenses 11,203,027 5,308,127
1,123,260,813 P 622,159,902 P
Note June 30, 2017 June 30, 2016
Cost of sales and services 17 889,591,555 P 468,029,874 P
Operating expenses 233,669,258 154,130,028
1,123,260,813 P 622,159,902 P
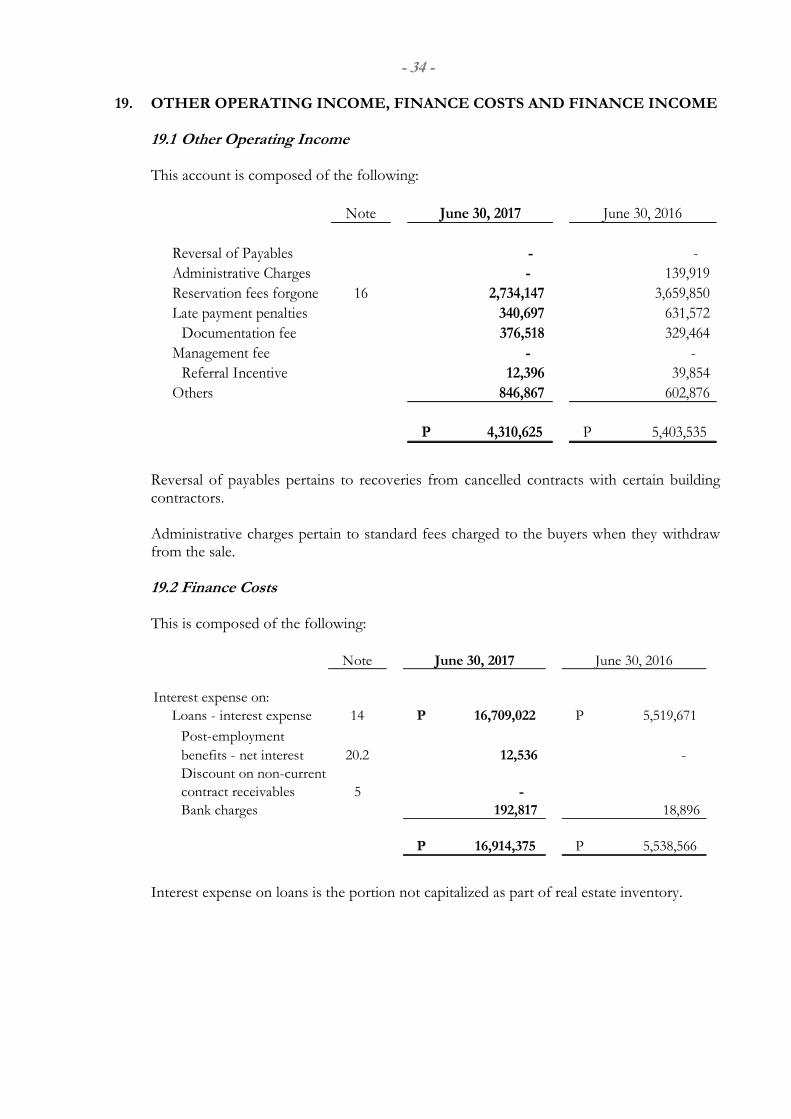
- 34 -
19. OTHER OPERATING INCOME, FINANCE COSTS AND FINANCE INCOME 19.1 Other Operating Income This account is composed of the following:
Reversal of payables pertains to recoveries from cancelled contracts with certain building contractors. Administrative charges pertain to standard fees charged to the buyers when they withdraw from the sale. 19.2 Finance Costs This is composed of the following:
Interest expense on loans is the portion not capitalized as part of real estate inventory.
Note June 30, 2017 June 30, 2016
Reversal of Payables - -
Administrative Charges - 139,919
Reservation fees forgone 16 2,734,147 3,659,850
Late payment penalties 340,697 631,572
Documentation fee 376,518 329,464
Management fee - -
Referral Incentive 12,396 39,854
Others 846,867 602,876
4,310,625 P 5,403,535 P
Note June 30, 2017 June 30, 2016
Interest expense on:
Loans - interest expense 14 16,709,022 P 5,519,671 P
Post-employment
benefits - net interest 20.2 12,536 -
Discount on non-current
contract receivables 5 -
Bank charges 192,817 18,896
16,914,375 P 5,538,566 P
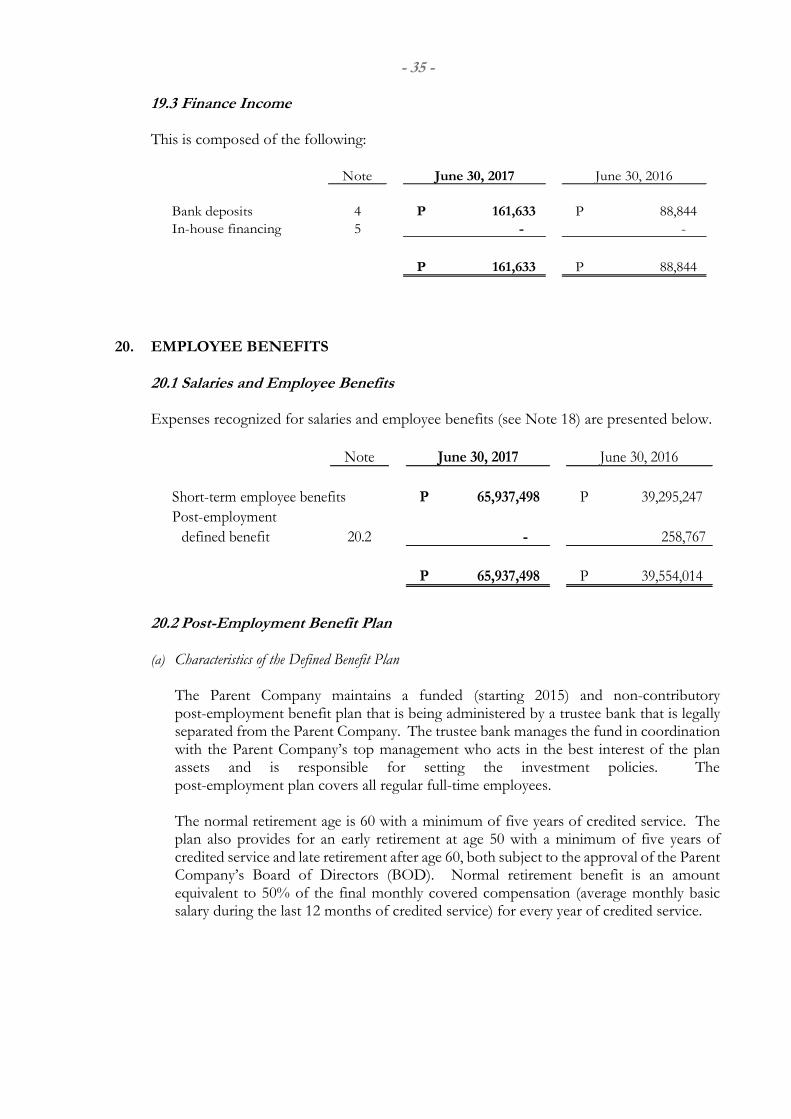
- 35 -
19.3 Finance Income This is composed of the following:
20. EMPLOYEE BENEFITS
20.1 Salaries and Employee Benefits Expenses recognized for salaries and employee benefits (see Note 18) are presented below.
20.2 Post-Employment Benefit Plan (a) Characteristics of the Defined Benefit Plan
The Parent Company maintains a funded (starting 2015) and non-contributory post-employment benefit plan that is being administered by a trustee bank that is legally separated from the Parent Company. The trustee bank manages the fund in coordination with the Parent Company’s top management who acts in the best interest of the plan assets and is responsible for setting the investment policies. The post-employment plan covers all regular full-time employees. The normal retirement age is 60 with a minimum of five years of credited service. The plan also provides for an early retirement at age 50 with a minimum of five years of credited service and late retirement after age 60, both subject to the approval of the Parent Company’s Board of Directors (BOD). Normal retirement benefit is an amount equivalent to 50% of the final monthly covered compensation (average monthly basic salary during the last 12 months of credited service) for every year of credited service.
Note June 30, 2017 June 30, 2016
Bank deposits 4 161,633 P 88,844 P
In-house financing 5 - -
161,633 P 88,844 P
Note June 30, 2017 June 30, 2016
Short-term employee benefits 65,937,498 P 39,295,247 P
Post-employment
defined benefit 20.2 - 258,767
65,937,498 P 39,554,014 P
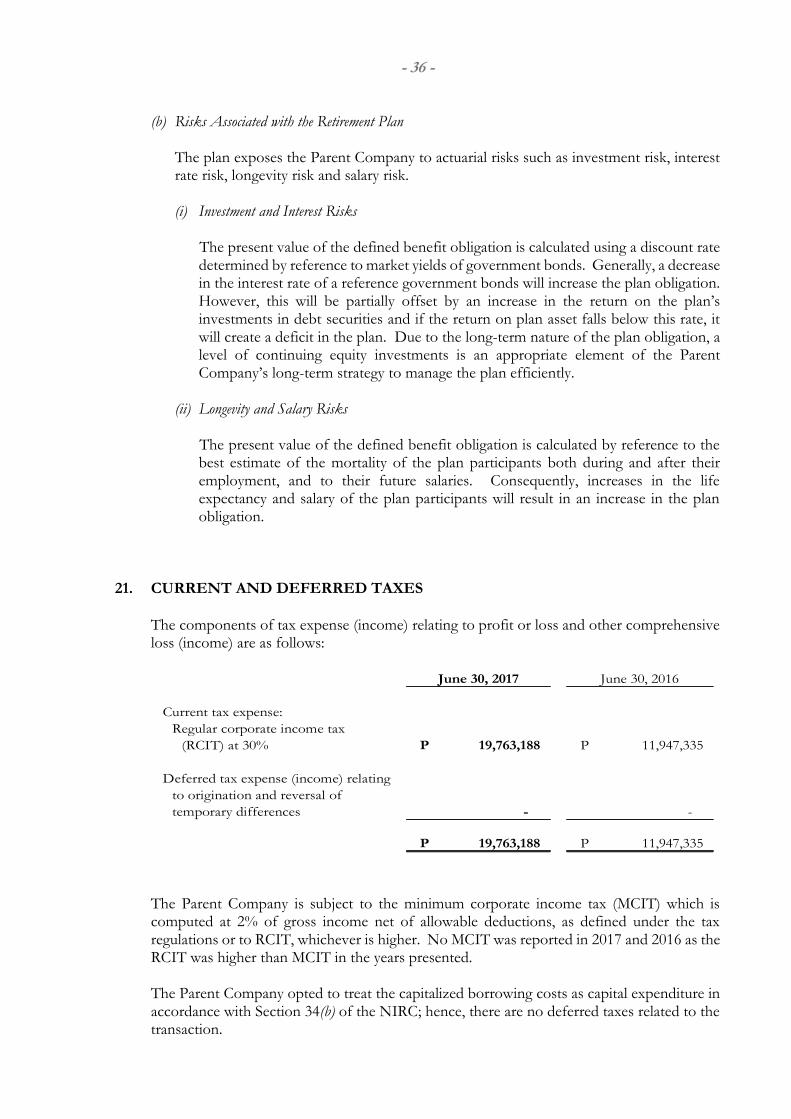
- 36 -
(b) Risks Associated with the Retirement Plan
The plan exposes the Parent Company to actuarial risks such as investment risk, interest rate risk, longevity risk and salary risk. (i) Investment and Interest Risks
The present value of the defined benefit obligation is calculated using a discount rate determined by reference to market yields of government bonds. Generally, a decrease in the interest rate of a reference government bonds will increase the plan obligation. However, this will be partially offset by an increase in the return on the plan’s investments in debt securities and if the return on plan asset falls below this rate, it will create a deficit in the plan. Due to the long-term nature of the plan obligation, a level of continuing equity investments is an appropriate element of the Parent Company’s long-term strategy to manage the plan efficiently.
(ii) Longevity and Salary Risks The present value of the defined benefit obligation is calculated by reference to the best estimate of the mortality of the plan participants both during and after their employment, and to their future salaries. Consequently, increases in the life expectancy and salary of the plan participants will result in an increase in the plan obligation.
21. CURRENT AND DEFERRED TAXES
The components of tax expense (income) relating to profit or loss and other comprehensive loss (income) are as follows:
The Parent Company is subject to the minimum corporate income tax (MCIT) which is computed at 2% of gross income net of allowable deductions, as defined under the tax regulations or to RCIT, whichever is higher. No MCIT was reported in 2017 and 2016 as the RCIT was higher than MCIT in the years presented. The Parent Company opted to treat the capitalized borrowing costs as capital expenditure in accordance with Section 34(b) of the NIRC; hence, there are no deferred taxes related to the transaction.
June 30, 2017 June 30, 2016
Current tax expense:
Regular corporate income tax
(RCIT) at 30% 19,763,188 P 11,947,335 P
Deferred tax expense (income) relating
to origination and reversal of
temporary differences - -
19,763,188 P 11,947,335 P

- 37 -
Both Parent Company and subsidiary opted to claim itemized deductions in computing their income tax due for the period ended June 30, 2017 and 2016.
22. RELATED PARTY TRANSACTIONS The Group’s related parties include its ultimate parent or ABS, entities under common ownership, associates, joint ventures, shareholders, the Group’s key management personnel, its retirement fund and others as described in Note 2.20. A summary of the Group’s transactions and outstanding balances with related parties is presented below.
Based on management’s assessment, no impairment loss is required to be provided on the Group’s receivables from related parties as at June 30, 2017 and December 31, 2016 . The cash advances to and from related parties are noninterest-bearing, unsecured, due on demand and are expected to be settled in cash and/or offsetting of accounts within one year from end of the reporting period. 22.1 Advances to Related Parties The Group grants cash advances to shareholders, entities under common ownership, associates and joint ventures.
Note
Amount of
TransactionOutstanding Balance Amount of Transaction Outstanding Balance
Shareholders
Advances to 22.1 - - 130,233,234 )( -
Advances from - - 3,133,857 -
Sale of property - - 32,272,232 -
Entities under Common
Ownership
Collections - net 22.1 3,894,355 )( 20,347,634 20,242,632 )( 24,241,989
Associates
Advances 22.1 5,528,872 5,568,169 39,297 39,297
Joint Ventures
Advances 22.1 8,592,712 11,050,648 2,457,936 2,457,936
Sale of property 22.4 - 48,837,857 45,642,857 48,837,857
Key Management Personnel
Sale of real estate 22.7 - 35,192,095 48,703,620 48,933,991
June 30, 2017 December 31, 2016
Consolidated
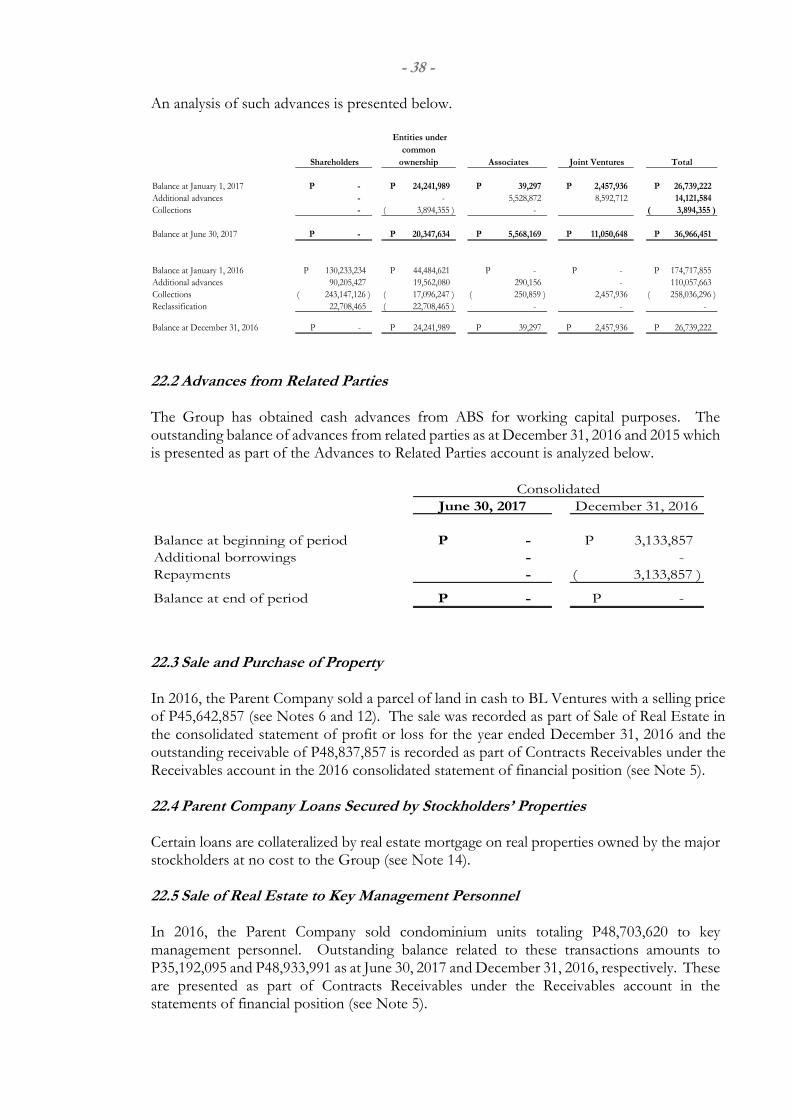
- 38 -
An analysis of such advances is presented below.
22.2 Advances from Related Parties The Group has obtained cash advances from ABS for working capital purposes. The outstanding balance of advances from related parties as at December 31, 2016 and 2015 which is presented as part of the Advances to Related Parties account is analyzed below.
22.3 Sale and Purchase of Property In 2016, the Parent Company sold a parcel of land in cash to BL Ventures with a selling price of P45,642,857 (see Notes 6 and 12). The sale was recorded as part of Sale of Real Estate in the consolidated statement of profit or loss for the year ended December 31, 2016 and the outstanding receivable of P48,837,857 is recorded as part of Contracts Receivables under the Receivables account in the 2016 consolidated statement of financial position (see Note 5).
22.4 Parent Company Loans Secured by Stockholders’ Properties Certain loans are collateralized by real estate mortgage on real properties owned by the major stockholders at no cost to the Group (see Note 14). 22.5 Sale of Real Estate to Key Management Personnel In 2016, the Parent Company sold condominium units totaling P48,703,620 to key management personnel. Outstanding balance related to these transactions amounts to P35,192,095 and P48,933,991 as at June 30, 2017 and December 31, 2016, respectively. These are presented as part of Contracts Receivables under the Receivables account in the statements of financial position (see Note 5).
Shareholders
Entities under
common
ownership Associates Joint Ventures Total
Balance at January 1, 2017 P - 24,241,989 P 39,297 P 2,457,936 P 26,739,222 P
Additional advances - - 5,528,872 8,592,712 14,121,584
Collections - 3,894,355 )( - 3,894,355 )(
Balance at June 30, 2017 P - 20,347,634 P 5,568,169 P 11,050,648 P 36,966,451 P
Balance at January 1, 2016 130,233,234 P 44,484,621 P P - P - 174,717,855 P
Additional advances 90,205,427 19,562,080 290,156 - 110,057,663
Collections 243,147,126 )( 17,096,247 )( 250,859 )( 2,457,936 258,036,296 )(
Reclassification 22,708,465 22,708,465 )( - - -
Balance at December 31, 2016 P - 24,241,989 P 39,297 P 2,457,936 P 26,739,222 P
June 30, 2017 December 31, 2016
Balance at beginning of period P - 3,133,857 P
Additional borrowings - -
Repayments - 3,133,857 )(
Balance at end of period P - P -
Consolidated
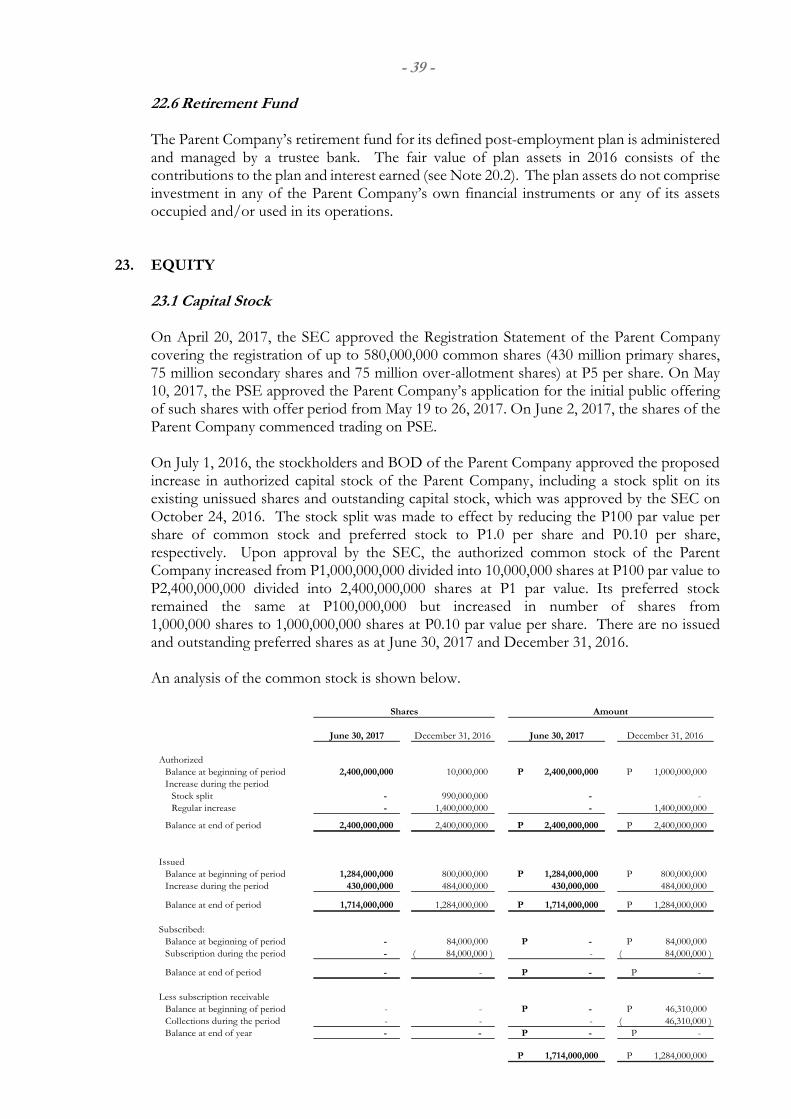
- 39 -
22.6 Retirement Fund The Parent Company’s retirement fund for its defined post-employment plan is administered and managed by a trustee bank. The fair value of plan assets in 2016 consists of the contributions to the plan and interest earned (see Note 20.2). The plan assets do not comprise investment in any of the Parent Company’s own financial instruments or any of its assets occupied and/or used in its operations.
23. EQUITY
23.1 Capital Stock On April 20, 2017, the SEC approved the Registration Statement of the Parent Company covering the registration of up to 580,000,000 common shares (430 million primary shares, 75 million secondary shares and 75 million over-allotment shares) at P5 per share. On May 10, 2017, the PSE approved the Parent Company’s application for the initial public offering of such shares with offer period from May 19 to 26, 2017. On June 2, 2017, the shares of the Parent Company commenced trading on PSE. On July 1, 2016, the stockholders and BOD of the Parent Company approved the proposed increase in authorized capital stock of the Parent Company, including a stock split on its existing unissued shares and outstanding capital stock, which was approved by the SEC on October 24, 2016. The stock split was made to effect by reducing the P100 par value per share of common stock and preferred stock to P1.0 per share and P0.10 per share, respectively. Upon approval by the SEC, the authorized common stock of the Parent Company increased from P1,000,000,000 divided into 10,000,000 shares at P100 par value to P2,400,000,000 divided into 2,400,000,000 shares at P1 par value. Its preferred stock remained the same at P100,000,000 but increased in number of shares from 1,000,000 shares to 1,000,000,000 shares at P0.10 par value per share. There are no issued and outstanding preferred shares as at June 30, 2017 and December 31, 2016. An analysis of the common stock is shown below.
June 30, 2017 December 31, 2016 June 30, 2017 December 31, 2016
Authorized
Balance at beginning of period 2,400,000,000 10,000,000 2,400,000,000 P 1,000,000,000 P
Increase during the period
Stock split - 990,000,000 - -
Regular increase - 1,400,000,000 - 1,400,000,000
Balance at end of period 2,400,000,000 2,400,000,000 2,400,000,000 P 2,400,000,000 P
Issued
Balance at beginning of period 1,284,000,000 800,000,000 1,284,000,000 P 800,000,000 P
Increase during the period 430,000,000 484,000,000 430,000,000 484,000,000
Balance at end of period 1,714,000,000 1,284,000,000 1,714,000,000 P 1,284,000,000 P
Subscribed:
Balance at beginning of period - 84,000,000 P - 84,000,000 P
Subscription during the period - 84,000,000 )( - 84,000,000 )(
Balance at end of period - - P - P -
Less subscription receivable
Balance at beginning of period - - P - 46,310,000 P
Collections during the period - - - 46,310,000 )(
Balance at end of year - - P - P -
1,714,000,000 P 1,284,000,000 P
Shares Amount
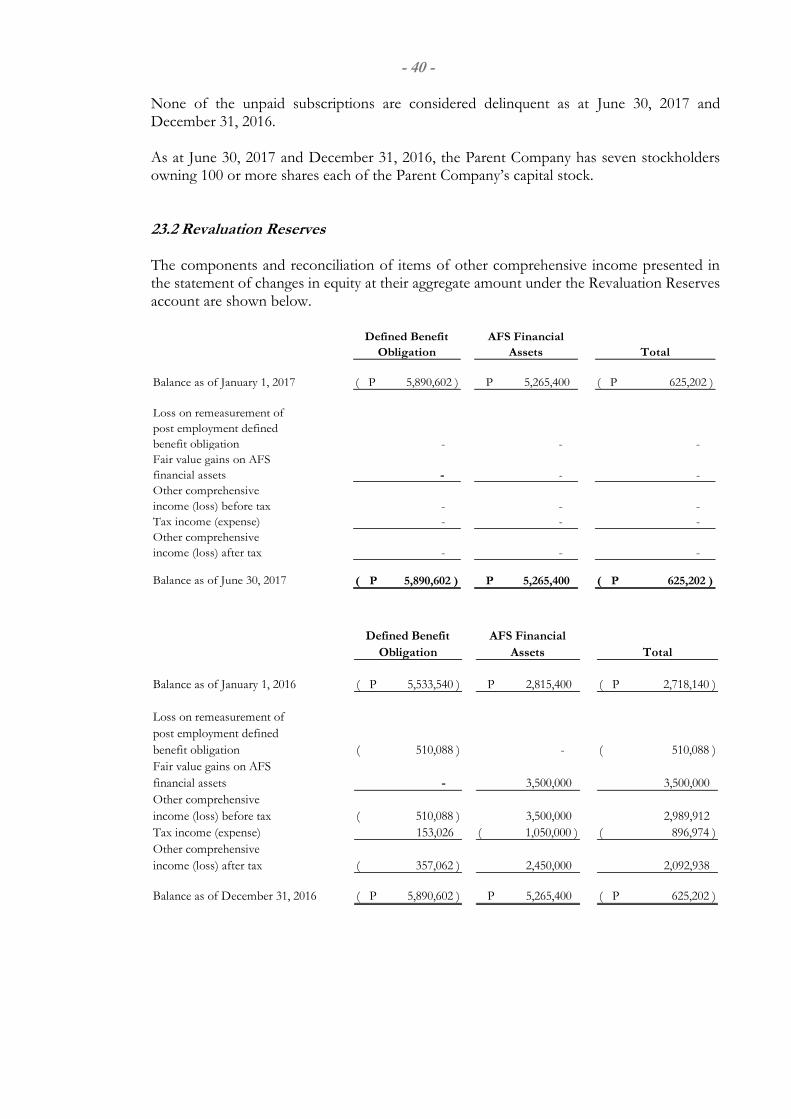
- 40 -
None of the unpaid subscriptions are considered delinquent as at June 30, 2017 and December 31, 2016. As at June 30, 2017 and December 31, 2016, the Parent Company has seven stockholders owning 100 or more shares each of the Parent Company’s capital stock. 23.2 Revaluation Reserves The components and reconciliation of items of other comprehensive income presented in the statement of changes in equity at their aggregate amount under the Revaluation Reserves account are shown below.
Defined Benefit
Obligation
AFS Financial
Assets Total
Balance as of January 1, 2017 5,890,602 )( P 5,265,400 P 625,202 )( P
Loss on remeasurement of
post employment defined
benefit obligation - - -
Fair value gains on AFS
financial assets - - -
Other comprehensive
income (loss) before tax - - -
Tax income (expense) - - -
Other comprehensive
income (loss) after tax - - -
Balance as of June 30, 2017 5,890,602 )( P 5,265,400 P 625,202 )( P
Defined Benefit
Obligation
AFS Financial
Assets Total
Balance as of January 1, 2016 5,533,540 )( P 2,815,400 P 2,718,140 )( P
Loss on remeasurement of
post employment defined
benefit obligation 510,088 )( - 510,088 )(
Fair value gains on AFS
financial assets - 3,500,000 3,500,000
Other comprehensive
income (loss) before tax 510,088 )( 3,500,000 2,989,912
Tax income (expense) 153,026 1,050,000 )( 896,974 )(
Other comprehensive
income (loss) after tax 357,062 )( 2,450,000 2,092,938
Balance as of December 31, 2016 5,890,602 )( P 5,265,400 P 625,202 )( P
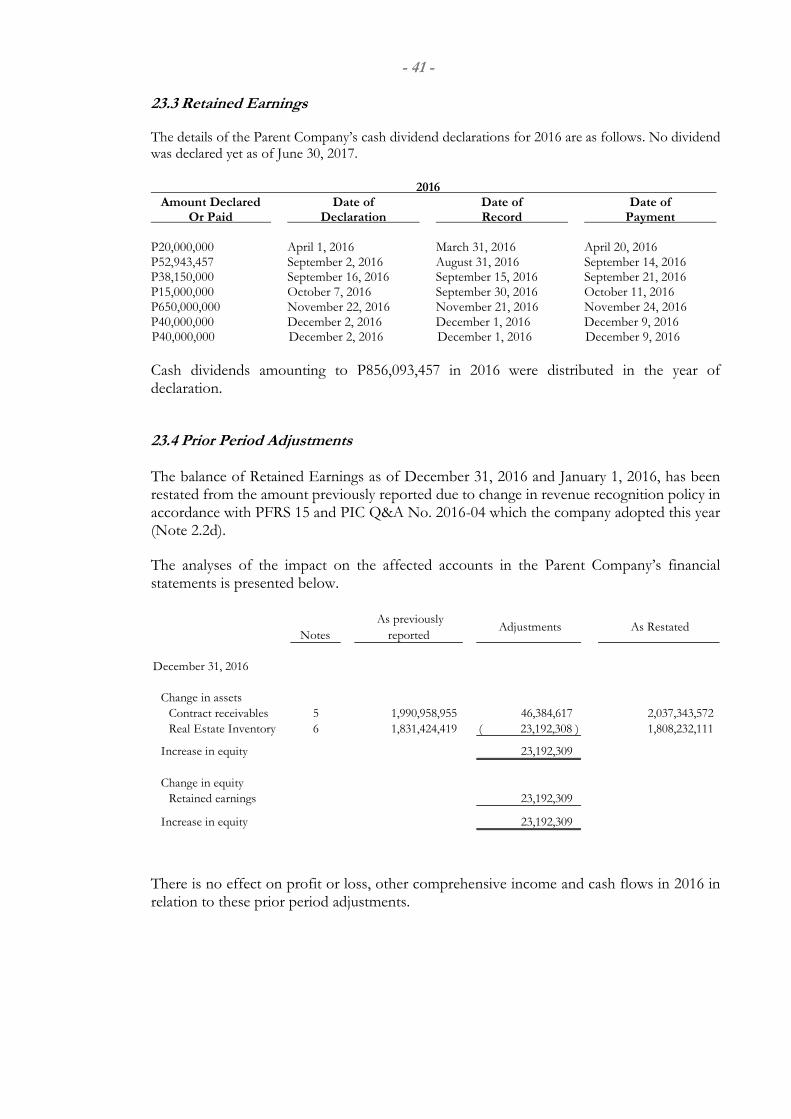
- 41 -
23.3 Retained Earnings The details of the Parent Company’s cash dividend declarations for 2016 are as follows. No dividend was declared yet as of June 30, 2017.
2016 Amount Declared Date of Date of Date of Or Paid Declaration Record Payment P20,000,000 April 1, 2016 March 31, 2016 April 20, 2016 P52,943,457 September 2, 2016 August 31, 2016 September 14, 2016 P38,150,000 September 16, 2016 September 15, 2016 September 21, 2016 P15,000,000 October 7, 2016 September 30, 2016 October 11, 2016 P650,000,000 November 22, 2016 November 21, 2016 November 24, 2016 P40,000,000 December 2, 2016 December 1, 2016 December 9, 2016
P40,000,000 December 2, 2016 December 1, 2016 December 9, 2016
Cash dividends amounting to P856,093,457 in 2016 were distributed in the year of declaration.
23.4 Prior Period Adjustments The balance of Retained Earnings as of December 31, 2016 and January 1, 2016, has been restated from the amount previously reported due to change in revenue recognition policy in accordance with PFRS 15 and PIC Q&A No. 2016-04 which the company adopted this year (Note 2.2d).
The analyses of the impact on the affected accounts in the Parent Company’s financial statements is presented below.
There is no effect on profit or loss, other comprehensive income and cash flows in 2016 in relation to these prior period adjustments.
Notes
As previously
reported Adjustments As Restated
December 31, 2016
Change in assets
Contract receivables 5 1,990,958,955 46,384,617 2,037,343,572
Real Estate Inventory 6 1,831,424,419 23,192,308 )( 1,808,232,111
Increase in equity 23,192,309
Change in equity
Retained earnings 23,192,309
Increase in equity 23,192,309
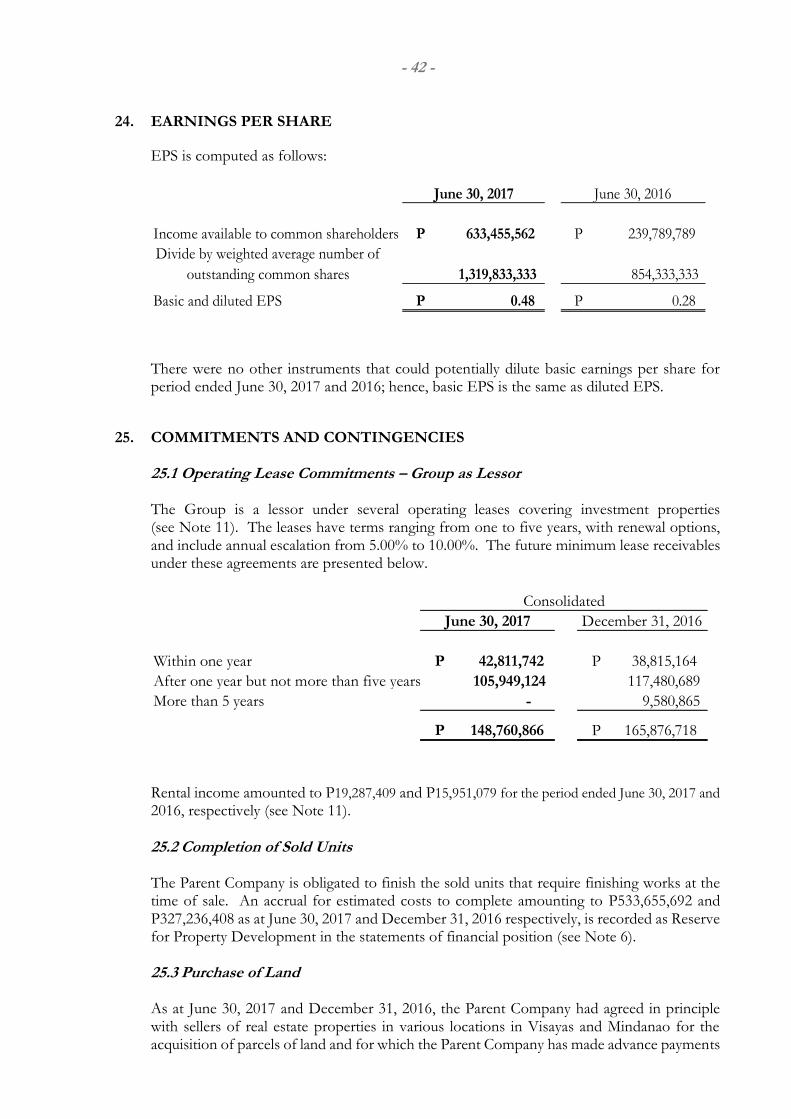
- 42 -
24. EARNINGS PER SHARE
EPS is computed as follows:
There were no other instruments that could potentially dilute basic earnings per share for period ended June 30, 2017 and 2016; hence, basic EPS is the same as diluted EPS.
25. COMMITMENTS AND CONTINGENCIES 25.1 Operating Lease Commitments – Group as Lessor The Group is a lessor under several operating leases covering investment properties (see Note 11). The leases have terms ranging from one to five years, with renewal options, and include annual escalation from 5.00% to 10.00%. The future minimum lease receivables under these agreements are presented below.
Rental income amounted to P19,287,409 and P15,951,079 for the period ended June 30, 2017 and
2016, respectively (see Note 11).
25.2 Completion of Sold Units The Parent Company is obligated to finish the sold units that require finishing works at the time of sale. An accrual for estimated costs to complete amounting to P533,655,692 and P327,236,408 as at June 30, 2017 and December 31, 2016 respectively, is recorded as Reserve for Property Development in the statements of financial position (see Note 6). 25.3 Purchase of Land As at June 30, 2017 and December 31, 2016, the Parent Company had agreed in principle with sellers of real estate properties in various locations in Visayas and Mindanao for the acquisition of parcels of land and for which the Parent Company has made advance payments
June 30, 2017 June 30, 2016
Income available to common shareholders 633,455,562 P 239,789,789 P
1,319,833,333 854,333,333
Basic and diluted EPS 0.48 P 0.28 P
Divide by weighted average number of
outstanding common shares
June 30, 2017 December 31, 2016
Within one year 42,811,742 P 38,815,164 P
After one year but not more than five years 105,949,124 117,480,689
More than 5 years - 9,580,865
148,760,866 P 165,876,718 P
Consolidated

- 43 -
totalling P387,397,128 and P259,897,127, respectively (see Note 7). The advance payments shall be applied against the full amount of the contract price upon consummation of the contracts.
25.4 Others There are other commitments and contingent liabilities that arise in the normal course of the Group’s operations that are not reflected in the financial statements. As at June 30, 2017 and December 31, 2016, management is of the opinion that losses, if any, from these items will not have a material effect on the Group’s financial statements.
26. RISK MANAGEMENT OBJECTIVES AND POLICIES The Group is exposed to certain financial risks in relation to financial instruments. The Group’s financial assets and liabilities by category are summarized in Note 27. The main types of risks are market risk, credit risk and liquidity risk. The Group’s risk management focuses on actively securing the Group’s short-to-medium term cash flows by minimizing the exposure to financial markets. Long-term financial investments are managed to generate lasting returns. The Group does not actively engage in the trading of financial assets for speculative purposes nor does it write options. The most significant financial risks to which the Group is exposed to are described as follows.
26.1 Market Risk The Group is exposed to market risk through its use of financial instruments and specifically to foreign currency risk and interest rate risk which result from its operating, investing and financing activities. The Group has no significant foreign currency exposure risks as most of its transactions are carried out in Philippine pesos, its functional currency. The Group has no significant interest rate risk exposure as most of its interest-bearing financial assets and liabilities bear fixed interest rates.
26.2 Credit Risk Credit risk is the risk that a counterparty may fail to discharge an obligation to the Group. The Group is exposed to this risk for various financial instruments arising from loans and receivables from selling goods and services to customers, and placing deposits with banks. The Group continuously monitors defaults of customers and other counterparties, identified either individually or by group, and incorporate this information into its credit risk controls. The Group’s policy is to deal only with creditworthy counterparties. In addition, for a significant proportion of sales, advance payments are received to mitigate credit risk.
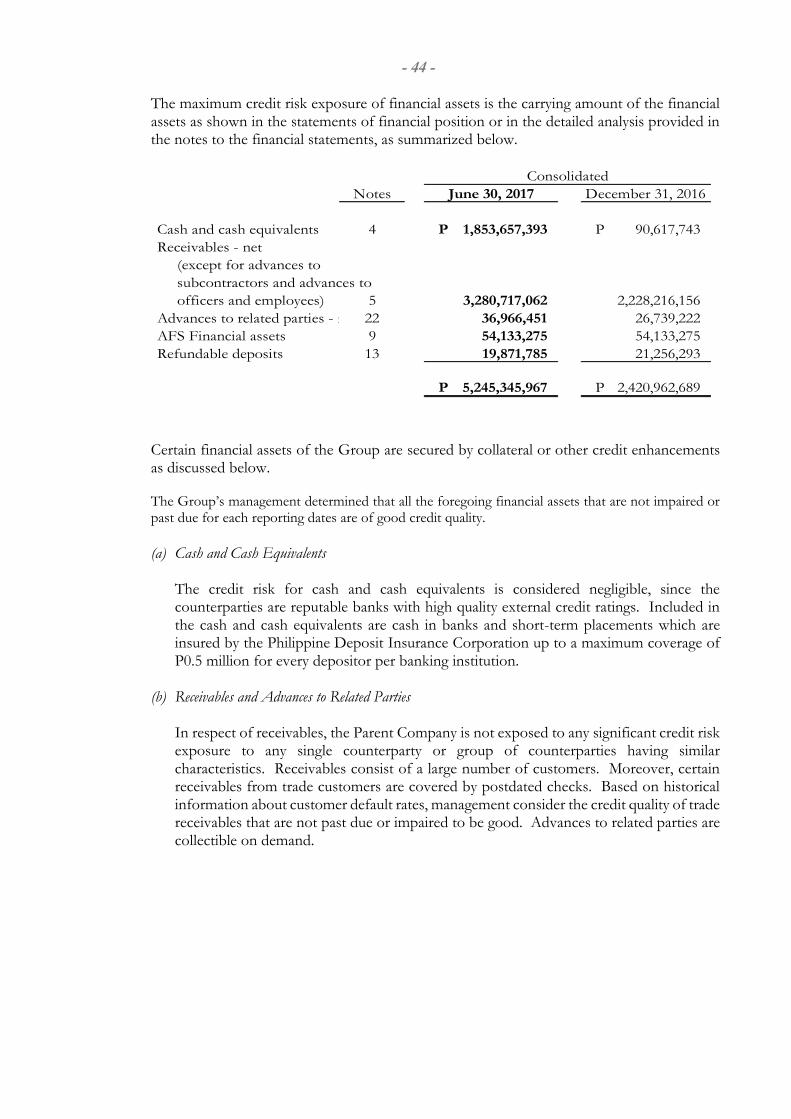
- 44 -
The maximum credit risk exposure of financial assets is the carrying amount of the financial assets as shown in the statements of financial position or in the detailed analysis provided in the notes to the financial statements, as summarized below.
Certain financial assets of the Group are secured by collateral or other credit enhancements as discussed below. The Group’s management determined that all the foregoing financial assets that are not impaired or past due for each reporting dates are of good credit quality.
(a) Cash and Cash Equivalents
The credit risk for cash and cash equivalents is considered negligible, since the counterparties are reputable banks with high quality external credit ratings. Included in the cash and cash equivalents are cash in banks and short-term placements which are insured by the Philippine Deposit Insurance Corporation up to a maximum coverage of P0.5 million for every depositor per banking institution.
(b) Receivables and Advances to Related Parties In respect of receivables, the Parent Company is not exposed to any significant credit risk exposure to any single counterparty or group of counterparties having similar characteristics. Receivables consist of a large number of customers. Moreover, certain receivables from trade customers are covered by postdated checks. Based on historical information about customer default rates, management consider the credit quality of trade receivables that are not past due or impaired to be good. Advances to related parties are collectible on demand.
Notes June 30, 2017 December 31, 2016
Cash and cash equivalents 4 1,853,657,393 P 90,617,743 P
Receivables - net
(except for advances to
subcontractors and advances to
officers and employees) 5 3,280,717,062 2,228,216,156
Advances to related parties - net 22 36,966,451 26,739,222
AFS Financial assets 9 54,133,275 54,133,275
Refundable deposits 13 19,871,785 21,256,293
5,245,345,967 P 2,420,962,689 P
Consolidated

- 45 -
Summarized below are the financial assets as at June 30, 2017 and December 31, 2016 that are past due (all of which are receivables) but unimpaired.
26.3 Liquidity Risk The Group manages its liquidity needs by carefully monitoring cash outflows due in a day-to-day business. The Group maintains cash to meet its liquidity. Excess cash are invested in short-term placements.
As at June 30, 2017 (Consolidated), the financial liabilities have contractual maturities which are presented below.
This compares to the maturity of the financial liabilities as at December 31, 2016 (Parent Company) as follows:
The foregoing contractual maturities reflect the gross cash flows, which may differ from the carrying values of the liabilities at the end of the reporting periods.
June 30, 2017 December 31, 2016
Not more than 30 days 1,525,645 P 990,014 P
More than 30 days but
not more than 60 days - 996,835
More than 60 days but
not more than 90 days 1,526,591 783,530
More than 90 days but
not more than 120 days - 638,668
More than 120 days 7,081,826 3,748,761
10,134,062 P 7,157,808 P
Consolidated
Within 6 Months 6 to 12 Months 1 to 5 YearsLater than 5
Years
Interest-bearing loans 420,000,000 P 324,442,207 P 1,192,777,599 P 740,900,768 P
Trade and other payables (except
for government obligations and
deferred output VAT) 501,599,944 387,577,571 16,956,129 -
921,599,944 P 712,019,778 P 1,209,733,728 P 740,900,768 P
Current Non-current
Within 6 Months 6 to 12 Months 1 to 5 Years Later than 5 Years
Interest-bearing loans 742,831,341 P 134,366,909 P 1,607,692,392 P 141,172,694 P
Trade and other payables (except
for government obligations and
deferred output VAT) 387,834,273 - 16,956,129 -
1,130,665,614 P 134,366,909 P 1,624,648,521 P 141,172,694 P
Current Non-current

- 46 -
27. CATEGORIES AND OFFSETTING OF FINANCIAL ASSETS AND
FINANCIAL LIABILITIES AND FAIR VALUE MEASUREMENTS AND DISCLOSURES 27.1 Carrying Amounts and Fair Values by Category The carrying amounts and fair values of the categories of financial assets and financial liabilities presented in the statements of financial position are shown below.
See Notes 2.5 and 2.11 for a description of the accounting policies for each category of financial instrument. A description of the Group’s risk management objectives and policies for financial instruments is provided in Note 26. 27.2 Offsetting of Financial Assets and Financial Liabilities The following financial assets with net amounts presented in the statements of financial position are subject to offsetting, enforceable master netting arrangements and similar agreements:
Notes Carrying Value Fair value Carrying Value Fair value
Financial Assets
Loans and receivables 4
Cash and cash equivalents 1,853,657,393 1,853,657,393 90,617,743 90,617,743
Receivables - net
(except for advances to
subcontractors and
advances to officers and
employees) 5 3,280,717,062 3,280,717,062 2,228,216,156 2,228,216,156
Advances to related parties 22.1 36,966,451 36,966,451 26,739,222 26,739,222
Refundable deposits 13 19,871,785 19,871,785 21,256,293 21,256,293
5,191,212,691 5,191,212,691 2,366,829,414 2,366,829,414
AFS Financial Asset 54,133,275 54,133,275 54,133,275 54,133,275
5,245,345,967 5,245,345,967 2,420,962,689 2,420,962,689
Financial Liabilities
Financial Liabilities at amortized cost
Interest - bearing loans 14 2,678,120,574 2,678,120,574 2,392,039,193 2,392,039,193
Trade and other payables 15 898,408,456 898,408,456 404,790,402 404,790,402
3,576,529,030 3,576,529,030 2,796,829,595 2,796,829,595
June 30, 2017
Consolidated
December 31, 2016
Financial AssetsFinancial Liabilities
set off
Financial
Instruments
Cash collateral
receivedNet amount
Consolidated
June 30, 2017
Cash and cash equivalents 1,853,412,393 P P - 1,853,412,393 P P - P - 1,853,412,393 P
Receivables - net (except for advances
to subcontractors and advances to
employees) 3,280,717,062 P P - 3,280,717,062 P P - P - 3,280,717,062 P
Advances to related parties 36,966,451 P P - 36,966,451 P P - P - 36,966,451 P
Consolidated
December 31, 2016
Cash and cash equivalents 90,372,743 P P - 90,372,743 P 65,802,254 )( P P - 24,570,489 P
Receivables - net (except for advances
to subcontractors and advances to
employees) 2,181,831,540 P P - 2,181,831,540 P P - P - 2,181,831,540 P
Advances to related parties 26,739,222 P P - 26,739,222 P P - P - 26,739,222 P
Gross amounts recognized in the statement of
financial position
Net amount
presented in the
Statement of
Financial Position
Related amounts not set off in the Statement
of Financial Position

- 47 -
The following financial liabilities with net amounts presented in the statements of financial position are subject to offsetting, enforceable master netting arrangements and similar agreements:
For financial assets and financial liabilities subject to enforceable master netting agreements or similar arrangements above, each agreement between the Group and counterparties (i.e., related parties and contractors) allows for net settlement of the relevant financial assets and liabilities when both elect to settle on a net basis. In the absence of such an election, financial assets and liabilities will be settled on a gross basis, however, each party to the master netting agreement or similar agreement will have the option to settle all such amounts on a net basis in the event of default of the other party. 27.3 Fair Value Measurements and Disclosures
(a) Fair Value Hierarchy In accordance with PFRS 13, the fair value of financial assets and financial liabilities and non-financial assets which are measured at fair value on a recurring or non-recurring basis and those assets and liabilities not measured at fair value but for which fair value is disclosed in accordance with other relevant PFRS, are categorized into three levels based on the significance of inputs used to measure the fair value. The fair value hierarchy has the following levels:
a) Level 1: quoted prices (unadjusted) in active markets for identical assets or liabilities
that an entity can access at the measurement date; b) Level 2: inputs other than quoted prices included within Level 1 that are observable for
the asset or liability, either directly (i.e., as prices) or indirectly (i.e., derived from prices); and,
c) Level 3: inputs for the asset or liability that are not based on observable market data
(unobservable inputs). The level within which the financial asset or liability is classified is determined based on the lowest level of significant input to the fair value measurement.
Financial LiabilitiesFinancial Assets set
off
Financial
Instruments
Cash collateral
receivedNet amount
Consolidated
June 30, 2017
Interest - bearing loans 2,678,120,574 P P - 2,678,120,574 P P - P - 2,678,120,574 P
Trade and other payables
(except for government obligations
and deferred output VAT) 898,408,456 P P - 898,408,456 P P - P - 898,408,456 P
Consolidated
December 31, 2016
Interest - bearing loans 2,392,039,193 P P - 2,392,039,193 P 65,802,254 )( P P - 2,326,236,939 P
Trade and other payables
(except for government obligations
and deferred output VAT) 404,790,402 P P - 404,790,402 P 65,802,254 )( P P - 338,988,148 P
Gross amounts recognized in the statement of
financial position
Net amount
presented in the
Statement of
Financial Position
Related amounts not set off in the Statement
of Financial Position

- 48 -
For purposes of determining the market value at Level 1, a market is regarded as active if quoted prices are readily and regularly available from an exchange, dealer, broker, industry group, pricing service, or regulatory agency, and those prices represent actual and regularly occurring market transactions on an arm’s length basis. For investments which do not have quoted market price, the fair value is determined by using generally acceptable pricing models and valuation techniques or by reference to the current market value of another instrument which is substantially the same after taking into account the related credit risk of counterparties, or is calculated based on the expected cash flows of the underlying net asset base of the instrument. When the Group uses valuation technique, it maximizes the use of observable market data where it is available and relies as little as possible on entity specific estimates. If all significant inputs required to determine the fair value of an instrument are observable, the instrument is included in Level 2. Otherwise, it is included in Level 3.
(b) Financial Instruments Measured at Fair Value The table below shows the fair value hierarchy of the Group’s classes of financial assets and financial liabilities measured at fair value in the statements of financial position on a recurring basis as at June 30, 2017 and December 31, 2016.
(c) Financial Instruments Measured at Amortized Cost for which Fair Value is
Disclosed The table below summarizes the fair value hierarchy of the Group’s financial assets and financial liabilities which are not measured at fair value in the 2017 and 2016 statements of financial position but for which fair value is disclosed.
Level 1 Level 2 Level 3 Total
Consolidated
June 30, 2017
Financial Assets
Equity securities
AFS Financial Assets - 47,500,000 P 6,633,275 P 54,133,275 P
Consolidated
December 31, 2016
Financial Assets
Equity securities
AFS Financial Assets - 47,500,000 P 6,633,275 P 54,133,275 P
Level 1 Level 2 Level 3 Total
Financial Assets
Cash and cash equivalents 1,853,657,393 P P - P - 1,853,657,393 P
Receivables - net - - 3,280,717,062 3,280,717,062
Advances to related parties - - 36,966,451 36,966,451
Refundable deposits - - 19,871,785 19,871,785
1,853,657,393 P P - 3,337,555,298 P 5,191,212,691 P
Financial Liabilities
Interest - bearing loans P - P - 2,678,120,574 P 2,678,120,574 P
Trade and other payables - - 898,408,456 898,408,456
P - P - 3,576,529,030 P 3,576,529,030 P
June 30, 2017 (Consolidated)
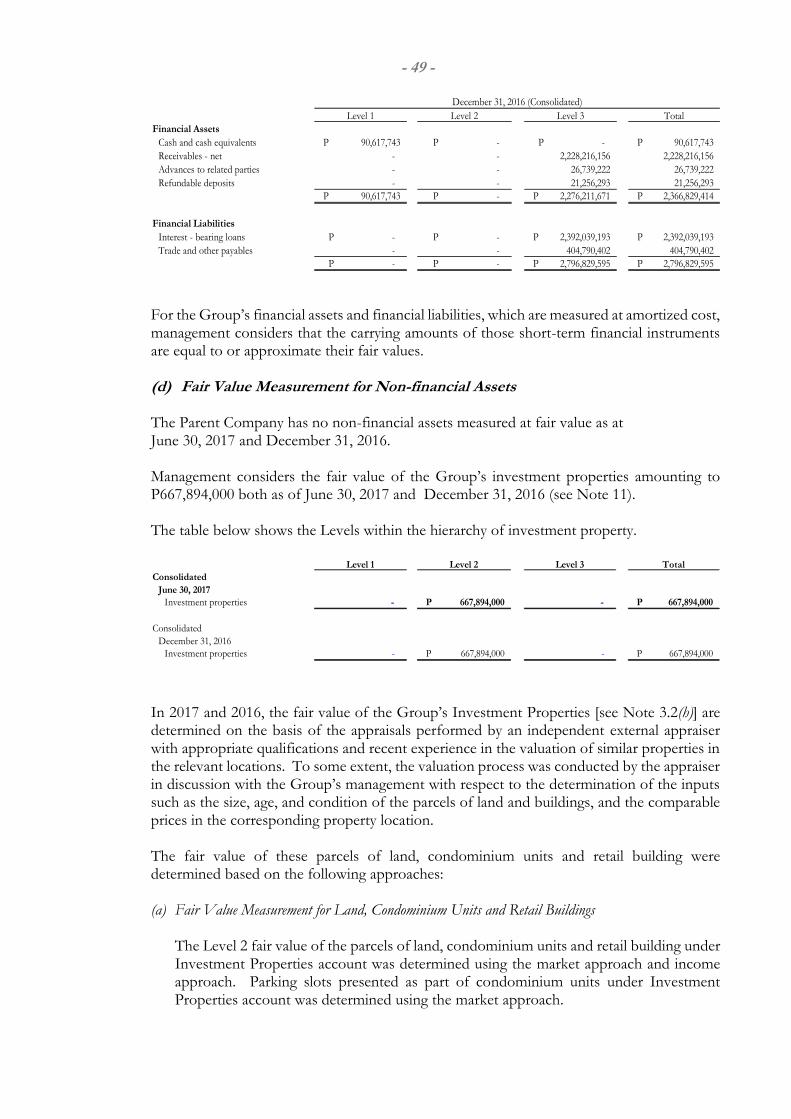
- 49 -
For the Group’s financial assets and financial liabilities, which are measured at amortized cost, management considers that the carrying amounts of those short-term financial instruments are equal to or approximate their fair values. (d) Fair Value Measurement for Non-financial Assets The Parent Company has no non-financial assets measured at fair value as at June 30, 2017 and December 31, 2016. Management considers the fair value of the Group’s investment properties amounting to P667,894,000 both as of June 30, 2017 and December 31, 2016 (see Note 11). The table below shows the Levels within the hierarchy of investment property.
In 2017 and 2016, the fair value of the Group’s Investment Properties [see Note 3.2(h)] are determined on the basis of the appraisals performed by an independent external appraiser with appropriate qualifications and recent experience in the valuation of similar properties in the relevant locations. To some extent, the valuation process was conducted by the appraiser in discussion with the Group’s management with respect to the determination of the inputs such as the size, age, and condition of the parcels of land and buildings, and the comparable prices in the corresponding property location. The fair value of these parcels of land, condominium units and retail building were determined based on the following approaches: (a) Fair Value Measurement for Land, Condominium Units and Retail Buildings
The Level 2 fair value of the parcels of land, condominium units and retail building under Investment Properties account was determined using the market approach and income approach. Parking slots presented as part of condominium units under Investment Properties account was determined using the market approach.
Level 1 Level 2 Level 3 Total
Financial Assets
Cash and cash equivalents 90,617,743 P P - P - 90,617,743 P
Receivables - net - - 2,228,216,156 2,228,216,156
Advances to related parties - - 26,739,222 26,739,222
Refundable deposits - - 21,256,293 21,256,293
90,617,743 P P - 2,276,211,671 P 2,366,829,414 P
Financial Liabilities
Interest - bearing loans P - P - 2,392,039,193 P 2,392,039,193 P
Trade and other payables - - 404,790,402 404,790,402
P - P - 2,796,829,595 P 2,796,829,595 P
December 31, 2016 (Consolidated)
Level 1 Level 2 Level 3 Total
Consolidated
June 30, 2017
Investment properties - 667,894,000 P - 667,894,000 P
Consolidated
December 31, 2016
Investment properties - 667,894,000 P - 667,894,000 P

- 50 -
Under the income approach, these uses valuation techniques that convert future amounts (e.g. cash flows or income and expenses) to a single current (i.e. discounted) amount. The fair value measurement is determined on the basis of the value indicated by current market expectations about those future amounts.
On the other hand, under the market approach, when comparable lease offerings of similar properties and sales prices of comparable land properties in close proximity are used in the valuation of the subject property with insignificant adjustment on the price, fair value is included in Level 2. Consequently, if the observable recent prices of the reference properties were adjusted significantly for differences in key attributes such as properties size, zoning and accessibility, the fair value is included in Level 3. The most significant input into this valuation approach is the price per square foot; hence, the higher the price per square foot, the higher the fair value.
(b) Fair Value Measurement for Improvements under Retail Buildings The Level 2 fair value of building improvements presented as part of retail buildings under Investment Properties account was determined using the cost approach that reflects the cost to a market participant to construct an asset of comparable usage, construction standards, design and layout, adjusted for obsolescence. The more significant inputs used in the valuation include direct and indirect costs of construction such as but not limited to, labor and contractor’s profit, materials and equipment, surveying and permit costs, electricity and utility costs, architectural and engineering fees, insurance and legal fees. These inputs were derived from various suppliers and contractor’s quotes, price catalogues, and construction price indices. Under this approach, higher estimated costs used in the valuation will result in higher fair value of the properties. There has been no change on the valuation techniques used by the Group, except as indicated above, during the period for its investment properties. Also, there were no transfers into or out of Level 2 fair value hierarchy for the period ended June 30, 2017 and December 31, 2016.
28. CAPITAL MANAGEMENT OBJECTIVES, POLICIES AND PROCEDURES The Group’s capital management objectives are to ensure the Group’s ability to continue as a going concern and to provide an adequate return to shareholders by pricing products and services commensurate with the level of risk. The Group monitors capital on the basis of the carrying amount of equity as presented in the statements of financial position. Capital for the reporting periods under review is summarized as follows:
June 30, 2017 December 31, 2016
Total liabilities 4,755,792,412 3,808,672,984
Total equity 4,175,169,215 1,561,430,826
Debt-to-equity ratio 1.14:1.00 2.44:1.00
Consolidated

- 51 -
The Group’s goal in capital management is to maintain a maximum debt-to-equity structure ratio of 75:25 on a monthly basis (see Note 14). This is in line with the Parent Company’s compliance with requirement of the BOI. The Group sets the amount of capital in proportion to its overall financing structure, i.e., equity and financial liabilities. The Group manages the capital structure and makes adjustments to it in the light of changes in economic conditions and the risk characteristics of the underlying assets. In order to maintain or adjust the capital structure, the Group may adjust the amount of dividends paid to shareholders, issue new shares or sell assets to reduce debt. The Group has complied with its covenant obligations, including maintaining the required debt-to-equity ratio for both period ended June 30, 2017 and December 31, 2016.