S.E.C. Number 10044 - PHILEX MINING CORPORATION · December 31, 2016, the Group’s mining business...
188
Transcript of S.E.C. Number 10044 - PHILEX MINING CORPORATION · December 31, 2016, the Group’s mining business...


1
S.E.C. Number 10044 File Number______
PHILEX MINING CORPORATION (Company’s Full Name)
2nd Floor LaunchPad, Reliance Street corner Sheridan Street, Mandaluyong City, Metro Manila 1550
(Company’s Address)
631-1381 to 88 (Telephone Numbers)
December 31 (Fiscal Year Ending)
(month & day)
SEC FORM 17-A Annual Report
Form Type
_____________________________
Amendment Delegation (If applicable)
December 31, 2016 Period Ended Date
__________________________ (Secondary License Type and File Number)

2
SECURITIES AND EXCHANGE COMMISSION
SEC FORM 17-A
ANNUAL REPORT PURSUANT TO SECTION 17 OF THE SECURITIES REGULATION CODE
AND SECTION 141 OF CORPORATION CODE OF THE PHILIPPINES
1. For the calendar year ended December 31, 2016
2. SEC Identification Number 10044
3. BIR Tax Identification No. 000-283-731-000
4. Exact name of issuer as specified in its charter: PHILEX MINING CORPORATION
5. Philippines
Province, Country or other jurisdiction of incorporation or organization
6. (SEC Use Only) Industry Classification Code:
7. 2nd Floor LaunchPad, Reliance Street corner Sheridan Street, Mandaluyong City,
Metro Manila
Address of principal office Postal Code 1550
8. (632) 631-1381 to 88
Issuer’s telephone number, including area code
9. Philex Building, 27 Brixton Street, Pasig City 1600
Former name, former address, and former fiscal year, if changed since last report
10. Securities registered pursuant to Sections 8 and 12 of the SRC, or Sec. 4 & 8 of the RSA Number of Shares of Common Stock Outstanding
Title of Each Class and Amount of Debt Outstanding
Common shares, P1 par value (as of Dec. 31, 2016) 4,940,399,068
Debt Outstanding (as of December 31, 2016) P9,675,494,423
11. Are any or all of these securities listed on a Stock Exchange?
Yes [ X ] No [ ]
If yes, state the name of such stock exchange and the classes of securities listed therein:
Philippine Stock Exchange Common Shares
12. Check whether the issuer:
(a) has filed all reports required to be filed by Section 17 of the SRC and SRC Rule 17
thereunder or Section 11 of the RSA and RSA Rule 11(a) – 1 thereunder, and
Sections 26 and 141 of the Corporation Code of the Philippines during the preceding
twelve (12) months (or for such shorter period that the issuer was required to file such
reports).
Yes [ X ] No [ ]
(b) has been subject to such filing requirements for the past 90 days.
Yes [ X ] No [ ]
13. Aggregate market value of the voting stock held by non-affiliates: P42.487 billion based on
closing price at the Philippine Stock Exchange on March 27, 2017.
3
PART 1
BUSINESS AND GENERAL INFORMATION
Item 1. Business
CORPORATE PROFILE
Philex Mining Corporation (“PMC” or the “Company”) and its subsidiaries are organized into two
main business groupings: the mining business, which is directly under PMC, Philex Gold
Philippines, Inc. (PGPI) and Silangan Mindanao Mining Co., Inc. (SMMCI), and the energy and
hydrocarbon business under PXP Energy Corporation (PXP), formerly Philex Petroleum
Corporation, but not until July 15, 2016, when PXP and its subsidiaries ceased to be subsidiaries
of PMC as a result of loss on control through property dividend declaration. Thus, as of
December 31, 2016, the Group’s mining business remains as its only business segment.
Mining Business
The Company was incorporated in the Philippines in 1955 and has been listed in the
Philippine Stock Exchange since November 23, 1956. PMC, PGPI (a wholly-owned
subsidiary incorporated in the Philippines) and Silangan Mindanao Exploration Co., Inc.
(SMECI, a wholly-owned subsidiary incorporated in the Philippines) and its subsidiary,
SMMCI, are primarily engaged in large-scale exploration, development and utilization of
mineral resources.
PMC operates the Padcal Mine in Benguet for the past 59 years using the underground
block-cave method. It is one of the oldest operating mines in the country and provides
PMC its biggest source of revenue. In October 2015, an additional 20 million tonnes of
ore reserves were declared within the current ore body, which will extend the mine’s life
by two (2) more years, from 2020 to 2022. In February 2016, the Company disclosed the
results of ongoing exploration near the surface of Bumolo Project, which area is within
Mineral Production Sharing Agreement (MPSA) 156-2000-CAR, with an estimated 21.7
million tonnes of inferred resources at 0.21% copper and 0.30 grams per tonne gold, at a
cut-off of 0.312% CuEq.
PGPI, on the other hand, operated the Bulawan mine in Negros Occidental until the second quarter of 2002. The Company’s exploration strategy in the late 1980’s was focused on gold exploration, which resulted in the acquisition and staking of a number of primarily gold claim holdings throughout the Philippines. In July 1996, these gold assets were transferred to PGPI. These assets included the Bulawan mine in Negros Occidental, Negros Island, which operated commercially from January 1996 until 2002, when it was decommissioned due to unfavorable metal prices. The Bulawan mine currently has remaining resources of 23.9 million tonnes, including that of the Vista Alegre area. Exploration projects in the Vista Alegre area include the Nagtalay project and the Laburan/Skid 9 project, which have completed the geological modelling and preliminary resource estimation.
SMECI, through SMMCI, owns the Silangan Project covering the Boyongan and Bayugo
deposits in Surigao. SMMCI completed the pre-feasibility study of Boyongan deposit in
late 2014, and is currently conducting the definitive or bankable feasibility study, which is
expected to be completed in 2017. The Boyongan copper-gold porphyry deposit in
Surigao del Norte was discovered in August 2000 under SMMCI, a joint venture with
Anglo American Exploration Plc (Anglo). On February 6, 2009, the Company acquired

4
Anglo’s 50% interest in the Silangan Project under SMMCI for a cash consideration of
US$55 million, thereby owning 100% of the Silangan Project. Adjacent to the Silangan
Project is the Kalayaan Project, the exploration of which is being undertaken by the
Company by virtue of a Farm-in Agreement with Kalayaan Gold & Copper Resources,
Inc., a subsidiary of Manila Mining Corporation.
Energy and Hydrocarbon Business
On February 29, 2016, the Company’s Board of Directors approved a property dividend
consisting of shares of stock of PXP at the ratio of seventeen PXP shares for every one
hundred shares of PMC, which was approved by the Securities and Exchange
Commission on June 22, 2016.
The transaction reduced PMC’s shareholdings in PXP, effective July 15, 2016, from
64.7% to approximately 19.8%, and allow PMC to leverage on its key strengths and focus
its resources on its core business of metals mining, particularly with respect to the
extension of Padcal’s life of mine, commercial operations of the Silangan project and
development of other Company mining tenements.
PRODUCTS/SALES
For the past 59 years, the Company has operated the Sto. Tomas II deposit at Padcal, Tuba,
Benguet Province – the first underground block caving operation in the Far East.
The Company’s Padcal mine produces copper concentrates, containing copper, gold and silver. Total ore extracted and processed from start of operation to 2016 aggregated to 400.606 million tonnes, producing 2.248 billion pounds of copper, 6.098 million ounces of gold, and 6.573 million ounces of silver.
Based on the Sales Agreement entered into by the Company and Pan Pacific Copper Co., Ltd. (Pan Pacific), a major Japanese copper producer jointly established by JX Nippon Mining & Metals Corporation and Mitsui Mining & Smelting Co., Ltd., in March 2004, 60% of the Company’s annual copper concentrate production, approximately 40,000 dry metric ton of current production level, is committed to Pan Pacific, and the remaining copper concentrate to Louis Dreyfuss Commodities Metals Suisse SA. Pan Pacific processes the concentrates through its smelter plants and produces products, such as refined copper, precious metals and sulfuric acid. Pan Pacific is one of the leading buyers of copper concentrates in the world, procuring approximately 1.7 million tonnes of copper concentrates annually from around the world. Compared to this huge volume, the Company’s shipments to Pan Pacific is relatively insignificant.
All of the Parent Company’s sales revenues for the years 2014 to 2016 were from copper
concentrate shipments made to Japan. The 2016 consolidated revenue of the Company included
the net realizable value of mine products inventory at the end of the financial reporting period.
5
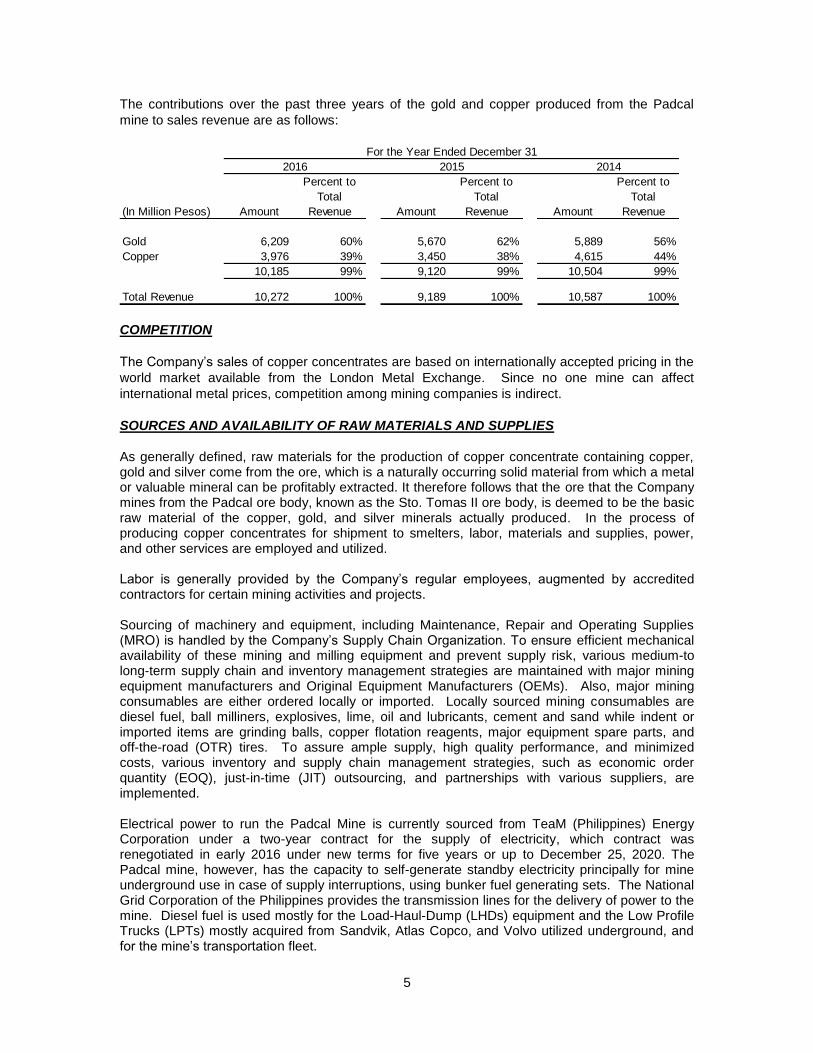
The contributions over the past three years of the gold and copper produced from the Padcal
mine to sales revenue are as follows:
COMPETITION
The Company’s sales of copper concentrates are based on internationally accepted pricing in the
world market available from the London Metal Exchange. Since no one mine can affect
international metal prices, competition among mining companies is indirect.
SOURCES AND AVAILABILITY OF RAW MATERIALS AND SUPPLIES
As generally defined, raw materials for the production of copper concentrate containing copper, gold and silver come from the ore, which is a naturally occurring solid material from which a metal or valuable mineral can be profitably extracted. It therefore follows that the ore that the Company mines from the Padcal ore body, known as the Sto. Tomas II ore body, is deemed to be the basic raw material of the copper, gold, and silver minerals actually produced. In the process of producing copper concentrates for shipment to smelters, labor, materials and supplies, power, and other services are employed and utilized. Labor is generally provided by the Company’s regular employees, augmented by accredited contractors for certain mining activities and projects. Sourcing of machinery and equipment, including Maintenance, Repair and Operating Supplies (MRO) is handled by the Company’s Supply Chain Organization. To ensure efficient mechanical availability of these mining and milling equipment and prevent supply risk, various medium-to long-term supply chain and inventory management strategies are maintained with major mining equipment manufacturers and Original Equipment Manufacturers (OEMs). Also, major mining consumables are either ordered locally or imported. Locally sourced mining consumables are diesel fuel, ball milliners, explosives, lime, oil and lubricants, cement and sand while indent or imported items are grinding balls, copper flotation reagents, major equipment spare parts, and off-the-road (OTR) tires. To assure ample supply, high quality performance, and minimized costs, various inventory and supply chain management strategies, such as economic order quantity (EOQ), just-in-time (JIT) outsourcing, and partnerships with various suppliers, are implemented. Electrical power to run the Padcal Mine is currently sourced from TeaM (Philippines) Energy Corporation under a two-year contract for the supply of electricity, which contract was renegotiated in early 2016 under new terms for five years or up to December 25, 2020. The Padcal mine, however, has the capacity to self-generate standby electricity principally for mine underground use in case of supply interruptions, using bunker fuel generating sets. The National Grid Corporation of the Philippines provides the transmission lines for the delivery of power to the mine. Diesel fuel is used mostly for the Load-Haul-Dump (LHDs) equipment and the Low Profile Trucks (LPTs) mostly acquired from Sandvik, Atlas Copco, and Volvo utilized underground, and for the mine’s transportation fleet.
(In Million Pesos) Amount
Percent to
Total
Revenue Amount
Percent to
Total
Revenue Amount
Percent to
Total
Revenue
Gold 6,209 60% 5,670 62% 5,889 56%
Copper 3,976 39% 3,450 38% 4,615 44%
10,185 99% 9,120 99% 10,504 99%
Total Revenue 10,272 100% 9,189 100% 10,587 100%
2016 2015 2014
For the Year Ended December 31

6
The maintenance of the Padcal mine’s cable-haul conveyor system to transport the ore underground to the mill is contracted with Prince ACE Corporation, a Philippine company that works closely with Conveyor Design Engineering (Australia) and JV Industries (Australia). The Company has its own drilling expertise and equipment to conduct its own drilling activities, but drilling contractors, such as Quest Exploration Drilling (Philippines), Inc., DrillCorp Philippines, Inc., and MDGI Philippines, Inc., are also utilized, particularly for exploration. From time to time as may be needed, local and foreign consultants would also be engaged to provide the Company technical advice or assistance in doing specific engineering projects.
EMPLOYEES
The total manpower complement of the Parent Company as of December 31, 2016 consisted of
1,982 full-time regular employees (1,879 from Padcal and 103 from Mandaluyong Head Office).
Of the Company’s employees, 1,369 were in operations while 613 were involved in support
service functions. Employee classifications according to rank were as follows:
The overall average tenure of employees is 14 years, with an average age of 41 years old. The
employee population’s gender distribution was 93% male and 7% female. The Company
anticipates no material change in the number and type of employees within the ensuing twelve
months.
The Padcal employees belong to two collective bargaining agents: the Philex Rank-and-File
Employees Union-Association of Labor Unions (Trade Union Congress of the Philippines)
[PRFEU-ALU (TUCP)] for rank-and-file employees and the Philex Mining Supervisory Employees
Union-Association of Professional Supervisory Office Technical Employees Union (Trade Union
Congress of the Philippines) [PMSEU-APSOTEU (TUCP)] for supervisors. The five-year
collective bargaining agreements (CBAs) with both unions were signed in January 2016 with
effectivity up to January 2, 2020 for PRFEU-ALU (TUCP) and up to May 1, 2020 for PMSEU-
APSOTEU (TUCP).
On the other hand, Head Office rank-and-file employees are members of the Philex Pasig
Employees Union. The Philex Pasig Employees Union and the Company executed a
Memorandum of Agreement on December 27, 2016 pending the signing of the formal Collective
Bargaining Agreement. The Agreement, which will be registered with DOLE, will be renegotiated
anew in 2019-2020..
There has been no major labor dispute or strike by any of the Company’s unions in the past five
years. In addition, the Company has no other supplemental benefits or incentive arrangements
under its collective bargaining agreements with the unions other than the usual employee
benefits, such as vacation and sick leave pays, among others.
A Manpower-Rightsizing Program (MRP) was implemented in Padcal Mine and Mandaluyong
Head Office in November 2014 and early 2015, which reduced the overall manpower complement
by 534.
Manpower complement including subsidiaries totaled to 2,023 and 2,111, in 2016 and 2015,
respectively.
Dec. 31, 2016 Dec. 31, 2015
Officers and Managerial 125 124
Supervisory 488 498
Rank & File 1,369 1,385
Total 1,982 2,007
7
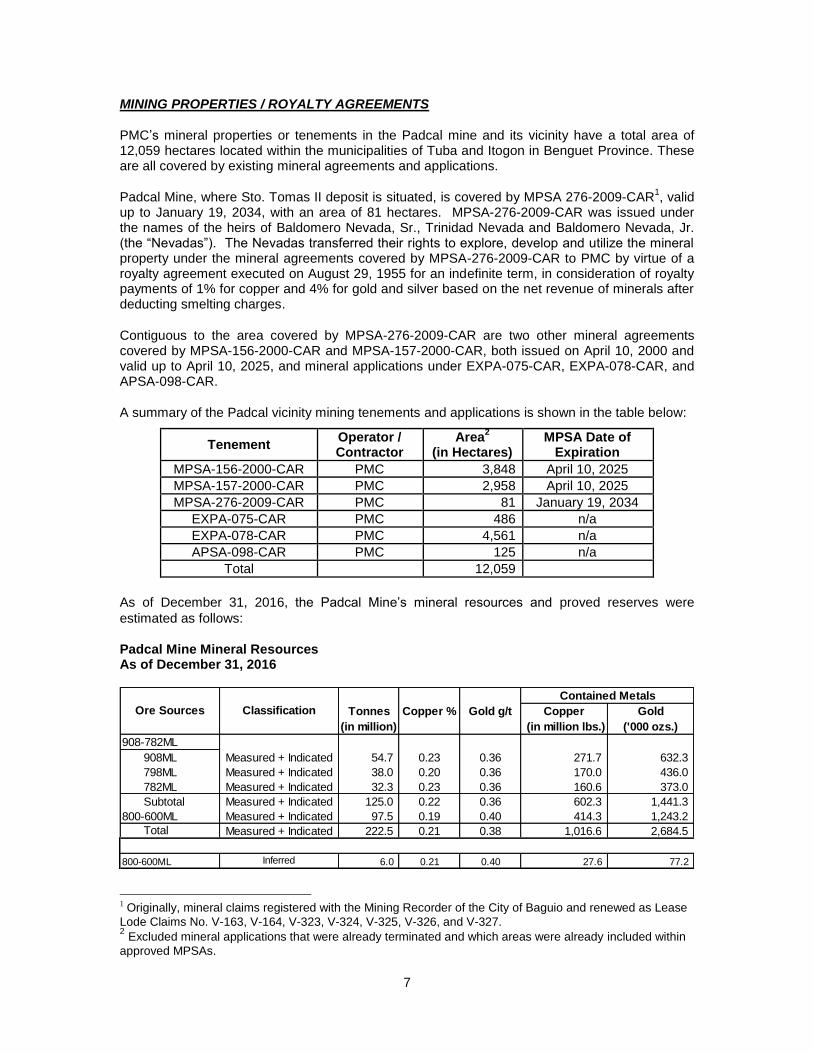
MINING PROPERTIES / ROYALTY AGREEMENTS
PMC’s mineral properties or tenements in the Padcal mine and its vicinity have a total area of 12,059 hectares located within the municipalities of Tuba and Itogon in Benguet Province. These are all covered by existing mineral agreements and applications.
Padcal Mine, where Sto. Tomas II deposit is situated, is covered by MPSA 276-2009-CAR1, valid
up to January 19, 2034, with an area of 81 hectares. MPSA-276-2009-CAR was issued under the names of the heirs of Baldomero Nevada, Sr., Trinidad Nevada and Baldomero Nevada, Jr. (the “Nevadas”). The Nevadas transferred their rights to explore, develop and utilize the mineral property under the mineral agreements covered by MPSA-276-2009-CAR to PMC by virtue of a royalty agreement executed on August 29, 1955 for an indefinite term, in consideration of royalty payments of 1% for copper and 4% for gold and silver based on the net revenue of minerals after deducting smelting charges.
Contiguous to the area covered by MPSA-276-2009-CAR are two other mineral agreements covered by MPSA-156-2000-CAR and MPSA-157-2000-CAR, both issued on April 10, 2000 and valid up to April 10, 2025, and mineral applications under EXPA-075-CAR, EXPA-078-CAR, and APSA-098-CAR.
A summary of the Padcal vicinity mining tenements and applications is shown in the table below:
Tenement Operator / Contractor
Area2
(in Hectares) MPSA Date of
Expiration
MPSA-156-2000-CAR PMC 3,848 April 10, 2025
MPSA-157-2000-CAR PMC 2,958 April 10, 2025
MPSA-276-2009-CAR PMC 81 January 19, 2034
EXPA-075-CAR PMC 486 n/a
EXPA-078-CAR PMC 4,561 n/a
APSA-098-CAR PMC 125 n/a
Total 12,059
As of December 31, 2016, the Padcal Mine’s mineral resources and proved reserves were
estimated as follows:
Padcal Mine Mineral Resources As of December 31, 2016
1 Originally, mineral claims registered with the Mining Recorder of the City of Baguio and renewed as Lease
Lode Claims No. V-163, V-164, V-323, V-324, V-325, V-326, and V-327. 2 Excluded mineral applications that were already terminated and which areas were already included within
approved MPSAs.
Copper Gold
(in million) (in million lbs.) ('000 ozs.)
908-782ML
908ML Measured + Indicated 54.7 0.23 0.36 271.7 632.3
798ML Measured + Indicated 38.0 0.20 0.36 170.0 436.0
782ML Measured + Indicated 32.3 0.23 0.36 160.6 373.0
Subtotal Measured + Indicated 125.0 0.22 0.36 602.3 1,441.3
800-600ML Measured + Indicated 97.5 0.19 0.40 414.3 1,243.2
Total Measured + Indicated 222.5 0.21 0.38 1,016.6 2,684.5
800-600ML Inferred 6.0 0.21 0.40 27.6 77.2
Copper % Gold g/tClassification Tonnes
Contained Metals
Ore Sources

8
Notes:
1. Parameters:
Copper Equivalent (CuEq) cut-off grade = 0.332%; Metal Prices: US$2.75 per pound Cu, US$1,275 per ounce Au; Metal Recoveries: 82% Cu, 80% Au; Conversion Factor for gold to CuEq: 0.660%
2. Mineral Resource reported is based on the Resource block model prepared by R. C. Obial & Associates.
3. Mineral Resource Estimates followed the terminology and guidelines set forth in the Philippine Mineral Reporting code (PMRC).
4. Total resources include proved reserves.
5. All tonnage information has been rounded to reflect the relative uncertainty in the estimates; there may therefore be small differences in the totals.
This Resource Statement was prepared by Mr. Noel C. Oliveros, Exploration Division Manager of Philex Mining Corporation, who has sufficient experience relevant to the style of mineralization of Sto. Tomas II Porphyry Copper Deposit. Mr. Oliveros is a Competent Person for Exploration and Mineral Resource Estimation under the definition of the Philippine Mineral Reporting Code (“PMRC”). He is a professional Geologist with PRC License No. 1285 and accreditation number Geology CP-07-08-07. He has given his consent to the Public Reporting of this statement concerning Mineral Resource Estimation.
Padcal Mine Proved Reserves As of December 31, 2016
Notes:
1. Geovia PCBCTM
software was used in the above estimate with the following parameters:
Copper Equivalent (CuEq) cut-off grade = 0.332%; Metal Prices: US$2.75 per pound Cu, US$1,275 per ounce Au; Metal Recoveries: 82% Cu, 80% Au; Forex:
P48/US$1; Operating Cost per MT: P793; Conversion Factor for gold to CuEq:
0.660%
2. The operating cost per MT of P793 is the actual cost for CY 2016 and is lower by 2% compared to
last year’s disclosure of P810.
3. Meanwhile, the FOREX of P48/US$1 is the conservative projection of the Company and is higher
by 9% compared to last year’s P44/US$1.
4. Better grade reserves at 760-ML have been added in place of lower grade reserves at 798-ML, 782-ML and 700-ML.
This Reserve Statement was prepared by Engr. Ricardo S. Dolipas II (BSEM), Mine Division Manager of Philex Mining Corporation. Engr. Dolipas is a Competent Person under the definition of the PMRC and has sufficient experience as to the type of deposit and style of mining in Padcal Mine. He is a licensed mining engineer with PRC registration number 0002513 and CP
Copper Gold
(in million) (in million lbs.) ('000 ozs.)
908ML 0.4 0.11 0.43 0.7 4.4
798ML 25.0 0.20 0.38 90.7 242.8
782ML 11.2 0.20 0.35 41.0 100.3
760ML 12.1 0.21 0.49 45.2 152.3
730ML 7.1 0.19 0.46 24.4 83.6
700ML 3.9 0.20 0.44 14.2 44.0
Total 59.7 0.20 0.41 216.2 627.4
Ore Sources Tonnes
Recoverable Metals
Copper % Gold g/t

9
accreditation number EM 0002513-021/13. He has given his consent to the Public Reporting of this statement concerning Mineral Reserve Estimation.
On October 28, 2015, the declared life of mine of Padcal Mine has been extended to year 2022 from 2020 due to an additional 20 million tonnes declared proved reserves.
On February 22, 2016, the Company disclosed the results of ongoing exploration near the surface of Bumolo Project, which area is within MPSA 156-2000-CAR, with an estimated 21.7 million tonnes of inferred resources at 0.21% copper and 0.30 grams per tonne gold, at a cut-off of 0.312% CuEq.
Other mineral agreements and/or applications of the Company, such as EXP-000004-VI for mineral property located in the Province of Negros Occidental, and mineral agreements and/or applications of its subsidiaries and affiliates are discussed in the Exploration and Development section of this report.
PATENTS, TRADEMARKS AND LICENSES
The Company has several areas targeted for exploration within the vicinity of the Padcal Mine, which has a total of 13,228 hectares covered by the mining agreements and applications identified in the table above and in the Exploration and Development section of this report. Apart from these mining properties and tenements, the Company holds no other patents, trademarks, copyrights, licenses, franchises and concessions from the government issued and granted to the Company by government authorities on which the Company’s Padcal mine operations depend on.
GOVERNMENT REGULATIONS AND APPROVALS
Existing governmental regulations affect the Company’s operations, particularly on the costs of compliance reflected either as expense or as capital asset under generally accepted accounting principles. In the case of new government regulations, the effect or impact of such new governmental regulations on the Company’s operations could only be determined upon their passage and implementation.
The exploration, development and utilization of the country’s natural resources is governed principally by the 1987 Constitution, which provides that the State may directly explore, develop, and utilize the country’s natural resources, or it may enter into co-production, joint venture or production-sharing agreements with Filipino citizens or corporations or associations, at least sixty per centum of whose capital is owned by such citizens. The Constitution also authorizes the President of the Republic of the Philippines to enter into technical or financial assistance agreements with foreign-owned corporations for large-scale exploration, development, and utilization of minerals, petroleum, and other mineral oils in accordance with the general terms and conditions of applicable laws, based on real contributions to the economic growth and general welfare of the country. Several laws have since been enacted to implement these Constitutional principles and directives.
RA 7942: Mining Act of 1995, approved on March 3, 1995
Republic Act 7942 or the Mining Act of 1995 sets out the provisions governing mining and mining-related activities in the country. The Mining Act declares the areas open for mining operations and at the same time, enumerates those closed for mining applications. More importantly, said law sets forth the mining cycle and the corresponding permits needed for each phase: from exploration to the declaration of mining project feasibility, to the positive determination of commercial viability of a project, to the execution of mineral agreements with the government prior to actual operations, until the required rehabilitation after operating a mine.
10
RA 8371: Indigenous Peoples’ Rights Act of 1997, approved on October 29, 1997
RA 8371 or the Indigenous Peoples’ Rights Act of 1997 (“IPRA Law”) introduced the requirement of “Free and Prior Informed Consent” (FPIC) which means the consensus of members of the concerned Indigenous People (IP) / Indigenous Cultural Community (ICC). Under the said law, all departments and governmental agencies are strictly enjoined from issuing, renewing, or granting any concession, license or lease or entering into a production sharing agreement, without prior certification from the National Commission on Indigenous Peoples (NCIP), which certification can only be issued after the FPIC with the IPs / ICCs concerned is concluded.
PD No. 1586, Environmental Impact Assessment System (EIA), issued on June 11, 1978
Presidential Decree No. 1586 (PD No. 1586) introduced the Environmental Impact Assessment System (EIA) which mandates that “no person, partnership, or corporation shall undertake or operate any such declared environmentally critical project or area without first securing an Environmental Compliance Certificate issued by the President or his duly authorized representative”. Hence, pursuant to PD No. 1586, the Mining Act of 1995 requires mining companies to secure an Environmental Compliance Certificate (ECC) in all phases of mining activities, except during the exploration stage.
EO 79, issued on July 6, 2012
Executive Order No. 79 was issued by President Benigno Aquino III creating the Mining Industry Coordinating Council (MICC) and instituting changes to ensure the practice of responsible mining in the country.
HB No. 503, filed on June 30, 2016
House Bill No. 50 seeks to adopt a systematic, coherent and responsive forest management system to restore the integrity of our forest ecosystem. This bill recognizes the Sustainable Forest Ecosystems Management (SFEM) strategy as the principal policy framework for all programs in the forestry sector. The bill prioritizes the protection and rehabilitation of our forest systems through regeneration or restoration of natural forests. HB Nos. 54 and 113
4, both filed on June 30, 2016
House Bill Nos. 54 and 113 are proposed to take the place of RA 7942 because it allegedly failed to ensure the constitutionally guaranteed rights of the people to a balanced and healthful ecology, to social justice in all phases of national development, to a self-reliant and independent economy effectively controlled by Filipinos, and other important rights. These house bills seek to (i) guarantee that the exploration, development and utilization of mineral resources will primarily benefit the Filipino people; (ii) prioritize sustainable livelihood choices for communities; give utmost importance to food security and livable conditions for the people; (iii) ensure that the gains from the mining industry would be maximized while preventing or mitigating its adverse effects; (iv) recognize that the issue of environment and sustainable development is local and thus prioritize local participation in decisions surrounding mining; (v) ensure the protection of human rights of communities and individuals; and (vi) impose harsh penalties for the violation of its provisions.
3 Explanatory Note by Rep. Lawrence Lemuel H. Fortun
4 Explanatory Notes by Reps. Kaka Bag-ao, Teddy Brawner Baguilat and Lawrence Lemuel H. Fortun

11
HB No. 3915, filed on June 30, 2016
House Bill No. 391 seeks to amend RA 7942 in order to protect the rights of the members of Indigenous Cultural Communities or Indigenous Peoples and remove the confusion created by RA 8371. HB No. 422
6, filed on June 30, 2016
House Bill No. 422 proposes a fiscal regime and revenue sharing arrangement between the Government and the mining contractor for large-scale metallic mineral mining operations, wherein the Government Share shall be ten percent (10%) of Gross Revenue or fifty-five percent (55%) of the Adjusted Net Mining Revenue (ANMR), whichever is higher. In the event that the ANMR Margin exceeds fifty percent (50%) due to increase in metal prices or other factors, the Government, as owner of the mineral, shall get fifty-five percent (55%) of the Threshold ANMR plus sixty percent (60%) on the excess ANMR. Adjusted Net Mining Revenue is arrived at after deducting from Gross Revenue the allowable deductible expenses. Based on the bill, the payment to the government shall be in lieu of all national and local taxes including income tax, royalty for indigenous cultural communities (ICC), duties on imported specialized capital mining equipment, fees for mayors and/or business permits and other fees and charges imposed by the host local government units (LGUs). HB No. 488
7, filed on June 30, 2016
House Bill No. 488 seeks to establish the standards for responsible mining based on the draft standard issued by the Initiative for Responsible Mining Assurance in Canada on April 5, 2016. This was proposed pursuant to President Rodrigo Duterte’s directive that mining should be based on the standards of responsible mining in developed countries like Canada and Australia. HB No. 1618
8, filed on July 14, 2016
House Bill No. 1618 seeks to close areas declared by LGUs as No-Mining Zones from mining applications and operations, amending RA No. 7942. The proposal is based on the belief of the author that the national government should respect and recognize the prerogative of local government units to declare areas under their respective jurisdictions as no-mining zones through the enactment of local ordinances. HB No. 1665
9, filed on July 18, 2016
House Bill No. 1665 seeks to formulate a framework that would focus on prudent use of natural resources, protection of the environment and the people to be affected like indigenous peoples, multi-party participation for sustainable development and poverty reduction. HB No. 2915
10, filed on August 15, 2016
House Bill No. 2915 was previously approved at the committee level of the 15
th Congress. The
Bill seeks the development of mineral ores. Downstream industries on the processing of mineral ores are encouraged so as to develop community-based supplier industries, services, improve government benefits for the mining industry and control the export of unprocessed minerals.
5 Explanatory Note by Rep. Jose T. Panganiban, Jr.
6 Explanatory Note by Rep. Romero “Miro” S. Quimbo
7 Explanatory Note by Reps. Gloria Macapagal Arroyo and Prospero Pichay, Jr.
8 Explanatory Note by Rep. Carlos Isagani T. Zarate
9 Explanatory Note by Rep. Ronald M. Cosalan
10 Explanatory Note by Rep. Joseph Stephen S. Paduano

12
HB No. 3229
11, filed on August 22, 2016
House Bill No. 3229 seeks to adopt a strategy for the industrialization of the mining industry, including the promotion of the processing of mineral ores and other downstream activities. HB No. 3440
12, filed on September 1, 2016
House Bill No. 3440 seeks to classify the mine rehabilitation fund as a public fund. With the classification as public fund, the mine rehabilitation fund will be subject to the audit powers of the Commission on Audit, thereby preventing those who manage it from misappropriating the fund. Further, it seeks to ensure that the mining industry has sufficient funds for the rehabilitation of areas affected by the mining industry. HB No. 3851
13, filed on September 29, 2016
House Bill No. 3851 seeks to empower cities and municipalities to exercise police power on sand, gravel and other quarry resources on their territory to be used exclusively for public purpose. With the enactment of the bill into law, the city or municipality where the extraction site is located will be given the responsibility of effectively monitoring the extraction activities in its territory by giving it the authority to issue the necessary government permits and utilizing its barangay executives to supervise the extraction of sand, gravel and other quarrying resources. The result of efficient monitoring would be an increase in income of all local governments while the granting by the city/municipal mayors of government permits allows for the timely completion of building and infrastructure projects for the benefit of the local government.
EXPLORATION AND DEVELOPMENT
Exploration and development (the equivalent of research and development for a mining company) are currently undertaken by the Company’s in-house team and with or assisted by consultants and other service providers like engineering and/or drilling contractors. Expenses related to exploration and development for 2016, 2015 and 2014 amounted to P625.3 million, P2.488 billion and P3.445 billion, respectively.
Note 13 of the Notes to Consolidated Financial Statements of the Exhibits in Part V, Item 14 is also incorporated hereto by reference.
Padcal Projects in Benguet
The Padcal Mine, which Philex has been operating since 1958, is the first underground block
cave operation in the Far East. The mine produces copper concentrates, with gold and silver as
by-products. Exploration activities in 2016 focused on three major projects in the vicinity of Padcal – Bumolo for intensive drilling, Desert Storm for surface assessment and targeting for porphyry copper-gold, and Tapsan for surface mapping for gold in veins. All three projects are located in MPSA-156, although a significant area of the possible resources in Tapsan occurs within MPSA-157.
11
Explanatory Note by Rep. Francisco Jose F. Matugas II 12
Explanatory Note by Reps. Rodel M. Batocabe, Alfredo A. Garbin, Jr. and Christopher S. Co 13
Explanatory Note by Rep. Jose Carlos L. Cari

13
Bumolo Project Bumolo lies about 1.5 kilometers (kms) from the Santo Tomas II orebody that is currently being mined. In 2016, a total of 11,075 meters (m) from 46 drill holes were examined and analyzed. These holes were combined with earlier information from drilling that started in March 2015 and resulted to the delineation of a low-grade, exposed porphyry copper-gold prospect that measures 400 m wide, 350 m long, and 120 m in thickness. Drilling, including metallurgical testing of mineralized drill core samples, was completed in August 2016 and yielded preliminary resources and grades of Indicated category at 11.4MT of 0.19%Cu and 0.30g/tAu quality, at a cut-off grade of 0.312% CuEq (copper equivalent). Desert Storm The Desert Storm project consists of four scattered prospects – namely Southwest, North Midway, Oliva, and Tapsan (copper) – where potential for buried porphyry copper-gold is currently being investigated. Social access to the prospect areas was vigorously pursued starting last quarter of 2016. Tapsan Investigations of the Tapsan project (for gold) commenced in the second quarter of 2016. Mapping of surface exposures and gold veins from a number of tunnels from pocket miners identified possible targets for drilling. The 731 grab and channel samples included 157 samples with assay of more than 0.5 parts per million (ppm) gold. Others Two (2) other projects around the vicinity of Padcal – Clifton and Santo Tomas II West – were also being investigated but were shortly suspended in 2016 due to regulatory challenges.
Support to Operations The Exploration and Mine Geology teams helped prepare the documents presented during the Department of Environment and Natural Resources (DENR) Audit conducted from August 9-10, 2016. The Mine Geology staff assisted the hydrogeology consultant SMEC in drilling and monitoring nine (9) horizontal holes underground in Santo Tomas II mine to study future dewatering needs should mining proceed below 800 ML. Underground mapping and sampling were also accomplished, through 2,120 samples collected over 6,603 m of horizontal and vertical tunnel advance. Based on the Competent Person’s Report disclosed in March 2017, the total Remaining Resource of Padcal Mine as of December 31, 2016 is 222.5 metric tonnes (MT), with an average grade of 0.21%Cu and 0.38g/tAu at cut-off grade of 0.332%CuEq. In addition, the annual assessment of the stability of the Subsidence Area was completed in three months. This included a preliminary structural mapping in December 2016, which yielded a limited water flow measurement. Petrographic analyses of mill stream, filter cake, copper middling, and final flotation tail samples were likewise conducted, with mineralogy results of which were regularly monitored as technical support to the Mill Operations. Likewise, a geohazard monitoring team assessed slides in Philex Road and other subsidiary roads within and around the minesite, which delivered satisfactory results, to ensure road safety.
Silangan Project The Silangan Project, located in Surigao del Norte, consists of two deposits – wholly-owned Boyongan and Bayugo, a portion of which is the subject of a joint venture agreement with Manila Mining Corporation. The Project is registered with the Board of Investments (BOI) as a non-

14
pioneer project entitled to four years of income tax holiday beginning 2017, extendable for another two years subject to certain conditions. In October 2016, the Project filed a request with the BOI on the movement of the start of the income tax holiday to the beginning of 2021. This request is currently pending with the BOI.
The Silangan Project tenements, consisting of the Boyongan and Bayugo deposits, are covered
by MPSA-149-99-XIII and EP-XIII-013 Lot-B located in Surigao del Norte. In July 2016, MPSA-
149-99-XIII was reduced to 2,332 hectares after relinquishing 677 hectares that are outside the
mine development and maintenance plan. It also relinquished 6,934 hectares from its EP-XIII-013
as part of government prescribed requirement for exploration permit renewal. EP-XIII-013 is now
reduced to 5,000 hectares from the previous 11,934 hectares. These two tenements which are
held by Silangan Mindanao Mining Company, Inc. (SMMCI), a wholly owned subsidiary of PMC,
are surrounded by other PMC tenements and applications within Surigao del Norte, as listed
below:
Tenements Operator / Contractor
Area (in Hectares)
MPSA Date of Expiration
MPSA-149-9-XIII SMMCI 2,202 December 29, 2024
MPSA-034-95-X SMMCI 405 February 1, 2021
EP-XIII-013 Lot-A&B SMMCI 5,000
EPA-XIII-012 SMMCI 2,330
EPA-000039-XIII SMMCI 6,683
Total 16,620
The reported resources for Boyongan and Bayugo as of August 5, 2011, were as follows:
Tonnes (millions)
Copper % Gold g/t Contained
Copper Gold
(million lbs.) (000 ozs.)
BOYONGAN
Measured 201 0.54 0.78 2,400 5,000
Indicated 72 0.46 0.57 720 1,300
Measured + Indicated 273 0.52 0.72 3,120 6,300
Inferred 26 0.41 0.49 240 400
BAYUGO
Measured 99 0.64 0.65 1,390 2,100
Indicated 26 0.76 0.69 430 600
Measured + Indicated 125 0.66 0.66 1,820 2,700
Inferred 7 0.77 0.60 120 100
Mr. Noel C. Oliveros, Exploration Division Manager and Head of the Exploration and Resource Estimation Group of Philex Mining Corporation, has given his consent to the release of this resource estimate. The resource estimate is compliant with the rules and guidelines as set forth by the Philippine Mineral Reporting Code (PMRC). Mr. Oliveros has sufficient experience in resource evaluation relevant to the style of mineralization in the Surigao Mineral District. Mr. Oliveros is a Competent Person for Exploration and Mineral Resource Estimation under the definition of the PMRC. He has given his consent to the public reporting of this estimate following the PMRC guidelines concerning Mineral Resource Estimation.
15
BOYONGAN AND BAYUGO DEPOSITS In November 2010, as part of the Project’s pre-feasibility study, SRK Consulting – an independent leading international mining engineering consulting firm – was engaged by SMMCI to make an independent evaluation of the project. SRK recommended the construction of an exploration decline or ramp to the bottom of the Boyongan deposit as part of a geotechnical investigation to provide more reliable and specific information on the area’s ground condition for purposes of mine planning and design as well as to obtain bulk samples from the ore body. The development of the decline started in April 2011 and advanced until January 2015, reaching a distance of 1,415m from the portal, with dimensions of 5m-high and 5m-wide. The center of the Boyongan deposit’s eastern high grade zone was mapped and bulk sampled via a crosscut, called the Ore Characterization Drive (OCD), approximately 800 meters from the decline. Another bulk sampling program was conducted from the surface using large diameter bore holes from May to December 2014. The decline, together with the OCD, was decommissioned last November 2015 and its portal was closed before the end of 2015. Under the supervision of lead consultant AECOM, a total of 100+ tons of bulk ore samples were prepared and shipped to various laboratories in Australia for bench and pilot metallurgical tests. This would be used for the development of the pilot plant. Meanwhile, the process flow design of the pilot plant, which produced copper cathodes, would be a significant input to the Definitive Feasibility Study (DFS). Value-engineering studies on the project was undertaken by AUSENCO, an independent engineering firm based in Brisbane, Australia in early 2016. The study progressed into a full Definitive Feasibility Study and is expected to be completed in 2017. The project’s amended ECC for the surface mining method was approved in May 2016 following the approval of the amended Mining Project Feasibility Study in connection with the approved Declaration of Mining Project Feasibility. The total expenditure related to the project as of December 31, 2016 amounted to P16.840 billion, including the P1.438 billion incurred prior to 2009, when the project was under Anglo. The figure does not include the fair value adjustment amounting to P5.552 billion.
KALAYAAN PROJECT
In May 2011, the Company executed a Farm-In Agreement with Manila Mining
Corporation (MMC), which involved the purchase of a 5% equity interest in Kalayaan
Gold-Copper Resources Inc. (KGCRI), a subsidiary of MMC that assigns the right to
explore the Kalayaan properties covering 286 hectares under EP-XIII-014B. This area is
adjacent to EP-XIII-013 and is containing the Bayugo deposit.
Under the agreement, the Company was to conduct exploration activities in the property
for three (3) years but was extended for an additional three years. Exploration of the area
is currently on hold pending the approval of the Third Renewal of the Exploration Period.
In the event the Company declares commercial feasibility of the area within the period, it
will have the right to increase its holdings in KGCRI to 60% by subscribing to an
additional 55% of KGCRI’s outstanding capital stock for a minimal amount and will
become an integral part of the Silangan Project.

16
The Company commenced drilling in December 2011 after ground preparations,
environmental mitigating measures and community-relations initiatives had been
conducted. This transpired for about seven (7) months after the signing of the Farm-In
Agreement. By September 2013, a total of 73,520 meters had been drilled, of which
66,486 meters were for resource definition and 7,034 meters for scout drilling.
In 2014, detailed logging of 57 definition drill holes of East and West Bayugo, totaling
26,104.64 meters, was completed. This activity increased the confidence in the
understanding of the mineralization. In addition, magnetotellurics (MT) survey from the
surface was conducted, which provided preliminary data on the hydrologic model of the
Boyongan and Bayugo deposits.
Other Significant Projects
During the course of the year, the Company’s Exploration Group also evaluated proposals for possible joint-ventures and/or operating agreements. However, insufficient data and the overall challenging regulatory climate prevented the Company from pursuing the offers further. In addition, EO 79 has stalled exploration activities in each of the Company’s various Mineral Production Sharing Agreements (MPSAs) located in Negros Occidental, Surigao del Norte and Zamboanga Del Norte.
COMPLIANCE WITH ENVIRONMENTAL LAWS
The Company’s Padcal mine had been issued ISO14001 Certification since 2002 for Environmental Management System. This certification has been suspended because of the tailings spill accident in the second half of 2012. The Company developed an Integrated Management System (IMS) in 2014. Evaluation of TUV Rheinland resulted in two certifications, ISO-14001 and Occupational Health and Safety Management, BS OSHAS 18001. Silangan is also ISO-14001 certified.
With the Company’s commitment to its environmental and policy statement of protecting and enhancing the environment, it has spent total environmental expenses of P446 million in 2016, bringing the Company’s expenditures from 1967 to date to P5.804 billion.
The Company and its subsidiaries have been consistent winners in environmental contests. Awards won for the last three years include; for the Padcal mine, First runner up in 2016 and as the Best Mining Forest champion in 2012 and 2011, and for the Silangan Project, as first runner-up in 2015, second runner-up in 2014 and 2013, first runner –up in 2011 and third runner-up in 2010-Best Mining Forest Contest (Exploration Category). Silangan Project won the Platinum Achievement Award in 2016 and the Presidential Award, the highest award from the Presidential Mineral Industry Environmental Award for Mineral Exploration category for two consecutive years in 2015 and 2014.
As a responsible mining company, PMC and its subsidiaries adhere to its corporate environmental stewardship implementing rehabilitation and restoration of areas affected by various mining and exploration operations.

17
Total Disturbed Areas Reforested and Maintained
Name of Project
Area disturbed (hectares)
Project Status
Area reforested (hectares)
Type of reforestation
Type of species planted
PMC 1,363 MPSA-276 2,800 Forest Plantation Benguet Pine, Gmelina, Alnus, Antsoan Dilao, Eucalyptus, Agoho, Narra, Teak, Coffee, Mango, Avocado, etc.
Padcal Mine Operation
Agro-forestry
PGPI - Bulawan
146 MLC-MRD510 Care &
Maintenance
821* Forest Plantation Mangium, Auri, Mahogany, Gmelina, Rain tree Coffee
Agro-forestry
PGPI - Sibutad
38 MPSA-063 178.69 Forest Plantation Mangium and Auri
Care & Maintenance
Mangrove Plantation
Bakauan ((Rhizophora Mucrunata)
38
PMC-LMC Surigao
37 MPSA-148-Exploration
5 Forest and Agro-forestry
Falcata, narra, mangium, coffee
SMMCI Surigao
24.41 MPSA-149 79 Agro-forestry Mahogany, Mangium, Falcata, Narra, Cacao, Palawan Cherry, Lanzones, Marang, Rambutan, etc.
Kalayaan, Surigao
140,750 sq.m
93,397 sq.m
Agro-forestry Falcata, coffee
* Areas on assisted natural regeneration (ANR) are included.
ENVIRONMENTAL COMPLIANCE TO DENR REGULATIONS
In compliance with Environmental Regulations, PMC and its subsidiaries have implemented environmental management measures, installed pollution control measures or devices for identified sources of air, water and toxic pollution, and have regularly reported the results of its inspection and monitoring to the Environmental Management Bureau of DENR. The following environmental policies are complied with:

18
PD 1586: Establishing an Environmental Impact Statement System including other environmental management related measures and for other purposes. No person, partnership or corporation shall undertake or operate any declared environmentally critical project or area without first securing an ECC.
RA 6969: Toxic, Hazardous and Nuclear Waste Act. Is the Act regulating the handling, treatment and disposal of generated chemical wastes and other toxic and hazardous substances.
RA 8749: Philippine Clean Air Act: Is the Act that provides for the management of point and non-point sources of pollution and quarterly monitoring and testing of pollution source device or facility.
RA 9275: Philippine Clean Water Act: Is the environmental law regulating discharges of effluent from processing and other operation of the company.
Name of Project
Registration/Permit No Permit Type Date Issued
PMC-Padcal Mine
RIC-8604-012-301C ECC for Nevada Group of mineral claims and other adjoining mineral claims
Nov. 9, 1987
CAR-0202-011-120 ECC for Alang Cut Silt Pond
Apr. 2, 2002
CAR-0108-053-208
ECC for the Access Road from the Cyclone Area to the Main Dam Embankment of Tailings Storage Facility 3
Aug. 29, 2001
CAR-0108-52-302 ECC for Quarry “H” for Tailings Storage Facility 3
Aug. 29, 2001
CAR-0108-51-302 ECC for Quarry “G” for Tailings Storage Facility 3
Aug. 29, 2001
ECC-9901-002-12 ECC for Fuel and Lubrication Station
Sep. 22, 2000
CAR-0411-107-120 ECC for the Tailings Storage Facility 3 Open Spillway
Nov. 16, 2004
CAR-0702-014-213 ECC for the Sanitary Landfill Facility-Category 1
Mar. 9, 2007
CAR-0803-033-312
ECC for the Raising of Tailings Storage Facility No. 3 Embankment Crest Elevation (610MASL to 615MASL) (amended )
5-May-10
Padcal Mine Discharge Permits
2004-DP-K-141105-050 Tailings Storage Facility No. 3
Nov. 7, 2015
2007-DP-14112-063 /CNC-CAR-1310-0011
Alang-Cut Silt Pond Apr. 25, 2015

19
2007-DP-D-14112-079 / CNC-CAR-1310-0011
Oil Water Separator at Compressed Air Plant
Jul. 06, 2015
2007-DP-D-14112-060 /CNC-CAR-1310-0008
Oil Water Separator, Banget Sludge Pond, Used Oil Impounding Area
Apr. 25, 2015
2007-DP-D-14112-061 / CNC-CAR-1310-0009
Oil Water Separator at Oil Yard of Banget Sludge Pond Area
Apr. 25, 2015
2007-DP-D-14112-058 / CNC-CAR-1310-0006
Oil Water Separator at 1015ML UG Equipment Wash Bay Area
Apr. 25, 2015
2007-DP-D-14112-059 / CNC-CAR-1310-0007
Oil Water Separator at Motor Pool Area
Apr. 25, 2015
RA6969 – Chemical Control Order (CCO)
No. 14-11-0003 DENR Registry ID Aug. 28, 1995
CCO-99-0002-M CCO Registry Jul. 26, 1999
CCO-2010-001-CAR CCO for Asbestos 28-May-10
CCO-2010-003-CAR CCO for PCB Sep. 23, 2010
RA8749-Permit to Operate
2005-POA-D-141112-077 Assay Laboratory Apr. 4, 2015
2005-POA-D-141112-097 Bumulo Fuel and Lubrication Station
Apr. 4, 2015
2005-POA-D-141112-099 Foundary/Machine Shop Apr. 4, 2015
2005-POA-G-141112-111 Banget Storage Area Used Oil Impounding System (Old Site)
Jul. 18, 2015
2005-POA-G-141112-113 Banget Storage Area Used Oil Impounding System (New Site)
Jul. 20, 2015
2005-POA-G-141112-112 Banget Power Plant Jul. 18, 2015
2014-POA-I-141112-146 Diesel Fuel Storage Tank-Main Bodega
Sep. 15, 2014
2014-POA-I-141112-147 Diesel Fuel Storage Tank-Motorpool
Sep. 15, 2014
2015-POA-I-141112-147 Diesel Engine Generator Set
Sep. 21, 2015
PMC-LMC DENR I.D No. 16-67-0092 Hazwaste Generator DENR Registry ID
Dec. 10, 2013
PMC-Kalayaan
2013-WDP-J-1367-154 Waste Water Discharge Permit
Oct. 21 2013
DENR I.D No. 16-67-0084 Hazwaste Generator DENR Registry ID
Feb. 13 2013
2013-POA-J-1367-315 Permit to Operate Air Pollution Installation Device/Facility
Oct. 21, 2013
PGPI- 06-45-0014 Hazwaste Generator 29-Jan-99

20
Bulawan DENR Registry ID
ECC # 0698-0203-034-120A Environmental Compliance Certificate
Feb. 4, 1998
DENR I.D No. 98-TPW-J-0645-161
Permit to Operate Air Pollution Installation Device/Facility
1998
PGPI-Sibutad
ECC # 9503-003-301 Environmental Compliance Certificate
Jan. 23 1997
DENR ID. # 09-72-0003 Hazwaste Generator DENR Registry ID
4-Jan-99
CCO Registry # 99-0016 Chemical Control Order Registry
19-Jan-99
RELATED PARTY TRANSACTIONS
PMC has extended loans and advances to some of its subsidiaries were presented under Part III,
Item 12 of this report.
MAJOR BUSINESS RISKS
Regulatory and Tax Environment
The local mining industry is heavily regulated under the current regime and the level of regulation
dictates the behavior of mining operations and investments into the sector.
Under the present administration, the DENR ordered the audit of all operating mines in the country. PMC’s Padcal Mine was one of the companies not recommended for suspension. In addition, the DENR also ordered the closure of 23 operating mines and issued a show cause order for the cancellation of 75 MPSAs across the country, affecting the operations of several mines. As of this writing, the MICC, which is co-chaired by the Department of Finance (DOF) and the DENR, is pursuing a technical review of the closure orders from the DENR. In addition, the government is perceived to be seeking greater control of and a higher tax take from the local industry. There is also an on-going move from the MICC, Department of Trade and Industry (DT)I-BOI, DOF, and other related government and civic group organizations to amend the Fiscal Regime and Revenue Sharing Arrangement for Large-Scale Metallic Mining operations in the Philippines. The current draft proposal aims to increase tax payments of PMC by about 80-100%, based on the proposed amendment to the tax rates, to 55% of adjusted net mining revenue or 10% of gross revenues, whichever is higher.
These policies and proposed changes in government policy towards mining have delayed major
projects in the country due to the altered risk-reward equation. To mitigate these, the Company
continues to uphold its commitment to responsible mining in all aspects and religiously ensures
compliance with all laws, rules and regulations with respect to the industry. As a complementary
measure, PMC continues to build strong working relationships with the government, directly and
indirectly, through the Chamber of Mines of the Philippines (COMP). PMC is also increasing the
transparency of its tax payments to the government to heighten public awareness. In relation to
this, the Company strongly supports the EITI (Extractive Industries Transparency Initiative)
implementation of the Philippines as an EITI Candidate Country through compliance with the
21
reportorial and documentary submissions required by the EITI as advocated/led by the COMP to
express strong support for responsible mining practices. Furthermore, the Company constantly
makes representations to the government through different public forums and continues to
effectively communicate the positive impacts of mining through various media.
Exploration and Development of Mineral Deposits
The exploration for and development of mineral properties involve significant risks, which may not
be completely eliminated even with a combination of careful evaluation, experience and
knowledge. While the discovery of an ore body may result in substantial rewards, only a few
properties explored are ultimately developed into producing mines. Major expenses may be
required to locate and establish mineral reserves, develop metallurgical processes, and construct
mining and processing facilities at a particular site.
There can be no assurance that the exploration of mining tenements, where the Company has
interests in, during the exploration stage (or of any other tenement in which the Company may
acquire an interest in the future) will result in the establishment of commercially viable mining
operations. An apparently viable mineral deposit, even when identified, is no guarantee that the
same can be exploited profitably.
If the exploration of the Company’s existing tenements prove to be unsuccessful, this may result
in a reduction of the value of those tenements, diminution in the Company’s cash reserves and
possible relinquishment of the tenements. Similarly, there can be no assurance that the
exploration of mining tenements currently under development will result in the establishment of
commercially viable mining operations.
The success of the Company depends on, among others, the delineation of the economically
mineable reserves, access to required development capital, securing and maintaining title to its
exploration and mining tenements and obtaining all consents and approvals necessary for the
conduct of its exploration activities. The Company has a competent team of legal and technical
personnel who handle and manage these matters. Mineral Agreements, Permits and Licenses, and Operating and/or Royalty agreement The Company relies on permits, licenses (including MPSAs), operating and/or royalty agreements with third-party claim owners and land access agreements to conduct its mining operations. The MPSAs and operating and/or royalty agreements covering the Company’s mineral properties expire at different times and require renewal upon expiration. Regulatory authorities can exercise considerable discretion in the terms and timing of permit issuance or whether a permit may be issued at all. Accordingly, the approvals needed for mining operations may not be issued or renewed or, if issued or renewed, may not be issued in a timely fashion, or may involve requirements that may be changed or interpreted in a manner which restricts the Company’s ability to conduct mining operations profitably. Furthermore, new laws or regulations, or changes in the enforcement or interpretation of existing laws or regulations, may require substantial increases in equipment and operating costs in order to obtain approvals required by, or to otherwise comply with the conditions imposed by, such new or revised laws and regulations. The need to obtain such new or revised approvals or to comply with additional conditions may also cause material delays or interruptions in one or more of the Company’s current or planned operations or developments or, to the extent such approvals or conditions cannot be obtained or met on an economical basis, the curtailment or termination of such operations or developments. The local governments where the Company’s mines or exploration properties are located may also impose additional restrictions on its operations. There can be no assurance that any such local government supervision or regulation will not interrupt current or planned operations. The failure to successfully resolve any such situations
22
could have an adverse effect upon the Company’s business, results of operations and financial condition. In addition, the Company’s ability to explore or develop its mining tenements may be subject to prior informed consent of indigenous people (IP) that have ancestral domain title over such tenements. The operation of such mining tenements may also require acquisition of surface rights from third parties. There is no certainty that the Company will be able to acquire all surface rights that are necessary for the exploration and development of its mining tenements on a timely basis or at all. Typically, however, the DENR would write and afford a tenement holder an opportunity to address alleged breaches of the terms of, or challenges to, its mineral agreements, permits or licenses before issuing an order to cancel or terminate such mineral agreements, permits, or licenses. As a practical matter, the Mines and Geosciences Bureau (MGB) would move to have a mineral agreement, permit or license cancelled or terminated only when there is an irremediable material breach on the part of the tenement holder. To address the foregoing risks, the Company employs a team of legal and operating personnel, who exercise the requisite due diligence with respect to the ownership of mining and surface rights, and the enforceability of the Company’s rights over its mining properties. Mining and surface rights are reviewed for ownership and location verification. Operational Risk for Mining Operations Mining operations are subject to all the hazards and risks normally encountered in exploration, development and production, including unusual and unexpected geologic formations, seismic activity, rock bursts, cave-ins, flooding and other conditions involved in the drilling and removal of material, any of which could result in damage to, or destruction of, mines and other producing facilities, damage to life or property, environmental damage, increased costs and possible legal liability. Additional costs are incurred by the Company for items such as labor, transport, costs of consumables and movement of plant and equipment. Other costs may also be incurred if the equipment necessary to the exploration and mining operations of the Company are damaged. The Philippines has experienced a number of natural catastrophes over the years, including typhoons, volcanic eruptions, landslides, and earthquakes that may materially disrupt and adversely affect the Company’s business operations. The Company cannot give any assurance that it will be able to obtain and maintain insurance coverage for the catastrophe or that such insurance coverage will be adequate to compensate the Company for all damages and economic losses resulting from natural catastrophes. The Padcal tailings storage facilities have been designed to provide safety zones in cases of cave-ins. Emergency procedures are set and properly documented in case of a tailings storage facility overtopping. The Company maintains a warning system to alert its workers in cases of landslides, major earthquakes, and potential cave-ins. The Company schedules underground blasting activities and plans drilling activities to ensure employee safety at all times. The Company ensures compliance from all of its employees and visitors with underground safety standards that include wearing the proper safety gadgets and gears and carrying appropriate equipment. It provides periodic training on underground mining safety and survival practices. The Company likewise has a highly commended team of underground rescue personnel that had assisted in the country’s actual landslides and major earthquake disaster operations. Although the Company maintains insurance to cover some of these risks and hazards in amounts it believes to be reasonable, such insurance may not provide adequate coverage in all circumstances. There is no assurance that the Company’s insurance will continue to be available at economically feasible premiums or that it will provide sufficient coverage for losses related to these or other risks and hazards. Additionally, the Company may be subject to liability or sustain

23
loss for certain risks and hazards against which it cannot insure due to unavailability of such insurance facility in the local market or which the Company may elect not to insure because of the premium cost. The costs of insurance coverages could have an adverse impact on the Company’s future cash flows, earnings, results of operations and financial condition.
Price Risks The Company’s revenue is largely dependent on the world market prices for gold and copper and the factors affecting the behavior of these are beyond the Company’s control. If the sales prices of these commodities fall and remain below the production costs for a sustained period, the Company will incur losses. If those losses continue, the Company may curtail or suspend some or all of its mining and exploration activities. This would have an adverse impact on the Company’s business, results of operations, stated reserves and financial condition.
To mitigate these price risks, the Company constantly evaluates the advantages and
disadvantages of hedging a portion of its annual production. In addition, production and
operating costs are constantly being monitored to attain efficient use of working capital.
Environmental and Natural Events Risks
Being in a natural resource operation, the Company is inherently subject to potential
environmental concerns. The Company is also subject to Philippine laws and regulations
governing the environmental impact of its operations.
To manage the risk, the Company puts a great amount of effort and invests a substantial amount
of resources into environmental protection and rehabilitation. As a manifestation of its
commitment to responsible and sustainable mineral resource development, the Company has
adopted an environmental policy statement which is consistent with ISO 14001 Certification on
Environmental Management Systems. The Company is also covered by a pollution liability
insurance to respond to possible claims against it in case of environmental pollution which may
be caused by its Padcal mining operation.
While the Company believes it is substantially in compliance with all material environmental
regulations, it cannot give assurance that changes in these regulations will not be effected or
disastrous environmental incidents will not happen, which may adversely impact its operation
and/or impose added costs to the Company, such was the case during the 2012 incident.
In addition, natural disasters, such as earthquakes, floods and landslides, could also severely
hamper operations of the Company. Such natural disasters could, among other things, damage
he Company’s facilities and surrounding infrastructure, block the access to its mining assets,
injure its personnel and result in a suspension of its operations for an undeterminable period of
time, all of which could materially and adversely affect its business, financial condition, results of
operations and prospects.
Social License to Operate
The pressure on social license to operate remains a major risk for the Company. The presence of
protesters and social media with broad-ranging agendas, becoming more active, vocal, and
organized, may pose a risk to the timely completion of the Company’s exploration activities. The
regulators have given greater powers to local communities to make final decision on approving
mining and exploration activities in their areas. As a result, negotiations with surface owners and
local residents takes time, further hindering the production and exploration timetable. The
indecisive stance of some government bureaus to approve and issue much-needed permits and
licenses may also cause delays in the Company’s exploration projects and improvement of major
facilities.

24
To mitigate these risks, the Company provides full cooperation with the regulators to comply with
governmental requirements in ensuring safety and environment protection in all aspects of
operations. It continues to actively participate in LGUs Community Development Programs on
education and alternative learning system, construction of community infrastructures, and
livelihood projects; and continues to effectively communicate the positive impacts of mining.
Item 2. Properties
The Company’s mineral properties are discussed in the sections for Mining Properties / Royalty
Agreements, and Exploration and Development.
The Company owns real properties and support facilities in its Padcal mine site, a concentrate
loading facility at Poro Point, San Fernando, La Union, which are used in operations, and various
titled lands located at Barangay Tuding, Itogon, Benguet with a total area of 129 hectares. PGPI
similarly owns real properties and support facilities in its Bulawan and Sibutad Projects, which are
currently on care and maintenance. Certain mining assets of PGPI were covered by a Collateral
Trust Indenture to secure its loans from the Parent Company.
The real property in Pasig City, where the Company’s Corporate Head Office was located, was
the subject of a Deed of Absolute Sale and was sold to a third-party in July 2014. In September
2016, the Company transferred to its new office space located at the 2nd
floor, LaunchPad,
Reliance Street corner Sheridan Street, Mandaluyong City. The office space is the subject of a
Memorandum of Agreement (“MOA”) with a third party entered into in 2015. Under the terms of
the MOA, the parties shall enter into a separate contract to sell upon the occurrence of certain
conditions. SMMCI has been acquiring real properties or entering into land lease agreements for the Silangan Project. The lease agreements are typically for 25 years cancellable at the option of SMMCI.
The Company does not lease any significant real property nor has the intention at present to acquire any significant real property other than necessary for corporate purposes in the next 12 months. Machinery and equipment are routinely acquired month to month as needed by operation usually through direct purchase or through letters of credit, if imported, under supplier’s or bank’s credit terms.
Item 3. Legal Proceedings
A table that identifies material legal proceedings as of December 31, 2016 involving the Company, including its subsidiaries, is set out below:
CASE TITLE / SUBJECT MATTER
VENUE
NATURE
AMOUNT
INVOLVED
STATUS
PMC
1
Butan Mining Exploration Company v. Philex Mining Corporation
Mines Adjudication Bureau
For rental fees for the 745 ML tunnel traversing Butan claims
Above P 300 million
Pending the MAB’s resolution
2
Philex Mining Corporation v. The Province of Benguet & Provincial
La Trinidad, Benguet Regional Trial Court
Local quarry tax on TP3
P 12.2 million Pending decision

25
Treasurer
3
Philex Mining Corporation v. Roel Santos et al.
Supreme Court
Proper computation of award due illegally dismissed employees
P 26.449 Million Pending Resolution of PMC’s Motion for Reconsideration
4
Heirs of Jose Marino v. Philex Mining Corporation
National Commission on Indigenous Peoples – Cordillera Administrative Region (NCIP-CAR)
Claim for enforcement of alleged ancestral rights, damages with prayer for injunction
N/A Proceedings suspended
5
Cecilia Agbanlog et al. v. Philex Mining Corporation
Court of Appeals
Declaration that complainants as school teachers are regular employees of Philex
N/A Pending resolution
6
IIPO v. IPO-APSSOL and Philex Mining Corporation
NCIP – CAR
Dispute between two (2) Indigenous Peoples’ Groups; Philex is a nominal party
N/A Pending resolution
7
Heirs of Sinak-ey v. IPO-APPSOL and Philex Mining Corporation
NCIP En Banc
Validity of NCIP-approved MOA entered into between IPO-APSSOL and Philex
N/A Pending resolution
8
Heirs of Nicolas v. Philex Mining Corporation and Heirs of Nevada
Court of Appeals
Damages and royalty claims
N/A Entry of Judgment in favor of Philex and Heirs of Nevada issued
9 Heirs of Aritao v. Philex Mining Corporation
NCIP – CAR Damages
P 60 / per square meter (P600,000 up); injunction against the construction of the spillway.
Still pending
10
Sales Alipio, et al. v. Philex Mining Corporation, et al.,
NCIP En Banc Injunction against construction of access roads
N/A Appeal pending resolution
11
Basilio, et al. v. Philex Mining Corporation, et al.
NCIP – CAR Damages P 36 million
Archived by NCIP pending the resolution by the Supreme Court of the two motions for reconsideration
12 Various civil and labor cases
various
Various civil and labor cases in the ordinary course of business
N/A
Pending. PMC is a party to a number of cases in the ordinary course of business involving small amounts of claims which are disputed by PMC on various grounds

26
13 ABAKATAF, et al., vs. DENR, et al.
Court of Appeals (Cagayan de Oro)
Action for injunction with urgent ex-parte application for temporary environmental protection order (TEPO) and/or environmental protection order under A.M. No. 09-6-8 SC
N/A Submitted for decision
The Parent Company may be subject of lawsuits and claims arising out of the ordinary course of its business, which are either pending decision by the courts or are being contested, and the outcomes of which are not presently determinable. The Company expects that the resolution and/or decision of such lawsuits and claims would have no material effect to the Company.
Item 4. Submission of Matters to a Vote of the Security Holders
There were no matters covered under this item submitted in the fourth quarter of 2016 to the security holders for a vote.
PART II
OPERATIONAL AND FINANCIAL INFORMATION
Item 5. Market for Registrant’s Common Equity and Related Stockholder Matters
Market Information
The registrant’s common equity, which was initially classified into Class A and Class B common stock until it was declassified into a single class in 2006, is traded in the Philippine Stock Exchange under the code name PX.
The Company’s public float as of December 31, 2016 is 33.37%
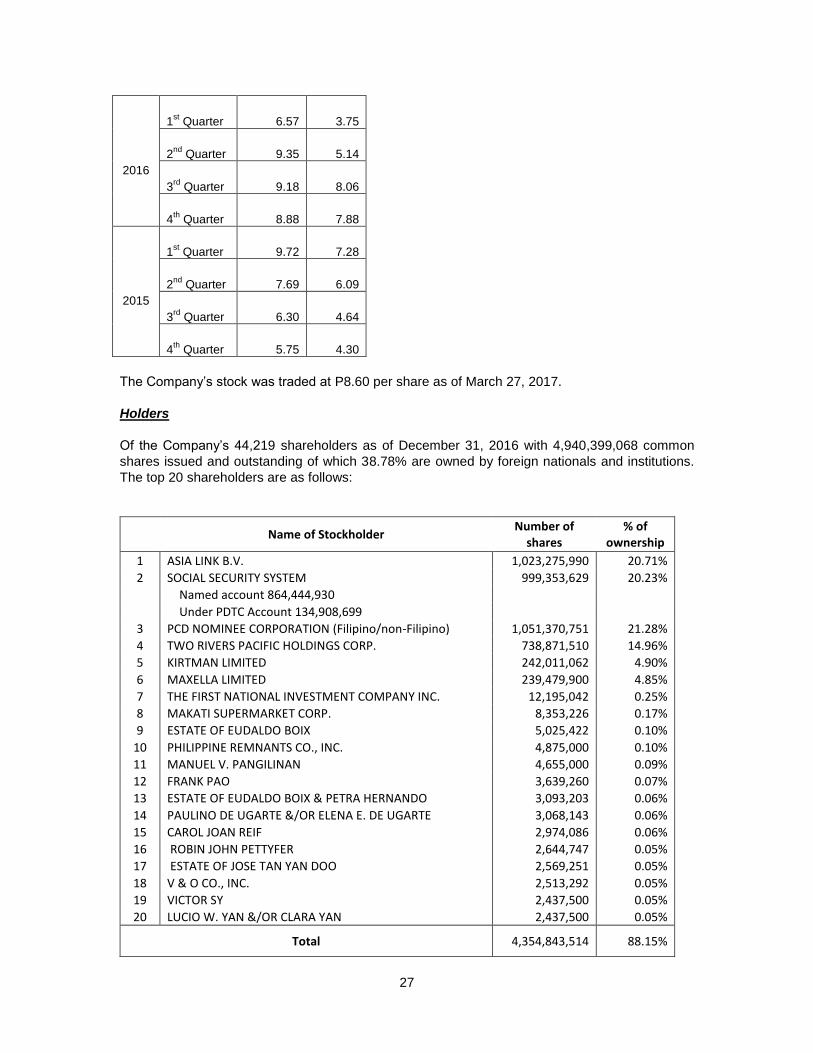
The average quarterly stock prices for the Company’s common shares within the last two years
and for the first two months of 2017 were as follows:
Year Period High Low
2017
February 10.50 8.70
January 9.55 8.51
27
2016
1st Quarter 6.57 3.75
2nd
Quarter 9.35 5.14
3rd
Quarter 9.18 8.06
4th
Quarter 8.88 7.88
2015
1st Quarter 9.72 7.28
2nd
Quarter 7.69 6.09
3rd
Quarter 6.30 4.64
4th
Quarter 5.75 4.30
The Company’s stock was traded at P8.60 per share as of March 27, 2017.
Holders
Of the Company’s 44,219 shareholders as of December 31, 2016 with 4,940,399,068 common
shares issued and outstanding of which 38.78% are owned by foreign nationals and institutions.
The top 20 shareholders are as follows:
Name of Stockholder
Number of shares
% of ownership
1 ASIA LINK B.V. 1,023,275,990 20.71%
2 SOCIAL SECURITY SYSTEM 999,353,629 20.23%
Named account 864,444,930
Under PDTC Account 134,908,699
3 PCD NOMINEE CORPORATION (Filipino/non-Filipino) 1,051,370,751 21.28%
4 TWO RIVERS PACIFIC HOLDINGS CORP. 738,871,510 14.96%
5 KIRTMAN LIMITED 242,011,062 4.90%
6 MAXELLA LIMITED 239,479,900 4.85%
7 THE FIRST NATIONAL INVESTMENT COMPANY INC. 12,195,042 0.25%
8 MAKATI SUPERMARKET CORP. 8,353,226 0.17%
9 ESTATE OF EUDALDO BOIX 5,025,422 0.10%
10 PHILIPPINE REMNANTS CO., INC. 4,875,000 0.10%
11 MANUEL V. PANGILINAN 4,655,000 0.09%
12 FRANK PAO 3,639,260 0.07%
13 ESTATE OF EUDALDO BOIX & PETRA HERNANDO 3,093,203 0.06%
14 PAULINO DE UGARTE &/OR ELENA E. DE UGARTE 3,068,143 0.06%
15 CAROL JOAN REIF 2,974,086 0.06%
16 ROBIN JOHN PETTYFER 2,644,747 0.05%
17 ESTATE OF JOSE TAN YAN DOO 2,569,251 0.05%
18 V & O CO., INC. 2,513,292 0.05%
19 VICTOR SY 2,437,500 0.05%
20 LUCIO W. YAN &/OR CLARA YAN 2,437,500 0.05%
Total 4,354,843,514 88.15%

28
Dividends
Beginning 2010, the Company’s Board of Directors has adopted a policy to declare cash dividend of up to 25% of the Company’s core net income should the circumstances allow for its declaration.
In 2016, 2015 and 2014, the following dividends were declared:
1. On July 27, 2016, a regular cash dividend of P0.03 per share based on the first semester
of 2016 core net income; for record date of August 10, 2016; paid on August 24, 2016.
2. On February 29, 2016, a property dividend of 17 PXP shares for every 100 Philex Mining shares held; for record date of March 15, 2016; paid on July 15, 2016.
3. On February 25, 2015, a regular cash dividend of P0.02 per share based on the fourth quarter 2014 core net income; for record date of March 11, 2015; paid on March 25, 2015.
4. On October 29, 2014, a regular cash dividend of P0.03 per share based on the nine months 2014 core net income; for record date of November 12, 2014; paid on November 28, 2014.
5. On February 26, 2014, a regular cash dividend of P0.05 per share based on the full-year 2013 core net income; for record date of March 12, 2014; paid on March 26, 2014.
Recent Sale of Unregistered or Exempt Securities
No securities were sold by the Company within the past three years which were not registered
under the Code.
On June 23, 2006, the Company’s stockholders approved and adopted a Stock Option Plan
(2007 SOP) which provides for the granting of options to the Company’s directors, officers,
managers and key consultants to purchase common shares of the Company at specified exercise
price. The aggregate number of shares initially approved for grant was 88,733,707 shares or 3%
of then total outstanding shares of the Company. On March 8, 2007, the SEC resolved that the
issuance of the 88,733,707 shares under the plan is exempt from the registration requirements
under Section 10.2 of the Code.
As adjustment to the shares reserved for stock option due to the effect of the declaration of stock
dividend of 30% in 2007 and 25% in 2009, additional 22,882,037 shares and 17,180,737 shares
were respectively made available for grant which were similarly granted exemption from
registration by the SEC. The exercise prices for the outstanding option shares were
correspondingly adjusted to avoid a dilution of their option value.
No additional option shares were granted from the 2007 SOP following the expiration of the 5-
year term of the Plan in 2012. However, unexercised options remain outstanding over their five-
year term subject to provisions of the Plan. With the expiration of the 5-year term of the January
5, 2011 grant which was the last grant under the Plan, the 2007 SOP and all outstanding options
granted under the plan expired on January 5, 2016. The total option shares granted under the
2007 SOP up to its expiry amounted to 150,728,832, of which 118,713,332 option shares have
been exercised and 32,015,500 option shares were forfeited.

29
On June 29, 2011, the Company’s stockholders approved a new stock option plan covering up to
246,334,118 shares equivalent to 5% of the Company’s outstanding shares of 4,926,682,368 as
of June 29, 2011. This plan was approved by the SEC on February 22, 2013, which approval
was received by the Company on March 5, 2013.
As of December 31, 2016, the total option shares granted under the 2011 SOP totaled to
46,660,000 (with 25,570,000 option shares forfeited), of which 21,090,000 options shares are
outstanding (with 20,215,000 option shares vested) but none have been exercised.
Item 6. Management Discussion and Analysis of Financial Position and Results of
Operations For the years ended December 31, 2016, 2015 and 2014 Information on the Company’s results of operations and financial condition presented in the 2016 Audited Consolidated Financial Statements and accompanying Notes to the Consolidated Financial Statements are incorporated herein by reference. REVIEW OF FINANCIAL RESULTS On June 23, 2016, the Philippine Securities and Exchange Commission (SEC) approved the Company’s property dividend declaration, for the distribution to Company shareholders of 17 PXP Energy Corporation (PXP) shares for every 100 Philex Mining shares held at record date. Following the distribution of the property dividend on July 15, 2016, which reduced the Company’s interest in PXP from 64.7% to 19.8%, the Company deconsolidated PXP and presented it as investment in an associate. Revenues
Total operating revenues for the year 2016 amounted to P10.272 billion, or 12% higher than P9.189 billion in 2015 (13% lower versus P10.587 billion in 2014). The Company operated for a full year in 2016, 2015 and 2014, following the temporary and subsequent permanent lifting of the suspension order at the Padcal mine in March 2013 and August 2014, respectively. Gold production was down by 4% to 103,304 ounces in 2016 from 107,887 ounces in 2015 due to lower ore grade as a result mainly of declining ore grades at 908 ML and 840 ML, as these ore
2016 2015 2014
2016 vs
2015
2015 vs
2014
Gold
Revenue (P millions) P6,209 P5,670 P5,889 10 (4)
Ounces produced 103,304 107,887 105,008 (4) 3
Average realized price $1,254 $1,147 $1,270 9 (10)
Copper
Revenue (P millions) P3,976 P3,450 P4,615 15 (25)
Pounds produced 34,961,062 34,104,049 35,391,154 3 (4)
Average realized price $2.35 $2.29 $2.98 3 (23)
Other revenues (P millions) P86 P70 P82 24 (15)
Total Revenues (P millions) P10,272 P9,189 P10,587 12 (13)
For the Year Ended December 31 % Change

30
sources get depleted and 105,008 ounces in 2014. Despite lower gold production, gold revenues – comprising 60% of the total in 2016 – increased to P6.209 billion from P5.670 billion in 2015, mainly from favorable gold prices, and P5.889 billion in 2014. Copper production was higher by 3% to 34,961,063 pounds in 2016 from 34,104,049 pounds in 2015 due to higher tonnage and better ore grades, but lower than the production in 2014 of 35,391,154 pounds. As a result of higher copper production, coupled with favorable copper prices, copper revenues were up to P3.976 billion in 2016 – accounting for 39% of the total in 2016 – from P3.450 billion in 2015 but lower than P4.615 billion in 2014. Realized gold prices for the years ended December 31, 2016, 2015 and 2014 were $1,254 per ounce, $1,147 per ounce and $1,270 per ounce, respectively. The recovery in realized gold price in 2016 was due to uncertainties in the global economy, particularly Britain’s exit from the European Union, lower than expected interest rate hike in the US, and continued demand for gold from China, ending the decline in world metal prices that started the latter part of 2012. Similarly, realized copper prices in 2016 recovered at an average of $2.35 per pound from $2.29 per pound in 2015 as a result of supply-side constraints from the closure of major copper-producing mines. The decline of copper prices in 2015 from $2.98 per pound in 2014 was due to the decline in world metal prices starting the latter part of 2012. Other revenues, which came from sales of silver, made up the remaining 1% of the Company’s total revenue in 2016. Revenue from silver in 2016 was higher at P86.5 million, compared with P69.7 million in 2015 and P82.5 million in 2014. This was mainly due to higher silver prices in 2016. In the past three years, to protect part of its revenues from unfavorable metal price fluctuations, the Company entered into metal hedging contracts in the form of forwards, purchased put options and sold call options. The gains or losses from these transactions were reflected in revenue as addition or deduction in deriving the realized metal prices for the Company’s metal production during the respective reporting periods. In February 2016, the Company entered into gold collar hedging contracts covering 3,000 ounces of monthly gold production from February to July 2016 at a strike price of US$1,170 per ounce for the put options and US$1,242 per ounce for the call options. Further in June 2016, the Company entered into gold collar hedging contracts covering 3,000 ounces of monthly production from July to December 2016 at a strike price of US$1,300 per ounce for the put options and US$1,350 per ounce for the call options. Net realized gain recognized for the year 2016 amounted to P14.7 million. As of December 31, 2016, there are no outstanding gold hedging contracts thus no unrealized mark-to-market (MTM) gain or loss recognized. In 2015, the net realized gain recognized amounted to P29.1 million on hedging contracts entered into by the Company in December 2014 that matured in the first quarter 2015 and contracts entered into in May 2015 covering May to September 2015 production. These gold collar hedging contracts covered 3,000 ounces of monthly gold production at an average strike price of US$1,200 per ounce for the put options and US$1,210 per ounce for the call options for the December 2014 contract, and at an average strike price of US$1,200 per ounce for the put options and US$1,230 per ounce for the call options for the May 2015 contract. These contracts were designated as cash flow hedges and matured as of December 31, 2015 thus no hedging contracts were outstanding as at end 2015.
In June and September 2014, the Company entered into gold collar hedging contracts covering 6,000 ounces of monthly production for the third quarter of 2014 at an average strike price of US$1,262.50 per ounce for the put options and US$1,325.50 per ounce for the call options, and 3,000 ounces of monthly production for the fourth quarter of 2014 at a strike price of US$1,200 per ounce for the put options and US$1,270 per ounce for the call options, respectively, with a

31
total of 27,000 ounces. The terms of these contracts already matured as of December 31, 2014 with net realized gain of P10.1 billion. Operational Overview
Gold production was down to 103,304 ounces in 2016 from 107,887 ounces in 2015 and 105,008 ounces in 2014. The 4% decrease in gold production in 2016 was mainly due to the lower ore grade by 5%, despite higher tonnage of 9.359 million from 9.199 million in 2015. Ore grades are expected to decline as mining operations move towards the fringes of the ore body as it approaches the end of mine life. Copper production, on the other hand, increased by 3% to 34,961,062 pounds in 2016 from 34,104,049 pounds in 2015 (4% lower versus 35,391,154 ounces in 2014). The higher tonnage, coupled with slightly higher average copper head grade, resulted in higher copper production in 2016 against 2015. In 2015, lower tonnage and copper head grade resulted in lower copper production versus 2014, despite higher metal recovery. Similar to gold, lower copper grades are expected and within program under the mine’s development plan. Total tonnes milled from the Company’s Padcal mine for the year ended December 31, 2016 was 2% higher than 2015 (3% lower than 2014) mainly from more operating days in 2016 and higher equipment availability during the latter part of 2016.
Operating Costs and Expenses
Total operating costs and expenses (including General and Administrative Expenses or GAE) amounted to P6.900 billion in 2016, lower by 2% than the P7.011 billion in 2015 (12% lower versus P7.989 billion in 2014) due mainly to the Company’s continuing cost management and expense reduction programs. Cash production costs amounted to P4.614 billion in 2016, almost the same as that in 2015 of P4.615 billion, but 10% lower than the cost of P5.143 billion in 2014.
2016 2015 2014
2016 vs
2015
2015 vs
2014
Tonnes milled 9,359,161 9,198,540 9,506,195 2 (3)
Copper concentrates 73,107 69,987 70,062 4 (0)
No. of Operating Days 362 357 359 1 (0)
Gold
Ounces 103,304 107,887 105,008 (4) 3
Head grade - grams/tonne 0.417 0.438 0.438 (5) -
Recovery - % 82 83 78 (1) 6
Copper
Pounds 34,961,062 34,104,049 35,391,154 3 (4)
Head grade - % 0.206 0.205 0.212 0.5 (3)
Recovery - % 82 82 80 0.1 3
For the Year Ended December 31 % Change

32
Depreciation, depletion and amortization was also down by 6% at P1.460 billion against P1.546 billion in 2015 (from P1.666 billion in 2014 or 7% lower) following the extension of Padcal mine life by two more years from 2020 to 2022. GAE substantially decreased by 10% to P373.1 million from P414.3 million in 2015 (lower than P674.4 million in 2014) as a result of the manpower rightsizing program implemented in early 2015 and late 2014, and the continued expense management being effected across the organization throughout 2016. Excise tax and royalties in 2016 was higher by 4% than 2015 (14% lower versus 2014 due to higher Social Development and Management Program (SDMP) amount that was deducted from royalties to Indigenous People) as an offshoot of higher net revenue.
Costs Per Tonne / Per Ounce / Per Pound
Production cost per tonne in 2016 of P649 was below 2015’s P670 per tonne (versus 2014’s P716 per tonne). The decrease in production cost per tonne in 2016 against 2015 and 2014 was caused primarily by the lower power rate in 2016 and the reduction in manpower at the Padcal Mine since December 2014. Operating cost (including smelting charges) per tonne similarly went down to P793 per tonne in 2016 from P808 per tonne in 2015 (lower than 2014’s P859 per tonne). The drop in operating cost per tonne was realized from lower power rate as well as further manpower reduction, other productivity-enhancing measures and the extension in Padcal mine life from 2020 to 2022, thereby extending the depreciation and amortization of Company assets. Smelting charges slightly increased in 2016 with higher production of copper concentrates and pounds of copper, in spite of lower average treatment and refining charges (TC/RC) following the decrease in rates for the period, from April 2015 to March 2017, by US$9.65 per DMT of copper concentrate and 0.965 cents per pound copper, respectively, which normally follow the trend of TC/RC rates based on the Japanese Benchmark. Total smelting charges amounted to P893.3 million in 2016, higher by 7% than P836.6 million in 2015 (2% lower versus P849.8 in 2014). Operating cost (using a co-production method) per ounce of gold and per pound of copper were $919 per ounce and $1.72 per pound in 2016, both lower than the 2015 and
Padcal Mine 2016 2015 2014
2016 vs
2015
2015 vs
2014
Padcal Cash Production cost 4,614 4,615 5,143 (0) (10)
Depreciation, Depletion & Amortization 1,460 1,546 1,666 (6) (7)
Total Production Cost 6,075 6,160 6,808 (1) (10)
Excise tax & Royalties 452 437 507 4 (14)
Smelting Charges 893 837 850 7 (2)
Total Operating cost (P million) 7,421 7,434 8,165 (0) (9)
Production cost per tonne P 649 P 670 P 716 (3) (6)
Operating cost per tonne P 793 P 808 P 859 (2) (6)
Operating cost per ounce of Gold $ 919 $ 933 $ 977 (2) (5)
Operating cost per pound of Copper $ 1.72 $ 1.86 $ 2.29 (7) (19)
For the Year Ended December 31 % Change

33
2014 levels due to the significant decrease in power rates and labor costs following the manpower rationalization program of the Company in 2014 and early 2015.
Net Other Income (Charges)
Net Other Charges in 2016 amounted to P202.1 million from P55.1 million in 2015 and net other income of P40.1 million in 2014, with gains on sale of AFS financial assets and sale of property, plant and equipment included in 2015 and 2014. The Company recognized net foreign exchange losses in 2016 of P145.2 million against P158.7 million in 2015 mainly from the restatement of the Company’s net foreign currency-related liabilities due to the depreciation of the Philippine peso against the US dollar. In 2014, the Company recognized a foreign exchange loss of P56.5 million, with foreign exchange rates at yearend closing at P49.72 in 2016, P47.06 in 2015, and P44.72 in 2014. In 2016, the Company recognized its share in the net losses of Lepanto Consolidated Mining Corporation (Lepanto) and PXP amounting to P44.6 million, higher than P13.2 million in 2015 when the Company started the recognition of losses of Lepanto following the reclassification of the investment in Lepanto from AFS financial asset to investment in an associate in 2015, and reclassification of PXP from a subsidiary to an associate in July 2016.. The Company realized interest income of P2.1 million, P4.1 million and P5.2 million in 2016, 2015 and 2014, respectively, mostly coming from short-term money market placements. Interest rates ranged from 1.0% to 2.0% for the past three years. In 2015, the Company recognized a gain of P107.1 million from the sale of its investment in Indophil Resources NL (Indophil) under an acquisition scheme offered by Indophil’s major shareholder, Alsons Prime Investments Corporation, to Indophil’s other shareholders, where AUD0.30 was offered for every share held. The Company’s investments in Indophil totaled 29,240,806 shares with a carrying cost of P190.4 million prior to the sale. The proceeds of P297.5 million from the sale were received in February 2015. On interest expense, the Company incurred P349.4 million in 2014 mainly from the short-term loans with local banks and FPC subsidiaries, slightly lower than previous year due to the retirement of some local bank loans and repayment of the loans with FPC subsidiaries in December 2014. Interest expenses on the convertible notes issued by Silangan Mindanao Exploration Co., Inc. (SMECI) in December 2014 were capitalized, thus no expense shown in 2016 and 2015. Interest expenses of P87.3 million in 2016 and P108.8 million in 2015 to local banks related to the Silangan investment were likewise capitalized. In 2014, the Company’s Pasig property was the subject of a Deed of Absolute sale with a third-party for a total consideration of P777.4 million, with a corresponding gain of P764.7 million.
(P millions) 2016 2015 2014
Forex exchange losses-net (145) (159) (56)
Share in net losses of associates (45) (13) -
Interest income 2 4 5
Gain on disposal of AFS financial assets - 107 -
Interest expense - - (349)
Gain on sale of property, plant and equipment - - 765
Others (14) 6 (324)
(202) (55) 40
For the Year Ended December 31

34
Others-Net of P323.8 million in 2014 included P394.2 million in separation pay that was incurred by the Company, on top of the retirement gratuity under the Philex Trust Fund, in relation to the manpower rightsizing program implemented in 2014. Provisions for Impairment Losses The Company continues to assess the viability of its existing mine exploration projects and other investments. In 2016, provisions for impairment losses were recognized amounting to P2.505 billion from nil in 2015 and P231.4 million in 2014. Income (Loss) on Deconsolidated Subsidiary Group Result from deconsolidation of PXP was shown as a separate line item under 'Income (Loss) on Deconsolidated Subsidiary Group’ as required by PFRS 5 following SEC’s approval of declaration of PXP shares as property dividend. In 2016, Income on Deconsolidated Subsidiary Group amounted to P2.494 billion, consisting of the non-recurring gain from the loss of control over PXP of P2.523 billion and share of the operating loss of PXP of P29.1 million up to June 2016, while comparative amount in 2015 and 2014 posted a share of operating loss of P144.0 million and P510.9 million, respectively. Starting third quarter of 2016, the Company’s share in the earnings or losses of PXP is recognized under Share in net losses of associates. .
Core and Reported Net Income Net income attributable to the equity holders of the Company in 2016 amounted to P1.589 billion, compared with P896.2 million in 2015 and P1.006 billion in 2014. The 2016 net income was largely affected by higher metal prices and foreign exchange rate, while unfavorable metal prices in the prior year caused lower net income in 2015 versus 2014. The Company’s results of operations ended in a consolidated net income of P1.567 million for the year 2016, more than two times of the P775.6 million in 2015 and P702.8 million in 2014, due to favorable metal prices and foreign exchange rate and lower operating costs from the strict implementation of cost reduction programs. The Company’s core net income was P1.657 billion in 2016, 83% higher than the P905.2 million in 2015 (versus P1.122 billion in 2014) due primarily to higher metal prices. Inversely in 2015, the core net income was lower compared with 2014 due to lower metal prices. In 2016, EBITDA amounted to P3.854 billion, compared with P2.779 billion in 2015 and P3.394 billion in 2014. The Company’s EBITDA, similar to core net income, excludes non-recurring transactions to clearly provide results based on normal operating parameters of the business. The core net income reflects the Company’s overall operating performance without the net effect of non-recurring transactions.

35
Reconciliation of Core Net Income to Consolidated Net Income
FINANCIAL CONDITION REVIEW
(P millions) 2016 2015 2014
Core net income 1,657 905 1,122
Non-recurring gains (losses):
Foreign exchange losses (145) (144) (57)
Gain on sale of assets / AFS financial assets 107 765
Net Provision for write-down of asset (2) (336)
Share in net loss of an associate (13) -
Provisions for impairment of assets (2,505)
Gain from loss of control over a subsidiary group 2,538
Reorganization costs - (394)
Net tax effect of aforementioned adjustments 44 43 (94)
Net income attributable to equity holders of the Parent Company 1,589 896 1,006
Net income attributable to NCI (22) (121) (303)
Consolidated net income 1,567 776 703
For the Year Ended December 31
(P millions, except ratios) 2016 2015 2014
Cash and Cash equivalents 458 1,009 5,232
Current assets excluding cash and cash equivalents 6,437 4,263 4,299
Non-current assets 31,767 38,256 35,066
Total Assets 38,662 43,527 44,597
Short-term loans 3,083 3,318 4,308
Current liabilities excluding short-term loans 2,495 2,397 3,215
Non-current liabilities 9,685 10,528 10,032
Equity attributable to Equity Holders of the Parent Company 23,400 24,563 23,599
Non-Controlling interests (0.3) 2,721 3,442
Total Equity 23,399 27,284 27,042
Current/Liquidity ratios
Current ratio 1.24 0.92 1.27
Quick ratio 0.17 0.33 0.84
Solvency ratios and debt to equity ratios
Debt-to-equity ratio 0.65 0.60 0.65
Solvency ratio 0.20 0.14 0.13
Financial leverage ratios
Asset-to equity ratio 1.65 1.60 1.65
Interest rate coverage ratio - - 3.97
Profitability ratios
Return on assets 3.81% 1.76% 1.66%
Return on equity 6.18% 2.86% 2.65%
Net profit margin 16.71% 9.29% 7.22%
As of December 31

36
Current Assets As of December 31, 2016, Current Assets of the Company stood at P6.895 billion, 31% higher than P5.271 billion in 2015 (45% lower versus P9.530 billion in 2014), primarily due to higher amount of inventories (P2.319 billion in 2016 compared with P1.887 billion in 2015 and P1.858 billion in 2014) and the presentation in 2016 of the Advances to a related party amounting to P2.194 billion following the deconsolidation of PXP. Cash and Cash Equivalents In 2016, Cash and Cash Equivalent amounted to P457.9 million, down from P1.009 billion in 2015 and P5.232 billion in 2014. These amounts included the cash balance of Silangan Mindanao Exploration Co., Inc. of P25.5 million, P279.5 million in 2015 and P3.038 billion in 2014, which significantly decreased due to extensive exploration activities at the Silangan Project. The 2015 and 2014 cash balances included that of PXP’s subsidiaries, until PXP was deconsolidated in mid-2016. Current Assets excluding Cash and Cash Equivalents Current Assets, excluding Cash and Cash Equivalents, was up to P6.437 billion mainly due to higher Inventories and Advances to a related party.
Accounts Receivable Accounts Receivables consisted essentially of Trade Receivables from sales of the Company’s copper concentrates or bullion and Other Receivables. As at year-end 2016, Accounts Receivable amounted to P486.5 million (against P897.5 million in 2015 and P1.056 billion in 2014), with Trade Receivables amounting to P411.8 million (P701.3 million in 2015 and P893.9 million in 2014) and Other Receivables amounting to P74.7 million (P196.2 million in 2015 and P161.9 million in 2014). As of December 31, 2016, outstanding receivables from copper concentrates mainly consisted of the remaining 10% of five shipments in the last quarter of 2016 that remained outstanding awaiting final pricing, while the 2015 receivables consisted of 100% of the value of shipment no. 38-LDM which was shipped to Japan on December 24, 2015 and the remaining 10% of four other shipments. In 2014, receivables consisted of 100% of the value of shipment no. S-708, of which 90% was collected only in early January 2015, and 10% of various 2014 shipments. A total of fourteen copper concentrates shipments were made in 2016 and in 2015 compared with fifteen shipments in 2014. The Padcal mine’s copper concentrates shipments were provisionally valued based on prices in the second calendar week and first calendar week immediately prior to the week of shipment to Pan Pacific Corporation (PPC) and Louis Dreyfus Commodities Metals Suisse SA (LDM), respectively. These were then adjusted to the applicable final prices based on their “quotational period (QP)”, which under PPC for the contract years 2016 and 2015 were the calendar months following the month of the shipment’s arrival in Japan for gold and silver, and the third calendar month following the month of arrival for copper, while shipments under LDM have QP terms of “month of scheduled shipment (MOSS)”. Inventories Inventories, higher at P2.319 billion in 2016 compared with P1.887 billion in 2015 (slightly lower than P1.858 billion in 2014), comprised mostly of materials and supplies at 54% of total value, with the 46% remainder from mine products inventories. Materials and
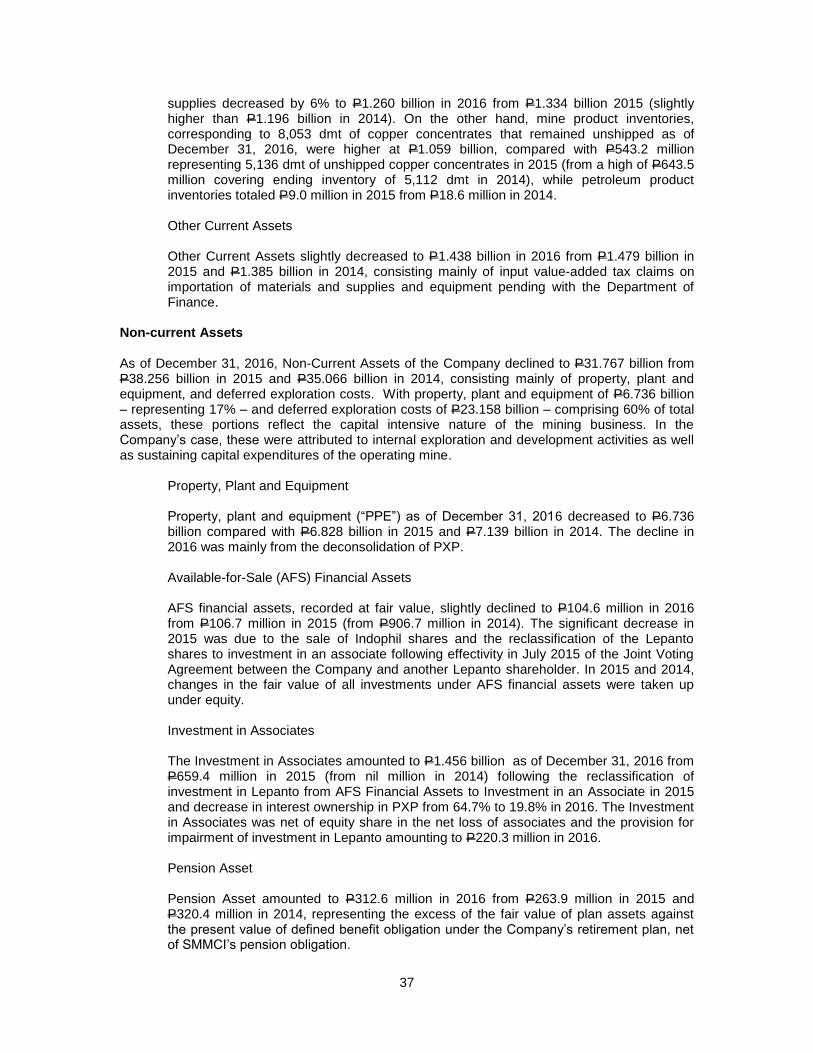
37
supplies decreased by 6% to P1.260 billion in 2016 from P1.334 billion 2015 (slightly higher than P1.196 billion in 2014). On the other hand, mine product inventories, corresponding to 8,053 dmt of copper concentrates that remained unshipped as of December 31, 2016, were higher at P1.059 billion, compared with P543.2 million representing 5,136 dmt of unshipped copper concentrates in 2015 (from a high of P643.5 million covering ending inventory of 5,112 dmt in 2014), while petroleum product inventories totaled P9.0 million in 2015 from P18.6 million in 2014. Other Current Assets Other Current Assets slightly decreased to P1.438 billion in 2016 from P1.479 billion in 2015 and P1.385 billion in 2014, consisting mainly of input value-added tax claims on importation of materials and supplies and equipment pending with the Department of Finance.
Non-current Assets As of December 31, 2016, Non-Current Assets of the Company declined to P31.767 billion from P38.256 billion in 2015 and P35.066 billion in 2014, consisting mainly of property, plant and equipment, and deferred exploration costs. With property, plant and equipment of P6.736 billion – representing 17% – and deferred exploration costs of P23.158 billion – comprising 60% of total assets, these portions reflect the capital intensive nature of the mining business. In the Company’s case, these were attributed to internal exploration and development activities as well as sustaining capital expenditures of the operating mine.
Property, Plant and Equipment Property, plant and equipment (“PPE”) as of December 31, 2016 decreased to P6.736 billion compared with P6.828 billion in 2015 and P7.139 billion in 2014. The decline in 2016 was mainly from the deconsolidation of PXP. Available-for-Sale (AFS) Financial Assets AFS financial assets, recorded at fair value, slightly declined to P104.6 million in 2016 from P106.7 million in 2015 (from P906.7 million in 2014). The significant decrease in 2015 was due to the sale of Indophil shares and the reclassification of the Lepanto shares to investment in an associate following effectivity in July 2015 of the Joint Voting Agreement between the Company and another Lepanto shareholder. In 2015 and 2014, changes in the fair value of all investments under AFS financial assets were taken up under equity. Investment in Associates The Investment in Associates amounted to P1.456 billion as of December 31, 2016 from P659.4 million in 2015 (from nil million in 2014) following the reclassification of investment in Lepanto from AFS Financial Assets to Investment in an Associate in 2015 and decrease in interest ownership in PXP from 64.7% to 19.8% in 2016. The Investment in Associates was net of equity share in the net loss of associates and the provision for impairment of investment in Lepanto amounting to P220.3 million in 2016. Pension Asset Pension Asset amounted to P312.6 million in 2016 from P263.9 million in 2015 and P320.4 million in 2014, representing the excess of the fair value of plan assets against the present value of defined benefit obligation under the Company’s retirement plan, net of SMMCI’s pension obligation.

38
Goodwill The goodwill amounted to nil as of December 31, 2106, following the deconsolidation of PXP, from of P1.239 billion in 2015 and 2014, which consisted of goodwill from acquisition of various investments (P103.3 million for FEC Resources in 2007, P155.3 million for Forum Energy in 2008 and P980.0 million for Pitkin in 2013). Deferred Exploration Costs Deferred Exploration Costs and Other Non-current Assets amounted to P23.158 billion in 2016, a 21% decrease from P29.153 billion in 2015 following a 15% jump from P25.453 billion in 2014. The 2016 balance consisted solely of exploration costs covering mining projects while the 2015 and 2014 balances still included oil exploration projects under PXP. The latter was subsequently derecognized as a result of the Company’s loss of control over PXP in 2016. Additions in the balances were mainly on account of the on-going pre-development activities in the Silangan Project and other projects. The Company provided impairment losses of P2.285 billion in 2016, nil in 2015 and P231.4 million in 2014 on various mine exploration projects of the Company and PGPI. In 2015, under the energy and hydrocarbon business of PPC, the Company recorded impairment losses of P41.2 million for SC 53 and Peru Block XXVII, net of reversal for SC 40. The Company also recorded impairment losses of P338.5 million in 2014. Deferred Exploration Costs and Other Non-current Assets
(P millions) 2016 2015
Silangan Project 21,139 19,701
Kalayaan Project 2,731 2,706
Bulawan and Vista Alegre Projects 632 630
Lascogon Project 299 300
Sibutad Project 235 231
Bumolo Project 208 77
Clifton Project 133 110
Southwest Prospect 100 100
Sanfran/Tambis Project 92 92
Other exploration costs 1,281 1,536
Total 26,850 25,483
Less: Impairment Losses (3,778) (1,493)
Deferred mine exploration costs - net 23,072 23,990
Deferred oil exploration costs - net - 4,974
Total Deferred exploration costs - net 23,072 28,963
Other Non-Current Assets 86 190
23,158 29,153

39
Total Assets At year-end 2016, Total Assets of the Company stood at P38.662 billion compared with P43.527 billion in 2015 and P44.597 billion in 2014. As of December 31, 2016, Total Current Liabilities decreased to P5.578 billion from the P5.715 billion in 2015, also lower than P7.523 billion in 2014, due to the repayment of loans with FPC and local banks. The bank loan balance continues to go down with repayments regularly made by the Company. Loans Payable Loans Payable went down to P3.083 billion (US$62.0 million) in 2016 from P3.318 billion (US$70.5 million) in 2015 and P4.308 billion (US$96.3 million) in 2014. In 2016, 2015 and 2014, the Company paid off P402.3 million (US$8.5 million), P1.176 billion (US$25.8 million) and P1.289 billion (US$29.3 million), respectively, in short-term bank loans and the US$80 million loan with FPC in 2014. The Loans Payable consisted of loans from local banks as follows: Philippine National Bank for US$26 million, Banco de Oro (BDO) for US$31 million and Bank of the Philippine Islands (BPI) for US$5 million. Current Liabilities excluding Loans Payable Current Liabilities, excluding Loans Payable, was slightly up to P2.495 billion against P2.397 billion in 2015 (versus P3.215 billion in 2014) due mainly to an increase in Income Tax Payable.
Accounts Payable and Accrued Liabilities Accounts Payable and Accrued Liabilities, mainly payables to suppliers and contractors, decreased by P71.8 million to P1.833 billion in 2016 from P1.904 billion in 2015 (down from P2.679 billion in 2014). No significant amount of the Company’s trade payables have been left unpaid within their acceptable terms agreed upon with suppliers. Income Tax Payable Income Tax Payable amounted to P164.3 million from P13.0 million in 2015 (higher than P47.4 million in 2014) due to a significant improvement in earnings in 2016. Dividends Payable Dividends Payable amounted to P498.1 million in 2016 compared with P479.7 million in 2015 and P488.8 million in 2014. In February 2016, the Company declared its shares of stock in PXP as property dividends to its shareholders at record date of March 15, 2016 at a ratio of 17 PXP shares for every 100 PX shares held. The dividend declaration was approved by the Philippine Securities and Exchange Commission (SEC) on June 22, 2016, with payment date of July 15, 2016. In July 2016, the Company also declared cash dividend of P0.03 per share (equivalent to P148.2 million) to shareholders at record date of August 10, 2016, with payment date of August 24, 2016, representing 19% of the Company’s core net income for the first half of 2016. In February 2015, the Company declared a cash dividend of P0.02 per share (equivalent to P98.8 million) in addition to the P0.03 per share (equivalent to P148.2 million) dividend declared in October 2014 or a total of P0.05 per share, representing 22% of the 2014 core net income. In 2014, the Company also declared dividends of P0.05 per share,

40
totaling P246.8 million, representing 16% of the Company’s core net income for the full year of 2013.
Non-current Liabilities Total Non-Current Liabilities at year-end 2016 decreased to P9.685 billion from P10.528 billion in 2015 and P10.032 billion in 2014, comprising mainly of Deferred Income Tax Liabilities and Loans and Bonds Payable.
Deferred Income Tax Liabilities Deferred Income Tax Liabilities (DTL) significantly decreased to P2.958 billion in 2016 from P3.939 billion in 2015 and P3.859 billion in 2014, which consisted mainly of the following: P1.665 billion arising from the acquisition of the remaining 50% of Silangan from Anglo in 2009; and P1.194 billion for accelerated depreciation and deferred exploration costs. The DTL balances in 2015 and 2014 also included P980.0 million from PXP’s acquisition of additional interest in Pitkin. Bonds Payable Bonds Payable as at end-2016 amounted to P6.593 billion, which increased from P6.259 billion in 2015 (from P5.947 billion in 2014), due to the amortization of deferred transaction costs (DTC). This amount represented the carrying amount of the convertible notes issued by SMECI, net of the unamortized DTC. Provisions for Losses and Mine Rehabilitation Costs Provision for Losses and Mine Rehabilitation Costs amounted to P134.1 million in 2016, lower than P330.0 million in 2015 and P225.6 million in 2014, comprising mainly of FEP’s contingent liability of P192.8 million, which was derecognized following the Company’s loss of control over PXP. Provision for Mine Rehabilitation increased to P129.2 million in 2016 from P125.7 million in 2015 (excluding P9.2 million under PXP) and P21.9 million in 2014 (excluding P9.6 million under PXP) representing the amortized value of the Company’s estimated mine closure costs.
Total Liabilities As of December 31, 2016, Total Liabilities of the Company decreased to P15.263 billion from P16.243 billion in 2015 and P17.555 billion in 2014, consisting mainly of short-term bank loans, deferred income tax liabilities and the convertible bond issuance with a face value of P7.200 billion but with carrying amount of P6.593 billion, net of P1.226 billion equity conversion option. The decrease in Total Liabilities was primarily due to the repayment of short-term bank loans of US$8.5 million. Shareholders’ Equity
Total Equity as of December 31, 2016 amounted to P23.399 billion, 14% lower than P27.284 billion in 2015 (slightly higher than P27.042 billion in 2014). The yearly increases in the Capital
2016 2015 2014
Common shares 4,940,399,068 4,940,399,068 4,940,399,068
Stock options 21,090,000 27,385,000 33,618,150
As of December 31

41
Stock and Additional Paid-in Capital from 2014 to 2016 were from the amortization of share-based compensation on stock options under the Company’s stock option plan. Retained Earnings amounted to P14.442 billion from P15.496 billion in 2015 and P14.712 billion in 2014, after recording the Company’s Net Income Attributable to the Equity Holders of the Parent Company of P1.589 billion in 2016 (P896.2 million in 2015 and P1.006 billion in 2014), net of cash and property dividends. A total of P148.2 million cash dividend was declared in 2016 compared with P98.8 million in 2015 and P395.1 million in 2014. On February 28, 2017, the Company’s Board of Directors (BOD) approved the declaration of cash dividend of P0.04 per share as regular dividend to all stockholders at record date of March 14, 2017, payable on March 27, 2017. In 2016, the net re-measurement of pension obligation of P68.8 million (P13.1 million in 2015 and P27.3 million in 2014) was taken up against retained earnings. On February 28, 2017, the Company’s BOD approved further appropriation of P500.0 million of the unappropriated retained earnings for purposes of mine development and construction of the Silangan Project from 2017 to 2018, thereby increasing total appropriation to P10.500 billion. Net Unrealized Loss on AFS Financial Assets, representing the temporary decline in the fair value of AFS Financial Assets, amounted to P3.1 million in 2016 from P1.0 million in 2015 and P64.1 million in 2014. Equity Conversion Options amounted to P1.226 billion corresponding to the carrying amount of the conversion options of the 8-year convertible bonds issued by SMECI, with PMC as the co-issuer, in December 2014 with a face value of P7.200 billion. As a result of the translation of foreign subsidiaries’ accounts in 2015, Cumulative Translation Adjustments amounted to P124.3 million in 2015 from P37.4 million in 2014. No cumulative translation adjustment was taken up in 2016 following the deconsolidation of investment in PXP. Similarly, the amount of Net Revaluation Surplus also decreased to P1.572 billion from a balance of P1.611 billion from the years 2014 to 2015. Likewise, the changes in the non-controlling accounts also were attributable to the deconsolidation of investment in PXP. The Effect of Transactions with Non-controlling Interests amounted to P77.9 million in 2016 from P23.2 million in 2015 and P19.1 million in 2014. The Non-controlling Interests significantly decreased to a negative balance of P0.3 million in 2016 from a positive balance of P2.721 billion in 2015 and P3.442 billion in 2014. LIQUIDITY AND CAPITAL RESOURCES The Company’s primary objectives are to fund existing operations and maintain a healthy pipeline of exploration projects to further extend mine life and for potential expansion. Despite the risks inherent in the business associated with metal prices, foreign exchange rates, regulatory environment, and the changing economic and market conditions, the Company generated net cash flows from operating activities of P2.747 billion in 2016, P1.425 billion in 2015 and P1.450 billion in 2014. The cash generated in 2016 significantly increased due to higher gold and copper prices. Other than internally generated funds, which remain as the Company’s principal source of cash, the Company also raised funds from borrowings primarily to finance the capital expenditures of the Padcal mine, the development of Silangan project and exploration initiatives of various mine sites, as well as to refinance existing debts. Net cash used in investing activities, principally for capital expenditures and exploration costs, amounted to P2.665 billion from P4.367 billion in 2015 and P5.124 billion in 2014. Capital expenditures decreased to P2.360 billion in 2016 from P3.878 billion in 2015 and P5.764 billion in 2014, which were attributed to higher sustaining capital expenditure of Padcal mine and Silangan

42
Project, amounting to P1.735 billion as against P1.390 billion in 2015 and P2.319 billion in 2014. Expenditure for the continuing exploration activities at the Silangan, Kalayaan, and other projects amounted to P625.3 million in 2016, lower than P2.488 billion in 2015 and P3.445 billion in 2014 as most of the capital-intensive activities were completed. The net cash used in investing activities also reflected the cash from deconsolidated subsidiary group of P606.6 million and net proceeds from the sale of Company assets of P33.3 million in 2016. The net proceeds from the sale of Indophil shares of P297.5 million and the share buyback of Pitkin of P646.7 million in 2015, and the proceeds from the sale of Company’s real property of P765 million and a total of P395.7 million used for the share buyback of Pitkin in 2014, were also reflected under net cash used in investing activities for the particular year. Net cash used in financing activities amounted to P637.5 million in 2016 as against P1.284 billion in 2015 and the net cash provided by financing activities of P4.825 billion in 2014, on account of lower loan availment of P236.2 million in 2016 compared with P3.016 billion in 2015 and P10.090 billion in 2014 – including proceeds from the issuance of convertible notes of P7.162 billion. Loan repayments made in 2016, 2015 and 2014 were P638.5 million, P4.192 billion and P4.935 billion, respectively, while payments for cash dividends amounted to P235.1 million in 2016, P108.0 million in 2015 and P366.9 million in 2014.
Capital Expenditures and Exploration Costs14
Capital expenditures in 2016 amounted to P2.360 billion from P3.879 billion in 2015 and P5.764 billion in 2014 as the Company focused on the Silangan project and mining projects within the vicinity of Padcal. The Company, however, continues to invest in new technologies to expand capacities, improve efficiencies and accelerate the development of the Silangan Project.
14
Excluded the Company’s energy and hydrocarbon business capex in 2015 and 2014 amounting to P181.8
million and P67.0 million, respectively. No capex reflected in 2016 following the deconsolidation of
investment in PXP.
(P millions) 2016 2015 2014
By Project:
Padcal and Others
Mine Development 601 623 668
Tailings Pond Structures 342 258 298
Machinery & Equipment 693 643 869
1,636 1,524 1,835
Silangan and Kalayaan Project
Deferred Exploration 415 2,380 3,281
Machinery & Equipment, net of asset disposal and
reclassification 99 (134) 483
514 2,246 3,765
Mine Exploration Projects 210 108 164
2,360 3,878 5,764
By Recording:
625 2,488 3,445
Property, plant and equipment 1,735 1,390 2,319
2,360 3,878 5,764
For the Year Ended December 31
Deferred Exploration costs

43
Padcal operations accounted for 69% of capital outlays in 2016 at P1.636 billion compared with P1.524 billion in 2015 and P1.835 billion in 2014. The increase in 2016 was mainly due to higher costs incurred for raising the spillway at TSF3, which entailed P342.3 million, P258.1 million and P298.0 million in investments over the last three years. Upgrade of equipment and machinery continued as well, with outlays amounting to P693.4 million in 2016, P643.4 million in 2015 and P869.0 million in 2014, which enabled the Company to maintain the inventory level at 15 months. Investments in exploration projects, meanwhile, amounted to P210.1 million in 2016 from P108.0 million in 2015 and P164.0 million in 2014. The increase was due to extensive exploration within the Padcal vicinity to further extend Padcal mine life. Expenditures for the Silangan Project accounted for the second largest chunk of capital investments at 22% of capital outlays in 2016 at P513.9 million compared with P2.246 billion in 2015 and P3.765 billion in 2014. Deferred exploration costs amounted to P415.2 million in 2016 against P2.380 billion and P3.281 billion in 2015 and 2014, respectively. Silangan capex decreased in 2016 with the near completion of Silangan DFS. Investments in new machinery and equipment amounted to P98.7 million in 2016 and P483.4 million in 2014. In 2015, machinery and equipment showed a negative P134.1 million balance, which was the result of investments in new machinery and equipment of P61.0 million, offset by the P39.8 million costs of equipment sold and P155.3 million costs of completed jobs in progress reclassified to deferred exploration costs.
Top Five Key Financial and Non-Financial Performance Indicators Safety Performance The Company believes that operational excellence can only be achieved unless personnel health and safety remains an utmost priority. In 2016, the Company reported for its Padcal Mine three (3) Lost Time Accident-Fatal (LTA-F), caused by electrical and vehicular accidents, down from four (4) LTA-F in 2015, caused largely by Typhoon Lando, from one (1) LTA-F incident in 2014. Meanwhile, there were nine (9) Lost Time Accident-Non Fatal (LTA-NF) recorded in 2016, seven (7) in 205 and two (2) LTA-NF in 2014. The Company is working towards achieving a “zero-harm” record by constantly reviewing safety policies and procedures. Initiatives are also in place to ensure that injuries are avoided and accidents are eliminated in the workplace. Third-party consultants are also engaged to evaluate the Company’s existing safety performance and identify risks areas as well as possible areas for improvement. Earnings Per Share The earnings per share (EPS) represent the net income attributable to equity holders of the Company, expressed in the amount per share of the Company’s average outstanding capital stock. Assuming a constant outstanding number of shares, the earnings per share correspondingly rises as the Company's earnings increase. The EPS ultimately reflects the Company’s financial and operational growth as a result of its performance in cost management, technical efficiency and productivity. The basic earnings per share in 2016 was 78% higher at P0.322, based on 4,940,399,068 weighted average shares outstanding for the period, compared with P0.181 in 2015 based on the

44
4,940,399,068 weighted average shares and P0.204 in 2014 based on the 4,938,577,039 weighted average shares. Considering the effect of the Company’s potentially dilutive stock options outstanding for the period, an assumed exercise of the options at exercise price higher than market would have resulted in additional common shares. In 2016, 2015 and 2014, the outstanding stock options were considered anti-dilutive based on the lower market price of the Company’s shares compared with to the exercise price, thus the diluted earnings per share in 2016, 2015 and 2014 were the same as the basic earnings per share of the Company in the said periods.
Tonnes Milled and Metal Produced Tonnes milled and ore grade determine the volume of concentrates produced and sold. Tonnes milled totaled 9,359,161 in 2016, compared with 9,198,540 tonnes in 2015 and 9,506,195 tonnes in 2014, with full year production since 2014. The higher tonnage in 2016 was mainly due to higher equipment availability. Copper metal production also increased to 34,961,062 pounds in 2016 from 34,104,049 pounds of copper in 2015 and 35,391,154 pounds in 2014, due mainly to higher tonnage and better ore grade. Gold production, however, decreased to 103,304 ounces of gold of copper in 2016, compared with 107,887 ounces of gold and 105,008 ounces of gold, as a result of lower grade and metal recovery. Total Production Cost Per Tonne and Operating Cost Per Tonne of Ore Milled, and Per Ounce Gold and Per Pound Copper Produced The Company’s average cost per tonne is a key measure of the Company’s operating performance. At the same cost level, the higher the production volume, the lower the cost per tonne becomes, which will also be similar if the same production volume incurs a lower operating cost. Thus, a lower cost per tonne would generally reflect an improvement in operating efficiency. The same essentially applies to cost expressed in per unit of metal, which incorporates the metal grade, as it affects metal production, and the exchange rate, as it affects the conversion from peso to dollar. In 2016, the total production cost (mine site cost and expenses excluding marketing charges, excise tax and royalties) per tonne of ore milled was P649, with total production cost of P6.075 billion over ore milled of 9.359 million tonnes. This was lower than the cost per tonne of P670 from the total production cost of P6.160 billion over ore milled of 9.199 million tonnes in 2015 and the cost per tonne of P716 from the total production cost of P6.808 billion over ore milled of 9.506 million tonnes in 2014. The operating costs and expenses (all cost and expenses excluding corporate overhead) per tonne of ore milled in 2015 was P793 from the total operating cost and expenses of P7.421 billion, slightly lower than the P808 from the operating costs and expenses of P7.434 billion in 2015, and 6% lower than the P859 from the operating costs and expenses of P8.165 billion in 2014. As the mine produces both gold and copper (and silver) together in one operating process, no physical basis can be used in allocating costs between the two metals, thus, the cost may be allocated proportionately based on the revenue contribution of each product. In 2016, the operating cost applicable to gold produced amounted to US$919 per ounce, lower compared with US$933 per ounce in 2015 and US$977 per ounce in 2014. Likewise, operating cost applicable to copper produced was lower at US$1.72 per pound in 2016 compared with US$1.86 per pound in 2015 and US$2.29 per pound in 2014.

45
Exploration Activities The Company is cognizant that exploration in itself is a speculative endeavor, and mineral exploration and mining operations can be hampered by force majeure and other unforeseen circumstances beyond the Company’s control. To mitigate the impact of these external factors and other contingencies, the Company banks on its ability to successfully explore and/or acquire reserves, design and construct efficient processing facilities, operate and manage its projects, and provide effective financial controls and management. To ensure the optimization of value from its natural resource properties and the long-term sustainability of operations, the Company pursues and invests in viable exploration activities and operational enhancements on a constant basis. In 2016, the amount spent on exploration was P625.3 million compared with P2.488 billion in 2015 and P3.445 billion in 2014. As of December 31, 2016, total exploration costs amounted to P23.072 billion, 60% of the Company’s Total Assets, compared with P28.963 billion in 2015 and P25.439 billion in 2014. The 2015 and 2014 balances included costs related to oil and gas exploration. Subsidiaries and Related Party Transactions Philex Mining Corporation (PMC) has extended loans and advances to some of its subsidiaries, as described under Part III, Item 12 of this Report. Furthermore, Note 2 of the Notes to the Consolidated Financial Statements is likewise incorporated hereto by reference for discussions on the new and revised accounting standards that the Company adopted in 2016. Known Trends, Events, or Uncertainties There is no known event that will trigger direct or contingent financial obligation that is material to the Company, including any default or acceleration of an obligation that have not been booked, although the Company could be contingently liable for lawsuits and claims arising from the ordinary course of business, which contingencies are not presently determinable. Other than as discussed above, there are no known significant trends, demands, commitments, or uncertainties that will result in or that are reasonably likely to result in the Company’s liquidity increasing or decreasing in a material way. There are no material commitments for capital expenditures not reflected in the Company’s financial statements. There is likewise no significant seasonality or cyclicality in its business operation that would have material effect on the Company’s financial condition or results of operation. There were no other significant elements of income or loss that did not arise from the Company’s continuing operations. There are no material off-balance sheet transactions, arrangements, obligations (including contingent obligations), and other relationship of the Company with unconsolidated entities or other persons created during the reporting period. There are no line items in the Company’s financial statements not already explained for causes either above or in the Notes to the Consolidated Financial Statements other than due to the usual period-to-period fluctuations in amounts natural in every business operations.
Item 7. Financial Statements
The audited financial statements are presented in Part V, Exhibits and Schedules.

46
Item 8. Information on Independent Accountants and other Related Matters External Audit Fees and Services Audit and Audit-Related Fees For 2016, 2015 and 2014, the Company’s external auditors were engaged primarily to express an opinion on the financial statements of the Company and its subsidiaries. The audit, however, included the auditors providing assistance to the Company in the preparation of its income tax return in as far as ensuring the agreement of the reported income and costs and expenses in the return with the recorded amounts in the books. The procedures conducted for this engagement included those that are necessary under auditing standards generally accepted in the Philippines but did not include detailed verification of the accuracy and completeness of the reported income and costs and expenses. The audit fees for these services for the entire Philex group (excluding PXP group) were P5.27 million for 2015, P5.27 million for 2015 and P5.63 million for 2014. Tax Fees The Company has not engaged the external auditors for any tax-related services in 2016, 2015 and 2014. They were, however, engaged by Silangan in 2016 to verify the documentary compliance of Silangan for value-added input tax claims purposes for a fee of P330 thousand. All Other Fees The external auditors were engaged to review and propose a job classification framework that reflects the relative worth of specified positions and levels in the Company’s table of organization. The external auditors were paid the amount of P880 thousand for their services. All audit and non-audit engagements were approved by the Company’s Audit Committee. Audit Committee’s Approval of Policies and Procedures Prior to the commencement of this year-end audit work, the external auditors presented their program and schedule to the Company’s Audit Committee, which included discussion of issues and concerns regarding the audit work to be done. At the completion of this audit works, the Company’s audited financial statements for the year were likewise presented by the external auditors to the Audit Committee for committee approval and endorsement to the full Board for final approval.
Changes in and Disagreements with Accountants on Accounting and Financial Disclosures
There was no change in the Company’s independent accountants during the two most recent calendar years or in any subsequent interim period, except for the change in the Company’s audit engagement partner to Mr. Jose Pepito E. Zabat III starting the 2012 year-end audit.
There has been no disagreement with the independent accountants on accounting and financial disclosure.
47
PART III
CONTROL AND COMPENSATION INFORMATION
Item 9. Directors and Executive Officers of the Registrant
Directors
The following are the present directors of the Company whose terms of office are for one (1) year
or until their successors are elected and qualified: MANUEL V. PANGILINAN, Chairman, Non-Executive Director Age: 70 Date of First Appointment: November 28, 2008
Academic Background: Mr. Pangilinan graduated cum laude from the Ateneo de Manila University with a Bachelor of Arts degree in Economics. He received his Master of Business Administration degree from Wharton School of the University of Pennsylvania in 1968. Business and Professional Background/ Experience: Mr. Pangilinan founded First Pacific Company Limited, a corporation listed on the Hong Kong Stock Exchange, in May 1981. He served as Managing Director of First Pacific Company Limited since its founding in 1981 until 1999. He was appointed Executive Chairman until June 2003, after which he was named Managing Director and Chief Executive Officer. In May 2006, the Office of the President of the Philippines awarded Mr. Pangilinan the Order of Lakandula, rank of Komandante, in recognition of his contributions to the country. He was named Management Man of the Year 2005 by the Management Association of the Philippines. Mr. Pangilinan was awarded Honorary Doctorates in Science by Far Eastern University in 2010; in Humanities by Holy Angel University in 2008; by Xavier University in 2007; and by San Beda College in 2002 in the Philippines. He was formerly Chairman of the Board of Trustees of the Ateneo de Manila University and was a member of the Board of Overseers of the Wharton School. He is a member of the ASEAN Business Advisory Council. Mr. Pangilinan has been a Director of PMC and Philex Gold Philippines, Inc. (PGPI) since November 2008. He is also Managing Director and Chief Executive Officer of First Pacific Company Limited, and Chairman of the PLDT Inc. (PLDT) since 2004, after serving as its President and Chief Executive Officer (CEO) since 1998. He reassumed the position of President and CEO of PLDT effective December 2015. He is also Chairman of Smart Communications, Inc., PLDT Communications and Energy Ventures, Inc. (Digitel), Metro Pacific Investments Corporation, Silangan Mindanao Mining Co., Inc., Landco Pacific Corporation, Medical Doctors Inc. (Makati Medical Center), Colinas Verdes Corporation (Cardinal Santos Medical Center), Asian Hospital, Inc., Davao Doctors, Inc., Riverside Medical Center Inc., Our Lady of Lourdes Hospital, Central Luzon Doctors’ Hospital, Inc., Maynilad Water Services Corporation, Mediaquest, Inc., Associated Broadcasting Corporation (TV5) and Manila North Tollways Corporation. Mr. Pangilinan is also Chairman of the Manila Electric Company (MERALCO), after serving as its President and Chief Executive Officer from July 2010 to May 2012. In December 2013, Roxas Holdings, Inc., Incorporated, the largest sugar producer in the Philippines, announced the election of Mr. Pangilinan as Vice Chairman.

48
Directorship in other Listed Companies in the Philippines: 1. PLDT Inc. - Chairman 2. Metro Pacific Investments Corporation - Chairman 3. Roxas Holdings, Inc. - Vice Chairman and Non-Executive Director 4. Manila Electric Company – Chairman 5. PXP Energy Corporation - Chairman
1JUAN B. SANTOS, Vice Chairman Non-Executive Director
Age: 78 Date of First Appointment: September 28, 2010
Academic Background: Mr. Santos graduated from the Ateneo de Manila University in 1960, with a Bachelor of Science degree in Business Administration, and a Master’s Degree at Thunderbird School of Global Management in Arizona, U.S.A. in 1962. Business and Professional Background/ Experience: Mr. Santos was President and Chief Executive Officer of Nestle Philippines, Inc. from 1987 to 2003, and continued to serve as Chairman of Nestle Philippines, Inc. until 2005. From 1989 to 1995, Mr. Santos concurrently served as Chief Executive Officer of Nestle Singapore Pte. Ltd. Prior to his appointment as President of Nestle Philippines, Inc., Mr. Santos was President of the Nestle Group of Companies in Thailand. In 2005, Mr. Santos served as the Secretary of the Department of Trade and Industry of the Philippines, and was designated as a member of the Governance Advisory Council, and Public Sector Representative for the Public-Private Sector Task Force for the Development of Globally Competitive Philippine Service Industries. He was awarded Management Man of the Year by the Management Association of the Philippines in 1994, and the Agora Awardee for Marketing Management by the Philippine Marketing Association in 1992. Mr. Santos has been a Director and Vice Chairman of PMC since September 28, 2010, and most recently re-elected as such on June 24, 2015. He is currently Chairman of the Social Security Commission, governing board of the Social Security System, Vice Chairman of Alaska Milk Corporation, and Director of the PLDT Inc., First Philippine Holdings Corporation, Sun Life Grepa Financial, and Inc., East-West Seeds Co., Inc. He sits on the Board of Advisors of Coca-Cola FEMSA Philippines, Mitsubishi Motors Philippines Inc. and serves as Trustee of the St. Luke’s Medical Center. He was former Chairman of the Ramon Magsaysay Award Foundation, and Consultant of the Marsman-Drysdale Group of Companies. He is also Chairman of Dualtech Training Center Foundation, Inc. Directorship in other Listed Companies in the Philippines 1. PLDT Inc. (PLDT) - Non-Executive Director 2. First Philippine Holdings Corp. - Independent Director
EULALIO B. AUSTIN, JR. President & CEO, Executive Director Age: 55 Date of First Appointment : June 29, 2011
Academic Background: Mr. Austin graduated from Saint Louis University-Baguio City, with a Bachelor of Science degree in Mining Engineering and placed eight at the 1982 Professional Board Examination for mining engineers. He took his Management Development Program at the

49
Asian Institute of Management in 2005 and his Advance Management Program at Harvard Business School in 2013. Business and Professional Background/ Experience: Mr. Austin has been a Director of PMC and PGPI since June 29, 2011 and was re-elected on June 24, 2015. He became President and Chief Operating Officer on January 1, 2012 and President and Chief Executive Officer of the Company on April 3, 2013. He previously served the Company as its Senior Vice President for Operations and Padcal Resident Manager in 2011, Vice President & Resident Manager for Padcal Operations from 2004 to 2010, Mine Division Manager (Padcal) from 1999 to 2003, Engineering Group Manager in 1998 and Mine Engineering & Draw Control Department Manager from 1996 to 1998. Mr. Austin concurrently serves as Director of PXP Energy Corporation and Silangan Mindanao Mining Co., Inc. He likewise sits on the Board of of the Chamber of Mines of the Philippines and Philippine Mineral Safety and Environmental Association (PMSEA) and was Founding President of PSEM’s Philex Chapter. He was recently awarded as the CEO of the year on Mining by The Asset last December 14, 2015 in Hongkong. He was also a recipient of Asia Pacific Entrepreneur Award (APEA) for the Mining Industry by Enterprise Asia in 2016. He was also recognized by the Philippine Society of Mining Engineers as the Most Outstanding Engineer in Mine Management in June 2016. Directorship in OTHER Listed Companies in the Philippines:
1. PXP Energy Corporation - Non - Executive Director
2 MICHAEL N. ALIMURUNG, Non-Executive Director
Age: 41 Date of First Appointment: November 25, 2015
Academic Qualification: Mr. Michael N. Alimurung graduated from the Ateneo de Manila University with Honors in 1997 and 1998 with Bachelor of Science degrees in Management Engineering and Computer Science respectively. He obtained an MBA from the Stanford Graduate School of Business in 2006. Business and Professional Background/ Experience: He is currently one of the nine (9) SSS Commissioners and the Chairperson of the SSC-IT (Information Technology) Committee. He serves as a Director of Philex Mining Corporation and Union Bank of the Philippines. He provides general management and strategy consulting to government agencies, including the Commission on Audit, the Department of Social Welfare and Development and the Development Academy of the Philippines (DAP). In the public sector, he served as Assistant Executive Secretary and Head of the Government Performance Monitoring Office in the Office of the President, Republic of the Philippines from 2010-2012. He was a Board Member of DAP in 2011 and designated as a DAP Fellow in 2012. In the private sector, he is the founder of Impact.ph, an organization that aims to enhance and transform the Philippine nonprofit sector. He was previously the anchor of Bright Ideas, a talk show of Bloomberg TV Philippines He also worked as a Principal at the Wellspring Consulting, a top-tier consulting firm focused on the social sector, based in Boston, MA from 2006-2010 and 2012-2014. He was a co-founder of Jericho Systems,
50
an e-commerce and publishing company and also a co-founder of BukasSarili Foundation. He worked at Citibank in 2004 and Procter & Gamble from 1999-2003. He also taught at the Ateneo de Manila from 1999-2002 and at the University of Asia and the Pacific from 1998-1999. Directorship in Other Listed Companies: 1.) Union Bank of the Philippines - Non-Executive Director (Date of First Appointment: October 15, 2015)
OSCAR J. HILADO, Independent Director Age : 79 Date of First Appointment : December 7, 2009
Academic Background: Mr. Hilado, a Certified Public Accountant, completed his undergraduate studies at the De La Salle College-Bacolod in 1958 and obtained his Masters in Business Administration from the Harvard School of Business Administration (Smith Mundt/Fulbright Scholar) in 1962. He received a Doctorate in Business Management, Honoris Causa, from the De La Salle University and a Doctorate of Laws, Honoris Causa, from the University of St. La Salle in 1992. Business and Professional Background/ Experience: Mr. Hilado has been an Independent Director of PMC since December 7, 2009, and was last re-elected on June 24, 2015. He was the Chairman & Chief Executive Officer of Philippine Investment Management (PHINMA), Inc. (January 1994 to August 2005), and currently Chairman of the Board. He is currently also Chairman of PHINMA Corp, Trans-asia Oil and Energy Development Corporation, PHINMA Property Holdings Corp., Vice Chairman of Trans-Asia Power Generation Corporation, and Director of Trans Asia Renewable Energy Corporation and publicly listed Trans-Asia Petroleum Corporation. Mr. Hilado is an Independent Director of Smart Communications, Inc. and Digital Telecommunications Phils., Inc, and the publicly listed First Philippine Holdings Corporation and A. Soriano Corporation. He is also a Director of United Pulp and Paper Company, Inc., Beacon Property Ventures, Inc., Manila Cordage Company, Pueblo de Oro Development Corporation, Seven Seas Resorts and Leisure, Inc., Asian Eye Institute, Araullo University, Cagayan de Oro College, University of Iloilo, University of Pangasinan, Microtel Inns & Suites (Pilipinas) Inc. Directorship in Other Listed Companies in the Philippines : 1. PHINMA Corporation - Non-Executive Director 2. Trans Asia Oil & Energy Development Corporation and its subsidiary, Trans Asia Power Generation Corporation - Non-Executive Director 3. A. Soriano Corporation - Non-Executive Director 4. First Philippine Holdings Corp. -Independent Director 5. Rockwell Land Corporation – Independent Director 6. Roxas Holdings, Inc. – Independent Director

51
MARILYN A. VICTORIO-AQUINO, Non-Executive Director Age: 61 Date of First Appointment : December 7, 2009
Academic Background: Ms. Victorio-Aquino graduated cum laude (class salutatorian) from the University of the Philippines College of Law in 1980 and placed second in the Philippine Bar Examinations. Business and Professional Background/ Experience: She has been a Director of PMC and PGPI since December 7, 2009 and was re-elected on June 24, 2015. She is an Assistant Director of First Pacific Company Limited. since July 2012, following her 32-year law practice at SyCip Salazar Hernandez and Gatmaitan Law Offices, where she was Partner from 1989 to 2012. She is also a Director of Philippine Indofood Distribution Corporation since August 2014, of Light Rail Manila Corporation since July 2014, of Silangan Mindanao Mining Co., Inc., and Lepanto Consolidated Mining Company since October 2012, and of Maynilad Water Services Corporation since December 2012. Directorship in Other Listed Companies in the Philippines: 1. PXP Energy Corporation - Non-Executive Director 2. Lepanto Consolidated Mining Company – Non-Executive Director
3 BIENVENIDO E. LAGUESMA, Non-Executive Director
Age: 65 Date of First Appointment: February 27, 2013
Academic Background Mr. Laguesma finished his Bachelor of Laws at Ateneo De Manila College in 1975 and his post-graduate studies as a Colombo Scholar (British Council) for Public Sector Administration course at the Royal Institute of Public Administration in London, United Kingdom of Great Britain from May to August of 1985. Business and Professional Background/ Experience Mr. Laguesma has been a Director of PMC and PGPI since February 27, 2013, and was re-elected on June 24, 2015. He is presently a Commissioner of the SSS and has held such position since March 2011. Mr. Laguesma was Secretary of the DOLE from 1998-2001, Presidential Assistant (Office of the President of the Republic of the Philippines) from 1996 to 1998, and DOLE Undersecretary from 1990 to 1996, after holding various other positions in the Government since 1976. He is a Director of the First Metro Investment Corporation and Chairman of the Charter Ping An Insurance Corporation of the Metrobank Group. He is also Senior Partner of the Laguesma Magsalin Consultants and Gastardo Law Offices. He is currently a Member, Board of Regents, Pamantasan ng Lungsod ng Maynila and a Director of Drug Abuse Resistance Education, DAREPHIL, Inc. Directorship in OTHER Listed Companies in the Philippines
1. None
52
BARBARA ANNE C. MIGALLOS Corporate Secretary , Executive Director Age: 62 Date of First Appointment: June 26, 2013
Academic Background: Ms. Migallos graduated cum laude from the University of the Philippines, with a Bachelor of Arts degree, and finished her Bachelor of Laws degree as cum laude (salutatorian) also at the University of the Philippines. She placed third in the 1979 Philippine Bar Examination. Business and Professional Background/ Experience Ms. Migallos was elected to the Board of Directors of PMC and PGPI on June 24, 2015. She is also the Company’s Corporate Secretary since July 1998. She is also Director and Corporate Secretary of PXP Energy Corporation, and Corporate Secretary of Silangan Mindanao Mining Co., Inc. She is the Managing Partner of the Migallos & Luna Law Offices. Ms. Migallos is also a Director of Mabuhay Vinyl Corporation since 2000 and Philippine Resins Industries since 2001, and Corporate Secretary of Eastern Telecommunications Philippines, Inc. since 2005 and Nickel Asia Corporation since 2010. She is a professorial lecturer in Corporations Law, Insurance, Securities Regulation and Credit Transactions at the De La Salle University College of Law. She was a Senior Partner of Roco Kapunan Migallos and Luna Law Offices from 1988 to 2006. Directorship in other Listed Companies in the Philippines 1. PXP Energy Corporation - Non-Executive Director 2. Mabuhay Vinyl Corporation - Non-Executive Director
ROBERT C. NICHOLSON, Non-Executive Director Age: 61 Date of First Appointment : November 8, 2008
Academic Background: Mr. Nicholson graduated from the University of Kent in 1976 and qualified as a solicitor in England and Wales and in Hong Kong. Business and Professional Background/ Experience Mr. Nicholson has been a Director of PMC and PGPI since November 28, 2008, and was re-elected on June 24, 2015. He is an Executive Chairman of Forum Energy Plc, a Chairman of Goodman Fielder Pty Limited (since March 2015), a Commissioner of PT Indofood Sukses Makmur Tbk. He is also a Director of Metro Pacific Investments Corporation, PXP Energy Corporation and Silangan Mindanao Mining Co, Inc., Executive Director of Pitkin Petroleum Plc and Pacific Light Power Pte. Ltd., all of which are First Pacific Group subsidiaries or associates. Mr. Nicholson is also an Independent Non-executive Director of Pacific Basin Shipping Limited and Lifestyle Properties Development Limited. Previously, he was a senior partner of Reed Smith Richards Butler from 1985 to 2001 where he established the corporate and commercial department, and was also a senior advisor to the board of directors of PCCW Limited between August 2001 and September 2003.

53
Mr. Nicholson has wide experience in corporate finance and crossborder transactions, including mergers and acquisitions, regional telecommunications, debt and equity capital markets, corporate reorganizations and privatizations in China. Directorship in other Listed Companies in the Philippines 1. PXP Energy Corporation - Non-Executive Director 2. Metro Pacific Investment Corporation - Non-Executive Director
WILFREDO A. PARAS, Independent Director Age : 70 Date of First Appointment : June 29, 2011
Academic Background Mr. Paras completed his undergraduate studies at the University of the Philippines in 1969 with Bachelor of Science, Industrial Pharmacy and his Master in Business Administration at the De La Salle University in 1991. He also completed an Executive Program at the University of Michigan at Ann Arbor, Michigan, USA. Business and Professional Background/ Experience Mr. Paras has been an Independent Director of PMC since June 29, 2011 and was re-elected on June 24, 2015. He is currently Independent Director of GT Capital Holdings, Inc. since May 2013, President of WAP Holdings, Inc., and a Director of CIIF Oil Mills Group of Companies. He is also a member of the Board of Trustees of Dualtech Training Foundation Inc. Mr. Paras was previously the Executive VicePresident, Chief Operating Officer and Director of JG Summit Petrochemical Corporation, President and Director of PT Union Carbide Indonesia, Managing Director of Union Carbide Singapore, and Business Director for Union Carbide Asia Pacific. Directorship in Other Listed Companies in the Philippines
1. GT Capital Holdings, Inc. - Non-Executive Director
EDWARD A. TORTORICI Non-Executive Director
Age: 77 Date of First Appointment : December 7, 2009
Academic Background Mr. Tortorici received a Bachelor of Science degree from New York University and a Master of Science degree from Fairfield University. Business and Professional Background/ Experience Mr. Tortorici has been a Director of PMC and PGPI since December 7, 2009, and was last re-elected on June 24, 2015. Mr. Tortorici has served in a variety of senior and executive management positions, including Corporate Vice President for Crocker Bank and Managing Director positions at Olivetti Corporation of America and Fairchild Semiconductor Corporation. Mr. Tortorici subsequently founded EA Edwards Associates, an international management and consulting firm specializing in strategy formulation and productivity improvement with offices in USA, Europe and Middle East. In 1987, Mr. Tortorici joined First Pacific Company Limited as an Executive Director for strategic planning and corporate restructuring, and launched the Group’s entry into the telecommunications and technology sectors. Presently, he oversees corporate strategy for First Pacific Company Limited and guides the Group’s strategic planning and corporate development activities. Mr. Tortorici serves as a Commissioner of PT Indofood

54
Sukses Makmur Tbk and as Director of Metro Pacific Investments Corporation, Maynilad Water Services, Inc., FEC Resources Inc. of Canada. He previously served as Director of AIM-listed Forum Energy plc. Mr. Tortorici serves as a Trustee of the Asia Society Philippines and is on the Board of Advisors of the Southeast Asia Division of the Center for Strategic and International Studies, a Washington D.C. non-partisan think tank. He also served as a Commissioner of the U.S. ASEAN Strategy Commission. Directorship in Other Listed Companies in the Philippines 1. Metro Pacific Investment Corporation - Non-Executive Director
4 JOSE GABRIEL M. LA VIÑA, Non-Executive Director
Age: 59 Date of First Appointment: February 28, 2017 Academic Background: Mr. La Viña graduated at the Ateneo de Manila University with a degree of BA Philosophy (Magna Cum Laude) and an Ateneo Full Scholar & Insular Life Educational Foundational Scholar. He was also an AFS Scholar, Master in Entrepreneurship (Superior Performance) at the Asian Institute of Management; a Valedictorian at Corona del Mar High School, Newport Beach, California, Xavier University High School, and Xavier University Grade School. Business and Professional Background/ Experience: Mr. La Viña was appointed Commissioner of the Social Security System (SSS) on November 2016. Prior to this, he was Social Media Director, Duterte 2016 Presidential Campaign and a member of its Media Central & Communications Group. Mr. La Viña has 32 years of experience as Founder & CEO in various industries, including Home Mortgage Brokerage, Real Estate, Cooperative Banking, Technology, Auto Sales, Supply Chain Management, Hospitality and Music Entertainment. Elected February 2016 to the Board of Directors of the Alumni Association of the Asian Institute of Management. Served as Treasurer & Trustee of AFS Intercultural Services, which sends around 30 to 40 Filipino Muslim youth scholars to the United States every year under the Kennedy-Lugar Youth Exchange and Study program funded by the U.S. State Department. As composer, Mr. La Viña’s songs have been recorded by Lea Salonga, Chad Borja, Joey Albert, Iza Calzado, Gino Padilla, Anna Fegi, Renz Verano, Jinky Llamanzares, Kaye Abad, Toti Fuentes, Raymond Lauchenco, Iwi Laurel, Tillie Moreno, Louie Reyes, Eugene Villaluz, Teresa Loyzaga, and other Filipino and international artists. One of his compositions won Third Prize in the Metro Manila Popular Music Festival in 1984 and two other received Honorable Mention at the 10th Billboard International Song Contest, 2002.
Directorship in Other Listed Companies in the Philippines: 1. None
55
4 MICHAEL G. REGINO, Non-Executive Director
Age: 59 Date of First Appointment : February 28, 2017 Academic Background: Mr. Regino graduated Cum Laude and Salutatorian from Ateneo de Zamboanga University in 1981, with a degree of Bachelor of Science, Major in Economics. He obtained his Masters in Business Administration in 1985 from Ateneo de Manila University. Business and Professional Background/ Experience: Mr. Regino has more than 30 years of corporate experience in organizing, developing and successfully operating enterprises in the following fields: real estate and construction, ready mix concrete operations, crushing plant operations, heavy equipment, Cable television operations, property management, Non-life insurance brokerage and risk management, and memorial parks development. Aside from his being a Social Security Commissioner, he also serves as the President and member of the Board of Directors of San Agustin Services, Inc., Agata Mining Ventures, Inc., and Exploration Drilling Corp.; Senior Vice President and Chief Operating Officer of St. Augustine Gold and Copper Ltd.; and Executive Director of TVI Resources Development Phils., Inc. He likewise sits in the Board of Directors of Nationwide Development Corporation, as well as of KingKing Mining Corp., where he is in charge of Davao Operations. Mr. Regino previously worked as President of Golden Haven Memorial Parks, Inc., Camella Homes, and MGS Group of Companies. He also once shared his expertise in other industries such as Northern Foods, Corp., Kilusang Kabuhayan at Kaunlaran, and Ateneo de Zamboanga University, where he served as Finance and Treasury Manager, Chief Financial Specialist, and Instructor in Economics, respectively.
Directorship in Other Listed Companies in the Philippines: 1. None
4 ANITA BUMPUS QUITAIN, Non-Executive Director
Age: 70 Date of First Appointment: February 28, 2017 Academic Background: Ms. Quitain has BSE Education Degree holder from the University of Mindanao in Davao City and Bachelor of Science Degree in Commerce, Major in Accounting. She also completed two (2) years of Masters in Public Administration (37 units) for her Career Civil Service Eligibility Business and Professional Background/ Experience: As newly-appointed SSS Commissioner, Ms. Quitain notched a major achievement by voting yes on the increase of the pension of SSS pensioners, despite being a neophyte member of the Social Security Commission. As an employee of the SSS (for 31 years) assigned to the Main Office of Region 09 in Davao City, one of her major achievements was taking charge of the operations of the then newly-opened SSS Representative Office in Digos City, Davao del Sur as Office-in-Charge. She stayed there for five (5) years where she conducted seminars and coverage drives, especially in rural areas, aside from discharging management and leadership functions in the Representative Office.

56
As a BSE Education Degree holder, she worked with the Department of Education as an elementary classroom teacher for ten (10) years and served worked as a classroom teacher in the Philippine Women’s College of Davao for one year. After this, she moved to SSS office in Region 09, Davao City, where she eventually retired in July, 2009 after 31 years of dedicated service. Ms. Quitain was, at one time or another, headed different sections, namely: Membership, Real Estate, Operations Accounting, Member Assistance Center, and Sickness, Maternity and Disability Sections.
Directorship in Other Listed Companies in the Philippines: 1. None
1
Mr. Juan B. Santos resigned from the Philex Board effective 26 October 2016 2
Mr. Michael V. ALimurung resigned from the Philex Board effective 23 November 2016 3 Mr. Bienvenido E. Laguesma resigned from SSS as Commissioners in 31 December 2016.
4 Appointed to the Philex Board of Directors effective 28 February 2017
Executive Officers
The following persons are the present executive officers of the Company: EULALIO B. AUSTIN, JR. – 55, Filipino citizen. Mr. Austin has been a Director of PMC and PGPI since June 29, 2011 and was re-elected on June 24, 2015. He became President and Chief Operating Officer on January 1, 2012 and President and Chief Executive Officer of the Company on April 3, 2013. He previously served the Company as its Senior Vice President for Operations and Padcal Resident Manager in 2011, Vice President & Resident Manager for Padcal Operations from 2004 to 2010, Mine Division Manager (Padcal) from 1999 to 2003, Engineering Group Manager in 1998 and Mine Engineering & Draw Control Department Manager from 1996 to 1998. Mr. Austin concurrently serves as Director of PXP Energy Corporation and Silangan Mindanao Mining Co., Inc. He likewise sits on the Board of of the Chamber of Mines of the Philippines and Philippine Mineral Safety and Environmental Association (PMSEA) and was Founding President of PSEM’s Philex Chapter. He was recently awarded as the CEO of the year on Mining by The Asset last December 14, 2015 in Hongkong. He was also a recipient of Asia Pacific Entrepreneur Award (APEA) for the Mining Industry by Enterprise Asia in 2016. He was also recognized by the Philippine Society of Mining Engineers as the Most Outstanding Engineer in Mine Management in June 2016. BARBARA ANNE C. MIGALLOS – 62, Filipino citizen. Ms. Migallos has been a Director of the Company and PGPI since June 26, 2013 and was re-elected on June 24, 2015. She is also the Company’s Corporate Secretary since July 1998. Ms. Migallos is also Director and Corporate Secretary of PXP Energy Corporation, and Corporate Secretary of Silangan Mindanao Mining Co., Inc. and Lascogon Mining Corporation. She is the Managing Partner of the Migallos & Luna Law Offices. Ms. Migallos has also been a Director of Mabuhay Vinyl Corporation since 2000 and the Philippine Resins Industries since 2001, and Corporate Secretary of Eastern Telecommunications Philippines, Inc. since 2005 and Nickel Asia Corporation since 2010. She is also a professorial lecturer in insurance law and securities regulation law at the De La Salle University College of Law. Ms. Migallos graduated cum laude from the University of the Philippines, with a Bachelor of Arts degree, and finished her Bachelor of Laws degree as cum laude (salutatorian) also at the University of the Philippines. She placed third in the 1979 Philippine Bar Examination. DANNY Y. YU. – 55, Filipino citizen. Mr. Yu was appointed Senior Vice President for Finance and Chief Financial Officer (“CFO”) on September 2, 2013. He is also the Company’s Compliance
57
Officer and Corporate Governance Officer. Prior to joining the Company, Mr. Yu was CFO of Digitel Communications, Inc. (subsidiary of PLDT) and of Digitel Mobile Philippines, Inc. (Sun Cellular) from November 2011 to July 2013. He was also Group CFO of ePLDT, Inc. and subsidiaries (November 2010 to December 2011); CFO of PLDT Global Corporation (June 2004 to November 2010) and of Mabuhay Satellite Corporation (March 1999 to May 2004). Mr. Yu was also Vice President-Corporate Development of Fort Bonifacio Development Corporation (March 1997 to March 1999). A CPA, he was previously connected with Sycip, Gorres and Velayo & Co. Mr. Yu obtained a Bachelor of Science Degree in Commerce, Major in Accounting (Magna Cum Laude) from the San Carlos University in Cebu City. In 1995, he completed a Master in Management at the Asian Institute of Management. Last year, Mr. Yu was named as the 2016 ING Finex CFO of the Year. MANUEL A. AGCAOILI – 60, Filipino citizen. Mr. Agcaoili has joined the Company as Senior Vice President and Padcal Resident Manager on January 15, 2014. He was previously with MBMI Resources, Inc. (Vancouver, Canada) as Director and President from 2004 to 2014 and Senior Philippine Representative, Narra Nickel Mining and Development Corporation, Tesoro Mining And Development Corporation, and McArthur Mining, Inc. as Director and President from 2006 to 2008, and Lafayette Philippines, Inc. as Director also from 2006 to 2008. He was also previously connected with the Philippine Associated Smelting and Refining Corporation. Mr. Agcaoili graduated with a Bachelor of Science Degree in Metallurgical Engineering at the University of the Philippines in 1980. He also completed a Master in Business Administration Program at the Ateneo De Manila University Graduate School of Business in 2002. MICHAEL T. TOLEDO – 56, Filipino citizen. Mr. Toledo has been Senior Vice President for Corporate Affairs since February 15, 2012. He also heads the Media Bureau of the MVP group of companies. Before joining the Company, he was President and Chief Executive Officer of the Weber Shandwick Manila office since 2006, and was Director and/or Legal and Financial Consultant for various government owned and controlled corporations. Mr. Toledo was also Press Secretary and Presidential Spokesperson for former President Joseph Ejercito Estrada. Mr. Toledo finished a Bachelor of Arts Degree in Philosophy in 1981 and completed a Bachelor of Laws Degree at University of the Philippines in 1985. In 1994, he obtained a Masters of Law degree at the London School of Economics and Political Science. REDEMPTA P. BALUDA – 61, Filipino citizen. Ms. Baluda has been Vice President for Exploration since January 2, 2009. She was formerly Assistant Vice President for Exploration from 2007 to 2009, Division Manager for Environment and Community Relations and Geology for Padcal Operations from 1998 to 2007 and Department Manager for Geology from 1996 to 1998. Ms. Baluda finished with a Bachelor of Science Degree in Geology at the University of the Philippines in 1976. She also completed the academic units under the Masters in Environment & Natural Resource Management at the University of the Philippines campus in Los Banos, Laguna in 2007. VICTOR A. FRANCISCO – 52, Filipino citizen. Mr. Francisco has been Vice President for Environment and Community Relations since January 2, 2009. He was previously Group Manager for Corporate Environment and Community Relations in 2007, Department Manager– Corporate Environment and Community Relations in 1999 and Assistant Manager –Corporate Environmental Affairs in 1997. Mr. Francisco completed a Bachelor of Science Degree in Community Development at the University of the Philippines in 1987. He also received a Masters in Environmental Science and Management at the University of the Philippines campus in Los Banos, Laguna in 1995. JOAN A. DE VENECIA – 36, Filipino citizen. Joan A. de Venecia is currently the Vice President and General Counsel of Philex Mining Corporation, having joined the company on August 1, 2015. Prior to this, Ms. De Venecia was the Vice President for the Public Relations and Information Services Group at Pag-IBIG Fund, a government owned and controlled corporation. Before joining public service, Ms. De Venecia was a senior associate at SyCip Salazar

58
Hernandez & Gatmaitan. She obtained her Master of Laws in International Legal Studies degree (Hugo Grotius scholar & Fulbright scholar, 2010) from the New York University School of Law; Bachelor of Laws degree (valedictorian, cum laude, Academic Excellence awardee, 2005) from the University of the Philippines College of Law; and BS–Legal Management (hon. mention, 2001) from the Ateneo de Manila University. She ranked 1st in the 2005 Bar Examinations. She teaches law at the UP College of Law, and is a regular Mandatory Continuing Legal Education lecturer on Investor-State Arbitration.
While all employees are expected to make a significant contribution to the Company, there is no
one particular employee, not an executive officer, expected to make a significant contribution to
the business of the Company on his own.
The Company is not aware of any adverse events or legal proceedings during the past five (5)
years that are material to the evaluation of the ability or integrity of its directors or executive
officers. Note 31 of the Notes to the Consolidated Financial Statements of the Exhibits in Part V,
Item 14 is also hereto incorporated by reference.
There are no family relationships up to the fourth civil degree of consanguinity among any of the
directors and executive officers.
No director has resigned or declined to stand for re-election because of disagreement with the Company on any matter relating to the Company’s operations, policies or practices.
Item 10. Executive Compensation
There are no arrangements for additional compensation of directors other than that provided in
the Company’s by-laws which provides compensation to the directors, at the Board’s discretion to
determine and apportion as it may deem proper, an amount up to one and a half (1 ½ %) percent
of the Company’s net income before tax of the preceding year. Payments made in 2016, 2015
and 2014 amounted to P12.7 million P10.5 million and P10.6 million, respectively. In 2016, 2015
and 2014, the payments represented only 1% of the Company’s net income before tax.
Effective March 2015, the Directors’ per diem increased to P40,000 per board meeting attendance and P30,000 per committee participation, and are deductible from the annual directors’ compensation provided under Section 7 of the Company’s By-laws. Previously, the rate per attendance for both board and committee meeting was P8,000. In the event that financial results warrant the payment of the annual directors’ compensation under the Company’s by-laws, such directors’ compensation shall be inclusive of the annual total per diem paid to directors.
There is no executive officer with contracts or with compensatory plan or arrangement having
terms or compensation significantly dissimilar to the regular compensation package, or separation
benefits under the Company’s group retirement plan, for the managerial employees of the
Company.
On June 23, 2006, the Company’s stockholders approved the stock option plan of the Company which was thereafter duly approved by the Securities and Exchange Commission on March 8, 2007. This Plan and all outstanding option shares granted under this plan expired in 2016.
On June 29, 2011, the Company’s stockholders approved a new stock option plan covering up to 246,334,118 shares equivalent to 5% of the Company’s outstanding shares of 4,926,682,368 as of June 29, 2011. This plan was approved by the SEC on February 22, 2013, which approval was received by the Company on March 5, 2013. Note 27 of the Notes to Consolidated Financial

59
Statements of the Exhibits in Part V, Item 14 on the Company’s Stock Option Plan is hereby incorporated for reference.
The following table shows the compensation of the directors and officers for the past three years
and estimated to be paid in the ensuing year. Starting 2008, stock option exercises of the
Company’s non-management directors, consisting of the difference between the market and
exercise prices at the time of option exercise, are considered as director’s fee for purposes of the
table.

60
SUMMARY OF COMPENSATION TABLE
(In Thousands)
DIRECTORS
Year Directors' Fee
2017 (Estimated) P 22,790
2016 P 11,666
2015 P 13,544
2014 P 10,461
CEO AND FOUR MOST HIGHLY COMPENSATED OFFICERS
Year Salary Bonus/Others
2017 (Estimated) P 62,649 P 5,221
2016 P 67,544 P 17,553
2015 P 60,918 P 14,774
2014 P 64,499 P 21,992
Total Officers'
Year Salary Bonus/Others
2017 (Estimated) P 74,317 P 6,193
2016 P 76,754 P 22,101
2015 P 77,938 P 29,971
2014 P 84,829 P 27,669
ALL DIRECTORS & OFFICERS AS A GROUP
Year Total Amount
2017 (Estimated) P 103,300
2016 P 110,521
2015 P 121,453
2014 P 122,959
The aggregate amount of compensation paid in 2016, 2015 and 2014 and estimated amount expected
to be paid in 2017 as presented in the above table are for the following executive officers:
2017 (Estimate) - Eulalio B. Austin, Jr. (CEO), Danny Y. Yu, Manuel A. Agcaoili, Michael T.
Toledo and Redempta P. Baluda
2015 - Eulalio B. Austin, Jr. (CEO), Danny Y. Yu, Manuel A. Agcaoili, Michael T. Toledo
and Redempta P. Baluda
2014 - Eulalio B. Austin, Jr. (CEO), Danny Y. Yu, Manuel A. Agcaoili, Michael T. Toledo
and Benjamin R. Garcia
2016 - Eulalio B. Austin, Jr. (CEO), Danny Y. Yu, Manuel A. Agcaoili, Michael T. Toledo
and Redempta P. Baluda

61
Item 11. Security Ownership of Certain Beneficial Owners and Management
Security Ownership of Certain Record and Beneficial Owners
The list of registered stockholders owning five (5%) percent or more of the Company’s stock as of
December 31, 2016 follows:
1 Asia Link B.V., a wholly-owned subsidiary of First Pacific Company Limited
(FPC), is the registered owner of 1,023,275,990 shares. In its SEC Form 23-A dated December 3, 2009, FPC disclosed that it beneficially owns 1,542,590,602 shares inclusive of the shares held by Asia Link B.V. FPC is represented by Messrs. Manuel V. Pangilinan, Robert C. Nicholson and Edward A. Tortorici on the Company’s Board of Directors.
2 The total shares held by the Social Security System (SSS) presented above is
inclusive of 152,793,599 shares lodged with the PCD Nominee Corporation as the record owner as of December 31, 2015. Messrs. Juan B. Santos and Bienvenido E. Laguesma, and Mr. Michael N. Alimurung currently represent the SSS in the Company as members of the Board of Directors.
3 PCD Nominee Corporation (PCD), the nominee of the Philippine Depository &
Trust Corp., is the registered owner of the shares in the books of the Company’s transfer agent. The beneficial owners of such shares are PCD’s participants who hold the shares on their own behalf or in behalf of their clients. The 1,016,299,855 shares shown above as of December 31, 2015 are exclusive of the 152,793,599 shares owned by SSS which shares were included as part of the total holdings of SSS as indicated above. PCD is a private company organized by the major institutions actively participating in the
Title of ClassName and Address of Record
Owner and Relationship to Issuer
Name of Beneficial Owner
and Relationship with
Record Owner
CitizenshipNumber of
SharesPercentage
Common ASIA LINK B.V. First Pacific Company
Limited, Inc.Dutch 1,023,275,990 20.71%
Prins Bernhardplein 200,1097 JB
Amsterdam, The NetherlandsSee Note 1 below
Common Social Security System Social Security System Filipino 999,353,629 20.23%
c/o Loans and Investment Office,
7/F SSS Building, Diliman, Quezon
City
See Note 2 below
Common PCD Nominee Corp. See Note 3 belowFilipino/Other
Alien916,462,052 18.55%
37/F, Tower I, The Enterprise
Center, 6766 Ayala Averue,
Makati City
Common Two Rivers Pacific Holdings Corp.Two Rivers Pacific Holdings
Corp.Filipino 738,871,510 14.96%
10/F MGO Building, Legaspi cor
dela Rosa Sts., Legaspi Village,
Makati City
See Note 4 below

62
Philippine capital markets to implement an automated book-entry system of handling securities transaction in the Philippines. Other than SSS whose shares under the PCD which were excluded and presented separately in the table above, there are no participants under the PCD account owning more than 5% of the voting securities of the Company.
4 Two Rivers Pacific Holdings Corporation is represented by Ms. Marilyn A.
Victorio-Aquino and Mr. Eulalio B. Austin Jr. on the Company’s Board of Directors.
5 The foregoing record owners have no relationship with the Company other
than being stockholders.
Security Ownership of Management
The beneficial ownership of the Company’s directors and executive officers as of December 31,
2016 follows:
Title of class
Name of Beneficial Owner Nature of Ownership
Citizenship Number of
Shares Percentage
COMMON Manuel V. Pangilinan Direct Filipino 4,655,000 0.09%
COMMON Eulalio B. Austin, Jr. Direct Filipino 1,360,937 0.03%
COMMON Barbara Anne C. Migallos Direct Filipino 203,875 0.00%
COMMON Edward A. Tortorici Direct American 3,285,100 0.07%
COMMON Robert C. Nicholson Direct British 1,250 0.00%
COMMON Marilyn A. Victorio-Aquino Direct Filipino 500,100 0.01%
COMMON Oscar J. Hilado Direct Filipino 173 0.00%
COMMON Wilfredo A. Paras Direct Filipino 1 0.00%
COMMON Danny Y. Yu Direct Filipino 40,000 0.00%
COMMON Redempta P. Baluda Direct Filipino 20 0.00%
COMMON Victor A. Francisco Direct Filipino 50,000 0.00%
COMMON Manuel A. Agcaoili Filipino 0.00%
COMMON Michael T. Toledo Filipino 0.00%
COMMON Joan A. De Venecia Filipino 0.00%
Directors and Officers as a Group 10,096,456 0.20%
The above directors and executive officers have no indirectly owned shares other than the above.
Voting Trust/Changes in Control
There is no voting trust holder of 5% or more of the Company’s stock. There are no arrangements which may result in a change in control of the Company.
Item 12. Certain Relationships and Related Transactions
The Company’s significant related party transactions as of December 31, 2016, 2015 and 2014, which are under terms that are no less favorable than those arranged with third parties, and account balances are as follows:

63
a) Advances from PMC to SMMCI and SMECI
PMC, owning directly and indirectly 100% of SMMCI and SMECI, provides the funds to SMMCI, through SMECI since 2011 and directly thereafter, for the Silangan project’s expenditures since the Company’s acquisition of Anglo American’s interest in the Silangan Project in 2009. These advances, which were intended to be converted into equity, amounted to P650.6 million, nil, and P6.174 billion as of December 31, 2016, 2015, and 2014, respectively. On February 10, 2015, the Company infused all outstanding advances amounting to P7.208 billion as equity.
b) Advances from PMC to PXP
PMC made cash advances to PXP Energy Corporation (PXP) for its additional working capital requirements, and for the acquisition of equity in FEP, PERC and Pitkin. As of December 31, 2016, 2015, and 2014, advances from PMC amounted to P2,194 billion, P2.194 billion, and P2.684 billion, respectively. On August 17, 2015, PX and PXP entered into a pledge agreement to secure the advances against certain shares of stocks owned by PXP.
c) Receivable from Anglo
PMC was reimbursed by Anglo American for expenses incurred by PMC on behalf of Northern Luzon Exploration & Mining Co. Inc. (“NLEMCI”) except in 2015 when no reimbursement was received. In 2016 and 2014, PMC received reimbursement of P2.6 million and P235 thousand, respectively. As of December 31, 2016, 2015, and 2014, the Company’s receivables from these transactions amounted to P217 thousand, P2.4 million, and P1.5 million, respectively.
d) Issuance of Convertible Bonds to FPC and SSS by SMECI In December 2014, SMECI and PMC, as the co-issuer, issued 8-year convertible bonds with a face value of P7.2 billion at 1.5% coupon rate p.a. payable semi-annually. The bonds are convertible into 400,000 common shares of SMECI at P18,000 per share one year after the issue date. The carrying value of loans payable amounted to P6.593 billion, P6.259 billion, and P5.947 billion as of December 31, 2016, 2015 and 2014, respectively.
Note 14 and 24 of the Notes to Consolidated Financial Statements of the Exhibits in Part V, Item 14 on Related Party Transactions, is incorporated hereto by reference.
PART IV
CORPORATE GOVERNANCE
Item 13. Corporate Governance
As a publicly-listed Philippine corporation, PMC conforms to the corporate governance rules, requirements, and regulations of the Philippine Securities and Exchange Commission (SEC), the Philippine Stock Exchange (PSE) and all pertinent government regulatory bodies. The Company is committed to the highest standards of corporate governance and continues to benchmark its procedures against internationally-recognized and globally-accepted best practices.
To ensure constant improvement, PMC monitors developments in corporate governance to elevate the Company’s corporate governance structures, processes, and practices to global standards. The Company also advocates an ethical corporate culture, guided by its core values of

64
integrity, teamwork, respect for individuals, work excellence, corporate as well as social and environment responsibility.
PMC has adopted a Manual of Corporate Governance (CG) and complies with the Code of
Corporate Governance of the SEC and Corporate Governance Guidelines and listing rules of the
PSE, and endeavors to raise its corporate governance practices in line with global best practices.
Based on SEC Memo Circular 20 Series of 2016, publicly-listed companies shall not be required
to post on their websites the Consolidated Changes in the ACGR for 2016 on or before January
10, 2017. Likewise, they shall not be required to attach the same to their 2016 Annual Report
(SEC Form-17A)
PART V
EXHIBITS AND SCHEDULES
Item 14. Exhibits and Reports on SEC Form 17-C
(a) Exhibits and Schedules
Statement of Management’s Responsibility for Financial Statements
Report of Independent Auditors
Audited Consolidated Financial Statements and Notes for the year ended December 31, 2016
Schedule I : Reconciliation of Retained Earnings Available for Dividends Declaration
Schedule II : Schedule of Financial Soundness Indicators
Schedule III : Chart Showing Ownership and Relationship between the Parent Company and
its Subsidiaries
Schedule IV : Schedule of All Effective Standards and Interpretations
Schedule V: Schedules as Required by SRC Rule 68, As Amended
Schedule A. Financial Assets
Schedule B. Amounts Receivable from Directors, Officers, Employees, Related Parties and
Principal Stockholders (Other than Related Parties)
Schedule C. Amounts Receivable from Related Parties which are Eliminated during the
Consolidation of Financial Statements
Schedule D. Intangible Assets – Other Assets (Deferred Mine Exploration Costs and Other
Noncurrent Assets)
Schedule E. Long Term Debt
Schedule F. Indebtedness to Related Parties (Long-term Loans from Related Companies)
Schedule G. Guarantees of Securities of Other Issuers
Schedule H. Capital Stock
Certificate on the Compilation Services for the Preparation of the Financial Statements and Notes to the Financial Statements

65
(b) Reports on SEC Form 17-C
There were thirty-three reports filed by the Company under SEC Form 17-C during the first
quarter of 2017 and the last nine months of 2016 covered up to filing of this report, part of which
follows:
Report Date Item Reported
March 01, 2017 Press release on Philex Mining’s 2016 Financial and
Operating Results; Publication of 2016 Philex Mining
Corporation and Subsidiaries Audited Financial
Statements; Declaration of cash dividends;
Amendment to Articles of Incorporation; Notice of
Annual Stockholders’ Meeting on June 28, 2017;
Appointment of three new SSS-nominated Directors to
the Philex Board of Directors
February 27, 2017 PMC Reply To DENR Show Cause Letter
February 22, 2017 Notice of Analysts’ Briefing on the Results for the Full
Year 2016 Financial and Operating Performance
February 2, 2017 Reply to Exchange Query re: material effects on the
business, operations and financial conditions of the
Company Statement of Department of Environment
and Natural Resources (DENR) Secretary Gina Lopez
January 4, 2017 Resignation of Atty. Bienvenido E. Laguesma as
Director
November 28, 2016 Clarification on news article “Philex Mining Corp. is
seen to gain from the weakening peso in terms of
higher earnings."
November 24, 2016 Resignation of Mr. Michael V. Alimurung as Director
October 27, 2016 Press Release on Results of Nine Months of 2016
Operating and Financial Performance; Resignation of
Mr. Juan B. Santos as Director
October 20, 2016 Notice of Analysts’ Briefing on the Results for the First
Nine months ended September 30, 2016
November 26, 2015 Appointment of Mr. Michael Victor N. Alimurung as
New Member of the Philex Mining Board of Directors
September 20, 2016 Change of corporate address
August 26, 2016 Formal Disclosure of Philex Mining’s 2015 Annual
Sustainability Report
August 4, 2016 Clarification of news article entitled “Production at
Silangan mine delayed anew”

66
July 28, 2016 Press Release on Results of First Half 2016 Operating
and Financial Performance; Declaration of Cash
Dividends
July 22, 2016 Notice of Analysts’ Briefing on the Results for the first
half ended June 30, 2016
June 30, 2016 Results of Organizational Meeting of Board of
Directors; Amendment to By Laws; Results of Annual
Stockholders' Meeting
June 24, 2016 SEC Approval of the property dividends
June 9, 2016 PSE disclosure on Silangan ISO 14001:2004
Certification
May 19, 2106 Amendment to notice of annual general stockholders'
meeting
May 17, 2016 Final Approval of the Amended Mining Project
Feasibility Study of Silangan Mindanao Mining Co.,
Inc.
April 28, 2016 Financial and operating results for the First Quarter
ended March 31, 2016
April 19, 2016 Notice of Analysts’ Briefing on the Results for the First
Quarter ended March 31, 2016
March 21, 2016 Clarification of the news article entitled “Philex defers
Padcal drilling to 2018”
March 17, 2016 Philex Mining Corp. Statement of Remaining
Resources and Reserves December 31, 2015


Philex Mining Corporation andSubsidiaries
Consolidated Financial StatementsDecember 31, 2016 and 2015and Years Ended December 31, 2016,2015 and 2014
and
Independent Auditor’s Report

*SGVFS014558*
INDEPENDENT AUDITOR’S REPORT
The Stockholders and the Board of DirectorsPhilex Mining Corporation
Report on the Audits of the Consolidated Financial Statements
Opinion
We have audited the consolidated financial statements of Philex Mining Corporation and its subsidiaries(“the Group”) which comprise the consolidated statements of financial position as at December 31, 2016and 2015, and the consolidated statements of comprehensive income, consolidated statements of changesin equity and consolidated statements of cash flows for each of the three years in the period endedDecember 31, 2016, and notes to the consolidated financial statements, including a summary ofsignificant accounting policies.
In our opinion, the accompanying consolidated financial statements present fairly, in all material respects,the consolidated financial position of the Group as at December 31, 2016 and 2015, and its consolidatedfinancial performance and its consolidated cash flows for each of the three years in the period endedDecember 31, 2016, in accordance with accounting principles generally accepted in the Philippinesapplied on the basis described in Note 2 to the consolidated financial statements.
Basis for Opinion
We conducted our audits in accordance with Philippine Standards on Auditing (PSA). Ourresponsibilities under those standards are further described in the Auditors’ Responsibilities for the Auditsof the Consolidated Financial Statements section of our report. We are independent of the Group inaccordance with the Code of Ethics for Professional Accountants in the Philippines (Code of Ethics)together with the ethical requirements that are relevant to our audits of the consolidated financialstatements in the Philippines, and we have fulfilled our other ethical responsibilities in accordance withthese requirements and the Code of Ethics. We believe that the audit evidence we have obtained issufficient and appropriate to provide a basis for our opinion.
Key Audit Matters
Key audit matters are those matters that, in our professional judgement, were of most significance in ouraudit of the consolidated financial statements of the current year. These matters were addressed in thecontext of our audit of the consolidated financial statements as a whole, and in forming our opinionthereon, and we do not provide a separate opinion on these matters. For each matter below, ourdescription of how our audit addressed the matter is provided in that context.
SyCip Gorres Velayo & Co.6760 Ayala Avenue1226 Makati CityPhilippines
Tel: (632) 891 0307Fax: (632) 819 0872ey.com/ph
BOA/PRC Reg. No. 0001, December 14, 2015, valid until December 31, 2018SEC Accreditation No. 0012-FR-4 (Group A), November 10, 2015, valid until November 9, 2018
A member firm of Ernst & Young Global Limited

*SGVFS014558*
- 2 -
We have fulfilled the responsibilities described in the Auditors’ Responsibilities for the Audit of theConsolidated Financial Statements section of our report, including in relation to these matters.Accordingly, our audit included the performance of procedures designed to respond to our assessment ofthe risks of material misstatement of the consolidated financial statements. The results of our auditprocedures, including the procedures performed to address the matters below, provide the basis for ouraudit opinion on the accompanying consolidated financial statements.
Recoverability of Deferred Mine Exploration Costs
The ability of the Group to recover its deferred exploration costs depends on the commercial viability ofthe mineral resources. The carrying values of deferred exploration costs amounted toP=23.07 billion as at December 31, 2016, which is about 60% of the Group’s consolidated total assets. Thesubstantial amount of this account, the level of additions during the year, and the significant managementjudgment required when performing an impairment review are key areas of focus in our audit(see Note 13).
Audit response
We obtained an understanding of the Group’s capitalization policy and tested whether the policy has beenapplied consistently. We obtained management’s assessment on the recoverability of the deferredexploration costs and inquired into the status of these projects and their plans on operations. Weinspected the licenses, permits and correspondences with regulatory agencies (see Note 34) of eachexploration project to determine that the period, for which the Group has the right to explore in thespecific area, has not been cancelled or has not expired, will not expire in the near future, and will berenewed accordingly. We also inquired about the existing concession areas that are expected to beabandoned or any exploration activities that are planned to be discontinued in those areas.
Loss of control over PXP Energy Corporation
On February 29, 2016, Philex Mining Corporation declared its shares of stock on PXP EnergyCorporation (PXP), a subsidiary, as dividends to its shareholders as of March 15, 2016 record date,resulting to the reduction of Philex Mining Corporation’s interest in PXP from about 65% to about 20%.Due to the loss of control, Philex Mining Corporation has deconsolidated PXP and accounted theremaining interest as investment in associate starting July 15, 2016. PXP is considered as a significantsegment of the Group, and the accounting treatment for the transaction is complex. Therefore, weconsidered this as a key audit matter (see Note 33).
Audit response
We reviewed the valuation of PXP shares distributed as property dividends and performed recalculationof the gain on deconsolidation. We analyzed the transaction and examined the deconsolidationprocedure. Furthermore, we assessed the adequacy of the disclosures with respect to the deconsolidationdue to loss of control of a subsidiary.
A member firm of Ernst & Young Global Limited

*SGVFS014558*
- 3 -
Estimation of Ore Reserves and Resources
The estimation of ore reserves and resources involves significant management estimates and assumptions.Reserves and resources are key inputs to depletion, depreciation, amortization and decommissioningprovisions. As discussed in Note 10 to the consolidated financial statements, the Group’s miningproperties amounting to P=3.57 billion as of December 31, 2016 are amortized using the units ofproduction method. This matter is significant to our audit because the estimation of the mineable orereserves for Padcal mine requires significant estimation from management.
Audit response
We obtained an understanding of management’s processes and controls in the estimation of mineable orereserves. We evaluated the competence and objectivity of the management’s specialist to perform anindependent assessment of its ore reserves and resources. We reviewed the specialist’s report andobtained an understanding of the nature, scope and objectives of their work and basis of the estimatesincluding any changes in the reserves during the year. In addition, we tested the reserves and resourcesestimates applied to the relevant areas of the consolidated financial statements including depletion,depreciation, amortization and decommissioning provisions.
Other Information
Management is responsible for the other information. The other information comprises the informationincluded in the SEC Form 20-IS (Definitive Information Statement), SEC Form 17-A and Annual Reportfor the year ended December 31, 2016, but does not include the financial statements and our auditor’sreport thereon. The SEC Form 20-IS (Definitive Information Statement), SEC Form 17-A and AnnualReport for the year ended December 31, 2016 are expected to be made available to us after the date of thisauditor’s report.
Our opinion on the financial statements does not cover the other information and we will not express anyform of assurance conclusion thereon.
In connection with our audits of the financial statements, our responsibility is to read the otherinformation identified above when it becomes available and, in doing so, consider whether the otherinformation is materially inconsistent with the financial statements or our knowledge obtained in theaudits or otherwise appears to be materially misstated.
Responsibilities of Management and Board of Directors (BOD) for the Consolidated FinancialStatements
Management is responsible for the preparation and fair presentation of the consolidated financialstatements in accordance with accounting principles generally accepted in the Philippines applied on thebasis described in Note 2 to the consolidated financial statements, and for such internal control asmanagement determines is necessary to enable the preparation of consolidated financial statements thatare free from material misstatement, whether due to fraud or error.
In preparing the consolidated financial statements, management is responsible for assessing the Group’sability to continue as a going concern, disclosing, as applicable, matters related to going concern andusing the going concern basis of accounting unless management either intends to liquidate the Group or tocease operations, or has no realistic alternative but to do so.
A member firm of Ernst & Young Global Limited

*SGVFS014558*
- 4 -
The BOD is responsible for overseeing the Group’s financial reporting process.
Auditors’ Responsibilities for the Audits of the Consolidated Financial Statements
Our objectives are to obtain reasonable assurance about whether the consolidated financial statements as awhole are free from material misstatement, whether due to fraud or error, and to issue an auditor’s reportthat includes our opinion. Reasonable assurance is a high level of assurance, but is not a guarantee that anaudit conducted in accordance with PSA will always detect a material misstatement when it exists.Misstatements can arise from fraud or error and are considered material if, individually or in theaggregate, they could reasonably be expected to influence the economic decisions of users taken on thebasis of these consolidated financial statements.
As part of an audit in accordance with PSA, we exercise professional judgment and maintain professionalskepticism throughout the audit. We also:
∂ Identify and assess the risks of material misstatement of the consolidated financial statements,whether due to fraud or error, design and perform audit procedures responsive to those risks, andobtain audit evidence that is sufficient and appropriate to provide a basis for our opinion. The risk ofnot detecting a material misstatement resulting from fraud is higher than for one resulting from error,as fraud may involve collusion, forgery, intentional omissions, misrepresentations, or the override ofinternal control.
∂ Obtain an understanding of internal control relevant to the audit in order to design audit proceduresthat are appropriate in the circumstances, but not for the purpose of expressing an opinion on theeffectiveness of the Group’s internal control.
∂ Evaluate the appropriateness of accounting policies used and the reasonableness of accountingestimates and related disclosures made by management.
∂ Conclude on the appropriateness of management’s use of the going concern basis of accounting and,based on the audit evidence obtained, whether a material uncertainty exists related to events orconditions that may cast significant doubt on the Group’s ability to continue as a going concern. Ifwe conclude that a material uncertainty exists, we are required to draw attention in our auditor’sreport to the related disclosures in the consolidated financial statements or, if such disclosures areinadequate, to modify our opinion. Our conclusions are based on the audit evidence obtained up tothe date of our auditor’s report. However, future events or conditions may cause the Group to ceaseto continue as a going concern.
∂ Evaluate the overall presentation, structure and content of the consolidated financial statements,including the disclosures, and whether the consolidated financial statements represent the underlyingtransactions and events in a manner that achieves fair presentation.
A member firm of Ernst & Young Global Limited

*SGVFS014558*
- 5 -
We communicate with the BOD regarding, among other matters, the planned scope and timing of theaudit and significant audit findings, including any significant deficiencies in internal control that weidentify during our audit.
We also provide those charged with governance with a statement that we have complied with relevantethical requirements regarding independence, and to communicate with them all relationships and othermatters that may reasonably be thought to bear on our independence, and where applicable, relatedsafeguards.
From the matters communicated with those charged with governance, we determine those matters thatwere of most significance in the audit of the consolidated financial statements of the current period andare therefore the key audit matters. We describe these matters in our auditor’s report unless law orregulation precludes public disclosure about the matter or when, in extremely rare circumstances, wedetermine that a matter should not be communicated in our report because the adverse consequences ofdoing so would reasonably be expected to outweigh the public interest benefits of such communication.
The engagement partner on the audit resulting in this independent auditor’s report isJose Pepito E. Zabat III.
SYCIP GORRES VELAYO & CO.
Jose Pepito E. Zabat IIIPartnerCPA Certificate No. 85501SEC Accreditation No. 0328-AR-3 (Group A), May 1, 2015, valid until April 30, 2018Tax Identification No. 102-100-830BIR Accreditation No. 08-001998-60-2015, February 27, 2015, valid until February 26, 2018PTR No. 5908781, January 3, 2017, Makati City
February 28, 2017
A member firm of Ernst & Young Global Limited

*SGVFS014558*
PHILEX MINING CORPORATION AND SUBSIDIARIESCONSOLIDATED STATEMENTS OF FINANCIAL POSITION(Amounts in Thousands, Except Par Value Per Share)
December 312016 2015
ASSETSCurrent AssetsCash and cash equivalents (Note 6) P=457,937 P=1,008,686Accounts receivable (Note 7) 486,497 897,479Inventories (Note 8) 2,318,850 1,886,544Advances to a related party (Note 24) 2,193,829 –Other current assets (Note 9) 1,437,752 1,478,748Total Current Assets 6,894,865 5,271,457
Noncurrent AssetsProperty, plant and equipment (Note 10) 6,735,578 6,828,052Deferred exploration costs and other noncurrent assets (Notes 1, 13 and 18) 23,158,325 29,153,010Available-for-sale (AFS) financial assets (Note 11) 104,615 106,687Investment in associates (Notes 12 and 33) 1,455,876 659,408Pension asset - net (Note 19) 312,570 263,867Goodwill (Notes 4 and 33) – 1,238,583Deferred income tax assets - net (Note 25) – 5,992Total Noncurrent Assets 31,766,964 38,255,599
TOTAL ASSETS P=38,661,829 P=43,527,056
LIABILITIES AND EQUITYCurrent LiabilitiesLoans payable (Note 14) P=3,082,640 P=3,317,730Accounts payable and accrued liabilities (Notes 15 and 31) 1,832,661 1,904,488Income tax payable (Note 25) 164,265 13,014Dividends payable (Note 26) 498,129 479,652Total Current Liabilities 5,577,695 5,714,884
Noncurrent LiabilitiesDeferred income tax liabilities - net (Notes 4 and 25) 2,957,896 3,939,160Loans and bonds payable (Note 14) 6,592,854 6,259,063Provision for losses and mine rehabilitation costs (Notes 10 and 31) 134,124 330,047Total Noncurrent Liabilities 9,684,874 10,528,270
Total Liabilities 15,262,569 16,243,154
Equity Attributable to Equity Holders of the Parent CompanyCapital stock - P=1 par value (Note 26) 4,940,399 4,940,399Additional paid-in capital 1,143,981 1,142,722Retained earnings (Note 26) Unappropriated 4,442,436 5,496,271 Appropriated 10,000,000 10,000,000Net unrealized loss on AFS financial assets (Note 11) (3,094) (1,022)Equity conversion option (Note 14) 1,225,518 1,225,518Cumulative translation adjustments – 124,334Net revaluation surplus (Note 4 and 33) 1,572,385 1,611,397Effect of transactions with non-controlling interests 77,892 23,164
23,399,517 24,562,783Non-controlling interests (Note 26) (257) 2,721,119Total Equity 23,399,260 27,283,902
TOTAL LIABILITIES AND EQUITY P=38,661,829 P=43,527,056
See accompanying Notes to Consolidated Financial Statements.

*SGVFS014558*
PHILEX MINING CORPORATION AND SUBSIDIARIESCONSOLIDATED STATEMENTS OF INCOME(Amounts in Thousands, Except Earnings per Share)
Years Ended December 312016 2015 2014
REVENUEGold P=6,209,006 P=5,669,860 P=5,889,107Copper 3,976,184 3,449,799 4,615,092Silver and others 86,475 69,723 82,464
10,271,665 9,189,382 10,586,663Less smelting charges 893,278 836,597 849,837
9,378,387 8,352,785 9,736,826
COSTS AND EXPENSES (Note 16)Production costs (including depletion and depreciation) 6,074,862 6,160,352 6,808,252General and administrative expenses 373,123 414,255 674,395Excise taxes and royalties 452,415 436,856 506,654
6,900,400 7,011,463 7,989,301
OTHER INCOME (CHARGES)Foreign exchange losses - net (Note 21) (145,213) (158,697) (56,484)Share in net losses of associates (Note 12) (44,572) (13,200) –Interest income (Note 6) 2,081 4,085 5,182Gain on disposal of AFS financial assets (Note 11) – 107,088 –Interest expense (Note 14) – − (349,447)Gain on sale of property, plant and equipment (Note 10) – − 764,685Others - net (Notes 1, 13, 21 and 31) (14,439) 5,642 (323,836)
(202,143) (55,082) 40,100
INCOME BEFORE PROVISIONS FOR IMPAIRMENTLOSSES 2,275,844 1,286,240 1,787,625
PROVISIONS FOR IMPAIRMENTLOSSES - NET (Notes 12 and 13) (2,504,850) − (231,401)
INCOME (LOSS) BEFORE INCOME TAX (229,006) 1,286,240 1,556,224
PROVISION FOR (BENEFIT FROM) INCOME TAX(Note 25)
Current 586,483 245,550 421,108Deferred 110,742 121,030 (78,626)
697,225 366,580 342,482
(926,231) 919,660 1,213,742
INCOME (LOSS) ON DECONSOLIDATED SUBSIDIARYGROUP, NET OF TAX (Note 33)
Loss from deconsolidated subsidiary group (29,102) (144,025) (510,897)Gain from loss of control over a subsidiary group 2,522,704 – –
2,493,602 (144,025) (510,897)
NET INCOME P=1,567,371 P=775,635 P=702,845
Net Income (Loss) Attributable to:Equity holders of the Parent Company P=1,589,045 P=896,181 P=1,005,552Non-controlling interests (Note 26) (21,674) (120,546) (302,707)
P=1,567,371 P=775,635 P=702,845
Basic Earnings Per Share (Note 28) P=0.322 P=0.181 P=0.204
Diluted Earnings Per Share (Note 28) P=0.322 P=0.181 P=0.204
See accompanying Notes to Consolidated Financial Statements.

*SGVFS014558*
PHILEX MINING CORPORATION AND SUBSIDIARIESCONSOLIDATED STATEMENTS OF COMPREHENSIVE INCOME(Amounts in Thousands)
Years Ended December 312016 2015 2014
NET INCOME P=1,567,371 P=775,635 P=702,845
OTHER COMPREHENSIVE INCOME (LOSS)Items to be reclassified to profit or loss in subsequent periods: Unrealized loss on AFS financial assets - net of related
deferred income tax (Note 11) (2,072) (23,023) (68,699)Reversal of fair value changes in AFS investment
subsequently accounted for as an associate (Note 11) – 193,099 – Gain on translation of foreign subsidiaries – 147,278 7,655
Realized gain on sale of AFS financial assets (Note 11) – (107,088) – Realized loss on fair value of hedging instruments transferred
to the consolidated statements of income - net of related deferred income tax (Note 21) – (7,766) –
Gain on fair value of derivative (Note 21) – – 7,766(2,072) 202,500 (53,278)
Items not to be reclassified to profit or loss in subsequent periods:Remeasurement gains (losses) on pension obligation
plans - net of income tax effect (Note 19) (98,319) (22,316) (40,054)Income tax effect 29,496 6,695 12,016
(68,823) (15,621) (28,038)
OTHER COMPREHENSIVE INCOME (LOSS) (70,895) 186,879 (81,316)
TOTAL COMPREHENSIVE INCOME P=1,496,476 P=962,514 P=621,529
Total Comprehensive Income (Loss) Attributable to:Equity holders of the Parent Company P=1,518,150 P=1,033,019 P=921,823Non-controlling interests (Note 26) (21,674) (70,505) (300,294)
P=1,496,476 P=962,514 P=621,529
See accompanying Notes to Consolidated Financial Statements.

*SGVFS014558*
PHILEX MINING CORPORATION AND SUBSIDIARIESCONSOLIDATED STATEMENTS OF CHANGES IN EQUITYFOR THE YEARS ENDED DECEMBER 31, 2016, 2015 AND 2014(Amounts in Thousands)
Equity Attributable to Equity Holders of the Parent Company
CapitalStock
AdditionalPaid-In Retained Earnings (Note 26)
NetUnrealized
Gain (Loss)on AFS
FinancialAssets
EquityConversion
OptionCumulativeTranslation
NetRevaluation
Surplus
Effect ofTransactions
withNon-
controllingInterests
Non-controlling
Interests(Note 26) Capital Unappropriated Appropriated (Notes 11) (Note 14) Adjustments (Note 4) (Note 2) Subtotal (Note 26) Total
BALANCES AT DECEMBER 31, 2013 P=4,936,996 P=1,058,497 P=4,128,826 P=10,000,000 P=4,689 P=– P=25,116 P=1,611,397 P=45,099 P=21,810,620 P=4,106,634 P=25,917,254Net income (loss) – – 1,005,552 – – – – – – 1,005,552 (302,707) 702,845Other comprehensive income (loss):Items to be reclassified to profit or loss in
subsequent periods: Unrealized loss on AFS financial
assets - net of related deferredincome tax (Note 11) – – – – (68,699) – – – – (68,699) – (68,699)
Gain on translation of foreign subsidiaries – – – – – – 4,488 – – 4,488 3,167 7,655Items not to be reclassified to profit or loss in
subsequent periods:Remeasurements of pension obligation, net
of tax (Note 19) – – (27,283) – – – – – – (27,283) (755) (28,038) Gain on fair value of derivative – – – – – – 7,766 – – 7,766 – 7,766Total comprehensive income – – 978,269 – (68,699) – 12,254 – – 921,824 (300,295) 621,529Increase in paid-in capital due to exercise of
stock option (Note 27) 3,403 33,322 – – – – – – – 36,725 – 36,725Increase in additional paid-in capital due to stock
option plan (Note 27) – 25,808 – – – – – – – 25,808 – 25,808Sale of PXP shares – – – – – – – – 259 259 193 452Share buyback transaction (Note 2) – – – – – – – – (26,274) (26,274) (364,129) (390,403)Equity conversion options (Note 14) – – – – – 1,225,518 – – – 1,225,518 – 1,225,518Declaration of cash dividends (Note 26) – – (395,063) – – – – – – (395,063) – (395,063)
BALANCES AT DECEMBER 31, 2014 P=4,940,399 P=1,117,627 P=4,712,032 P=10,000,000 (P=64,010) P=1,225,518 P=37,370 P=1,611,397 P=19,084 P=23,599,417 P=3,442,403 P=27,041,820

*SGVFS014558*
- 2 -
Equity Attributable to Equity Holders of the Parent Company
CapitalStock
AdditionalPaid-In Retained Earnings (Note 26)
NetUnrealized
Gain (Loss)on AFS
FinancialAssets
EquityConversion
OptionCumulativeTranslation
NetRevaluation
Surplus
Effect ofTransactions
withNon-
controllingInterests
Non-controlling
Interests(Note 26) Capital Unappropriated Appropriated (Notes 11) (Note 14) Adjustments (Note 2) (Note 2) Subtotal (Note 26) Total
BALANCES AT DECEMBER 31, 2014 P=4,940,399 P=1,117,627 P=4,712,032 P=10,000,000 (P=64,010) P=1,225,518 P=37,370 P=1,611,397 P=19,084 P=23,599,417 P=3,442,403 P=27,041,820Net income (loss) – – 896,181 – – – – – – 896,181 (120,546) 775,635Other comprehensive income (loss):Items to be reclassified to profit or loss in
subsequent periods: Unrealized loss on AFS financial
assets - net of related deferredincome tax (Note 11) – – – – (23,023) – – – – (23,023) – (23,023)
Reversal of fair value changes in AFSinvestment subsequently accountedfor as an associate (Note 11) – – – – 193,099 – – – – 193,099 – 193,099
Realized gain on sale of AFS financial assets(Note 11) – – – – (107,088) – – – – (107,088) – (107,088)
Realized loss on fair value of hedginginstruments – – – – – – (7,766) – – (7,766) – (7,766)
Gain on translation of foreign subsidiaries – – – – – – 94,730 – – 94,730 52,548 147,278Items not to be reclassified to profit or loss in
subsequent periods:Remeasurements of pension obligation, net
of tax (Note 19) – – (13,114) – – – – – – (13,114) (2,507) (15,621)Total comprehensive income – – 883,067 – 62,988 – 86,964 – – 1,033,019 (70,505) 962,514Increase in additional paid-in capital due to stock
option plan (Note 27) – 25,095 – – – – – – – 25,095 – 25,095Share buyback transaction (Note 2) – – – – – – – – 4,080 4,080 (650,779) (646,699)Declaration of cash dividends (Note 26) – – (98,828) – – – – – – (98,828) – (98,828)
BALANCES AT DECEMBER 31, 2015 P=4,940,399 P=1,142,722 P=5,496,271 P=10,000,000 (P=1,022) P=1,225,518 P=124,334 P=1,611,397 P=23,164 P=24,562,783 P=2,721,119 P=27,283,902

*SGVFS014558*
- 3 -
Equity Attributable to Equity Holders of the Parent Company
CapitalStock
AdditionalPaid-In Retained Earnings (Note 26)
NetUnrealized
Gain (Loss)on AFS
FinancialAssets
EquityConversion
OptionCumulativeTranslation
NetRevaluation
Surplus(Notes 4
Effect ofTransactions
withNon-
controllingInterests
Non-controlling
Interests(Note 26) Capital Unappropriated Appropriated (Notes 11) (Note 14) Adjustments and 33) (Note 2) Subtotal (Note 26) Total
BALANCES AT DECEMBER 31, 2015 P=4,940,399 P=1,142,722 P=5,496,271 P=10,000,000 (P=1,022) P=1,225,518 P=124,334 P=1,611,397 P=23,164 P=24,562,783 P=2,721,119 P=27,283,902Net income (loss) – – 1,589,045 – – – – – – 1,589,045 (21,674) 1,567,371Other comprehensive income (loss): -Items to be reclassified to profit or loss in
subsequent periods: Unrealized loss on AFS financial
assets - net of related deferredincome tax (Note 11) – – – – (2,072) – – – – (2,072) – (2,072)
Items not to be reclassified to profit or loss insubsequent periods:Remeasurements of pension obligation, net
of tax (Note 19) – – (68,823) – – – – – – (68,823) – (68,823)Total comprehensive income – – 1,520,222 – (2,072) – – – – 1,518,150 (21,674) 1,496,476Increase in additional paid-in capital due to stock
option plan (Note 27) – 1,259 – – – – – – – 1,259 – 1,259Deconsolidation of a subsidiary group (Note 33) – – 121,946 – – – (124,334) (39,012) 54,728 13,328 (2,699,702) (2,686,374)Declaration of dividends (Note 26) – – (2,696,003) – – – – – – (2,696,003) – (2,696,003)
BALANCES AT DECEMBER 31, 2016 P=4,940,399 P=1,143,981 P=4,442,436 P=10,000,000 (P=3,094) P=1,225,518 P=– P=1,572,385 P=77,892 P=23,399,517 (P=257) P=23,399,260See accompanying Notes to Consolidated Financial Statements.

*SGVFS014558*
PHILEX MINING CORPORATION AND SUBSIDIARIESCONSOLIDATED STATEMENTS OF CASH FLOWS(Amounts in Thousands)
Years Ended December 312016 2015 2014
CASH FLOWS FROM OPERATING ACTIVITIESIncome before income tax from continuing operations (P=229,006) P=1,286,240 P=1,556,224Loss before income tax from discontinued operations (Note 33) 2,464,064 (144,009) (501,942)Income before income tax 2,235,058 1,142,231 1,054,282Adjustments for: Depletion and depreciation (Note 18) 1,481,405 1,568,431 1,690,556 Gain on loss of control over a subsidiary (Note 33) (2,522,704) – – Gain on disposal of AFS financial assets (Note 11) – (107,088) –
Impairment losses on deferred exploration costs and otherassets - net (Notes 12 and 13) 2,504,850 − 231,401
Share-based compensation expense (Note 27) 1,259 25,095 25,808Share in net losses of associates (Note 12) 44,572 13,200 −
Interest income (Note 6) (3,980) (11,529) (16,952) Interest expense (Note 14) – − 354,461 Gain on sale of property, plant and equipment (Note 10) – − (764,685) Reorganization costs (Note 31) – – 394,154 Movement in pension assets - net (48,703) 32,942 (79,383) Unrealized foreign exchange losses and others - net 268,353 199,964 98,778Operating income before working capital changes 3,960,110 2,863,246 2,988,420Decrease (increase) in: Accounts receivable 295,002 156,711 (761,700) Inventories (441,350) (28,324) 810,054 Other current assets 50,760 (102,007) (33,496)Decrease in: Accounts payable and accrued liabilities (55,086) (685,502) (834,052)Cash generated from operations 3,809,436 2,204,124 2,169,226Interest received 3,973 13,497 18,574Interest paid (631,374) (512,719) (352,474)Income taxes paid (435,232) (279,975) (385,680)Net cash flows from operating activities 2,746,803 1,424,927 1,449,646
CASH FLOWS FROM INVESTING ACTIVITIESIncrease in deferred exploration costs and other
noncurrent assets (356,576) (2,628,256) (3,138,805)Additions to property, plant and equipment (Note 10) (1,735,034) (1,389,710) (2,353,691)Net proceeds from sale of: Property, plant and equipment 33,287 – 764,685 AFS financial assets – 297,462 –Share buyback of Pitkin (Note 1) – (646,699) (395,734)Cash from deconsolidated subsidiary group (Note 33) (606,585) – –Net cash flows used in investing activities (2,664,908) (4,367,203) (5,123,545)
(Forward)
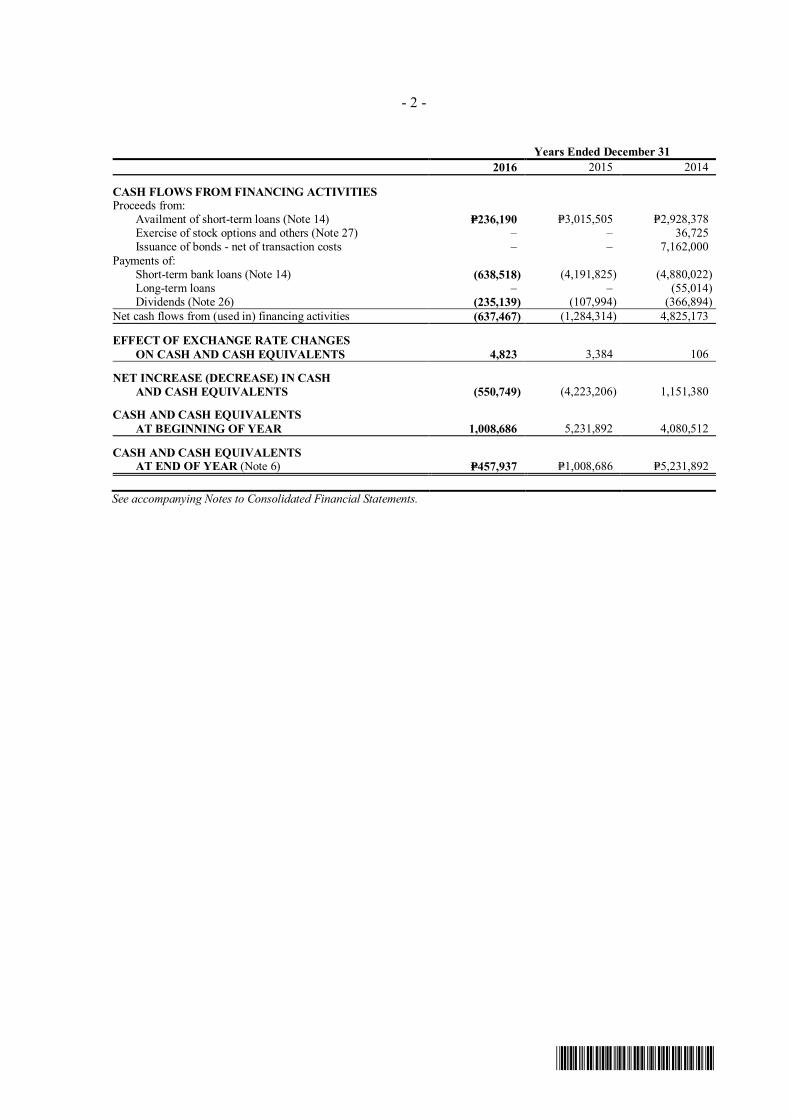
*SGVFS014558*
- 2 -
Years Ended December 312016 2015 2014
CASH FLOWS FROM FINANCING ACTIVITIESProceeds from: Availment of short-term loans (Note 14) P=236,190 P=3,015,505 P=2,928,378 Exercise of stock options and others (Note 27) – – 36,725 Issuance of bonds - net of transaction costs – – 7,162,000Payments of: Short-term bank loans (Note 14) (638,518) (4,191,825) (4,880,022) Long-term loans – – (55,014) Dividends (Note 26) (235,139) (107,994) (366,894)Net cash flows from (used in) financing activities (637,467) (1,284,314) 4,825,173
EFFECT OF EXCHANGE RATE CHANGESON CASH AND CASH EQUIVALENTS 4,823 3,384 106
NET INCREASE (DECREASE) IN CASHAND CASH EQUIVALENTS (550,749) (4,223,206) 1,151,380
CASH AND CASH EQUIVALENTSAT BEGINNING OF YEAR 1,008,686 5,231,892 4,080,512
CASH AND CASH EQUIVALENTSAT END OF YEAR (Note 6) P=457,937 P=1,008,686 P=5,231,892
See accompanying Notes to Consolidated Financial Statements.

*SGVFS014558*
PHILEX MINING CORPORATION AND SUBSIDIARIESNOTES TO CONSOLIDATED FINANCIAL STATEMENTS(Amounts in Thousands, Except Amounts Per Unit and Number of Shares)
1. Corporate Information, Business Operations and Authorization for Issuance of theFinancial Statements
Corporate InformationPhilex Mining Corporation and its subsidiaries (collectively referred to as “the Group”) areorganized into two main business groupings: the mining and metals business under Philex MiningCorporation (the Parent Company or PMC), and the energy and hydrocarbon business under PXPEnergy Corporation “PXP” (formerly Philex Petroleum Corporation), but not until July 15, 2016,where PXP and its subsidiaries ceased to be subsidiaries as a result of loss on control throughproperty dividend declaration (see Notes 26 and 33). Thus, as at December 31, 2016, the Group’smining and metals business remains as its only business segment.
Philex Mining Corporation was incorporated on July 19, 1955 in the Philippines and is listed in thePhilippine Stock Exchange on November 23, 1956. Having reached the end of its 50 years corporatelife, the Parent Company’s Philippine Securities and Exchange Commission (SEC) registration wasrenewed on July 23, 2004. The Parent Company, Philex Gold Philippines, Inc. (PGPI, a wholly-owned subsidiary incorporated in the Philippines), Lascogon Mining Corporation (LMC), (asubsidiary of PGPI and incorporated in the Philippines), and Silangan Mindanao Exploration Co.,Inc. (SMECI, a wholly-owned subsidiary directly by the Parent Company and incorporated in thePhilippines) and its subsidiary, Silangan Mindanao Mining Co. Inc. (SMMCI, a wholly-ownedsubsidiary by the Parent Company and through SMECI, and incorporated in the Philippines) are allprimarily engaged in large-scale exploration, development and utilization of mineral resources. TheParent Company operates the Padcal Mine in Benguet. PGPI operated the Bulawan mine in NegrosOccidental until the second quarter of 2002. LMC conducts exploration work in Taganaan, Surigaodel Norte. SMMCI owns the Silangan Project covering the Boyongan and Bayugo deposits.
PXP Energy Corporation (a 64.7% owned subsidiary of the Parent Company until July 15, 2016 andincorporated in the Philippines) and its subsidiaries: Forum Energy Plc (FEP, 58.9% owned andregistered in England and Wales) and its subsidiaries, Pitkin Petroleum Plc. (PPP, 53.4% owned andincorporated and registered in United Kingdom of Great Britain and Northern Ireland) and itssubsidiaries, and FEC Resources, Inc. (FEC, 54.99% owned and incorporated in Canada) areengaged primarily in oil and gas operation and exploration activities, holding participations in oiland gas production and exploration activities through their investee companies. On July 15, 2016,the Parent Company’s ownership interest over PXP was reduced to 19.8% as a result of propertydividend (see Notes 26 and 33).
The Group’s income is derived mainly from the Padcal Mine. Income from petroleum and coal andother sources are relatively insignificant.
The Parent Company’s registered business address is 2nd floor LaunchPad, Reliance cor SheridanStreets, Mandaluyong City, Metro Manila.
Status of Business Operations - Mining and MetalsPadcal Mine OperationsThe Parent Company has the Padcal Mine as its main source of revenue from its metals businesssegment. The Padcal Mine is on its 60th year of operation producing copper concentrates containinggold, copper and silver.
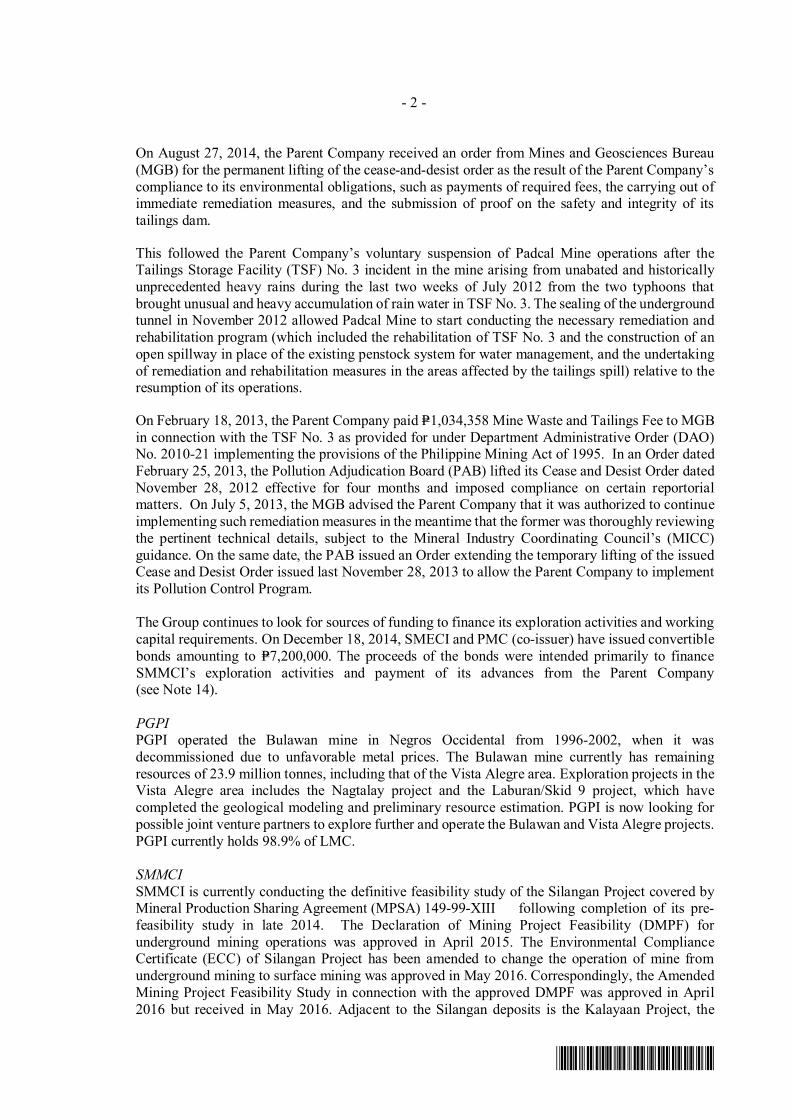
- 2 -
*SGVFS014558*
On August 27, 2014, the Parent Company received an order from Mines and Geosciences Bureau(MGB) for the permanent lifting of the cease-and-desist order as the result of the Parent Company’scompliance to its environmental obligations, such as payments of required fees, the carrying out ofimmediate remediation measures, and the submission of proof on the safety and integrity of itstailings dam.
This followed the Parent Company’s voluntary suspension of Padcal Mine operations after theTailings Storage Facility (TSF) No. 3 incident in the mine arising from unabated and historicallyunprecedented heavy rains during the last two weeks of July 2012 from the two typhoons thatbrought unusual and heavy accumulation of rain water in TSF No. 3. The sealing of the undergroundtunnel in November 2012 allowed Padcal Mine to start conducting the necessary remediation andrehabilitation program (which included the rehabilitation of TSF No. 3 and the construction of anopen spillway in place of the existing penstock system for water management, and the undertakingof remediation and rehabilitation measures in the areas affected by the tailings spill) relative to theresumption of its operations.
On February 18, 2013, the Parent Company paid P=1,034,358 Mine Waste and Tailings Fee to MGBin connection with the TSF No. 3 as provided for under Department Administrative Order (DAO)No. 2010-21 implementing the provisions of the Philippine Mining Act of 1995. In an Order datedFebruary 25, 2013, the Pollution Adjudication Board (PAB) lifted its Cease and Desist Order datedNovember 28, 2012 effective for four months and imposed compliance on certain reportorialmatters. On July 5, 2013, the MGB advised the Parent Company that it was authorized to continueimplementing such remediation measures in the meantime that the former was thoroughly reviewingthe pertinent technical details, subject to the Mineral Industry Coordinating Council’s (MICC)guidance. On the same date, the PAB issued an Order extending the temporary lifting of the issuedCease and Desist Order issued last November 28, 2013 to allow the Parent Company to implementits Pollution Control Program.
The Group continues to look for sources of funding to finance its exploration activities and workingcapital requirements. On December 18, 2014, SMECI and PMC (co-issuer) have issued convertiblebonds amounting to P=7,200,000. The proceeds of the bonds were intended primarily to financeSMMCI’s exploration activities and payment of its advances from the Parent Company(see Note 14).
PGPIPGPI operated the Bulawan mine in Negros Occidental from 1996-2002, when it wasdecommissioned due to unfavorable metal prices. The Bulawan mine currently has remainingresources of 23.9 million tonnes, including that of the Vista Alegre area. Exploration projects in theVista Alegre area includes the Nagtalay project and the Laburan/Skid 9 project, which havecompleted the geological modeling and preliminary resource estimation. PGPI is now looking forpossible joint venture partners to explore further and operate the Bulawan and Vista Alegre projects.PGPI currently holds 98.9% of LMC.
SMMCISMMCI is currently conducting the definitive feasibility study of the Silangan Project covered byMineral Production Sharing Agreement (MPSA) 149-99-XIII following completion of its pre-feasibility study in late 2014. The Declaration of Mining Project Feasibility (DMPF) forunderground mining operations was approved in April 2015. The Environmental ComplianceCertificate (ECC) of Silangan Project has been amended to change the operation of mine fromunderground mining to surface mining was approved in May 2016. Correspondingly, the AmendedMining Project Feasibility Study in connection with the approved DMPF was approved in April2016 but received in May 2016. Adjacent to the Silangan deposits is the Kalayaan Project, the

- 3 -
*SGVFS014558*
exploration of which is being undertaken by the Parent Company by virtue of a Farm-in Agreementwith Kalayaan Gold & Copper Resources, Inc., a subsidiary of Manila Mining Corporation (MMC)(see Note 29).
Status of Business Operations - Energy and HydrocarbonPXP and its subsidiariesPXP was a Parent Company’s subsidiary until July 2016 when it was deconsolidated following itsdistribution as a property dividend (Notes 26 and 33).
PPP, PXP and FEP, through its subsidiaries, has various participating interests in petroleum servicecontracts as follows:
Participating InterestService Contract Pitkin PXP FEPSC 6 (Cadlao Block) – 1.65% –SC 6A (Octon Block) – 5.56%1 5.56%1
SC 6B (Bonita Block) – – 7.03%SC 14 (Tara PA) – – 10.00%SC 14 Block A (Nido) – – 8.47%SC 14 Block B (Matinloc) – – 12.41%SC 14 Block B-1 (North Matinloc) – – 19.46%SC 14 Block C (Galoc) – – 2.28%SC 14 Block C-2 (West Linapacan) 1 – – 9.10%SC 14 Block D (Retention Block) – – 8.17%SC 40 (North Cebu Block) – – 100.00%SC 53 (Mindoro) – – –SC 72 (Reed Bank) – – 70.00%SC 74 (Linapacan) 2 – 70.00% –SC 75 Area 4 (Northwest Palawan) – 50.00% –Peru Block Z-38 25.00% – –
1 On October 24, 2016, the DOE has approved the Purchase and Sale Agreement (PSA) and Deed of Assignment (DOA)dated April 27, 2016 transferring the 70% interest of Pitkin Petroleum (Philippines) Plc to Mindoro-Palawan Oiland Gas, Inc. (MPOGI).
2 On April 25, 2016, the DOE has approved the PSA and DOA dated February 24, 2016 transferring the 70% interest andoperatorship of Pitkin Petroleum (Philippines) Plc to PXP.
FEP and its Subsidiaries FEP’s principal asset is a 70% interest in Service Contract (SC) 72 which covers an area of 8,800square kilometers in the West Philippine Sea. FEP is scheduled to accomplish its secondsub-phase of exploration activities from August 2011 to August 2013. However, due to maritimedisputes between the Philippine and Chinese governments, exploration activities in the area aretemporarily suspended as at December 31, 2015.
FEP’s SC 14C Galoc has completed its development of Galoc Phase 2 which increased the capacityof the field to produce from 4,500 barrels of oil per day (BOPD) to 12,000 BOPD inDecember 2013.
PPPPitkin is an international upstream oil and gas group, engaged primarily in the acquisition,exploration and development of oil and gas properties and the production of hydrocarbon productswith operations in the Philippines and Peru. Pitkin’s principal asset is 25% interest in Peru BlockZ-38.

- 4 -
*SGVFS014558*
On July 16, 2013 and October 25, 2013, Pitkin completed the sale of all its interests in its wholly-owned subsidiaries, Vietnam American Exploration Company LLC (Vamex) with a 25%participating interest in both Vietnam Block 07/03 and Lonsdale, Inc. The gain on sale of thesesubsidiaries amounted to P=246,597. Accordingly, goodwill attributable to Vietnam Block 07/03 attime of acquisition of Pitkin by PXP was derecognized amounting to P=554,178.
PXPOn April 5, 2013, PXP increased its shareholding in Pitkin Petroleum Plc (Pitkin) from 18.46% to50.28% through subscription of 10,000,000 new ordinary shares and purchase of 36,405,000 sharesfrom existing shareholders at US$0.75 per share. The transaction led to PXP obtaining control overPitkin. Pitkin was incorporated and registered in the United Kingdom (UK) of Great Britain andNorthern Ireland on April 6, 2005.
On July 2, 2014, PXP surrendered 2,000,000 of its shares held in Pitkin following the latter’s tenderoffer to buy back 11,972,500 shares equivalent to 8.55% of all shares outstanding as of that date fora consideration of US$1 per share. Pitkin received a total of 11,099,000 shares surrendered from itsexisting shareholders. The share buyback transaction caused an increase in PXP’s ownership inPitkin from 50.3% to 53.1% as at July 2, 2014.
In May 2015, PPP tendered another offer to buy back its outstanding shares. PXP and the non-controlling interests surrendered 21,373,000 shares and 19,499,500 shares, respectively. Followingthis transaction, PXP’s interest in PPP has increased from 53.1% to 53.4%.
On July 15, 2016, PXP and its subsidiaries ceased to be subsidiaries of the Parent Company. TheParent Company lost its control through declaration of its PXP shares as property dividend(see Notes 26 and 33).
Recovery of Deferred Mine and Oil Exploration CostsThe Group’s ability to realize its deferred mine and oil exploration costs with carrying valueamounting to P=23,072,040 and P=28,963,295 as at December 31, 2016 and 2015, respectively (seeNote 13), depends on the success of exploration and development work in proving the viability ofits mining and oil properties to produce minerals and oil in commercial quantities, and the successof converting the Group’s EPs or EPAs or APSAs to new mineral agreements, which cannot bedetermined at this time. The consolidated financial statements do not include any adjustment thatmight result from these uncertainties.
Authorization for Issuance of the Consolidated Financial StatementsThe consolidated financial statements are authorized for issuance by the Parent Company’s Boardof Directors (BOD) on February 28, 2017.
2. Summary of Significant Accounting Policies and Financial Reporting Practices
Basis of PreparationThe consolidated financial statements of the Group have been prepared using the historical costbasis, except for mine products inventories that are measured at net realizable value (NRV), and forAFS financial assets and derivative financial instruments that are measured at fair value.The consolidated financial statements are presented in Philippine Peso (Peso), which is the ParentCompany’s functional and reporting currency, rounded to the nearest thousands, except whenotherwise indicated.
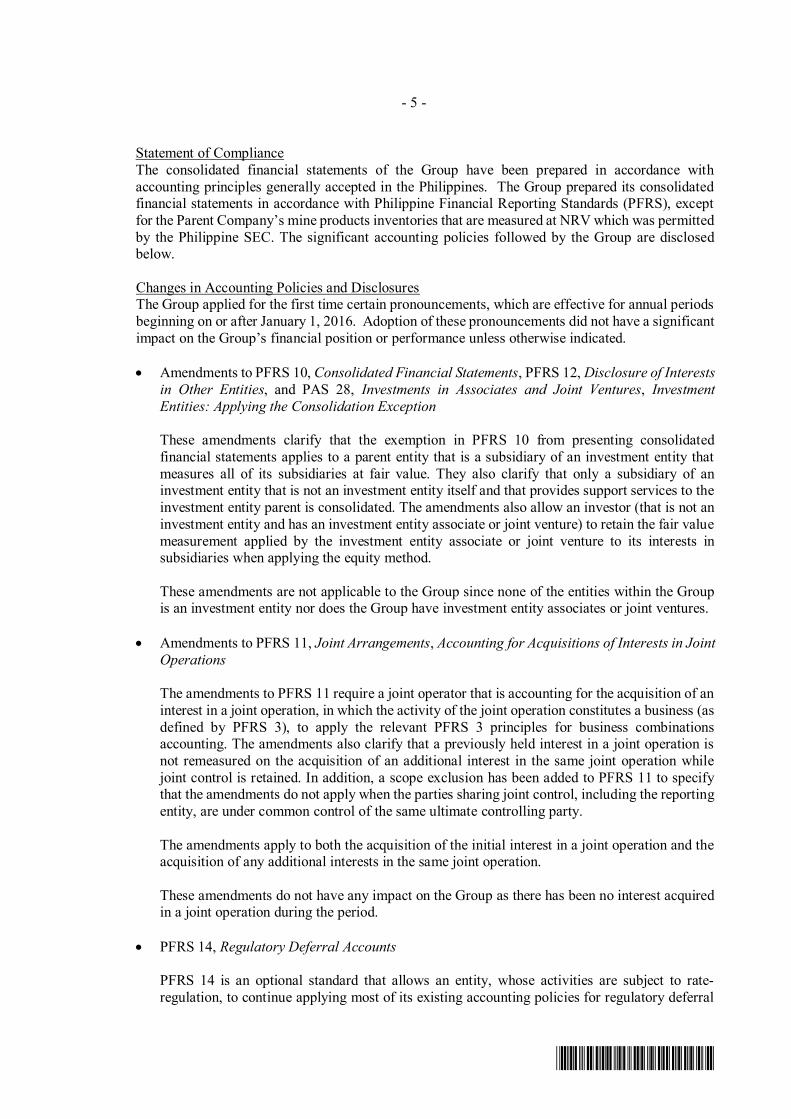
- 5 -
*SGVFS014558*
Statement of ComplianceThe consolidated financial statements of the Group have been prepared in accordance withaccounting principles generally accepted in the Philippines. The Group prepared its consolidatedfinancial statements in accordance with Philippine Financial Reporting Standards (PFRS), exceptfor the Parent Company’s mine products inventories that are measured at NRV which was permittedby the Philippine SEC. The significant accounting policies followed by the Group are disclosedbelow.
Changes in Accounting Policies and DisclosuresThe Group applied for the first time certain pronouncements, which are effective for annual periodsbeginning on or after January 1, 2016. Adoption of these pronouncements did not have a significantimpact on the Group’s financial position or performance unless otherwise indicated.
∂ Amendments to PFRS 10, Consolidated Financial Statements, PFRS 12, Disclosure of Interestsin Other Entities, and PAS 28, Investments in Associates and Joint Ventures, InvestmentEntities: Applying the Consolidation Exception
These amendments clarify that the exemption in PFRS 10 from presenting consolidatedfinancial statements applies to a parent entity that is a subsidiary of an investment entity thatmeasures all of its subsidiaries at fair value. They also clarify that only a subsidiary of aninvestment entity that is not an investment entity itself and that provides support services to theinvestment entity parent is consolidated. The amendments also allow an investor (that is not aninvestment entity and has an investment entity associate or joint venture) to retain the fair valuemeasurement applied by the investment entity associate or joint venture to its interests insubsidiaries when applying the equity method.
These amendments are not applicable to the Group since none of the entities within the Groupis an investment entity nor does the Group have investment entity associates or joint ventures.
∂ Amendments to PFRS 11, Joint Arrangements, Accounting for Acquisitions of Interests in JointOperations
The amendments to PFRS 11 require a joint operator that is accounting for the acquisition of aninterest in a joint operation, in which the activity of the joint operation constitutes a business (asdefined by PFRS 3), to apply the relevant PFRS 3 principles for business combinationsaccounting. The amendments also clarify that a previously held interest in a joint operation isnot remeasured on the acquisition of an additional interest in the same joint operation whilejoint control is retained. In addition, a scope exclusion has been added to PFRS 11 to specifythat the amendments do not apply when the parties sharing joint control, including the reportingentity, are under common control of the same ultimate controlling party.
The amendments apply to both the acquisition of the initial interest in a joint operation and theacquisition of any additional interests in the same joint operation.
These amendments do not have any impact on the Group as there has been no interest acquiredin a joint operation during the period.
∂ PFRS 14, Regulatory Deferral Accounts
PFRS 14 is an optional standard that allows an entity, whose activities are subject to rate-regulation, to continue applying most of its existing accounting policies for regulatory deferral

- 6 -
*SGVFS014558*
account balances upon its first-time adoption of PFRS. Entities that adopt PFRS 14 must presentthe regulatory deferral accounts as separate line items on the statement of financial position andpresent movements in these account balances as separate line items in the statement of incomeand other comprehensive income. The standard requires disclosures on the nature of, and risksassociated with, the entity’s rate-regulation and the effects of that rate-regulation on its financialstatements.
Since the Group is an existing PFRS preparer, this standard would not apply.
∂ Amendments to PAS 1, Presentation of Financial Statements, Disclosure Initiative
The amendments are intended to assist entities in applying judgment when meeting thepresentation and disclosure requirements in PFRSs. They clarify the following:
• That entities shall not reduce the understandability of their financial statements by eitherobscuring material information with immaterial information; or aggregating material itemsthat have different natures or functions
• That specific line items in the statement of income and other comprehensive income andthe statement of financial position may be disaggregated
• That entities have flexibility as to the order in which they present the notes to financialstatements
• That the share of other comprehensive income of associates and joint ventures accountedfor using the equity method must be presented in aggregate as a single line item, andclassified between those items that will or will not be subsequently reclassified to profit orloss.
These amendments do not have any impact to the Group.
∂ Amendments to PAS 16, Property, Plant and Equipment and PAS 38, Intangible Assets,Clarification of Acceptable Methods of Depreciation and Amortization
The amendments clarify the principle in PAS 16 and PAS 38 that revenue reflects a pattern ofeconomic benefits that are generated from operating a business (of which the asset is part) ratherthan the economic benefits that are consumed through use of the asset. As a result, a revenue-based method cannot be used to depreciate property, plant and equipment and may only be usedin very limited circumstances to amortize intangible assets.
These amendments are applied prospectively and do not have any impact to the Group, giventhat the Group has not used a revenue-based method to depreciate or amortize its property, plantand equipment and intangible assets.
∂ Amendments to PAS 16 and PAS 41, Agriculture: Bearer Plants
The amendments change the accounting requirements for biological assets that meet thedefinition of bearer plants. Under the amendments, biological assets that meet the definition ofbearer plants will no longer be within the scope of PAS 41. Instead, PAS 16 will apply. Afterinitial recognition, bearer plants will be measured under PAS 16 at accumulated cost (beforematurity) and using either the cost model or revaluation model (after maturity). The amendmentsalso require that produce that grows on bearer plants will remain in the scope of PAS 41measured at fair value less costs to sell. For government grants related to bearer plants, PAS 20,Accounting for Government Grants and Disclosure of Government Assistance, will apply.

- 7 -
*SGVFS014558*
The amendments are applied retrospectively and do not have any impact on the Group as theGroup does not have any bearer plants.
∂ Amendments to PAS 27, Separate Financial Statements, Equity Method in Separate FinancialStatements
The amendments allow entities to use the equity method to account for investments insubsidiaries, joint ventures and associates in their separate financial statements. Entities alreadyapplying PFRS and electing to change to the equity method in its separate financial statementswill have to apply that change retrospectively.
These amendments do not have any impact on the Group’s consolidated financial statements.
∂ Annual Improvements to PFRSs 2012 - 2014 Cycle
• Amendment to PFRS 5, Non-current Assets Held for Sale and Discontinued Operations,Changes in Methods of Disposal
The amendment is applied prospectively and clarifies that changing from a disposal throughsale to a disposal through distribution to owners and vice-versa should not be considered tobe a new plan of disposal, rather it is a continuation of the original plan. There is, therefore,no interruption of the application of the requirements in PFRS 5. The amendment alsoclarifies that changing the disposal method does not change the date of classification.
• Amendment to PFRS 7, Financial Instruments: Disclosures, Servicing Contracts
PFRS 7 requires an entity to provide disclosures for any continuing involvement in atransferred asset that is derecognized in its entirety. The amendment clarifies that a servicingcontract that includes a fee can constitute continuing involvement in a financial asset. Anentity must assess the nature of the fee and arrangement against the guidance for continuinginvolvement in PFRS 7 in order to assess whether the disclosures are required. Theamendment is to be applied such that the assessment of which servicing contracts constitutecontinuing involvement will need to be done retrospectively. However, comparativedisclosures are not required to be provided for any period beginning before the annualperiod in which the entity first applies the amendments.
• Amendment to PFRS 7, Applicability of the Amendments to PFRS 7 to Condensed InterimFinancial Statements
This amendment is applied retrospectively and clarifies that the disclosures on offsetting offinancial assets and financial liabilities are not required in the condensed interim financialreport unless they provide a significant update to the information reported in the most recentannual report.
• Amendment to PAS 19, Employee Benefits, Discount Rate: Regional Market Issue
This amendment is applied prospectively and clarifies that market depth of high qualitycorporate bonds is assessed based on the currency in which the obligation is denominated,rather than the country where the obligation is located. When there is no deep market forhigh quality corporate bonds in that currency, government bond rates must be used.

- 8 -
*SGVFS014558*
• Amendment to PAS 34, Interim Financial Reporting, Disclosure of Information ‘Elsewherein the Interim Financial Report’
The amendment is applied retrospectively and clarifies that the required interim disclosuresmust either be in the interim financial statements or incorporated by cross-referencebetween the interim financial statements and wherever they are included within the greaterinterim financial report (e.g., in the management commentary or risk report).
Future Changes in Accounting PoliciesPronouncements issued but not yet effective are listed below. Unless otherwise indicated, the Groupdoes not expect that the future adoption of the said pronouncements to have a significant impact onits consolidated financial statements. The Group intends to adopt the following pronouncementswhen they become effective.
Effective beginning on or after January 1, 2017
∂ Amendment to PFRS 12, Clarification of the Scope of the Standard (Part of AnnualImprovements to PFRSs 2014 - 2016 Cycle)
The amendments clarify that the disclosure requirements in PFRS 12, other than those relatingto summarized financial information, apply to an entity’s interest in a subsidiary, a joint ventureor an associate (or a portion of its interest in a joint venture or an associate) that is classified (orincluded in a disposal group that is classified) as held for sale.
∂ Amendments to PAS 7, Statement of Cash Flows, Disclosure Initiative
The amendments to PAS 7 require an entity to provide disclosures that enable users of financialstatements to evaluate changes in liabilities arising from financing activities, including bothchanges arising from cash flows and non-cash changes (such as foreign exchange gains orlosses). On initial application of the amendments, entities are not required to providecomparative information for preceding periods. Early application of the amendments ispermitted. Application of amendments will result in additional disclosures in the 2017consolidated financial statements of the Group.
∂ Amendments to PAS 12, Income Taxes, Recognition of Deferred Tax Assets for UnrealizedLosses
The amendments clarify that an entity needs to consider whether tax law restricts the sources oftaxable profits against which it may make deductions on the reversal of that deductibletemporary difference. Furthermore, the amendments provide guidance on how an entity shoulddetermine future taxable profits and explain the circumstances in which taxable profit mayinclude the recovery of some assets for more than their carrying amount.
Entities are required to apply the amendments retrospectively. However, on initial applicationof the amendments, the change in the opening equity of the earliest comparative period may berecognized in opening retained earnings (or in another component of equity, as appropriate),without allocating the change between opening retained earnings and other components ofequity. Entities applying this relief must disclose that fact. Early application of the amendmentsis permitted.
These amendments are not expected to have any impact on the Group.

- 9 -
*SGVFS014558*
Effective beginning on or after January 1, 2018
∂ Amendments to PFRS 2, Share-based Payment, Classification and Measurement of Share-based Payment Transactions
The amendments to PFRS 2 address three main areas: the effects of vesting conditions on themeasurement of a cash-settled share-based payment transaction; the classification of a share-based payment transaction with net settlement features for withholding tax obligations; and theaccounting where a modification to the terms and conditions of a share-based paymenttransaction changes its classification from cash settled to equity settled.
On adoption, entities are required to apply the amendments without restating prior periods, butretrospective application is permitted if elected for all three amendments and if other criteria aremet. Early application of the amendments is permitted.
The Group is assessing the potential effect of the amendments on its consolidated financialstatements.
∂ Amendments to PFRS 4, Insurance Contracts, Applying PFRS 9, Financial Instruments, withPFRS 4
The amendments address concerns arising from implementing PFRS 9, the new financialinstruments standard before implementing the forthcoming insurance contracts standard. Theyallow entities to choose between the overlay approach and the deferral approach to deal withthe transitional challenges. The overlay approach gives all entities that issue insurance contractsthe option to recognize in other comprehensive income, rather than profit or loss, the volatilitythat could arise when PFRS 9 is applied before the new insurance contracts standard is issued.On the other hand, the deferral approach gives entities whose activities are predominantlyconnected with insurance an optional temporary exemption from applying PFRS 9 until theearlier of application of the forthcoming insurance contracts standard or January 1, 2021.
The overlay approach and the deferral approach will only be available to an entity if it has notpreviously applied PFRS 9.
The amendments are not applicable to the Group since none of the entities within the Grouphave activities that are predominantly connected with insurance or issue insurance contracts.
∂ PFRS 15, Revenue from Contracts with Customers
PFRS 15 establishes a new five-step model that will apply to revenue arising from contractswith customers. Under PFRS 15, revenue is recognized at an amount that reflects theconsideration to which an entity expects to be entitled in exchange for transferring goods orservices to a customer. The principles in PFRS 15 provide a more structured approach tomeasuring and recognizing revenue.
The Group is currently assessing the impact of adopting this standard.
The new revenue standard is applicable to all entities and will supersede all current revenuerecognition requirements under PFRSs. Either a full or modified retrospective application isrequired for annual periods beginning on or after January 1, 2018.

- 10 -
*SGVFS014558*
∂ PFRS 9, Financial Instruments
PFRS 9 reflects all phases of the financial instruments project and replaces PAS 39, FinancialInstruments: Recognition and Measurement, and all previous versions of PFRS 9. The standardintroduces new requirements for classification and measurement, impairment, and hedgeaccounting. PFRS 9 is effective for annual periods beginning on or after January 1, 2018, withearly application permitted. Retrospective application is required, but providing comparativeinformation is not compulsory. For hedge accounting, the requirements are generally appliedprospectively, with some limited exceptions.
The adoption of PFRS 9 will have an effect on the classification and measurement of theGroup’s financial assets and impairment methodology for financial assets, but will have noimpact on the classification and measurement of the Group’s financial liabilities. The adoptionwill also have an effect on the Group’s application of hedge accounting and on the amount ofits credit losses. The Group is currently assessing the impact of adopting this standard.
∂ Amendments to PAS 28, Measuring an Associate or Joint Venture at Fair Value (Part of AnnualImprovements to PFRSs 2014 - 2016 Cycle)
The amendments clarify that an entity that is a venture capital organization, or other qualifyingentity, may elect, at initial recognition on an investment-by-investment basis, to measure itsinvestments in associates and joint ventures at fair value through profit or loss. They also clarifythat if an entity that is not itself an investment entity has an interest in an associate or jointventure that is an investment entity, the entity may, when applying the equity method, elect toretain the fair value measurement applied by that investment entity associate or joint venture tothe investment entity associate’s or joint venture’s interests in subsidiaries. This election is madeseparately for each investment entity associate or joint venture, at the later of the date on which(a) the investment entity associate or joint venture is initially recognized; (b) the associate orjoint venture becomes an investment entity; and (c) the investment entity associate or jointventure first becomes a parent. The amendments should be applied retrospectively, with earlierapplication permitted.
∂ Amendments to PAS 40, Investment Property, Transfers of Investment PropertyThe amendments clarify when an entity should transfer property, including property underconstruction or development into, or out of investment property. The amendments state that achange in use occurs when the property meets, or ceases to meet, the definition of investmentproperty and there is evidence of the change in use. A mere change in management’s intentionsfor the use of a property does not provide evidence of a change in use. The amendments shouldbe applied prospectively to changes in use that occur on or after the beginning of the annualreporting period in which the entity first applies the amendments. Retrospective application isonly permitted if this is possible without the use of hindsight.
∂ Philippine Interpretation IFRIC-22, Foreign Currency Transactions and AdvanceConsideration
The interpretation clarifies that in determining the spot exchange rate to use on initialrecognition of the related asset, expense or income (or part of it) on the derecognition of a non-monetary asset or non-monetary liability relating to advance consideration, the date of thetransaction is the date on which an entity initially recognizes the nonmonetary asset or non-monetary liability arising from the advance consideration. If there are multiple payments orreceipts in advance, then the entity must determine a date of the transactions for each paymentor receipt of advance consideration. The interpretation may be applied on a fully retrospective

- 11 -
*SGVFS014558*
basis. Entities may apply the interpretation prospectively to all assets, expenses and income inits scope that are initially recognized on or after the beginning of the reporting period in whichthe entity first applies the interpretation or the beginning of a prior reporting period presentedas comparative information in the financial statements of the reporting period in which the entityfirst applies the interpretation.
Effective beginning on or after January 1, 2019
∂ PFRS 16, Leases
Under the new standard, lessees will no longer classify their leases as either operating or financeleases in accordance with PAS 17, Leases. Rather, lessees will apply the single-asset model.Under this model, lessees will recognize the assets and related liabilities for most leases on theirbalance sheets, and subsequently, will depreciate the lease assets and recognize interest on thelease liabilities in their profit or loss. Leases with a term of 12 months or less or for which theunderlying asset is of low value are exempted from these requirements.
The accounting by lessors is substantially unchanged as the new standard carries forward theprinciples of lessor accounting under PAS 17. Lessors, however, will be required to disclosemore information in their financial statements, particularly on the risk exposure to residualvalue.
Entities may early adopt PFRS 16 but only if they have also adopted PFRS 15. When adoptingPFRS 16, an entity is permitted to use either a full retrospective or a modified retrospectiveapproach, with options to use certain transition reliefs.
The Group is currently assessing the impact of adopting PFRS 16.
Deferred effectivity
∂ Amendments to PFRS 10 and PAS 28, Sale or Contribution of Assets between an Investor andits Associate or Joint Venture
The amendments address the conflict between PFRS 10 and PAS 28 in dealing with the loss ofcontrol of a subsidiary that is sold or contributed to an associate or joint venture. Theamendments clarify that a full gain or loss is recognized when a transfer to an associate or jointventure involves a business as defined in PFRS 3, Business Combinations. Any gain or lossresulting from the sale or contribution of assets that does not constitute a business, however, isrecognized only to the extent of unrelated investors’ interests in the associate or joint venture.
On January 13, 2016, the Financial Reporting Standards Council postponed the originaleffective date of January 1, 2016 of the said amendments until the International AccountingStandards Board has completed its broader review of the research project on equity accountingthat may result in the simplification of accounting for such transactions and of other aspects ofaccounting for associates and joint ventures.

- 12 -
*SGVFS014558*
Summary of Significant Accounting Policies
Presentation of Consolidated Financial StatementsThe Group has elected to present all items of recognized income and expenses in two statements: astatement displaying components of profit or loss in the consolidated statement of income and asecond statement beginning with profit or loss and displaying components of other comprehensiveincome (OCI) in the consolidated statement of comprehensive income.
Basis of ConsolidationThe consolidated financial statements comprise the financial statements of the Parent Company andits subsidiaries as at December 31, 2016 and 2015. Control is achieved when the Group is exposed,or has rights, to variable returns from its involvement with the investee and has the ability to affectthose returns through its power over the investee. Specifically, the Group controls an investee ifand only if the Group has:
∂ Power over the investee (i.e. existing rights that give it the current ability to direct the relevantactivities of the investee),
∂ Exposure, or rights, to variable returns from its involvement with the investee, and∂ The ability to use its power over the investee to affect its returns.
When the Group has less than a majority of the voting or similar rights of an investee, the Groupconsiders all relevant facts and circumstances in assessing whether it has power over an investee,including:
∂ The contractual arrangement with the other vote holders of the investee,∂ Rights arising from other contractual arrangements,∂ The Group’s voting rights and potential voting rights.
The Group re-assesses whether or not it controls an investee if facts and circumstances indicate thatthere are changes to one or more of the three elements of control. Consolidation of a subsidiarybegins when the Group obtains control over the subsidiary and ceases when the Group loses controlof the subsidiary. Assets, liabilities, income and expenses of a subsidiary acquired or disposed ofduring the year are included in the consolidated statement of comprehensive income from the datethe Group gains control until the date the Group ceases to control the subsidiary.
Profit or loss and each component of OCI are attributed to the equity holders of the parent of theGroup and to the non-controlling interests, even if this results in the non-controlling interests havinga deficit balance. When necessary, adjustments are made to the financial statements of subsidiariesto bring their accounting policies into line with the Group’s accounting policies. All intra-groupassets and liabilities, equity, income, expenses and cash flows relating to transactions betweenmembers of the Group are eliminated in full on consolidation.
A change in the ownership interest of a subsidiary, without a loss of control, is accounted for as anequity transaction. If the Group loses control over a subsidiary, it:
∂ Derecognizes the assets (including goodwill) and liabilities of the subsidiary∂ Derecognizes the carrying amount of any non-controlling interests∂ Derecognizes the cumulative translation differences recorded in equity∂ Recognizes the fair value of the consideration received∂ Recognizes the fair value of any investment retained∂ Recognizes any surplus or deficit in profit or loss

- 13 -
*SGVFS014558*
∂ Reclassifies the parent’s share of components previously recognized in OCI to profit or loss orretained earnings, as appropriate, as would be required if the Group had directly disposed of therelated assets or liabilities.
The Parent Company’s subsidiaries and their respective natures of businesses are as follows:
Subsidiaries Nature and Principal Place of Business
PGPI Incorporated in the Philippines on August 9, 1996 as a wholly-owned subsidiaryof PGI and became a wholly-owned subsidiary of PGHI on April 27, 2010. In2015, PGPI was acquired and 100% owned by the Parent Company. PGPI wasprimarily engaged in the operation of the Bulawan mine and the development ofthe Sibutad Project both on care and maintenance status since 2002. PGPIcurrently owns 98.9% of the outstanding shares of LMC.
LMC Incorporated in the Philippines on October 20, 2005 to engage in exploration,development and utilization of mineral resources, particularly the LascogonProject in Surigao.
SMECI Incorporated in the Philippines on October 12, 1999 primarily to engage in thebusiness of large-scale exploration, development and utilization of mineralresources; currently the holding company of SMMCI.
SMMCI Incorporated in the Philippines on January 4, 2000 primarily to engage in thebusiness of large-scale exploration, development and utilization of mineralresources, principally the Silangan Project.
PXP* Incorporated in the Philippines on December 27, 2007 to carry on businessesrelated to any and all kinds of petroleum and petroleum products, oil, and othersources of energy. PXP’s shares are listed in the Philippine Stock Exchange.
FEP* Incorporated on April 1, 2005 in England and Wales primarily to engage in thebusiness of oil and gas exploration and production, with focus on the Philippines.FEP shares were delisted in the Alternative Investment Market of the LondonStock Exchange in 2015.
FEC* Incorporated on February 8, 1982 under the laws of Alberta, Canada primarily toengage in the business of exploration and development of oil and gas and othermineral related opportunities.
BEMC* Incorporated in the Philippines on July 19, 2005 to engage in exploration,development and utilization of energy-related resources, particularly the Brixtoncoal operations in Diplahan, Zamboanga Sibugay. On September 1, 2013, BEMCannounced the closure of its coal mine in Diplahan, Zamboanga Sibugay.
On January 6, 2014, BEMC has finalized the agreement for the assignment ofCOC 130 to Grace Coal Mining and Development Inc. (GCMDI). On May 12,2015, the DOE has approved the assignment completing the transfer of COC 130from BEMC to GCMDI.
PPP* Incorporated and registered in United Kingdom (UK) of Great Britain andNorthern Ireland on April 6, 2005 and is engaged primarily in the acquisition,exploration and development of oil and gas properties and the production ofhydrocarbon products. PPP registered its Philippine Branch, Pitkin Petroleum(Philippines) Plc, on March 19, 2008 and is presently engaged in the explorationof oil and gas assets in the Philippine territories.
Fidelity Stock Transfers,Inc. (FSTI)
Incorporated in the Philippines on December 28, 1981 to act as a stock transferagent and/or registrar of client corporations. The company is currently in dormantstatus.

- 14 -
*SGVFS014558*
Subsidiaries Nature and Principal Place of Business
Philex Land, Inc. (PLI) Incorporated in the Philippines on February 26, 2007 to own, use, develop,subdivide, sell, exchange, lease, and hold for investment or otherwise, real estateof all kinds including buildings, houses, apartments and other structures. Thecompany is currently in dormant status.
Philex InsuranceAgency, Inc. (PIAI)
Incorporated in the Philippines on May 20, 1987 to act as a general agent for andin behalf of any domestic and/or foreign non-life insurance company orcompanies authorized to do business in the Philippines. PIAI is currently indormant status.
Philex Gold Holdings,Inc. (PGHI)
Incorporated in the Philippines on August 28, 1996 to serve as an intermediaryholding company through which its subsidiaries and the Parent Company conductlarge-scale exploration, development and utilization of mineral resources. PGHIowned 100% of the outstanding shares of PGPI effective April 27, 2010. In 2015,PGHI sold 100% of its ownership in PGPI to the Parent Company.
Philex Gold Inc. (PGI)** Incorporated in Canada on June 14, 1996 and owned 100% of the outstandingshares of PGPI until April 26, 2010.
*Deconsolidated subsidiaries on July 15, 2016. See Notes 26 and 33.**Dissolution took place in January 2016.
Also included as part of the Parent Company’s subsidiaries are those intermediary entities whichare basically holding companies established for the operating entities mentioned above. Thefollowing are the intermediary entities of the Group: Forum Philippine Holdings Limited (FPHL),Forum FEI Limited (FFEIL), Pitkin Peru LLC (PPR), Pitkin Petroleum Peru 2 LLC (PP2) and PitkinPetroleum Peru 3 LLC (PP3). On July 15, 2016, PXP and its subsidiaries ceased to be a subsidiaryof the Parent Company. PMC lost its control through declaration of its shares in a property dividend(see Notes 26 and 33).
The ownership of the Parent Company and subsidiaries over the foregoing companies in 2016 and2015 are summarized as follows:
Percentages of Ownership2016 2015
Direct Indirect Direct IndirectPGHI 100.0 – 100.0 –
PGI – – – 100.0PGPI – – – –
LMC – – – –PGPI 100.0 100.0 –
LMC – 98.9 – 98.9PXP 19.8 – 64.7
BEMC – – – 100.0FEP and subsidiaries – – – 58.9FEC – – – 55.0
LMC – – – 1.1FEP – – – 18.4
PPP – – – 53.4SMECI 100.0 – 100.0 –
SMMCI – 100.0 – 100.0FSTI 100.0 – 100.0 –PLI 100.0 – 100.0 –PIAI 100.0 – 100.0 –
- 15 -
*SGVFS014558*
Sale of PXP sharesIn 2015, PMC sold 839,100 share of PXP to third parties. The resulting sale of share decreased theownership of the Parent Company in PXP from 64.8% to 64.7%.
Infusion of additional capital of PMC in SMECIOn February 3, 2015, by virtue of SMECI’s BOD and by the vote of the stockholders representingat least two-thirds of the outstanding capital stock, SMECI’s Articles of Incorporation wereamended to increase its authorized capital stock from 170,000 shares with par value of P=10,000 pershare to 1,000,000 shares also with a par value of P=10,000 per share. On February 10, 2015,PMC subscribed 500,000 shares out of the 830,000 new shares for an aggregate price ofP=7,207,500.
Acquisition of additional shares of PPPOn July 2, 2014, PXP surrendered 2,000,000 of its shares held in PPP following the latter’s tenderoffer to buy back 11,972,500 shares equivalent to 8.55% of all shares outstanding as of that date fora consideration of US$1 per share. PPP received a total of 11,099,000 shares surrendered from itsexisting shareholders. The share buyback transaction resulted to an increase in PXP’s ownership inPPP from 50.3% to 53.1%.
In May 2015, PPP tendered another offer to buy back its outstanding shares. PXP and the non-controlling interests surrendered 21,373,000 shares and 19,499,500 shares, respectively. Followingthis transaction, PXP’s interest in PPP has increased from 53.1% to 53.4%.
Acquisition of additional investment in FEPIn June and November 2015, PXP purchased additional investment from the non-controllingshareholders of FEP. The transaction resulted in increase in ownership of PXP over FEP from 36.4%to 48.8%.
NCINCI represents interest in a subsidiary that is not owned, directly or indirectly, by the ParentCompany. Profit or loss and each component of OCI (loss) are attributed to the equity holders ofthe Parent Company and to the NCI. Total comprehensive income (loss) is attributed to the equityholders of the Parent Company and to the NCI even if this results in the NCI having a deficit balance.
NCI represents the portion of profit or loss and the net assets not held by the Group. Transactionswith NCI are accounted for as an equity transaction.
On July 15, 2016, PXP and its subsidiaries ceased to be subsidiaries of the Parent Company. TheParent Company lost its control through declaration of its shares in PXP as property dividend(see Notes 26 and 33).
Interest in Joint ArrangementsPFRS defines a joint arrangement as an arrangement over which two or more parties have jointcontrol. Joint control is the contractually agreed sharing of control of an arrangement, which existsonly when decisions about the relevant activities (being those that significantly affect the returns ofthe arrangement) require unanimous consent of the parties sharing control.
Joint operationsA joint operation is a type of joint arrangement whereby the parties that have joint control of thearrangement have rights to the assets and obligations for the liabilities, relating to the arrangement.
- 16 -
*SGVFS014558*
In relation to its interests in joint operations, the Group recognizes its:∂ Assets, including its share of any assets held jointly∂ Liabilities, including its share of any liabilities incurred jointly∂ Revenue from the sale of its share of the output arising from the joint operation∂ Share of the revenue from the sale of the output by the joint operation∂ Expenses, including its share of any expenses incurred jointly
Business Combination and GoodwillBusiness combinations, except for business combination between entities under common control,are accounted for using the acquisition method. The cost of an acquisition is measured as theaggregate of the consideration transferred, measured at acquisition date fair value and the amountof any NCI in the acquiree. For each business combination, the acquirer measures the NCI in theacquiree either at fair value or at the proportionate share of the acquiree’s identifiable net assets.Acquisition-related costs incurred are expensed and included in general and administrativeexpenses.
When the Group acquires a business, it assesses the financial assets and financial liabilities assumedfor appropriate classification and designation in accordance with the contractual terms, economiccircumstances and pertinent conditions as at the acquisition date. This includes the separation ofembedded derivatives in host contracts by the acquiree.
If the business combination is achieved in stages, the acquisition date fair value of the acquirer’spreviously held equity interest in the acquiree is remeasured to fair value at the acquisition date andany gain or loss on remeasurement is recognized in the consolidated statement of income.
Any contingent consideration to be transferred by the acquirer will be recognized at fair value at theacquisition date. Subsequent changes to the fair value of the contingent consideration which isdeemed to be an asset or liability, will be recognized in accordance with PAS 39 either in theconsolidated statement of income, or in the consolidated statement of comprehensive income. If thecontingent consideration is classified as equity, it is not remeasured until it is finally settled withinequity.
Goodwill is initially measured at cost being the excess of the aggregate of the considerationtransferred and the amount recognized for NCI over the net identifiable assets acquired andliabilities assumed. If the fair value of the net assets acquired is in excess of the aggregateconsideration transferred, the Group reassesses whether it has correctly identified all of the assetsacquired and all of the liabilities assumed and reviews the procedures used to measure the amountsto be recognized at the acquisition date. If the reassessment still results in an excess of the fair valueof net assets acquired over the aggregate consideration transferred, then the gain is recognized inprofit or loss. Goodwill is reviewed for impairment, annually or more frequently if events or changesin circumstances indicate that the carrying value may be impaired.
Impairment is determined for goodwill by assessing the recoverable amount of the Cash GeneratingUnit (CGU) or group of CGUs to which the goodwill relates. Where the recoverable amount of theCGU or group of CGUs is less than the carrying amount of the CGU or group of CGUs to whichgoodwill has been allocated, an impairment loss is recognized in the consolidated statement ofincome. Impairment losses relating to goodwill cannot be reversed in future periods. The Groupperforms its impairment test of goodwill annually every December 31.
After initial recognition, goodwill is measured at cost less any accumulated impairment losses. Forthe purpose of impairment testing, goodwill acquired in a business combination is, from theacquisition date, allocated to each of the Group’s CGUs that are expected to benefit from the

- 17 -
*SGVFS014558*
combination, irrespective of whether other assets or liabilities of the acquiree are assigned to thoseunits.
Where goodwill has been allocated to a CGU and part of the operation within that unit is disposedof, the goodwill associated with the operation disposed of is included in the carrying amount of theoperation when determining the gain or loss on disposal of the operation. Goodwill disposed in thesecircumstances is measured based on the relative values of the disposed operation and the portion ofthe CGU retained.
Foreign Currency Translation of Foreign OperationsThe Group’s consolidated financial statements are presented in Philippine Peso, which is also theParent Company’s functional currency. Each subsidiary in the Group determines its own functionalcurrency and items included in the consolidated financial statements of each subsidiary are measuredusing that functional currency. The Group has elected to recognize the translation adjustment thatarises from the direct method of consolidation, which is the method the Group uses to complete itsconsolidation. Transactions in foreign currencies are initially recorded in the functional currencyrate on the date of the transaction. Outstanding monetary assets and liabilities denominated inforeign currencies are retranslated at the functional currency rate of exchange at the end of thereporting period. All exchange differences are recognized in the consolidated statement of income.Non-monetary items that are measured in terms of historical cost in a foreign currency are translatedusing the exchange rates as at the dates of the initial transactions. Non-monetary items measured atfair value in a foreign currency are translated using the exchange rates at the date when the fair valuewas determined.
For purposes of consolidation, the financial statements of FEL and Pitkin, which are expressed inUnited States (US) dollar amounts, and the financial statements of FEC, which are expressed inCanadian (Cdn) dollar amounts, have been translated to Peso amounts as follows:a. assets and liabilities for each statement of financial position presented are translated at the
closing rate at the date of the consolidated statement of financial positionb. income and expenses in the statement of income are translated at exchange rates at the average
monthly prevailing rates for the yearc. all resulting exchange differences in other comprehensive income
Cash and Cash EquivalentsCash includes cash on hand and with banks. Cash equivalents are short-term, highly liquidinvestments that are readily convertible to known amounts of cash with original maturities of threemonths or less from dates of acquisition and that are subject to insignificant risk of change in value.
Financial InstrumentsDate of recognitionThe Group recognizes a financial asset or a financial liability in the consolidated statement offinancial position when it becomes a party to the contractual provisions of the instrument. Purchasesor sales of financial assets that require delivery of assets within the time frame established byregulation or convention in the marketplace are recognized on the trade date.
Initial recognition and classification of financial instrumentsFinancial instruments are recognized initially at fair value. The initial measurement of financialinstruments, except for those designated at fair value through profit or loss (FVPL), includestransaction cost.
On initial recognition, the Group classifies its financial assets in the following categories: financialassets at FVPL, loans and receivables, held-to-maturity (HTM) investments, and AFS financial

- 18 -
*SGVFS014558*
assets. The classification depends on the purpose for which the investments are acquired andwhether they are quoted in an active market. Financial liabilities, on the other hand, are classifiedinto the following categories: financial liabilities at FVPL and other financial liabilities, asappropriate. Management determines the classification of its financial assets and financial liabilitiesat initial recognition and, where allowed and appropriate, re-evaluates such designation at everyreporting date.
Financial instruments are classified as liabilities or equity in accordance with the substance of thecontractual arrangement. Interest, dividends, gains and losses relating to a financial instrument ora component that is a financial liability are reported as expense or income. Distributions to holdersof financial instruments classified as equity are charged directly to equity, net of any related incometax benefits.
As at December 31, 2016 and 2015, the Group’s financial assets and financial liabilities consist ofloans and receivables, AFS financial assets and other financial liabilities.
Determination of fair valueThe Group measures financial instruments, such as, derivatives, and non-financial assets such asinvestment properties, at fair value at each statement of financial position date. Fair value is theprice that would be received to sell an asset or paid to transfer a liability in an orderly transactionbetween market participants at the measurement date. The fair value measurement is based on thepresumption that the transaction to sell the asset or transfer the liability takes place either:
∂ In the principal market for the asset or liability, or∂ In the absence of a principal market, in the most advantageous market for the asset or liability.
The principal or the most advantageous market must be accessible to by the Group. The fair valueof an asset or a liability is measured using the assumptions that market participants would use whenpricing the asset or liability, assuming that market participants act in their economic best interest.
A fair value measurement of a non-financial asset takes into account a market participant’s abilityto generate economic benefits by using the asset in its highest and best use or by selling it to anothermarket participant that would use the asset in its highest and best use.
The Group uses valuation techniques that are appropriate in the circumstances and for whichsufficient data are available to measure fair value, maximizing the use of relevant observable inputsand minimizing the use of unobservable inputs.
All assets and liabilities for which fair value is measured or disclosed in the financial statements arecategorized within the fair value hierarchy, described as follows, based on the lowest level inputthat is significant to the fair value measurement as a whole:
∂ Level 1 - Quoted (unadjusted) market prices in active markets for identical assets or liabilities∂ Level 2 - Valuation techniques for which the lowest level input that is significant to the fair
value measurement is directly or indirectly observable∂ Level 3 - Valuation techniques for which the lowest level input that is significant to the fair
value measurement is unobservable
For assets and liabilities that are recognized in the financial statements on a recurring basis, theGroup determines whether transfers have occurred between Levels in the hierarchy by re-assessingcategorization (based on the lowest level input that is significant to the fair value measurement as awhole) at the end of each reporting period.

- 19 -
*SGVFS014558*
Derivatives and HedgingThe Group uses currency and commodity derivatives such as forwards, swaps and option contractsto economically hedge its exposure to fluctuations in gold and copper prices. For accountingpurposes, such derivative financial instruments are initially recognized at fair value on the date onwhich a derivative contract is entered into and are subsequently remeasured at fair value.Derivatives are carried as assets when the fair value is positive and as liabilities when the fair valueis negative.
Derivatives are accounted for as at FVPL, where any gains or losses arising from changes in fairvalue on derivatives are taken directly to consolidated statement of income, unless hedge accountingis applied.
For the purpose of hedge accounting, hedges are classified as:a. fair value hedges when hedging the exposure to changes in the fair value of a recognized asset
or liability; orb. cash flow hedges when hedging exposure to variability in cash flows that is either attributable
to a particular risk associated with a recognized asset or liability or a forecast transaction; orc. hedges of a net investment in a foreign operation.
A hedge of the foreign currency risk of a firm commitment is accounted for as a cash flow hedge.
At the inception of a hedge relationship, the Group formally designates and documents the hedgerelationship to which the Group wishes to apply hedge accounting and the risk managementobjective and strategy for undertaking the hedge. The documentation includes identification of thehedging instrument, the hedged item or transaction, the nature of the risk being hedged and how theentity will assess the hedging instrument’s effectiveness in offsetting the exposure to changes in thehedged item’s fair value or cash flows attributable to the hedged risk. Such hedges are expected tobe highly effective in achieving offsetting changes in fair value or cash flows and are assessed onan ongoing basis to determine that they actually have been highly effective throughout the financialreporting periods for which they were designated.
Hedges that meet the strict criteria for hedge accounting are accounted for as follows:
Cash flow hedgesCash flow hedges are hedges of the exposure to variability in cash flows that is attributable to aparticular risk associated with a recognized asset or liability or a highly probable forecast transactionand could affect profit or loss. The effective portion of the gain or loss on the hedging instrument isrecognized in the consolidated statement of comprehensive income, while the ineffective portion isrecognized in the consolidated statement of income.
Amounts taken to equity are transferred to the consolidated statement of income when the hedgedtransaction affects profit or loss, such as when the hedged financial income or financial expense isrecognized or when a forecast sale or purchase occurs. When the hedged item is the cost of a non-financial asset or liability, the amounts recognized as OCI are transferred to the initial carryingamount of the non-financial asset or liability.
If the forecast transaction or firm commitment is no longer expected to occur, amounts previouslyrecognized in equity are transferred to the consolidated statement of income. If the hedginginstrument expires or is sold, terminated or exercised without replacement or rollover, or if itsdesignation as a hedge is revoked, amounts previously recognized in equity remain in equity untilthe forecast transaction or firm commitment occurs. If the related transaction is not expected tooccur, the amount is taken to the consolidated statement of income.

- 20 -
*SGVFS014558*
Embedded derivativesAn embedded derivative is separated from the host financial or non-financial contract and accountedfor as a derivative if all of the following conditions are met:
ƒ the economic characteristics and risks of the embedded derivative are not closely related to theeconomic characteristic of the host contract;
ƒ a separate instrument with the same terms as the embedded derivative would meet the definitionof a derivative; and
ƒ the hybrid or combined instrument is not recognized as at FVPL.
The Group assesses whether embedded derivatives are required to be separated from host contractswhen the Group first becomes a party to the contract. Reassessment only occurs if there is a changein the terms of the contract that significantly modifies the cash flows that would otherwise berequired.
Embedded derivatives that are bifurcated from the host contracts are accounted for either as financialassets or financial liabilities at FVPL. Changes in fair values are included in the consolidatedstatement of income.
Loans and ReceivablesLoans and receivables are non-derivative financial assets with fixed or determinable payments thatare not quoted in an active market. After initial measurement, loans and receivables are subsequentlycarried at amortized cost using the effective interest method less any allowance for impairment.Amortized cost is calculated taking into account any discount or premium on acquisition andincludes transaction costs and fees that are an integral part of the effective interest rate andtransaction costs. Gains and losses are recognized in the consolidated statement of income when theloans and receivables are derecognized or impaired, as well as through the amortization process.These financial assets are included in current assets if maturity is within 12 months from theconsolidated statement of financial position date. Otherwise, these are classified as noncurrentassets.
As of December 31, 2016 and 2015, the Group’s cash and cash equivalents, accounts receivable andadvances to a related party are included under loans and receivables.
AFS Financial AssetsAFS financial assets are non-derivative financial assets that are designated as AFS or are notclassified in any of the three other categories. The Group designates financial instruments as AFSfinancial assets if they are purchased and held indefinitely and may be sold in response to liquidityrequirements or changes in market conditions. After initial recognition, AFS financial assets aremeasured at fair value with unrealized gains or losses being recognized in the consolidated statementof comprehensive income as “Net unrealized gain (loss) on AFS financial assets.”
When the investment is disposed of, the cumulative gains or losses previously recorded in equityare recognized in the consolidated statement of income. Interest earned on the investments isreported as interest income using the effective interest method. Dividends earned on investmentsare recognized in the consolidated statement of income as “Dividend income” when the right ofpayment has been established. The Group considers several factors in making a decision on theeventual disposal of the investment. The major factor of this decision is whether or not the Groupwill experience inevitable further losses on the investment. These financial assets are classified asnoncurrent assets unless the intention is to dispose of such assets within 12 months from theconsolidated statement of financial position date.
Note 11 discuss the details of the Group’s AFS financial assets as of December 31, 2016 and 2015.

- 21 -
*SGVFS014558*
Other Financial LiabilitiesOther financial liabilities are initially recorded at fair value, less directly attributable transactioncosts. After initial recognition, interest-bearing loans and borrowings are subsequently measured atamortized cost using the effective interest method. Amortized cost is calculated by taking intoaccount any issue costs and any discount or premium on settlement. Gains and losses are recognizedin the consolidated statement of income when the liabilities are derecognized as well as through theamortization process.
As at December 31, 2016 and 2015, included in other financial liabilities are the Group’s accountspayable and accrued liabilities, dividends payable, and loans and bonds payable.
Debt Issuance CostsDebt issuance costs are amortized using effective interest rate method and unamortized debtissuance costs are included in the measurement of the related carrying value of the debt in theconsolidated statement of financial position. When loan is repaid, the related unamortized debtissuance costs at the date of repayment are charged in the consolidated statement of income.
Impairment of Financial AssetsThe Group assesses at each consolidated statement of financial position date whether there isobjective evidence that a financial asset or a group of financial assets is impaired. A financial assetor a group of financial assets is deemed to be impaired if, and only if, there is objective evidence ofimpairment as a result of one or more events that have occurred after the initial recognition of theasset (an incurred “loss event”) and that loss event (or events) has an impact on the estimated futurecash flows of the financial asset or the group of financial assets that can be reliably estimated.Evidence of impairment may include indications that the contracted parties or a group of contractedparties are/is experiencing significant financial difficulty, default or delinquency in interest orprincipal payments, the probability that they will enter bankruptcy or other financial reorganization,and where observable data indicate that there is measurable decrease in the estimated future cashflows, such as changes in arrears or economic conditions that correlate with defaults.
Financial assets carried at costIf there is objective evidence that an impairment loss on an unquoted equity instrument, that is notcarried at fair value because its fair value cannot be reliably measured, or on a derivative asset thatis linked to and must be settled by delivery of such an unquoted equity instrument has been incurred,the amount of the loss is measured as the difference between the asset’s carrying amount and thepresent value of estimated future cash flows discounted at the current market rate of return of asimilar financial asset.
Loans and receivablesThe Group first assesses whether objective evidence of impairment exists individually for financialassets that are individually significant, and individually or collectively for financial assets that arenot individually significant. If there is objective evidence that an impairment loss on financial assetscarried at amortized cost has been incurred, the amount of loss is measured as a difference betweenthe asset’s carrying amount and the present value of estimated future cash flows (excluding futurecredit losses that have not been incurred) discounted at the financial asset’s original effective interestrate (i.e., the effective interest rate computed at initial recognition). The carrying amount of the assetshall be reduced through the use of an allowance account. The amount of loss is recognized in theconsolidated statement of income.
If it is determined that no objective evidence of impairment exists for an individually assessedfinancial asset, whether significant or not, the asset is included in the group of financial assets withsimilar credit risk characteristics and that group of financial assets is collectively assessed for

- 22 -
*SGVFS014558*
impairment. Assets that are individually assessed for impairment and for which an impairment lossis or continues to be recognized are not included in a collective assessment of impairment.
If, in a subsequent period, the amount of the impairment loss decreases and the decrease can berelated objectively to an event occurring after the impairment was recognized, the previouslyrecognized impairment loss is reversed. Any subsequent reversal of an impairment loss isrecognized in the consolidated statement of income, to the extent that the carrying value of the assetdoes not exceed its amortized cost at the reversal date.
AFS financial assetsFor AFS financial assets, the Group assesses at each consolidated statement of financial positiondate whether there is objective evidence that a financial asset or group of financial assets is impaired.In case of equity investments classified as AFS financial assets, this would include a significant orprolonged decline in the fair value of the investments below its cost. The determination of what is“significant” or “prolonged” requires judgment. The Group treats “significant” generally as 20% ormore and “prolonged” as greater than 12 months for quoted equity securities. When there is evidenceof impairment, the cumulative loss measured as the difference between the acquisition cost and thecurrent fair value, less any impairment loss on that financial asset previously recognized in theconsolidated statement of income is removed from equity and recognized in the consolidatedstatement of income.
Impairment losses on equity investments are recognized in the consolidated statement of income.Increases in fair value after impairment are recognized directly in the consolidated statement ofcomprehensive income.
Derecognition of Financial Assets and Financial LiabilitiesFinancial assetsA financial asset (or, where applicable, a part of a financial asset or part of a group of similarfinancial assets) is derecognized when:
ƒ the rights to receive cash flows from the asset have expired;ƒ the Group retains the right to receive cash flows from the asset, but has assumed an obligation
to pay them in full without material delay to a third party under a “pass-through” arrangement;or
ƒ the Group has transferred its rights to receive cash flows from the asset and either (a) hastransferred substantially all the risks and rewards of the asset, or (b) has neither transferred norretained substantially all risks and rewards of the asset, but has transferred control of the asset.
Where the Group has transferred its rights to receive cash flows from an asset or has entered into apass-through arrangement and has neither transferred nor retained substantially all the risks andrewards of the asset nor transferred control of the asset, the asset is recognized to the extent of theGroup’s continuing involvement in the asset. Continuing involvement that takes the form of aguarantee over the transferred asset is measured at the lower of the original carrying amount of theasset and the maximum amount of consideration that the Group could be required to repay. Wherecontinuing involvement takes the form of a written and/or purchased option (including a cash-settledoption or similar provision) on the transferred asset, the extent of the Group’s continuinginvolvement is the amount of the transferred asset that the Group may repurchase, except that in thecase of a written put option (including a cash-settled option or similar provision) on asset measuredat fair value, the extent of the Group’s continuing involvement is limited to the lower of the fairvalue of the transferred asset and the option exercise price.

- 23 -
*SGVFS014558*
Financial liabilitiesA financial liability is derecognized when the obligation under the liability is discharged, cancelledor has expired.
Where an existing financial liability is replaced by another from the same lender on substantiallydifferent terms, or the terms of an existing liability are substantially modified, such an exchange ormodification is treated as a derecognition of the original liability and the recognition of a newliability, and the difference in the respective carrying amounts is recognized in the consolidatedstatement of income.
InventoriesMine products inventory, which consist of copper concentrates containing copper, gold and silver,are stated at NRV. Coal and petroleum inventory and materials and supplies are valued at the lowerof cost and NRV.
NRV for mine products and coal inventory is the selling price in the ordinary course of business,less the estimated costs of completion and estimated costs necessary to make the sale. In the case ofmaterials and supplies, NRV is the value of the inventories when sold at their condition at theconsolidated statement of financial position date.
Costs of coal include all mining and mine-related costs and cost of purchased coal from small-scaleminers. These costs are aggregated to come up with the total coal inventory cost. Unit cost isdetermined using the moving average method.
Cost of petroleum inventory includes share in productions costs consisting of costs of conversionand other costs incurred in bringing the inventories to their present location and condition. Unit costis determined using the weighted average method.
Costs of materials and supplies comprise all costs of purchase and other costs incurred in bringingthe materials and supplies to their present location and condition. The purchase cost is determinedon a moving average basis.
Input Tax RecoverableInput tax recoverable is stated at 10% in prior years up to January 2006 and 12% starting February2006 of the applicable purchase cost of goods and services, net of output tax liabilities and allowancefor probable losses. Input tax recoverable represents the value-added tax (VAT) paid on purchasesof applicable goods and services, net of output tax liabilities, which can be recovered as tax creditagainst future tax liabilities of the Group upon approval by the BIR and/or the Philippine Bureau ofCustoms.
Property, Plant and EquipmentProperty, plant and equipment, except land, are stated at cost less accumulated depletion anddepreciation and accumulated impairment in value, if any. Land is stated at cost less anyaccumulated impairment in value.
The initial cost of property, plant and equipment consists of its purchase price and any directlyattributable costs of bringing the asset to its working condition and location for its intended use andany estimated cost of dismantling and removing the property, plant and equipment item andrestoring the site on which it is located to the extent that the Group had recognized the obligation tothat cost. Such cost includes the cost of replacing part of the property, plant and equipment if therecognition criteria are met. When significant parts of property, plant and equipment are required tobe replaced in intervals, the Group recognizes such parts as individual assets with specific useful

- 24 -
*SGVFS014558*
lives and depreciation. Likewise, when a major inspection is performed, its cost is recognized in thecarrying amount of property, plant and equipment as a replacement if the recognition criteria aresatisfied. All other repair and maintenance costs are recognized in the consolidated statement ofincome as incurred.
When assets are sold or retired, the cost and related accumulated depletion and depreciation, andaccumulated impairment in value are removed from the accounts and any resulting gain or loss isrecognized in the consolidated statement of income.
Depletion or amortization of mine, mining and oil and gas properties is calculated using theunits-of-production method based on estimated recoverable reserves. Depreciation of other itemsof property, plant and equipment is computed using the straight-line method over the estimateduseful lives of the assets as follows:
No. of YearsBuildings 10 to 40Building improvements 5 to 10Machinery and equipment 2 to 20Surface structures 10
Depreciation or depletion of an item of property, plant and equipment begins when it becomesavailable for use, i.e., when it is in the location and condition necessary for it to be capable ofoperating in the manner intended by management. Depreciation or depletion ceases at the earlier ofthe date that the item is classified as held for sale (or included in a disposal group that is classifiedas held for sale) in accordance with PFRS 5, and the date the asset is derecognized.
The estimated recoverable reserves, useful lives, and depreciation and depletion methods arereviewed periodically to ensure that the estimated recoverable reserves, periods and methods ofdepletion and depreciation are consistent with the expected pattern of economic benefits from theitems of property, plant and equipment.
Property, plant and equipment also include the estimated costs of rehabilitating the ParentCompany’s Padcal Mine and BEMC’s Coal Mine, for which the Group is constructively liable.These costs, included under land, buildings and improvements, are amortized using theunits-of-production method based on the estimated recoverable mine reserves until the Groupactually incurs these costs in the future.
Level and block development (included as part of mine and mining and oil and gas properties) andconstruction in progress are stated at cost, which includes the cost of construction, plant andequipment, other direct costs and borrowing costs, if any. Block development and construction inprogress are not depleted nor amortized until such time as these are completed and become availablefor use.
Deferred Exploration CostsExpenditures for exploration works on oil and mining properties (i.e., acquisition of rights toexplore, topographical, geological, geochemical and geophysical studies, exploratory drilling,trenching, sampling, and activities in relation to evaluating the technical feasibility and commercialviability of extracting an oil and mineral resource) are deferred as incurred and included under“Deferred exploration costs and other noncurrent assets” account in the consolidated statement offinancial position. If and when recoverable reserves are determined to be present in commerciallyproducible quantities, the deferred exploration expenditures, and subsequent oil and mine

- 25 -
*SGVFS014558*
development costs are capitalized as part of the mine and mining and oil and gas properties accountclassified under property, plant and equipment.
A valuation allowance is provided for unrecoverable deferred oil and mine exploration costs basedon the Group’s assessment of the future prospects of the exploration project. Full provision is madefor the impairment unless it is probable that such costs are expected to be recouped throughsuccessful exploration and development of the area of interest, or alternatively, by its sale. If theproject does not prove to be viable or when the project is abandoned, the deferred oil and mineexploration costs associated with the project and the related impairment provisions are written off.Exploration areas are considered permanently abandoned if the related permits of the explorationhave expired and/or there are no definite plans for further exploration and/or development.
Borrowing CostsBorrowing costs that are directly attributable to the acquisition, construction or production of aqualifying asset as part of the cost of that asset is capitalized by the Group. The capitalization ofborrowing costs: (i) commences when the activities to prepare the assets are in progress andexpenditures and borrowing costs are being incurred; (ii) is suspended during the extended periodsin which active development, improvement and construction of the assets are interrupted; and(iii) ceases when substantially all the activities necessary to prepare the assets are completed.
Other borrowing costs are recognized as an expense in the period in which they are incurred.
Impairment of Noncurrent Non-financial AssetsThe Group’s noncurrent non-financial assets include property, plant and equipment, deferred mineexploration costs, and other noncurrent assets. The Group assesses at each reporting date whetherthere is indication that a noncurrent non-financial asset or CGU may be impaired. If any indicationexists, or when an annual impairment testing for such items is required, the Group makes an estimateof their recoverable amount. An asset’s recoverable amount is the higher of an asset’s or CGU’sfair value less costs to sell and its value in use, and is determined for an individual item, unless suchitem does not generate cash inflows that are largely independent of those from other assets or groupof assets or CGUs. When the carrying amount exceeds its recoverable amount, such item isconsidered impaired and is written down to its recoverable amount. In assessing value in use, theestimated future cash flows to be generated by such items are discounted to their present value usinga pre-tax discount rate that reflects the current market assessment of the time value of money andthe risks specific to the asset or CGU. Impairment losses of continuing operations are recognizedin the consolidated statement of income in the expense categories consistent with the function of theimpaired asset.
An assessment is made at least on each consolidated statement of financial position date as towhether there is indication that previously recognized impairment losses may no longer exist or mayhave decreased. If any indication exists, the recoverable amount is estimated and a previouslyrecognized impairment loss is reversed only if there has been a change in the estimate in the assetsor CGU’s recoverable amount since the last impairment loss was recognized. If so, the carryingamount of the item is increased to its new recoverable amount which cannot exceed the impairmentloss recognized in prior years. Such reversal is recognized in the consolidated statement of incomeunless the asset or CGU is carried at its revalued amount, in which case the reversal is treated as arevaluation increase. After such a reversal, the depreciation charge is adjusted in future periods toallocate the asset’s revised carrying amount less any residual value on a systematic basis over itsremaining estimated useful life.

- 26 -
*SGVFS014558*
Provision for Mine Rehabilitation CostsThe Group records the present value of estimated costs of legal and constructive obligations requiredto restore the mine site upon termination of the mine operations. The nature of these restorationactivities includes dismantling and removing structures, rehabilitating mines and settling ponds,dismantling operating facilities, closure of plant and waste sites, and restoration, reclamation andre-vegetation of affected areas. The obligation generally arises when the asset is constructed or theground or environment is disturbed at the mine site. When the liability is initially recognized, thepresent value of the estimated cost is capitalized as part of the carrying amount of the related miningassets.
Changes to estimated future costs are recognized in the consolidated statement of financial positionby either increasing or decreasing the rehabilitation liability and asset to which it relates if the initialestimate was originally recognized as part of an asset measured in accordance withPAS 16, Property, Plant and Equipment. Any reduction in the rehabilitation liability and, therefore,any deduction from the asset to which it relates, may not exceed the carrying amount of that asset.If it does, any excess over the carrying value is taken immediately to consolidated profit or loss.
If the change in estimate results in an increase in the rehabilitation liability and, therefore, anaddition to the carrying value of the asset, the Group considers whether this is an indication ofimpairment of the asset as a whole, and if so, tests for impairment in accordance with PAS 36.If, for mature mines, the estimate for the revised mine assets net of rehabilitation provisions exceedsthe recoverable value that portion of the increase is charged directly to expense.
For closed sites, changes to estimated costs are recognized immediately in consolidated profit orloss.
Capital StockOrdinary or common shares are classified as equity. The proceeds from the increase of ordinary orcommon shares are presented in equity as capital stock to the extent of the par value issued sharesand any excess of the proceeds over the par value or shares issued less any incremental costs directlyattributable to the issuance, net of tax, is presented in equity as additional paid-in capital.
Dividends on Common SharesCash and property dividends on common shares are recognized as a liability and deducted fromequity when approved by the respective shareholders of the Parent Company. Stock dividends aretreated as transfers from retained earnings to capital stock.
Dividends for the year that are approved after the consolidated statement of financial position dateare dealt with as an event after the consolidated statement of financial position date.
Retained EarningsRetained earnings represent the cumulative balance of periodic net income or loss, dividendcontributions, prior period adjustments, effect of changes in accounting policy and other capitaladjustments. When the retained earnings account has a debit balance, it is called “deficit.” A deficitis not an asset but a deduction from equity.
Unappropriated retained earnings represent that portion which is free and can be declared asdividends to stockholders. Appropriated retained earnings represent that portion which has beenrestricted and, therefore, not available for dividend declaration.

- 27 -
*SGVFS014558*
Revenue RecognitionRevenue is recognized upon delivery to the extent that it is probable that the economic benefitsassociated with the transaction will flow to the Group and the amount of revenue can be reliablymeasured. The Group assesses its revenue arrangements against specific criteria in order todetermine if it is acting as principal or agent. The Group has concluded that it is acting as principalin all of its revenue arrangements. The following specific recognition criteria must also be metbefore revenue is recognized:
Revenue from sale of mine productsRevenue from sale of mine products is measured based on shipment value price, which is based onquoted metal prices in the London Metals Exchange (LME) and London Bullion Metal Association(LBMA) and weight and assay content, as adjusted for marketing charges to reflect the NRV ofmine products inventory at the end of the financial reporting period. Contract terms for the Group’ssale of metals (i.e. gold, silver and copper) in concentrates and bullion allow for a price adjustmentbased on final assay results of the metal content by the customer.
The terms of metal in copper concentrates sales contracts with third parties contain provisionalarrangements whereby the selling price for the metal is based on prevailing spot prices on a specifiedfuture date after shipment to the customer (the quotation period). Mark-to-market adjustments tothe sales price occur based on movements in quoted market prices up to the date of final settlement,and such adjustments are recorded as part of revenue. The period between provisional invoicingand final settlement can be between one (1) and three (3) months. Ninety percent (90%) of theprovisional shipment value is collected within a week from shipment date, while the remaining tenpercent (10%) is collected upon determination of the final shipment value on final weight and assayfor metal content and prices during the applicable quotational period less deduction for smeltingcharges.
Revenue from sale of petroleum productsRevenue is derived from sale of petroleum to third party customers. Sale of oil is recognized at thetime of delivery of the product to the purchaser. Revenue is measured, based on participatinginterest of the Group, at the fair value of the consideration received, excluding discounts, rebates,and other sales tax or duty.
Revenue from sale of coalRevenue from sale of coal is recognized when the risks and rewards of ownership is transferred tothe buyer, on the date of shipment to customers when the coal is loaded into the Group’s orcustomers’ loading facilities.
Interest incomeInterest income is recognized as the interest accrues using the effective interest method.
Cost and Expense RecognitionCosts and expenses are recognized in the consolidated statement of income in the year they areincurred. The following specific cost and expense recognition criteria must also be met before costsand expenses are recognized:
Production costsProduction costs, which include all direct materials, power and labor costs, handling, hauling andstorage, and other costs related to the mining and milling operations, and all direct expenses incurredfor logistics and store room costs for mine and mining inventories, are expensed as incurred.

- 28 -
*SGVFS014558*
Excise taxes and royaltiesExcise taxes pertain to the taxes paid or accrued by the Parent Company for its legal obligationarising from the production of copper concentrates. Also, the Parent Company is paying forroyalties which are due to the claim owners of the land where the mine site operations were located.These excise taxes and royalties are expensed as incurred.
Petroleum production costsPetroleum production costs, which include all direct materials and labor costs, depletion of oil andgas properties, and other costs related to the oil and gas operations, are expensed when incurredbased on the Group’s participating revenue interest in the respective service contracts.
Cost of coal salesCost of coal sales includes costs of purchased coal and all direct materials and labor costs and othercosts related to the coal production. Cost of coal sales is recognized by the Group when sales aremade to customers.
General and administrative expensesGeneral and administrative expenses constitute the costs of administering the business and areexpensed as incurred.
Retirement Benefits CostsThe net defined benefit liability or asset is the aggregate of the present value of the defined benefitobligation at the end of the reporting period reduced by the fair value of plan assets (if any), adjustedfor any effect of limiting a net defined benefit asset to the asset ceiling. The asset ceiling is thepresent value of any economic benefits available in the form of refunds from the plan or reductionsin future contributions to the plan.
The cost of providing benefits under the defined benefit plans is actuarially determined using theprojected unit credit method.
Defined benefit costs comprise the following:∂ Service cost∂ Net interest on the net defined benefit liability or asset∂ Remeasurements of net defined benefit liability or asset
Service costs which include current service costs, past service costs and gains or losses on non-routine settlements are recognized as expense in profit or loss. Past service costs are recognizedwhen plan amendment or curtailment occurs. These amounts are calculated periodically byindependent qualified actuaries.
Net interest on the net defined benefit liability or asset is the change during the period in the netdefined benefit liability or asset that arises from the passage of time which is determined by applyingthe discount rate based on government bonds to the net defined benefit liability or asset. Net intereston the net defined benefit liability or asset is recognized as expense or income in consolidated profitor loss.
Remeasurements comprising actuarial gains and losses, return on plan assets and any change in theeffect of the asset ceiling (excluding net interest on defined benefit liability) are recognizedimmediately in OCI in the period in which they arise. Remeasurements are not reclassified toconsolidated profit or loss in subsequent periods.

- 29 -
*SGVFS014558*
Plan assets are assets that are held by a long-term employee benefit fund or qualifying insurancepolicies. Plan assets are not available to the creditors of the Parent Company, nor can they be paiddirectly to the Group. Fair value of plan assets is based on market price information. When nomarket price is available, the fair value of plan assets is estimated by discounting expected futurecash flows using a discount rate that reflects both the risk associated with the plan assets and thematurity or expected disposal date of those assets (or, if they have no maturity, the expected perioduntil the settlement of the related obligations). If the fair value of the plan assets is higher than thepresent value of the defined benefit obligation, the measurement of the resulting defined benefitasset is limited to the present value of economic benefits available in the form of refunds from theplan or reductions in future contributions to the plan.
The Parent Company’s right to be reimbursed of some or all of the expenditure required to settle adefined benefit obligation is recognized as a separate asset at fair value when and only whenreimbursement is virtually certain.
Termination benefitTermination benefits are employee benefits provided in exchange for the termination of anemployee’s employment as a result of either an entity’s decision to terminate an employee’semployment before the normal retirement date or an employee’s decision to accept an offer ofbenefits in exchange for the termination of employment.
A liability and expense for a termination benefit is recognized at the earlier of when the entity canno longer withdraw the offer of those benefits and when the entity recognizes related restructuringcosts. Initial recognition and subsequent changes to termination benefits are measured in accordancewith the nature of the employee benefit, as either post-employment benefits, short-term employeebenefits, or other long-term employee benefits.
Employee leave entitlementEmployee entitlements to annual leave are recognized as a liability when they are accrued to theemployees. The undiscounted liability for leave expected to be settled wholly before twelve monthsafter the end of the annual reporting period is recognized for services rendered by employees up tothe end of the reporting period.
Share-based PaymentsCertain officers and employees of the Group receive additional remuneration in the form of share-based payments of either the Parent Company or FEP, whereby equity instruments (or “equity-settled transactions”) are awarded in recognition of their services.
The cost of equity-settled transactions with employees is measured by reference to their fair valueat the date they are granted, determined using the acceptable valuation techniques. Further detailsare given in Note 27.
The cost of equity-settled transactions, together with a corresponding increase in equity, isrecognized over the period in which the performance and/or service conditions are fulfilled endingon the date on which the employees become fully entitled to the award (“vesting date”). Thecumulative expense recognized for equity-settled transactions at each reporting date up to and untilthe vesting date reflects the extent to which the vesting period has expired, as well as the Group’sbest estimate of the number of equity instruments that will ultimately vest. The consolidatedstatements of income charge or credit for the period represents the movement in cumulative expenserecognized at the beginning and end of that period. No expense is recognized for awards that do notultimately vest, except for awards where vesting is conditional upon a market condition, which

- 30 -
*SGVFS014558*
awards are treated as vesting irrespective of whether or not the market condition is satisfied,provided that all other performance conditions are satisfied.
Where the terms of an equity-settled award are modified, as a minimum, an expense is recognizedas if the terms had not been modified. An additional expense is likewise recognized for anymodification which increases the total fair value of the share-based payment arrangement or whichis otherwise beneficial to the employee as measured at the date of modification.
Where an equity-settled award is cancelled, it is treated as if it had vested on the date of cancellation,and any expense not yet recognized for the award is recognized immediately. If a new award,however, is substituted for the cancelled awards and designated as a replacement award, thecancelled and new awards are treated as if they were a modification of the original award, asdescribed in the previous paragraph.
Foreign Currency-Denominated Transactions and TranslationsTransactions denominated in foreign currencies are recorded using the exchange rate at the date ofthe transaction. Outstanding monetary assets and monetary liabilities denominated in foreigncurrencies are restated using the rate of exchange at the consolidated statement of financial positiondate. Non-monetary items that are measured at fair value in a foreign currency shall be translatedusing the exchanges rates at the date when the fair value was determined.
When a gain or loss on a non-monetary item is recognized in other comprehensive income, anyforeign exchange component of that gain or loss shall be recognized in the consolidated statementof comprehensive income. Conversely, when a gain or loss on a non-monetary item is recognizedin profit or loss, any exchange component of that gain or loss shall be recognized in the consolidatedstatement of income.
Income TaxesCurrent income taxCurrent income tax assets and liabilities for the current and prior periods are measured at the amountexpected to be recovered from or paid to the taxation authorities. The tax rates and tax laws used tocompute the amount are those that are enacted or substantively enacted at the consolidated statementof financial position date.
Deferred income taxDeferred income tax is provided using the liability method on temporary differences between thetax bases of assets and liabilities and their carrying amounts for financial reporting purposes at thereporting date.
Deferred income tax liabilities are recognized for all taxable temporary differences, except:
∂ When the deferred income tax liability arises from the initial recognition of goodwill or an assetor liability in a transaction that is not a business combination and, at the time of the transaction,affects neither the accounting profit nor taxable profit or loss,
∂ In respect of taxable temporary differences associated with investments in subsidiaries,associates and interests in joint ventures, when the timing of the reversal of the temporarydifferences can be controlled and it is probable that the temporary differences will not reversein the foreseeable future.
Deferred income tax assets are recognized for all deductible temporary differences, the carryforward benefits of the excess of minimum corporate income tax (MCIT) over the regular corporateincome tax (RCIT) [excess MCIT], and net operating loss carryover (NOLCO), to the extent that it

- 31 -
*SGVFS014558*
is probable that sufficient future taxable profits will be available against which the deductibletemporary differences, excess MCIT and NOLCO can be utilized, except:
∂ When the deferred income tax asset relating to the deductible temporary difference arises fromthe initial recognition of an asset or liability in a transaction that is not a business combinationand, at the time of the transaction, affects neither the accounting profit nor taxable profit orloss,
∂ In respect of deductible temporary differences associated with investments in subsidiaries,associates and interests in joint ventures, deferred income tax assets are recognized only to theextent that it is probable that the temporary differences will reverse in the foreseeable future andtaxable profit will be available against which the temporary differences can be utilized.
In business combinations, the identifiable assets acquired and liabilities assumed are recognized attheir fair values at acquisition date. Deferred income tax liabilities are provided on temporarydifferences that arise when the tax bases of the identifiable assets acquired and liabilities assumedare not affected by the business combination or are affected differently.
The carrying amount of deferred income tax assets is reviewed at each reporting date and reducedto the extent that it is no longer probable that sufficient taxable profit will be available to allow allor part of the deferred income tax asset to be utilized. Unrecognized deferred income tax assets arere-assessed at each reporting date and are recognized to the extent that it has become probable thatfuture taxable profits will allow the deferred income tax asset to be recovered.
Deferred income tax assets and liabilities are measured at the tax rates that are expected to applyin the year when the asset is realized or the liability is settled, based on tax rates (and tax laws)that have been enacted or substantively enacted at the reporting date.
Deferred income tax assets and deferred income tax liabilities are offset if a legally enforceable rightexists to set off the current income tax assets against the current income tax liabilities and thedeferred income taxes relate to the same taxable entity and the same taxation authority.
Provisions and ContingenciesProvisions are recognized when the Group has a present obligation (legal or constructive) as a resultof a past event, it is probable that an outflow of resources embodying economic benefits will berequired to settle the obligation and a reliable estimate can be made of the amount of the obligation.If the effect of the time value of money is material, provisions are determined by discounting theexpected future cash flows at a pre-tax rate that reflects current market assessments of the time valueof money and, where appropriate, the risks specific to the liability.
Where discounting is used, the increase in the provision due to the passage of time is recognized asinterest expense. When the Group expects a provision or loss to be reimbursed, the reimbursementis recognized as a separate asset only when the reimbursement is virtually certain and its amount isestimable. The expense relating to any provision is presented in the consolidated statement ofincome, net of any reimbursement.
Contingent liabilities are not recognized in the consolidated financial statements but are disclosedin the notes to the consolidated financial statements unless the possibility of an outflow of resourcesembodying economic benefits is remote. Contingent assets are not recognized in the consolidatedfinancial statements but disclosed when an inflow of economic benefits is probable. Contingentassets are assessed continually to ensure that developments are appropriately reflected in theconsolidated financial statements. If it has become virtually certain that an inflow of economic

- 32 -
*SGVFS014558*
benefits will arise, the asset and the related income are recognized in the consolidated financialstatements.
Basic Earnings Per ShareBasic earnings per share is computed by dividing the net income attributable to equity holders ofthe Parent Company by the weighted average number of common shares outstanding during the yearafter giving retroactive effect to stock dividends declared and stock rights exercised during the year,if any.
Diluted Earnings Per ShareDiluted earnings per share amounts are calculated by dividing the net income attributable to equityholders of the Parent Company by the weighted average number of ordinary shares outstandingduring the year plus the weighted average number of ordinary shares that would be issued on theconversion of all dilutive potential ordinary shares into ordinary shares.
Other Comprehensive IncomeOther comprehensive income comprises items of income and expense (including items previouslypresented under the consolidated statement of changes in equity) that are not recognized in theconsolidated statement of income for the year in accordance with PFRS.
Events After the Statement of Financial Position DateEvents after the consolidated statement of financial position date that provide additional informationabout the Group’s position at the consolidated statement of financial position date (adjusting event)are reflected in the consolidated financial statements. Events after the consolidated statement offinancial position date that are not adjusting events, if any, are disclosed when material to theconsolidated financial statements.
Operating SegmentA business segment is a group of assets and operations engaged in providing products or servicesthat are subject to risks and returns that are different from those of other business segments. Ageographical segment is engaged in providing products or services within a particular economicenvironment that is subject to risks and returns that are different from those of segments operatingin other economic environments. For management purposes, the Group is organized into businessunits based on their products and services, and has three (3) reportable operating segments. Financialinformation on business segments is presented in Note 5. The Group operates in one geographicalsegment, being the location of its current mining activities; therefore, geographical segmentinformation is no longer presented.
3. Management’s Use of Significant Judgments, Accounting Estimates and Assumptions
The preparation of the consolidated financial statements in accordance with accounting principlesgenerally accepted in the Philippines requires the management of the Group to exercise judgment,make accounting estimates and use assumptions that affect the reported amounts of assets, liabilities,income and expenses, and disclosure of any contingent assets and contingent liabilities. Futureevents may occur which will cause the assumptions used in arriving at the accounting estimates tochange. The effects of any change in accounting estimates are reflected in the consolidated financialstatements as they become reasonably determinable.
Accounting assumptions, estimates and judgments are continually evaluated and are based onhistorical experience and other factors, including expectations of future events that are believed tobe reasonable under the circumstances.

- 33 -
*SGVFS014558*
JudgmentsIn the process of applying the Group’s accounting policies, management has made the followingjudgments, apart from those involving estimations, which have the most significant effects onamounts recognized in the consolidated financial statements:
Determination of the Functional CurrencyThe Parent Company and most of its local subsidiaries based on the relevant economic substance ofthe underlying circumstances, have determined their functional currency to be the Philippine peso.It is the currency of the primary economic environment in which the Parent Company and most ofits local subsidiaries primarily operates. FEC’s functional currency is Canadian dollar. PGI, PPPand FEP’s functional currencies are US dollar.
Recognition of Deferred Income Tax AssetsThe Group reviews the carrying amounts at each end of reporting period and adjusts the balance ofdeferred income tax assets to the extent that it is no longer probable that sufficient future taxableprofits will be available to allow all or part of the deferred income tax assets to be utilized. Thesufficiency of future taxable profits requires the use of assumptions, judgments and estimates,including future prices of metals, volume of inventories produced and, sold and amount of costs andexpenses that are subjectively determined like depreciation. As at December 31, 2016 and 2015,deferred income tax assets recognized in the consolidated statements of financial position amountedto P=322,023 and P=306,335, respectively (see Note 25). As at December 31, 2016 and 2015, nodeferred income tax assets were recognized on the following deductible temporary differencesamounting to about P=2,730,995 and P=2,655,280, respectively (see Note 25), because managementbelieves that it is not probable that future taxable income will be available to allow all or part of thebenefit of the deferred income tax assets to be utilized.
Classification of Financial InstrumentsThe Group exercises judgment in classifying financial instruments in accordance with PAS 39. TheGroup classifies a financial instrument, or its components, on initial recognition as a financial asset,a financial liability or an equity instrument in accordance with the substance of the contractualarrangement and the definitions of a financial asset, a financial liability or an equity instrument. Thesubstance of a financial instrument, rather than its legal form, governs its classification in theGroup’s consolidated statements of financial position.
The Group has no intention of selling its investments in stocks in the near term. These are beingheld indefinitely and may be sold in response to liquidity requirements or changes in marketcondition. The Group has no plans to dispose its AFS investments within 12 months from the endof the reporting date.
The Group determines the classification at initial recognition and re-evaluates this classification,where allowed and appropriate, at every reporting date (see Note 20).
Determining and Classifying a Joint ArrangementJudgment is required to determine when the Group has joint control over an arrangement, whichrequires an assessment of the relevant activities and when the decisions in relation to those activitiesrequire unanimous consent. The Group has determined that the relevant activities for its jointarrangements are those relating to the operating and capital decisions of the arrangement.Judgment is also required to classify a joint arrangement.
Classifying the arrangement requires the Group to assess their rights and obligations arising fromthe arrangement. Specifically, the Group considers:∂ The structure of the joint arrangement - whether it is structured through a separate vehicle

- 34 -
*SGVFS014558*
∂ When the arrangement is structured through a separate vehicle, the Group also considers therights and obligations arising from:a. The legal form of the separate vehicleb. The terms of the contractual arrangementc. Other facts and circumstances (when relevant)
This assessment often requires significant judgment, and a different conclusion on joint control andalso whether the arrangement is a joint operation or a joint venture, may materially impact theaccounting.
As at December 31, 2015, the Group’s joint arrangement is in the form of a joint operation. As atDecember 31, 2016, the Group has no joint arrangement as a result of loss of control over PXP andits subsidiaries (see Notes 26 and 33).
Accounting Estimates and AssumptionsThe key assumptions concerning the future and other key sources of estimation uncertainties at theend of reporting period that have a significant risk of causing a material adjustment to the carryingamounts of assets and liabilities within the next financial year are as follows:
Measurement of Mine Products RevenueMine products revenue is provisionally priced until or unless these are settled at pre-agreed futureor past dates referred to as “quotational period,” the prevailing average prices at which time becomethe basis of the final price. Revenue on mine products is initially recognized based on shipmentvalues calculated using the provisional metals prices, shipment weights and assays for metal contentless deduction for insurance and smelting charges as marketing. The final shipment values aresubsequently determined based on final weights and assays for metal content and prices during theapplicable quotational period. Total mine products revenue, gross of smelting charges, amounted toP=10,271,665, P=9,189,382 and P=10,586,663 in 2016, 2015 and 2014, respectively.
Impairment of Loans and ReceivablesThe Group maintains an allowance for doubtful accounts at a level that management considersadequate to provide for potential uncollectability of its loans and receivables. The Group evaluatesspecific balances where management has information that certain amounts may not be collectible.In these cases, the Group uses judgment, based on available facts and circumstances, and based ona review of the factors that affect the collectability of the accounts. The review is made bymanagement on a continuing basis to identify accounts to be provided with allowance.
The Group did not assess its loans and receivables for collective impairment due to fewcounterparties that can be specifically identified. Outstanding trade receivables are mainly from theParent Company’s main customer. Other receivables of the Group are not material. The amount ofloss is recognized in the consolidated statements of income with a corresponding reduction in thecarrying value of the loans and receivables through an allowance account. Total carryingvalue of loans and receivables amounted to P=3,123,522 and P=1,769,486 as at December 31, 2016and 2015, respectively (see Note 21). Allowance for impairment on these financial assets amountedto P=1,747, as at December 31, 2016 and 2015 (see Note 7).
Valuation of AFS Financial AssetsThe Group carries its quoted and unquoted AFS financial assets at fair value and at cost,respectively. Fair value measurement requires the use of accounting estimates and judgment. Atinitial recognition, the fair value of quoted AFS financial assets is based on its quoted price in anactive market, while the fair value of unquoted AFS financial assets is based on the latest available

- 35 -
*SGVFS014558*
transaction price. The amount of changes in fair value would differ if the Group utilized a differentvaluation methodology.
Any change in fair value of its AFS financial assets is recognized in the consolidated statements ofcomprehensive income. As at December 31, 2016 and 2015, the Group has net cumulativeunrealized loss on its AFS financial assets amounting to P=3,094 and P=1,022, respectively (seeNote 11). As at December 31, 2016 and 2015, the carrying value of the Group’s AFS financial assetsamounted to P=104,615 and P=106,687, respectively (see Note 11).
Impairment of AFS Financial AssetsThe Group treats AFS financial assets as impaired when there has been a significant or prolongeddecline in fair value below its cost or where other objective evidence of impairment exists. Thedetermination of what is “significant” or “prolonged” requires judgment. The Group treats“significant” generally as 20% or more and “prolonged” as greater than 12 months for quoted equitysecurities. In addition, the Group evaluates other factors, including normal volatility in share pricefor quoted equities and the future cash flows and the discount factors for unquoted securities. As atDecember 31, 2016 and 2015, the carrying value of the Group’s AFS financial assets amounted toP=104,615 and P=106,687, respectively (see Note 11). No impairment loss was recognized in 2016,2015 and 2014.
Impairment of GoodwillThe Group reviews the carrying values of goodwill for impairment annually or more frequently ifevents or changes in circumstances indicate that the carrying value may be impaired. Impairmentis determined for goodwill by assessing the recoverable amount of the CGU or group of CGUs towhich the goodwill relates. Assessments require the use of estimates and assumptions such as long-term commodity prices, discount rates, future capital requirements, exploration potential andoperating performance. If the recoverable amount of the unit exceeds the carrying amount of theCGU, the CGU and the goodwill allocated to that CGU shall be regarded as not impaired. Wherethe recoverable amount of the CGU or group of CGUs is less than the carrying amount of the CGUor group of CGUs to which goodwill has been allocated, an impairment loss is recognized. Noimpairment losses were recognized in 2016, 2015 and 2014, whereas the carrying value ofgoodwill as at December 31, 2016 and 2015 amounted to nil and P=1,238,583, respectively(see Notes 1, 4 and 33).
Measurement of NRV of Mine Products InventoryThe NRV of mine products inventory is the estimated sales value less costs to sell, which can bederived from such inventory based on its weight and assay for metal content, and the LME andLBMA for prices, which also represents an active market for the product. Changes in weight andassay for metal content as well as the applicable prices as the mine products inventory are eventuallyshipped and sold are accounted for and accordingly adjusted in revenue. The NRV of mine productsinventory as at December 31, 2016 and 2015 amounted to P=1,059,280 and P=543,228, respectively,which were also reflected as part of mine products revenue for the years then ended (see Note 8).
Write-down of Carrying Values of Coal and Materials and Supplies InventoriesThe Group carries coal and material and supplies inventories at NRV when such value is lower thancost due to damage, physical deterioration, obsolescence or other causes. When it is evident thatthe NRV is lower than its cost based on physical appearance and condition of inventories, anallowance for inventory obsolescence is provided. Related allowance for inventory obsolescenceon materials and supplies amounted to P=100,126 and P=116,185 as at December 31, 2016 and 2015,respectively. The carrying value of materials and supplies inventories amounted to P=1,259,570 andP=1,334,272 as at December 31, 2016 and 2015, respectively (see Note 8). Additional provision for

- 36 -
*SGVFS014558*
materials and supplies obsolescence amounted to P=30,000 and nil in 2016 and 2015, respectively(see Note 8).
Related allowance for decline in coal inventory and materials and supplies derecognized during theyear amounted to P=220,083 and P=46,059, respectively. The carrying amount of coal inventoryamounted to nil as at December 31, 2016 and 2015 (see Note 8).
Estimation of Fair Value of Identifiable Net Assets of an Acquiree in a Business CombinationThe Group applies the acquisition method of accounting whereby the purchase consideration isallocated to the identifiable assets, liabilities and contingent liabilities (identifiable net assets) on thebasis of fair value at the date of acquisition. The determination of fair values requires estimates ofeconomic conditions and factors such as metal prices, mineral reserve, freight exchange rates andothers. Transactions qualified as business combinations are discussed in Note 4.
Estimation of Useful Lives of Property, Plant and EquipmentThe Group estimates the useful lives of depreciable property, plant and equipment, except for mineand mining and oil and gas properties, based on internal technical evaluation and experience. Theseestimated useful lives are reviewed periodically and updated if expectations differ from previousestimates due to physical wear and tear, technical and commercial obsolescence and other limits onthe use of the assets. For mine and mining properties which were depreciated based on units-ofproduction, the Group estimates and periodically reviews the remaining recoverable reserves toensure that remaining reserves are reflective of the current condition of the mine and mining and oiland gas properties. The estimated useful lives of the Group’s property, plant and equipment aredisclosed in Note 2 to the consolidated financial statements.
As at December 31, 2016 and 2015, net book value of property, plant and equipment amounted toP=6,735,578 and P=6,828,052 respectively (see Note 10).
Estimation of Recoverable ReservesRecoverable reserves were determined using various factors or parameters such as market price ofmetals and global economy. These are economically mineable reserves based on the current marketcondition and concentration of mineral resource. The estimated recoverable reserves are used in thecalculation of depreciation, amortization and testing for impairment, the assessment of life of themine, and for forecasting the timing of the payment of mine rehabilitation costs. On June 30, 2011,the Padcal Mine life had been extended from 2017 to 2020. On March 20, 2015, the Padcal Minelife has been extended once again from 2020 to 2022. The extension of mine life is due to theadditional reserves from the mineral resources delineated below the current mining level.
As at December 31, 2016 and 2015, the carrying value of the mine and mining properties of theParent Company amounted to P=3,574,005 and P=3,109,995, respectively net of related accumulateddepletion amounting to P=9,415,853 and P=8,655,590, respectively.
Estimation of Provision for Mine Rehabilitation CostsThe Group recognized a liability relating to the estimated costs of mine rehabilitation. The Groupassesses its mine rehabilitation provision annually. Significant estimates and assumptions are madein determining the provision for mine rehabilitation as there are numerous factors that will affectthe ultimate liability. These factors include estimates of the extent and costs of rehabilitationactivities, technological changes, regulatory changes, cost increases and changes in discount rates.
Those uncertainties may result in future actual expenditure differing from the amounts currentlyprovided. The provision at each end of the reporting period represents management’s best estimateof the present value of the future rehabilitation costs required. Changes to estimated future costs

- 37 -
*SGVFS014558*
are recognized in the consolidated statements of financial position by adjusting the rehabilitationasset and liability. If the net rehabilitation provisions of revised mine assets for mature mines exceedthe carrying value, that portion of the increase is charged directly to the consolidated statements ofincome. For closed sites, changes to estimated costs are recognized immediately in the consolidatedstatements of income. Provision for mine rehabilitation costs amounted to P=129,234 and P=134,898as at December 31, 2016 and 2015, respectively (see Note 10).
Impairment of Non-financial AssetsThe Group’s non-financial assets include input tax recoverable, property, plant and equipment,deferred mine and oil exploration costs, other noncurrent asset, net pension asset, and investment inassociates. The Group assesses whether there are indications of impairment on its current andnoncurrent non-financial assets, at least on an annual basis. If there is objective evidence, animpairment testing is performed. This requires an estimation of the value in use of the CGUs towhich the assets belong. Assessments require the use of estimates and assumptions such as VATdisallowance rate, long-term commodity prices, discount rates, future capital requirements,exploration potential and operating performance. In assessing value in use, the estimated futurecash flows are discounted to their present value using a suitable discount rate that reflects currentmarket assessments of the time value of money and the risks specific to the asset. Impairment lossesamounting to P=2,504,850, nil and P=231,401 were recognized in 2016, 2015 and 2014, respectively.As at December 31, 2016 and 2015, the carrying value of non-financial assets amounted toP=33,017,307 and P=38,270,648, respectively (see Notes 9, 10, 12, 13 and 19).
Valuation of Financial InstrumentsThe Group carries certain financial assets and financial liabilities (i.e., derivatives and AFS financialassets) at fair value, which requires the use of accounting estimates and judgment. While significantcomponents of fair value measurement were determined using verifiable objective evidence(i.e., foreign exchange rates, interest rates, quoted equity prices), the amount of changes in fair valuewould differ if the Group utilized a different valuation methodology. Any change in fair value ofthese financial assets and financial liabilities is recognized in the consolidated statements of incomeand in the consolidated statements of comprehensive income.
The carrying values and corresponding fair values of financial assets and financial liabilities as wellas the manner in which fair values were determined are discussed in Note 20.
Convertible BondsThe Group’s convertible bonds, treated as a compound financial instrument, are separated intoliability and equity components based on the terms of the contract. On issuance of the convertiblebonds, the fair value of the liability component is determined using a market rate for an equivalentnon-convertible instrument. This amount is classified as a financial liability measured at amortizedcost (net of transaction costs) until it is extinguished on conversion or redemption. The remainderof the proceeds is allocated to the conversion option that is recognized and included in equity.Transaction costs are deducted from equity, net of associated income tax. The carrying amount ofthe conversion option is not remeasured in subsequent years. Transaction costs are apportionedbetween the liability and equity components of the convertible bonds based on the allocation ofproceeds to the liability and equity components when the instruments are initially recognized(see Note 14).
Provisions for LossesThe Group provides for present obligations (legal or constructive) where it is probable that therewill be an outflow of resources embodying economic benefits that will be required to settle the saidobligations. An estimate of the provision is based on known information at each end of the reporting

- 38 -
*SGVFS014558*
period, net of any estimated amount that may be reimbursed to the Group. The amount of provisionis being re-assessed at least on an annual basis to consider new relevant information (see Note 31).
Estimation of Net Pension Obligations (Plan Assets) and CostsThe Group’s net retirement benefits costs are actuarially computed using certain assumptions withrespect to future annual salary increases and discount rates per annum, among others. The ParentCompany’s net excess retirement plan asset amounted to P=328,118 and P=285,835 as atDecember 31, 2016 and 2015, respectively (see Note 19). SMMCI’s retirement liability amountedto P=15,548 and P=21,968 as at December 31, 2016 and 2015, respectively (see Note 19).
4. Business Combinations
Acquisition of SMECI and SMMCIOn February 6, 2009, the Parent Company acquired control over SMECI and SMMCI from AngloAmerican Exploration (Philippines), Inc. which qualified as a step acquisition. Due to thetransaction, a revaluation surplus amounting to P=1,572,385 was recognized.
Business combinations of a subsidiary group until July 15, 2016 are as follows:
Acquisition of PPPOn April 5, 2013, PXP increased its stake in PPP from 18.46% to 50.28% through acquisition ofadditional 46.4 million shares at US$0.75 per share which resulted to PXP obtaining control overPPP. The goodwill of P=1,534,168 arising from the acquisition pertains to the revenue potential theGroup expects from PPP Peru Block Z-38, SC 14 Block C-2 (West Linapacan) and other Philippineblocks.
As at the acquisition date, the fair value of the net identifiable assets and liabilities of the PPP areas follows:
Fair ValueRecognized on
Acquisition
Previous CarryingValue in the
SubsidiaryAssetsCash and cash equivalents P=803,379 P=803,379Receivables 40,916 40,916Inventories 1,035 1,035Deferred exploration oil and gas exploration costs 5,521,113 407,219Property and equipment 2,801 2,801Other noncurrent assets 6,842 6,842
6,376,086 1,262,192LiabilitiesAccounts payable and accrued liabilities P=48,391 P=48,391Deferred tax liability 1,534,168 –
1,582,559 48,391Total identifiable net assets P=4,793,527 P=1,213,801Total consideration 6,327,695Goodwill arising from acquisition P=1,534,168

- 39 -
*SGVFS014558*
The fair values of deferred oil and gas exploration costs recognized as at December 31, 2013financial statements were based on a provisional assessment of their fair value while the Groupsought for the final results of independent valuations for the assets. The valuation is based ondiscounted cash flows for each of the project subject to uncertainty which involves significantjudgments on many variables that cannot be precisely assessed at reporting date.
During 2014, results of studies from third party oil and gas consultants and competent persons wereobtained by each of the respective operators of the projects which enabled the Group to perform andupdate the discounted cash flows. As a result of these assessment, an increase in carrying amountof Peru exploration assets by P=393,399 occurred while assets in the Philippines decreased by thesame amount. These adjustments, however, did not have any material effect on goodwill, deferredtax assets or liabilities, impairment losses and foreign currency exchange gains or losses as atDecember 31, 2014.
In business combinations, the identifiable assets acquired and liabilities assumed are recognized attheir fair values at the acquisition date. Deferred income tax liabilities are provided on temporarydifferences that arise when the tax bases of the identifiable assets acquired and liabilities assumedare not affected by the business combination or are affected differently.
The aggregate consideration follows:
AmountFair value of previously held interest P=1,313,700Consideration transferred for additional interest acquired 1,433,332Fair value of non-controlling interest 3,580,663
P=6,327,695
The Group measured NCI using the fair value method.
AmountConsideration transferred for additional interest acquired P=1,433,332Less cash of acquired subsidiary 803,379
P=629,953
Revenues and net income of the acquiree since the acquisition date amounted to P=3,465 andP=1,980,796, respectively. Consolidated revenue and net income of the Group had the businesscombination occurred on January 1, 2013 would be higher by P=2,564 and lower by P=34,650,respectively.
The Group also recorded additional retirement benefit liability amounting to P=11,373 as atJanuary 1, 2013 as a result of the business combination.
Acquisition of SMECI and SMMCIOn February 6, 2009, the Parent Company acquired control over SMECI and SMMCI from AngloAmerican Exploration (Philippines), Inc. which qualified as a step acquisition. Due to thetransaction, a revaluation surplus amounting to P=1,572,385 was recognized.
Acquisition of FEPOn July 3, 2008, PXP acquired control over FEP through a transaction which qualified as a stepacquisition. A revaluation surplus amounting to P=39,012 was recognized which pertains to theadjustment to the fair values of the net assets of FEP relating to the previously held interest of theParent Company in FEP through FEC.

- 40 -
*SGVFS014558*
Acquisition of BEMC and FECOn September 24, 2010, PMC transferred all of its investment in shares of stock in BEMC and FECto PXP. This qualified as a business combination under common control. The acquisitions resultedto an increase in equity reserves and non-controlling interests amounting P=40,588 and P=303,525,respectively, as at the date of business combinations. Goodwill arising from the businesscombination amounted to P=258,593.
GoodwillAs at December 31, 2016 and 2015, the goodwill resulting from business combinations amounting tonil and P=1,238,583, respectively, are allocated to the Group’s cash-generating units namely: SC 14 C1Galoc Oil Field, SC 14 A&B Nido-Matinloc, SC 72 Reed Bank and Peru Z38. The Group performedits annual impairment test in 2015.
The recoverable amount of the CGUs were determined based on a value in use calculation usingcash flow projections from financial budgets covering the expected life of the oil and gas fields.Based on its analysis, management concluded that the goodwill is recoverable. The calculation ofthe value in use for the CGUs incorporates the following key assumptions: a) oil prices which areestimated with reference to external market forecasts; b) volume of resources and reserves whichare based on resources and reserves report prepared by third party; c) capital expenditure andproduction and operating costs which are based on the Group's historical experience and latest lifeof well models; and d) discount rate of 10%. The management believes that key assumptions usedin determining the recoverable amount at reasonable possible changes would not cause the CGUscarrying amount to exceed its recoverable amount.
In 2016, goodwill was derecognized as a result of loss of control over PXP and its subsidiaries(see Notes 26 and 33).
5. Segment Information
The Group is organized into business units on their products and activities and has two reportablebusiness segments: the mining and metals segment, and the energy and hydrocarbon segment untilJuly 15, 2016 when the deconsolidation of the energy and hydrocarbon took place. The operatingbusinesses are organized and managed separately through the Parent Company and its subsidiariesaccording to the nature of the products provided, with each segment representing a strategic businessunit that offers different products to different markets.
Management monitors the operating results of its business units separately for the purpose of makingdecisions about resource allocation and performance assessment. Segment performance is evaluatedbased on net income (loss) for the year, earnings before interest, taxes and depreciation and depletion(EBITDA), and core net income (loss).
Net income (loss) for the year is measured consistent with consolidated net income (loss) in theconsolidated statements of income. EBITDA is measured as net income excluding interest expense,interest income, provision for (benefit from) income tax, depreciation and depletion of property,plant and equipment and effects of non-recurring items.
EBITDA is not a uniform or legally defined financial measure. EBITDA is presented because theGroup believes it is an important measure of its performance and liquidity. The Group reliesprimarily on the results in accordance with PFRS and uses EBITDA only as supplementaryinformation.

- 41 -
*SGVFS014558*
The Group is also using core net income (loss) in evaluating total performance. Core income is theperformance of business segments based on a measure of recurring profit. This measurement basisis determined as profit attributable to equity holders of the Parent Company excluding the effects ofnon-recurring items, net of their tax effects. Non-recurring items represent gains (losses) that,through occurrence or size, are not considered usual operating items, such as foreign exchange gains(losses), gains (losses) on derivative instruments, gains (losses) on disposal of investments, andother non-recurring gains (losses).
The following tables present revenue and profit and certain asset and liability information regardingthe Group’s business segments:
December 31, 2016
MetalsEnergy and
Hydrocarbon*
UnallocatedCorporate
Balances Eliminations TotalRevenueExternal customers P=9,378,387 P=− P=− P=− P=9,378,387Consolidated revenue P=9,378,387 P=− P=− P=− P=9,378,387
ResultsEBITDA P=3,429,066 (P=30,840) P=979 P=455,020 P=3,854,225Interest income – net 1,997 1,899 84 − 3,980Income tax benefit (697,224) 436 − − (696,788)Depreciation and depletion (1,481,405) − − − (1,481,405)Non-recurring items (112,044) (597) − − (112,641)Consolidated net income (loss) P=1,140,390 (P=29,102) P=1,063 P=455,020 P=1,567,371
Core net income (loss) P=1,665,195 (P=7,567) (P=224) P=− P=1,657,404
Consolidated total assets P=41,860,372 P=− P=9,129 (P=3,207,672) P=38,661,829
Consolidated total liabilities P=13,735,121 P=− P=443 P=1,527,005 P=15,262,569
Other Segment Information:Capital expenditures and other non-current assets P=2,091,610 P=− P=− P=− P=2,091,610*January 1 to July 15, 2016.
December 31, 2015
MetalsEnergy and
Hydrocarbon
UnallocatedCorporateBalances Eliminations Total
RevenueExternal customers P=8,352,785 P=172,250 P=− P=− P=8,525,035Consolidated revenue P=8,352,785 P=172,250 P=− P=− P=8,525,035
ResultsEBITDA P=3,379,577 (P=132,367) P=204 (P=468,561) P=2,778,853Interest income (expense) – net 4,085 7,444 − − 11,529Income tax benefit (366,580) (16) − − (366,596)Depreciation and depletion (1,563,972) (4,175) (284) − (1,568,431)Non-recurring items (64,809) (14,911) − − (79,720)Consolidated net income (loss) P=1,388,301 (P=144,025) (P=80) (P=468,561) P=775,635
Core net income (loss) P=939,930 (P=34,893) P=205 P=− P=905,242Consolidated total assets P=39,469,736 P=4,057,188 P=132 P=− P=43,527,056
Consolidated total liabilities P=14,924,608 P=1,317,339 P=1,207 P=− P=16,243,154
Other Segment Information:Capital expenditures and other non-current assets P=3,844,397 P=214,787 P=− P=− P=4,059,184Non-cash expenses other than depletion
and depreciation 173,828 362,354 − 41,187 577,369
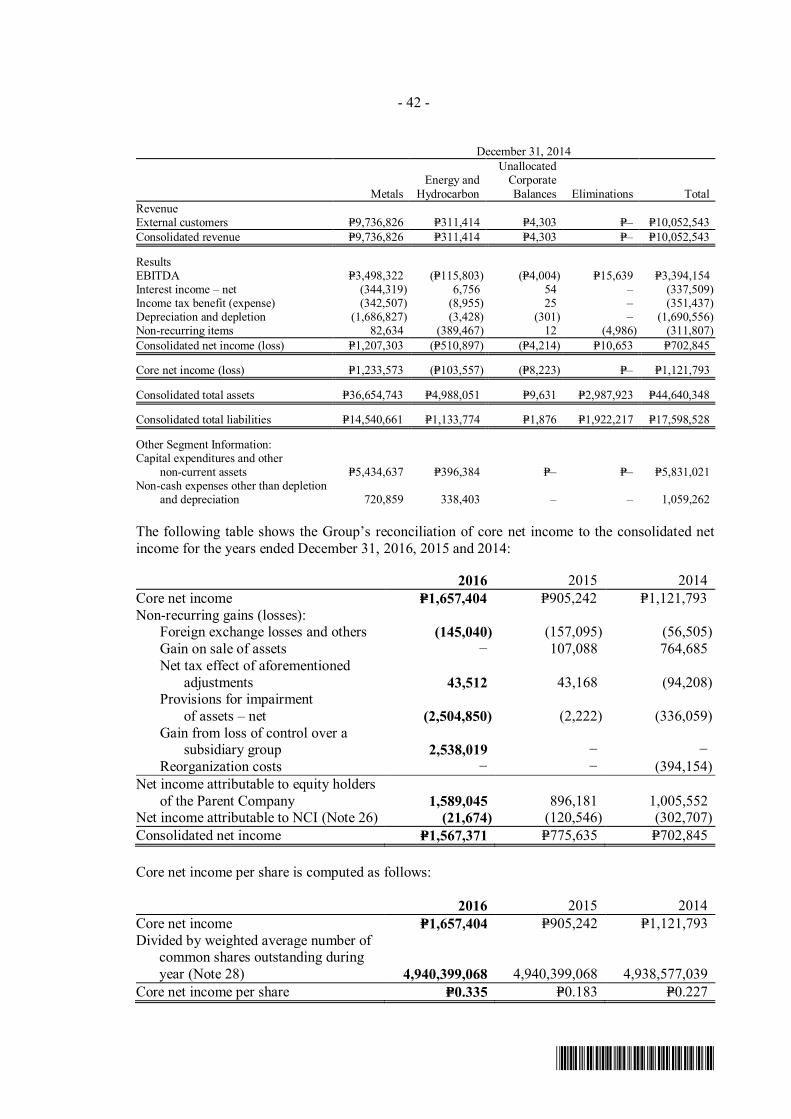
- 42 -
*SGVFS014558*
December 31, 2014
MetalsEnergy and
Hydrocarbon
UnallocatedCorporateBalances Eliminations Total
RevenueExternal customers P=9,736,826 P=311,414 P=4,303 P=– P=10,052,543Consolidated revenue P=9,736,826 P=311,414 P=4,303 P=– P=10,052,543
ResultsEBITDA P=3,498,322 (P=115,803) (P=4,004) P=15,639 P=3,394,154Interest income – net (344,319) 6,756 54 – (337,509)Income tax benefit (expense) (342,507) (8,955) 25 – (351,437)Depreciation and depletion (1,686,827) (3,428) (301) – (1,690,556)Non-recurring items 82,634 (389,467) 12 (4,986) (311,807)Consolidated net income (loss) P=1,207,303 (P=510,897) (P=4,214) P=10,653 P=702,845
Core net income (loss) P=1,233,573 (P=103,557) (P=8,223) P=– P=1,121,793
Consolidated total assets P=36,654,743 P=4,988,051 P=9,631 P=2,987,923 P=44,640,348
Consolidated total liabilities P=14,540,661 P=1,133,774 P=1,876 P=1,922,217 P=17,598,528
Other Segment Information:Capital expenditures and other non-current assets P=5,434,637 P=396,384 P=– P=– P=5,831,021Non-cash expenses other than depletion
and depreciation 720,859 338,403 – – 1,059,262
The following table shows the Group’s reconciliation of core net income to the consolidated netincome for the years ended December 31, 2016, 2015 and 2014:
2016 2015 2014Core net income P=1,657,404 P=905,242 P=1,121,793Non-recurring gains (losses):
Foreign exchange losses and others (145,040) (157,095) (56,505)Gain on sale of assets − 107,088 764,685Net tax effect of aforementioned
adjustments 43,512 43,168 (94,208)Provisions for impairment
of assets – net (2,504,850) (2,222) (336,059)Gain from loss of control over a
subsidiary group 2,538,019 − −Reorganization costs − − (394,154)
Net income attributable to equity holdersof the Parent Company 1,589,045 896,181 1,005,552
Net income attributable to NCI (Note 26) (21,674) (120,546) (302,707)Consolidated net income P=1,567,371 P=775,635 P=702,845
Core net income per share is computed as follows:
2016 2015 2014Core net income P=1,657,404 P=905,242 P=1,121,793Divided by weighted average number of
common shares outstanding duringyear (Note 28) 4,940,399,068 4,940,399,068 4,938,577,039
Core net income per share P=0.335 P=0.183 P=0.227

- 43 -
*SGVFS014558*
Sales of the Parent Company are made to Pan Pacific Copper Co., Ltd. (Pan Pacific), which iscovered by a Sales Agreement (signed on March 11, 2004), and to Louis Dreyfuss CommoditiesMetals Suisse SA (LD Metals) for the remaining copper concentrates. Gross revenue, excludingprovisional pricing adjustments, from Pan Pacific and LD Metals for the year endedDecember 31, 2016, 2015 and 2014 are presented below:
2016 2015 2014LD Metals P=3,287,548 P=6,109,840 P=8,336,374Pan Pacific 6,377,937 3,128,525 3,179,773
P=9,665,485 P=9,238,365 P=11,516,147
6. Cash and Cash Equivalents
Cash and cash equivalents consist of:
2016 2015Cash on hand P=2,208 P=2,370Cash with banks 272,345 693,894Short-term deposits 183,384 312,422
P=457,937 P=1,008,686
Cash with banks and short-term deposits earn interest at bank deposit rates. Short-term deposits aremade for varying periods, usually of up to three months depending on the cash requirements of theGroup. Interest income arising from cash with banks and short-term deposits amounted toP=2,081, P=4,085 and in P=5,182 in 2016, 2015 and 2014, respectively.
7. Accounts Receivable
Accounts receivable consist of:
2016 2015Trade P=411,795 P=701,328Others 76,449 197,898
488,244 899,226Less allowance for impairment losses 1,747 1,747
P=486,497 P=897,479
The Parent Company’s trade receivables arise from shipments of copper concentrates which areinitially paid based on 90% of their provisional value, currently within one week from shipmentdate. The 10% final balance does not bear any interest until final settlement, which usuallytakes around three months from shipment date for Pan Pacific or after a month for LD Metals. TheGroup has US dollar (US$) accounts receivable amounting to US$7,838 and US$13,194 as atDecember 31, 2016 and 2015, respectively (see Note 23).
Accrued interest receivables arise from the Group’s short-term deposits. Other receivables includeadvances to officers and employees, and other non-trade receivables. Advances from officers andemployees are non-interest bearing cash advances for business-related expenditures that are subjectto liquidation. Other non-trade receivables are non-interest bearing and are generally collectible ondemand.

- 44 -
*SGVFS014558*
The following table is a rollforward analysis of the allowance for impairment losses recognized onaccounts receivable:
2016 2015January 1
Others P=1,747 P=2,613Reversals during the year
Others − (866)December 31 P=1,747 P=1,747
The impaired receivables were specifically identified as at December 31, 2016 and 2015.
8. Inventories
Inventories consist of:
2016 2015Mine products - at NRV P=1,059,280 P=543,228Petroleum - at NRV − 9,044Materials and supplies:
On hand - at NRV 1,195,456 1,291,969In transit - at cost 64,114 42,303
P=2,318,850 P=1,886,544
As at December 31, 2016 and 2015, the cost of materials and supplies inventories on hand amountedto P=1,259,570 and P=1,334,272 respectively.
The following table is a rollforward analysis of the allowance for impairment losses recognized oncoal and materials and supplies inventories:
2016 2015January 1
Coal P=220,083 P=220,083Materials and supplies 116,185 116,185
Provisions during the yearCoal − −Materials and supplies 30,000 −
Derecognition during the yearCoal (220,083) −Materials and supplies (46,059) −
December 31 P=100,126 P=336,268
Provision for coal inventories which is related to BEMC’s closure in 2013 is included in the “Lossfrom deconsolidated subsidiary group” account in the consolidated statements of income as a resultof Parent Company’s loss of control over PXP (see Notes 26 and 33).
Materials and supplies recognized as expense amounted to P=1,640,583, P=1,557,628 and P=1,785,909in 2016, 2015 and 2014, respectively (see Note 16).
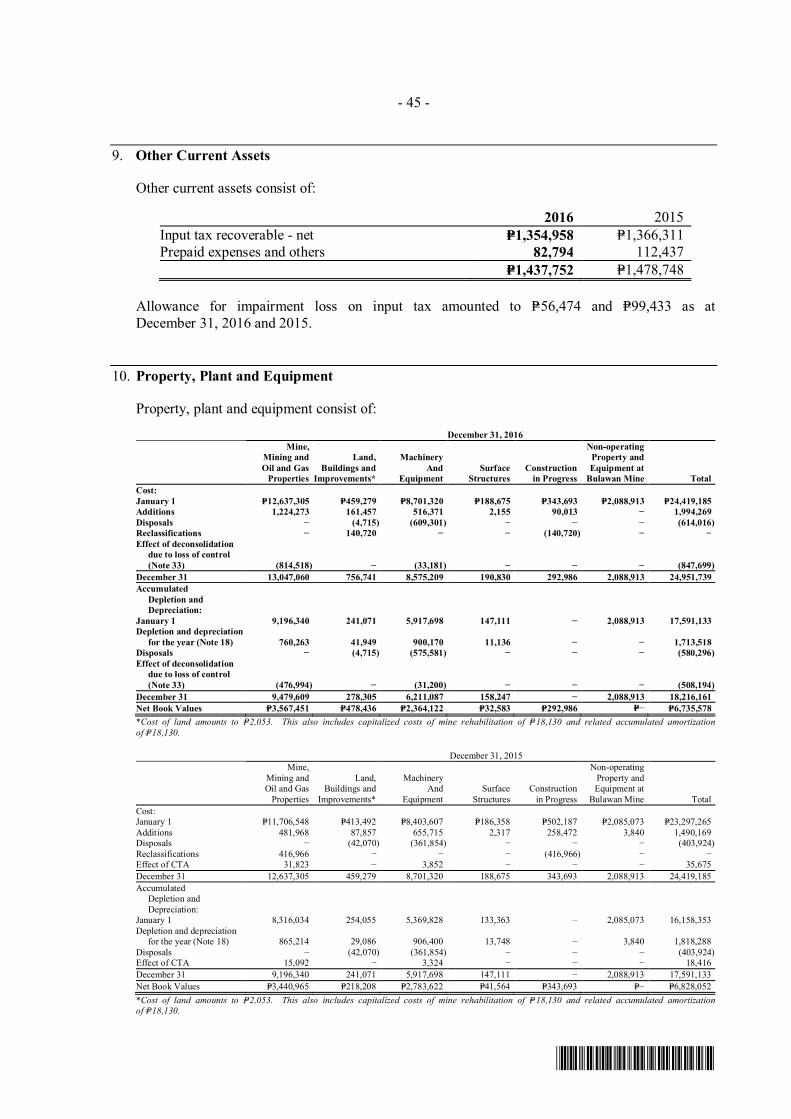
- 45 -
*SGVFS014558*
9. Other Current Assets
Other current assets consist of:
2016 2015Input tax recoverable - net P=1,354,958 P=1,366,311Prepaid expenses and others 82,794 112,437
P=1,437,752 P=1,478,748
Allowance for impairment loss on input tax amounted to P=56,474 and P=99,433 as atDecember 31, 2016 and 2015.
10. Property, Plant and Equipment
Property, plant and equipment consist of:
December 31, 2016Mine, Non-operating
Mining and Land, Machinery Property andOil and Gas Buildings and And Surface Construction Equipment at
Properties Improvements* Equipment Structures in Progress Bulawan Mine TotalCost:January 1 P=12,637,305 P=459,279 P=8,701,320 P=188,675 P=343,693 P=2,088,913 P=24,419,185Additions 1,224,273 161,457 516,371 2,155 90,013 − 1,994,269Disposals − (4,715) (609,301) − − − (614,016)Reclassifications − 140,720 − − (140,720) − −Effect of deconsolidation
due to loss of control(Note 33) (814,518) − (33,181) − − − (847,699)
December 31 13,047,060 756,741 8,575,209 190,830 292,986 2,088,913 24,951,739Accumulated Depletion and Depreciation:January 1 9,196,340 241,071 5,917,698 147,111 − 2,088,913 17,591,133Depletion and depreciation
for the year (Note 18) 760,263 41,949 900,170 11,136 − − 1,713,518Disposals − (4,715) (575,581) − − − (580,296)Effect of deconsolidation
due to loss of control(Note 33) (476,994) − (31,200) − − − (508,194)
December 31 9,479,609 278,305 6,211,087 158,247 − 2,088,913 18,216,161Net Book Values P=3,567,451 P=478,436 P=2,364,122 P=32,583 P=292,986 P=− P=6,735,578*Cost of land amounts to P=2,053. This also includes capitalized costs of mine rehabilitation of P=18,130 and related accumulated amortizationof P=18,130.
December 31, 2015Mine, Non-operating
Mining and Land, Machinery Property andOil and Gas Buildings and And Surface Construction Equipment at
Properties Improvements* Equipment Structures in Progress Bulawan Mine TotalCost:January 1 P=11,706,548 P=413,492 P=8,403,607 P=186,358 P=502,187 P=2,085,073 P=23,297,265Additions 481,968 87,857 655,715 2,317 258,472 3,840 1,490,169Disposals − (42,070) (361,854) − − − (403,924)Reclassifications 416,966 − − − (416,966) − −Effect of CTA 31,823 − 3,852 − − − 35,675December 31 12,637,305 459,279 8,701,320 188,675 343,693 2,088,913 24,419,185Accumulated Depletion and Depreciation:January 1 8,316,034 254,055 5,369,828 133,363 – 2,085,073 16,158,353Depletion and depreciation
for the year (Note 18) 865,214 29,086 906,400 13,748 − 3,840 1,818,288Disposals − (42,070) (361,854) − − − (403,924)Effect of CTA 15,092 − 3,324 − − − 18,416December 31 9,196,340 241,071 5,917,698 147,111 − 2,088,913 17,591,133Net Book Values P=3,440,965 P=218,208 P=2,783,622 P=41,564 P=343,693 P=− P=6,828,052*Cost of land amounts to P=2,053. This also includes capitalized costs of mine rehabilitation of P=18,130 and related accumulated amortizationof P=18,130.

- 46 -
*SGVFS014558*
Mine and mining properties as at December 31, 2016 and 2015 include mine development costs ofthe 908 Meter Level, 782 Meter Level and 798 Meter Level project amounting to P=7,213,316 andP=6,692,789, respectively. In 2011, the estimated mine life of the Parent Company’s Padcal Minewas extended until 2020, or an additional three years from the original estimated mine life of until2017. In 2015, with the discovery of additional resources, the estimated mine life of the Padcal Minewas again extended for an additional two years until 2022. Correspondingly, the extensions in minelife were considered as a change in estimate and the effect on the amortization of the depletion costswas taken up prospectively.
Total depreciation cost of machinery and equipment used in exploration projects amounting toP=232,061, P=254,032 and P=321,336 in 2016, 2015 and 2014, respectively, are capitalized underdeferred exploration costs, which relate to projects that are currently ongoing for PMC, SMMCI andPGPI.
Land, buildings and improvements include the estimated costs of rehabilitating the ParentCompany’s Padcal Mine from 2023 up to 2030, discounted at a rate of 2.79%. In 2015, the ParentCompany performed a reassessment of its provision for mine rehabilitation costs which increasedthe liability and related asset by P=100,459. Accretion of interest totaled P=3,510 and P=3,414 in 2016and 2015, respectively.
The Group’s provision for mine rehabilitation costs amounted to P=129,434 and P=134,898 as atDecember 31, 2016 and 2015, respectively.
Non-operating property and equipment in the Bulawan mine pertains to PGPI’s fully-depreciatedproperty and exploration equipment that are presently not in use. These assets do not qualify asassets held for sale under PFRS 5 and are thus retained as property, plant and equipment.
On July 17, 2014, the Parent Company sold its property located in Pasig City for a total amount ofP=777,445. Total gain of P=764,685 was recognized in the consolidated statements of income after therelated necessary taxes and expenses. Subsequently in September 2016, the Parent Companyacquired building and improvements amounting to P=161,457 which is now the Parent Company’sregistered business office.
11. Available-for-sale (AFS) Financial Assets
AFS Financial AssetsThe Group’s AFS financial assets consist of quoted and unquoted investment in share of stock asfollows:
2016 2015Investments in quoted shares P=31,924 P=33,975Investments in unquoted shares of stock 72,691 72,712
P=104,615 P=106,687
AFS financial assets in quoted shares of stock are carried at fair value with cumulative changes infair values presented as a separate account in equity. Meanwhile, AFS financial assets in unquotedshares of stock are carried at cost because fair value bases (i.e., quoted market prices) are neitherreadily available nor is there an alternative basis of deriving a reliable valuation at the end of thereporting period.

- 47 -
*SGVFS014558*
On February 3, 2015, the Parent Company sold its investment in quoted shares in Indophil for aconsideration of P=297,462. The transaction resulted in a gain amounting to P=107,088 recorded under“Other income (charges)” on the consolidated statements of income.
Investment in Lepanto is reclassified as investment in an associate in 2015 (see Note 12).
As at December 31, 2016 and 2015, the cumulative change in value of AFS financial assetsamounted to a decrease of P=3,094 and P=1,022, respectively. These changes in fair values in the sameamounts have been recognized and shown as “Net unrealized gain (loss) on AFS financial assets”account in the equity section of the consolidated statements of financial position and are also shownin the consolidated statements of comprehensive income.
The following table shows the movement of the “Net unrealized loss on AFS financial assets”account:
2016 2015January 1 (P=1,022) (P=64,010)Decrease in fair value of
AFS financial assets (2,072) (23,023)Reversal of fair value changes in AFS
investment subsequently accountedfor as an associate (Note 12) − 193,099
Realized gain on sale of AFS financial assets − (107,088)December 31 (P=3,094) (P=1,022)
12. Investment in Associates
2016 2015Lepanto P=626,038 P=659,408PXP (Note 33) 1,050,131 −
1,676,169 659,408Less allowance for impairment loss 220,293 −
P=1,455,876 P=659,408
LepantoThe Parent Company entered into a Joint Voting Agreement (the Agreement) with another Lepantoshareholder to jointly vote their share on all matters affecting their right on Lepanto for five yearsfrom the effectivity of the Agreement. By virtue of the Agreement, the shareholding and boardrepresentation of the combined interest of PMC and the other Lepanto shareholder resulted insignificant influence over Lepanto.
Lepanto is involved on the exploration and mining of gold, silver, copper, lead, zinc and all kindsof ores, metals, minerals, oil, gas and coal and their related by products. Lepanto is listed on thePhilippine Stock Exchange (PSE). The Group’s interest in Lepanto is accounted for using the equitymethod on the consolidated financial statements.
In 2016, the Group provided an allowance for impairment losses in its investment in Lepantoamounting to P=220,293.
The following table summarizes the financial information of Lepanto:

- 48 -
*SGVFS014558*
2016 2015Current assets P=1,979,774 P=1,844,445Non-current assets 14,883,124 14,879,042Current liabilities (1,782,979) (1,008,527)Non-current liabilities (8,153,679) (8,141,015)Equity P=6,926,240 P=7,573,945
2016* 2015*Revenue P=1,121,195 P=907,999Cost and expenses (1,658,721) (1,391,951)Finance costs (16,010) (18,327)Other income (expenses) 59,295 (8,321)Loss before income tax (494,241) (510,600)Income tax expense (6,309) (328)Loss for the year P=500,550 P=510,928
Total comprehensive loss P=500,550 P=510,928
Group’s share of loss for the year (annualized) P=33,370 P=13,200*Balances are based on unaudited September 30, 2016 interim financial statements submitted by Lepanto to PSE.
PXPThe Parent Company declared its shares of stock in PXP as property dividends to its shareholderson March 15, 2016 record date at a ratio of 17 shares for every 100 shares held. The dividenddeclaration was approved by the Philippine Securities and Exchange Commission (SEC) onJune 22, 2016. The Group ceases to have control over PXP on July 15, 2016 (see Notes 26 and 33).
The following table illustrates the summarized financial information of the Group’s investment in PXP:
2016*Current assets P=625,695Non-current assets 6,679,041Current liabilities (2,955,578)Non-current liabilities (1,312,809)Equity P=3,036,349
2016*Revenue P=78,354Cost and expenses (122,228)Other income (expenses) 4,961Loss before income tax (38,913)Income tax expense (457)Loss for the year P=39,370Total comprehensive loss P=39,370Group’s share of loss for
the year (actual) P=11,202*Balances are based on audited December 31, 2016 consolidated financial statements.
13. Deferred Exploration Costs and Other Noncurrent Assets

- 49 -
*SGVFS014558*
Deferred exploration costs and other noncurrent assets consist of:
2016 2015Deferred mine exploration costs P=26,849,933 P=25,482,996Less allowance for impairment losses 3,777,893 1,493,336
23,072,040 23,989,660Deferred oil exploration costs – 5,399,948Less allowance for impairment losses – 426,313
– 4,973,635Other noncurrent assets 86,285 189,715
P=23,158,325 P=29,153,010
The following table is a rollforward analysis of the allowance for impairment losses recognized ondeferred exploration cost and other noncurrent assets:
2016 2015January 1
Deferred mine exploration cost P=1,493,336 P=1,519,542Deferred oil exploration cost 426,313 874,415
Provisions during the yearDeferred mine exploration cost 2,284,557 –Deferred oil exploration cost – 429,848
Reversals during the yearDeferred oil exploration cost – (388,630)
Write-off during the yearDeferred mine exploration cost – (26,206)Deferred oil exploration cost – (489,320)
Deconsolidation of a subsidiary group (Note 33) (426,313) –December 31 P=3,777,893 P=1,919,649
Deferred Mine and Oil Exploration CostsDeferred mine and oil exploration costs relate to projects that are ongoing. The recovery of thesecosts depends upon the success of exploration activities and future development of thecorresponding mining properties or the discovery of oil and gas that can be produced in commercialquantities. Allowances have been provided for those deferred costs that are specifically identifiedto be unrecoverable. Allowances recognized are included under “Provision for impairment oninvestment in an associate and deferred exploration costs” in the consolidated statements of incomeamounted to P=2,284,557, P=429,848 and P=569,944 in 2016, 2015 and 2014, respectively.
On July 15, 2016, deferred oil exploration costs were derecognized as a result of Parent Company’sloss of control over PXP (see Notes 26 and 33).
Other Noncurrent AssetsBank accounts that the Parent Company and PGPI maintain with Land Bank of the Philippines toestablish their respective Mine Rehabilitation Funds (MRF), pursuant to the requirements ofRepublic Act (RA) No. 7942, otherwise known as “The Philippine Mining Act of 1995.” The MRFshall be used for the physical and social rehabilitation of areas and communities affected by thePadcal, Bulawan and Sibutad Mines, and for research in the social, technical and preventive aspectsof their rehabilitation. As at December 31, 2016 and 2015, the Parent Company’s MRF amountedto P=5,469 and P=5,361, while PGPI’s MRF amounted to P=6,870 and P=6,825, respectively.

- 50 -
*SGVFS014558*
14. Loans and Bonds Payable
2016 2015Current Loans
Bank loansBanco de Oro (BDO) P=1,541,320 P=1,882,400Philippine National Bank (PNB) 1,292,720 1,364,740Bank of the Philippine Islands (BPI) 248,600 70,590
3,082,640 3,317,730Noncurrent Loans
Bonds payable 6,592,854 6,259,063P=9,675,494 P=9,576,793
Related Party Loans in Prior YearsIn 2012 and 2013, the Parent Company entered into unsecured Term Loan Facility Agreements withKirtman Limited, Maxella Limited and Asia Link B.V., companies under common control of FirstPacific Company Limited (FPC Group), to finance the capital expenditures of Silangan Project andworking capital requirements of the Group. The Term Loans Facility Agreements were fully settledin 2014.
Interest expense on the Term Loan Facility Agreements with Kirtman Limited, Maxella Limitedand Asia Link B.V amounted to nil for both 2016 and 2015, and P=207,074 in 2014.
BDO LoansOn April 25, 2013, the Parent Company assumed the liability of BEMC for the settlement of theP=100,000 loan from BDO at the interest rate of 4% subject to repricing. After a series of renewals,the maturity of the loan was extended to January 20, 2014. The loan was consequently renewedupon maturity for an additional 85 days until April 15, 2014 under the same terms. The loan wasfully paid in July 2014.
On November 6, 2013, the Parent Company obtained unsecured short-term loans from BDOamounting to US$20,000. The original loan term carries 2.5% interest per annum and will matureon February 4, 2014. The loan was renewed upon maturity for an additional 90 days untilMay 5, 2014 under the same terms and was subsequently renewed several times with last renewalmaturing April 28, 2015 under the same terms. Upon maturity on April 28, 2015, the ParentCompany renegotiated the loan to reduce the interest rate to 2.3% per annum and new maturity dateon July 27, 2015. The Parent Company renewed the loan several times with the latest maturity dateset on March 24, 2016. Partial payments amounting to US$3,000 were made in 2015 which reducedthe outstanding balance to US$17,000. On 2016, partial payments were made amounting toUS$2,000, US$1,500 and US$3,500 in April, June and August, respectively, which reduced theoutstanding balance to US$10,000. After several maturity and renewals, the latest maturity date ofthe loan is set at April 17, 2017.
On July 1, 2014, the Parent Company obtained unsecured short term loan from BDO amounting toUS$10,000. The loan carries 2.5% interest per annum and will mature on September 29, 2014. Theloan was renewed several times with the Parent Company renegotiating on June 17, 2015 for a lowerinterest rate per annum of 2.3%. The loan was rolled several times with the latest renewal settingthe maturity date on March 11, 2016. Partial payments amounting to US$4,000 were made in 2015which reduced the outstanding balance to US$6,000. Partial payment was made during

- 51 -
*SGVFS014558*
February 2016 amounting to US$1,000 which reduced the outstanding balance to US$5,000. Afterseveral maturity and renewals, the latest maturity date of the loan is set at March 6, 2017.
On April 27, 2015, the Parent Company obtained a new unsecured short term loan from BDOamounting to US$17,000. The loan carries 2.3% interest per annum and will mature onJuly 24, 2015. The loan was renewed several times upon maturity wherein the last maturity was seton March 20, 2016. Partial payment was made during February 2016 amounting to US$1,000 whichreduced the outstanding balance to US$16,000. After several maturity and renewals, the latestmaturity date of the loan is set at April 12, 2017.
PNB LoansOn November 6, 2013, the Parent Company obtained unsecured short-term loans from PNBamounting to US$20,000. The loan carries 2.5% interest per annum and will mature onFebruary 4, 2014. The loan was renewed several times upon maturity for an additional 90 days oruntil May 5, 2014 under the same terms. Subsequent renewal followed with last renewal maturingon April 15, 2015. The loan was fully paid in 2015.
On March 19, 2014, the Parent Company obtained an unsecured short-term loan from PNBamounting to US$10,000. The loan carries 2.5% interest per annum but subject to repricing every30 days. The loan will mature on June 19, 2014. Partial payments amounting to $1,000 was madein 2015 which reduced outstanding balance to $9,000. When the partial payment was made inJuly 2015, the rate was also renegotiated to 2.3%. On 2016, partial payments were made amountingto US$1,000 each in February, September and December which reduced the outstanding balance toUS$6,000. After several maturity and renewals, the latest maturity date of the loan is set atMay 25, 2017.
On June 3, 2014, the Parent Company obtained unsecured loan from PNB amounting to US$10,000.The loan carries 2.5% interest per annum and was renegotiated to 2.3% in June 2015. After severalmaturity and renewals, the latest maturity date of the loan is set at March 14, 2017.
On November 24, 2015, the Parent Company obtained unsecured loan from PNB amounting toUS$10,000. The loan carries 2.3% interest per annum with original maturity on February 22, 2016and was later extended for another 90 days. After several maturity and renewals, the latest maturitydate of the loan is set at May 15, 2017.
BPI LoansOn January 14, 2013 and February 18, 2013, the Parent Company assumed the liability for thesettlement of the P=150,000 and P=100,000 loans with BPI, previously payable by BEMC. Theinterest rates of the notes are at 4% per annum but subject to repricing every 30 days based on theprevailing interest rate at the date of repricing. The related interest is payable every 30 days. Aftera series of renewals, the maturity of the P=150,000 and P=100,000 loans from BPI was extended toJanuary 30, 2014 and February 14, 2014, respectively. Interest was increased to 4.5% per annumfor both loans. The maturity dates of both loans were extended through another renewal under theincreased interest rate until March 3, 2014 and March 28, 2014, respectively. These loans were bothfully paid in July 2014.
On November 6, 2013, the Parent Company obtained an unsecured short-term loan from BPIamounting to US$10,000. The loan carries 2.5% interest per annum and will mature onFebruary 6, 2014. The loan was also renewed upon maturity for an additional 45 days or untilMarch 21, 2014 under the same terms. The loan was fully paid on March 21, 2014.

- 52 -
*SGVFS014558*
On May 12, 2014, PMC obtained an unsecured short-term loan from BPI amounting to US$10,000.The loan carries 2.5% interest per annum and will mature on June 1, 2014. After several maturityand renewals, the loan was fully settled on November 25, 2015.
On November 24, 2014, the Parent Company obtained an unsecured short-term loan from BPIamounting to US$5,000. The loan carries 2.5% interest per annum but subject to repricing every30 days and last renewal to mature on January 23, 2015. After several maturity and renewals, theloan was fully settled on September 18, 2015.
On November 27, 2014, the Parent Company obtained an unsecured short-term loan from BPIamounting to US$3,500. The loan carries 2.5% interest per annum but subject to repricing every30 days. Partial payments amounting to US$2,000 were made in 2015 which reduced theoutstanding balance to US$1,500. After several maturity and renewals, the latest maturity date ofthe loan is set at May 10, 2017.
On July 11, 2016, the Parent Company obtained an unsecured short-term loan from BPI amountingto US$3,500. The loan carries 2.25% interest per annum. The Parent Company renewed the loanseveral times in 2016 with the latest maturity date set on May 9, 2017.
LBP LoansOn July 14, 2014, the Parent Company obtained an unsecured short-term loan from LBP amountingto P=100,000. The loan carries 4.5% interest per annum which will start on the date of initialborrowing and having a duration not exceeding 88 days, and will mature on October 10, 2014. Thisloan was renewed for another 88 days to mature on January 8, 2015. The Parent Company renewedthe loan under the same terms in 2015 with partial payment amounting to P=50,000 made onFebruary 26, 2015 and full settlement made on March 9, 2015.
On July 28, 2014, the Parent Company obtained an unsecured short-term loan from LBP amountingto P=250,000. The loan carries 4.5% interest per annum but subject to repricing every 90 days, andwill mature on October 27, 2014. This loan was renewed for another 88 days to mature onJanuary 23, 2015. The Parent Company renewed the loan under the same terms in 2015 with partialpayment amounting to P=100,000 made on January 23, 2015 and full settlement made onFebruary 10, 2015.
BNP Paribas LoanOn December 21, 2012, FEP, together with Galoc Production Co. (GPC), entered into a $40,000loan facility with BNP Paribas for the purpose of financing the development activities ofSC 14C’s Galoc Phase 2. On June 30, 2014, the loan was fully settled in cash and all accessorycontracts are terminated.
Interest expense on the bank loans amounted to P=87,283, P=108,837 and P=90,757 for 2016, 2015 and2014, respectively.
Bonds PayableOn December 18, 2014, SMECI, with PMC as the co-issuer, issued 8-year convertible bonds witha face value of P=7,200,000 at 1.5% coupon rate p.a. payable semi-annually. The bonds areconvertible into 400,000 common shares of SMECI at P=18 per share 12 months after the issue date(“Standstill Period”). On the last day of the Standstill Period, the Issuer shall have a one-time rightto redeem the bonds from the holders in whole or in part. After the Standstill Period, the noteholdersmay exercise the conversion right, in whole but not in parts, at any time but no later than the maturitydate. At redemption/maturity date, the bonds can be redeemed together with the principal or facevalue of the bonds at a premium, payable at a rate of 3% per annum compounded semi-annually

- 53 -
*SGVFS014558*
based on the face value of the bonds and unpaid accrued interest (if there be any). The proceeds ofthe bonds were used to repay the SMECI’s advances from PMC and fund further exploration worksof SMMCI.
At the date of issuance, the carrying amount of the bonds payable and equity conversion optionsamounted to P=5,974,482 and P=1,225,518, respectively. The carrying value of convertible bondspayable amounted to P=6,592,854 and P=6,259,063 as at December 31, 2016 and 2015, respectively.
Interest amortization amounted to P=333,791 and P=311,697 in 2016 and 2015, respectively whilefinance charges paid amounted to P=121,342 and P=76,871 in 2016 and 2015, respectively. Financecharges paid in 2016 and 2015 consist of coupon payments amounting to P=114,671 and 15% finaltax amounting to P=6,671 paid on behalf of Asialink B.V. Accrued interest amounting to P=41,647 asat December 31, 2016 and 2015 is presented in “Accounts payable and accrued liabilities” in thestatement of financial position. Bonds amortization is calculated on the effective interest basis byapplying effective interest rate of 6.97% per annum (compounded semi-annually) for an equivalentnon-convertible bonds at the date of issue of the convertible bond to the liability component of theconvertible bonds.
Finance expense pertaining to the convertible bonds amounting to P=455,133 and P=433,488 in 2016and 2015, respectively, was capitalized as deferred exploration costs. The rate used to determine theamount of borrowing costs eligible for capitalization was 5.61%.
15. Accounts Payable and Accrued Liabilities
Accounts payable and accrued liabilities consist of:
Trade P=643,847 P=738,635Accrued expenses 458,659 502,524Accrued royalties and excise taxes 121,723 67,890Withholding taxes 36,049 59,903Provisions (Note 31) 410,592 434,048Other nontrade liabilities 161,791 101,488
P=1,832,661 P=1,904,488
Trade payables are non-interest bearing and are generally settled within 30-60 day terms. Accruedexpenses consist of accrued operating and administrative expenses are settled monthly, whilecontracted and outside services are settled within the terms of their respective contracts. Othernontrade liabilities include payroll-related liabilities.
Accrued royalties are due to the claim owners of the land where the mine site operations werelocated while excise taxes pertain to the taxes paid or accrued by the Parent Company for its legalobligation arising from the production of copper concentrates. These excise taxes and royalties areexpensed as incurred. Royalties are paid monthly while obligation to pay excise taxes are madequarterly.
Withholding taxes pertain to statutory deductions and withheld taxes by the Parent Company fromits employees for compensation and suppliers for expanded withholding taxes that are to be remittedto the Bureau of Internal Revenue fourteen days following the end of month.

- 54 -
*SGVFS014558*
16. Costs and Expenses
Costs and expenses include the following:
2016 2015 2014Production costs
Materials and supplies (Note 8) P=1,640,583 P=1,557,628 P=1,785,909Communications, light and water 1,468,000 1,664,852 1,709,707Depletion and depreciation
(Notes 10 and 18) 1,460,439 1,545,778 1,665,523Personnel (Note 17) 875,705 822,254 1,076,790Contracted services 303,817 290,567 240,024Hauling, handling and storage 64,190 72,312 88,324Others 262,128 206,961 241,975
P=6,074,862 P=6,160,352 P=6,808,252
General and administrative expensesPersonnel (Note 17) P=216,552 P=261,430 P=342,083Contracted services 34,875 29,187 92,453Taxes and licenses 24,928 28,924 70,442Depreciation (Notes 10 and 18) 20,966 18,478 21,606Communications, light and water 10,579 16,153 15,762Travel and transportation 7,166 5,033 13,408Donations 4,961 9,465 3,934Office supplies 4,666 3,048 2,907Repairs and maintenance 3,318 5,513 12,189Others 45,112 37,024 99,611
P=373,123 P=414,255 P=674,395
Excise taxes and royaltiesRoyalties P=269,758 P=269,380 P=310,714Excise taxes 182,657 167,476 195,940
P=452,415 P=436,856 P=506,654
Other general and administrative expenses include security, janitorial and other outside services,and general miscellaneous expenses.
17. Personnel Cost
Details of personnel costs are as follows:
2016 2015 2014Production costs (Note 16)
Salaries and wages P=606,171 P=562,458 P=733,826Employee benefits 224,900 216,887 402,622Retirement costs (gain) (Note 19) 44,634 42,909 (59,658)
875,705 822,254 1,076,790(Forward)

- 55 -
*SGVFS014558*
2016 2015 2014General and administrative expenses
(Note 16)Salaries and wages P=149,243 P=167,684 P=256,036Employee benefits 60,043 86,761 88,032Retirement costs (gain) (Note 19) 7,266 6,985 (1,985)
216,552 261,430 342,083P=1,092,257 P=1,083,864 P=1,418,873
In 2013, the Parent Company, PPP and FEP recognized retirement costs amounting to P=448,780,P=24,212, and P=1,391, respectively. In 2014, PPP and FEP recognized retirement costs amounting toP=2,939 and P=4,788, respectively while the Parent company recognized a net retirement gainamounting to P=69,370. In 2015, retirement costs amounted to P=49,894 and P=1,982 for the ParentCompany and FEP, respectively. In 2016, the Parent Company recognized retirement costsamounting to P=51,900 (see Note 19).
18. Depletion and Depreciation
Details of depletion and depreciation expense are as follows:
2016 2015 2014Production costs (Note 16) P=1,460,439 P=1,545,778 P=1,665,523General and administrative (Note 16) 20,966 18,478 21,606
P=1,481,405 P=1,564,256 P=1,687,129
Total depreciation cost of machinery and equipment used in exploration projects amounting toP=232,113, P=254,032 and P=321,336 in 2016, 2015 and 2014, respectively, are capitalized underdeferred exploration costs, which relate to projects that are currently ongoing for PMC, SMMCI andPGPI (see Note 10).
19. Retirement Benefits
Under the existing regulatory framework, Republic Act 7641 requires a provision for retirement payto qualified private sector employees in the absence of any retirement plan in the entity, provided,however, that the employees retirement benefit under the collective bargaining and other agreementsshall not be less than provided under the law. The law does not require minimum funding of theplan.
Parent Company Retirement FundThe Parent Company has a funded, noncontributory, defined benefits retirement plan covering allof its regular employees. The pension funds are being administered and managed through theRetirement Gratuity Plan of Philex Mining Corporation, with Union Bank of the Philippines andBDO as Trustee. The retirement plan provides for retirement, separation, disability and deathbenefits to its members.

- 56 -
*SGVFS014558*
Changes in the net defined benefit liability (asset) of funded funds of the Parent Company are as follows:
2016Net benefit cost in charged to consolidated statements
of income Remeasurements in other comprehensive incomeReturn on Actuarial Actuarialplan assets Changes changes(excluding arising from arising from
amount changes in changes inJanuary 1, Current Settlement/ Benefits included in Experience financial Contribution December 31,
2016 service cost Net interest Curtailment Subtotal paid net interest Adjustments Assumptions Subtotal by employer 2016Present value of
defined benefitobligation P=878,093 P=65,563 P=35,046 P=– P=978,702 (P=40,352) P=– (P=37,392) (P=28,005) (P=65,397) P=– P=872,953
Fair value ofplan assets (1,163,928) – (48,709) – (1,212,637) 40,352 (28,786) – – (28,786) – (1,201,071)
(P=285,835) (P=233,935) P=– (P=28,786) (P=37,392) (P=28,005) (P=94,183) P=– (P=328,118)
2015Net benefit cost in charged to consolidated statements
of income Remeasurements in other comprehensive incomeReturn on Actuarial Actuarial
plan assets Changes changes(excluding arising from arising from
amount changes in changes inJanuary 1, Current Settlement/ Benefits included in Experience financial Contribution December 31,
2015 service cost Net interest Curtailment Subtotal paid net interest Adjustments Assumptions Subtotal by employer 2015Present value of
defined benefitobligation P=798,089 P=63,240 P=25,466 P=– P=886,795 (P=13,092) P=– P=55,575 (P=51,185) P=4,390 P=– P=878,093
Fair value ofplan assets (P=1,162,041) – (38,812) – (1,200,853) 13,092 23,833 – – 23,833 – (1,163,928)
(P=363,952) (P=314,058) P=– P=23,833 P=55,575 (P=51,185) P=28,223 P=– (P=285,835)

- 57 -
*SGVFS014558*
2014Net benefit cost in charged to consolidated statements
of income Remeasurements in other comprehensive incomeReturn on Actuarial Actuarial
plan assets Changes changes(excluding arising from arising from
amount changes in changes inJanuary 1, Current Settlement/ Benefits included in Experience financial Contribution December 31,
2014 service cost Net interest Curtailment Subtotal paid net interest Adjustments assumptions Subtotal by employer 2014Present value of
defined benefitobligation P=1,138,837 P=71,905 P=33,064 (P=492,422) P=751,384 (P=78,155) P=– P=130,802 (P=5,942) P=124,860 P=– P=798,089
Fair value ofplan assets (1,436,542) – (45,508) 363,591 (1,118,459) 78,155 (89,737) – – (89,737) (32,000) (1,162,041)
(P=297,705) (P=367,075) P=– (P=89,737) P=130,802 (P=5,942) P=35,123 (P=32,000) (P=363,952)

- 58 -
*SGVFS014558*
The fair value of net plan assets of the Parent Company by each classes as at the end of the reportingperiod are as follows:
2016 2015AssetsCash and cash equivalents P=140,724 P=119,321Receivables 7,766 9,116Investment in debt securities 710,437 648,793Investment in equity securities 224,939 387,427Other investments 117,961 –
1,201,827 1,164,657LiabilitiesAccrued trust fees payables 756 729
P=1,201,071 P=1,163,928
The cost of defined benefit pension plans as well as the present value of the pension obligation isdetermined using actuarial valuations. The actuarial valuation involves making various assumptions.The principal assumptions used in determining pension and post-employment medical benefitobligations for the defined benefit plans are shown below:
Actuarial valuation assumptions 2016 2015Discount rate 4,64% 4.25%Future salary increases 5.00% 5.00%Expected rate of return on plan assets 6.00% 6.00%
The overall expected rate of return of assets is determined based on market expectation prevailingon that date, applicable to the period over which the obligation is expected to be settled.
The sensitivity analysis below has been determined based on reasonably possible changes of eachsignificant assumption of the defined benefit obligation as of the reporting period, assuming all otherassumptions were held constant:
Increase(decrease)
Effect on definedbenefit obligation
Discount rates 1.00% (P=38,502)(1.00%) 52,220
Future salary increases 1.00% P=42,599(1.00%) (40,782)
Shown below is the maturity analysis of the Company’s undiscounted benefit payments:
Expected benefitpayments
Less than one year P=57,993More than one year to five years 354,358More than five years to ten years 941,434
The average duration of the defined benefit obligation at the end of the reporting period is4.25 years.

- 59 -
*SGVFS014558*
The Parent Company’s actuarial funding requirement in 2015 and 2016 is nil, however, the intentionis to continue regular contributions to the fund.
Pension expense from the defined benefit retirement plan is actuarially determined using theprojected unit credit method. The latest actuarial valuation report was made as atDecember 31, 2016.
SMMCI Retirement FundSMMCI has unfunded, noncontributory defined benefit retirement plan covering its regular and full-time employees. The Company also provides additional post employment healthcare benefits tocertain senior employees in the Philippines.
The cost of defined benefit pension plans and other post-employment medical benefits as well asthe present value of the pension obligation are determined using actuarial valuations. The actuarialvaluation involves making various assumptions. The principal assumptions used in determiningpension and post-employment medical benefit obligations for the defined benefit plans are shownbelow:
Actuarial valuation assumptions 2016 2015Discount rates 5.56% 5.07%Future salary increases 10.00% 10.00%
Changes in the defined benefit liability of SMMCI are as follows:
2016 2015January 1 P=21,968 P=19,033Current service cost 13,100 10,907Past service cost (16,498) –Interest cost 1,114 870
Subtotal (2,284) 11,777Remeasurements in other comprehensive income
Experience adjustments (3,229) (2,460)Actuarial changes from changes in demographic assumptions – (4,879)Actuarial changes from changes in financial assumptions (907) (1,503)Subtotal (4,136) (8,842)
December 31 P=15,548 P=21,968
Retirement expense amounting to P=14,214 and P=11,777 in 2016 and 2015, respectively, werecapitalized as part of the deferred mine exploration costs. In 2016, there was a reversal of pastservice costs amounting to P=16,498 due to the retrenchment in SMMCI.

- 60 -
*SGVFS014558*
The sensitivity analysis below has been determined based on reasonably possible changes of eachsignificant assumption on the defined benefit obligation as of the end of the reporting period,assuming if all other assumptions were held constant:
Increase(decrease)
Present Value ofObligation
Discount rates 1.00% (P=13,958)(1.00%) 17,491
Future salary increases 1.00% P=7,447(1.00%) (13,954)
Shown below is the maturity analysis of the undiscounted benefit payments:
2016 2015Less than 1 year P=– P=–More than 1 year to 5 years 9,555 24,793More than 5 years to 10 years 13,424 20,824More than 10 years to 15 years 4,055 15,181More than 15 years to 20 years 62,915 115,792More than 20 years 243,336 378,500
The average duration of the defined benefit obligation at the end of the reporting period is23.03 years and 22.29 years in 2016 and 2015, respectively.
PPP Retirement FundPPP has an unfunded, noncontributory defined benefit retirement plan covering its regular and full-time employees.
The cost of defined benefit pension plans and other post-employment medical benefits as well asthe present value of the pension obligation are determined using actuarial valuations. The actuarialvaluation involves making various assumptions. The principal assumptions used in determiningpension and post-employment medical benefit obligations for the defined benefit plans are shownbelow:
Actuarial valuation assumptions 2014Discount rates 5.77%Future salary increases 5.00%
Present value of defined benefit obligation:
2014Net benefit cost in consolidated statements of
comprehensive incomeJanuary 1 P=15,623Current service cost 5,132Interest cost 2,595
Subtotal 23,350Re-measurements in OCI
Experience adjustments 2,267Actuarial changes from changes in financialassumptions (1,065)
Subtotal 1,202Ending balance P=24,552

- 61 -
*SGVFS014558*
The sensitivity analysis below has been determined based on reasonably possible changes of eachsignificant assumption on the defined benefit obligation as of the end of the reporting period,assuming if all other assumptions were held constant:
Present Value of ObligationIncrease (decrease) 2014
Discount rates 1.00% P=23,638(1.00%) 26,326
Future salary increases 1.00% 26,271(1.00%) 23,668
Turnover rate 1.00% 23,570(1.00%) 25,602
Shown below is the maturity analysis of the undiscounted benefit payments:
2014Less than 1 year P=−More than 1 year to 5 years 27,050More than 5 years to 10 years 16,527
PPP terminated all of its employees in 2015. FEP also terminated its employees and were rehiredthe PXP in August 2015. These resulted in absolute and full extinguishment of the obligation of thePPP to pay retirement benefits under the existing regulatory framework. Consequently, theoutstanding retirement benefits liabilities of the PPP and FEP at the date of extinguishment wererecognized as gain in the statement of comprehensive income. Gain on extinguishment of retirementbenefits liability of PPP and FEP amounted to P=3,463 and P=24,893, respectively.
The retirement benefits liability amounting to nil and P=24,552 as at December 31, 2015 and 2014,respectively, are recorded under “Pension asset-net” in the consolidated statements of financialposition.
20. Financial Instruments
Fair Values of Financial InstrumentsThe carrying values of cash and cash equivalents, accounts receivable, short-term bank loan,accounts payable and accrued liabilities, and dividends payable, approximate their fair valuesbecause of their short-term nature. Non-current bonds payable also approximates its fair values asit bears interest at market rate. Quoted AFS financial assets are carried at fair value based on thequoted values of the securities. Unquoted AFS financial assets are carried at book value since fairvalue cannot be readily determined based on observable market data.
The fair value measurement of the quoted financial assets is categorized as under Level 1 under fairvalue hierarchy.
21. Financial Risk Management Objectives and Policies and Hedging Activities
Financial Risk Management Objectives and PoliciesThe Group’s principal financial instruments, other than derivatives, comprise mainly of cash andcash equivalents, accounts receivable, AFS financial assets, short-term bank loan and accountspayable and accrued liabilities. The main purpose of these financial instruments is to providefinancing for the Group’s operations and capital intensive projects.

- 62 -
*SGVFS014558*
The BOD is mainly responsible for the overall risk management and approval of the risk strategiesand principles of the Group. The BOD has approved its formalized hedging policy in relation toentering into commodity derivatives in order to manage its financial performance.
Financial RisksThe main risks arising from the Group’s financial instruments are credit and concentration risks,liquidity risk and market risk. The market risk exposure of the Group can be further classified toforeign currency risk, interest rate risk, equity price risk and commodity price risk. The BODreviews and approves the policies for managing these risks and they are summarized as follows:
Credit and Concentration RisksCredit risk is the risk where the Group could incur a loss if its counterparties fail to discharge theircontractual obligations. To avoid such losses, the Group’s primary credit risk management strategyis to trade only with recognized, creditworthy third parties. At present, 60% of the ParentCompany’s annual production of concentrates is sold to Pan Pacific Copper Co., Ltd. The balanceof the Parent Company’s annual production of concentrates is contracted with LD Metals which iscovered by several short-term agreements up to March 2018.
Credit risk may also arise from the Group’s other financial assets, which comprise of cash and cashequivalents. The Group’s exposure to credit risk could arise from default of the counterparty, havinga maximum exposure equal to the carrying amount of these instruments.
The table below summarizes the Group’s exposure to credit risk for the components of theconsolidated statements of financial position as of December 31, 2016 and 2015:
2016 2015Cash and cash equivalents
Cash with banks P=272,345 P=693,894Short-term deposits 183,384 312,422
Accounts receivableTrade 411,795 701,328Others 62,169 61,842
Advances to a related party 2,193,829 –Gross maximum credit risk exposure P=3,123,522 P=1,769,486
The following tables show the credit quality of the Group’s financial assets by class as atDecember 31, 2016 and 2015 based on the Group’s credit evaluation process:
December 31, 2016
Neither Past Due nor ImpairedPast Due andIndividually
TotalHigh-Grade Standard ImpairedCash and cash equivalents
Cash with banks P=272,345 P=– P=– P=272,345Short-term deposits 183,384 – – 183,384
Accounts receivableTrade 411,795 – – 411,795Others 62,169 – 1,747 63,916
Advances to a related party 2,193,829 – – 2,193,829Total P=3,123,522 P=– P=1,747 P=3,125,269

- 63 -
*SGVFS014558*
December 31, 2015
Neither Past Due nor ImpairedPast Due andIndividually
TotalHigh-Grade Standard ImpairedCash and cash equivalents
Cash with banks P=693,894 P=– P=– P=693,894Short-term deposits 312,422 − − 312,422
Accounts receivableTrade 701,328 − − 701,328Others 61,842 − 1,747 63,589
Total P=1,769,486 P=– P=1,747 P=1,771,233
Credit quality of cash and cash equivalents and accounts receivable are based on the nature of thecounterparty and the Group’s evaluation process.
High-grade credit quality financial assets pertain to financial assets with insignificant risk of defaultbased on historical experience.
Liquidity RiskLiquidity risk is the risk where the Group becomes unable to meet its obligations when they fall dueunder normal and stress circumstances. The Group’s objective is to maintain a balance betweencontinuity of funding and flexibility through the use of bank loans. The Group addresses liquidityconcerns primarily through cash flows from operations and short-term borrowings, if necessary.
The tables below summarize the maturity profile of the Group’s financial assets that can be used bythe Group to manage its liquidity risk and the maturity profile of the Group’s financial liabilities,based on contracted undiscounted repayment obligations (including interest) as atDecember 31, 2016 and 2015, respectively:
December 31, 2016
On DemandWithin1 Year
More than1 Year Total
Loans and receivablesCash and cash equivalents P=457,937 P=− P=− P=457,937Accounts receivable
Trade − 411,795 − 411,795Others − 62,169 − 62,169
Advances to a related party 2,193,829 − − 2,193,829AFS financial assets
Quoted equity investments 31,924 − − 31,924Unquoted equity investments 72,691 − − 72,691
Total undiscounted financial assets P=2,756,381 P=473,964 P=− P=3,230,345Other financial liabilities
Short-term loansPrincipal P=− P=3,082,640 P=− P=3,082,640Interest − 2,613 − 2,613
Long-term loansPrincipal − − 7,200,000 7,200,000Interest − − 756,000 756,000
Accounts payables and accruedliabilities − 1,242,302 − 1,242,302
Dividends payable 498,129 − − 498,129Total undiscounted financial
liabilities P=498,129 P=4,327,555 P=7,956,000 P=12,781,684

- 64 -
*SGVFS014558*
December 31, 2015
On DemandWithin1 Year
More than1 Year Total
Loans and receivablesCash and cash equivalents P=1,008,686 P=− P=− P=1,008,686Accounts receivable:
Trade − 701,328 − 701,328Others − 61,842 − 61,842
AFS financial assetsQuoted equity investments 33,975 − − 33,975Unquoted equity investments 72,712 − − 72,712
Total undiscounted financial assets P=1,115,373 P=763,170 P=− P=1,878,543Other financial liabilities
Short-term loansPrincipal P=– P=3,317,730 P=– P=3,317,730Interest – 81,730 – 81,730
Long-term loansPrincipal – – 7,200,000 7,200,000Interest – – 756,000 756,000
Accounts payables and accruedliabilities – 1,318,165 – 1,318,165
Dividends payable 479,652 – – 479,652Total undiscounted financial
liabilities P=479,652 P=4,717,625 P=7,956,000 P=13,153,277
Market Risks
Foreign Currency RiskForeign currency risk is the risk where the value of the Group’s financial instruments diminishesdue to unfavorable changes in foreign exchange rates. The Parent Company’s transactional currencyexposures arise from sales in currencies other than its functional currency. All of the ParentCompany’s sales are denominated in US dollar. Also, the Parent Company is exposed to foreignexchange risk arising from its US dollar-denominated cash and cash equivalents, trade receivablesand loans payable. For the years ended December 31, 2016, 2015 and 2014, the Group recognizednet foreign exchange losses of P=145,213, P=158,697 and P=56,484, respectively, arising from thetranslation of these foreign currency-denominated financial instruments.
As the need arises, the Group enters into structured currency derivatives to cushion the effect offoreign currency fluctuations.
The following tables summarize the impact on income before income tax of reasonably possiblechanges in the exchange rates of US dollar against the Peso. The reasonable movement in exchangerates was determined using 1-year historical data.
Year Ended December 31, 2016US$ Appreciate (Depreciate) Effect on Income before Income Tax
4%-4%
(P=97,088)(4%) 97,088
Year Ended December 31, 2014US$ Appreciate (Depreciate) Effect on Income before Income Tax
4% (P=123,005)(4%) 123,005

- 65 -
*SGVFS014558*
There were no outstanding dollar derivatives as of December 31, 2016 and 2015.
Equity Price RiskEquity price risk is the risk where the fair values of investments in quoted equity securities couldincrease or decrease as a result of changes in the levels of equity indices and in the value ofindividual stocks. Management monitors the movement of the share prices pertaining to the Group’sinvestments. The Group is exposed to equity securities price risk because of investments held bythe Parent Company and PXP, which are classified in the consolidated statements of financialposition as AFS financial assets (see Note 11). As of December 31, 2016 and 2015, investments inquoted shares totaling P=31,924 and P=33,975 representing 0.08% of the total assets of the Group, in2016 and 2015, respectively. Reasonable possible changes were based on an evaluation of datastatistics using 1-year historical stock price data.
The effect on equity, as a result of a possible change in the fair value of the Group’s quoted equityinstruments held as AFS financial assets as at December 31, 2016 and 2015 that could be broughtby changes in equity indices with all other variables held constant are as follows:
December 31, 2016
CurrencyChange in Quoted Prices ofInvestments Carried at Fair Value
Effecton Equity
Peso Increase by 21% P=7,020Increase by 41% 14,040Decrease by 21% (7,020)Decrease by 41% (14,040)
December 31, 2015
CurrencyChange in Quoted Prices ofInvestments Carried at Fair Value
Effecton Equity
Peso Increase by 21% P=7,474Increase by 41% 14,949Decrease by 21% (7,474)Decrease by 41% (14,949)
Commodity Price RiskThe Parent Company’s mine products revenues are valued based on international commodityquotations (i.e., primarily on the LME and London Bullion Metal Association quotes) over whichthe Parent Company has no significant influence or control. This exposes the Group’s results ofoperations to commodity price volatilities that may significantly impact its cash inflows. The ParentCompany enters into derivative transactions as a means to mitigate the risk of fluctuations in themarket prices of its mine products.

- 66 -
*SGVFS014558*
The following table shows the effect on income before income tax should the change in the pricesof copper and gold occur based on the inventory of the Company as at December 31, 2016. Thechange in metal prices is based on 1-year historical price movements.
December 31, 2016Change in Metal Prices Effect on Income before Income TaxGold
Increase by 8% P=181,133Decrease by 8% (181,133)
CopperIncrease by 12% P=271,699Decrease by 12% (271,699)
There were no outstanding gold and copper derivatives as at December 31, 2016.
As at December 31, 2015, there were outstanding gold derivatives designated as cash flow hedgeswherein fair value changes are reported under equity. The following table summarizes the impacton equity of reasonably possible change in the prices of gold and copper.
December 31, 2015Change in Metal Prices Effect on EquityGold
Increase by 12% P=41,536Decrease by 12% (41,536)
CopperIncrease by 21% P=40,613Decrease by 21% (40,613)
Derivative Financial Instruments
Gold DerivativesIn December 2014, the Parent Company has entered into gold collar contracts covering3,000 ounces of monthly gold production for the first quarter of 2015 at an average strike price ofUS$1,200 per ounce for the put options and US$1,210 per ounce for the call options. Also inMay 2015, the Company concluded hedging contracts covering 3,000 ounces per month startingMay to September 2015 at an average strike price of US$1,200 per ounce for the put options andUS$1,230 per ounce for the call options. These contracts were designated as cash flow hedges.
In June 2014, the Company entered into gold collar hedging contracts covering 6,000 ounces ofmonthly production for the third quarter of 2014 at an average strike price of US$1,262.50 per ouncefor the put options and US$1,325.50 per ounce for the call options. Similarly in September 2014,the Company concluded gold collar hedging contracts covering 9,000 ounces of monthly productionfor the fourth quarter of 2014 at an average strike price of US$1,200 per ounce for the put optionsand US$1,270 per ounce for the call options. These contracts were also designated as cash flowhedges.
In February 2016, the Parent Company entered into gold collar hedging contracts covering3,000 ounces of monthly gold production from February to July 2016 at a strike price of US$1,170per ounce for the put options and US$1,242 per ounce for the call options. Further in June 2016, theCompany entered into gold collar hedging contracts covering 3,000 ounces of monthly production

- 67 -
*SGVFS014558*
from July to December 2016 at a strike price of US$1,300 per ounce for the put options andUS$1,350 per ounce for the call options. These contracts were also designated as cash flow hedges.
There were no outstanding gold derivatives as at December 31, 2016.
Embedded DerivativesAs at December 31, 2015 the Parent Company has embedded derivatives, which is represented byprice exposure relative to its provisionally priced commodity sales contracts (see Notes 5 and 7).Mark-to-market gains and losses from open or provisionally priced sales are recognized throughadjustments to revenue in the consolidated statements of income and to trade receivables in theconsolidated statements of financial position. The Parent Company determines mark-to-marketprices using the forward price for quotational periods after the consolidated statements of financialposition date stipulated in the contract. The effect of these fair value adjustments arising fromembedded derivatives amounted to a net loss of P=152,906 in 2015 which was included under revenueand adjusted against receivables.
There were no outstanding embedded derivatives as at December 31, 2016.
22. Capital Management
The Group maintains a capital base to cover risks inherent in the business. The primary objectiveof the Group’s capital management is to optimize the use and earnings potential of the Group’sresources, ensuring that the Group complies with externally imposed capital requirements, if any,and considering changes in economic conditions and the risk characteristics of the Group’sactivities. No significant changes have been made in the objectives, policies and processes of theGroup from the previous years.
The following table summarizes the total capital considered by the Group:
2016 2015Capital stock P=4,940,399 P=4,940,399Additional paid-in capital 1,143,981 1,142,722Retained earnings
Unappropriated 4,442,436 5,496,271Appropriated 10,000,000 10,000,000
P=20,526,816 P=21,579,392
23. Foreign Currency-Denominated Monetary Assets and Liabilities
The Group’s foreign currency-denominated monetary assets and liabilities as at December 31, 2016and 2015 follow:
2016 2015
US$Peso
Equivalent US$Peso
EquivalentAssets
Cash and cash equivalents $5,404 P=268,687 $8,914 P=419,493Trade receivables 7,838 389,705 13,194 620,910
13,242 658,392 22,108 1,040,403
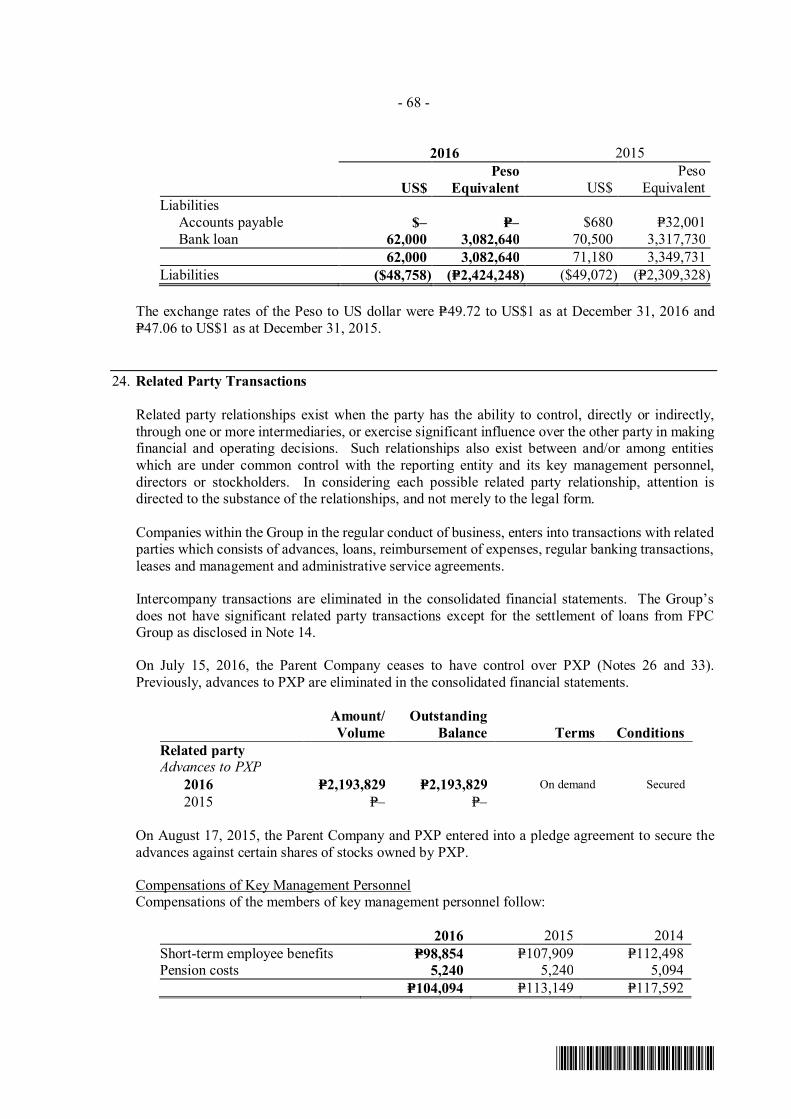
- 68 -
*SGVFS014558*
2016 2015
US$Peso
Equivalent US$Peso
EquivalentLiabilities
Accounts payable $– P=– $680 P=32,001Bank loan 62,000 3,082,640 70,500 3,317,730
62,000 3,082,640 71,180 3,349,731Liabilities ($48,758) (P=2,424,248) ($49,072) (P=2,309,328)
The exchange rates of the Peso to US dollar were P=49.72 to US$1 as at December 31, 2016 andP=47.06 to US$1 as at December 31, 2015.
24. Related Party Transactions
Related party relationships exist when the party has the ability to control, directly or indirectly,through one or more intermediaries, or exercise significant influence over the other party in makingfinancial and operating decisions. Such relationships also exist between and/or among entitieswhich are under common control with the reporting entity and its key management personnel,directors or stockholders. In considering each possible related party relationship, attention isdirected to the substance of the relationships, and not merely to the legal form.
Companies within the Group in the regular conduct of business, enters into transactions with relatedparties which consists of advances, loans, reimbursement of expenses, regular banking transactions,leases and management and administrative service agreements.
Intercompany transactions are eliminated in the consolidated financial statements. The Group’sdoes not have significant related party transactions except for the settlement of loans from FPCGroup as disclosed in Note 14.
On July 15, 2016, the Parent Company ceases to have control over PXP (Notes 26 and 33).Previously, advances to PXP are eliminated in the consolidated financial statements.
Amount/Volume
OutstandingBalance Terms Conditions
Related partyAdvances to PXP
On demand Secured2016 P=2,193,829 P=2,193,8292015 P=– P=–
On August 17, 2015, the Parent Company and PXP entered into a pledge agreement to secure theadvances against certain shares of stocks owned by PXP.
Compensations of Key Management PersonnelCompensations of the members of key management personnel follow:
2016 2015 2014Short-term employee benefits P=98,854 P=107,909 P=112,498Pension costs 5,240 5,240 5,094
P=104,094 P=113,149 P=117,592

- 69 -
*SGVFS014558*
25. Income Taxes
a. The components of the Group’s net deferred income tax assets (liabilities) are as follows:
2016 2015Deferred income tax assets on:
Provision for losses and others P=149,424 P=140,505Unrealized foreign exchange losses - net 114,548 69,214Unamortized past service costs 29,299 42,079Accumulated accretion of interest on provision
for mine rehabilitation costs 8,533 7,480Pension obligation − 5,992Allowances for:
Inventory obsolescence 9,000 −Unrecoverable deferred mine and oil
exploration costs − 16,304Disallowable claims receivable 11,219 24,761
Total deferred income tax assets 322,023 306,335Deferred income tax liabilities on:
Difference in fair value and carrying value of the net assets of subsidiary acquired (1,665,513) (2,645,504)Accelerated depreciation (1,399,638) (1,318,640)Mine inventory at year-end (100,624) (42,848)Gain on dilution on interest − (126,615)Net retirement plan assets (75,769) (98,368)Unrealized foreign exchange gain (10,120) (13,520)OCI portion of retirement liability (28,255) −
Total deferred income tax liabilities (3,279,919) (4,245,495)Net deferred income tax liabilities (P=2,957,896) (P=3,939,160)
b. A reconciliation of the Group’s provision for income tax computed at the statutory income taxrates based on income before income tax to the provision for income tax is as follows:
2016 2015 2014Provision for income tax
computed at the statutoryincome tax rates P=601,916 P=386,847 P=445,109
Additions to (reductions in)income tax resulting from:Unrecognized DTA, NOLCO
and excess MCIT 22,714 8,533 111,400Nondeductible expenses and
non-taxableincome - net 72,633 (35,103) (220,214)
Stock-based compensationexpense − 7,529 7,742
Interest income alreadysubjected to final tax (38) (1,226) (1,555)
Provision for income tax P=697,225 P=366,580 P=342,482

- 70 -
*SGVFS014558*
c. As at December 31, 2016 and 2015, no deferred income tax assets were recognized ondeductible temporary differences amounting to about P=2,730,995 and P=2,655,280, respectively.
d. As at December 31, 2016, significant NOLCO and MCIT of the Parent Company’s subsidiariesfor which no deferred income taxes were recognized are as follows:
SMMCIAs at December 31, 2016, SMMCI’s NOLCO and excess MCIT that can be claimed asdeduction from future taxable income are as follows:
Year Available NOLCO ExcessIncurred Until Amount Tax Effect MCIT2014 2017 P=11,149 P=3,345 P=712015 2018 26,960 16,977 –2016 2019 11,970 3,591 –
P=50,079 P=23,913 P=71
The following are the movements of the SMMCI’s NOLCO and excess MCIT for the yearsended December 31:
NOLCO Excess MCIT2016 2015 2016 2015
At January 1 P=62,296 P=68,724 P=71 P=74Additions 11,970 26,960 − −Expirations (24,187) (33,388) − (3)At December 31 P=50,079 P=62,296 P=71 P=71
PGPIAs at December 31, 2016, PGPI’s NOLCO and excess MCIT that can be claimed as deductionfrom future taxable income are as follows:
Year Incurred Available Until NOLCO Excess MCIT2014 2017 P=32,567 P=–2015 2018 – 1882016 2019 1,119 203
P=33,686 P=391
The following are the movements in NOLCO and excess MCIT for the years endedDecember 31:
NOLCO Excess MCIT2016 2015 2016 2015
Beginning balance P=125,449 P=160,788 P=210 P=46Additions 1,119 – 203 188Application – (985) –Expirations (92,882) (34,354) (22) (24)Ending balance P=33,686 P=125,449 P=391 P=210

- 71 -
*SGVFS014558*
26. Equity
Capital StockThe details of the Parent Company’s capital stock follow:
Number of Shares2016 2015
Authorized common stock - P=1 par value 8,000,000,000 8,000,000,000
Issued, outstanding and fully paid:January 1 4,940,399,068 4,940,399,068Issuance during the year – –December 31 4,940,399,068 4,940,399,068
Below is a summary of the capital stock movement of the Parent Company:
Year Date of Approval
Change in Numberof AuthorizedCapital Stock
New Subscriptions/Issuances***
1956 November 26, 1956 60,000,000 20,590,2501957 30,539,7501958 107,0351959 1,442,5001960 September 12, 1960 30,000,000 10,997,3971961 1,238,5001962 9,737,2941963 December 16, 1993 90,000,000* 103,258,3781964 March 6, 1964 220,000,000 65,339,5201965 61,546,7551966 60,959,1821969 September 22, 1969 600,000,000 182,878,2801970 274,317,4201971 August 20, 1971 1,000,000,000 411,476,1311973 4,000,000,000**** 2,623,160,3321974 1,543,035,4761978 540,062,4201981 August 4, 1981 5,000,000,000 1,485,171,6551983 742,006,9771985 815,707,4731986 3,923,841,2151987 August 14, 1987 9,000,000,000 3,867,787,3261989 July 11, 1989 20,000,000,000 5,028,123,5241990 June 27, 1990 (38,000,000,000)** (20,549,744,536)1991 375,852,2331992 162,869,2581993 179,156,1831995 403,8491997 985,928,4831999 May 23, 1997 3,000,000,000 –2007 10,781,2502008 912,279,662

- 72 -
*SGVFS014558*
Year Date of Approval
Change in Numberof AuthorizedCapital Stock
New Subscriptions/Issuances***
2009 May 22, 2009 3,000,000,000 1,019,753,7892010 21,525,9992011 7,619,7832012 3,276,0752013 3,969,2502014 3,403,0002015 –2016 –
8,000,000,000 4,940,399,068 *This is the result of the change of par value from P=0.10 to P=0.05. **This is the result of the change in par value from P=0.05 to P=1.00. ***Information on issue/offer price on public offering not available or information not applicable since the shares
were not issued in relation to a public offering.****Information on date of approval not available.
As at December 31, 2016 and 2015, the Parent Company’s total stockholders is 44,219 and 44,296respectively.
Retained EarningsRetained earnings consist of the following:
2016 2015Retained earnings:
Unappropriated P=4,285,040 P=5,408,240Cumulative actuarial gains 157,396 88,031Total unappropriated 4,442,436 5,496,271Appropriated 10,000,000 10,000,000
Ending balance P=14,442,436 P=15,496,271
On December 13, 2013, the Parent Company’s BOD approved the appropriation of P=10,000,000 ofthe unappropriated retained earnings for purposes of mine development and construction of theSilangan Project from 2016 to 2020. On February 28, 2017, the Parent Company’s BOD approvedfurther appropriation of P=500,000 of the unappropriated retained earnings for purposes of mine anddevelopment and construction of the Silangan Project from 2017 to 2018, thereby increasing totalappropriation to P=10,500,000.
On February 26, 2014, the BOD of the Parent Company approved the declaration of cash dividendof P=0.05 per share as regular dividend to all stockholders at record date of March 12, 2014.
On October 29, 2014, the BOD of the Parent Company approved the declaration of cash dividendof P=0.03 per share as regular dividend to all stockholders at record date of November 12, 2014.
On February 25, 2015, the BOD of the Parent Company approved the declaration of cash dividendof P=0.02 per share as regular dividend to all stockholders at record date of March 11, 2015.
On February 29, 2016, the Parent Company declared its shares of stock in PXP as property dividendsto its shareholders on March 15, 2016 record date at a ratio of 17 shares for every 100 shares held.The dividend declaration was approved by the Philippine Securities and Exchange Commission

- 73 -
*SGVFS014558*
(SEC) on June 22, 2016. The Parent Company ceases to have control over PXP on July 15, 2016(see Note 33).
On July 27, 2016, the BOD of the Parent Company approved the declaration of cash dividend ofP=0.03 per share as regular dividend to all stockholders at record date of August 10, 2016.
The Parent Company’s retained earnings available for dividend distribution amounted toP=5,359,813 and P=6,117,846 as at December 31, 2016 and 2015, respectively.
As at December 31, 2016 and 2015, dividends payable amounted to P=498,129 and P=479,652,respectively.
On February 28, 2017, the BOD of the Parent Company approved the declaration of cash dividendof P=0.04 per share as regular dividend to all stockholders at record date of March 14, 2017.
NCINCI consist of the following:
Percentage of Ownership Amount2016 2015 2016 2015
NCI on net assets of:PXP – 35.3% P=– P=641,864BEMC – 35.3% – (249,565)FEC – 55.0% – 118,607FEP and its subsidiaries – 58.9% – 163,852PPP and its subsidiaries – 65.4% – 2,046,600LMC 0.7% 0.7% (257) (239)
(P=257) P=2,721,119
Transactions with NCI are disclosed in Note 2.
Financial information of subsidiaries that have material non-controlling interests are providedbelow:
Income (loss) allocated to material NCI:
2015PPP and its subsidiaries (P=351,239)PXP 22,299
Other comprehensive income allocated to material NCI:
2015PPP and its subsidiaries P=524PXP −

- 74 -
*SGVFS014558*
Statements of comprehensive income as of December 31, 2015:
PPP PXPRevenue P=− P=−Cost of sales − −General and administrative expenses (109,721) (35,822)Other income (charges) (427,215) 102,302Income (loss) before tax (536,936) 66,480Benefit from income tax (14) −Net income (loss) (536,950) 66,480Other comprehensive loss (6,010) −
Total comprehensive income (loss) (P=542,960) P=66,480
Attributable to non-controlling interests (P=355,639) (P=24,467)
Statements of financial position as at December 31, 2015:
PPP PXPCurrent assets P=281,920 P=1,045,869Noncurrent assets 189,509 3,009,190Current liabilities (7,343) (2,198,851)Noncurrent liabilities − (122,399)Total equity 464,086 1,733,809
Attributable to:Equity holders of the Parent Company P=160,110 P=1,121,774Non-controlling interests 303,976 612,035
464,086 1,733,809
Statements of cash flows as of December 31, 2015:
Activities PPP PXPOperating (P=234,888) (P=23,188)Investing 55,464 644,844Financing (1,332,272) (490,398)Net increase (decrease) in cash and cash equivalents (P=1,511,696) P=131,258
Statements of cash flows as of December 31, 2014:
Activities PPP PXPOperating (P=196,275) (P=14,106)Investing (112,817) 7,459Financing (513,737) 95,044Net increase (decrease) in cash and cash equivalents (P=822,829) P=88,397
As at December 31, 2016, there were no material NCI as a result of loss of control over PXP andits subsidiaries as disclosed in Note 33.

- 75 -
*SGVFS014558*
27. Share-based Payments
2006 Parent Company Stock Option Plan (SOP)On June 23, 2006, the Parent Company’s stockholders approved and ratified the stock option planof the Parent Company as approved by the Parent Company’s BOD on March 31, 2006. Amongthe salient terms and features of the stock option plan are as follows:
i) Participants: directors, officers, managers and key consultants of the Company and itssignificantly-owned subsidiaries;
ii) Number of shares: up to 3% of the Company’s issued and outstanding shares;iii) Term: Five years from adoption date;iv) Exercise price: Average stock price during the last 20 trading days prior to the date of grant
multiplied by a factor of 0.8, but in no case below par value; andv) Vesting period: Up to 16.67% in six months from grant date; up to 33.33% in 1 year from grant
date; up to 50% in 1.5 years from grant date; up to 66.67% in 2 years from grant date; up to83.35% in 2.5 years from grant date; and up to 100% in 3 years from grant date.
On March 8, 2007, the stock option plan was approved by the Philippine SEC.
A total of two confirmed new grants for 15,000,000 shares were awarded on June 24 andDecember 7, 2009.
For the year ended December 31, 2010, three confirmed new grants were endorsed. A total of9,950,000 shares were awarded on May 25, September 28 and November 23, 2010.
On January 5, 2011, a new stock option grant was given following the terms of the approved plan.A total of 6,000,000 options were awarded vesting every 6 months up to January 5, 2014. TheCompany uses the Customized Binomial Lattice Model to compute for the fair value of the optionstogether with the following assumptions:
January 5, 2011Spot price per share P=15.40Time to maturity 5 yearsVolatility* 54.57%Dividend yield 1.93%Suboptimal exercise behavior multiple 1.5Forfeiture rate 2%
2010May 25 September 28 November 23
Spot price per share P=11.00 P=14.88 P=14.00Time to maturity 5 years 5 years 5 yearsVolatility* 54.57% 55.09% 54.98%Dividend yield 2.69% 2.00% 2.12%Suboptimal exercise behavior multiple 1.5 1.5 1.5Forfeiture rate 2% 2% 2%*Volatility is calculated using historical stock prices and their corresponding logarithmic returns.

- 76 -
*SGVFS014558*
The following table shows the movements in 2016 and 2015 of the 2006 Parent Company SOP:
Number of Options Weighted Average Exercise Price2016 2015 2016 2015
January 1 P=4,515,000 P=5,368,150 P=12.20 P=11.78Exercised – – – –Forfeited (4,515,000) (853,150) – 9.54December 31 P=– P=4,515,000 P=12.20 P=12.20
The number of unexercised vested stock options as at December 31, 2016 and 2015 are nil and4,515,000, respectively.
The 2006 SOP effectively expired on January 5, 2016 following the expiration of the 5-year termof the January 5, 2011 grant which was the last grant under the plan.
2011 Parent Company SOPOn April 27, 2011, the BOD approved the 2011 SOP of the Company, which was concurrentlyapproved by the shareholders on June 29, 2011. Among the salient terms and features of the stockoption plan are as follows:
i) Option Grant Date is the date on which option is awarded under the Parent Company 2011 SOP,provided such award is subsequently accepted by eligible participant.
ii) The vesting percentage and vesting schedule of the options granted under the 2011 ParentCompany SOP shall be determined by the Compensation Committee of the Board.
iii) 246,334,118 shares representing 5% of the Parent Company’s outstanding capital stock shall beinitially reserve for exercise of options to be granted.
iv) The exercise price for the options granted under the 2011 Parent Company SOP shall bedetermined by the Compensation Committee of the Board but shall not be lower than the highestof: (i) the closing price of the shares on PSE on the Option Grant Date, (ii) the average closingprice of the shares on the PSE for the 5 business days on which dealings in the shares are madeimmediately preceding the Option Grant Date; and (iii) the par value of shares.
v) Any amendments to the 2011 Parent Company SOP shall be deemed adopted and made effectiveupon approval by shareholders owning at least two-thirds of the outstanding capital stock of theParent Company and, to the extent legally necessary, by the SEC.
On March 5, 2013, the Parent Company received the SEC resolution approving the 2011 SOP.
The Parent Company granted 40,410,000 options under the 2011 SOP.
The Parent Company uses the Customized Binomial Lattice Model to compute for the fair value ofthe options together with the following assumptions:
Spot price per share P=17.50Exercise price per share P=24.05Time to maturity 7 yearsRisk-free rate 3.3435%Volatility* 49.8731%Dividend yield 1.0031%*Volatility is calculated using historical stock prices and their corresponding logarithmic returns.

- 77 -
*SGVFS014558*
The following table shows the movements in 2016 of the 2011 SOP of the Parent Company:
Number ofOptions
WeightedAverage
Exercise Price2016 2016
January 1 22,870,000 P=21.97Forfeited (1,780,000) 23.99December 31 21,090,000 P=21.80
The following table shows the movements in 2015 of the 2011 SOP of the Parent Company:
Number ofOptions
WeightedAverage
Exercise Price2015 2015
January 1 28,250,000 P=24.05Granted 6,250,000 16.45Forfeited (11,630,000) 24.05December 31 22,870,000 P=21.97
The number of unexercised vested stock options totaled to 21,090,000 and 22,870,000 in 2016 and2015, respectively. The stock options outstanding are anti-dilutive. The effect of the conversionoptions of the convertible bonds is anti-dilutive as at December 31, 2016 and 2015.
The total share-based compensation expense for the 2006 and 2011 SOP in 2016, 2015 and 2014amounted to P=1,259, P=25,095 and P=25,808, respectively. The corresponding share-based optionreserve included under Additional Paid-in Capital as at December 31, 2016 and 2015 amounted toP=353,170 and P=351,911, respectively.
28. Basic/Diluted Earnings Per Share
Basic earnings per share are computed as follows:
2016 2015 2014Net income attributable to equity
holders of the ParentCompany P=1,589,045 P=896,181 P=1,005,552
Divided by weighted averagenumber of common sharesoutstanding during year 4,940,399,068 4,940,399,068 4,938,577,039
Basic earnings per share P=0.322 P=0.181 P=0.204

- 78 -
*SGVFS014558*
Diluted earnings per share amounts are calculated as follows:
2016 2015 2014Net income attributable to equity
holders of the ParentCompany P=1,589,045 P=896,181 P=1,005,552
Divided by weighted averagenumber of common sharesadjusted for the effect ofexercise of stock options 4,940,399,068 4,940,399,068 4,938,577,039
Diluted earnings per share P=0.322 P=0.181 P=0.204
Weighted average number ofcommon shares adjusted forthe effect of exercise of stockoptions 4,940,399,068 4,940,399,068 4,938,577,039
The stock options outstanding are anti-dilutive. The effect of the conversion options of theconvertible bonds is anti-dilutive as at December 31, 2016 and 2015.
29. Farm-in Agreement with MMC
On May 11, 2011, the Parent Company entered into a farm-in agreement with MMC to acquire upto 60% of the outstanding capital stock of Kalayaan Copper Gold Resources, Inc. (Kalayaan), awholly owned subsidiary of MMC. The Parent Company purchased from MMC 125,000 shares ofKalayaan representing 5% of the outstanding capital stock for US$25,000 or P=1,071,521. Further,the Parent Company will subscribe to additional 3,437,500 shares of Kalayaan, representing 55%of outstanding capital stock, subject to the condition that the Parent Company will fulfill thesubscription services within the earlier of three (3) years following the execution of the agreementor expiry of the term of the exploration permit.
Upon acquisition of 5% stake over Kalayaan, MMC, under the Operating Agreement, grants theParent Company exclusive, irrevocable and unconditional rights:
a. To conduct exploration and pre-development;b. To perform all activities necessary to complete a final feasibility study for the project; and,c. To possess and/or exercise all of Kalayaan’s surface rights, to exercise, utilize and enjoy all the
rights, benefits, privileges, and perform all the obligations of Kalayaan under and in relation tothe exploration permit and the mineral rights, provided that Kalayaan shall remain liable for allaccrued obligations under the exploration permit as at the date of the agreement.
The transaction was recorded by allocating the US$25,000 to Investment in AFS pertaining to the5% interest in Kalayaan and to the exploration rights acquired. The acquisition cost is thenallocated by valuing the investment in AFS at P=100 and the deferred exploration cost at P=1,071,421.
As at December 31, 2016, the Company is undergoing discussions with MMC to revise, andconsequently, extend the term of the farm-in agreement on the Kalayaan Project.
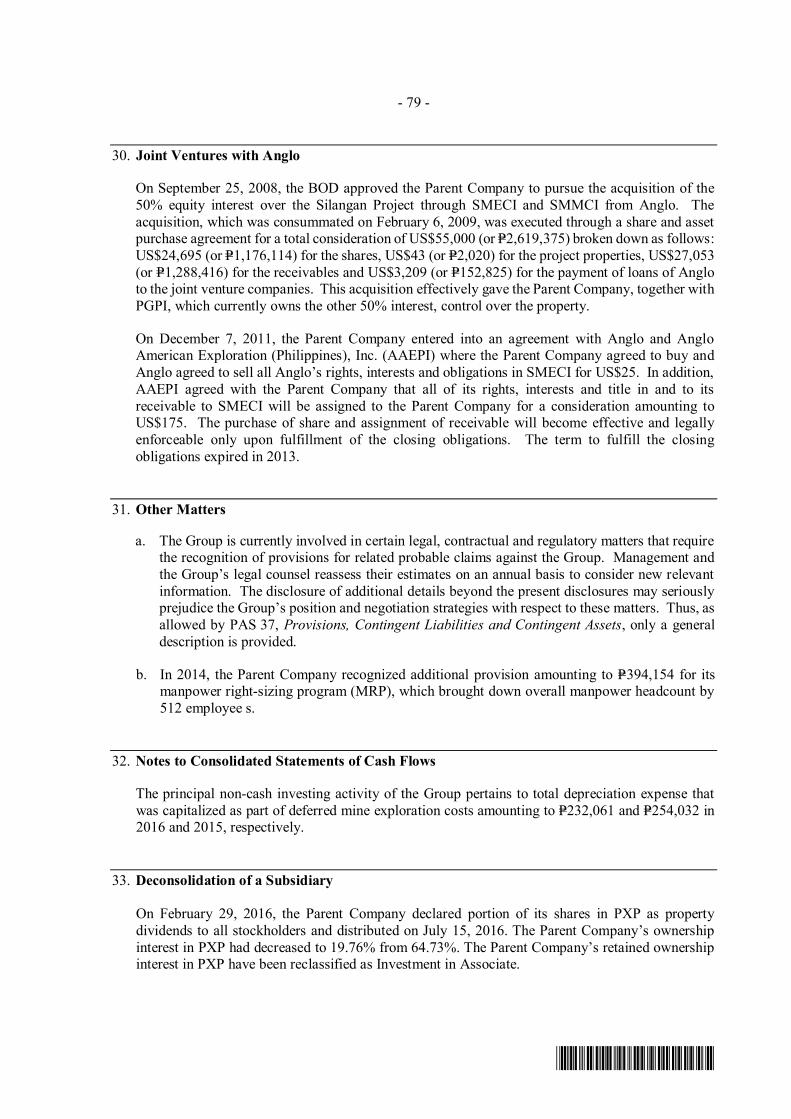
- 79 -
*SGVFS014558*
30. Joint Ventures with Anglo
On September 25, 2008, the BOD approved the Parent Company to pursue the acquisition of the50% equity interest over the Silangan Project through SMECI and SMMCI from Anglo. Theacquisition, which was consummated on February 6, 2009, was executed through a share and assetpurchase agreement for a total consideration of US$55,000 (or P=2,619,375) broken down as follows:US$24,695 (or P=1,176,114) for the shares, US$43 (or P=2,020) for the project properties, US$27,053(or P=1,288,416) for the receivables and US$3,209 (or P=152,825) for the payment of loans of Angloto the joint venture companies. This acquisition effectively gave the Parent Company, together withPGPI, which currently owns the other 50% interest, control over the property.
On December 7, 2011, the Parent Company entered into an agreement with Anglo and AngloAmerican Exploration (Philippines), Inc. (AAEPI) where the Parent Company agreed to buy andAnglo agreed to sell all Anglo’s rights, interests and obligations in SMECI for US$25. In addition,AAEPI agreed with the Parent Company that all of its rights, interests and title in and to itsreceivable to SMECI will be assigned to the Parent Company for a consideration amounting toUS$175. The purchase of share and assignment of receivable will become effective and legallyenforceable only upon fulfillment of the closing obligations. The term to fulfill the closingobligations expired in 2013.
31. Other Matters
a. The Group is currently involved in certain legal, contractual and regulatory matters that requirethe recognition of provisions for related probable claims against the Group. Management andthe Group’s legal counsel reassess their estimates on an annual basis to consider new relevantinformation. The disclosure of additional details beyond the present disclosures may seriouslyprejudice the Group’s position and negotiation strategies with respect to these matters. Thus, asallowed by PAS 37, Provisions, Contingent Liabilities and Contingent Assets, only a generaldescription is provided.
b. In 2014, the Parent Company recognized additional provision amounting to P=394,154 for itsmanpower right-sizing program (MRP), which brought down overall manpower headcount by512 employee s.
32. Notes to Consolidated Statements of Cash Flows
The principal non-cash investing activity of the Group pertains to total depreciation expense thatwas capitalized as part of deferred mine exploration costs amounting to P=232,061 and P=254,032 in2016 and 2015, respectively.
33. Deconsolidation of a Subsidiary
On February 29, 2016, the Parent Company declared portion of its shares in PXP as propertydividends to all stockholders and distributed on July 15, 2016. The Parent Company’s ownershipinterest in PXP had decreased to 19.76% from 64.73%. The Parent Company’s retained ownershipinterest in PXP have been reclassified as Investment in Associate.

- 80 -
*SGVFS014558*
a. Analysis of consolidated assets and liabilities of PXP and its subsidiaries as at July 15, 2016are as follows:
July 15, 2016AssetsCash and cash equivalents P=606,585Accounts receivable 82,212Inventories 4,043Other current assets 3,345Property, plant and equipment 339,475Deferred exploration costs and other noncurrent assets 4,997,549Goodwill 1,238,583Deferred income tax assets - net 4,153Total assets 7,275,945LiabilitiesAccounts payable and accrued expenses (65,354)Advances from related parties (2,149,036)Deferred income tax liabilities (1,093,035)Provision for losses and mine rehabilitation costs (209,842)Total liabilities (3,517,267)Net assets directly associated with disposal group 3,758,678Non-controlling interest (2,863,617)
Net assets of deconsolidated subsidiary group attributable to Parent P=895,061
b. Gain from loss of control over a subsidiary group
July 15, 2016Fair value of dividends distributed P=2,442,387Fair value of retained interest in PXP 1,050,131Consideration 3,492,518Less: Net assets of deconsolidated
subsidiary group P=895,061Cumulative equity items reclassified to
profit or loss 59,439Transaction costs 15,314 969,814
Gain from loss of control over a subsidiarygroup P=2,522,704
c. Net cash inflow (outflow) arising from deconsolidation of the subsidiary
2016* 2015 2014Net cash flows from (used in)
operating activities P=66,845 (P=115,195) (P=84,287)Net cash flows from (used in)
investing activities 13,211 (58,612) (199,862)Net cash flows from (used in)
financing activities 174 (1,205,035) (428,827)Effect of exchange rate changes – (3,168) (133)Net cash inflow (outflow) P=80,230 (P=1,382,010) (P=713,109)* From January 1 to July 15, 2016.

- 81 -
*SGVFS014558*
Results of deconsolidated subsidiary group
2016* 2015 2014Revenue
Petroleum P=59,187 P=172,250 P=311,414Cost and expenses
General and administrative expenses (31,217) (214,333) (281,091)Mine product taxes and royalties – – (534)Petroleum product costs (59,398) (97,982) (152,981)Cost of sales - coal – – (3,282)
(90,615) (312,315) (437,888)Other income (expenses)
Gain on reversal of impairment loss – 388,630 18,122Interest income 1,899 7,444 11,770Foreign exchange gains (losses) - net (597) 26,307 110Interest expense and other charges – – (5,014)Loss on disposal of shares P=– P=– (P=367)Provisions for impairment of assets - net – (429,849) (400,400)Others - net 588 3,524 311
1,890 (3,944) (375,468)Loss before income tax (29,538) (144,009) (501,942)Provision for (benefit from)
income tax 436 (16) (8,955)Loss from deconsolidated
subsidiary group (P=29,102) (P=144,025) (P=510,897)Total comprehensive loss (P=29,102) (P=144,025) (P=510,897)* From January 1 to July 15, 2016.

- 82 -
*SGVFS014558*
Basic and diluted loss per share attributable to equity holders of the Parent Company fromdeconsolidated subsidiary group are computed as follows:
2016 2015 2014Loss from deconsolidated
subsidiary group attributableto equity holders of the ParentCompany P=7,446 P=24,646 P=208,231
Divided by weighted averagenumber of common sharesoutstanding during year 4,940,399,068 4,940,399,068 4,938,577,039
Basic and diluted earnings pershare P=0.002 P=0.005 P=0.042
34. Events After Reporting Period
a. DENR Issues on Mining OperationsOn February 17, 2017, SMMCI and PGPI received show cause letters (Letters) from theDepartment of Environment and Natural Resources (DENR) directing SMMCI and PGPI,respectively, to explain why the following Mineral Production Sharing Agreements (MPSAs)should not be cancelled for being located within watershed areas:
MPSA No. Location CompanyMPSA No. 149-99-XIII Mainit and Placer, Surigao del Norte SMMCIMPSA No. 148-99-XIII Surigao City, Sison and Placer LMC/PGPIMPSA No. 344-2010-XIII Lianga and Barobo, Surigao del Sur PGPIMPSA No. 063-97-IX
Sibutad, Dapitan City and Rizal,Zamboanga del Norte PGPI
MPSA No. 096-97-VI Hinobaan, Negros Occidental PGPI
On February 24, 2017, SMMCI and PGPI responded to the Letters stating that there is no legalnor factual basis for the cancellation of the MPSAs since the contract areas covered by theMPSAs are not located within proclaimed watershed forest reserves where mining is prohibited,and that in any case, DENR has not observed due process. SMMCI and PGPI reserve all rightsto take appropriate legal action and exhaust all remedies to protect their rightful claims undercontract and the law.
b. Appropriation of Retained EarningsOn February 28, 2017, the Parent Company’s BOD approved further appropriation of P=500,000of the unappropriated retained earnings for purposes of mine and development and constructionof the Silangan Project from 2017 to 2018, thereby increasing total appropriation toP=10,500,000.

- 83 -
*SGVFS014558*
c. Declaration of Cash DividendsOn February 28, 2017, the BOD of the Parent Company approved the declaration of cashdividend of P=0.04 per share as regular dividend to all stockholders at record date ofMarch 14, 2017.