Sec Fertiliseer PL 191113 (1)
8
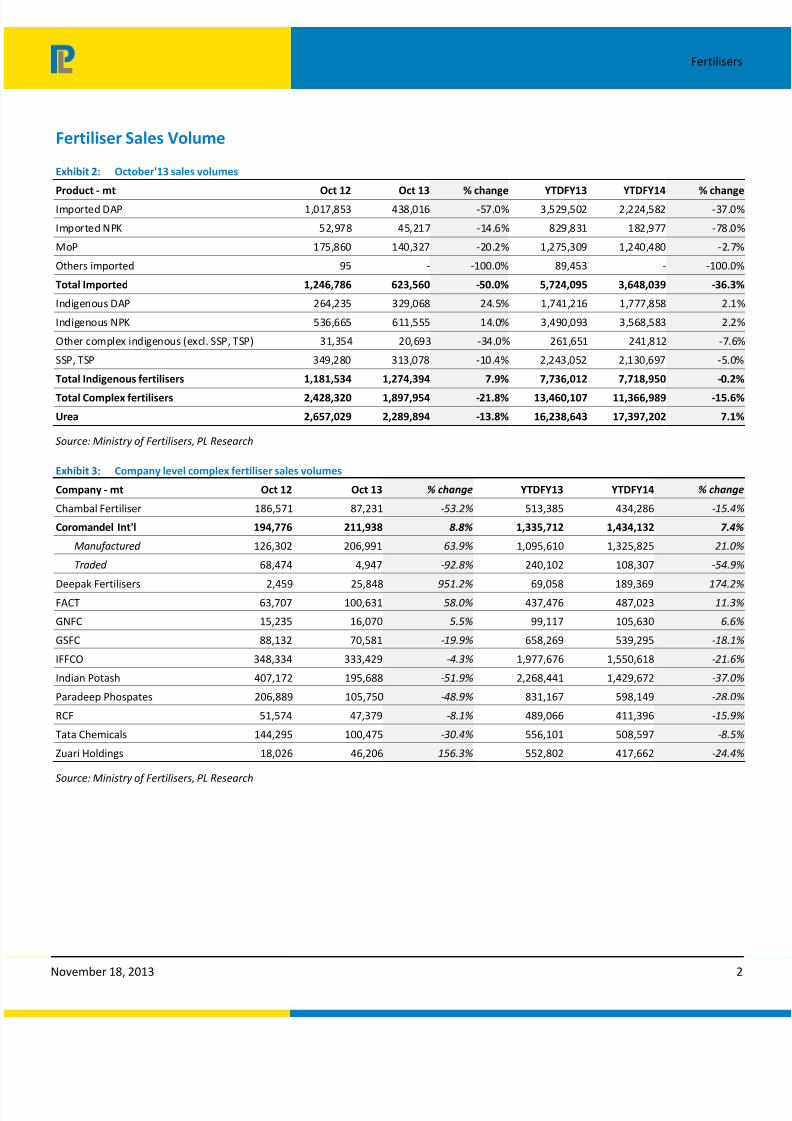
November 18, 2013 Prabhudas Lilladher Pvt. Ltd. and/or its associates (the 'Firm') does and/or seeks to do business with companies covered in its research reports. As a result investors should be aware that the Firm may have a conflict of interest that could affect the objectivity of the report. Investors should consider this report as only a single factor in making their investment decision. Please refer to important disclosures and disclaimers at the end of the report Fertilisers Oct’13 ‐ Complex fertiliser sales down 22%; urea down by 14% YoY S e c t o r U p d a t e Balwindar Singh [email protected] +91-22-66322239 Sensex v/s PL Agri Products & Chemical Index 70 80 90 100 110 120 N o v 1 2 J a n 1 3 M a r 1 3 M a y 1 3 J u l 1 3 S e p 1 3 N o v 1 3 PL Agri Pro ducts & Chemical Index Sensex Source: Bloomberg Stock Performance (%) 1M 6M 12M Sensex (2.3) 0.6 11.4 PL Agri Products Index 7.3 0.6 (7.2) Chambal Fertilisers (1.7) (24.3) (44.4) Coromandel Int. (5.2) 16.2 (21.2) Deepak Fertilisers (1.2) 8.3 (16.9) Dhanuka Agritech 20.4 21.8 18.7 GSFC 7.3 1.2 (24.2) Rallis India (1.9) 16.0 0.1 Tata Chemicals 11.7 (14.4) (12.9) United Phosphorus 8.8 9.1 49.6 Preliminary data from the Ministry of Fertilisers indicates that sales volumes of overall complex fertilisers (incl. manufactured & traded) declined 21.8% YoY for the industry during Oct’13, primarily due to decline in trading volumes. Imported complex fertilisers witnessed a decline of 50.0% YoY during Oct’13, while manufactured volumes increased by 7.9% YoY. On the other hand, urea was down by 13.8% YoY during Oct’13. On a YTD basis, aggregate complex fertiliser sales is down 15.6% YoY due to 36% decline in traded volumes. Urea, however, is up by 7.1% on a YTD basis. Over the last couple of quarters as expected, manufactured indigenous volumes have improved, while imports continue to decline as importers have till now refrained from importing. However, due to continuous decline in global fertiliser prices during the last few months trading has again emerged as an attractive proposition. Our recent interaction with companies’/industry participants corroborates the fact that traders have started becoming aggressive in the marketplace. Likelihood of reduction in farmgate prices has become imminent during the current rabi season and we expect reduction to the tune of Rs1,500 ‐ 2,000/mt on DAP. Subsidy overhang remains a major issue in the sector and we expect working capital requirements to remain stretched over the next few quarters. Global fertiliser prices continue their downward slide: Global fertiliser prices continue to decline due to demand-supply mismatch. Global DAP prices are currently quoting at US$352/mt compared to US$475/mt in July 2013. Ammonia prices have corrected to US$430/mt currently due to improvement in supply over the last few months. Potash prices are currently ruling at US$375/mt and are expected to slide further post the break-up of joint venture between Uralkali and Belaruskali. Phosphoric acid contracts for Q3FY14 have been done at US$609/mt. Farmgate prices likely to be reduced during the rabi season: With global fertiliser prices continuing their downward trend, it is quite likely that farmgate prices of complex fertilisers might be reduced during the rabi season. We expect reduction to the tune of Rs1,500-2,000/mt on DAP. We believe such reduction in prices will be beneficial for the sector and would help to spur agri-inputs consumption. Further, even after the reduction in prices, companies would be able to maintain their margins. However, pending subsidy receivables remain the major overhang on sector. Our interactions suggest that urea subsidy has been received only till June’13, while complex fertiliser subsidy has been received till Sep’13. Exhibit 1: Valuations Primer Name Rating CMP (Rs) TP (Rs) EPS (Rs) PE (x) FY14E FY15E FY14E FY15E Chambal Fertilizers & Chemicals Accumulate 37 48 5.5 6.5 6.7 5.6 Coromandel International Accumulate 217 225 14.0 18.5 15.5 11.7 Deepak Fertilisers & Petrochemicals Corporation Accumulate 108 130 21.7 25.8 5.0 4.2 Gujarat State Fertilisers & Chemicals Accumulate 57 60 11.2 13.1 5.1 4.4 Tata Chemicals Accumulate 276 270 26.1 32.1 10.6 8.6 Source: PL Research
Transcript of Sec Fertiliseer PL 191113 (1)

8/13/2019 Sec Fertiliseer PL 191113 (1)
http://slidepdf.com/reader/full/sec-fertiliseer-pl-191113-1 1/7
8/13/2019 Sec Fertiliseer PL 191113 (1)
http://slidepdf.com/reader/full/sec-fertiliseer-pl-191113-1 2/7

8/13/2019 Sec Fertiliseer PL 191113 (1)
http://slidepdf.com/reader/full/sec-fertiliseer-pl-191113-1 3/7

8/13/2019 Sec Fertiliseer PL 191113 (1)
http://slidepdf.com/reader/full/sec-fertiliseer-pl-191113-1 4/7

8/13/2019 Sec Fertiliseer PL 191113 (1)
http://slidepdf.com/reader/full/sec-fertiliseer-pl-191113-1 5/7

8/13/2019 Sec Fertiliseer PL 191113 (1)
http://slidepdf.com/reader/full/sec-fertiliseer-pl-191113-1 6/7

8/13/2019 Sec Fertiliseer PL 191113 (1)
http://slidepdf.com/reader/full/sec-fertiliseer-pl-191113-1 7/7