SEC Championship Game Record Booka.espncdn.com/SEC/football/2018/SEC-fb-record-book-2018.pdf2 SEC...
80
SEC Championship Game Record Book As of 1/17/17
Transcript of SEC Championship Game Record Booka.espncdn.com/SEC/football/2018/SEC-fb-record-book-2018.pdf2 SEC...

SEC Championship Game Record Book As of 1/17/17

SEC Championship Game Record Book2
TABLE OF CONTENTS3.................Game Summaries/Composite Standings4.................Winners Fared in Bowls/Next Season5-8 ............. Individual Records8................. Longest Plays9-14 ........... Team Records15-17 ......... Team Capsules/Superlatives18...............Coaches Records19...............Quarterback Passer Ratings20-21 .........Miscellaneous Game Notes/Last Time22...............Single Play Scoring Drives/Non-Offensive Scores/Two-Point Conversions23...............Blocked Kicks/Safeties24-25 .........Yearly Game Totals26-27 ......... 2017 Game Stats28-29 ......... 2016 Game Stats30-31 ......... 2015 Game Stats32-33 ......... 2014 Game Stats34-35 ......... 2013 Game Stats36-37 ......... 2012 Game Stats38-39 ......... 2011 Game Stats40-41 ......... 2010 Game Stats42-43 ......... 2009 Game Stats44-45 ......... 2008 Game Stats46-47 ......... 2007 Game Stats48-49 ......... 2006 Game Stats50-51 ......... 2005 Game Stats52-53 ......... 2004 Game Stats54-55 ......... 2003 Game Stats56-57 ......... 2002 Game Stats58-59 ......... 2001 Game Stats60-61 ......... 2000 Game Stats62-63 ......... 1999 Game Stats64-65 ......... 1998 Game Stats66-67 ......... 1997 Game Stats68-69 ......... 1996 Game Stats70-71 ......... 1995 Game Stats72-73 ......... 1994 Game Stats74-75 ......... 1993 Game Stats76-77 ......... 1992 Game Stats78...............Game Officials79............... Football Legends
SEC CHAMPIONSHIP GAME QUICK NOTESGames: 26 (Current streak: Eastern Division 1 game)Western Division won 14 Western won eight straight from 2009-16 (Alabama-5, Auburn-2, LSU-1)Eastern Division won 12 Eastern won six straight from 1993-98 (Florida-4, Tennessee-2)Western points – 722 (27.7)Eastern points – 631 (24.2)Only five games have been decided by 7 points or less (West is 3-2)Only two games have been decided by 1 point (1994 – Florida 24, Alabama 23; 1997 – Tennessee 30, Auburn 29)Longest drought: 19 years Mississippi State 1998(through 2017 game) 11 years Arkansas 2006 10 years Tennessee 2007Teams without an appearance: Kentucky, Ole Miss, Texas A&M, VanderbiltTeams with consecutive appearancesFlorida (5) 1992-96, (2) 1999-2000, 2008-09, 2015-16Alabama (3) 2014-16, (3) 1992-94, (2) 2008-09 Georgia (2) 2011-12Missouri (2) 2013-14Tennessee (2) 1997-98
SEC CHAMPIONSHIP GAME HOST CITIESBirmingham, Ala. Legion Field 1992-1993Atlanta, Ga. Georgia Dome 1994-2016Atlanta, Ga. Mercedes-Benz Stadium 2017-Present
SEC CHAMPIONSHIP GAME ATTENDANCEAll-Time Attendance1. 83,091 1992 Alabama 28, Florida 21 Legion Field, Birmingham, Ala.2. 76,534 2017 Georgia 28, Auburn 7 Mercedes-Benz Stadium, Atlanta, Ga.3. 76,345 1993 Florida 28, Alabama 13 Legion Field, Birmingham, Ala.4. 75,892 2008 Florida 31, Alabama 20 Georgia Dome, Atlanta, Ga.5. 75,802 2010 Auburn 56, S. Carolina 17 Georgia Dome, Atlanta, Ga.
Attendance at Mercedes-Benz Stadium (Atlanta, Ga.) 1. 76,534 2017 Georgia 28, Auburn 7 Total: 76,534 Average (1 game): 76,534
Attendance at Georgia Dome (Atlanta, Ga.)1. 75,892 2008 Florida 31, Alabama 202. 75,802 2010 Auburn 56, S. Carolina 173. 75,632 2013 Auburn 59, Missouri 424. 75,624 2012 Alabama 32, Georgia 285. 75,514 2009 Alabama 32, Florida 136. 75,320 2015 Alabama 29, Florida 157. 74,913 2003 LSU 34, Georgia 138. 74,896 1997 Tennessee 30, Auburn 299. 74,892 2004 Auburn 28, Tennessee 2810. 74,843 2001 LSU 31, Tennessee 20Total: 1,712,689 Average (23 games): 74,465
Attendance at Legion Field (Birmingham, Ala.)1. 83,091 1992 Alabama 28, Florida 212. 76,345 1993 Florida 28, Alabama 13Total: 159,436 Average (2 games): 79,718
Record book compiled by Jeff Muir with assistance from SEC Director of Communications Chuck Dunlap. Updates or corrections can be emailed to [email protected]

SEC Championship Game Record Book 3
SEC CHAMPIONSHIP GAME SUMMARIES (AP rankings; Higher ranked team is 19-7)Date Winner Loser Score Atten. MVP TV Announcers1992 #2 Alabama #12 Florida 28-21 83,091 CB Antonio Langham, Alabama ABC Keith Jackson, Bob Griese1993 #9 Florida #16 Alabama 28-13 76,345 QB Terry Dean, Florida ABC Keith Jackson, Bob Griese1994 #6 Florida #3 Alabama 24-23 74,751 DT Ellis Johnson, Florida ABC Keith Jackson, Bob Griese1995 #2 Florida #23 Arkansas 34-3 71,325 QB Danny Wuerffel, Florida ABC Keith Jackson, Bob Griese1996 #4 Florida #11 Alabama 45-30 74,132 QB Danny Wuerffel, Florida ABC Keith Jackson, Bob Griese1997 #3 Tennessee #11 Auburn 30-29 74,896 QB Peyton Manning, Tennessee ABC Keith Jackson, Bob Griese1998 #1 Tennessee #23 Mississippi State 24-14 74,795 WR Peerless Price, Tennessee ABC Keith Jackson, Bob Griese1999 #7 Alabama #5 Florida 34-7 71,500 WR Freddie Milons, Alabama ABC Brad Nessler, Bob Griese2000 #7 Florida #18 Auburn 28-6 73,427 QB Rex Grossman, Florida ABC Brent Musburger, Gary Danielson2001 #21 LSU #2 Tennessee 31-20 74,843 QB Matt Mauck, LSU CBS Verne Lundquist, Todd Blackledge, Jill Arrington2002 #4 Georgia #22 Arkansas 30-3 75,835 QB David Greene, Georgia CBS Verne Lundquist, Todd Blackledge, Jill Arrington2003 #3 LSU #5 Georgia 34-13 74,913 RB Justin Vincent, LSU CBS Verne Lundquist, Todd Blackledge, Jill Arrington2004 #3 Auburn #15 Tennessee 38-28 74,892 QB Jason Campbell, Auburn CBS Verne Lundquist, Todd Blackledge, Tracy Wolfson2005 #13 Georgia #3 LSU 34-14 73,717 QB D.J. Shockley, Georgia CBS Verne Lundquist, Todd Blackledge, Tracy Wolfson2006 #4 Florida #8 Arkansas 38-28 73,374 WR Percy Harvin, Florida CBS Verne Lundquist, Gary Danielson, Tracy Wolfson2007 #5 LSU #14 Tennessee 21-14 73,832 QB Ryan Perrilloux, LSU CBS Verne Lundquist, Gary Danielson, Tracy Wolfson2008 #2 Florida #1 Alabama 31-20 75,892 QB Tim Tebow, Florida CBS Verne Lundquist, Gary Danielson, Tracy Wolfson2009 #2 Alabama #1 Florida 32-13 75,514 QB Greg McElroy, Alabama CBS Verne Lundquist, Gary Danielson, Tracy Wolfson2010 #1 Auburn #19 South Carolina 56-17 75,802 QB Cam Newton, Auburn CBS Verne Lundquist, Gary Danielson, Tracy Wolfson2011 #1 LSU #12 Georgia 42-10 74,515 CB Tyrann Mathieu, LSU CBS Verne Lundquist, Gary Danielson, Tracy Wolfson2012 #2 Alabama #3 Georgia 32-28 75,624 RB Eddy Lacy, Alabama CBS Verne Lundquist, Gary Danielson, Tracy Wolfson2013 #3 Auburn #5 Missouri 59-42 75,632 RB Tre Mason, Auburn CBS Verne Lundquist, Gary Danielson, Tracy Wolfson2014 #1 Alabama #14 Missouri 42-13 73,526 QB Blake Sims, Alabama CBS Verne Lundquist, Gary Danielson, Allie LaForce2015 #2 Alabama #18 Florida 29-15 75,320 RB Derrick Henry, Alabama CBS Verne Lundquist, Gary Danielson, Allie LaForce2016 #1 Alabama #15 Florida 54-16 74,632 LB Reuben Foster, Alabama CBS Verne Lundquist, Gary Danielson, Allie LaForce2017 #6 Georgia #4 Auburn 28-7 76,534 LB Roquan Smith, Georgia CBS Brad Nessler, Gary Danielson, Allie LaForce
MVP BY POSITIONQB (14) – Terry Dean, Florida, 1993; Danny Wuerffel, Florida, 1995-96; Peyton Manning, Tennessee, 1997; Rex Grossman, Florida, 2000; Matt Mauck, LSU, 2001; David Greene, Georgia, 2002; Jason Campbell, Auburn, 2004; D.J. Shockley, Georgia, 2005; Ryan Perrilloux, LSU, 2007; Tim Tebow, Florida, 2008; Greg McElroy, Alabama, 2009; Cam Newton, Auburn, 2010; Blake Sims, Alabama, 2014RB (4) – Justin Vincent, LSU, 2003; Eddie Lacy, Alabama, 2012; Tre Mason, Auburn, 2013; Derrick Henry, Alabama, 2015WR (3) – Peerless Price, Tennessee, 1998; Freddie Milons, Alabama, 1999; Percy Harvin, Florida, 2006DB (2) – Antonio Langham, Alabama, 1992; Tyrann Mathieu, LSU, 2011LB (2) – Reuben Foster, Alabama, 2016; Roquan Smith, Georgia, 2017DT (1) – Ellis Johnson, Florida, 1994
SEC CHAMPIONSHIP GAME COMPOSITE STANDINGS Team App First Last W L Pct. Pts. Opp. Avg. Oavg.Florida 12 1992 2016 7 5 .583 300 300 25.0 25.0Alabama 11 1992 2016 7 4 .636 337 241 30.6 21.9Auburn 6 1997 2017 3 3 .500 195 173 32.5 28.8Georgia 6 2002 2017 3 3 .500 143 132 23.8 22.0LSU 5 2001 2011 4 1 .800 142 91 28.4 18.2Tennessee 5 1997 2007 2 3 .400 116 133 23.2 26.6Arkansas 3 1995 2006 0 3 .000 34 102 11.3 34.0Missouri 2 2013 2014 0 2 .000 55 101 27.5 50.5Mississippi State 1 1998 1998 0 1 .000 14 24 14.0 24.0South Carolina 1 2010 2010 0 1 .000 17 56 17.0 56.0
SEC CHAMPIONSHIP GAME TAKEAWAYS/GIVEAWAYS CHAMPIONSHIPS BY SCHOOL Takeaways Giveaways School Last TitlesTeam Int. Fum. Total Int. Fum. Total Net Dif Alabama 2016 26Alabama 18 2 20 8 2 10 +10 Georgia 2017 13LSU 7 3 10 4 1 5 +5 Tennessee 1998 13Auburn 6 6 12 3 9 12 0 LSU 2011 11Georgia 4 3 7 6 1 7 0 Auburn 2013 8Missouri 0 2 2 1 1 2 0 Florida 2008 8Mississippi State 1 1 2 2 1 3 -1 Ole Miss 1963 6South Carolina 0 1 1 2 0 2 -1 *Georgia Tech 1952 5Florida 14 6 20 20 3 23 -3 *Tulane 1949 3Tennessee 4 4 8 5 7 12 -4 Kentucky 1976 2Arkansas 2 0 2 5 3 8 -6 Mississippi State 1941 1 *-Former Members

SEC Championship Game Record Book4
HOW SEC CHAMPIONSHIP GAME WINNERS FARED IN THEIR BOWL GAME OR PLAYOFFYear Team Following Championship Game1992 Alabama Defeated #1 Miami, 34-13, in the Sugar Bowl in New Orleans, La., for the National Championship1993 Florida Defeated #3 West Virginia, 41-7, in the Sugar Bowl in New Orleans, La.1994 Florida Lost to #7 Florida State, 23-17, in the Sugar Bowl in New Orleans, La.1995 Florida Lost to #1 Nebraska, 62-24, in the Fiesta Bowl in Tempe, Ariz. (Nebraska won National Championship)1996 Florida Defeated #1 Florida State, 52-20, in the Sugar Bowl in New Orleans, La., for the National Championship1997 Tennessee Lost to #2 Nebraska, 42-17, in the Orange Bowl in Miami Gardens, Fla. (Nebraska won National Championship)1998 Tennessee Defeated #2 Florida State, 23-16, in the Fiesta Bowl for the BCS National Championship in Tempe, Ariz.1999 Alabama Lost to #8 Michigan, 35-34 OT, in the Orange Bowl in Miami Gardens, Fla.2000 Florida Lost to #2 Miami, 37-20, in the Sugar Bowl in New Orleans, La.2001 LSU Defeated #7 Illinois, 47-34, in the Sugar Bowl in New Orleans, La.2002 Georgia Defeated #16 Florida State, 26-13, in the Sugar Bowl in New Orleans, La.2003 LSU Defeated #3 Oklahoma, 21-14, in the Sugar Bowl in New Orleans, La.2004 Auburn Defeated #9 Virginia Tech, 16-13, in the Sugar Bowl in New Orleans, La.2005 Georgia Lost to #11 West Virginia, 38-35, in the Sugar Bowl in Atlanta, Ga.*2006 Florida Defeated #1 Ohio State, 41-14, in the BCS National Championship Game in Glendale, Ariz. 2007 LSU Defeated #1 Ohio State, 38-24, in the BCS National Championship Game in New Orleans, La.2008 Florida Defeated #2 Oklahoma, 24-14, in the BCS National Championship Game in Miami Gardens, Fla. 2009 Alabama Defeated #2 Texas, 37-21, in the BCS National Championship Game in Pasadena, Calif.2010 Auburn Defeated #2 Oregon, 22-19, in the BCS National Championship Game in Glendale, Ariz.2011 LSU Lost to #2 Alabama, 21-0, in the BCS National Championship Game in New Orleans, La.2012 Alabama Defeated #1 Notre Dame, 42-14, in the BCS National Championship Game in Miami Gardens, Fla.2013 Auburn Lost to #1 Florida State, 34-31, in the BCS National Championship Game in Pasadena, Calif.2014 Alabama Lost to #4 Ohio State, 42-35, in the Sugar Bowl in the College Football Playoff Semifinals in New Orleans, La.2015 Alabama Defeated #3 Michigan State, 38-0, in the Cotton Bowl in the College Football Playoff Semifinals in Arlington, Texas Alabama Defeated #1 Clemson, 45-40, in the College Football Playoff National Championship Game in Glendale, Ariz.2016 Alabama Defeated #4 Washigton, 24-7, in the Chick fil-A Peach Bowl in the College Football Playoff Semifinals in Atlanta, Ga. Alabama Lost to #2 Clemson, 35-31, in the College Football Playoff National Championship Game in Tampa, Fla.2017 Georgia Defeated #3 Oklahoma, 54-48 2OT, in the Rose Bowl in the College Football Playoff Semifinals in Pasadena, Calif. Georgia Lost to #4 Alabama, 26-23 OT, in the College Football Playoff National Championship Game in Atlanta, Ga.*-game moved to Atlanta due to Hurricane Katrina.
HOW SEC CHAMPIONSHIP GAME WINNERS FARED IN THEIR NEXT SEASONYear Team Following Championship Season1992 Alabama Repeated as Western Division champions losing to Florida 28-13 in championship game. Forfeited all games by NCAA.1993 Florida Repeated as Eastern Division champions (7-1), defeated Alabama 24-23, finishing 10-1-11994 Florida Repeated as Eastern Division champions (8-0), defeated Arkansas 34-3, finishing 12-0.1995 Florida Repeated as Eastern Division champions (8-0), defeated Alabama 45-30, finishing 11-1.1996 Florida Finished third in the Eastern Division (6-2) and 9-2 overall.1997 Tennessee Repeated as Eastern Division champions (8-0), defeated Mississippi State 24-14, finishing 12-0.1998 Tennessee Finished second in the Eastern Division (6-2) and 9-2 overall. 1999 Alabama Finished sixth in the Eastern Division (3-5) and 3-8 overall.2000 Florida Finished second in the Eastern Division (6-2) and 9-2 overall.2001 LSU Finished third in the Western Division (5-3) and 8-4 overall.2002 Georgia Repeated as Eastern Division champions (6-2) and 10-3 overall.2003 LSU Finished second in the Eastern Division (6-2) and 9-2 overall.2004 Auburn Finished second in the Western Division (7-1) and 9-2 overall.2005 Georgia Finished fourth in the Eastern Division (4-4) and 9-4 overall.2006 Florida Finished third in the Eastern Division (5-3) and 9-4 overall.2007 LSU Finished third in the Western Division (3-5) and 8-5 overall.2008 Florida Repeated as Eastern Division champions (8-0) and 13-1 overall.2009 Alabama Finished fourth in the Western Division (5-3) and 10-3 overall.2010 Auburn Finished fourth in the Western Division (4-4) and 8-5 overall.2011 LSU Finished second in the Western Division (6-2) and 10-3 overall.2012 Alabama Finished second in the Western Division (7-1) and 11-2 overall.2013 Auburn Finished fourth in the Western Division (4-4) and 8-5 overall.2014 Alabama Repeated as Western Division champions (7-1), defeated Florida 29-15, finishing 14-12015 Alabama Repeated as Western Division champions (8-0), defeated Florida 54-16, finishing 14-12016 Alabama Tied with Auburn for first in the Western Division (7-1) and 13-1 overall (won national championship over Georgia)2017 Georgia

SEC Championship Game Record Book 5
INDIVIDUAL RECORDSSCORINGMost Points24 Tre Mason, Auburn, 2013 (4 rushing TD)20 Reidel Anthony, Florida, 1996 (3 receiving TD, 1 2pt)18 Kenny Hilliard, LSU, 2011 (2 rushing TD, 1 receiving TD)18 Mark Ingram, Alabama, 2009 (3 rushing TD)
Most Points Kicking12 Billy Bennett, Georgia, 2002 (3-3 FG, 3-3 PAT)11 Adam Griffith, Alabama, 2016 (2-3 FG, 5-6 PAT)11 Cody Parkey, Auburn, 2013 (1-2 FG, 8-8 PAT)11 John Corbello, LSU, 2001 (3-4 FG, 2-2 PAT)11 Michael Proctor, Alabama, 1994 (3-3 FG, 2-2 PAT)
Most Touchdowns4 Tre Mason, Auburn, 2013 (4 rush)3 Kenny Hilliard, LSU, 2011 (2 rush, 1 receiving)3 Mark Ingram, Alabama, 2009 (3 rush)3 Reidel Anthony, Florida, 1996 (3 receiving)
Most (One-Point) Points After Touchdown Made8 Cody Parkey, Auburn, 2013 (8-8)8 Wes Byrum, Auburn, 2010 (8-8)6 Drew Alleman, LSU, 2011 (6-6)6 Adam Griffith, Alabama, 2014 (6-6)
Most Two-Point Conversions Made1 Done 7 times last by: Terry Godwin from Jake Fromm, Georgia, 2017 (pass)
Most Field Goals Attempted5 Ryan Pflugner, Alabama, 1999 (made 3)4 John Corbello, LSU, 2001 (made 3)3 Done 8 times, last by Adam Griffith, Alabama, 2016 (made 2)
Most Field Goals Made3 Billy Bennett, Georgia, 2002 (3 attempts)3 John Corbello, LSU, 2001 (4 attempts)3 Ryan Pflugner, Alabama, 1999 (5 attempts)3 Michael Proctor, Alabama, 1994 (3 attempts)
Longest Field Goal Attempted54 Cody Parkey, Auburn, 2013 (missed)
Longest Field Goal Made52 Cody Parkey, Auburn, 201351 Brandon Coutu, Georgia, 200551 Billy Bennett, Georgia, 200351 Alex Walls, Tennessee, 200149 Ryan Pflugner, Alabama, 1999 TOTAL OFFENSEPlays54 Shane Matthews, Florida, 1992 (49 pass, 5 rush)53 Freddie Kitchens, Alabama, 1996 (45 pass, 8 rush)49 Danny Wuerffel, Florida, 1996 (35 pass, 14 rush)
Yards Gained431 Jason Campbell, Auburn, 2004 (374 pass, 57 rush)408 Cam Newton, Auburn, 2010 (335 pass, 73 rush)390 Danny Wuerffel, Florida, 1996 (401 pass, -11 rush)375 Peyton Manning, Tennessee, 1997 (373 pass, 2 rush)
Yards Per Play (Min. 25 plays)9.70 Cam Newton, Auburn, 2010 (42 for 408)8.98 Jason Campbell, Auburn, 2004 (48 for 431)7.97 Peyton Manning, Tennessee, 1997 (47 for 375)
Touchdown Responsibility6 Cam Newton, Auburn, 2010 (4 pass, 2 rush)6 Danny Wuerffel, Florida, 1996 (6 pass)4 Tre Mason, Auburn, 2013 (4 rush); James Franklin, Missouri, 2013 (3 pass, 1 rush); Rex Grossman, Florida, 2000 (4 pass); Peyton Manning, Tennessee, 1997 (4 pass) ALL-PURPOSE YARDS GAINED(Rushing, receiving, interception returns, punt returns, kickoff returns)Most Attempts47 Tre Mason, Auburn, 2013 (46 rushes, 1 reception)44 Derrick Henry, Alabama, 2015 (44 rushes)34 Jamal Lewis, Tennessee, 1997 (31 rushes, 3 receptions)31 Shaun Alexander, Alabama, 1999 (30 rushes, 1 reception)31 Sherman Williams, Alabama, 1994 (29 rushes, 2 receptions)
Most Yards Gained312 Tre Mason, Auburn, 2013 (304 rush, 8 receiving)233 Kevin Prentiss, Miss. State, 1998 (27 receiving, 152 punt ret., 54 kickoff ret.)227 Darvin Adams, Auburn, 2010 (217 receiving, 10 punt return)205 Gerald Riggs, Tennessee, 2004 (182 rush, 23 kickoff return)201 Justin Vincent, LSU, 2003 (201 rushing) RUSHINGMost Rushing Attempts, Career64 Derrick Henry, Alabama, 2014-1546 Tre Mason, Auburn, 201344 Errict Rhett, Florida, 1992-9339 T.J. Yeldon, Alabama, 2012, 2014
Most Rushing Attempts, Game46 Tre Mason, Auburn, 2013 (304 yards)44 Derrick Henry, 2015 (189 yards)31 Jamal Lewis, Tennessee, 1997 (127 yards)30 Shaun Alexander, Alabama, 1999 (97 yards)29 Sherman Williams, Alabama, 1994 (99 yards)
Most Rushing Yards Gained, Career330 Derrick Henry, Alabama, 2014-15304 Tre Mason, Auburn, 2013216 Justin Vincent, LSU, 2003, 2005200 T.J. Yeldon, Alabama, 2012, 2014
Most Rushing Yards Gained, Game1. 304 Tre Mason, Auburn, 2013 (46 rushes)2. 201 Justin Vincent, LSU, 2003 (18 rushes)3. 189 Derrick Henry, Alabama, 2015 (44 rushes)4. 182 Gerald Riggs, Tennessee, 2004 (11 rushes)5. 181 Eddie Lacy, Alabama, 2012 (20 rushes)6. 169 Earnest Graham, Florida, 2000 (19 rushes)7. 153 T.J. Yeldon, Alabama, 2012 (25 rushes)8. 141 Derrick Henry, Alabama, 2014 (20 rushes)9. 127 Jamal Lewis, Tennessee, 1997 (31 rushes)10. 123 Henry Josey, Missouri, 2013 (9 rushes)11. 122 Todd Gurley, Georgia, 2012 (23 rushes)12. 120 Travis Henry, Tennessee, 1998 (26 rushes)13. 120 Jacob Hester, LSU, 2007 (23 rushes)14. 116 Freddie Milons, Alabama, 1999 (6 rushes)15. 113 Mark Ingram, Alabama, 2009 (28 rushes)16. 112 Glen Coffee, Alabama, 2008 (21 rushes)17. 106 Musa Smith, Georgia, 2002 (19 rushes)18. 105 Percy Harvin, Florida, 2006 (6 rushes)19. 101 Nick Marshall (QB), Auburn, 2013 (16 rushes)20. 100 Carnell Williams, Auburn, 2004 (19 rushes)
Longest Run From Scrimmage87 TD Justin Vincent, LSU, 200380 TD Gerald Riggs, Tennessee, 200477 TD Freddie Milons, Alabama, 199967 TD Percy Harvin, Florida, 200665 Henry Josey, Missouri, 2013 64 TD D’Andre Swift, Georgia, 2017

SEC Championship Game Record Book6
Highest Rushing Average Gain (20 attempts)9.1 Eddie Lacy, Alabama, 2012 (20-181)7.1 Derrick Henry, Alabama, 2014 (20-141)6.6 Tre Mason, Auburn, 2013 (46-304)
Highest Rushing Average Gain (10 attempts)16.5 Gerald Riggs, Tennessee, 2004 (11-182)11.2 Justin Vincent, LSU, 2003 (18-201)8.9 Earnest Graham, Florida, 2000 (19-169)
Most Rushing Touchdowns, Career4 Tre Mason, Auburn, 20134 Mark Ingram, Alabama, 2008-093 Derrick Henry, Alabama, 2014-153 T.J. Yeldon, Alabama, 2012-14
Most Rushing Touchdowns, Game4 Tre Mason, Auburn, 20133 Mark Ingram, Alabama, 20092 Done 10 times, last by Derrick Henry and T.J. Yeldon, Alabama in 2014 PASSINGHighest Passer Rating (20 attempts)208.36 Cam Newton, Auburn, 2010 (17-28-0, 335 yds, 4TD)198.53 Danny Wuerffel, Florida, 1996 (20-35-2, 401 yds, 6 TD)191.14 Blake Sims, Alabama, 2014 (23-27-0, 262 yds, 2 TD)191.11 Tim Tebow, Florida, 2008 (14-22-0, 216 yds, 3 TD)
Most Passes Attempted, Career104 Danny Wuerffel, Florida, 1994-9673 Aaron Murray, Georgia, 2011-1270 David Greene, Georgia, 2002-03
Most Passes Attempted, Game49 Shane Matthews, Florida, 1992 (30 completions)45 Freddie Kitchens, Alabama, 1996 (19 completions)43 Casey Clausen, Tennessee, 2001 (27 completions)43 Peyton Manning, Tennessee, 1997 (25 completions)41 David Greene, Georgia, 2003 (17 completions)41 Danny Wuerffel, Florida, 1994 (23 completions)
Most Passes, Completed Career63 Danny Wuerffel, Florida, 1994-9634 Aaron Murray, Georgia, 2011-1234 Tim Tebow, Florida, 2008-0934 David Greene, Georgia, 2002-03
Most Passes Completed, Game30 Shane Matthews, Florida, 1992 (49 attempts)27 Jason Campbell, Auburn, 2004 (35 attempts)27 Casey Clausen, Tennessee, 2001 (43 attempts)26 Austin Appleby, Florida, 2016 (39 attempts)25 Peyton Manning, Tennessee, 1997 (43 attempts)
Most Consecutive Completions10 Blake Sims, Alabama, 2014 (10-of-10 to start game) (1st-2nd quarters)9 Jake Fromm, Georgia, 2017 (1st-2nd quarters)9 Danny Wuerffel, Florida, 1995 (1st quarter)9 Shane Matthews, Florida, 1992 (1st quarter)8 Jarrett Stidham, Auburn, 2017 (8-of-8 to start game) (1st quarter)
Highest Completion Percentage, Game (20 attempts)85.2 Blake Sims, Alabama, 2014 (23-of-27)77.1 Jason Campbell, Auburn, 2004 (27-of-35)72.7 Jake Fromm, Georgia, 2017 (16-of-22)
Highest Completion Percentage, Game (10 attempts)81.8 Nick Marshall, Auburn, 2013 (9-of-11)75.0 Brian Burgdorf, Alabama, 1993 (9-of-12)66.7 Greg McElroy, Alabama, 2009 (12-of-18)
Most Passing Yards Gained, Career904 Danny Wuerffel, Florida, 1994-96463 Tim Tebow, Florida, 2008-09436 David Greene, Georgia, 2002-03428 Aaron Murray, Georgia, 2011-12
Most Passing Yards Gained, Game401 Danny Wuerffel, Florida, 1996 (20-of-35)374 Jason Campbell, Auburn, 2004 (27-of-35)373 Peyton Manning, Tennessee, 1997 (25-of-43)335 Cam Newton, Auburn, 2010 (17-of-28)332 Casey Clausen, Tennessee, 2001 (27-of-43)303 James Franklin, Missouri, 2013 (21-of-37)
Longest Pass Completion94 TD Freddie Kitchens to Michael Vaughn, Alabama, 199685 TD Danny Wuerffel to Jacquez Green, Florida, 199673 TD Peyton Manning to Marcus Nash, Tennessee, 199770 TD Jay Barker to Curtis Brown, Alabama, 199469 Greg McElroy to Mark Ingram, Alabama, 200969 Dameyune Craig to Hicks Poor, Auburn, 1997
Highest Passing Average Gain per Attempt, Game (20 attempts)11.96 Cam Newton, Auburn, 2010 (17-28-0, 335 yds, 4 TD)11.46 Danny Wuerffel, Florida, 1996 (20-35-2, 401 yds, 6 TD)10.96 Jason Campbell, Auburn, 2004 (27-35-1, 374 yds, 3 TD)9.86 Danny Wuerffel, Florida, 1995 (20-28-0, 276 yds, 2 TD)9.82 Tim Tebow, Florida, 2008 (14-22-0, 216 yds, 3 TD)
Most Touchdown Passes, Career10 Danny Wuerffel, Florida, 1994-964 Tim Tebow, Florida, 2008-094 Cam Newton, Auburn, 20104 Rex Grossman, Florida, 20004 Peyton Manning, Tennessee, 1997
Most Touchdown Passes, Game6 Danny Wuerffel, Florida, 19964 Cam Newton, Auburn, 20104 Rex Grossman, Florida, 20004 Peyton Manning, Tennessee, 19973 Done 4 times, last by James Franklin, Missouri, 2013
Most Attempts Without Interception43 Casey Clausen, Tennessee, 200134 Maty Mauk, Missouri, 201432 Jarrett Stidham, 201728 Cam Newton, Auburn, 201028 Danny Wuerffel, Florida, 1995
Most Passes Had Intercepted3 Austin Appleby, Florida, 20163 David Greene, Georgia, 20033 Jesse Palmer, Florida, 19992 Done 13 times, last by Aaron Murray, Georgia, 2011
Most Times Sacked5 Treon Harris, Florida, 20155 David Greene, Georgia, 20035 Freddie Kitchens, Alabama, 19965 Jay Barker, Alabama, 19944 Done 6 times, last by Austin Appleby, Florida, 2016

SEC Championship Game Record Book 7
PASS RECEIVINGMost Receptions, Career24 Reidel Anthony, Florida, 1994-9620 Amari Cooper, Alabama, 2012, 201418 Willie Jackson, Florida, 1992-9314 Peerless Price, Tennessee, 1997-98
Most Receptions, Game12 Amari Cooper, Alabama, 2014 (83 yards) (11 in 1st half, 7 in 1st quarter)11 Reidel Anthony, Florida, 1996 (171 yards)10 Errict Rhett, Florida, 1992 (82 yards) (Most by a RB)9 Done 5 times, last by Brandon Powell, Florida, 2016 (59 yards)
Most Receiving Yards Gained, Career323 Reidel Anthony, Florida, 1994-96258 Peerless Price, Tennessee, 1997-98233 Ike Hilliard, Florida, 1994-96217 Darvin Adams, Auburn, 2010214 Willie Jackson, Florida, 1992-93210 Amari Cooper, Alabama, 2012, 2014
Most Receiving Yards Gained, Game1. 217 Darvin Adams, Auburn, 2010 (7 receptions)2. 171 Reidel Anthony, Florida, 1996 (11 receptions)3. 169 Jimmie Hunt, Missouri, 2014 (6 receptions)4. 161 Peerless Price, Tennessee, 1997 (8 receptions)5. 144 Dorial Green-Beckham, Missouri, 2013 (6 receptions)6t. 142 Tavarres King, Georgia, 2012 (5 receptions)6t. 142 Michael Vaughn, Alabama, 1996 (5 receptions)8. 140 Kelley Washington, Tennessee, 2001 (9 receptions)9. 127 Amari Cooper, Alabama, 2012 (7 receptions)10. 126 Marcus Nash, Tennessee, 1997 (9 receptions)11. 125 Ike Hilliard, Florida, 1995 (7 receptions)12. 124 Julio Jones, Alabama, 2008 (5 receptions)13. 119 Curtis Brown, Alabama, 1994 (3 receptions)14. 114 Willie Jackson, Florida, 1993 (9 receptions)15. 111 Courtney Taylor, Auburn, 2004 (6 receptions)16. 106 Jacquez Green, Florida, 1996 (3 receptions)17. 105 Reidel Anthony, Florida, 1994 (8 receptions)18t. 101 DeAndrew White, Alabama, 2014 (4 receptions)18t. 101 David Palmer, Alabama, 1992 (5 receptions)20. 100 Willie Jackson, Florida, 1992 (9 receptions) 91 DeAndre Goolsby, Florida, 2016 (7 receptions) (Most by a TE) 82 Errict Rhett, Florida, 1992 (10 receptions) (Most by a RB)
Longest Reception94 TD Michael Vaughn from Freddie Kitchens, Alabama, 199685 TD Jacquez Green from Danny Wuerffel, Florida, 199673 TD Marcus Nash from Peyton Manning, Tennessee, 199770 TD Curtis Brown from Jay Barker, Alabama, 199469 Mark Ingram from Greg McElroy, Alabama, 200969 Hicks Poor from Dameyune Craig, Auburn, 1997
Highest Receiving Average, Game (4 receptions)31.0 Darvin Adams, Auburn, 2010 (7 receptions, 217 yards)28.4 Tavarres King, Georgia, 2012 (5 receptions, 142 yards)28.4 Michael Vaughn, Alabama, 1996 (5 receptions, 142 yards)28.2 Jimmie Hunt, Missouri, 2014 (6 receptions, 169 yards)
Most Receiving Touchdowns, Career4 Reidel Anthony, Florida, 1994-96 3 Peerless Price, Tennessee, 1997-98
Most Receiving Touchdowns, Game3 Reidel Anthony, Florida, 1996 (3 receiving)2 Done 7 times, last by Dorial Green-Beckham, Missouri, 2013
INTERCEPTIONS BYMost Interceptions2 Lito Sheppard, Florida, 2000 (31 yards)2 Marcus Spencer, Alabama, 1999 (53 yards)2 Tommy Johnson, Alabama, 1993 (18 yards)2 Michael Gilmore, Florida, 1993 (0 yards)
Most Interception Return Yards Gained77 Jayson Bray, Auburn, 1997 (1 interception)70 Robert Bean, Mississippi State, 1998 (1 interception)53 Marcus Spencer, Alabama, 1999 (2 interceptions)
Longest Interception Return77 Jayson Bray, Auburn, 199770 TD Robert Bean, Mississippi State, 199845 TD Morris Claiborne, LSU, 2011
Most Interception Return Touchdowns1 Done 11 times, last by Minkah Fitzpatrick, Alabama, 2016 (44 yards) PUNTINGMost Punts10 Jaret Holmes, Auburn, 1997 (438 yards, 43.8 average)10 Bryne Diehl, Alabama, 1992 (326 yards, 32.6 average)9 David Leaverton, Tennessee, 1998 (323 yards, 35.9 average)
Longest Punt67 Brad Wing, LSU, 201165 Alan Rhine, Florida, 200062 Johnny Townsend, 201662 Drew Butler, Georgia, 2011
Highest Punt Average, Game (3 punts)54.5 Johnny Townsend, Florida, 2016 (4 punts, 218 yards)51.8 Johnny Townsend, Florida, 2015 (8 punts, 414 yards)51.6 Drew Butler, Georgia, 2011 (8 punts, 413 yards)51.2 JK Scott, Alabama, 2015 (6 punts, 307 yards)
Lowest Punt Average, Game (3 punts)29.5 Kody Bliss, Auburn, 2004 (2 punts, 59 yards)32.6 Bryne Diehl, Alabama, 1992 (10 punts, 326 yards)34.3 Matt Wait, Arkansas, 1995 (4 punts, 137 yards)
Most 50+ yard Punts, Game6 Brad Wing, LSU, 20115 Johnny Townsend, Florida, 20155 Drew Butler, Georgia, 2011 PUNT RETURNSMost Punt Returns7 Cyrus Jones, Alabama, 2015 (32 yards); Terry Fair, Tennessee, 1997 (157 yards)6 Kevin Prentiss, Miss. State, 1998 (152 yards)
Most Punt Return Yards Gained157 Terry Fair, Tennessee, 1997 (7 returns)152 Kevin Prentiss, Miss. State 1998 (6 returns)119 Tyrann Mathieu, LSU, 2011 (4 returns)
Longest Punt Return85 TD Antonio Callaway, Florida, 201583 TD Kevin Prentiss, Miss. State, 199862 TD Tyrann Mathieu, LSU, 201147 Trevon Diggs, Alabama, 2016
Highest Punt Return Average (3 returns)30.0 Trevon Diggs, Alabama, 2016 (3 returns, 90 yards)29.8 Tyrann Mathieu, LSU, 2011 (4 returns, 119 yards)28.0 Antonio Callaway, Florida, 2015 (3 returns, 84 yards)
Most Punt Return Touchdowns1 Antonio Callaway, Florida, 2015 (85 yards); Tyrann Mathieu, LSU, 2011 (62 yards); Kevin Prentiss, Miss. State, 1998 (83 yards)

SEC Championship Game Record Book8
KICKOFF RETURNSMost Kickoff Returns5 Done 5 times, last by Chris Thompson, Florida, 20164 Done 8 times, last by Cyrus Jones, Alabama, 2012
Most Kickoff Yards Gained124 Chris Thompson, Florida, 2016 (5 returns)121 Brandon James, Florida, 2008 (5 returns)108 Bo Carroll, Florida, 1999 (5 returns)
Longest Kickoff Return50 Lennon Creer, Tennessee, 200746 Markeith Cooper, Auburn, 199741 Javier Arenas, Alabama, 2008
Highest Kickoff Average (3 returns)28.3 Christion Jones, Alabama, 2014 (3 returns, 85 yards)26.3 Javier Arenas, Alabama, 2009 (3 returns, 79 yards)26.0 Brandon James, Florida, 2009 (3 returns, 78 yards)
Most Kickoff Return TouchdownsNone FUMBLESMost Fumbles3 Nick Marshall, QB, Auburn, 20133 Rex Grossman, QB, Florida, 20002 Done 7 times, last by Blake Sims, QB, Alabama, 2014
Most Fumbles Lost2 Nick Marshall, QB, Auburn, 20132 Terry Fair, DB, Tennessee, 1997 FUMBLE RETURNSMost Fumble Return Yards Gained95 Ben Hanks, Florida, 199524 Brad Ware, Auburn, 199711 E.J. Gaines, Missouri, 2013
Longest Fumble Return95 TD Ben Hanks, Florida, 199524 TD Brad Ware, Auburn, 199711 TD E.J. Gaines, Missouri, 2013
Most Fumble Return Touchdowns1 E.J. Gaines, Missouri, 20131 Wondy Pierre-Louis, Florida, 20061 Cole Bennett, Auburn, 20041 Brad Ware, Auburn, 19971 Ben Hanks, Florida, 1995 TACKLESTotal Tackles18 Omar Gaither, Tennessee, 200415 Takeo Spikes, Auburn, 199715 Jerod Mayo, Tennessee, 200714 Kentrell Brothers, Missouri, 201414 Mike Nattiel, Florida, 1999
Solo Tackles15 Omar Gaither, Tennessee, 2004 (18 total)10 Roquan Smith, Georgia, 2017 (13 total)10 Takeo Spikes, Auburn, 1997 (15 total)10 Kevin Burnett, Tennessee, 2004 (13 total)10 Larry Campbell, Miss. State, 1998 (12 total)10 Larry Kennedy, Florida, 1993 (11 total) SACKSMost Sacks2.0 Done 8 times, last by Reuben Foster, Alabama, 2016
TACKLES FOR LOSSTackles for Loss (sacks included in TFL total)3.0 Done 10 times, last by Kony Ealy, Missouri, 2013 FORCED FUMBLESForced Fumbles2 Kony Ealy, Missouri, 2013 FUMBLE RECOVERIESFumbles Recovered2 Roquan Smith, Georgia, 20172 Mike Nattiel, Florida, 2000 LONGEST PLAYSRush (TD) - 87 by Justin Vincent, LSU, 2003Rush (non-TD) - 65 by Henry Josey, Missouri, 2013Rush (by QB) - 42 by Nick Marshall, Auburn, 2013
Pass (TD) - 94 by Freddie Kitchens to Michael Vaughn, Alabama, 1996Pass (non-TD) - 69 by Dameuyne Craig to Hicks Poor, Auburn, 1997
Punt Return (TD) - 85 by Antonio Callaway, Florida, 2015Punt Return (non-TD) - 47 by Trevon Diggs, Alabama, 2016
Kickoff Return (TD) - Not happenedKickoff Return (non-TD) - 50 by Lennon Creer, Tennessee, 2007
Interception Return (TD) - 70 by Robert Bean, Miss. State, 1998Interception Return (non-TD) 77 by Jayson Bray, Auburn, 1997
Fumble Return (TD) - 95 by Ben Hanks, Florida, 1995
Punt - 67 by Brad Wing, LSU, 2011
Field Goal Made - 52 by Cody Parkey, Auburn, 2013Field Goal Attempted - 54 by Cody Parkey, Auburn, 2013

SEC Championship Game Record Book 9
TEAM RECORDSGAMES, VICTORIES, DEFEATSMost Games12 Florida11 Alabama6 Auburn, Georgia
Most Consecutive Games Played5 Florida, 1992-96
Most Games Won7 Alabama, Florida
Most Consecutive Games Won5 Alabama, 2009, 2012, 2014-16
Most Games Lost5 Florida4 Alabama 3 Arkansas, Auburn, Georgia, Tennessee
Most Consecutive Games Lost3 Alabama, 1993, 1994, 1996; Arkansas, 1995, 2002, 2006; Tennessee, 2001, 2004, 2007; Florida, 2009, 2015, 20162 Missouri, 2013-14; Georgia, 2011-12; Auburn, 1997, 2000 SCORINGMost Points59 Auburn, 201356 Auburn, 201054 Alabama, 201645 Florida, 199642 Alabama, 2014; Missouri 2013; LSU, 2011
Fewest Points3 Arkansas, 2002; Arkansas, 1995 6 Auburn, 2000 7 Auburn, 2017; Florida, 1999 10 Georgia, 2011
Most Points, Both Teams101 2013 Auburn 59, Missouri 4275 1996 Florida 45, Alabama 3073 2010 Auburn 56, S. Carolina 1770 2016 Alabama 54, Florida 1666 2006 Florida 38, Arkansas 2866 2004 Auburn 38, Tennessee 28
Fewest Points, Both Teams33 2002 Georgia 30, Arkansas 334 2000 Florida 28, Auburn 635 2017 Georgia 28, Auburn 7; 2007 LSU 21, Tennessee 1437 1995 Florida 34, Arkansas 338 1998 Tennessee 24, Miss. State 14
Largest Margin of Victory, Game39 Auburn 56, S. Carolina 17, 201038 Alabama 54, Florida 16, 201632 LSU 42, Georgia 10, 201131 Florida 34, Arkansas 3, 199529 Alabama 42, Missouri 13, 2014
Most Points, Each Half1st: 33 Alabama, 20162nd: 35 LSU, 2011
Most Points, Each Quarter1st: 21 Auburn, 20102nd: 18 Florida, 19963rd: 21 LSU, 20114th: 21 Alabama, 2014
Most Points, Both Teams, Each Half1st: 55 Auburn 28, Missouri 27, 20132nd: 46 Auburn 31, Missouri 15, 2013
Fewest Points, Both Teams, Each Half1st: 13 Tennessee 7, LSU 6, 20072nd: 10 Georgia 7, Arkansas 3, 2002; Florida 7, Auburn 3, 2000
Most Points, Both Teams, Each Quarter1st: 28 Auburn 21, S. Carolina 7, 20102nd: 31 Missouri 17, Auburn 14, 20133rd: 32 Auburn 17, Missouri 15, 20134th: 21 Tennessee 14, Miss. State 7, 1998; Florida 14, Arkansas 7, 2006; Alabama 14, Georgia 7, 2012; Alabama 21, Missouri 0, 2014
Scoreless quarters, Both Teams1st: 2012 Alabama vs. Georgia2nd: 2007 Tennessee vs. LSU3rd: 1999 Miss. State vs. Tennessee4th: 2000 Florida vs. Auburn
Points off Turnovers21 LSU vs. Georgia, 2011; Florida vs. Auburn, 200018 Alabama vs. Florida 199917 Alabama vs. Florida, 2016; Florida vs. Arkansas, 1995 TOUCHDOWNSMost Total Touchdowns8 Auburn vs. Missouri, 2013 (7 rush, 1 pass)8 Auburn vs. S. Carolina, 2010 (3 rush, 4 pass, 1 interception return)
Fewest Offensive Touchdowns0 Arkansas vs. Georgia, 2002 (0 rush, 0 pass)0 Auburn vs. Florida, 2000 (0 rush, 0 pass)0 Miss. State vs. Tennessee, 1998 (0 rush, 0 pass)0 Arkansas vs. Florida, 1995 (0 rush, 0 pass)
Most Total Touchdowns, Both Teams12 Auburn vs. Missouri, 2013 (Auburn 8, Missouri 4)10 Auburn vs. S. Carolina, 2010 (Auburn 8, S. Carolina 2)10 Florida vs. Alabama, 1996 (Florida 6, Alabama 4)
Fewest Total Touchdowns, Both Teams3 Georgia vs. Arkansas, 2002 (Georgia 3, Arkansas 0) POINTS AFTER TOUCHDOWNMost (One-Point) Points After Touchdown8 Auburn vs. Missouri, 20138 Auburn vs. S. Carolina, 20106 Done 3 times, last by Alabama vs. Florida, 2016
Most (One-Point) Points After Touchdown, Both Teams12 Auburn vs. Missouri, 2013 (Auburn 8, Missouri 4)10 Auburn vs. South Carolina, 2010 (Auburn 8, S. Carolina 2)9 Florida vs. Arkansas, 2006 (Florida 5, Arkansas 4)9 Auburn vs. Tennessee, 2004 (Auburn 5, Tennessee 4)
Fewest (One-Point) Points After Touchdown, Both Teams2 Florida vs. Alabama (Florida 1-2, Alabama 1-1)3 Done 5 times, last by Georgia vs. Auburn, 2017 (Georgia 2-2, Auburn 1-1)
Most Two-Point Conversions1 Done 7 times, last by Georgia vs. Auburn, 2017 FIELD GOALSMost Field Goals Made3 Done 4 times, last by Georgia vs. Arkansas, 20022 Done 18 times, last by Georgia vs. Auburn, 2017
Most Field Goals Attempted5 Alabama vs. Florida, 19994 LSU vs. Tennessee, 2001

SEC Championship Game Record Book10
Most Field Goals Made, Both Teams5 LSU vs. Tennessee, 2001 (LSU 3, Tennessee 2)4 Done 5 times, last by Florida vs. Alabama, 2009 (Florida 2, Alabama 2)
Fewest Field Goals Made, Both Teams0 Alabama vs. Florida, 1992 (UA 0-0, UF 0-1)1 Done 7, times, last by Alabama vs. Georgia, 2012 (Alabama 1-2, Georgia 0-1)
Most Field Goals Attempted, Both Teams6 LSU vs. Tennessee, 2001 (LSU 4, Tennessee 2)5 Done 4 times, last by LSU vs. Tennessee, 2007 (LSU 3, Tennessee 2)
Fewest Field Goals Attempted, Both Teams1 Auburn vs. Tennessee, 2004 (Auburn 1, Tennessee 0)1 Florida vs. Alabama, 1991 (Florida 1, Alabama 0) SAFETIESMost Safeties1 Alabama vs. Florida, 2015 (Alabama blocked a punt and ball went out of the back of the endzone)1 LSU vs. Georgia, 2003 (Bad punt snap as Georgia’s Gordon Ely-Kelso tackled in end zone by Alley Broussard and Daniel Francis)1 Alabama vs. Florida, 1996 (Florida’s Danny Wuerffel takes knee in end zone) FIRST DOWNSMost First Downs31 Auburn vs. Tennessee, 200430 Auburn vs. Missouri, 201328 Alabama vs. Missouri, 2014; Auburn vs. South Carolina, 2010
Fewest First Downs6 Florida vs. Alabama, 19997 Florida vs. Alabama, 20159 Done 3 times, last by Tennessee vs. Auburn, 2004
Most First Downs, Both Teams52 Auburn vs. Missouri, 2013 (Auburn 30, Missouri 22)48 Auburn vs. S. Carolina, 2010 (Auburn 28, S. Carolina 20)46 Florida vs. Arkansas, 1995 (Florida 25, Arkansas 21)
Fewest First Downs, Both Teams28 Alabama vs. Florida, 1999 (Alabama 22, Florida 6)30 Alabama vs. Florida, 1994 (Alabama 16, Florida 14)30 Tennessee vs. Miss. State, 1998 (Tennessee 21, Miss. State 9)
Most First Downs Rushing26 Auburn vs. Missouri, 201318 Alabama vs. Georgia, 201215 Alabama vs. Florida, 1999
Fewest First Downs Rushing1 Florida vs. Alabama, 20151 Missouri vs. Alabama, 20142 Done 3 times, last by Florida vs. Alabama, 2016
Most First Downs Rushing, Both Teams33 Auburn vs. Missouri, 2013 (Auburn 26, Missouri 7)24 Alabama vs. Georgia, 2012 (Alabama 18, Georgia 6)23 Auburn vs. S. Carolina, 2010 (Auburn 14, S. Carolina 9)
Fewest First Downs Rushing, Both Teams9 Tennessee vs. Auburn, 1997 (Tennessee 7, Auburn 2)10 Florida vs. Alabama, 1996 (Florida 6, Alabama 4)13 LSU vs. Tennessee, 2001 (LSU 10, Tennessee 3)13 Alabama vs. Florida, 1994 (Alabama 10, Florida 3)
Most First Downs Passing16 Florida vs. Alabama, 199214 Done 4 times, last by Auburn vs. Tennessee, 2004
Fewest First Downs Passing1 LSU vs. Georgia, 20113 Done 3 times, last by Alabama vs. Florida, 2016
Most First Downs Passing, Both Teams22 Done 5 times, last by Alabama vs. Missouri, 2014 (Alabama 13, Missouri 9)
Fewest First Downs Passing, Both Teams9 Alabama vs. Florida, 1999 (Alabama 6, Florida 3)11 Tennessee vs. Miss. State, 1998 (Tennessee 7, Miss. State 4)12 Done 2 times, last by Georgia vs. LSU, 2011 (Georgia 11, LSU 1)
Most First Downs Penalty4 Auburn vs. Tennessee, 20044 Georgia vs. Arkansas, 20023 Done 5 times, last by Alabama vs. Georgia, 2012
Fewest First Downs Penalty0 Done 15 times, last by Florida vs. Alabama, 2015
Most First Downs Penalty, Both Teams, Game7 Georgia vs. Arkansas, 2002 (Georgia 4, Arkansas 3)5 Georgia vs. Auburn, 2017 (Georgia 3, Auburn 2)
Fewest First Downs Penalty, Both Teams, Game0 Tennessee vs. LSU, 20071 Done 5 times, last by Alabama vs. Missouri, 2014 (Alabama 1, Missouri 0) TOTAL OFFENSEMost Total Yards Gained677 Auburn vs. Missouri, 2013 (545 rush, 132 pass)589 Auburn vs. Missouri, 2010 (238 rush, 351 pass)559 Auburn vs. Tennessee, 2004 (185 rush, 374 pass)534 Missouri vs. Auburn, 2013 (231 rush, 303 pass)512 Alabama vs. Georgia, 2012 (350 rush, 162 pass)504 Alabama vs. Missouri, 2014 (242 rush, 262 pass)502 Tennessee vs. Auburn, 1997 (129 rush, 373 pass)
Fewest Total Yards Gained114 Florida vs. Alabama, 1999 (31 rush, 83 pass)139 Arkansas vs. Georgia, 2002 (65 rush, 74 yards)149 Miss. State vs. Tennessee, 1998 (65 rush, 84 pass)
Most Total Yards Gained, Both Teams1,211 Auburn vs. Missouri, 2013 (Auburn 677, Missouri 534)938 Auburn vs. South Carolina, 2010 (Auburn 589, S. Carolina 349)906 Alabama vs. Georgia, 2012 (Alabama 512, Georgia 394)
Fewest Total Yards Gained, Both Teams480 Georgia vs. LSU, 2005 (Georgia 250, LSU 230)508 Tennessee vs. Miss. State, 1998 (Tennessee 359, Miss. State 149)520 Georgia vs. Arkansas, 2002 (Georgia 381, Arkansas 139)
Most Total Yards Gained, First Half376 Auburn vs. Missouri, 2013 (282 rush, 94 pass)
Most Total Yards Gained, Second Half301 Auburn vs. Missouri, 2013 (263 rush, 38 pass)
Most Total Plays85 Auburn vs. Missouri, 201385 Georgia vs. LSU, 201185 Auburn vs. Tennessee, 200484 Alabama vs. Florida, 201581 Tennessee vs. Miss. State, 199880 LSU vs. Tennessee, 2007
Fewest Total Plays44 Tennessee vs. Auburn, 200444 Florida vs. Alabama, 199945 Florida vs. Alabama, 201548 LSU vs. Georgia, 201149 Florida vs. Alabama, 2009

SEC Championship Game Record Book 11
Most Total Plays, Both Teams156 Auburn vs. Missouri, 2013 (Auburn 85, Missouri 71)146 LSU vs. Tennessee, 2007 (LSU 80, Tennessee 66)145 Alabama vs. Florida, 1996 (Alabama 73, Florida 72)
Fewest Total Plays, Both Teams118 Alabama vs. Florida, 1999 (Alabama 74, Florida 44)120 Alabama vs. Florida, 2009 (Alabama 71, Florida 49)120 LSU vs. Georgia, 2005 (LSU 66, Georgia 54)
Highest Total Yards Average Gain8.3 Auburn vs. South Carolina, 2010 (71 plays, 589 yards)8.0 Auburn vs. Missouri, 2013 (85 plays, 677 yards)7.5 Missouri vs. Auburn, 2013 (71 plays, 534 yards)
Lowest Total Yards Average Gain2.5 Arkansas vs. Georgia, 2002 (50 plays, 149 yards)2.6 Florida vs. Alabama, 1999 (44 plays, 114 yards)3.0 Miss. State vs. Tennessee, 1998 (56 plays, 139 yards) RUSHINGMost Rushing Attempts74 Auburn vs. Missouri, 201358 Alabama vs. Florida, 201553 Alabama vs. Florida, 2009
Fewest Rushing Attempts14 Florida vs. Alabama, 200918 Tennessee vs. LSU, 200120 Florida vs. Alabama, 1999
Most Rushing Attempts, Both Teams108 Auburn vs. Missouri, 2013 (Auburn 74, Missouri 34)80 Alabama vs. Georgia, 2012 (Alabama 51, Georgia 29)79 Alabama vs. Florida, 2015 (Alabama 58, Florida 21)
Fewest Rushing Attempts, Both Teams57 Tennessee vs. Auburn, 1997 (Tennessee 36, Auburn 21)60 LSU vs. Tennessee, 2001 (LSU 42, Tennessee 18)63 Florida vs. Auburn, 2000 (Florida 35, Auburn 28)
Most Rushing Yards Gained545 Auburn vs. Missouri, 2013 (74 rushes)350 Alabama vs. Georgia, 2012 (51 rushes)300 Alabama vs. Florida, 1999 (49 rushes)
Fewest Rushing Yards Gained-15 Auburn vs. Tennessee, 1997 (21 rushes)0 Florida vs. Alabama, 2016 (30 rushes)15 Florida vs. Alabama, 2015 (21 rushes)
Most Rushing Yards Gained, Both Teams776 Auburn vs. Missouri, 2013 (Auburn 545, Missouri 231)463 Alabama vs. Georgia, 2012 (Alabama 350, Georgia 113)413 Tennessee vs. Auburn, 2004 (Tennessee 228, Auburn 185)
Fewest Rushing Yards Gained, Both Teams96 Florida vs. Alabama, 1996 (Florida 69, Alabama 27)114 Tennessee vs. Auburn, 1997 (Tennessee 129, Auburn -15)160 Alabama vs. Florida, 1994 (Alabama 116, Florida 44)
Most Rushing Yards Gained, First Half282 Auburn vs. Missouri, 2013
Most Rushing Yards Gained, Second Half263 Auburn vs. Missouri, 2013
Highest Rushing Yards Average9.5 Tennessee vs. Auburn, 2004 (24 rushes, 228 yards)7.4 Auburn vs. Missouri, 2013 (74 rushes, 545 yards)6.9 Alabama vs. Georgia, 2012 (51 rushes, 350 yards)
Lowest Rushing Yards Average-0.7 Auburn vs. Tennessee, 1997 (21 rushes, -15 yards)0.0 Florida vs. Alabama, 2016 (30 rushes, 0 yards)0.7 Florida vs. Alabama, 2015 (21 rushes, 15 yards)
Most Rushing Touchdowns7 Auburn vs. Missouri, 20134 Done 2 times, last by Alabama vs. Florida, 2016
Fewest Rushing Touchdowns0 Done 22 times, last by Auburn vs. Georgia, 2017
Most Rushing Touchdowns, Both Teams8 Auburn vs. Missouri, 2013 (Auburn 7, Missouri 1)5 Alabama vs. Georgia, 2012 (Alabama 3, Georgia 2)5 Tennessee vs. Auburn, 2004 (Tennessee 3, Auburn 2)
Fewest Rushing Touchdowns, Both Teams0 Done 3 times, last by Tennessee vs. LSU, 2007 PASSINGMost Passes Attempted51 Georgia vs. LSU, 201149 Florida vs. Alabama, 199246 Alabama vs. Florida, 1996
Fewest Passes Attempted11 Auburn vs. Missouri, 201312 Georgia vs. LSU, 200513 LSU vs. Georgia, 2011
Most Passes Attempted, Both Teams81 Alabama vs. Florida, 1996 (Alabama 46, Florida 35)78 Tennessee vs. LSU 2001 (Tennessee 43, LSU 35)77 Tennessee vs. Auburn, 1997 (Tennessee 43, Auburn 34)
Fewest Passes Attempted, Both Teams42 LSU vs. Georgia, 2005 (LSU 30, Georgia 12)47 Alabama vs. Florida, 2008 (Alabama 25, Florida 22)48 Missouri vs. Auburn, 2013 (Missouri 37, Auburn 11)
Most Passes Completed30 Florida vs. Alabama, 199227 Tennessee vs. LSU, 200127 Auburn vs. Tennessee, 2004
Fewest Passes Completed5 LSU vs. Georgia, 20116 Georgia vs. LSU, 20058 Done 2 times, last by Tennessee vs. Auburn, 2004
Most Passes Completed, Both Teams41 LSU vs. Tennessee, 2007 (LSU 21, Tennessee 20)41 Tennessee vs. LSU, 2001 (Tennessee 27, LSU 14)40 Done 3 times, last by Auburn vs. Florida, 2000 (Auburn 23, Florida 17)
Fewest Passes Completed, Both Teams20 LSU vs. Georgia, 2005 (LSU 14, Georgia 6)22 Alabama vs. Florida, 1999 (Alabama 14, Florida 8)25 Done 2 times, last by Georgia vs. LSU, 2011 (Georgia 20, LSU 5)
Highest Completion Percentage (20 attempts)85.2 Alabama vs. Missouri, 2014 (23-of-27)
Highest Completion Percentage (10 attempts)81.8 Auburn vs. Missouri, 2013 (9-of-11)
Lowest Completion Percentage (20 attempts)33.3 Florida vs. Alabama, 1999 (8-of-24)
Lowest Completion Percentage (10 attempts)38.5 LSU vs. Georgia, 2011 (5-of-13)

SEC Championship Game Record Book12
Most Passing Yards Gained401 Florida vs. Alabama, 1996374 Auburn vs. Tennessee, 2004373 Tennessee vs. Auburn, 1997351 Auburn vs. S. Carolina, 2010332 Tennessee vs. LSU, 2001303 Missouri vs. Auburn, 2013
Fewest Passing Yards Gained30 LSU vs. Georgia, 201169 Tennessee vs. Auburn, 200474 Arkansas vs. Georgia, 2002
Most Passing Yards Gained, Both Teams670 Florida vs. Alabama, 1996 (Florida 401, Alabama 269)635 Tennessee vs. Auburn, 1997 (Tennessee 373, Auburn 262)544 Auburn vs. South Carolina, 2010 (Auburn 351, S. Carolina 193)
Fewest Passing Yards Gained, Both Teams245 Alabama vs. Florida, 1999 (Alabama 162, Florida 83)248 Georgia vs. LSU, 2011 (Georgia 218, LSU 30)268 LSU vs. Georgia, 2005 (LSU 156, LSU 112)
Most Passing Yards Gained, First Half176 Missouri vs. Auburn, 2013
Most Passing Yards Gained, Second Half185 Missouri vs. Alabama, 2014
Most Passing Touchdowns6 Florida vs. Alabama, 19964 Done 3 times, last by Auburn vs. South Carolina, 2010
Fewest Passing Touchdowns0 Done 7 times, last by Alabama vs. Florida, 2008
Most Passing Touchdowns, Both Teams9 Florida vs. Alabama, 1996 (Florida 6, Alabama 3)6 Auburn vs. South Carolina, 2010 (Auburn 4, South Carolina 2)6 Tennessee vs. Auburn, 1997 (Tennessee 4, Auburn 2)5 Arkansas vs. Florida, 2006 (Arkansas 3, Florida 2)
Fewest Passing Touchdowns, Both Teams1 Georgia vs. Arkansas, 2002 (Georgia 1, Arkansas 0) INTERCEPTION RETURNSMost Interceptions Thrown4 Florida vs. Alabama, 19993 Done 3 times, last by Florida vs. Alabama, 2016
Fewest Interceptions Thrown 0 Done 20 times, last by both Georgia vs. Auburn, 2017
Most Interceptions Thrown, Both Teams5 Arkansas vs. Florida, 2006 (Arkansas 3, Florida 2)5 Florida vs. Alabama, 1999 (Florida 4, Alabama 1)
Fewest Interceptions Thrown, Both Teams0 Alabama vs. Missouri, 2014 (Alabama 0, Missouri 0)
Most Yards Gained97 Alabama vs. Florida, 1999 (4 returns)84 Alabama vs. Florida, 2016 (3 returns)77 Auburn vs. Tennessee, 1997 (2 returns)
Most Yards Gained, Both Teams126 Alabama vs. Florida, 1999 (Alabama 4-97, Florida 1-29) 103 Miss. State vs. Tennessee, 1998 (Miss. State 1-70, Tennessee 2-33)84 Alabama vs. Florida, 2016 (Alabama 3-84, Florida 0-0)Most Interception Return Touchdowns1 Done 11 times, last by Alabama vs. Florida, 2016
SACKS BYMost Sacks6 LSU vs. Georgia, 20035 Done 5 times, last by Alabama vs. Florida, 2015
Fewest Sacks0 Done 6 times, last by Alabama vs. Missouri, 2014
Most Sacks, Both Teams10 LSU vs. Georgia, 2003 (LSU 6, Georgia 4)9 Florida vs. Alabama, 1996 (Florida 5, Alabama 4)7 Alabama vs. Florida, 2015 (Alabama 5, Florida 2)
Fewest Sacks, Both Teams1 Done 3 times, last by Florida vs. Alabama, 2009 (Florida 1, Alabama 0) TACKLES FOR LOSS BYMost Tackles for Loss11 Done 3 times, last by Georgia vs. LSU, 2005
Fewest Tackles for Loss1 Done 4 times, last by Florida vs. Alabama, 2008
Most Tackles for Loss, Both Teams19 Florida vs. Alabama, 1996 (Florida 10, Alabama 9)
Fewest Tackles for Loss, Both Teams5 Done 2 times, Alabama vs. Florida, 2008 (Alabama 4, Florida 1) PUNTINGMost Punts10 Mississippi State vs. Tennessee, 199810 Auburn vs. Tennessee, 199710 Alabama vs. Florida, 1992
Fewest Punts1 Auburn vs. South Carolina, 20102 Done 2 times, last by Alabama vs. Florida, 20163 Done 7 times, last by Alabama vs. Missouri, 2014
Most Punts, Both Teams19 Mississippi State vs. Tennessee, 1998 (Mississippi State 10, Tennessee 9)17 Alabama vs. Florida, 1992 (Alabama 10, Florida 7)16 Georgia vs. LSU, 2011 (Georgia 8, LSU 8)
Fewest Punts, Both Teams4 South Carolina vs. Auburn, 2010 (South Carolina 3, Auburn 1)6 Florida vs. Alabama, 2009 (Florida 4, Alabama 2)7 Done 3 times, last by Alabama vs. Florida, 2016 (Florida 5, Alabama 2)
Highest Punt Average (3 punts)51.6 Georgia vs. LSU, 201151.2 Alabama vs. Florida, 201550.4 LSU vs. Georgia, 201150.0 South Carolina vs. Auburn, 2010
Lowest Punt Average (3 punts)29.3 Arkansas vs. Florida, 2006 PUNT RETURNSMost Punt Returns8 Alabama vs. Florida, 2015 (45 yards)8 Tennessee vs. Auburn, 1997 (171 yards)6 Done 3 times, last by LSU vs. Georgia, 2011 (127 yards)
Fewest Punt Returns0 Done 11 times, last by Florida vs. Alabama, 2016
Most Punt Returns, Both Teams11 Alabama vs. Florida, 2015 (Alabama 8, Florida 3)10 LSU vs. Georgia, 2011 (LSU 6, Georgia 4)10 Tennessee vs. Auburn, 1997 (Tennessee 8, Auburn 2)

SEC Championship Game Record Book 13
Fewest Punt Returns, Both Teams0 Done 2 times, last by Florida vs. Alabama, 1999
Most Punt Return Yards Gained171 Tennessee vs. Auburn, 1997 (8 returns)152 Miss. State vs. Tennessee, 1998 (6 returns)127 LSU vs. Georgia, 2011 (6 returns)
Fewest Punt Return Yards Gained0 Done 11 times, last by Florida vs. Alabama, 2016
Most Punt Return Yards Gained, Both Teams186 Tennessee vs. Auburn, 1997 (Tennessee 8-171, Auburn 2-15)159 Miss. State vs. Tennessee, 1998 (Miss. State 6-152, Tennessee 3-7)129 Florida Vs. Alabama, 2015 (Florida 3-84, Alabama 8-45)
Fewest Punt Return Yards Gained, Both Teams0 Done 2 times, last by Florida vs. Alabama, 1999
Highest Punt Return Average 29.3 Alabama vs. Florida, 2016 (4-117)28.0 Florida vs. Alabama, 2015 (3-84)25.3 Miss. State vs. Tennessee, 1998 (6-152)
Most Punt Return Touchdowns1 Florida vs. Alabama, 20151 LSU vs. Georgia, 20111 Miss. State vs. Tennessee, 1998 KICKOFF RETURNSMost Kickoff Returns7 South Carolina vs. Auburn, 2010 (139 yards)7 Florida vs. Alabama, 1999 (116 yards)6 Done 3 times, last by Florida vs. Alabama, 2016 (145 yards)
Fewest Kickoff Returns0 Done 3 times, last by Georgia vs. Auburn, 20171 Done 4 times, last by Missouri vs. Auburn, 2013
Most Kickoff Returns, Both Teams11 South Carolina vs. Auburn, 2010 (South Carolina 7, Auburn 4)9 Done 5 times, last by Florida vs. Alabama, 2009 (Florida 6, Alabama 3)
Fewest Kickoff Returns, Both Teams1 Auburn vs. Georgia, 2017 (Auburn 1, Georgia 0)3 Auburn vs. Missouri, 2013 (Auburn 2, Missouri 1)
Most Kickoff Return Yards Gained161 Florida vs. Alabama, 2009 (6 returns)145 Florida vs. Alabama, 2016 (6 returns)139 South Carolina vs. Auburn, 2013 (7 returns)
Fewest Kickoff Return Yards Gained0 Done 3 times, last by Georgia vs. Auburn, 2017 (0 returns)
Most Kickoff Return Yards Gained, Both Teams240 Florida vs. Alabama, 2009 (Florida 6-161, Alabama 3-79)216 Florida vs. Alabama, 2008 (Florida 5-121, Alabama 4-95)211 South Carolina vs. Auburn, 2010 (S. Carolina 7-139, Auburn 4-72)
Fewest Kickoff Return Yards Gained, Both Teams20 Auburn vs. Georgia, 2017 (Auburn 1-20, Georgia 0-0)
Highest Kickoff ReturnAverage 28.3 Alabama vs. Missouri, 2014 (3 returns, 85 yards)26.8 Florida vs. Alabama, 2009 (6 returns, 161 yards)26.3 Alabama vs. Florida, 2009 (3 returns, 79 yards)
Most Kickoff Return TouchdownsNone
PENALTIESMost Penalties14 Florida vs. Alabama, 1996 (95 yards)13 Florida vs. Alabama, 1993 (95 yards)12 Done 4 times, last by Tennessee vs. Auburn, 2004 (95 yards)
Fewest Penalties0 Tennessee vs. LSU, 2007 (0 yards)1 Alabama vs. Florida, 2009 (5 yards)2 Done 6 times, last by Alabama vs. Florida, 2016 (14 yards)
Most Penalties, Both Teams22 Georgia vs. Arkansas, 2002 (Georgia 12, Arkansas 10)21 Auburn vs. Tennessee, 1997 (Auburn 12, Tennessee 9)21 Florida vs. Alabama, 1996 (Florida 14, Alabama 7) 19 Florida vs. Alabama, 1993 (Florida 13, Alabama 6)
Fewest Penalties, Both Teams6 Florida vs. Alabama, 2009 (Florida 5, Alabama 1)8 Done 5 times, last by Missouri vs. Alabama, 2014 (Missouri 6, Alabama 2)
Most Yards Penalized115 Georgia vs. Arkansas, 2002 (12 penalties)100 Miss. State vs. Tennessee, 1998 (10 penalties)99 Alabama vs. Florida, 1999 (12 penalties)
Fewest Yards Penalized0 Tennessee vs. LSU (0 yards)5 Alabama vs. Florida, 2009 (5 yards)10 Done 2 times, last by Alabama vs. Missouri, 2014 (2 penalties)
Most Yards Penalized, Both Teams210 Georgia vs. Arkansas 2002 (Georgia 12-115, Arkansas 10-95)165 Florida vs. Alabama, 1993 (Florida 13-95, Alabama 6-70)141 Georgia vs. LSU, 2011 (Georgia 9-87, LSU 8-54)
Fewest Yards Penalized, Both Teams40 Alabama vs. Florida, 1994 (Alabama 6-30, Florida 2-10)44 LSU vs. Tennessee (LSU 9-44, Tennessee 0-0)56 Florida vs. Alabama, 2009 (Florida 5-51, Alabama 1-5) FUMBLESMost Fumbles6 Tennessee vs. Auburn, 1997 (4 Lost)5 Auburn vs. Tennessee, 1997 (1 lost)4 Done 3 times, last by Georgia vs. LSU, 2011 (1 lost)
Fewest Fumbles0 Done 17 times, last by Georgia vs. Alabama, 2012
Most Fumbles, Both Teams11 Tennessee vs. Auburn, 1997 (Tennessee 6, Auburn 5)7 Florida vs. Auburn, 2000 (Florida 4, Auburn 3)
Fewest Fumbles, Both Teams0 Done 3 times, last by Florida vs. Alabama, 2008
Most Fumbles Lost4 Tennessee vs. Auburn, 1997 (6 fumbles)2 Done 6 times, last by Auburn vs. Georgia, 2017 (2 fumbles)
Most Fumbles Lost, Both Teams5 Tennessee vs. Auburn, 1997 (Tennessee 6-4, Auburn 5-1)4 Florida vs. Auburn, 2000 (Florida 4-2, Auburn 3-2)
Fewest Fumbles Lost, Both Teams0 Done 10 times, last by Florida vs. Alabama, 2016
SEC Championship Game Record Book14
TURNOVERSMost Turnovers6 Tennessee vs. Auburn, 1997 (2 interceptions, 4 fumbles)4 Done 4 times, last by Arkansas vs. Florida, 2006 (3 interceptions, 1 fumble)
Fewest Turnovers0 Done 14 times, last by Georgia vs. Auburn, 2017
Most Turnovers, Both Teams7 Tennessee vs. Auburn, 1997 (Tennessee 6, Auburn 1)7 Auburn vs. Florida, 2000 (Auburn 4, Florida 3)6 Arkansas vs. Florida, 2006 (Arkansas 4, Florida 2)
Fewest Turnovers, Both Teams0 Georgia vs. Arkansas, 2002 THIRD DOWN CONVERSIONSMost Third Down Conversions Made11 Alabama vs. Florida, 2009 (15 attempts)10 LSU vs. Tennessee, 2007 (20 attempts)9 Done 4 times, last by Alabama vs. Missouri, 2014 (13 attempts)
Most Third Down Conversion Attempts21 Georgia vs. LSU, 2011 (7 made)20 Done 3 times, last by LSU vs. Tennessee, 2007 (10 made)18 Alabama vs. Florida, 1996 (7 made)
Fewest Third Down Conversions Made0 Florida vs. Alabama, 2015 (11 attempts)0 Florida vs. Alabama, 1999 (9 attempts)1 Done 3 times, last by LSU vs. Georgia, 2011 (9 attempts)
Fewest Third Down Conversion Attempts9 Done 3 times, last by LSU vs. Georgia, 2011 (1 made)10 Done 2 times, last by Alabama vs. Florida, 2016 (5 made) FOURTH DOWN CONVERSIONSMost Fourth Down Conversions2 Auburn vs. Tennessee, 2004 (2 attempts)2 Florida vs. Alabama, 1994 (2 attempts)2 Florida vs. Alabama, 1993 (3 attempts)
Most Fourth Down Conversion Attempts3 Done 5 times, last by Missouri vs. Auburn, 2013 (1 made) TIME OF POSSESSIONMost in a Game43:29 Alabama vs. Florida, 201540:11 Alabama vs. Florida, 199939:37 Alabama vs. Florida, 2009
Most in a QuarterFirst 12:20 Florida vs. Alabama, 2016Second 12:30 LSU vs. Tennessee, 2007Third 13:55 Alabama vs. Florida, 2015Fourth 12:00 Georgia vs. Auburn, 2017
Most in First Half21:26 Auburn vs. Tennessee, 2004
Most in Second Half25:17 Alabama vs. Florida, 2015
SEC CHAMPIONSHIP GAME COIN TOSS RESULTS1992 Alabama won toss, defers. Florida receives.1993 Florida won toss, defers. Alabama receives.1994 Alabama won toss, defers. Florida receives.1995 Arkansas won toss, elects to receive.1996 Alabama won toss, defers. Florida receives.1997 Tennessee won toss, elects to receive.1998 Tennessee won toss, defers. Miss. State receives.1999 Florida won toss, elects to receive.2000 Auburn won toss, elects to receive.2001 LSU won toss, elects to receive.2002 Georgia won toss, defers. Arkansas receives.2003 LSU won toss, defers. Georgia receives.2004 Tennessee won toss, defers. Auburn receives.2005 LSU won toss, defers. Georgia receives.2006 Florida won toss, defers. Arkansas receives.2007 Tennessee won toss, elects to receive.2008 Alabama won toss, elects to receive.2009 Alabama won toss, elects to receive.2010 Auburn won toss, elects to receive.2011 Georgia won toss, defers. LSU receives.2012 Georgia won toss, defers. Alabama receives.2013 Auburn won toss, defers. Missouri receives.2014 Alabama won toss, elects to receive.2015 Florida won toss, elects to receive.2016 Alabama won toss, defers. Florida receives.2017 Georgia won toss, defers. Auburn receives.

SEC Championship Game Record Book 15
TEAM CAPSULES & SUPERLATIVES
Alabama (7-4)Year Result Opponent UA Coach Rusher No-Yds-TD Passer C-A-I Yds-TD Receiver No-Yds-TD1992 W, 28-21 Florida Gene Stallings Derrick Lassic 21-117-2 Jay Barker 10-18-0 154-1 David Palmer 5-101-01993 L, 13-28 Florida Gene Stallings David Palmer 16-93-0 David Palmer 8-16-1 90-0 Toderick Malone 3-37-01994 L, 23-24 Florida Gene Stallings Sherman Williams 29-99-0 Jay Barker 10-19-2 181-1 Curtis Brown 3-119-11996 L, 30-45 Florida Gene Stallings Dennis Riddle 17-42-1 Freddie Kitchens 19-45-1 264-3 Michael Vaughn 5-142-21999 W, 34-7 Florida Mike DuBose Freddie Milons 6-116-1 Andrew Zow 10-17-0 134-1 Antonio Carter 5-71-02008 L, 20-31 Florida Nick Saban Glen Coffee 21-112-1 John Parker Wilson 12-25-1 187-0 Julio Jones 5-124-02009 W, 32-13 Florida Nick Saban Mark Ingram 28-113-3 Greg McElroy 12-18-0 239-1 Marquis Maze 5-96-02012 W, 32-28 Georgia Nick Saban Eddie Lacy 20-181-2 AJ McCarron 13-21-1 162-1 Amari Cooper 7-127-12014 W, 42-13 Missouri Nick Saban Derrick Henry 20-141-2 Blake Sims 23-27-0 262-2 DeAndrew White 4-101-12015 W, 29-15 Florida Nick Saban Derrick Henry 44-189-1 Jake Coker 18-26-0 204-2 Calvin Ridley 8-102-02016 W, 54-16 Florida Nick Saban Bo Scarbrough 11-91-2 Jalen Hurts 11-20-0 138-1 Calvin Ridley 4-43-0
Opponents – vs. Florida 5-4 (W-1992, 1999, 2009, 2015, 2016; L-1993, 1994, 1996, 2008); vs. Georgia 1-0 (W-2012); vs. Missouri 1-0 (W-2014) MVPs (7) – Antonio Langham, DB, 1992; Freddie Milons, WR, 1999; Greg McElroy, QB, 2009; Eddie Lacy, RB, 2012; Blake Sims, QB, 2014; Derrick Henry, RB, 2015; Reuben Foster, LB, 2016 Points – 54 vs. Florida 2016 Pass Completions – 23, Blake Sims vs. Georgia 2014 First Downs – 28 vs. Missouri 2014 Pass Attempts – 45, Freddie Kitchens vs. Florida 1996 Rush Yards – 350 vs. Georgia 2012 Pass Interceptions – 2, Jay Barker vs. Florida 1994 Pass Yards – 269 vs. Florida 1996 Pass Yards – 264, Freddie Kitchens vs. Florida 1996 Total Yards – 512 vs. Georgia 2012 Pass TD – 3, Freddie Kitchens vs. Florida 1996 Rush Attempts – 44, Derrick Henry vs. Florida 2015 Receptions – 12, Amari Cooper vs. Missouri 2014 Rush Yards – 189, Derrick Henry vs. Florida 2015 Receiving Yards – 142, Michael Vaughn vs. Florida 1996 Rush TD – 3, Mark Ingram vs. Florida 2009 Receiving TD – 2, Michael Vaughn vs. Florida 1996 Arkansas (0-3)Year Result Opponent AR Coach Rusher No-Yds-TD Passer C-A-I Yds-TD Receiver No-Yds-TD1995 L, 3-34 Florida Danny Ford Marius Johnson 20-71-0 Barry Lunney 17-27-2 170-0 J.J. Meadors 7-74-02002 L, 3-30 Georgia Houston Nutt Fred Talley 17-51-0 Matt Jones 9-17-0 60-0 Richard Smith 5-36-02006 L, 28-38 Florida Houston Nutt Darren McFadden 21-73-0 Casey Dick 10-22-2 148-1 Marcus Monk 3-69-1
Opponents – vs. Florida 0-2 (L-1995, 2006); vs. Georgia 0-1 (L-2002) Points – 28 vs. Florida 2006 Pass Completions – 17, Barry Lunney vs. Florida 1995 First Downs – 21 vs. Florida 1995 Pass Attempts – 27, Barry Lunney vs. Florida 1995 Rush Yards – 132 vs. Florida 2006 Pass Ints – 2, Casey Dick vs. Florida 2006; Barry Lunney vs. Florida 1995 Pass Yards – 179 vs. Florida 2006 Pass Yards – 170, Barry Lunney vs. Florida 1995 Total Yards – 311 vs. Florida 2006 Pass TD – 1, Casey Dick vs. Florida 2006 Rush Attempts – 21, Darren McFadden vs. Florida 2006 Receptions – 7, J.J. Meadors vs. Florida 1995 Rush Yards – 73, Darren McFadden vs. Florida 2006 Receiving Yards – 74, J.J. Meadors vs. Florida 1995 Rush TD – None Receiving TD – 2, Felix Jones vs. Florida 2006 Auburn (3-3)Year Result Opponent AU Coach Rusher No-Yds-TD Passer C-A-I Yds-TD Receiver No-Yds-TD1997 L, 29-30 Tennessee Terry Bowden Rusty Williams 6-8-0 Dameyune Craig 14-34-0 262-2 Hicks Poor 3-98-02000 L, 6-28 Florida Tommy Tuberville Heath Evans 8-69-0 Ben Leard 17-30-1 158-0 Heath Evans 4-45-02004 W, 38-28 Tennessee Tommy Tuberville Carnell Williams 19-100-1 Jason Campbell 27-35-1 374-3 Courtney Taylor 6-111-12010 W, 56-17 S. Carolina Gene Chizik Cam Newton 14-73-2 Cam Newton 17-28-0 335-4 Darvin Adams 7-217-22013 W, 59-42 Missouri Gus Malzahn Tre Mason 46-304-4 Nick Marshall 9-11-0 132-1 Sammie Coates 6-94-12017 L, 7-28 Georgia Gus Malzahn Kerryon Johnson 13-44-0 Jarrett Stidham 16-32-0 145-1 Ryan Davis 7-65-0
Opponents – vs. Tennessee 1-1 (W-2004; L-1997); vs. South Carolina 1-0 (W-2010); vs. Missouri 1-0 (W-2013); vs. Florida 0-1 (L-2000); vs. Georgia 0-1 (L-2017) MVPs (3) – Jason Campbell, QB, 2004; Cam Newton, QB, 2010; Tre Mason, RB, 2013 Points – 59 vs. Missouri 2013 Pass Completions – 27, Jason Campbell vs. Tennessee 2004 First Downs – 31 vs. Tennessee 2004 Pass Attempts – 35, Jason Campbell vs. Tennessee 2004 Rush Yards – 545 vs. Missouri 2013 Pass Ints – 1, Done 3 times, last by Jason Campbell vs. Tennessee 2004 Pass Yards – 374 vs. Tennessee 2004 Pass Yards – 374, Jason Campbell vs. Tennessee 2004 Total Yards – 677 vs. Missouri 2013 Pass TD – 4, Cam Newton vs. S. Carolina 2010 Rush Attempts – 46, Tre Mason vs. Missouri 2013 Receptions – 7, Done 2 times, last by Ryan Davis vs. Georgia 2017 Rush Yards – 304, Tre Mason vs. Missouri 2013 Receiving Yards – 217, Darvin Adams vs. S. Carolina 2010 Rush TD – 4, Tre Mason vs. Missouri 2013 Receiving TD – 2, Darvin Adams vs. S. Carolina 2010

SEC Championship Game Record Book16
Florida (7-5)Year Result Opponent UF Coach Rusher No-Yds-TD Passer C-A-I Yds-TD Receiver No-Yds-TD1992 L, 21-28 Alabama Steve Spurrier Errict Rhett 22-59-1 Shane Matthews 30-49-2 287-2 Willie Jackson 9-100-11993 W, 28-13 Alabama Steve Spurrier Errict Rhett 22-88-1 Terry Dean 20-37-2 256-2 Willie Jackson 9-114-01994 W, 24-23 Alabama Steve Spurrier Fred Taylor 14-40-0 Danny Wuerffel 23-41-2 227-2 Reidel Anthony 8-105-11995 W, 34-3 Arkansas Steve Spurrier Terry Jackson 11-62-0 Danny Wuerffel 20-28-0 276-2 Ike Hilliard 7-125-11996 W, 45-30 Alabama Steve Spurrier Fred Taylor 13-83-0 Danny Wuerffel 20-35-2 401-6 Reidel Anthony 11-171-31999 L, 7-34 Alabama Steve Spurrier Earnest Graham 9-27-0 Jesse Palmer 7-20-3 80-0 Darrell Jackson 3-49-02000 W, 28-6 Auburn Steve Spurrier Earnest Graham 19-169-0 Rex Grossman 17-26-1 238-4 Reche Caldwell 3-91-22006 W, 38-28 Arkansas Urban Meyer Percy Harvin 6-105-1 Chris Leak 16-30-2 189-1 Cornelius Ingram 6-71-02008 W, 31-20 Alabama Urban Meyer Tim Tebow 17-57-0 Tim Tebow 14-22-0 216-3 Louis Murphy 4-86-02009 L, 13-32 Alabama Urban Meyer Tim Tebow 10-63-0 Tim Tebow 20-35-1 247-1 Aaron Hernandez 8-85-02015 L, 15-29 Alabama Jim McElwain Kelvin Taylor 7-8-0 Treon Harris 9-24-1 165-1 C.J. Worton 1-46-12016 L, 16-54 Alabama Jim McElwain Jordan Scarlett 11-17-0 Austin Appleby 26-39-3 261-2 DeAndre Goolsby 7-91-1
Opponents – vs. Alabama 4-5 (W-1993, 1994, 1996, 2009; L-1992, 1999, 2009, 2015, 2016); vs. Arkansas 2-0 (W-1995, 2006); vs. Auburn 1-0 (W-2000) MVPs (7) – Terry Dean, QB, 1993; Ellis Johnson, DT, 1994; Danny Wuerffel, QB, 1995, 1996; Rex Grossman, QB, 2000; Percy Harvin, WR, 2006; Tim Tebow, QB, 2008 Points – 45 vs. Alabama 1996 Pass Completions – 30, Shane Matthews vs. Alabama 1992 First Downs – 25 vs. Arkansas 1995 Pass Attempts – 49, Shane Matthews vs. Alabama 1992 Rush Yards – 202 vs. Arkansas 2006 Pass Ints – 3, Austin Appleby vs. Alabama, 2016; Jesse Palmer vs. Alabama 1999 Pass Yards – 401 vs. Alabama 1996 Pass Yards – 401, Danny Wuerffel vs. Alabama 1996 Total Yards – 470 vs. Alabama 1996 Pass TD – 6, Danny Wuerffel vs. Alabama 1996 Rush Attempts – 22, Errict Rhett vs. Alabama 1992, 1993 Receptions – 11, Reidel Anthony vs. Alabama 1996 Rush Yards – 169, Earnest Graham vs. Auburn 2000 Receiving Yards – 171, Reidel Anthony vs. Alabama 1996 Rush TD – 1, Done 8 times, last by Jeff Demps vs. Alabama 2008 Receiving TD – 3, Reidel Anthony vs. Alabama 1996 Georgia (3-3)Year Result Opponent UG Coach Rusher No-Yds-TD Passer C-A-I Yds-TD Receiver No-Yds-TD2002 W, 30-0 Arkansas Mark Richt Musa Smith 19-106-2 David Greene 17-29-0 237-1 Terrence Edwards 7-92-02003 L, 13-34 LSU Mark Richt Kregg Lumpkin 7-54-0 David Greene 17-41-3 199-1 Ben Watson 4-86-12005 W, 34-14 LSU Mark Richt Thomas Brown 14-62-0 D.J. Shockley 6-12-0 112-2 Sean Bailey 2-74-22011 L, 10-42 LSU Mark Richt Ken Malcome 5-37-0 Aaron Murray 16-40-2 163-1 Orson Charles 4-42-02012 L, 28-32 Alabama Mark Richt Todd Gurley 23-122-2 Aaron Murray 18-33-1 265-1 Tavarres King 5-142-02017 W, 28-7 Auburn Kirby Smart D’Andre Swift 7-88-1 Jake Fromm 16-22-0 183-2 Mercole Hardman 4-67-0
Opponents – vs. LSU 1-2 (W-2005, L-2005, 2011); vs. Arkansas 1-0 (W-2002); vs. Auburn 1-0 (W-2017); vs. Alabama 0-1 (L-2012) MVPs (3) – David Greene, QB, 2002; D.J. Shockley, QB, 2005; Roquan Smith, LB, 2017 Points – 34 vs. LSU 2005 Pass Completions – 18, Aaron Murray vs. Alabama 2012 First Downs – 25 vs. Arkansas 2002 Pass Attempts – 41, David Greene vs. LSU 2005 Rush Yards – 238 vs. Auburn 2017 Pass Interceptions – 3, David Greene vs. LSU 2005 Pass Yards – 281 vs. Alabama 2012 Pass Yards – 265, Aaron Murray vs. Alabama 2012 Total Yards – 421 vs. Auburn 2017 Pass TD – 2, Jake Fromm vs. Auburn 2017; D.J. Shockley vs. LSU 2005 Rush Attempts – 23, Todd Gurley vs. Alabama 2012 Receptions – 7, Terrence Edwards vs. Arkansas 2002 Rush Yards – 122, Todd Gurley vs. Alabama 2012 Receiving Yards – 142, Tavarres King vs. Alabama 2012 Rush TD – 2, Todd Gurley vs. Alabama 2012; Musa Smith vs. Arkansas 2002 Receiving TD – 2, Sean Bailey vs. LSU 2005 LSU (4-1)Year Result Opponent LSU Coach Rusher No-Yds-TD Passer C-A-I Yds-TD Receiver No-Yds-TD2001 W, 31-20 Tennessee Nick Saban Domanick Davis 16-78-1 Rohan Davey 9-20-0 84-0 Josh Reed 4-60-02003 W, 34-13 Georgia Nick Saban Justin Vincent 18-201-2 Matt Mauck 14-22-1 151-1 Michael Clayton 5-81-12005 L, 14-34 Georgia Les Miles Shyrone Carey 10-43-0 JaMarcus Russell 11-19-1 120-0 Dwayne Bowe 5-74-12007 W, 21-14 Tennessee Les Miles Jacob Hester 23-120-0 Ryan Perrilloux 20-30-1 243-1 Demetrius Byrd 4-72-12011 W, 42-10 Georgia Les Miles Alfred Blue 8-94-1 Jordan Jefferson 5-13-0 30-1 Rueben Randle 2-15-0
Opponents – vs. Tennessee 2-0 (W-2001, 2007); vs. Georgia 2-1 (W-2003, 2011; L-2005) MVPs (4) – Matt Mauck, QB, 2001; Justin Vincent, RB, 2003; Ryan Perrilloux, QB, 2007; Tyrann Mathieu, DB, 2011 Points – 42 vs. Georgia 2011 Pass Completions – 20, Ryan Perrilloux vs. Tennessee 2007 First Downs – 21 vs. Tennessee 2007 Pass Attempts – 30, Ryan Perrilloux vs. Tennessee 2007 Rush Yards – 293 vs. Georgia 2003 Pass Interceptions – 1, Done 4 times, last by Ryan Perrilloux vs. Tennessee 2007 Pass Yards – 252 vs. Tennessee 2007 Pass Yards – 151, Matt Mauck vs. Georgia 2003 Total Yards – 464 vs. Tennessee 2007 Pass TD – 1, Done 4 times, last by Jordan Jefferson vs. Georgia 2011 Rush Attempts – 23, Jacob Hester vs. Tennessee 2007 Receptions – 5, Done 3 times, last by Early Doucet vs. Tennessee 2007 Rush Yards – 201, Justin Vincent vs. Georgia 2003 Receiving Yards – 81, Michael Clayton vs. Georgia 2003 Rush TD – 2, Done 3 times, last by Kenny Hilliard vs. Georgia 2011 Receiving TD – 1, Done 4 times, last by Kenny Hilliard vs. Georgia 2011

17SEC Championship Game Record Book
Mississippi State (0-1)Year Result Opponent MSU Coach Rusher No-Yds-TD Passer C-A-I Yds-TD Receiver No-Yds-TD1998 L, 14-24 Tennessee Jackie Sherrill James Johnson 14-38-0 Wayne Madkin 10-22-2 84-0 Kevin Cooper 5-44-0
Opponents – vs. Tennessee 0-1 (L-1998) Points – 14 vs. Tennessee 1998 Pass Completions – 10, Wayne Madkin vs. Tennessee 1998 First Downs – 9 vs. Tennessee 1998 Pass Attempts – 22, Wayne Madkin vs. Tennessee 1998 Rush Yards – 65 vs. Tennessee 1998 Pass Interceptions – 2, Wayne Madkin vs. Tennessee 1998 Pass Yards – 84 vs. Tennessee 1998 Pass Yards – 84, Wayne Madkin vs. Tennessee 1998 Total Yards – 149 vs. Tennessee 1998 Pass TD – None Rush Attempts – 14, James Johnson vs. Tennessee 1998 Receptions – 5, Kevin Cooper vs. Tennessee 1998 Rush Yards – 38, James Johnson vs. Tennessee 1998 Receiving Yards – 44, Kevin Cooper vs. Tennessee 1998 Rush TD - None Receiving TD – None Missouri (0-2)Year Result Opponent MO Coach Rusher No-Yds-TD Passer C-A-I Yds-TD Receiver No-Yds-TD2013 L, 42-59 Auburn Gary Pinkel Henry Josey 9-123-0 James Franklin 21-37-1 303-3 Dorial Green-Beckham 6-144-22014 L, 13-42 Alabama Gary Pinkel Russell Hansbrough 13-21-0 Maty Mauk 16-34-0 272-1 Jimmie Hunt 6-169-0
Opponents – vs. Auburn 0-1 (L-2013); vs. Alabama 0-1 (L-2014) Points – 42 vs. Auburn 2013 Pass Completions – 21, James Franklin vs. Auburn 2013 First Downs – 22 vs. Auburn 2013 Pass Attempts – 37, James Franklin vs. Auburn 2013 Rush Yards – 231 vs. Auburn 2013 Pass Interceptions – 1, James Franklin vs. Auburn 2013 Pass Yards – 303 vs. Auburn 2013 Pass Yards – 303, James Franklin vs. Auburn 2013 Total Yards – 534 vs. Auburn 2013 Pass TD – 3, James Franklin vs. Auburn 2013 Rush Attempts – 15, James Franklin vs. Auburn 2013 Receptions – 6, Jimmie Hunt vs. Alabama 2014; Dorial Green-Beckham vs. Auburn 2013 Rush Yards – 123, Henry Josey vs. Missouri 2013 Receiving Yards – 169, Jimmie Hunt vs. Alabama 2014 Rush TD – 1, James Franklin vs. Auburn 2013 Receiving TD – 2, Dorial Green-Beckham vs. Auburn 2013 South Carolina (0-1)Year Result Opponent SC Coach Rusher No-Yds-TD Passer C-A-I Yds-TD Receiver No-Yds-TD2010 L, 17-56 Auburn Steve Spurrier Marcus Lattimore 16-84-0 Stephen Garcia 16-28-2 170-2 Alshon Jeffery 4-36-1
Opponents – vs. Auburn 0-1 (L-2010) Points – 17 vs. Auburn 2010 Pass Completions – 16, Stephen Garcia vs. Auburn 2010 First Downs – 20 vs. Auburn 2010 Pass Attempts – 28, Stephen Garcia vs. Auburn 2010 Rush Yards – 156 vs. Auburn 2010 Pass Interceptions – 2, Stephen Garcia vs. Auburn 2010 Pass Yards – 193 vs. Auburn 2010 Pass Yards – 170, Stephen Garcia vs. Auburn 2010 Total Yards – 349 vs. Auburn 2010 Pass TD – 2, Stephen Garcia vs. Auburn 2010 Rush Attempts – 16, Marcus Lattimore vs. Auburn 2010 Receptions – 4, Alshon Jeffery vs. Auburn 2010 Rush Yards – 84, Marcus Lattimore vs. Auburn 2010 Receiving Yards – 38, Patrick DiMarco vs. Auburn 2010 Rush TD - None Receiving TD – 1, Alshon Jeffery & Patrick DiMarco vs. Auburn 2010 Tennessee (2-3)Year Result Opponent UT Coach Rusher No-Yds-TD Passer C-A-I Yds-TD Receiver No-Yds-TD1997 W, 30-29 Auburn Phillip Fulmer Jamal Lewis 31-127-0 Peyton Manning 25-43-2 373-4 Peerless Price 8-161-21998 W, 24-14 Miss. State Phillip Fulmer Travis Henry 26-120-0 Tee Martin 15-32-1 208-2 Peerless Price 6-97-12001 L, 20-31 LSU Phillip Fulmer Travis Stephens 14-37-0 Casey Clausen 27-43-0 332-2 Kelley Washington 9-140-12004 L, 28-38 Auburn Phillip Fulmer Gerald Riggs 11-182-2 Rick Clausen 8-20-0 69-1 Tony Brown 3-28-02007 L, 14-21 LSU Phillip Fulmer Arian Foster 21-55-0 Erik Ainge 20-40-2 249-2 Josh Briscoe 8-79-1
Opponents – vs. Auburn 1-1 (W-1997, 2004); vs. Mississippi State 1-0 (W-1998); vs. LSU 0-2 (L-2001, 2007) MVPs (2) – Peyton Manning, QB, 1997; Peerless Price, WR, 1998 Points – 30 vs. Auburn 1997 Pass Completions – 27, Casey Clausen vs. LSU 2001 First Downs – 22 vs. Auburn 1997 Pass Atts – 43, Casey Clausen vs. LSU 2001; Peyton Manning vs. Auburn 1997 Rush Yards – 228 vs. Auburn 2004 Pass Interceptions – 2, Peyton Manning vs. Auburn 1997 Pass Yards – 373 vs. Auburn 1997 Pass Yards – 373, Peyton Manning vs. Auburn 1997 Total Yards – 502 vs. Auburn 1997 Pass TD – 4, Peyton Manning vs. Auburn 1997 Rush Attempts – 31, Jamal Lewis vs. Auburn 1997 Receptions – 9, Kelley Washington vs. LSU 2001; Marcus Nash vs. Auburn 1997 Rush Yards – 182, Gerald Riggs vs. Auburn 2004 Receiving Yards – 161, Peerless Price vs. Auburn 1997 Rush TD – 2, Gerald Riggs vs. Auburn 2004 Receiving TD – 2, Peerless Price vs. Auburn 1997

18 SEC Championship Game Record Book
COACHES RECORDS IN SEC CHAMPIONSHIP GAMENick Saban, Alabama/LSU 7-1 5-1 with Alabama (W-2016, 2015, 2014, 2012, 2009; L-2008) 2-0 with LSU (W-2003, 2001) Steve Spurrier, Florida/S. Carolina 5-3 5-2 with Florida (W-2000, 1996, 1995, 1994, 1993; L-1999, 1992) 0-1 with South Carolina (L-2010) Les Miles, LSU 2-1 W-2011, 2007 L-2005 Urban Meyer, Florida 2-1 W-2008, 2006 L-2009 Phillip Fulmer, Tennessee 2-3 W-1998, 1997 L-2007, 2004, 2001 Mark Richt, Georgia 2-3 W-2005, 2002 L-2012, 2011, 2003 Kirby Smart, Georgia 1-0 W-2017 Gene Chizik, Auburn 1-0 W-2010 Mike DuBose, Alabama 1-0 W-1999 Gus Malzahn, Auburn 1-1 W-2013 L-2017 Tommy Tuberville, Auburn 1-1 W-2004 L-2000 Gene Stallings, Alabama 1-3 W-1992 L-1996, 1994, 1993 Jackie Sherrill, Miss. State 0-1 L-1998 Terry Bowden, Auburn 0-1 L-1997 Danny Ford, Arkansas 0-1 L-1995 Jim McElwain, Florida 0-2 L-2016, 2015 Gary Pinkel, Missouri 0-2 L-2014, 2013 Houston Nutt, Arkansas 0-2 L-2006, 2002
COACHES WHO HAVE TAKEN MORE THAN ONE TEAM TO THE SEC CHAMPIONSHIPNick Saban LSU 2001, 2003; Alabama 2008, 2009, 2012, 2014, 2015, 2016Steve Spurrier Florida 1992-96, 1999-2000; S. Carolina 2010
COACHES WHO LED TEAM TO CHAMPIONSHIP IN FIRST SEASON WITH SCHOOLJim McElwain, Florida in 2015 lost to Alabama, 29-15Gus Malzahn, Auburn in 2013 defeated Missouri, 59-42Les Miles, LSU in 2005 lost to Georgia, 34-14
COACH WHO LED TEAM TO CHAMPIONSHIP IN FIRST TWO SEASONS WITH SCHOOLJim McElwain, Florida in 2015-16 lost to Alabama, 29-15 in 2015; lost to Alabama, 54-16 in 2016
WINNING COACHES AGES LAST TITLE FIRST TITLEName Team Game Yrs. Months Days Game Yrs. Months DaysNick Saban Alabama 2016 65 1 6 2001 50 1 9Les Miles LSU 2011 58 0 24 2007 54 0 22Gene Stallings Alabama 1992 57 9 4 Steve Suprrier Florida 2000 55 7 13 1993 48 7 15Tommy Tuberville Auburn 2004 50 2 17Gene Chizik Auburn 2010 48 11 7Phillip Fulmer Tennessee 1998 48 3 5 1997 47 3 6Gus Malzahn Auburn 2013 48 1 10Mike DuBose Alabama 1999 46 11 0Mark Richt Georgia 2005 45 9 14 2002 42 9 19Urban Meyer Florida 2008 44 4 27 2006 42 4 23Kirby Smart Georgia 2017 2017 41 11 9

SEC Championship Game Record Book 19
HIGHEST CHAMPIONSHIP GAME PASSER RATINGS (MINIMUM: 20 ATTEMPTS)Player, Year Att. Cmp. Pct. Yards Avg./Att TD Int. RatingCam Newton, Auburn, 2010 28 17 .607 335 11.96 4 0 208.36Danny Wuerffel, Florida, 1996 35 20 .571 401 11.46 6 2 198.53Blake Sims, Alabama, 2014 27 23 .852 262 9.70 2 0 191.14Tim Tebow, Florida, 2008 22 14 .636 216 9.82 3 0 191.11Jason Campbell, Auburn, 2004 35 27 .771 374 10.69 3 1 189.47Rex Grossman, Florida, 2000 26 17 .654 238 9.15 4 1 185.35Danny Wueffel, Florida, 1995 28 20 .714 276 9.86 2 0 177.80Jake Fromm, Georgia, 2017 22 16 .727 183 8.32 2 0 172.60Jake Coker, Alabama, 2015 26 18 .692 204 7.85 2 0 160.52Peyton Manning, Tennessee, 1997 43 25 .581 373 8.67 4 2 152.40James Franklin, Missouri, 2013 37 21 .568 303 8.19 3 1 146.90Casey Clausen, Tennessee, 2001 43 27 .628 332 7.72 2 0 143.00Ryan Perrilloux, LSU, 2007 30 20 .600 243 8.10 1 1 139.04David Greene, Georgia, 2002 29 17 .586 237 8.17 1 0 138.65AJ McCarron, Alabama, 2012 21 13 .619 162 7.71 1 1 132.90Jalen Hurts, Alabama, 2016 20 11 .550 138 6.90 1 0 129.46Matt Mauck, LSU, 2003 22 14 .636 151 6.86 1 1 127.20Aaron Murray, Georgia, 2012 33 18 .545 265 8.03 1 1 125.94Dameyune Craig, Auburn, 1997 34 14 .412 262 7.71 2 0 125.32Austin Appleby, Florida, 2016 39 26 .667 261 6.69 2 3 124.42Maty Mauck, Missouri, 2014 34 16 .471 272 7.12 1 0 123.96Tim Tebow, Florida, 2009 35 20 .571 247 7.06 1 1 120.14Terry Dean, Florida, 1993 37 20 .540 256 6.92 2 2 119.20Shane Matthews, Florida, 1992 49 30 .612 287 5.86 2 2 117.77Stephen Garcia, S. Carolina, 2010 28 16 .571 170 6.07 2 2 117.43Tee Martin, Tennessee, 1998 32 15 .469 208 6.50 2 1 115.85Freddie Kitchens, Alabama, 1996 45 19 .422 264 5.87 3 1 109.06Danny Wuerffel, Florida, 1994 41 23 .561 227 5.54 2 2 108.95Erik Ainge, Tennessee, 2007 40 20 .500 249 6.23 2 2 108.79 Chris Leak, Florida, 2006 30 16 .533 189 6.30 1 2 103.92John Parker Wilson, Alabama, 2008 25 12 .440 187 7.48 0 1 102.83Barry Lunney, Arkansas, 1995 27 17 .630 170 6.30 0 2 101.04Treon Harris, Florida, 2015 24 9 .375 165 6.88 1 1 100.67Casey Dick, Arkansas, 2006 22 10 .455 148 6.73 1 2 98.78Jarrett Stidham, Auburn, 2017 32 16 .500 145 4.53 1 0 98.38Ben Laird, Auburn, 2000 30 17 .567 158 5.27 0 1 94.24Rick Clausen, Tennessee, 2004 20 8 .400 69 3.45 1 0 85.48Rohan Davey, LSU, 2001 20 9 .450 84 4.20 0 0 80.28David Greene, Georgia, 2003 41 17 .415 199 4.85 1 3 75.65Aaron Murray, Georgia, 2011 40 16 .400 163 4.08 1 2 72.48Wayne Madkin, Miss. State, 1998 22 10 .455 84 3.82 0 2 59.35Jesse Palmer, Florida, 1999 20 7 .350 80 4.00 0 3 38.60
SEC CHAMPIONSHIP GAME STARTING QUARTERBACKS QB RECORDS IN SEC CHAMPIONSHIP GAME 1992 Jay Barker, Alabama Shane Matthews, Florida (Minimum two games)1993 Terry Dean, Florida Brian Burgdorf, Alabama Danny Wuerffel, Florida 3-01994 Danny Wuerffel, Florida Jay Barker, Alabama Tim Tebow, Florida 1-11995 Danny Wuerffel, Florida Barry Lunney, Arkansas Jay Barker, Alabama 1-11996 Danny Wuerffel, Florida Freddie Kitchens, Alabama David Greene, Georgia 1-11997 Peyton Manning, Tennessee Dameyune Craig, Auburn Aaron Murray, Georgia 0-21998 Tee Martin, Tennessee Wayne Madkin, Miss. State 1999 Andrew Zow, Alabama Jesse Palmer, Florida 2000 Rex Grossman, Florida Ben Leard, Auburn2001 Rohan Davey, LSU Casey Clausen, Tennessee 2002 David Greene, Georgia Matt Jones, Arkansas 2003 Matt Mauck, LSU David Greene, Georgia 2004 Jason Campbell, Auburn Rick Clausen, Tennessee2005 D.J. Shockley, Georgia JaMarcus Russell, LSU2006 Chris Leak, Florida Casey Dick, Arkansas 2007 Ryan Perrilloux, LSU Erik Ainge, Tennessee2008 Tim Tebow, Florida John Parker Wilson, Alabama 2009 Greg McElroy, Alabama Tim Tebow, Florida2010 Cam Newton, Auburn Stephen Garcia, South Carolina2011 Jordan Jefferson, LSU Aaron Murray, Georgia 2012 A.J. McCarron, Alabama Aaron Murray, Georgia2013 Nick Marshall, Auburn James Franklin, Missouri2014 Blake Sims, Alabama Maty Mauk, Missouri2015 Jake Coker, Alabama Treon Harris, Florida2016 Jalen Hurts, Alabama Autin Appleby, Florida2017 Jake Fromm, Georgia Jarrett Stidham, Auburn

SEC Championship Game Record Book20
MISCELLANEOUS GAME NOTESTEAMS THAT WIN RUSHING YARDAGE ARE: 22-4 Won 13 in a row 2005-17 Lost in 2004,1995,1994,1993
TEAMS THAT WIN PASSING YARDAGE ARE: 16-10
TEAMS THAT WIN TURNOVERS ARE: 15-6 Even: 5 times
SEC CHAMPIONSHIP GAMES WITH NO INTERCEPTIONS: 2014, 2002, 2001
SEC CHAMPIONSHIP GAMES WITH NO TURNOVERS: 2002
NON-QB TOUCHDOWN PASSESFelix Jones 29 pass from Cedric Washington, Arkansas 2006 (4th quarter)Felix Jones 2 pass from Darren McFadden, Arkansas 2006 (3rd quarter)Erron Kinney 3 pass from Earnest Graham, Florida 1999 (1st quarter)
QUARTERBACKS TO CATCH A PASSTerry Dean, Florida, 15 pass from WR Chris Doering vs. Alabama 1993Brian Burgdorf, Alabama, 20 pass from FL David Palmer vs. Florida 1993
MOST RUSHING TOUCHDOWNS BY QUARTERBACK2 Cam Newton, Auburn, 20102 Matt Mauck, LSU, 2001
QUARTERBACKS THAT LED TEAM IN RUSHINGCam Newton, Auburn 2010 14-73-2Tim Tebow, Florida 2009 10-63-0Tim Tebow, Florida 2008 17-57-0
TEAMS WITH MULTIPLE 100-YARD RUSHERSAuburn 2013 (Tre Mason 304, Nick Marshall 101)Alabama 2012 (Eddie Lacy 181, T.J. Yeldon 153)
TEAMS WITH MULTIPLE 100-YARD RECEIVERSTennessee 1997 (Peerless Price 161, Marcus Nash 126)Florida 1996 (Reidel Anthony 171, Jacquez Green 106)
TEAMS WITH 100-YARD RUSHERS, 100-YARD RECEIVERSAlabama 2015 (RB Derrick Henry 189, WR Calvin Ridley 102)Alabama 2014 (RB Derrick Henry 141, WR DeAndrew White 101)Missouri 2013 (RB Henry Josey 123, WR Dorial Green-Beckham 144)Alabama 2012 (RB Eddie Lacy 181, RB T.J. Yeldon 153, WR Amari Cooper 127)Georgia 2012 (RB Todd Gurley 122, WR Tavarres King 142)Alabama 2008 (RB Glen Coffee 112, WR Julio Jones 124)Auburn 2004 (RB Carnell Williams 100, WR Courtney Taylor 111)Tennessee 1997 (RB Jamal Lewis 127, WR Peerless Price 161, WR Marcus Nash 126)Alabama 1992 (RB Derrick Lassic 117, FL David Palmer 101) TEAMS WITH 300-YARD PASSER, 100-YARD RUSHER, 100-YARD RECEIVERMissouri 2013 (QB James Franklin 303, RB Henry Josey 123, WR Dorial Green-Beckham 144)Auburn 2004 (QB Jason Campbell 374, RB Carnell Williams 100, WR Courtney Taylor 111)Tennessee 1997 (QB Peyton Manning 373, RB Jamal Lewis 127, WR Peerless Price 161, WR Marcus Nash 126)
PLAYERS TO RUSH, RECEIVE, RETURN PUNT AND KICKOFF IN A GAMEBrandon James, Florida 2009 Rush-9, Receive 9, PR-12, KR-78Carnell Williams, Auburn 2004 Rush-100, Receive-11, PR-4, KR-42DeCori Birmingham, Arkansas 2002 Rush-(-4), Receive-12, PR-10, KR-66*David Palmer, Alabama 1993 Rush-93, Receive-22, PR-32, KR-50*Palmer is the only player in SEC Championship game history to pass, rush, catch, return a punt and kickoff.
PLAYERS WITH RUSHING & RECEIVING TOUCHDOWNSKenny Hilliard, LSU vs. Georgia 2011 (2 rush, 1 receiving)Percy Harvin, Florida vs. Arkansas 2006 (1 rush, 1 receiving)Dennis Riddle, Alabama vs. Florida 1996 (1 rush, 1 receiving)Errict Rhett, Florida vs. Alabama 1992 (1 rush, 1 receiving)
PLAYERS TO RETURN PUNT, KICKOFF AND INTERCEPT A PASSJavier Arenas, Alabama 2009 PR-1-8, KR-3-79, INT-1-0Lito Sheppard, Florida 2000 PR-2-30, KR-1-27, INT-2-31
LAST PLAYER TO LEAD TEAM IN RUSHING AND RECEIVING YARDSHeath Evans, Auburn vs. Florida, 2000 (69 rushing, 45 receiving)
MOST CATCHES & RECEIVING YARDS BY A RUNNING BACK10 Errict Rhett, Florida vs. Alabama, 1992 (82 yards)
MOST CATCHES BY A TIGHT END8 Aaron Hernandez, Florida vs. Alabama, 2009 (85 yards)
MOST RECEIVING YARDS BY A TIGHT END91 DeAndre Goolsby, Florida vs. Alabama, 2016 (7 receptions)
MOST PLAYERS TO RUSH IN A GAME9 Florida vs. Alabama, 2016
MOST PLAYERS TO ATTEMPT A PASS IN A GAME4 Florida vs. Alabama, 1999
MOST PLAYERS TO CATCH A PASS IN A GAME10 Auburn vs. Florida, 2000
LONGEST GAME TIME3:56 Georgia vs. LSU, 2011
SHORTEST GAME TIME3:05 Florida vs. Arkansas 1995
COMEBACKS IN SEC CHAMPIONSHIP GAME HISTORY(Most Points Overcome To Win Game)13 Tennessee trailed Auburn 20-7 at 14:12 in second in 1997, won 30-2911 Alabama trailed Georgia 21-10 at 6:31 in third in 2012; won 32-2810 LSU trailed Tennessee 17-7 at 3:52 in second in 2001; won 31-20
TEAMS THAT TRAILED AT HALF AND WON2011 LSU trailed Georgia 10-7 at half and won 42-102007 LSU trailed Tennessee 7-6 at half and won 21-142001 LSU trailed Tennessee 17-10 at half and won 31-201997 Tennessee trailed Auburn 20-10 at half and won 30-29
FOURTH QUARTER COMEBACKS2012 Alabama trailed Georgia 28-25 at 12:54 and won 32-281998 Tennessee trailed Miss. State 14-10 at 8:43 and won 24-141997 Tennessee trailed Auburn 29-23 at 15:00 and won 30-291994 Florida trailed Alabama 23-17 at 8:56 and won 24-23
LARGEST LEAD39 Auburn 56, S. Carolina 17 at 2:22 in fourth in 201038 Alabama 54, Florida 16, at 3:48 in fourth in 201632 LSU 42, Georgia 10 at 4:21 in fourth in 201131 Florida 34, Arkansas 3 at 12:48 in fourth in 1995
MOST UNANSWERED POINTS42 LSU 42, Georgia 10 2011 (LSU trailed 10-0 at 0:42 in first)34 Alabama 34, Florida 7 1999 (Alabama trailed 7-0 at 13:20 in first)34 Florida 34, Arkansas 3 1995 (Florida trailed 3-0 at 7:26 in first)28 Georgia 28, Auburn 7 2017 (Georgia trailed 7-0 at 9:54 in first)
FASTEST SCORE TO START A GAME13:24 Cole Bennett 0 fumble recovery, Auburn 2004 (Carnell Williams fumbled at the 1 and Bennett recovered in end zone)13:20 Onterio McCalebb 12 pass from Cam Newton, Auburn 201013:20 Erron Kinney 3 pass from Earnest Graham, Florida 1999
LATEST SCORE TO START A GAME13:59 (2nd) Jay Rome 19 pass from Aaron Murray, Georgia 2012

SEC Championship Game Record Book 21
LAST TIME A FIELD GOAL BLOCKED2017 Georgia’s DaQuan Hawkins-Muckle blocked Auburn’s Daniel Carlson’s 31-yard attempt at 8:13 in the third quarter. Georgia’s Dominick Sanders recovered and returned 12 yards.
LAST TIME A PUNT BLOCKED2016 Alabama’s Derrick Gore blocked Florida’s Johnny Townsend punt at 1:42 in the first quarter. Josh Jacobs returned it 27 yards for a touchdown.
LAST TIME AN EXTRA POINT BLOCKED2016 Florida’s Jabari Zuniga blocked Alabama’s Adam Griffith’s PAT at 1:42 in the first quarter. It was returned by David Reese for defensive PAT.
LAST TIME A TEAM HAD TWO RBS EACH SCORE TWO TDS IN A GAME2014 Alabama’s Derrick Henry and T.J. Yeldon each recorded two rushing TDs against Missouri.
LONGEST SCORING DRIVE (PLAYS)17 (Yards: 88; Time of Drive: 8:47; Quarter: 4; Time of Game: 13:49) Scoring Play: Mark Ingram 1 run (Greg McElroy pass fail) - Alabama 2009
LONGEST SCORING DRIVE (YARDS)98 (Plays: 8; Time of Drive: 3:16; Quarter: 3; Time of Game: 3:32) Scoring play: Bo Scarbrough 2 run (Adam Griffith kick) - Alabama 2016
LONGEST SCORING DRIVE (TIME)8:47 (Plays: 17; Yards: 88; Time of Drive: 8:47; Quarter: 4; Time of Game: 13:49) Scoring Play: Mark Ingram 1 run (Greg McElroy pass fail) - Alabama 2009
LONG NON-SCORING DRIVE (PLAYS)14 (Yards: 70; Time of Drive: 3:50; Quarter: 4; Time of Game: 0:31) Result: Downs – Georgia 2011
LONG NON-SCORING DRIVE (YARDS)77 (Plays: 8; Time of Drive: 4:35; Quarter: 2; Time of Game: 6:41) Result: Interception – Alabama 201277 (Plays: 13; Time of Drive: 4:22; Quarter: 2; Time of Game: 0:06) Result: Missed Field Goal – LSU 200777 (Plays: 13; Time of Drive: 6:36; Quarter: 2; Time of Game: 11:06) Result: Fumble – Auburn 2000
LONGEST NON-SCORING DRIVE (TIME)7:28 (Plays: 12; Yards: 71; Quarter: 4: Time of Game: 0:00) Result: End of Half – Alabama 2009
RE-KICKIn 2015 at 8:04 in the third quarter, Alabama had to re-kickoff after the ball hit the TV cable over the field.
TEAMS THAT WON CHAMPIONSHIP IN FIRST APPEARANCEAlabama in 1992 (defeated Florida, 28-21) Tennessee in 1997 (def. Auburn, 30-29)LSU in 2001 (defeated Tennessee, 31-20) Georgia in 2002 (def. Arkansas, 30-3)
SEC CHAMPIONSHIP REMATCHESThe SEC Championship game has featured a rematch of a regular season game a total of seven times. The team that won the regular season game is 5-2 in the rematches. Regular Season Championship Game1999 #21 Alabama 40, at #3 Florida 39 OT #7 Alabama 34, #5 Florida 72000 at #10 Florida 38, #19 Auburn 7 #7 Florida 28, #18 Auburn 62001 at #7 Tennessee 26, #14 LSU 18 #21 LSU 31, #2 Tennessee 202003 at #11 LSU 17, #7 Georgia 10 #3 LSU 34, #5 Georgia 132004 #8 Auburn 34, at #10 Tennessee 10 #3 Auburn 38, #15 Tennessee 282010 at #17 Auburn 35, #12 S. Carolina 27 #1 Auburn 56, #19 South Carolina 172017 at #10 Auburn 40, #2 Georgia 17 #6 Georgia 28, #4 Auburn 7
Seven teams have lost in the championship game and returned to the title game the next season.Florida lost in 1992 Won in 1993Alabama lost in 1993 Lost in 1994Florida lost in 1999 Won in 2000Alabama lost in 2008 Won in 2009Georgia lost in 2011 Lost in 2012Missouri lost in 2013 Lost in 2014Florida lost in 2015 Lost in 2016
Alabama in 2015 became the first winner of the SEC Championship game to be outscored in the fourth quarter, by 8-7 count. Only one winner of the SEC title game failed to score in the final period – Florida 2000.
Fourteen of the 26 SEC Championship games have been won by the designated home team.
GAMES DECIDED BY 7 POINTS OR LESS:1992 Alabama 28, Florida 211994 Florida 24, Alabama 231997 Tennessee 30, Auburn 292007 LSU 21, Tennessee 142012 Alabama 32, Georgia 28
TOP 10 MATCHUPS (AP Rankings)1994 #6 Florida def. #3 Alabama, 24-231999 #7 Alabama def. #5 Florida, 34-72003 #3 LSU def. #5 Georgia, 34-132006 #4 Florida def. #8 Arkansas, 38-282008 #2 Florida def. #1 Alabama, 31-202009 #2 Alabama def. #1 Florida, 32-132012 #2 Alabama def. #3 Georgia, 32-282013 #3 Auburn def. #5 Missouri, 59-422017 #6 Georgia def. #4 Auburn, 28-7Higher ranked team is 4-5.
SEC MEDIA DAYS VOTINGHere is a look at how the media voted at SEC Football Media Days dating back to 1992 and how the projected champions actually fared: How Projected Projected Champion EventualYear Champion Fared Champion1992 Florida lost in SEC Champ. Game Alabama1993 Alabama lost in SEC Champ. Game Florida1994 Florida Won SEC Championship Game1995 Florida Won SEC Championship Game1996 Tennessee 2nd in East Florida1997 Florida T2nd in East Tennessee1998 Florida 2nd in East Tennessee1999 Tennessee 2nd in East Alabama2000 Alabama T5th in West Florida2001 Florida 2nd in East LSU2002 Tennessee 3rd in East Georgia2003 Auburn 3rd in West LSU2004 Georgia 2nd in East Auburn2005 Tennessee T4th in East Georgia2006 Auburn T2nd in West Florida2007 LSU Won SEC Championship Game2008 Florida Won SEC Championship Game2009 Florida lost in SEC Champ. Game Alabama2010 Alabama T3rd in West Auburn2011 Alabama 2nd in West LSU2012 LSU T2nd in West Alabama2013 Alabama T1st in West Auburn2014 Alabama Won SEC Championship Game2015 Auburn 7th in West Alabama2016 Alabama Won SEC Championship Game2017 Alabama T1st in West Georgia2018 Alabama

SEC Championship Game Record Book22
SINGLE PLAY SCORING DRIVES(Sorted by longest to shortest)Yards TOP Qtr Time Year Scoring play87 0:19 1 4:49 2003 Justin Vincent, LSU, 87 run (Chris Jackson kick fail) 80 0:13 3 6:05 2004 Gerald Riggs, Tennessee, 80 run (James Wilhoit kick) 67 0:30 4 14:22 2006 Percy Harvin, Florida, 67 run (Chris Hetland kick) 58 0:10 2 11:48 2014 DeAndrew White, Alabama, 58 pass from Blake Sims (Adam Griffith kick) 45 0:09 1 10:19 2005 Sean Bailey, Georgia, 45 pass from D.J. Shockley (Brandon Coutu kick) 26 0:08 4 5:47 1998 Cedrick Wilson, Tennessee, 26 pass from Tee Martin (Jeff Hall kick) 19 0:13 3 6:14 1997 Fred Beasley, Auburn, 24 pass from Dameyune Craig (Jaret Holmes kick) 13 0:05 4 4:22 2013 Tre Mason, Auburn, 13 run (Cody Parkey kick) 9 0:29 2 8:54 2006 Chris Leak, Florida, 9 run (Chris Hetland kick) 9 0:02 1 11:58 2002 Musa Smith, Georgia, 2 run (Billy Bennett kick) 5 0:05 3 9:12 1996 Dennis Riddle, Alabama, 5 run (Jon Brock kick)
NON-OFFENSIVE SCORES (26)(Includes interception return, punt return, fumble return, PAT return, safety)Quarter Time Year Scoring Play4 3:16 1992 Antonio Langham, Alabama, 27 interception return (Michael Proctor kick) 4 8:56 1994 Dwayne Rudd, Alabama, 23 interception return (Michael Proctor kick) 3 4:25 1995 Ben Hanks, Florida, 95 fumble return (Bart Edmiston kick) 4 4:32 1996 Alabama Team Safety 1 5:36 1997 Brad Ware, Auburn, 24 fumble return (Jaret Holmes kick) 3 1:06 1997 Quinton Reese, Auburn, PAT return 1 0:05 1998 Robert Bean, Mississippi State, 70 interception return (Brian Hazelwood kick) 4 8:43 1998 Kevin Prentiss, Mississippi State, 83 punt return (Brian Hazelwood kick) 4 11:36 1999 Reggie Grimes, Alabama, 38 interception return (Ryan Pflugner kick fail) 1 3:11 2003 LSU Team safety 3 4:17 2003 Lionel Turner, LSU, 18 interception return (Ryan Gaudet kick) 1 13:24 2004 Cole Bennett, Auburn, 0 fumble recovery (John Vaughn kick) 4 14:18 2005 Tim Jennings, Georgia, 15 interception return (Brandon Coutu kick) 3 8:33 2006 Antwain Robinson, Arkansas, 40 interception return (Jeremy Davis kick)3 3:47 2006 Wondy Pierre-Louis, Florida, 0 fumble recovery (Chris Hetland kick) 4 9:54 2007 Jonathan Zenon, LSU, 18 interception return (Ryan Perrilloux run) 3 7:23 2010 T’Sharvan Bell, Auburn, 10 interception return (Wes Byrum kick) 2 5:48 2011 Tyrann Mathieu, LSU, 62 punt return (Drew Alleman kick) 4 4:21 2011 Morris Claiborne, LSU, 45 interception return (Drew Alleman kick) 3 6:31 2012 Alec Ogletree, Georgia, 55 blocked field goal (Marshall Morgan kick) 2 13:11 2013 E.J. Gaines, Missouri, 11 fumble return (Andrew Baggett kick) 1 9:05 2015 Alabama Team safety following a blocked punt 2 11:53 2015 Antonio Callaway, Florida, 85 punt return (Neil MacInnes kick) 1 5:06 2016 Minkah Fitzpatrick, Alabama, 44 interception return (Adam Griffith kick)1 1:42 2016 Josh Jacobs, Alabama, 27 blocked punt (Adam Griffith kick blocked)1 1:42 2016 David Reese, Florida, PAT return
TWO-POINT CONVERSION ATTEMPTSMade 7-of-10 attempts. Rush 4-of-5. Pass 3-of-5.Year Team Play Result Qtr Time Score after attempt1996 Florida Danny Wuerffel pass to Reidel Anthony good 2nd 14:37 Florida 14, Alabama 71999 Alabama Andrew Zow pass to Sam Collins fail 2nd 0:30 Alabama 12, Florida 71999 Alabama Team rush (PAT fumbled) fail 4th 3:58 Alabama 34, Florida 72001 LSU Matt Mauck pass to Josh Reed good 4th 14:20 LSU 24, Tennessee 172007 LSU Ryan Perrilloux rush good 4th 9:54 LSU 21, Tennessee 142009 Alabama Greg McElroy pass fail 4th 13:49 Alabama 32, Florida 132012 Alabama T.J. Yeldon rush good 3rd 4:19 Georgia 21, Alabama 182013 Missouri James Franklin rush good 3rd 0:09 Auburn 45, Missouri 422015 Florida Treon Harris rush good 4th 5:02 Alabama 29, Florida 152017 Georgia Jake Fromm pass to Terry Godwin good 4th 13:06 Georgia 21, Auburn 7

SEC Championship Game Record Book 23
Teams that score first (13-13)2017 L2016 L2015 W2014 W2013 L2012 L2011 L2010 W2009 W2008 W2007 L2006 W2005 W2004 W2003 W2002 W2001 W2000 W1999 L1998 L1997 W1996 L1995 L1994 L1993 L1992 L
Teams that lead after first quarter (14-8)2017 L2016 W2015 W2014 W2013 W2012 T2011 L2010 W2009 W2008 L2007 L2006 W2005 W2004 W2003 W2002 W2001 W2000 W1999 L1998 L1997 L1996 L1995 W1994 T1993 T1992 T
Teams that lead at half (22-4)2017 W2016 W2015 W2014 W2013 W2012 W2011 L2010 W2009 W2008 W2007 L2006 W2005 W2004 W2003 W2002 W2001 L2000 W1999 W1998 W1997 L1996 W1995 W1994 W1993 W1992 W
Teams that lead after 3 quarters (20-6)2017 W2016 W2015 W2014 W2013 W2012 L2011 W2010 W2009 W2008 L2007 L2006 W2005 W2004 W2003 W2002 W2001 L2000 W1999 W1998 W1997 L1996 W1995 W1994 L1993 W1992 W
BLOCKED KICKSFIELD GOALS (4)2017 Georgia’s DaQuan Hawkins-Muckle blocked Auburn’s Daniel Carlson’s 31-yard attempt at 8:13 in the third quarter. Georgia’s Dominick Sanders recovered and returned 12 yards.2015 Alabama’s D.J. Pettway blocked Florida’s Austin Hardin’s 40-yard attempt at 4:33 in the first quarter. Alabama’s Cyrus Jones recovered and returned 5 yards.2012 Georgia’s Cornelius Washington blocked Alabama’s Cade Foster’s 49-yard attempt at 6:31 in the third quarter. Georgia’s Alex Ogletree recovered and returned 55 yards for a touchdown giving the Bulldogs a 21-10 lead.2003 Georgia’s Sean Jones blocked LSU’s Chris Jackson’s 48-yard attempt at 9:34 In the first quarter. Georgia’s Tony Taylor recovered and returned 38 yards to the LSU 31.
PUNTS (6)2016 Alabama’s Derrick Gore blocked Florida’s Johnny Townsend’s punt at 1:42 in the first quarter. UA’s Josh Jacobs returned the ball 27 yards for the score.2015 Alabama’s Keith Holcombe blocked Florida’s Johnny Townsend’s punt at 9:05 in the first quarter. The ball went out of the back of the endzone for a safety.2006 Florida’s Jarred Fayson blocked Arkansas’ Jacob Skinner’s punt at 9:23 in the second quarter. Tremaine McCollum recovered at the Arkansas 9.2005 Georgia’s Bryan McClendon blocked LSU’s Chris Jackson punt at 9:44 in the second quarter. Jackson recovered and was tackled by Kelin Johnson for a 2-yard loss at the LSU 15.2002 Georgia’s Decory Bryant blocked Arkansas’ Richie Butler’s punt at 12:00 in the first quarter. Georgia’s Thomas Davis recovered and returns 7 yards to the Arkansas 2.1994 Florida’s Sam McCorkle blocked Alabama’s Bryne Diehl’s punt at 4:18 in the second quarter. Ball was spotted at Alabama 43.
PATS (3)2003 Georgia’s Kedric Golston blocked LSU’s Chris Jackson’s PAT at 14:51 in the second quarter.1997 Auburn’s Charles Dorsey blocked Tennessee’s Jeff Hall’s PAT at 1:06 in third quarter. Auburn’s Quinton Reese returned the block for a defensive PAT (two points) to make the score Auburn 29-23.1996 Alabama’s Fernando Bryant blocked Florida’s Collins Cooper’s PAT at 3:11 in the first quarter to make the score Alabama 7, Florida 6. SAFETIES2015 Alabama recorded a safety at 9:05 in the first quarter when Alabama’s Keith Holcombe blocked Florida’s Johnny Townsend punt at 9:05 in the first quarter. The ball went out of the back of the endzone for a safety.2003 LSU recorded a safety at 3:11 in the first quarter when Georgia punter Gordon Ely-Kelso was tackled in the end zone by Alley Broussard and Daniel Francis following a bad snap.1996 Florida’s Danny Wuerffel took a safety with a 1-yard loss with 4:32 left in the fourth quarter.

SEC Championship Game Record Book24
1st
Rush
Pass
TotalO
ff.Ga
me
Sc
ore
Down
s At
t-Yds
-TD
C-A-
I Yd
s TD
Pl
ays-
Yds
Fum
-Los
t Pe
n-Yd
s Pt
-Yds
-Avg
PR-
Yds-
TD K
R-Yd
s-TD
Int-Y
ds-T
D Ti
me
3rd
conv
4t
h co
nv
Sack
-Yds
FG
2017
Geo
rgia
28
20
41
-238
-1
16-2
2-0
183
2 63
-421
1-
0 7-
91
4-17
6-44
.0
1-3-
0 0-
0-0
0-0-
0 33
:02
2-11
1-
2 3-
24
2-2
2017
Aub
urn
7 18
31
-114
-0
16-3
2-0
145
1 63
-259
2-
2 5-
39
6-24
4-40
.7
2-14
-0
1-20
-0
0-0-
0 26
:58
4-13
0-
1 2-
13
0-1
2016
Ala
bam
a 54
18
38
-234
-4
11-2
0-0
138
1 58
-372
1-
0 2-
14
2-81
-40.
5 4-
117-
1 0-
0-0
3-84
-1
24:5
2 5-
10
0-0
4-36
2-
220
16 F
lorid
a 16
16
30
-0-0
26
-39-
3 26
1 2
69-2
61
1-0
7-53
5-
218-
43.6
0-
0-0
6-14
5-0
0-0-
0 35
:08
7-16
0-
2 2-
11
0-0
2015
Flo
rida
15
7 21
-15-
0 9-
24-1
16
5 1
45-1
80
1-0
5-51
9-
414-
46.0
3-
84-1
2-
44-0
0-
0-0
16:3
1 0-
11
0-1
2-17
0-
020
15 A
laba
ma
29
25
58-2
33-1
18
-26-
0 20
4 2
84-4
37
2-1
5-35
6-
307-
51.2
8-
45-0
2-
46-0
1-
(-1)-0
43
:29
7-17
1-
1 5-
36
2-3
2014
Ala
bam
a 42
28
49
-242
-4
23-2
7-0
262
2 76
-504
3-
0 2-
10
3-13
0-43
.3
1-1-
0 3-
85-0
0-
0-0
36:4
3 9-
13
0-0
0-0
0-1
2014
Miss
ouri
13
10
23-4
1-0
16-3
4-0
272
1 57
-313
2-
1 6-
60
7-30
4-43
.4
0-0-
0 4-
89-0
0-
0-0
23:1
7 6-
16
1-1
2-2
2-2
2013
Miss
ouri
42
22
34-2
31-1
21
-37-
1 30
3 3
71-5
34
1-0
7-40
5-
225-
45.0
0-
0-0
1-14
-0
0-0-
0 25
:40
2-12
1-
3 1-
6 2-
220
13 A
ubur
n 59
30
74
-545
-7
9-11
-0
132
1 85
-677
3-
2 10
-63
3-12
0-40
.0
2-26
-0
2-28
-0
1-0-
0 34
:20
7-14
1-
1 3-
14
1-2
2012
Geo
rgia
28
18
29
-113
-2
19-3
4-1
281
1 63
-394
0-
0 7-
64
6-26
9-44
.8
1-7-
0 0-
0-0
1-0-
0 22
:25
4-12
1-
1 3-
17
0-1
2012
Ala
bam
a 32
26
51
-350
-3
13-2
1-1
162
1 72
-512
3-
1 2-
15
5-20
9-41
.8
1-8-
0 4-
89-0
1-
35-0
37
:35
4-12
0-
0 3-
15
1-2
2011
LSU
42
13
35-2
07-3
5-
13-0
30
1
48-2
37
0-0
8-54
8-
403-
50.4
6-
127-
1 2-
30-0
2-
45-1
23
:24
1-9
0-0
4-32
0-
020
11 G
eorg
ia
10
19
34-7
8-0
20-5
1-2
218
1 85
-296
4-
1 9-
87
8-41
3-51
.6
4-0-
0 5-
91-0
0-
0-0
36:3
6 7-
21
1-2
2-23
1-
2
2010
S. C
arol
ina
17
20
30-1
56-0
20
-33-
2 19
3 2
63-3
49
0-0
4-31
3-
150-
50.0
0-
0-0
7-13
9-0
0-0-
0 28
:59
5-12
0-
0 0-
0 1-
320
10 A
ubur
n 56
28
42
-238
-3
18-2
9-0
351
4 71
-589
1-
1 4-
44
1-36
-36.
0 1-
10-0
4-
72-0
2-
10-1
31
:01
9-12
0-
0 3-
14
0-1
2009
Flo
rida
13
13
14-8
8-0
20-3
5-1
247
1 49
-335
0-
0 5-
51
4-19
5-48
.8
1-12
-0
6-16
1-0
0-0-
0 20
:23
4-11
0-
1 1-
10
2-2
2009
Ala
bam
a 32
26
53
-251
-3
12-1
8-0
239
1 71
-490
1-
0 1-
5 2-
83-4
1.5
1-8-
0 3-
79-0
1-
0-0
39:3
7 11
-15
0-0
0-0
2-2
2008
Flo
rida
31
19
42-1
42-1
14
-22-
0 21
6 3
64-3
58
0-0
6-45
3-
143-
47.7
3-
25-0
5-
121-
0 1-
24-0
32
:04
7-13
0-
0 1-
11
2-2
2008
Ala
bam
a 20
18
33
-136
-2
12-2
5-1
187
0 58
-323
0-
0 2-
31
4-16
4-41
.0
2-20
-0
4-95
-0
0-0-
0 27
:56
5-12
0-
1 1-
2 2-
2
2007
Ten
ness
ee
14
17
26-9
4-0
20-4
0-2
249
2 66
-343
0-
0 0-
0 5-
180-
36.0
2-
11-0
4-
99-0
1-
15-0
23
:52
4-13
0-
1 1-
8 0-
220
07 L
SU
21
21
47
-212
-0
21-3
3-1
252
1 80
-464
3-
1 9-
44
4-18
0-45
.0
1-1-
0 3-
64-0
2-
18-1
36
:08
10-2
0 1-
2 0-
0 2-
3
2006
Flo
rida
38
17
30-2
02-2
17
-31-
2 19
4 2
61-3
96
3-0
8-67
6-
224-
37.3
5-
29-0
3-
23-0
3-
0-0
28:0
2 2-
11
1-2
0-0
1-1
2006
Ark
ansa
s 28
18
35
-132
-0
12-2
6-3
179
3 61
-311
1-
1 5-
25
6-17
6-29
.3
2-(-4
)-0
4-68
-0
2-40
-1
31:5
8 4-
12
0-0
2-15
0-
1
2005
LSU
14
18
36-7
4-1
14-3
0-2
156
1 66
-230
0-
0 9-
78
6-20
1-33
.5
0-0-
0 4-
43-0
0-
0-0
31:1
1 5-
12
0-2
1-6
0-0
2005
Geo
rgia
34
16
42
-138
-1
6-12
-0
112
2 54
-250
1-
0 2-
15
4-18
3-45
.8
2-20
-0
2-43
-0
2-15
-1
28:4
9 5-
12
0-1
5-56
2-
2
2004
Ten
ness
ee
28
9 24
-228
-3
8-20
-0
69
1 44
-297
0-
0 12
-95
6-24
3-40
.5
0-0-
0 1-
23-0
1-
0-0
20:2
9 2-
9 0-
1 1-
5 0-
020
04 A
ubur
n 38
31
49
-185
-2
27-3
6-1
374
3 85
-559
3-
1 4-
20
5-59
-29.
5 2-
4-0
3-42
-0
0-0-
0 39
:31
8-14
2-
3 0-
0 1-
1
2003
LSU
34
17
46-2
93-2
14
-22-
0 15
1 1
68-4
44
1-0
5-45
6-
256-
42.7
3-
33-0
3-
55-0
3-
18-0
35
:38
6-17
1-
1 6-
53
2-3
2003
Geo
rgia
13
14
25
-50-
0 17
-41-
3 19
9 1
66-2
49
0-0
3-24
6-
232-
38.7
3-
(-1)-0
5-
59-0
1-
0-0
24:2
2 3-
14
0-3
4-35
2-
2
2002
Geo
rgia
30
25
40
-124
-2
19-3
3-0
257
1 73
-381
0-
0 12
-115
3-
137-
45.7
6-
36-0
2-
46-0
0-
0-0
31:2
1 5-
15
0-1
4-26
3-
320
02 A
rkan
sas
3 12
35
-65-
0 10
-21-
0 74
0
56-1
39
0-0
10-9
5 9-
299-
33.2
1-
10-0
5-
98-0
0-
0-0
28:3
9 3-
14
0-1
1-8
1-1
2001
Ten
ness
ee
20
17
18-5
0-0
27-4
3-0
332
2 61
-382
2-
2 10
-78
4-15
7-39
.2
2-17
-0
6-99
-0
0-0-
0 25
:39
4-12
0-
2 2-
11
2-2
2001
LSU
31
20
42-1
34-3
14
-35-
0 15
1 0
77-2
85
0-0
5-32
4-
181-
45.2
2-
29-0
3-
42-0
0-
0-0
34:2
1 9-
20
1-2
1-2
3-4
2000
Flo
rida
28
20
35-1
91-0
17
-26-
1 23
8 4
61-4
29
4-2
8-61
4-
178-
44.5
2-
30-0
2-
44-0
2-
31-0
28
:11
7-12
0-
1 1-
2 0-
020
00 A
ubur
n 6
19
28-1
20-0
23
-43-
2 20
8 0
71-3
28
3-2
5-19
5-
206-
41.2
1-
13-0
2-
34-0
1-
3-0
31:4
9 8-
17
1-2
1-21
2-
2

25SEC Championship Game Record Book
1st
Rush
Pass
TotalO
ff.Ga
me
Sc
ore
Down
s At
t-Yds
-TD
C-A-
I Yd
s TD
Pl
ays-
Yds
Fum
-Los
t Pe
n-Yd
s Pt
-Yds
-Avg
PR-
Yds-
TD K
R-Yd
s-TD
Int-Y
ds-T
D Ti
me
3rd
conv
4t
h co
nv
Sack
-Yds
FG
1999
Flo
rida
7 6
20-3
1-0
8-24
-4
83
1 44
-114
2-
0 4-
30
8-32
4-40
.5
0-0-
0 7-
116-
0 1-
29-0
11
:45
0-9
1-1
2-14
0-
019
99 A
laba
ma
34
22
49-3
00-2
14
-25-
1 16
2 2
74-4
62
1-0
12-9
9 3-
120-
40.0
0-
0-0
2-28
-0
4-97
-1
40:1
1 6-
15
1-1
1-13
3-
5
1998
Miss
. Sta
te
14
9 25
-65-
0 10
-25-
2 84
0
50-1
49
2-1
10-1
00
10-3
97-3
9.7
6-15
2-1
4-92
-0
1-70
-1
23:5
4 1-
12
0-0
4-35
0-
119
98 T
enne
ssee
24
21
48
-151
-1
15-3
3-1
208
2 81
-359
2-
1 4-
30
9-32
3-35
.9
3-7-
0 3-
75-0
2-
33-0
36
:06
8-20
0-
0 2-
13
1-1
1997
Ten
ness
ee
30
22
36-1
29-0
25
-43-
2 37
3 4
79-5
02
6-4
9-49
5-
182-
36.4
8-
171-
0 1-
17-0
0-
0-0
35:4
3 9-
17
1-1
4-24
1-
119
97 A
ubur
n 29
9
21-(-
15)-0
14
-34-
0 26
2 2
55-2
47
5-1
12-7
8 10
-438
-43.
8 2-
15-0
4-
89-0
2-
77-0
24
:17
1-13
0-
0 1-
2 2-
3
1996
Ala
bam
a 30
13
27
-27-
1 20
-46-
1 26
9 3
73-2
96
1-0
7-45
8-
326-
40.8
0-
0-0
5-85
-0
2-22
-0
30:1
2 7-
18
0-2
4-17
0-
119
96 F
lorid
a 45
22
37
-69-
0 20
-35-
2 40
1 6
72-4
70
4-1
14-9
5 4-
148-
37.0
2-
12-0
4-
83-0
1-
0-0
29:4
8 4-
14
1-3
5-31
1-
1
1995
Flo
rida
34
25
35-1
14-1
21
-29-
0 28
2 2
64-3
96
0-0
8-55
3-
131-
43.7
0-
0-0
2-44
-0
2-25
-0
29:4
5 4-
10
0-0
2-14
2-
319
95 A
rkan
sas
3 21
43
-129
-0
17-2
7-2
170
0 70
-299
3-
2 9-
59
4-13
7-34
.3
0-0-
0 5-
83-0
0-
0-0
30:1
5 4-
13
1-2
2-12
1-
2
1994
Ala
bam
a 23
16
48
-116
-0
10-1
9-2
181
1 67
-297
1-
0 6-
30
6-20
6-34
.3
2-45
-0
2-43
-0
2-65
-1
34:1
5 5-
17
1-2
1-5
3-3
1994
Flo
rida
24
14
24-4
4-1
25-4
3-2
272
2 67
-316
0-
0 2-
10
6-24
8-41
.3
1-1-
0 3-
58-0
2-
9-0
25:4
5 2-
12
2-2
5-39
1-
1
1993
Flo
rida
28
20
31-1
03-2
21
-38-
2 27
1 2
69-3
74
1-0
13-9
5 7-
276-
39.4
5-
95-0
1-
17-0
2-
0-0
27:4
3 4-
14
2-2
2-15
0-
019
93 A
laba
ma
13
17
40-1
18-1
17
-29-
2 16
1 0
69-2
79
3-0
6-70
7-
305-
43.6
4-
32-0
4-
94-0
2-
18-0
32
:17
5-16
1-
2 2-
11
2-2
1992
Ala
bam
a 28
15
41
-132
-2
10-1
8-0
154
1 59
-286
0-
0 11
-75
10-3
26-3
2.6
3-31
-0
3-14
-0
2-27
-1
28:4
0 2-
13
0-0
3-21
0-
019
92 F
lorid
a 21
22
30
-30-
1 30
-49-
2 28
7 2
79-3
17
0-0
4-30
7-
279-
40.0
4-
23-0
5-
71-0
0-
0-0
31:2
0 4-
15
1-3
3-23
0-
1

26 SEC Championship Game Record Book
2017 SEC CHAMPIONSHIPGeorgia (12-1) 28, Auburn (10-3) 7Dec. 2, 2017 | Atlanta, Ga. (Mercedes-Benz Stadium)Attendance: 76,534 | TV: CBSKickoff Time: 4:12 p.m. | End of Game: 7:32 p.m. | Time of Game: 3:20Officials: Referee: John McDaid; Umpire: Tom Quick; Linesman: Gary Jayroe;Line Judge: Chad Lorance; Back Judge: Martin Hankins; Field Judge: Greg Thomas;Side Judge: Chad Hill.
Score by Quarters 1 2 3 4 TotalGeorgia 0 10 3 15 28Auburn 7 0 0 0 7
UG AUFIRST DOWNS 20 18Rushing 11 9Passing 6 7Penalty 3 2NET YARDS RUSHING 238 114Rushing Attempts 41 31Average Per Rush 5.8 3.7Rushing Touchdowns 1 0Yards Gained Rushing 259 143Yards Lost Rushing 21 29NET YARDS PASSING 183 145Completions-Attempts-Int 16-22-0 16-32-0Average Per Attempt 8.3 4.5Average Per Completion 11.4 9.1Passing Touchdowns 2 1TOTAL OFFENSIVE YARDS 421 259Total Offensive Plays 63 63Average Gain Per Play 6.7 4.1Fumbles: Number-Lost 1-0 2-2Penalties: Number-Yards 7-91 5-39PUNTS-YARDS 4-176 6-244Average Yards Per Punt 44.0 40.7Net Yards Per Punt 35.5 36.8Inside 20 0 150+ Yards 1 0Touchbacks 1 1Fair Catch 1 2KICKOFF-YARDS 6-388 2-130Average Yards Per Kickoff 64.7 65.0Net Yards Per Kickoff 64.7 55.0Touchbacks 5 2Punt Returns: Number-Yards-TD 1-3-0 2-14-0Average Per Return 3.0 7.0Kickoff Returns: Number-Yards-TD 0-0-0 1-20-0Average Per Return 0.0 20.0Interception: Number-Yards-TD 0-0-0 0-0-0Fumble Returns: Number-Yards 2-9 0-0Miscellaneous Yards 14 0Possession Time 33:02 26:581st Quarter 5:37 9:232nd Quarter 7:13 7:473rd Quarter 8:12 6:484th Quarter 12:00 3:00Third-Down Conversions 2 of 11 4 of 13Fourth-Down Conversions 1 of 2 0 of 1Red Zone Scores-Chances 4 of 5 1 of 3Touchdowns 2 1Field Goals 2 0Sacks By: Number-Yards 3-24 2-13PAT Kicks 2-2 1-1Field Goals 2-2 0-1
GeorgiaRushing No Gain Loss Net TD Lg AvgD’Andre Swift 7 88 0 88 1 64 12.6Nick Chubb 13 78 1 77 0 20 5.9Sony Michel 7 45 0 45 0 18 6.4Brian Herrien 2 16 0 16 0 13 8.0Elijah Holyfield 5 11 2 9 0 4 1.8Mecole Hardman 1 4 0 4 0 4 4.0Jake Fromm 3 17 13 4 0 17 1.3Team 3 0 5 -5 0 0 -1.7Totals 41 259 21 238 1 64 5.8
Passing C-A-I Yds TD Lg SackJake Fromm 16-22-0 183 2 34 2
Receiving No Yards TD LgTerry Godwin 5 48 1 31Mecole Hardman 4 67 0 34D’Andre Swift 3 17 0 8Sony Michel 2 38 0 32Nick Chubb 1 11 0 11Isaac Nauta 1 2 1 2Totals 16 183 2 34
Punting No Yds Avg Lg In20 TBCameron Nizialek 4 176 44.0 53 0 1
Punt Kickoff InterceptReturns No-Yds-Lg No-Yds-Lg No-Yds-LgMecole Hardman 1-3-0 0-0-0 0-0-0
Field Goals Qtr Time Dist ResultRodrigo Blankenship 2nd 4:59 27 goodRodrigo Blankenship 3rd 1:26 35 good
Kickoffs No Yards Avg TB OBRodrigo Blankenship 6 388 64.7 5 0
All-Purpose Run Rcv KR PR IR TotalD’Andre Swift 88 17 0 0 0 105
AuburnRushing No Gain Loss Net TD Lg AvgKerryon Johnson 13 49 5 44 0 15 3.4Jarret Stidham 9 49 24 25 0 12 2.8Kam Martin 4 20 0 20 0 7 5.0Eli Stove 3 19 0 19 0 11 6.3Malik Miller 2 6 0 6 0 5 3.0Totals 31 143 29 114 0 15 3.7
Passing C-A-I Yds TD Lg SackJarrett Stidham 16-32-0 145 1 29 3
Receiving No Yards TD LgRyan Davis 7 65 0 29Darius Slayton 2 14 0 9Kerryon Johnson 2 1 0 7Eli Stove 1 26 0 26Chandler Cox 1 21 0 21Malik Miller 1 11 0 11Nate Craig-Myers 1 6 1 6Devan Barrett 1 1 0 1Totals 16 145 1 29
Punting No Yds Avg Lg In20 TBAidan Marshall 6 244 40.7 49 1 1
Punt Kickoff InterceptReturns No-Yds-Lg No-Yds-Lg No-Yds-LgStephen Roberts 2-14-8 0-0-0 0-0-0Noah Igbinoghene 0-0-0 1-20-20 0-0-0Totals 2-14-8 1-20-20 0-0-0
Field Goals Qtr Time Dist ResultDaniel Carlson 3rd 8.13 31 blocked
Kickoffs No Yards Avg TB OBDaniel Carlson 2 130 65.0 2 0

27SEC Championship Game Record Book
All-Purpose Run Rcv KR PR IR TotalRyan Davis 0 65 0 0 0 65
Fumbles: Georgia - Sony Michel 1-0. Auburn - Jarrett Stidham 1-1, Kerryon Johnson 1-1.
Defensive LeadersGeorgia Solo Ast Total Sacks-Yds TFL-Yds FF FR-Yds Int-Yds BrUp Blks QBHRoquan Smith 10 3 13 1.0-11 2.0-17 - 2-9 - - - 2Lorenzo Carter 4 2 6 - 0.5-1 1 - - - - 1Deandre Baker 5 0 5 - 1.0-4 - - - - - -Totals 41 16 57 3-24 7-39 2 2-9 - 2 1 9
Auburn Solo Ast Total Sacks-Yds TFL-Yds FF FR-Yds Int-Yds BrUp Blks QBHDeshaun Davis 4 6 10 - 1.0-1 - - - - - 1Tray Mathews 5 3 8 1.0-7 1.0-7 - - - 1 - -Darrell Williams 4 3 7 - 0.5-1 - - - - - -Totals 35 32 67 2-13 4-16 - - - 2 - 1
Drive Chart Drive Started Drive Ended ConsumedTeam Qtr Spot Time Obtained Spot Time How Lost Pl-Yds TOPUG 1st G25 9:54 Kickoff G44 6:16 Punt 7-19 3:38UG 1st G32 4:18 Punt G41 2:19 Punt 3-9 1:59UG 2nd G16 13:04 Fumble A00 10:14 Touchdown 7-84 2:50UG 2nd G32 8:33 Punt A10 4:59 Field Goal 8-58 3:34UG 2nd G22 0:49 Punt G19 0:00 Half 2-(-3) 0:49UG 3rd G25 15:00 Kickoff G47 12:00 Punt 5-22 3:00UG 3rd G16 8:13 MIssed FG G31 6:23 Punt 4-15 1:50UG 3rd G20 4:48 Punt A18 1:26 Field Goal 7-62 3:22UG 4th U39 14:49 Fumble A00 13:06 Touchdown 4-39 1:43UG 4th G25 12:12 Punt A00 10:34 Touchdown 3-75 1:38UG 4th G28 10:08 Punt A18 2:07 Downs 14-54 8:01UG 4th A32 0:38 Downs A34 0:00 Half 1-(-2) 0:38Avg. Starting Field Position: UG 31 Three and Out: 1
Drive Chart Drive Started Drive Ended ConsumedTeam Qtr Spot Time Obtained Spot Time How Lost Pl-Yds TOPAU 1st A25 15:00 Kickoff G00 9:54 Touchdown 10-75 5:06AU 1st A20 6:16 Punt A22 4:18 Punt 3-2 1:58AU 1st A24 2:19 Punt G16 13:04 Fumble 10-60 4:15AU 2nd A25 10:14 Kickoff A24 8:33 Punt 3-(-1) 1:41AU 2nd A25 4:59 Kickoff G49 0:49 Punt 6-26 4:10AU 3rd A20 12:00 Punt G14 8:13 Missed FG 9-66 3:47AU 3rd A46 6:23 Punt G41 4:48 Punt 5-13 1:35AU 3rd A22 1:21 Kickoff A48 14:49 Fumble 5-26 1:32AU 4th A25 13:06 Kickoff A29 12:12 Punt 3-4 0:54AU 4th A25 10:34 Kickoff A25 10:08 Punt 3-0 0:26AU 4th A18 2:07 Downs A32 0:38 Downs 7-14 1:29Avg. Starting Field Position: AU 25 Three and Out: 4
Scoring SummaryQtr Time Scoring Play Ply-Yds Time UG-AU1st 9:54 AU - Nate Craig-Myers 6 pass from Jarrett Stidham (Daniel Carlson kick) 10 -75 5:06 0 -7
2nd 10 :14 UG - Isaac Nauta 2 pass from Jake Fromm (Rodrigo Blankenship kick) 7-84 2:50 7-72nd 4:59 UG - Rodrigo Blankenship 27 field goal 8-58 3:34 10 -7
3rd 1:26 UG - Rodrigo Blankenship 35 field goal 7-62 3:22 13-7
4th 13:06 UG - Terry Godwin 7 pass from Jake Fromm (Terry Godwin from Jake Fromm) 4-39 1:43 21-74th 10:34 UG - D’Andre Swift 64 run (Rodrigo Blankenship kick) 3-75 1:38 28-7

28 SEC Championship Game Record Book
2016 SEC CHAMPIONSHIPAlabama (13-0) 54, Florida (8-4) 16Dec. 3, 2016 | Atlanta, Ga. (Georgia Dome)Attendance: 74,632 | TV: CBSKickoff Time: 4:11 p.m. | End of Game: 7:38 p.m. | Time of Game: 3:27Officials: Referee: Matt Loeffler; Umpire: Stan Weihe; Linesman: Gus Morris; Line Judge: Michael Shirey; Back Judge: Tony Josselyn; Field Judge: Bobby Ables; Side Judge: Jesse Dupuy; Center Judge: Chris Snead.
Score by Quarters 1 2 3 4 TotalAlabama 16 17 7 14 54Florida 9 7 0 0 16
UA UFFIRST DOWNS 18 16Rushing 12 2Passing 3 13Penalty 3 1NET YARDS RUSHING 234 0Rushing Attempts 38 30Average Per Rush 6.2 0.0Rushing Touchdowns 4 0Yards Gained Rushing 260 51Yards Lost Rushing 26 51NET YARDS PASSING 138 261Completions-Attempts-Int 11-20-0 26-39-3Average Per Attempt 6.9 6.7Average Per Completion 12.5 10.0Passing Touchdowns 1 2TOTAL OFFENSIVE YARDS 372 261Total Offensive Plays 58 69Average Gain Per Play 6.4 3.8Fumbles: Number-Lost 1-0 1-0Penalties: Number-Yards 2-14 7-53PUNTS-YARDS 2-81 5-218Average Yards Per Punt 40.5 43.6Net Yards Per Punt 40.5 20.2Inside 20 0 250+ Yards 0 3Touchbacks 0 0Fair Catch 0 1KICKOFF-YARDS 10-634 3-195Average Yards Per Kickoff 63.4 65.0Net Yards Per Kickoff 63.4 16.7Touchbacks 4 3Punt Returns: Number-Yards-TD 4-117-1 0-0-0Average Per Return 29.3 0.0Kickoff Returns: Number-Yards-TD 0-0-0 6-145-0Average Per Return 0.0 24.2Interception: Number-Yards-TD 3-84-1 0-0-0Fumble Returns: Number-Yards 0-0 0-0Miscellaneous Yards 0 0Possession Time 24:52 35:081st Quarter 2:40 12:202nd Quarter 7:18 7:423rd Quarter 6:45 8:154th Quarter 8:09 6:51Third-Down Conversions 5 of 10 7 of 16Fourth-Down Conversions 0 of 0 0 of 2Red Zone Scores-Chances 7 of 7 1 of 2Touchdowns 5 1Field Goals 2 0Sacks By: Number-Yards 4-36 2-11PAT Kicks 6-7 2-2Field Goals 2-3 0-0
AlabamaRushing No Gain Loss Net TD Lg AvgBo Scarbrough 11 93 2 91 2 34 8.3Damien Harris 8 86 0 86 0 23 10.8Josh Jacobs 6 35 0 35 1 12 5.8Derrick Gore 4 23 2 21 1 11 5.3Jalen Hurts 8 23 22 1 0 12 0.1ArDarius Stewart 1 0 0 0 0 0 0.0Totals 38 260 26 234 4 34 6.2
Passing C-A-I Yds TD Lg SackJalen Hurts 11-20-0 138 1 52 2
Receiving No Yards TD LgCalvin Ridley 4 43 0 52ArDarius Stewart 3 42 0 31O.J. Howard 2 41 0 32Gehrig Dieter 1 6 1 6Josh Jacobs 1 6 0 6Totals 11 138 1 52
Punting No Yds Avg Lg In20 TBJK Scott 2 81 40.5 41 0 0
Punt Kickoff InterceptReturns No-Yds-Lg No-Yds-Lg No-Yds-LgMinkah Fitzpatrick 0-0-0 0-0-0 1-44-44Shaun Dion Hamilton 0-0-0 0-0-0 1-40-40Tony Brown 0-0-0 0-0-0 1-0-0Trevon Diggs 3-90-47 0-0-0 0-0-0Josh Jacobs 0-27-27 0-0-0 0-0-0Derrick Gore 1-0-0 0-0-0 0-0-0Totals 4-117-47 0-0-0 3-84-44
Field Goals Qtr Time Dist ResultAdam Griffith 1st 6:58 31 goodAdam Griffith 2nd 9:38 40 missedAdam Griffith 2nd 6:27 25 good
Kickoffs No Yards Avg TB OBJK Scott 2 129 64.5 1 0Adam Griffith 8 505 63.1 3 0Totals 10 634 63.4 4 0
All-Purpose Run Rcv KR PR IR TotalBo Scarbrough 91 0 0 0 0 91
FloridaRushing No Gain Loss Net TD Lg AvgJordan Scarlett 11 18 1 17 0 4 1.5Mark Thompson 5 16 0 16 0 7 3.2Lamical Perine 3 9 1 8 0 7 2.7Jordan Cronkite 1 2 0 2 0 2 2.0Brandon Powell 1 1 0 1 0 1 1.0Josh Hammond 1 1 0 1 0 1 1.0Antonio Callaway 2 0 2 -2 0 0 -1.0Johnny Townsend 1 0 11 -11 0 0 -11.0Austin Appleby 5 4 36 -32 0 4 -6.4Totals 30 51 51 0 0 7 0.0
Passing C-A-I Yds TD Lg SackAustin Appleby 26-39-3 261 2 32 4
Receiving No Yards TD LgBrandon Powell 9 59 0 13DeAndre Goolsby 7 91 1 25Antonio Callaway 4 63 1 24C’yontai Lewis 2 10 0 6Lamical Perine 1 32 0 32Josh Hammond 1 4 0 4Jordan Cronkite 1 2 0 2Mark Thompson 1 0 0 0Totals 26 261 2 32
Punting No Yds Avg Lg In20 TBJohnny Townsend 4 218 54.5 62 2 0Team 1 0 0.0 0 0 0Totals 5 218 43.6 62 2 0

29SEC Championship Game Record Book
Punt Kickoff InterceptReturns No-Yds-Lg No-Yds-Lg No-Yds-LgMark Thompson 0-0-0 1-21-21 0-0-0Chris Thompson 0-0-0 5-124-33 0-0-0Totals 0-0-0 6-145-33 0-0-0
Kickoffs No Yards Avg TB OBEddy Pineiro 3 195 65.0 3 0
All-Purpose Run Rcv KR PR IR TotalChris Thompson 0 0 124 0 0 124
Fumbles: Alabama - Jalen Hurts 1-0. Florida - Chris Thompson 1-0.
Defensive LeadersAlabama Solo Ast Total Sacks-Yds TFL-Yds FF FR-Yds Int-Yds BrUp Blks QBHReuben Foster 9 2 11 2.0-15 2.5-15 - - - - - -Ronnie Harrison 5 2 7 - - - - - 2 - -Dalvin Tomlinson 2 3 5 - - - - - - - 2Totals 39 34 73 4-36 9-51 1 - 3-84 3 1 8
Florida Solo Ast Total Sacks-Yds TFL-Yds FF FR-Yds Int-Yds BrUp Blks QBHChauncey Gardner 4 5 9 - 0.5-1 - - - 1 - -Daniel McMillian 5 2 7 - - - - - - - -Marcel Harris 6 1 7 1.0-2 1.0-2 - - - 1 - -Totals 38 20 68 2-11 7-28 - - - 2 1 2
Drive Chart Drive Started Drive Ended ConsumedTeam Qtr Spot Time Obtained Spot Time How Lost Pl-Yds TOPUA 1st A25 9:51 Kickoff A19 8:09 Punt 3-(-6) 1:42UA 1st F12 7:56 Interception F13 6:58 Field Goal 4-(-1) 0:58UA 1st F00 5:06 Interception F00 5:06 Touchdown 0-0 0:00UA 1st F27 1:42 Punt F27 1:42 Touchdown 0-0 0:00UA 2nd A12 14:53 Punt F00 11:55 Touchdown 7-88 2:58UA 2nd F22 9:55 Downs F22 9:38 Missed FG 4-0 0:17UA 2nd F43 8:28 Punt F07 6:27 Field Goal 7-36 2:01UA 2nd A38 5:30 Interception F00 3:47 Touchdown 5-62 1:43UA 2nd A25 0:19 Kickoff A33 0:00 Half 1-8 0:19UA 3rd A25 15:00 Kickoff A25 13:20 Punt 3-0 1:40UA 3rd A02 6:48 Downs F00 3:32 Touchdown 8-98 3:16UA 3rd A09 1:49 Punt F00 9:15 Touchdown 15-91 7:34UA 4th F21 06:12 Punt F00 3:48 Touchdown 4-21 2:24Avg. Starting Field Position: UA 39 Three and Out: 2
Drive Chart Drive Started Drive Ended ConsumedTeam Qtr Spot Time Obtained Spot Time How Lost Pl-Yds TOPUF 1st F36 15:00 Kickoff A00 9:51 Touchdown 10-64 5:09UF 1st F41 8:09 Punt F41 7:56 Interception 1-0 0:13UF 1st F25 6:58 Kickoff F27 5:06 Interception 3-2 1:52UF 1st F25 5:06 Kickoff F27 1:42 Punt 6-2 3:24UF 1st F25 1:38 Kickoff F34 14:53 Punt 3-9 1:45UF 2nd F25 11:55 Kickoff F22 9:55 Downs 4-(-3) 2:00UF 2nd F22 9:38 Missed FG F28 8:28 Punt 3-6 1:10UF 2nd F27 6:20 Kickoff F31 5:30 Interception 3-4 0:50UF 2nd F08 3:42 Kickoff A00 0:19 Touchdown 10-92 3:23UF 3rd F34 13:20 Punt A02 6:48 Downs 12-64 6:32UF 3rd F33 3:25 Kickoff F30 1:49 Punt 3-(-3) 1:36UF 4th F25 9:15 Kickoff F15 6:12 Punt 5-(-10) 3:03UF 4th F24 3:44 Kickoff F44 0:00 Half 6-20 3:44Avg. Starting Field Position: UF 26 Three and Out: 3
Scoring SummaryQtr Time Scoring Play Ply-Yds Time UA-UF1st 09:51 UF - Antonio Callaway 5 pass from Austin Appleby (Eddy Pineiro kick) 10-64 5:09 0-71st 06:58 UA - Adam Griffith 31 field goal 4-(-1) 0:58 3-71st 05:06 UA - Minkah Fitzpatrick 44 interception return (Adam Griffith kick) - - 10-71st 01:42 UA - Josh Jacobs 27 punt return (Adam Griffith kick blocked) - - 16-71st 01:42 UF - David Reese 98 PAT return - - 16-92nd 11:55 UA - Gehrig Dieter 6 pass from Jalen Hurts (Adam Griffith kick) 7-88 2:58 23-92nd 06:27 UA - Adam Griffith 25 field goal 7-36 2:01 26-92nd 03:47 UA - Josh Jacobs 6 run (Adam Griffith kick) 5 62 1:43 33-92nd 00:19 UF - DeAndre Goolsby 25 pass from Austin Appleby (Eddy Pineiro kick) 10-92 3:23 33-163rd 03:32 UA - Bo Scarbrough 2 run (Adam Griffith kick) 8-98 3:16 40-164th 09:15 UA - Bo Scarbrough 1 run (Adam Griffith kick) 15-91 7:34 47-164th 03:48 UA - Derrick Gore 10 run (Andy Pappanastos kick) 4-21 2:24 54-16

30 SEC Championship Game Record Book
2015 SEC CHAMPIONSHIPAlabama (12-1) 29, Florida (10-3) 15Dec. 5, 2015 | Atlanta, Ga. (Georgia Dome)Attendance: 75,320 | TV: CBSKickoff Time: 4:10 p.m. | End of Game: 7:50 p.m. | Time of Game: 3:40Officials: Referee: Matt Austin; Umpire: Rodney Lawary; Linesman: Tim Sistrunk; Line Judge: Michael Taylor; Back Judge: Jimmy Russell; Field Judge: Blake Parks; Side Judge: Bobby Moreau.
Score by Quarters 1 2 3 4 TotalFlorida 0 7 0 8 15Alabama 2 10 10 7 29
UF UAFIRST DOWNS 7 25Rushing 1 14Passing 6 9Penalty 0 2NET YARDS RUSHING 15 233Rushing Attempts 21 58Average Per Rush 0.7 4.0Rushing Touchdowns 0 1Yards Gained Rushing 57 260Yards Lost Rushing 42 27NET YARDS PASSING 165 204Completions-Attempts-Int 9-24-1 18-26-0Average Per Attempt 6.9 7.8Average Per Completion 18.3 11.3Passing Touchdowns 1 2TOTAL OFFENSIVE YARDS 180 437Total Offensive Plays 45 84Average Gain Per Play 4.0 5.2Fumbles: Number-Lost 1-0 2-1Penalties: Number-Yards 5-51 5-35PUNTS-YARDS 9-414 6-307Average Yards Per Punt 46.0 51.2Net Yards Per Punt 41.0 37.2Inside 20 1 550+ Yards 5 4Touchbacks 0 0Fair Catch 0 2KICKOFF-YARDS 4-213 6-390Average Yards Per Kickoff 53.3 65.0Net Yards Per Kickoff 42.3 57.3Touchbacks 1 4Punt Returns: Number-Yards-TD 3-84-1 8-45-0Average Per Return 28.0 5.6Kickoff Returns: Number-Yards-TD 2-44-0 2-46-0Average Per Return 22.0 23.0Interception: Number-Yards-TD 0-0-0 1-(-1)-0Fumble Returns: Number-Yards 1-0 0-0Miscellaneous Yards 0 15Possession Time 16:31 43:291st Quarter 6:35 8:252nd Quarter 5:13 9:473rd Quarter 1:05 13:554th Quarter 3:38 11:22Third-Down Conversions 0 of 11 7 of 17Fourth-Down Conversions 0 of 1 1 of 1Red Zone Scores-Chances 0 of 0 4 of 6Touchdowns 0 2Field Goals 0 2Sacks By: Number-Yards 2-17 5-36PAT Kicks 1-1 3-3Field Goals 0-1 2-3
FloridaRushing No Gain Loss Net TD Lg AvgKelvin Taylor 7 10 2 8 0 3 1.1Jordan Cronkrite 2 8 0 8 0 8 4.0Jordan Scarlett 1 3 0 3 0 3 3.0Treon Harris 11 36 40 -4 0 23 -0.4Totals 21 57 42 15 0 23 0.7
Passing C-A-I Yds TD Lg SackTreon Harris 9-24-1 165 1 46 5
Receiving No Yards TD LgJake McGee 3 43 0 18Valdez Showers 2 22 0 18DeAndre Goolsby 1 15 0 15C.J. Worton 1 46 1 46Antonio Callaway 1 46 0 46Treon Harris 1 -7 0 0Totals 9 165 1 46
Punting No Yds Avg Lg In20 TBJohnny Townsend 8 414 51.8 57 1 0Team 1 0 0.0 0 0 0Totals 9 414 46.0 57 1 0
Punt Kickoff InterceptReturns No-Yds-Lg No-Yds-Lg No-Yds-LgAntonio Callaway 3-84-85 0-0-0 0-0-0Vernon Hargreaves III 0-0-0 2-44-24 0-0-0Totals 3-84-85 2-44-24 0-0-0
Field Goals Qtr Time Dist ResultAustin Hardin 1st 4:33 40 blocked
Kickoffs No Yards Avg TB OBAustin Hardin 3 147 49.0 1 1Johnny Townsend 1 66 66.0 0 0Totals 4 213 53.3 1 1
All-Purpose Run Rcv KR PR IR TotalAntonio Callway 0 46 0 84 0 130
AlabamaRushing No Gain Loss Net TD Lg AvgDerrick Henry 44 195 6 189 1 21 4.3Jake Coker 8 44 21 23 0 17 2.9Kenyan Drake 4 14 0 14 0 7 3.5ArDarius Stewart 1 5 0 5 0 5 5.0Calvin Ridley 1 2 0 2 0 2 2.0Totals 58 260 27 233 1 21 4.0
Passing C-A-I Yds TD Lg SackJake Coker 18-26-0 204 2 55 2
Receiving No Yards TD LgCalvin Ridley 8 102 0 55ArDarius Stewart 4 64 1 32Richard Mullaney 3 22 1 9Kenyan Drake 3 16 0 9Totals 18 204 2 55
Punting No Yds Avg Lg In20 TBJK Scott 6 307 51.2 59 5 0
Punt Kickoff InterceptReturns No-Yds-Lg No-Yds-Lg No-Yds-LgCyrus Jones 7-32-15 1-24-24 0-0-0Keith Holcombe 1-13-0 0-0-0 0-0-0Kenyan Drake 0-0-0 1-22-22 0-0-0Marlon Humphrey 0-0-0 0-0-0 1-(-1)-0Totals 8-45-15 2-46-24 1-(-1)-0
Field Goals Qtr Time Dist ResultAdam Griffith 2nd 5:45 28 goodAdam Griffith 3rd 8:04 30 goodAdam Griffith 4th 14:07 24 missed
Kickoffs No Yards Avg TB OBAdam Griffith 6 390 65.0 4 0

31SEC Championship Game Record Book
All-Purpose Run Rcv KR PR IR TotalDerrick Henry 189 0 0 0 0 189Calvin Ridley 2 102 0 0 0 104
Fumbles: Florida - Antonio Callaway 1-0. Alabama - Derrick Henry 1-1, Jake Coker 1-0.
Defensive LeadersFlorida Solo Ast Total Sacks-Yds TFL-Yds FF FR-Yds Int-Yds BrUp Blks QBHAntonio Morrison 8 3 11 - 1.0-2 - - - - - -Marcus Maye 7 2 9 - - - 1-0 - - - 1Matt Rolin 7 1 8 - - - - - - - -Jarrad Davis 6 2 8 - 0.5-0 1 - - 1 - 2Keanu Neal 6 2 8 - - - - - - - -Jon Bullard 6 2 8 1.0-7 2.0-9 - - - - - -Totals 67 28 95 2-17 7-26 2 1-0 - 3 - 4
Alabama Solo Ast Total Sacks-Yds TFL-Yds FF FR-Yds Int-Yds BrUp Blks QBHRyan Anderson 4 0 4 1.0-8 2.0-9 - - - - - 3Totals 25 10 35 5-36 9-42 1 - - 1 1 11
Drive Chart Drive Started Drive Ended ConsumedTeam Qtr Spot Time Obtained Spot Time How Lost Pl-Yds TOPUF 1st F25 15:00 Kickoff F33 13:47 Punt 3-8 1:13UF 1st F13 10:13 Punt F13 9:05 Safety 3-0 1:08UF 1st F08 7:16 Punt A23 4:33 Missed FG 8-69 2:43UF 1st F02 2:06 Punt F08 0:35 Punt 3-6 1:31UF 2nd F28 14:53 Fumble F23 13:10 Punt 4-(-5) 1:43UF 2nd A00 11:53 Punt A00 11:53 Touchdown 0-0 0:00UF 2nd F20 5:41 Kickoff F18 3:28 Punt 3-(-2) 2:13UF 2nd F25 2:26 Kickoff F17 1:13 Punt 3-(-8) 1:13UF 3rd F25 8:04 Kickoff F20 7:36 Punt 3-(-5) 0:28UF 3rd F24 2:43 Kickoff F26 2:12 Interception 2-2 0:31UF 4th F20 14:07 Missed FG F16 13:16 Punt 3-(-4) 0:51UF 4th F25 8:50 Kickoff F24 7:48 Punt 3-(-1) 1:02UF 4th F19 6:01 Punt A00 5:02 Touchdown 3-81 0:59UF 4th F09 4:35 Punt F27 3:49 Downs 5-18 0:46 Avg. Starting Field Position: UF 18 Three and Out: 7
Drive Chart Drive Started Drive Ended ConsumedTeam Qtr Spot Time Obtained Spot Time How Lost Pl-Yds TOPUA 1st A10 13:47 Punt A33 10:13 Punt 7-23 3:34UA 1st A38 8:59 Kickoff A29 7:16 Punt 3--9 1:43UA 1st A33 4:33 Missed FG A45 2:06 Punt 3-12 2:27UA 1st F42 0:35 Punt F28 14:53 Fumble 3-14 0:42UA 2nd A24 13:10 Punt A26 11:53 Punt 3-2 1:17UA 2nd A25 11:53 Kickoff F11 5:45 Field Goal 14-64 6:08UA 2nd A42 3:28 Punt F00 2:26 Touchdown 3-58 1:02UA 2nd A20 1:13 Punt A31 0:00 End of half 2-11 1:13UA 3rd A22 14:53 Kickoff F13 8:04 Field Goal 12-65 6:49UA 3rd A19 7:36 Punt F00 2:49 Touchdown 10-81 4:47UA 3rd F39 2:12 Interception F07 14:07 Missed FG 7-32 3:05UA 4th A43 13:16 Punt F00 8:50 Touchdown 9-57 4:26UA 4th A23 7:48 Punt A44 6:01 Punt 3-21 1:47UA 4th A48 4:59 Kickoff A49 4:35 Punt 3-1 0:24UA 4th F27 3:49 Downs F03 0:00 End of half 5-24 3:49Avg. Starting Field Position: UA 35 Three and Out: 5
Scoring SummaryQtr Time Scoring Play Ply-Yds Time UF-UA1st 9:05 UA - Team safety - - 0-2
2nd 11:53 UF - Antonio Callaway 85 punt return (Neil MacInnes kick) - - 7-22nd 5:45 UA - Adam Griffith 28 field goal 14-64 6:08 7-52nd 2:26 UA - Derrick Henry 2 rush (Adam Griffith kick) 3-58 1:02 7-12
3rd 8:04 UA - Adam Griffith 30 field goal 12-65 6:49 7-153rd 2:49 UA - ArDarius Stewart 32 pass from Jake Coker (Adam Griffith kick) 10-81 4:47 7-22
4th 8:50 UA - Richard Mullaney 9 pass from Jake Coker (Adam Griffith kick) 9-57 4:26 7-294th 5:02 UF - C.J. Worton 46 pass from Treon Harris (Treon Harris rush) 3-81 0:59 15-29

32 SEC Championship Game Record Book
2014 SEC CHAMPIONSHIPAlabama (12-1) 42, Missouri (10-3) 13Dec. 6, 2014 | Atlanta, Ga. (Georgia Dome)Attendance: 73,526 | TV: CBSKickoff Time: 4:12 p.m. | End of Game: 7:37 p.m. | Time of Game: 3:25Officials: Referee: Tom Ritter; Umpire: Stan Weihe; Linesman: Gary Jayroe; Line Judge: David Oliver; Back Judge: Dax Hill; Field Judge: Jabir Walker; Side Judge: Chuck Ross.
Score by Quarters 1 2 3 4 TotalAlabama 7 14 0 21 42Missouri 0 3 10 0 13
UA MOFIRST DOWNS 28 10Rushing 14 1Passing 13 9Penalty 1 0NET YARDS RUSHING 242 41Rushing Attempts 49 23Average Per Rush 4.9 1.8Rushing Touchdowns 4 0Yards Gained Rushing 276 54Yards Lost Rushing 34 13NET YARDS PASSING 262 272Completions-Attempts-Int 23-27-0 16-34-0Average Per Attempt 9.7 8.0Average Per Completion 11.4 17.0Passing Touchdowns 2 1TOTAL OFFENSIVE YARDS 504 313Total Offensive Plays 76 57Average Gain Per Play 6.6 5.5Fumbles: Number-Lost 3-0 2-1Penalties: Number-Yards 2-10 6-60PUNTS-YARDS 3-130 7-304Average Yards Per Punt 43.3 43.4Net Yards Per Punt 43.0 43.4Inside 20 2 250+ Yards 1 1Touchbacks 0 0Fair Catch 2 3KICKOFF-YARDS 7-410 4-257Average Yards Per Kickoff 58.6 64.3Net Yards Per Kickoff 46.4 42.0Touchbacks 2 1Punt Returns: Number-Yards-TD 1-1-0 0-0-0Average Per Return 1.0 0.0Kickoff Returns: Number-Yards-TD 3-85-0 4-89-0Average Per Return 28.3 22.3Interception: Number-Yards-TD 0-0-0 0-0-0Fumble Returns: Number-Yards 1-0 0-0Miscellaneous Yards 0 0Possession Time 36:43 23:171st Quarter 10:31 4:292nd Quarter 9:04 5:563rd Quarter 7:35 7:254th Quarter 9:33 5:27Third-Down Conversions 9 of 13 6 of 16Fourth-Down Conversions 0 of 0 1 of 1Red Zone Scores-Chances 4 of 4 3 of 3Touchdowns 4 1Field Goals 0 2Sacks By: Number-Yards 0-0 2-12PAT Kicks 6-6 1-1Field Goals 0-1 2-2
AlabamaRushing No Gain Loss Net TD Lg AvgDerrick Henry 20 148 7 141 2 45 7.1T.J. Yeldon 14 48 1 47 2 12 3.4Tyren Jones 3 26 0 26 0 14 8.7Blake Sims 9 43 24 19 0 17 2.1Amari Cooper 1 9 0 9 0 9 9.0Jalston Fowler 1 2 0 2 0 2 2.0Team 1 0 2 -2 0 0 -2.0Totals 49 276 24 242 4 45 4.9
Passing C-A-I Yds TD Lg SackBlake Sims 23-27-0 262 2 58 2
Receiving No Yards TD LgAmari Cooper 12 83 0 17DeAndrew White 4 101 1 58Christion Jones 3 40 1 17O.J. Howard 2 20 0 17Jalston Fowler 1 13 0 13Brian Vogler 1 5 0 5Totals 23 262 2 58
Punting No Yds Avg Lg In20 TBJK Scott 3 130 43.3 52 2 0
Punt Kickoff InterceptReturns No-Yds-Lg No-Yds-Lg No-Yds-LgChristion Jones 1-1-1 3-85-36 0-0-0
Field Goals Qtr Time Dist ResultAdam Griffith 2nd 13:18 43 missed
Kickoffs No Yards Avg TB OBAdam Griffith 7 410 58.6 2 0
All-Purpose Run Rcv KR PR IR TotalDerrick Henry 141 0 0 0 0 141Christion Jones 0 40 85 1 0 126
MissouriRushing No Gain Loss Net TD Lg AvgRussell Hansbrough 13 26 5 21 0 6 1.6Marcus Murphy 7 27 7 20 0 15 2.9Ish Witter 1 1 0 1 0 1 1.0Maty Mauk 2 0 1 -1 0 0 -0.5Totals 23 54 13 41 0 15 1.8
Passing C-A-I Yds TD Lg SackMaty Mauk 16-34-0 272 1 63 0
Receiving No Yards TD LgJimmie Hunt 6 169 0 63Bud Sasser 5 31 1 16Darius White 3 56 0 26Marcus Murphy 1 11 0 11Sean Culkin 1 5 0 5Totals 16 272 1 63
Punting No Yds Avg Lg In20 TBChristian Brinser 7 304 43.4 50 2 0
Punt Kickoff InterceptReturns No-Yds-Lg No-Yds-Lg No-Yds-LgMarcus Murphy 0-0-0 3-63-27 0-0-0Tyler Hunt 0-0-0 1-26-26 0-0-0Totals 0-0-0 4-89-27 0-0-0
Field Goals Qtr Time Dist ResultAndrew Baggett 2nd 8:30 33 goodAndrew Baggett 3rd 4:37 33 good
Kickoffs No Yards Avg TB OBAndrew Baggett 4 257 64.3 1 0
All-Purpose Run Rcv KR PR IR TotalJimmie Hunt 0 169 0 0 0 169
Fumbles: Alabama-Blake Sims 2-0, Team 1-0. Missouri-Darius White 1-1, Team 1-0.

33SEC Championship Game Record Book
Defensive LeadersAlabama Solo Ast Total Sacks-Yds TFL-Yds FF FR-Yds Int-Yds BrUp Blks QBHA’Shawn Robinson 5 4 9 - 3.0-5 - - - - - 1Landon Collins 6 1 7 - 1.0-1 1 1-0 - - - -Geno Smith 4 1 5 - - - - - 1 - -Jarran Reed 2 2 4 - 2.0-7 - - - - - -Trey DePriest 1 3 4 - - - - - 1 - -Totals 31 22 53 - 6-13 1 1-0 - 4 - 11
Missouri Solo Ast Total Sacks-Yds TFL-Yds FF FR-Yds Int-Yds BrUp Blks QBHKentrell Brothers 8 6 14 - - - - - - - -Kenya Dennis 7 0 7 - - - - - - - -Braylon Webb 5 2 7 - - - - - - - -Michael Scherer 4 3 7 - - 1 - - - - -Vincent Lucas 3 4 7 1.0-6 2.0-7 - - - - - 1Totals 50 32 82 2-12 5-20 1 - - - - 3
Drive Chart Drive Started Drive Ended ConsumedTeam Qtr Spot Time Obtained Spot Time How Lost Pl-Yds TOPUA 1st UA32 15:00 Kickoff MO00 11:24 Touchdown 10-68 3:36UA 1st UA44 10:50 Punt UA37 8:31 Punt 3-(-7) 2:19UA 1st UA30 6:44 Punt UA42 3:49 Punt 5-12 2:55UA 1st UA39 1:41 Punt MO26 13:18 Missed FG 9-35 3:23UA 2nd UA42 11:58 Punt MO00 11:48 Touchdown 1-58 0:10UA 2nd UA25 8:30 Kickoff MO00 2:47 Touchdown 14-75 5:43UA 2nd UA09 1:29 Punt UA20 0:00 End of Half 3-11 1:29UA 3rd UA20 10:54 Kickoff UA47 8:02 Punt 6-27 2:52UA 3rd UA36 4:29 Kickoff MO00 14:55 Touchdown 10-64 4:34UA 4th UA10 12:15 Punt MO00 7:38 Touchdown 8-90 4:37UA 4th UA38 6:24 Fumble MO00 3:38 Touchdown 5-62 2:46UA 4th UA28 2:05 Punt UA47 0:00 End of Half 3-19 2:05Avg. Starting Field Position: UA 29 Three and Out: 1
Drive Chart Drive Started Drive Ended ConsumedTeam Qtr Spot Time Obtained Spot Time How Lost Pl-Yds TOPMO 1st MO19 11:19 Kickoff MO19 10:50 Punt 3-0 0:29MO 1st MO11 8:31 Punt MO20 6:44 Punt 3-9 1:47 MO 1st MO13 3:49 Punt MO20 1:41 Punt 6-7 2:08MO 2nd MO26 13:18 MIssed FG MO32 11:58 Punt 3-6 1:20MO 2nd MO27 11:42 Kickoff UA15 8:30 Field Goal 9-58 3:12MO 2nd MO25 2:47 Kickoff MO48 1:29 Punt 4-23 1:18MO 3rd MO25 15:00 Kickoff UA00 11:00 Touchdown 10-75 4:00MO 3rd MO20 8:02 Punt UA15 4:37 Field Goal 9-65 3:25MO 4th MO28 14:48 Kickoff MO45 12:15 Punt 6-17 2:33MO 4th MO28 7:38 Kickoff UA38 6:24 Fumble 3-34 1:14MO 4th MO17 3:33 Kickoff MO26 2:05 Punt 3-9 1:28Avg. Starting Field Position: MO 22 Three and Out: 4
Scoring SummaryQtr Time Scoring Play Ply-Yds Time UA-MO1st 11:24 UA – T.J. Yeldon 1 run (Adam Griffith kick) 10-68 3:36 7-0
2nd 11:48 UA – DeAndrew White 58 pass from Blake Sims (Adam Griffith kick) 1-58 0:10 14-02nd 8:30 MO – Andrew Baggett 33 field goal 9-58 3:12 14-32nd 2:47 UA – T.J. Yeldon 2 run (Adam Griffith kick) 14-75 5:43 21-3
3rd 11:00 MO – Bud Sasser 1 pass from Maty Mauk (Andrew Baggett kick) 10-75 4:00 21-103rd 4:37 MO – Andrew Baggett 33 field goal 9-65 3:25 21-13
4th 14:55 UA – Christion Jones 6 pass from Blake Sims (Adam Griffith kick) 10-64 4:34 28-134th 7:38 UA – Derrick Henry 26 rush (Adam Griffith kick) 8-90 4:37 35-134th 3:38 UA – Derrick Henry 1 rush (Adam Griffith kick) 5-62 2:46 42-13

34 SEC Championship Game Record Book
2013 SEC CHAMPIONSHIPAuburn (12-1) 59, Missouri (11-2) 42Dec. 7, 2013 | Atlanta, Ga. (Georgia Dome)Attendance: 75,632 | TV: CBSKickoff Time: 4:11 p.m. | End of Game: 8:05 p.m. | Time of Game: 3:54 Officials: Referee: Hubert Owens; Umpire: Russ Pulley; Linesman: Johnny Crawford; Line Judge: Tim Beard; Back Judge: Stan Murray; Field Judge: Greg Thomas; Side Judge: Chad Hill.
Score by Quarters 1 2 3 4 TotalMissouri 10 17 15 0 42Auburn 14 14 17 14 59
MO AUFIRST DOWNS 22 30Rushing 7 26Passing 13 3Penalty 2 1NET YARDS RUSHING 231 545Rushing Attempts 34 74Average Per Rush 6.8 7.4Rushing Touchdowns 1 7Yards Gained Rushing 247 565Yards Lost Rushing 16 20NET YARDS PASSING 303 132Completions-Attempts-Int 21-37-1 9-11-0Average Per Attempt 8.2 12.0Average Per Completion 14.4 14.7Passing Touchdowns 3 1TOTAL OFFENSIVE YARDS 534 677Total Offensive Plays 71 85Average Gain Per Play 7.5 8.0Fumbles: Number-Lost 1-0 3-2Penalties: Number-Yards 7-40 10-63PUNTS-YARDS 5-225 3-120Average Yards Per Punt 45.0 40.0Net Yards Per Punt 45.0 28.0Inside 20 0 350+ Yards 2 0 Touchbacks 0 0Fair Catch 1 2KICKOFFS-YARDS 8-500 9-585Average Yards Per Kickoff 62.5 65.0Net Yards Per Kickoff 60.8 61.9Touchbacks 6 8Punt Returns: Number-Yards-TD 0-0-0 2-36-0Average Per Return 0.0 18.0Kickoff Returns: Number-Yards-TD 1-14-0 2-28-0Average Per Return 14.0 14.0Interception: Number-Yards-TD 0-0-0 1-0-0Fumble Returns: Number-Yards-TD 2-11-0 0-0-0Miscellaneous Yards 0 0Possession Time 25:40 34:201st Quarter 7:53 7:072nd Quarter 6:02 8:583rd Quarter 5:49 9:114th Quarter 5:56 9:04Third-Down Conversions 2 of 12 7 of 14Fourth-Down Conversions 1 of 3 1 of 1Red Zone Scores-Chances 3 of 4 7 of 7Touchdowns 2 7Field Goals 1 0Sacks By: Number-Yards 1-6 3-14PAT Kicks 4-4 8-8Field Goals 2-2 1-2
MissouriRushing No Gain Loss Net TD Lg AvgHenry Josey 9 125 2 123 0 65 13.7James Franklin 15 76 14 62 1 12 4.1Russell Hansbrough 6 36 0 36 0 9 6.0Marcus Murphy 4 10 0 10 0 5 2.5Totals 34 247 16 231 1 65 6.8
Passing C-A-I Yds TD Lg SackJames Franklin 21-37-1 303 3 55 3
Receiving No Yards TD LgDorial Green-Beckham 6 144 2 55Marcus Lucas 5 50 0 43Marcus Murphy 3 40 1 24Bud Sasser 3 34 0 21L’D Washington 3 29 0 16Jimmie Hunt 1 6 0 6Totals 21 303 3 55
Punting No Yds Avg Lg In20 TBChristian Brinser 5 225 45.0 54 0 0
Punt Kickoff InterceptReturns No-Yds-Lg No-Yds-Lg No-Yds-LgMarcus Murphy 0-0-0 1-14-14 0-0-0
Field Goals Qtr Time Dist ResultAndrew Baggett 1st 10:50 42 goodAndrew Baggett 2nd 7:19 36 good
Kickoffs No Yards Avg TB OBAndrew Baggett 8 500 62.5 6 0
All-Purpose Run Rcv KR PR IR TotalDorial Green-Beckham 0 144 0 0 0 144Henry Josey 123 0 0 0 0 123
AuburnRushing No Gain Loss Net TD Lg AvgTre Mason 46 306 2 304 4 52 6.6Nick Marshall 16 115 14 101 1 42 6.3Corey Grant 5 65 0 65 1 43 13Ricardo Louis 3 43 0 43 0 23 14.3Cameron Artis-Payne 2 36 0 36 1 21 18Team 2 0 4 -4 0 0 -2Totals 74 565 20 545 7 52 7.4
Passing C-A-I Yds TD Lg SackNick Marshall 9-11-0 132 1 54 1
Receiving No Yards TD LgSammie Coates 6 94 1 54Trovon Reed 1 23 0 23Tre Mason 1 8 0 8Ricardo Louis 1 7 0 7Totals 9 132 1 54
Punting No Yds Avg Lg In20 TBSteven Clark 3 120 40.0 46 3 0
Punt Kickoff InterceptReturns No-Yds-Lg No-Yds-Lg No-Yds-LgChris Davis 2-36-22 0-0-0 0-0-0Jermaine Whitehead 0-0-0 0-0-0 1-0-0Corey Grant 0-0-0 1-21-21 0-0-0Nosa Eguae 0-0-0 1-7-0 0-0-0Totals 2-36-22 2-28-21 1-0-0
Field Goals Qtr Time Dist ResultCody Parkey 1st 2:24 54 missedCody Parkey 3rd 8:17 52 good
Kickoffs No Yards Avg TB OBCody Parkey 9 585 65.0 8 0
All-Purpose Run Rcv KR PR IR TotalTre Mason 304 8 0 0 0 312Nick Marshall 101 0 0 0 0 101
Fumbles: Missouri-Marcus Lucas 1-0. Auburn-Nick Marshall 3-2.

35SEC Championship Game Record Book
Defensive LeadersMissouri Solo Ast Total Sacks-Yds TFL-Yds FF FR-Yds Int-Yds BrUp Blks QBHBraylon Webb 8 4 12 - - - - - - - -Andrew Wilson 6 5 11 - - - - - - - -Donovan Bonner 5 5 10 - 1.0-4 - - - - - -E.J. Gaines 7 2 9 - 1.0-1 - 1-11 - - - -Totals 59 28 87 1-6 6-19 2 2-11 - 1 - 2
Auburn Solo Ast Total Sacks-Yds TFL-Yds FF FR-Yds Int-Yds BrUp Blks QBHCassanova McKinzy 6 4 10 - - - - - - - 2Jermaine Whitehead 5 1 6 - - - - 1-0 1 - -Kris Frost 3 3 6 - 1.0-2 1 - - - - 2Ryan Smith 4 2 6 - - - - - - - -Totals 41 20 61 3-14 5-19 1 - 1-0 4 - 12
Drive Chart Drive Started Drive Ended ConsumedTeam Qtr Spot Time Obtained Spot Time How Lost Pl-Yds TOPMO 1st M25 15:00 Kickoff M33 13:21 Punt 3-8 1:39 MO 1st A43 11:58 Fumble A24 10:50 Field Goal 5-19 1:08MO 1st M25 8:22 Kickoff A00 5:40 Touchdown 7-75 2:42MO 1st M37 2:24 Missed FG A25 14:56 Interception 7-38 2:28MO 2nd A11 13:11 Fumble A11 13:11 Touchdown 0-0 0:00MO 2nd M25 10:25 Kickoff A17 7:19 Field Goal 9-58 3:06MO 2nd M14 6:20 Kickoff M23 4:26 Punt 3-9 1:54MO 2nd M08 1:10 Punt A00 0:18 Touchdown 6-92 0:52MO 3rd M07 11:43 Punt M19 10:22 Punt 5-12 1:21MO 3rd M25 8:17 Kickoff A00 5:35 Touchdown 7-75 2:42MO 3rd M25 3:21 Kickoff M22 1:57 Punt 3-(-3) 1:24MO 3rd M25 0:31 Kickoff A00 0:09 Touchdown 2-75 0:22MO 4th M25 11:09 Kickoff M15 9:35 Punt 3-(-10) 1:34MO 4th M04 6:13 Punt M13 4:27 Downs 4-9 1:46MO 4th M25 4:22 Kickoff A07 1:46 Downs 9-68 2:36Avg. Starting Field Position: MO 23 Three and Out: 4
Drive Chart Drive Started Drive Ended ConsumedTeam Qtr Spot Time Obtained Spot Time How Lost Pl-Yds TOPAU 1st A41 13:21 Punt A43 11:58 Fumble 4-2 1:23AU 1st A25 10:50 Kickoff M00 8:22 Touchdown 7-75 2:28AU 1st A25 5:40 Kickoff M00 4:09 Touchdown 5-75 1:31AU 1st A42 4:08 Kickoff M37 2:24 Missed FG 5-21 1:44AU 2nd A09 14:56 Interception A11 13:11 Fumble 4-2 1:45AU 2nd A25 13:11 Kickoff M00 10:25 Touchdown 8-75 2:46AU 2nd A21 7:13 Kickoff M00 6:26 Touchdown 4-79 0:47AU 2nd A25 4:26 Punt M44 1:10 Punt 7-31 3:16AU 2nd A27 0:13 Kickoff A25 0:00 End of Half 1-(-2) 0:13AU 3rd A25 15:00 Kickoff M45 11:43 Punt 8-30 3:17AU 3rd M49 10:22 Punt M36 8:17 Field Goal 6-13 2:05 AU 3rd A25 5:35 Kickoff M00 3:21 Touchdown 6-75 2:14AU 3rd A46 1:57 Punt M00 0:31 Touchdown 5-54 1:26AU 3rd A25 0:09 Kickoff M00 11:09 Touchdown 8-75 4:00AU 4th A36 9:35 Punt A50 6:13 Punt 5-14 3:22AU 4th M13 4:27 Downs M00 4:22 Touchdown 1-13 0:05 AU 4th A07 1:46 Downs A19 0:00 End of Half 3-12 1:46Avg. Starting Field Position: AU 32 Three and Out: 4
Scoring SummaryQtr Time Scoring Play Ply-Yds Time MO-AU1st 10:50 MO – Andrew Baggett 42 field goal 5-19 1:08 3-01st 8:22 AU – Sammie Coates 38 pass from Nick Marshall (Cody Parkey kick) 7-75 2:28 3-71st 5:40 MO – Dorial Green-Beckham 28 pass from James Franklin (Andrew Baggett kick) 7-75 2:42 10-71st 4:09 AU – Nick Marshall 9 run (Cody Parkey kick) 5-75 1:31 10-14
2nd 13:11 MO – E.J. Gaines 11 fumble return (Andrew Baggett kick) - - 17-142nd 10:25 AU – Tre Mason 7 run (Cody Parkey kick) 8-75 2:46 17-212nd 7:19 MO – Andrew Baggett 36 field goal 9-58 3:06 20-212nd 6:26 AU – Tre Mason 3 run (Cody Parkey kick) 4-79 0:47 20-282nd 0:18 MO – Dorial Green Beckham 55 pass from James Franklin (Andrew Baggett kick) 6-92 0:52 27-28
3rd 8:17 AU – Cody Parkey 52 field goal 6-13 2:05 27-313rd 5:35 MO – Marcus Murphy 10 pass from James Frankin (Andrew Baggett kick) 7-75 2:42 34-313rd 3:21 AU – Corey Grant 2 run (Cody Parkey kick) 6-75 2:14 34-383rd 0:31 AU – Cameron Artis-Payne 15 run (Cody Parkey kick) 5-54 1:26 34-453rd 0:09 MO – James Franklin 5 run (James Franklin rush) 2-75 0:22 42-45
4th 11:09 AU – Tre Mason 1 run (Cody Parkey kick) 8-75 4:00 42-524th 4:22 AU – Tre Mason 13 run (Cody Parkey kick) 1-13 0:05 42-59

36 SEC Championship Game Record Book
2012 SEC CHAMPIONSHIPAlabama (12-1) 32, Georgia (11-2) 28Dec. 1, 2012 | Atlanta, Ga. (Georgia Dome)Attendance: 75,624 | TV: CBSKickoff Time: 4:11 p.m. | End of Game: 7:53 p.m. | Time of Game: 3:42Officials: Referee: Tom Ritter; Umpire: Casey Moreland; Linesman: Gary Jayroe; Line Judge: M.K. Taylor; Back Judge: Rich Martinez; Field Judge: Brad Freeman; Side Judge: Chuck Russ.
Score by Quarters 1 2 3 4 TotalAlabama 0 10 8 14 32Georgia 0 7 14 7 28
UA UGFIRST DOWNS 26 18Rushing 18 6 Passing 5 12Penalty 3 0NET YARDS RUSHING 350 113Rushing Attempts 51 29 Average Per Rush 6.9 3.9Rushing Touchdowns 3 2Yards Gained Rushing 374 128Yards Lost Rushing 24 15NET YARDS PASSING 162 281Completions-Attempts-Interception 13-21-1 19-34-1Average Per Attempt 7.7 8.3Average Per Completion 12.5 14.8Passing Touchdowns 1 1TOTAL OFFENSIVE YARDS 512 394Total Offensive Plays 72 63Average Gain Per Play 7.1 6.3Fumbles: Number-Lost 3-1 0-0Penalties: Number-Yards 2-15 7-64PUNTS-YARDS 5-209 6-269Average Yards Per Punt 41.8 44.8Net Yards Per Punt 36.4 43.5Inside 20 3 250+ Yards 0 1Touchbacks 1 0Fair Catch 3 3KICKOFFS-YARDS 5-325 5-321Average Yards Per Kickoff 65.0 64.2Net Yards Per Kickoff 45.0 41.4Touchbacks 5 1Punt Returns: Number-Yards-TD 1-8-0 1-7-0Average Per Return 8.0 7.0Kickoff Returns: Number-Yards-TD 4-89-0 0-0-0Average Per Return 22.2 0.0Interception: Number-Yards-TD 1-35-0 1-0-0Fumble Returns: Number-Yards-TD 0-0-0 0-0-1Miscellaneous Yards 0 68Possession Time 37:35 22:251st Quarter 6:47 8:132nd Quarter 10:53 4:073rd Quarter 10:54 4:064th Quarter 9:01 5:59Third-Down Conversions 4 of 12 4 of 12Fourth-Down Conversions 0 of 0 1 of 1Red Zone Scores-Chances 3-4 3-4Touchdowns 2 3Field Goals 1 0Sacks By: Number-Yards 3-15 3-17PAT Kicks 3-3 4-4Field Goals 1-2 0-1
AlabamaRushing No Gain Loss Net TD Lg AvgEddie Lacy 20 187 6 181 2 41 9.1T.J. Yeldon 25 154 1 153 1 31 6.1AJ McCarron 6 33 17 16 0 22 2.7Totals 51 374 24 350 3 41 6.9
Passing C-A-I Yds TD Lg SackAJ McCarron 13-21-1 162 1 45 3
Receiving No Yards TD LgAmari Cooper 7 127 1 45Eddie Lacy 2 7 0 6Michael Williams 2 5 0 3Cyrus Jones 1 1 0 1Totals 13 162 1 45
Punting No Yds Avg Lg In20 TBCody Mandell 5 209 41.8 48 3 1
Punt Kickoff InterceptReturns No-Yds-Lg No-Yds-Lg No-Yds-LgChristion Jones 1-8-8 0-0-0 0-0-0Cyrus Jones 0-0-0 4-89-25 0-0-0Ha Ha Clinton-Dix 0-0-0 0-0-0 1-35-35Totals 1-8-8 4-89-25 1-35-35
Field Goals Qtr Time Dist ResultJeremy Shelley 2nd 0:00 22 goodCade Foster 3rd 6:31 49 blocked
Kickoffs No Yards Avg TB OBCade Foster 5 325 65.0 5 0
All-Purpose Run Rcv KR PR IR TotalEddie Lacy 181 7 0 0 0 188T.J. Yeldon 153 0 0 0 0 153
GeorgiaRushing No Gain Loss Net TD Lg AvgTodd Gurley 23 122 0 122 2 18 5.3Keith Marshall 2 3 0 3 0 2 1.5Aaron Murray 4 3 15 -12 0 3 -3.0Totals 29 128 15 113 2 18 3.9
Passing C-A-I Yds TD Lg SackAaron Murray 18-33-1 265 1 45 3Arthur Lynch 1-1-0 16 0 16 0Totals 19-34-1 281 1 45 3
Receiving No Yards TD LgTavarres King 5 142 0 45Malcolm Mitchell 4 40 0 17Arthur Lynch 3 50 0 26Todd Gurley 3 3 0 4Chris Conley 2 11 0 8Jay Rome 1 19 1 19Sanders Commings 1 16 0 16Totals 19 281 1 45
Punting No Yds Avg Lg In20 TBCollin Barber 6 269 44.8 53 2 0
Punt Kickoff InterceptReturns No-Yds-Lg No-Yds-Lg No-Yds-LgMalcolm Mitchell 1-7-7 0-0-0 0-0-0Sanders Commings 0-0-0 0-0-0 1-0-0Totals 1-7-7 0-0-0 1-0-0
Field Goals Qtr Time Dist ResultMarshall Morgan 1st 6:22 50 missed
Kickoffs No Yards Avg TB OBJamie Lindley 4 256 64.0 1 0Marshall Morgan 1 65 65.0 0 0
All-Purpose Run Rcv KR PR IR TotalTavarres King 0 142 0 0 0 142Todd Gurley 122 3 0 0 0 125
Fumbles: UA-Cyrus Jones 1-0, AJ McCarron 1-1, Eddie Lacy 1-0. UG-none.

37SEC Championship Game Record Book
Defensive LeadersAlabama Solo Ast Total Sacks-Yds TFL-Yds FF FR-Yds Int-Yds BrUp Blks QBHRobert Lester 3 5 8 - 1.0-3 - - - - - -C.J. Mosley 5 2 7 - 1.0-4 - - - - - 1Deion Belue 2 3 5 - - - - - - - -Xzavier Dickson 3 2 5 2.0-7 2.0-7 - - - - - -Totals 34 16 50 3-15 5-22 - - 1-35 5 - 7
Georgia Solo Ast Total Sacks-Yds TFL-Yds FF FR-Yds Int-Yds BrUp Blks QBHAlec Ogletree 9 2 11 - 1.0-1 - - - - - -Shawn Williams 5 4 9 - - - - - - - -Bacarri Rambo 6 2 8 - - - - - 1 - -Damian Swann 4 3 7 - - - - - - - -Totals 41 38 79 3-17 6-24 3 1-0 1-0 3 - 4
Drive Chart Drive Started Drive Ended ConsumedTeam Qtr Spot Time Obtained Spot Time How Lost Pl-Yds TOPUA 1st A25 15:00 Kickoff G48 12:57 Punt 5-27 2:03UA 1st A19 11:42 Punt A40 9:33 Fumble 5-21 2:09UA 1st A33 6:22 Missed FG G49 3:47 Punt 4-18 2:35UA 2nd A24 13:59 Kickoff A14 12:01 Punt 3-(-10) 1:58UA 2nd A18 11:16 Punt G05 6:41 Interception 8-77 4:35UA 2nd A30 5:04 Punt G00 1:59 Touchdown 6-70 3:05UA 2nd G47 1:15 Interception G05 15:00 Field Goal 6-42 1:15UA 3rd A25 12:09 Kickoff G32 6:31 Missed FG 11-43 5:38UA 3rd A23 6:31 Kickoff G00 4:19 Touchdown 4-77 2:12UA 3rd A26 3:04 Punt G00 14:57 Touchdown 7-74 3:07UA 4th A21 12:54 Kickoff A50 7:14 Punt 8-29 5:40UA 4th A45 5:24 Punt G00 3:15 Touchdown 4-55 2:09UA 4th A36 2:17 Punt A44 1:08 Punt 3-8 1:09Avg. Starting Field Position: UA 29 Three and Out: 2
Drive Chart Drive Started Drive Ended ConsumedTeam Qtr Spot Time Obtained Spot Time How Lost Pl-Yds TOPUG 1st G20 12:57 Punt G28 11:42 Punt 3-8 1:15UG 1st A40 9:33 Fumble A33 6:22 Missed FG 8-7 3:11UG 1st G13 3:47 Punt A00 13:59 Touchdown 13-87 4:48UG 2nd A49 12:01 Punt G48 11:16 Punt 3-(-3) 0:45UG 2nd G20 6:41 Interception G24 5:04 Punt 3-4 1:37UG 2nd G25 1:59 Kickoff G49 1:15 Interception 3-24 0:44UG 3rd G25 15:00 Kickoff A00 12:09 Touchdown 9-75 2:51UG 3rd G45 6:31 MIssed FG G45 6:31 Touchdown 0-0 0:00UG 3rd G25 4:19 Kickoff G31 3:04 Punt 3-6 1:15UG 4th G25 14:57 Kickoff A00 12:54 Touchdown 5-75 2:03UG 4th G08 7:14 Punt G17 5:24 Punt 3-9 1:50UG 4th G25 3:15 Kickoff G17 2:17 Punt 3-(-8) 0:58UG 4th G15 1:08 Punt A05 0:00 End of Half 8-80 1:08Avg. Starting Field Position: UG 27 Three and Out: 6
Scoring SummaryQtr Time Scoring Play Ply-Yds Time UA-UG2nd 13:59 UG – Jay Rome 19 pass from Aaron Murray (Marshall Morgan kick) 13-87 4:48 0-72nd 1:59 UA – Eddie Lacy 41 run (Jeremy Shelley kick) 6-70 3:05 7-72nd 0:00 UA – Jeremy Shelley 22 FG 6-42 1:15 10-7
3rd 12:09 UG – Todd Gurley 3 run (Mashall Morgan kick) 9-75 2:51 10-143rd 6:31 UG – Alec Ogletree 55 blocked field goal return (Marshall Morgan kick) 0-0 0:00 10-213rd 4:19 UA – T.J. Yeldon 10 run (T.J. Yeldon rush) 4-77 2:12 18-21
4th 14:57 UA – Eddie Lacy 1 run (Jeremy Shelley kick) 7-74 3:07 25-214th 12:54 UG – Todd Gurley 10 run (Marshall Morgan kick) 5-75 2:03 25-284th 3:15 UA – Amari Cooper 45 pass from AJ McCarron (Jeremy Shelley kick) 4-55 2:09 32-28

38 SEC Championship Game Record Book
2011 SEC CHAMPIONSHIPLSU (13-0) 42, Georgia (10-3) 10Dec. 3, 2011 | Atlanta, Ga. (Georgia Dome)Attendance: 74,515 | TV: CBSKickoff Time: 4:10 p.m. | End of Game: 8:06 p.m. | Time of Game: 3:56Officials: Referee: Matt Austin; Umpire: Wilbur Hackett; Linesman: Lane Thomas; Line Judge: Michael Taylor; Back Judge: Steven Patrick; Field Judge: Blake Parks; Side Judge: Rob Skelton.
Score by Quarters 1 2 3 4 TotalGeorgia 10 0 0 0 10LSU 0 7 21 14 42
UG LSUFIRST DOWNS 19 13Rushing 5 11Passing 11 1Penalty 3 1NET YARDS RUSHING 78 207Rushing Attempts 34 35Average Per Rush 2.3 5.9Rushing Touchdowns 0 3Yards Gained Rushing 115 231Yards Lost Rushing 37 24NET YARDS PASSING 218 30Completions-Attempts-Int 20-51-2 5-13-0Average Per Attempt 4.3 2.3Average Per Completion 10.9 6.0Passing Touchdowns 1 1TOTAL OFFENSIVE YARDS 296 237Total Offensive Plays 85 48Average Gain Per Play 3.5 4.9Fumbles: Number-Lost 4-1 0-0Penalties: Number-Yards 9-87 8-54PUNTS-YARDS 8-413 8-403Average Yards Per Punt 51.6 50.4Net Yards Per Punt 35.8 47.9Inside 20 3 250+ Yards 5 6Touchbacks 0 1Fair Catch 0 2KICKOFFS-YARDS 2-140 7-474Average Yards Per Kickoff 70.0 67.7Net Yards Per Kickoff 55.0 49.0Touchbacks 0 2Punt Returns: Number-Yards-TD 4-0-0 6-127-1Average Per Return 0.0 21.2Kickoff Returns: Number-Yards-TD 5-91-0 2-30-0Average Per Return 18.2 15.0Interception: Number-Yards-TD 0-0-0 2-45-1Fumble Returns: Number-Yards-TD 0-0-0 0-0-0 Miscellaneous Yards 0 0Possession Time 36:36 23:241st Quarter 10:21 4:392nd Quarter 9:32 5:283rd Quarter 7:33 7:274th Quarter 9:10 5:50Third-Down Conversions 7 of 21 1 of 9Fourth-Down Conversions 1 of 2 0 of 0Red Zone Scores-Chances 1-2 3-3Touchdowns 1 3Field Goals 0 0Sacks By: Number-Yards 2-23 4-32PAT Kicks 1-1 6-6Field Goals 1-2 0-0
GeorgiaRushing No Gain Loss Net TD Lg AvgKen Malcome 5 37 0 37 0 9 7.4Carlton Thomas 7 28 0 28 0 16 4.0Isaiah Crowell 10 18 3 15 0 11 1.5Alec Ogletree 1 3 0 3 0 3 3.0Hutson Mason 1 2 0 2 0 2 2.0TEAM 1 0 1 -1 0 0 -1.0Malcolm Mitchell 1 0 1 -1 0 0 -1.0Aaron Murray 8 27 32 -5 0 9 -0.6Totals 34 115 37 78 0 16 2.3
Passing C-A-I Yds TD Lg SackAaron Murray 16-40-2 163 1 44 4Hutson Mason 4-11-0 55 0 21 0Totals 20-51-2 218 1 44 4
Receiving No Yards TD LgOrson Charles 4 42 0 19Malcolm Mitchell 4 32 0 13Tavarres King 3 59 0 44Chris Conley 3 40 0 21Rhett McGowan 2 22 0 12Ken Malcome 1 17 0 17Aron White 1 12 1 12Carlton Thomas 1 -3 0 -Isaiah Crowell 1 -3 0 -Totals 20 218 1 44
Punting No Yds Avg Lg In20 TBDrew Butler 8 413 51.6 62 3 0
Punt Kickoff InterceptReturns No-Yds-Lg No-Yds-Lg No-Yds-LgBrandon Boykin 4-0-0 3-49-23 0-0-0Branden Smith 0-0-0 2-42-25 0-0-0Totals 4-0-0 5-91-25 0-0-0
Field Goals Qtr Time Dist ResultBlair Walsh 1st 11:45 40 goodBlair Walsh 1st 7:34 45 missed
Kickoffs No Yards Avg TB OBBrandon Bogotay 1 70 70.0 0 0Blair Walsh 1 70 70.0 0 0Totals 2 140 70.0 0 0
All-Purpose Run Rcv KR PR IR TotalTavarres King 0 59 0 0 0 59
LSURushing No Gain Loss Net TD Lg AvgAlfred Blue 8 94 0 94 1 48 11.8Kenny Hilliard 8 72 0 72 2 17 9.0Michael Ford 6 34 0 34 0 11 5.7Spencer Ware 6 13 0 13 0 4 2.2Team 1 0 1 -1 0 0 -1.0Jordan Jefferson 6 18 23 -5 0 7 -0.8Totals 35 231 24 207 3 48 5.9
Passing C-A-I Yds TD Lg SackJordan Jefferson 5-13-0 30 1 9 2
Receiving No Yards TD LgRueben Randle 2 15 0 9Spencer Ware 1 9 0 9Kenny Hilliard 1 8 1 8Alfred Blue 1 -2 0 -Totals 5 30 1 9
Punting No Yds Avg Lg In20 TBBrad Wing 8 403 50.4 67 2 1
Punt Kickoff InterceptReturns No-Yds-Lg No-Yds-Lg No-Yds-LgTyrann Mathieu 4-119-62 0-0-0 0-0-0Odell Beckham, Jr. 2-8-7 0-0-0 0-0-0Morris Claiborne 0-0-0 2-30-15 1-45-45Tharold Simon 0-0-0 0-0-0 1-0-0Totals 6-127-62 2-30-15 2-45-45

39SEC Championship Game Record Book
Field Goals Qtr Time Dist ResultNone
Kickoffs No Yards Avg TB OBJames Hairston 7 474 67.7 2 0
All-Purpose Run Rcv KR PR IR TotalTyrann Mathieu 0 0 0 119 0 119
Fumbles: Georgia-Brandon Boykin 2-0; Carlton Thomas 1-0; Aaron Murray 1-1. LSU-None.
Defensive LeadersGeorgia Solo Ast Total Sacks-Yds TFL-Yds FF FR-Yds Int-Yds BrUp Blks QBHAlec Ogletree 5 1 6 1.0-17 1.0-17 - - - - - -Shawn Williams 4 1 5 - - - - - - - -Bacarri Rambo 4 1 5 - - - - - - - -Brandon Boykin 3 1 4 - 1.0-2 - - - 2 - -Totals 31 18 49 1-17 3-25 0 0 0 2 0 3
LSU Solo Ast Total Sacks-Yds TFL-Yds FF FR-Yds Int-Yds BrUp Blks QBHEric Reid 5 2 7 - - - - - - - -Michael Brockers 6 0 6 - 2.0-4 1 - - 1 - -Kevin MInterceptioner 4 2 6 - - - - - 1 - -Bennie Logan 5 0 5 - - 1 - - - - -Tyrann Mathieu 4 0 4 - 1.0-3 - 1-0 - - - 1Totals 48 16 64 4-32 9-42 2 1-0 2-45 8 0 10
Drive Chart Drive Started Drive Ended ConsumedTeam Qtr Spot Time Obtained Spot Time How Lost Pl-Yds TOPUG 1st G38 13:53 Punt L22 11:45 Field Goal 6-40 2:08UG 1st G49 11:45 Kickoff L27 7:34 Missed FG 9-24 4:11UG 1st G20 6:02 Punt G30 4:30 Punt 4-10 1:32UG 1st L44 3:12 Punt L00 0:42 Touchdown 6-44 2:30UG 2nd G27 13:29 Punt G35 9:40 Punt 6-8 3:49UG 2nd G13 8:15 Punt G03 5:48 Punt 3-(-10) 2:27UG 2nd G18 5:48 Kickoff G41 3:46 Punt 5-23 2:02UG 2nd G30 1:42 Punt G26 0:47 Punt 3-(-4) 0:55UG 2nd G26 0:19 Punt G25 0:00 End of Half 1-(-1) 0:19UG 3rd G17 15:00 Kickoff G27 13:31 Fumble 3-10 1:29UG 3rd G14 12:51 Kickoff G21 11:53 Punt 3-7 0:58UG 3rd G20 10:37 Kickoff G30 8:08 Interception 4-10 2:29UG 3rd G23 3:45 Kickoff G31 1:08 Punt 6-8 2:37UG 4th G15 11:32 Punt G40 8:08 Punt 8-25 3:24UG 4th G15 6:17 Kickoff G39 4:21 Interception 6-24 1:56UG 4th G20 4:21 Kickoff L10 0:31 Downs 14-70 3:50Avg. Starting Field Position: UG25 Three and Out: 3
Drive Chart Drive Started Drive Ended ConsumedTeam Qtr Spot Time Obtained Spot Time How Lost Pl-Yds TOPLSU 1st L15 15:00 Kickoff L12 13:53 Punt 3-(-3) 1:07LSU 1st L28 7:34 Missed FG L36 6:02 Punt 3-8 1:32LSU 1st L08 4:30 Punt L06 3:12 Punt 3-(-2) 1:18LSU 1st L08 0:42 Kickoff L17 13:29 Punt 3-9 2:13LSU 2nd L20 9:40 Punt L20 8:15 Punt 3-0 1:25LSU 2nd G00 5:48 Punt G00 5:48 Touchdown 0-0 0:00LSU 2nd L11 3:46 Punt L20 1:42 Punt 3-9 2:04LSU 2nd L33 0:47 Punt L20 0:19 Punt 3-(-13) 0:28LSU 3rd G26 13:31 Fumble G00 12:51 Touchdown 2-26 0:40LSU 3rd G17 11:53 Punt G00 10:37 Touchdown 4-17 1:16LSU 3rd L30 8:08 Interception G00 3:45 Touchdown 10-70 4:23LSU 3rd L25 1:08 Punt G39 11:32 Punt 6-36 4:36LSU 4th L07 8:08 Punt G00 6:17 Touchdown 4-93 1:51LSU 4th G00 4:21 Interception G00 4:21 Touchdown 0-0 0:00LSU 4th L10 0:31 Downs L09 0:00 End of Half 1-(-1) 0:31Avg. Starting Field Position: LSU27 Three and Out: 7
Scoring SummaryQtr Time Scoring Play Ply-Yds Time UG-LSU1st 11:45 UG-Blair Walsh 40 field goal 6-40 2:08 3-01st 0:42 UG-Aron White 12 pass from Aaron Murray (Blair Walsh kick) 6-44 2:30 10-02nd 5:48 LSU-Tyrann Mathieu 62 punt return (Drew Alleman kick) - - 10-73rd 12:51 LSU-Kenny Hilliard 15 run (Drew Alleman kick) 2-26 0:40 10-143rd 10:37 LSU-Kenny Hilliard 4 run (Drew Alleman kick) 4-17 1:16 10-213rd 3:45 LSU-Kenny Hilliard 8 pass from Jordan Jefferson (Drew Alleman kick) 10-70 4:23 10-284th 6:17 LSU-Alfred Blue 48 run (Drew Alleman kick) 4-93 1:51 10-354th 4:21 LSU-Morris Claiborne 45 interception return (Drew Alleman kick) - - 10-42
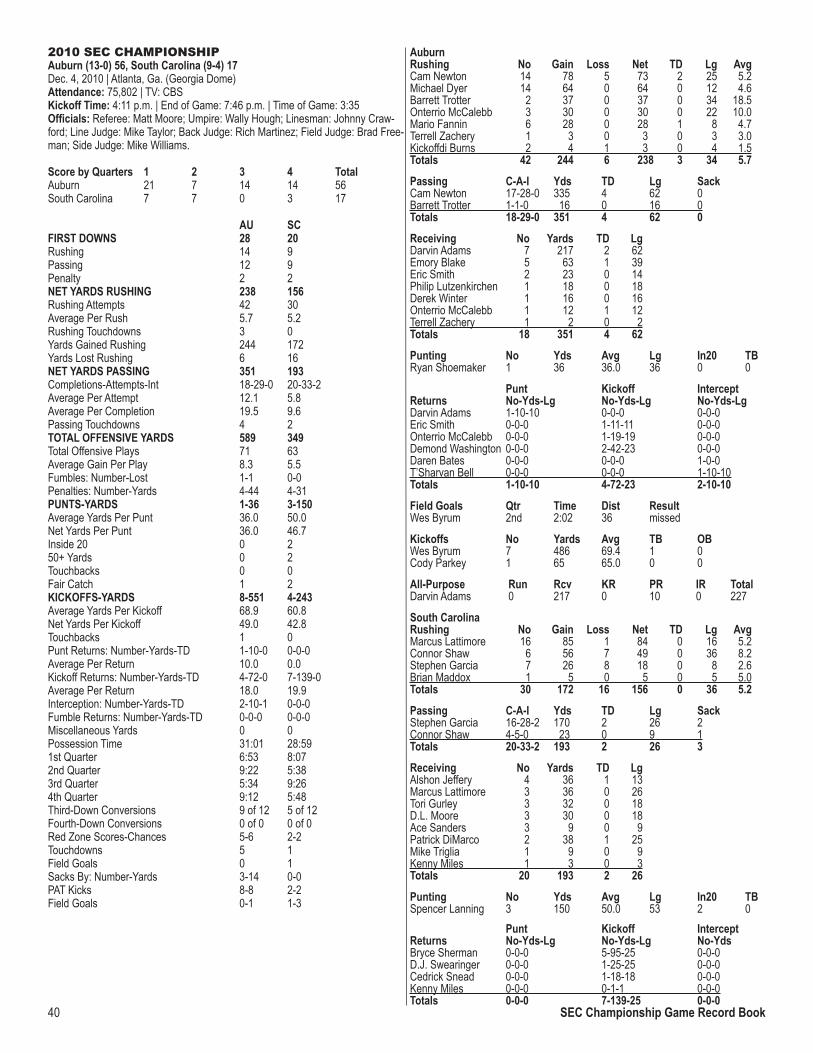
40 SEC Championship Game Record Book
2010 SEC CHAMPIONSHIPAuburn (13-0) 56, South Carolina (9-4) 17Dec. 4, 2010 | Atlanta, Ga. (Georgia Dome)Attendance: 75,802 | TV: CBSKickoff Time: 4:11 p.m. | End of Game: 7:46 p.m. | Time of Game: 3:35Officials: Referee: Matt Moore; Umpire: Wally Hough; Linesman: Johnny Craw-ford; Line Judge: Mike Taylor; Back Judge: Rich Martinez; Field Judge: Brad Free-man; Side Judge: Mike Williams.
Score by Quarters 1 2 3 4 TotalAuburn 21 7 14 14 56South Carolina 7 7 0 3 17
AU SCFIRST DOWNS 28 20Rushing 14 9Passing 12 9Penalty 2 2NET YARDS RUSHING 238 156Rushing Attempts 42 30Average Per Rush 5.7 5.2Rushing Touchdowns 3 0Yards Gained Rushing 244 172Yards Lost Rushing 6 16NET YARDS PASSING 351 193Completions-Attempts-Int 18-29-0 20-33-2Average Per Attempt 12.1 5.8Average Per Completion 19.5 9.6Passing Touchdowns 4 2TOTAL OFFENSIVE YARDS 589 349Total Offensive Plays 71 63Average Gain Per Play 8.3 5.5Fumbles: Number-Lost 1-1 0-0Penalties: Number-Yards 4-44 4-31PUNTS-YARDS 1-36 3-150Average Yards Per Punt 36.0 50.0Net Yards Per Punt 36.0 46.7Inside 20 0 250+ Yards 0 2Touchbacks 0 0Fair Catch 1 2KICKOFFS-YARDS 8-551 4-243Average Yards Per Kickoff 68.9 60.8Net Yards Per Kickoff 49.0 42.8Touchbacks 1 0Punt Returns: Number-Yards-TD 1-10-0 0-0-0Average Per Return 10.0 0.0Kickoff Returns: Number-Yards-TD 4-72-0 7-139-0Average Per Return 18.0 19.9Interception: Number-Yards-TD 2-10-1 0-0-0Fumble Returns: Number-Yards-TD 0-0-0 0-0-0Miscellaneous Yards 0 0Possession Time 31:01 28:591st Quarter 6:53 8:072nd Quarter 9:22 5:383rd Quarter 5:34 9:264th Quarter 9:12 5:48Third-Down Conversions 9 of 12 5 of 12Fourth-Down Conversions 0 of 0 0 of 0Red Zone Scores-Chances 5-6 2-2Touchdowns 5 1Field Goals 0 1Sacks By: Number-Yards 3-14 0-0PAT Kicks 8-8 2-2Field Goals 0-1 1-3
AuburnRushing No Gain Loss Net TD Lg AvgCam Newton 14 78 5 73 2 25 5.2Michael Dyer 14 64 0 64 0 12 4.6Barrett Trotter 2 37 0 37 0 34 18.5Onterrio McCalebb 3 30 0 30 0 22 10.0Mario Fannin 6 28 0 28 1 8 4.7Terrell Zachery 1 3 0 3 0 3 3.0Kickoffdi Burns 2 4 1 3 0 4 1.5Totals 42 244 6 238 3 34 5.7
Passing C-A-I Yds TD Lg SackCam Newton 17-28-0 335 4 62 0Barrett Trotter 1-1-0 16 0 16 0Totals 18-29-0 351 4 62 0
Receiving No Yards TD LgDarvin Adams 7 217 2 62Emory Blake 5 63 1 39Eric Smith 2 23 0 14Philip Lutzenkirchen 1 18 0 18Derek Winter 1 16 0 16Onterrio McCalebb 1 12 1 12Terrell Zachery 1 2 0 2Totals 18 351 4 62
Punting No Yds Avg Lg In20 TBRyan Shoemaker 1 36 36.0 36 0 0
Punt Kickoff InterceptReturns No-Yds-Lg No-Yds-Lg No-Yds-LgDarvin Adams 1-10-10 0-0-0 0-0-0Eric Smith 0-0-0 1-11-11 0-0-0Onterrio McCalebb 0-0-0 1-19-19 0-0-0Demond Washington 0-0-0 2-42-23 0-0-0Daren Bates 0-0-0 0-0-0 1-0-0T’Sharvan Bell 0-0-0 0-0-0 1-10-10Totals 1-10-10 4-72-23 2-10-10
Field Goals Qtr Time Dist ResultWes Byrum 2nd 2:02 36 missed
Kickoffs No Yards Avg TB OBWes Byrum 7 486 69.4 1 0Cody Parkey 1 65 65.0 0 0
All-Purpose Run Rcv KR PR IR TotalDarvin Adams 0 217 0 10 0 227
South CarolinaRushing No Gain Loss Net TD Lg AvgMarcus Lattimore 16 85 1 84 0 16 5.2Connor Shaw 6 56 7 49 0 36 8.2Stephen Garcia 7 26 8 18 0 8 2.6Brian Maddox 1 5 0 5 0 5 5.0Totals 30 172 16 156 0 36 5.2
Passing C-A-I Yds TD Lg SackStephen Garcia 16-28-2 170 2 26 2Connor Shaw 4-5-0 23 0 9 1Totals 20-33-2 193 2 26 3
Receiving No Yards TD LgAlshon Jeffery 4 36 1 13Marcus Lattimore 3 36 0 26Tori Gurley 3 32 0 18D.L. Moore 3 30 0 18Ace Sanders 3 9 0 9Patrick DiMarco 2 38 1 25Mike Triglia 1 9 0 9Kenny Miles 1 3 0 3Totals 20 193 2 26
Punting No Yds Avg Lg In20 TBSpencer Lanning 3 150 50.0 53 2 0 Punt Kickoff InterceptReturns No-Yds-Lg No-Yds-Lg No-YdsBryce Sherman 0-0-0 5-95-25 0-0-0D.J. Swearinger 0-0-0 1-25-25 0-0-0Cedrick Snead 0-0-0 1-18-18 0-0-0Kenny Miles 0-0-0 0-1-1 0-0-0Totals 0-0-0 7-139-25 0-0-0

41SEC Championship Game Record Book
Field Goals Qtr Time Dist ResultSpencer Lanning 2nd 8:09 51 missedSpencer Lanning 3rd 10:05 42 missedSpencer Lanning 4th 7:48 33 good
Kickoffs No Yards Avg TB OBJay Wooten 4 243 60.8 0 0
All-Purpose Run Rcv KR PR IR TotalMarcus Lattimore 84 36 0 0 0 120
Fumbles: AU-Cam Newton 1-1. SC-None.
Defensive LeadersAuburn Solo Ast Total Sacks-Yds TFL-Yds FF FR-Yds Int-Yds BrUp Blks QBHT’Sharvan Bell 6 3 9 - - - - 1-10 - - -Zac Etheridge 3 4 7 - 0.5-1 - - - - - -Daren Bates 3 3 6 - - - - 1-0 - - 1Mike McNeil 2 3 5 - - - - - 1 - -Totals 39 28 67 3-14 6-18 0 0-0 2-10 2 0 10
South Carolina Solo Ast Total Sacks-Yds TFL-Yds FF FR-Yds Int-Yds BrUp Blks QBHAntonio Allen 3 5 8 - 0.5-1 - - - - - 4Cliff Matthews 4 3 7 - - 1 - - - - 1Quin Smith 4 3 7 - 1.0-1 - - - - - 1Akeem Auguste 3 3 6 - - - - - - - -Totals 40 24 64 0-0 4-6 1 1-0 0-0 3 0 11
Drive Chart Drive Started Drive Ended ConsumedTeam Qtr Spot Time Obtained Spot Time How Lost Pl-Yds TOPAU 1st A23 15:00 Kickoff S00 13:20 Touchdown 4-77 1:40AU 1st A26 9:53 Kickoffff S00 5:31 Touchdown 12-74 4:22AU 1st A24 3:00 Punt S00 2:09 Touchdown 4-74 0:51AU 2nd A17 14:52 Punt A34 12:54 Fumble 6-17 1:58AU 2nd A24 12:40 Interception A27 11:39 Punt 3-3 1:01AU 2nd A34 8:09 Missed FG S18 2:02 Missed FG 12-48 6:07AU 2nd A41 0:16 Kickoff S00 0:00 Touchdown 2-59 0:16AU 3rd A25 10:05 Missed FG S00 7:56 Touchdown 7-75 2:09AU 3rd S00 7:23 Interception S00 7:23 Touchdown 0-0 0:00AU 3rd A09 3:25 Punt S00 11:14 Touchdown 13-91 7:11AU 4th A19 7:48 Kickoff S00 2:22 Touchdown 9-81 5:26Avg. Starting Field Position: AU24 Three and Out: 1
Drive Chart Drive Started Drive Ended ConsumedTeam Qtr Spot Time Obtained Spot Time How Lost Pl-Yds TOPSC 1st S25 13:20 Kickoff A00 9:53 Touchdown 7-75 3:27SC 1st S19 5:31 Kickoff S33 3:00 Punt 5-14 2:31SC 1st S24 2:09 Kickoff S32 14:52 Punt 3-8 2:17SC 2nd A34 12:54 Fumble A34 12:40 Interception 2-0 0:14SC 2nd S37 11:39 Punt A34 8:09 Missed FG 7-29 3:30SC 2nd S20 2:02 Missed FG A00 0:16 Touchdown 9-80 1:46SC 3rd S25 15:00 Kickoff A25 10:05 Missed FG 11-50 4:55SC 3rd S20 7:56 Kickoff S22 7:23 Interception 3-2 0:33SC 3rd S21 7:23 Kickoff S45 3:25 Punt 6-24 3:58SC 4th S11 11:14 Kickoff A15 7:48 Field Goal 8-74 3:26SC 4th S23 2:22 Kickoff S41 0:00 End of Half 5-18 2:22Avg. Starting Field Position: SC26 Three and Out: 1
Scoring SummaryQtr Time Scoring Play Ply-Yds Time AU-SC1st 13:20 AU – Onterrio McCalebb 12 pass from Cam Newton (Wes Byrum kick) 4-77 1:40 7-01st 9:53 SC – Patrick DiMarco 25 pass from Stephen Garcia (Spencer Lanning kick) 7-75 3:27 7-71st 5:31 AU – Cam Newton 5 run (Wes Byrum kick) 12-74 4:22 14-71st 2:09 AU – Darvin Adams 54 pass from Cam Newton (Wes Byrum kick) 4-76 0:51 21-7
2nd 0:16 SC – Alshon Jeffery 1 pass from Stephen Garcia (Spencer Lanning kick) 9-80 1:46 21-142nd 0:00 AU – Darvin Adams 51 pass from Cam Newton (Wes Byrum kick) 2-59 0:16 28-14
3rd 7:56 AU – Cam Newton 1 run (Wes Byrum kick) 7-75 2:09 35-143rd 7:23 AU – T’Sharvan Bell 10 interception return (Wes Byrum kick) - - 42-14
4th 11:14 AU – Emory Blake 7 pass from Cam Newton (Wes Byrum kick) 13-91 7:11 49-144th 7:48 SC – Spencer Lanning 33 field goal 8-74 3:26 49-174th 2:22 AU – Mario Fannin 6 run (Wes Byrum kick) 9-81 5:26 56-17

42 SEC Championship Game Record Book
2009 SEC CHAMPIONSHIPAlabama (13-0) 32, Florida (12-1) 13Dec. 5, 2009 | Atlanta, Ga. (Georgia Dome)Attendance: 75,514 | TV: CBSKickoff Time: 4:12 p.m. | End of Game: 7:39 p.m. | Time of Game: 3:27Officials: Referee: Matt Austin; Umpire: Wilbur Hackett; Linesman: Allama Mat-thews; Line Judge: Terry Walters; Back Judge: Stan Murray; Field Judge: Bobby Aillet; Side Judge: Bobby Moreau.
Score by Quarters 1 2 3 4 TotalFlorida 3 10 0 0 13Alabama 9 10 7 6 32
UF UAFIRST DOWNS 13 26Rushing 4 14Passing 9 10Penalty 0 2NET YARDS RUSHING 88 251Rushing Attempts 14 53Average Per Rush 6.3 4.7Rushing Touchdowns 0 3Yards Gained Rushing 92 272Yards Lost Rushing 4 21NET YARDS PASSING 247 239Completions-Attempts-Int 20-35-1 12-18-0Average Per Attempt 7.1 13.3Average Per Completion 12.4 19.9Passing Touchdowns 1 1TOTAL OFFENSIVE YARDS 335 490Total Offensive Plays 49 71Average Gain Per Play 6.8 6.9Fumbles: Number-Lost 0-0 1-0Penalties: Number-Yards 5-51 1-5PUNTS-YARDS 4-195 2-83Average Yards Per Punt 48.8 41.5Net Yards Per Punt 46.8 35.5Inside 20 2 050+ Yards 2 0Touchbacks 0 0Fair Catch 1 1KICKOFFS-YARDS 4-277 7-478Average Yards Per Kickoff 69.2 68.3Net Yards Per Kickoff 44.5 42.4Touchbacks 1 1Punt Returns: Number-Yards-TD 1-12-0 1-8-0Average Per Return 12.0 8.0Kickoff Returns: Number-Yards-TD 6-161-0 3-79-0Average Per Return 26.8 26.3Interceptions: Number-Yards-TD 0-0-0 1-0-0Fumble Returns: Number-Yards-TD 0-0-0 0-0-0Miscellaneous Yards 0 0Possession Time 20:23 39:371st Quarter 6:13 8:472nd Quarter 5:22 9:383rd Quarter 4:36 10:244th Quarter 4:12 10:48Third-Down Conversions 4 of 11 11 of 15Fourth-Down Conversions 0 of 1 0 of 0Red Zone Scores-Chances 1-3 5-6Touchdowns 0 4Field Goals 1 1Sacks By: Number-Yards 1-10 0-0PAT Kicks 1-1 2-3Field Goals 2-2 2-2
FloridaRushing No Gain Loss Net TD Lg AvgTim Tebow 10 66 3 63 0 23 6.3Jeff Demps 1 9 0 9 0 9 9.0Brandon James 1 9 0 9 0 9 9.0Chris Rainey 2 8 1 7 0 8 3.5Totals 14 92 4 88 0 23 6.3
Passing C-A-I Yds TD Lg SackTim Tebow 20-35-1 247 1 59 0
Receiving No Yards TD LgAaron Hernandez 8 85 0 38David Nelson 4 53 1 23Riley Cooper 3 77 0 59Deonte Thompson 2 22 0 19Brandon James 1 9 0 9Omarius Hines 1 4 0 4Emmanuel Moody 1 -3 0 0Totals 20 247 1 59
Punting No Yds Avg Lg In20 TBChas Henry 4 195 48.8 57 2 0
Punt Kickoff InterceptReturns No-Yds-Lg No-Yds-Lg No-Yds-LgBrandon James 1-12-12 3-78-26 0-0-0Chris Rainey 0-0-0 1-28-28 0-0-0Jeff Demps 0-0-0 2-55-28 0-0-0Totals 1-12-12 6-161-28 0-0-0
Field Goals Qtr Time Dist ResultCaleb Sturgis 1st 0:28 48 goodCaleb Sturgis 2nd 1:18 32 good
Kickoffs No Yards Avg TB OBCaleb Sturgis 4 277 69.2 1 0
All-Purpose Run Rcv KR PR IR TotalBrandon James 9 9 78 12 0 108
AlabamaRushing No Gain Loss Net TD Lg AvgMark Ingram 28 115 2 113 3 15 4.0Trent Richardson 11 80 0 80 0 25 7.3Roy Upchurch 7 57 0 57 0 29 8.1Greg McElroy 4 20 10 10 0 8 2.5Team 3 0 9 -9 0 0 -3.0Totals 53 272 21 251 3 29 4.7
Passing C-A-I Yds TD Lg SackGreg McElroy 12-18-0 239 1 69 1
Receiving No Yards TD LgMarquis Maze 5 96 0 34Colin Peek 3 39 1 19Mark Ingram 2 76 0 69Julio Jones 2 28 0 18Totals 12 239 1 69
Punting No Yds Avg Lg In20 TBP.J. Fitzgerald 2 83 41.5 43 0 0 Punt Kickoff InterceptReturns No-Yds-Lg No-Yds-Lg No-YdsJavier Arenas 1-8-8 3-79-32 1-0-0
Field Goals Qtr Time Dist ResultLeigh Tiffin 1st 10:37 48 goodLeigh Tiffin 2nd 6:03 34 good
Kickoffs No Yards Avg TB OBLeigh Tiffin 7 478 68.3 1 0
All-Purpose Run Rcv KR PR IR TotalMark Ingram 113 76 0 0 0 189
Fumbles: Florida - None. Alabama - Team 1-0.
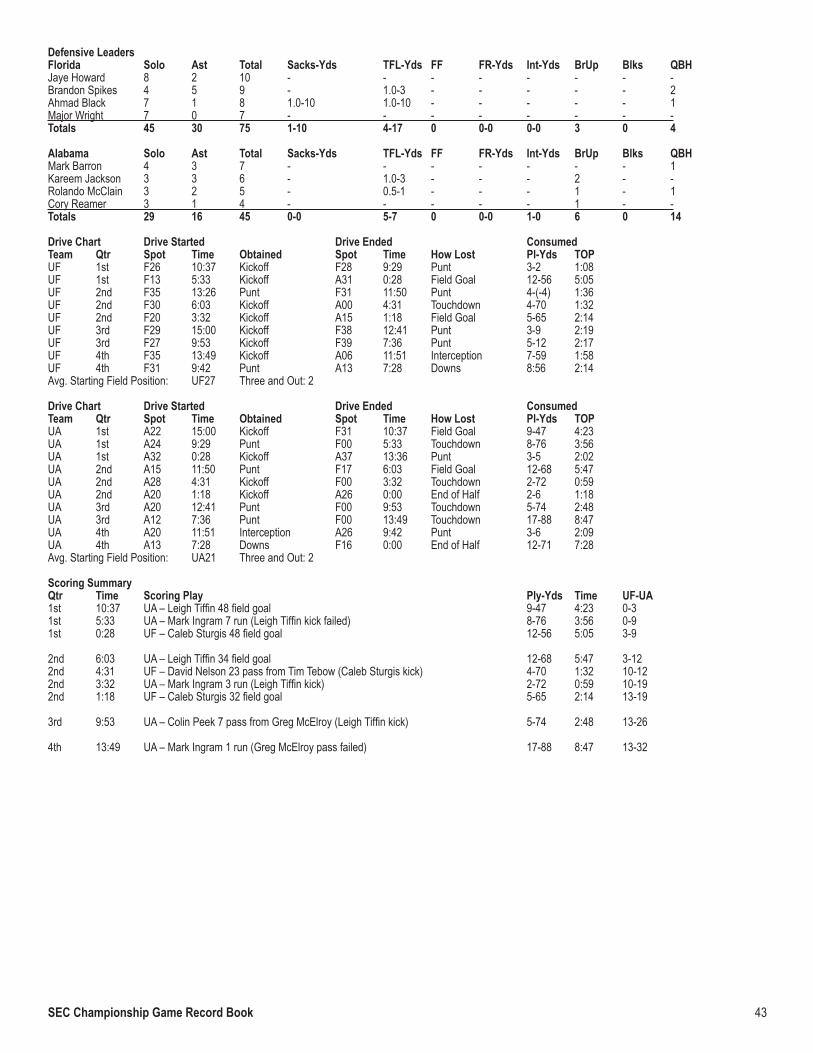
43SEC Championship Game Record Book
Defensive LeadersFlorida Solo Ast Total Sacks-Yds TFL-Yds FF FR-Yds Int-Yds BrUp Blks QBHJaye Howard 8 2 10 - - - - - - - -Brandon Spikes 4 5 9 - 1.0-3 - - - - - 2Ahmad Black 7 1 8 1.0-10 1.0-10 - - - - - 1Major Wright 7 0 7 - - - - - - - -Totals 45 30 75 1-10 4-17 0 0-0 0-0 3 0 4
Alabama Solo Ast Total Sacks-Yds TFL-Yds FF FR-Yds Int-Yds BrUp Blks QBHMark Barron 4 3 7 - - - - - - - 1Kareem Jackson 3 3 6 - 1.0-3 - - - 2 - -Rolando McClain 3 2 5 - 0.5-1 - - - 1 - 1Cory Reamer 3 1 4 - - - - - 1 - -Totals 29 16 45 0-0 5-7 0 0-0 1-0 6 0 14
Drive Chart Drive Started Drive Ended ConsumedTeam Qtr Spot Time Obtained Spot Time How Lost Pl-Yds TOPUF 1st F26 10:37 Kickoff F28 9:29 Punt 3-2 1:08UF 1st F13 5:33 Kickoff A31 0:28 Field Goal 12-56 5:05UF 2nd F35 13:26 Punt F31 11:50 Punt 4-(-4) 1:36UF 2nd F30 6:03 Kickoff A00 4:31 Touchdown 4-70 1:32UF 2nd F20 3:32 Kickoff A15 1:18 Field Goal 5-65 2:14UF 3rd F29 15:00 Kickoff F38 12:41 Punt 3-9 2:19UF 3rd F27 9:53 Kickoff F39 7:36 Punt 5-12 2:17UF 4th F35 13:49 Kickoff A06 11:51 Interception 7-59 1:58UF 4th F31 9:42 Punt A13 7:28 Downs 8:56 2:14Avg. Starting Field Position: UF27 Three and Out: 2
Drive Chart Drive Started Drive Ended ConsumedTeam Qtr Spot Time Obtained Spot Time How Lost Pl-Yds TOPUA 1st A22 15:00 Kickoff F31 10:37 Field Goal 9-47 4:23UA 1st A24 9:29 Punt F00 5:33 Touchdown 8-76 3:56UA 1st A32 0:28 Kickoff A37 13:36 Punt 3-5 2:02UA 2nd A15 11:50 Punt F17 6:03 Field Goal 12-68 5:47UA 2nd A28 4:31 Kickoff F00 3:32 Touchdown 2-72 0:59UA 2nd A20 1:18 Kickoff A26 0:00 End of Half 2-6 1:18UA 3rd A20 12:41 Punt F00 9:53 Touchdown 5-74 2:48UA 3rd A12 7:36 Punt F00 13:49 Touchdown 17-88 8:47UA 4th A20 11:51 Interception A26 9:42 Punt 3-6 2:09UA 4th A13 7:28 Downs F16 0:00 End of Half 12-71 7:28Avg. Starting Field Position: UA21 Three and Out: 2
Scoring SummaryQtr Time Scoring Play Ply-Yds Time UF-UA1st 10:37 UA – Leigh Tiffin 48 field goal 9-47 4:23 0-31st 5:33 UA – Mark Ingram 7 run (Leigh Tiffin kick failed) 8-76 3:56 0-91st 0:28 UF – Caleb Sturgis 48 field goal 12-56 5:05 3-9
2nd 6:03 UA – Leigh Tiffin 34 field goal 12-68 5:47 3-122nd 4:31 UF – David Nelson 23 pass from Tim Tebow (Caleb Sturgis kick) 4-70 1:32 10-122nd 3:32 UA – Mark Ingram 3 run (Leigh Tiffin kick) 2-72 0:59 10-192nd 1:18 UF – Caleb Sturgis 32 field goal 5-65 2:14 13-19
3rd 9:53 UA – Colin Peek 7 pass from Greg McElroy (Leigh Tiffin kick) 5-74 2:48 13-26
4th 13:49 UA – Mark Ingram 1 run (Greg McElroy pass failed) 17-88 8:47 13-32

44 SEC Championship Game Record Book
2008 SEC CHAMPIONSHIPFlorida (12-1) 31, Alabama (12-1) 20Dec. 6, 2008 | Atlanta, Ga. (Georgia Dome)Attendance: 75,892 | TV: CBSKickoff Time: 4:13 p.m. | End of Game: 7:26 p.m. | Time of Game: 3:13Officials: Referee: Thomas Ritter; Umpire: Russ Pulley; Linesman: Gus Morris; Line Judge: Julian Mapp; Back Judge: Dale Keneipp; Field Judge: Richard Morales; Side Judge: Chris Conley.
Score by Quarters 1 2 3 4 TotalAlabama 10 0 10 0 20Florida 7 10 0 14 31
UA UFFIRST DOWNS 18 19Rushing 11 9Passing 7 8Penalty 0 2NET YARDS RUSHING 136 142Rushing Attempts 33 42Average Per Rush 4.1 3.4Rushing Touchdowns 2 1Yards Gained Rushing 147 151Yards Lost Rushing 11 9NET YARDS PASSING 187 216Completions-Attempts-Int 12-25-1 14-22-0Average Per Attempt 7.5 9.8Average Per Completion 15.6 15.4Passing Touchdowns 0 3TOTAL OFFENSIVE YARDS 323 358Total Offensive Plays 58 64Average Gain Per Play 5.6 5.6Fumbles: Number-Lost 0-0 0-0Penalties: Number-Yards 2-31 6-45PUNTS-YARDS 4-164 3-143Average Yards Per Punt 41.0 47.7Net Yards Per Punt 34.8 41.0Inside 20 0 150+ Yards 0 1Touchbacks 0 0Fair Catch 1 1KICKOFFS-YARDS 5-335 6-412Average Yards Per Kickoff 67.0 68.7Net Yards Per Kickoff 42.8 49.5Touchbacks 0 1Punt Returns: Number-Yards-TD 2-20-0 3-25-0Average Per Return 10.0 8.3Kickoff Returns: Number-Yards-TD 4-95-0 5-121-0Average Per Return 23.8 24.2Interceptions: Number-Yards-TD 0-0-0 1-24-0Fumble Returns: Number-Yards-TD 0-0-0 0-0-0Miscellaneous Yards 0 0Possession Time 27:56 32:041st Quarter 7:43 7:172nd Quarter 6:35 8:253rd Quarter 10:33 4:274th Quarter 3:05 11:55Third-Down Conversions 5 of 12 7 of 13Fourth-Down Conversions 0 of 1 0 of 0Red Zone Scores-Chances 4-4 5-6Touchdowns 2 4Field Goals 2 1Sacks By: Number-Yards 1-2 1-11PAT Kicks 2-2 4-4Field Goals 2-2 1-2
AlabamaRushing No Gain Loss Net TD Lg AvgGlen Coffee 21 112 0 112 1 18 5.3Mark Ingram 8 21 0 21 1 9 2.6John Parker Wilson 3 13 11 2 0 9 0.7P.J. Fitzgerald 1 1 0 1 0 1 1.0Totals 33 147 11 136 2 18 4.1
Passing C-A-I Yds TD Lg SackJohn Parker Wilson 12-25-1 187 0 64 1
Receiving No Yards TD LgJulio Jones 5 124 0 64Nick Walker 3 37 0 17Darius Hanks 3 19 0 10Glen Coffee 1 7 0 7Totals 12 187 0 64
Punting No Yds Avg Lg In20 TBP.J. Fitzgerald 4 164 41.0 47 0 0
Punt Kickoff InterceptReturns No-Yds-Lg No-Yds-Lg No-Yds-LgJavier Arenas 2-20-20 4-95-41 0-0-0
Field Goals Qtr Time Dist ResultLeigh Tiffin 1st 3:28 30 goodLeigh Tiffin 3rd 0:08 27 good
Kickoffs No Yards Avg TB OBLeigh Tiffin 5 335 67.0 0 0
All-Purpose Run Rcv KR PR IR TotalJulio Jones 0 124 0 0 0 124Glen Coffee 112 7 0 0 0 119Javier Arenas 0 0 95 20 0 115
FloridaRushing No Gain Loss Net TD Lg AvgTim Tebow 17 62 5 57 0 14 3.4Jeff Demps 14 54 1 53 1 12 3.8Emmanuel Moody 4 23 0 23 0 10 5.8Brandon James 3 7 0 7 0 4 2.3Louis Murphy 1 4 0 4 0 4 4.0Chris Rainey 1 1 0 1 0 1 1.0Team 2 0 3 -3 0 0 -1.5Totals 42 151 9 142 1 14 3.4
Passing C-A-I Yds TD Lg SackTim Tebow 14-22-0 216 3 51 1
Receiving No Yards TD LgLouis Murphy 4 86 0 34Aaron Hernandez 3 43 0 22David Nelson 3 27 1 13Riley Cooper 2 56 1 51Carl Moore 1 3 1 3Kestahn Moore 1 1 0 1Totals 14 216 3 51
Punting No Yds Avg Lg In20 TBChas Henry 3 143 47.7 57 1 0 Punt Kickoff InterceptReturns No-Yds-Lg No-Yds-Lg No-YdsBrandon James 3-25-15 5-121-38 0-0-0Joe Haden 0-0-0 0-0-0 1-24-24Totals 3-25-15 5-121-38 1-24-24
Field Goals Qtr Time Dist ResultJonathan Phillips 2nd 8:59 19 goodJonathan Phillips 3rd 3:48 42 missed
Kickoffs No Yards Avg TB OBCaleb Sturgis 6 412 68.7 1 0
All-Purpose Run Rcv KR PR IR TotalBrandon James 7 0 121 25 0 153
Fumbles: Alabama-None. Florida-None.

45SEC Championship Game Record Book
Defensive LeadersAlabama Solo Ast Total Sacks-Yds TFL-Yds FF FR-Yds Int-Yds BrUp Blks QBHRolando McClain 7 2 9 - - - - - - - -Rashad Johnson 7 2 9 - - - - - - - -Justin Woodall 6 2 8 - 0.5-1 - - - - - -Totals 47 16 63 1-2 4-6 0 0-0 0-0 2 0 3
Florida Solo Ast Total Sacks-Yds TFL-Yds FF FR-Yds Int-Yds BrUp Blks QBHJoe Haden 6 2 8 - - - - 1-24 2 - - Brandon Spikes 5 2 7 - - - - - 1 - 2Ahmad Black 4 3 7 - - - - - - - -Totals 37 24 61 1-11 1-11 0 0 1-24 4 0 8
Drive Chart Drive Started Drive Ended ConsumedTeam Qtr Spot Time Obtained Spot Time How Lost Pl-Yds TOPUA 1st A20 15:00 Kickoff A29 12:45 Punt 3-9 2:15UA 1st A18 8:17 Kickoff F00 7:23 Touchdown 2-82 0:54UA 1st F25 5:43 Punt F13 3:28 Field Goal 5-12 2:15UA 1st A29 2:19 Punt F31 12:50 Downs 10-40 4:29UA 2nd A04 8:59 Kickoff A10 7:19 Punt 3-6 1:40UA 2nd A23 2:59 Kickoff A40 0:14 Punt 6-17 2:45UA 3rd A09 13:13 Punt F00 6:20 Touchdown 15-91 6:53UA 3rd A25 3:48 Missed FG F10 0:08 Field Goal 10-65 3:40UA 4th A41 9:21 Kickoff A32 7:27 Punt 3-(-9) 1:54UA 4th A17 2:50 Kickoff A32 1:39 Interception 3-15 1:11Avg. Starting Field Position: UA26 Three and Out: 3
Drive Chart Drive Started Drive Ended ConsumedTeam Qtr Spot Time Obtained Spot Time How Lost Pl-Yds TOPUF 1st F41 12:45 Punt A00 8:17 Touchdown 9-59 4:28UF 1st F11 7:23 Kickoff F13 5:43 Punt 3-2 1:40UF 1st F17 3:28 Kickoff F22 2:19 Punt 3-5 1:09UF 2nd F31 12:50 Downs A02 8:59 Field Goal 8-67 3:51UF 2nd F43 7:19 Punt A00 2:59 Touchdown 9-57 4:20UF 2nd F31 0:14 Punt F30 0:00 End of Half 1-(-1) 0:14UF 3rd F31 15:00 Kickoff F34 13:13 Punt 3-3 1:47UF 3rd F29 6:20 Kickoff A25 3:48 Missed FG 7-46 2:32UF 3rd F38 0:08 Kickoff A00 9:21 Touchdown 11-62 5:47UF 4th F35 7:27 Punt A00 2:50 Touchdown 8-65 4:37UF 4th A19 1:39 Interception A20 0:00 End of Half 4-(-1) 1:39Avg. Starting Field Position: UF35 Three and Out: 3
Scoring SummaryQtr Time Scoring Play Ply-Yds Time UA-UF1st 8:17 UF – Carl Moore 3 pass from Tim Tebow (Jonathan Phillips kick) 9-59 4:28 0-71st 7:23 UA – Glen Coffee 18 run (Leigh Tiffin kick) 2-82 0:54 7-71st 3:28 UA – Leigh Tiffin 30 field goal 5-12 2:15 10-7
2nd 8:59 UF – Jonathan Phillips 19 field goal 8-67 3:51 10-102nd 2:59 UF – David Nelson 5 pass from Tim Tebow (Jonathan Phillips kick) 9-57 4:20 10-17
3rd 6:20 UA – Mark Ingram 2 run (Leigh Tiffin kick) 15-91 6:53 17-173rd 0:08 UA – Leigh Tiffin 27 field goal 10-65 3:40 20-17
4th 9:21 UF – Jeff Demps 1 run (Jonathan Phillips kick) 11-62 5:47 20-244th 2:50 UF – Riley Cooper 5 pass from Tim Tebow (Jonathan Phillips kick) 8-65 4:37 20-31

46 SEC Championship Game Record Book
2007 SEC CHAMPIONSHIPLSU (11-2) 21, Tennessee (9-4) 14Dec. 1, 2007 | Atlanta, Ga. (Georgia Dome)Attendance: 73,832 | TV: CBSKickoff Time: 4:06 p.m. | End of Game: 7:45 p.m. | Time of Game: 3:39Officials: Referee: Tom Ritter; Umpire: Wilbur Hackett; Linesman: Gary Jayroe; Line Judge: Terry Walters; Back Judge: Stan Murray; Field Judge: Dan Moore; Side Judge: Chris Conley.
Score by Quarters 1 2 3 4 TotalTennessee 7 0 7 0 14LSU 6 0 7 8 21
UT LSUFIRST DOWNS 17 21Rushing 7 9Passing 11 12Penalty 0 0NET YARDS RUSHING 94 212Rushing Attempts 26 47Average Per Rush 3.6 4.5Rushing Touchdowns 0 0Yards Gained Rushing 97 259Yards Lost Rushing 3 47NET YARDS PASSING 249 252Completions-Attempts-Int 20-40-2 21-33-1Average Per Attempt 6.2 7.6Average Per Completion 12.4 12.0Passing Touchdowns 2 1TOTAL OFFENSIVE YARDS 343 464Total Offensive Plays 66 80Average Gain Per Play 5.2 5.8Fumbles: Number-Lost 0-0 3-1Penalties: Number-Yards 0-0 9-44PUNTS-YARDS 5-180 4-180Average Yards Per Punt 36.0 45.0Net Yards Per Punt 35.8 42.2Inside 20 3 250+ Yards 0 2 Touchbacks 0 0Fair Catch 2 1KICKOFFS-YARDS 3-200 5-288Average Yards Per Kickoff 66.7 57.6Net Yards Per Kickoff 45.3 37.8Touchbacks 0 0Punt Returns: Number-Yards-TD 2-11-0 1-1-0Average Per Return 5.5 1.0Kickoff Returns: Number-Yards-TD 4-99-0 3-64-0Average Per Return 24.8 21.3Interceptions: Number-Yards-TD 1-15-0 2-18-1Fumble Returns: Number-Yards-TD 1-3-0 0-0-0Miscellaneous Yards 0 0Possession Time 23:52 36:081st Quarter 6:10 8:502nd Quarter 2:30 12:303rd Quarter 8:19 6:414th Quarter 6:53 8:07Third-Down Conversions 4 of 13 10 of 20Fourth-Down Conversions 0 of 1 1 of 2Red Zone Scores-Chances 2-4 3-4Touchdowns 2 1Field Goals 0 2Sacks By: Number-Yards 1-8 0-0PAT Kicks 2-2 1-1Field Goals 0-2 2-3
TennesseeRushing No Gain Loss Net TD Lg AvgArian Foster 21 57 2 55 0 11 2.6Gerald Jones 2 39 0 39 0 20 19.5Lennon Creer 1 1 0 1 0 1 1.0Jonathan Crompton 1 0 0 0 0 0 0.0Team 1 0 1 -1 0 0 -1.0Totals 26 97 3 94 0 20 3.6
Passing C-A-I Yds TD Lg SackErik Ainge 20-40-2 249 2 47 0
Receiving No Yards TD LgJosh Briscoe 8 79 1 20Arian Foster 2 40 0 47Chris Brown 2 35 1 24Brad Cottam 2 28 0 19Lucas Taylor 2 25 0 13Austin Rogers 2 20 0 15Denarius Moore 1 16 0 16Lennon Creer 1 6 0 6Totals 20 249 2 47
Punting No Yds Avg Lg In20 TBBritton Colquitt 5 180 36.0 45 3 0
Punt Kickoff InterceptReturns No-Yds-Lg No-Yds-Lg No-Yds-LgDennis Rogan 2-11-7 0-0-0 0-0-0Lennon Creer 0-0-0 4-99-50 0-0-0Eric Berry 0-0-0 0-0-0 1-15-15Totals 2-11-7 4-99-50 1-15-15
Field Goals Qtr Time Dist ResultDaniel Lincoln 3rd 8:12 30 missedDaniel Lincoln 3rd 0:34 51 missed
Kickoffs No Yards Avg TB OBBritton Colquitt 3 200 66.7 0 0
All-Purpose Run Rcv KR PR IR TotalLennon Creer 1 6 99 0 0 106
LSURushing No Gain Loss Net TD Lg AvgJacob Hester 23 121 1 120 0 20 5.2Trindon Holliday 6 58 0 58 0 19 9.7Keiland Williams 5 48 14 34 0 27 6.8Ryan Perrilloux 9 32 18 14 0 10 1.6Richard Murphy 1 0 0 0 0 0 0.0Team 2 0 4 -4 0 0 -2.0Early Doucet 1 0 10 -10 0 0 -10.0Totals 47 259 47 212 0 27 4.5
Passing C-A-I Yds TD Lg SackRyan Perrilloux 20-30-1 243 1 48 1Patrick Fisher 1-1-0 9 0 9 0Team 0-2-0 0 0 0 0Totals 21-33-1 252 1 48 1
Receiving No Yards TD LgEarly Doucet 5 29 0 23Demetrius Byrd 4 72 1 27Brandon LaFell 3 65 0 48Richard Dickson 2 15 0 8Richard Murphy 2 14 0 12Jacob Hester 2 5 0 7Keith Zinger 1 27 0 27Charles Scott 1 16 0 16Quinn Johnson 1 9 0 9Totals 21 252 1 48
Punting No Yds Avg Lg In20 TBPatrick Fisher 4 180 45.0 58 2 0 Punt Kickoff InterceptReturns No-Yds-Lg No-Yds-Lg No-YdsChad Jones 1-1-1 2-40-26 0-0-0Trindon Holliday 0-0-0 1-24-24 0-0-0Jonathan Zenon 0-0-0 0-0-0 1-18-18Darry Beckwith 0-0-0 0-0-0 1-0-0Totals 1-1-1 3-64-26 2-18-18

47SEC Championship Game Record Book
Field Goals Qtr Time Dist ResultColt David 1st 8:29 30 goodColt David 1st 3:07 30 goodColt David 2nd 0:06 30 missed
Kickoffs No Yards Avg TB OBSean Gaudet 5 288 57.6 0 1
All-Purpose Run Rcv KR PR IR TotalJacob Hester 120 5 0 0 0 125
Fumbles: Tennessee-None. LSU-Perrilloux 2-0; Trindon Holliday 1-1.
Defensive LeadersTennessee Solo Ast Total Sacks-Yds TFL-Yds FF FR-Yds Int-Yds BrUp Blks QBHJerod Mayo 8 7 15 - 1.0-6 - - - - - 1Jonathan Hefney 6 4 10 - - - - - 1 - -Rico McCoy 5 3 8 - 1.0-10 1 - - - - -Xavier Mitchell 4 4 8 - 2.0-16 - - - 1 - 1Totals 50 32 82 1-8 7-42 2 1-3 1-15 4 0 6
LSU Solo Ast Total Sacks-Yds TFL-Yds FF FR-Yds Int-Yds BrUp Blks QBHCraig Steltz 5 3 8 - - - - - - - -Ali Highsmith 3 4 7 - - - - - - - 2Jonathan Zenon 4 2 6 - - - - 1-18 1 - -Chad Jones 3 3 6 - 1.0-7 - - - - - -Totals 34 28 62 0-0 2-9 0 0-0 2-18 5 0 6
Drive Chart Drive Started Drive Ended ConsumedTeam Qtr Spot Time Obtained Spot Time How Lost Pl-Yds TOPUT 1st T38 15:00 Kickoff L00 12:00 Touchdown 6-62 3:00UT 1st T20 8:29 Kickoff T32 7:04 Punt 4-12 1:25UT 1st L42 3:07 Kickoff L37 1:22 Punt 3-5 1:45UT 2nd T32 11:19 Downs L48 9:19 Punt 6-20 2:00UT 2nd T45 4:52 Punt T45 4:28 Punt 3-0 0:24UT 2nd T20 0:06 Missed FG T19 0:00 End of Half 1-(-1) 0:06UT 3rd T22 11:52 Kickoff L12 8:12 Missed FG 11-66 3:40UT 3rd T34 6:49 Fumble L00 3:09 Touchdown 9-66 3:40UT 3rd L37 1:33 Interception L34 0:34 Missed FG 4-3 0:59UT 4th T18 14:38 Punt T20 13:41 Punt 3-2 0:57UT 4th T09 10:50 Punt T14 9:54 Interception 3-5 0:56UT 4th T23 9:54 Kickoff L21 6:22 Downs 10-56 3:32UT 4th T34 4:10 Punt L14 2:42 Interception 5-52 1:28Avg. Starting Field Position: UT32 Three and Out: 3
Drive Chart Drive Started Drive Ended ConsumedTeam Qtr Spot Time Obtained Spot Time How Lost Pl-Yds TOPLSU 1st L24 12:00 Kickoff T13 8:29 Field Goal 10-63 3:31LSU 1st L29 7:04 Punt T13 3:07 Field Goal 9-58 3:57LSU 1st L13 1:22 Punt T32 11:19 Downs 11-55 5:03LSU 2nd L16 9:19 Punt L04 4:52 Punt 6-(-12) 4:27LSU 2nd L10 4:28 Punt T13 0:06 Missed FG 13-77 4:22LSU 3rd L24 15:00 Kickoff T00 11:52 Touchdown 6-76 3:08LSU 3rd L20 8:12 Missed FG T31 6:49 Fumble 5-49 1:23LSU 3rd L26 3:09 Kickoff L28 1:33 Interception 3-2 1:36LSU 3rd L34 0:34 Missed FG L32 14:38 Punt 3-(-2) 0:56LSU 4th L41 13:41 Punt T41 10:50 Punt 7-18 2:51LSU 4th T00 9:54 Interception T00 9:54 Touchdown 0-0 0:00LSU 4th L22 6:22 Downs L31 4:10 Punt 3-9 2:12LSU 4th L07 2:42 Interception L38 0:00 End of Half 7-31 2:42Avg. Starting Field Position: LSU22 Three and Out: 2
Scoring SummaryQtr Time Scoring Play Ply-Yds Time UT-LSU1st 12:00 UT – Chris Brown 11 pass from Erik Ainge (Daniel Lincoln kick) 6-62 3:00 7-01st 8:29 LSU – Colt David 30 field goal 10-63 3:31 7-31st 3:07 LSU – Colt David 30 field goal 9-58 3:57 7-6
3rd 11:52 LSU – Demetrius Byrd 27 pass from Ryan Perrilloux (Colt David kick) 6-76 3:08 7-133rd 3:09 UT – Josh Briscoe 6 pass from Erik Ainge (Daniel Lincoln kick) 9-66 3:40 14-13
4th 9:54 LSU – Jonthan Zenon 18 interception return (Ryan Perrilloux rush) - - 14-21

48 SEC Championship Game Record Book
2006 SEC CHAMPIONSHIPFlorida (12-1) 38, Arkansas (10-3) 28Dec. 2, 2006 | Atlanta, Ga. (Georgia Dome)Attendance: 73,374 | TV: CBSKickoff Time: 6:06 p.m. | End of Game: 9:43 p.m. | Time of Game: 3:37Officials: Referee: Steve Shaw; Umpire: Doug Linebarger; Linesman: Gus Morris; Line Judge: Julian Mapp; Back Judge: Steve Patrick; Field Judge: Greg Thomas; Side Judge: Bobby Moreau.
Score by Quarters 1 2 3 4 TotalArkansas 0 7 14 7 28Florida 3 14 7 14 38
AR UFFIRST DOWNS 18 17Rushing 7 11Passing 8 6Penalty 3 0NET YARDS RUSHING 132 202Rushing Attempts 35 30Average Per Rush 3.8 6.7Rushing Touchdowns 0 2Yards Gained Rushing 139 224Yards Lost Rushing 7 22NET YARDS PASSING 179 194Completions-Attempts-Int 12-26-3 17-31-2Average Per Attempt 6.9 6.3Average Per Completion 14.9 11.4Passing Touchdowns 3 2TOTAL OFFENSIVE YARDS 311 396Total Offensive Plays 61 61Average Gain Per Play 5.1 6.5Fumbles: Number-Lost 1-1 3-0Penalties: Number-Yards 5-25 8-67PUNTS-YARDS 6-176 6-224Average Yards Per Punt 29.3 37.3Net Yards Per Punt 24.5 38.0Inside 20 0 350+ Yards 0 1Touchbacks 0 0Fair Catch 0 1KICKOFFS-YARDS 5-243 7-386Average Yards Per Kickoff 48.6 55.1Net Yards Per Kickoff 40.0 39.7Touchbacks 1 2Punt Returns: Number-Yards-TD 2-(-4)-0 5-29-0Average Per Return -2.0 5.8Kickoff Returns: Number-Yards-TD 4-68-0 3-23-0Average Per Return 17.0 7.7Interceptions: Number-Yards-TD 2-40-1 3-0-0Fumble Returns: Number-Yards-TD 0-0-0 0-0-1Miscellaneous Yards 0 0Possession Time 31:58 28:021st Quarter 10:58 4:022nd Quarter 6:41 8:193rd Quarter 7:50 7:104th Quarter 6:29 8:31Third-Down Conversions 4 of 12 2 of 11Fourth-Down Conversions 0 of 0 1 of 2Red Zone Scores-Chances 1-2 3-3Touchdowns 1 2Field Goals 0 1Sacks By: Number-Yards 2-15 0-0PAT Kicks 4-4 5-5Field Goals 0-1 1-1
ArkansasRushing No Gain Loss Net TD Lg AvgDarren McFadden 21 75 2 73 0 15 3.5Felix Jones 13 62 5 57 0 31 4.4Mitch Mustain 1 2 0 2 0 2 2.0Totals 35 139 7 132 0 31 3.8
Passing C-A-I Yds TD Lg SackCasey Dick 10-22-2 148 1 48 0Darren McFadden 1-3-1 2 1 2 0Cedric Washington 1-1-0 29 1 29 0Totals 12-26-3 179 3 48 0
Receiving No Yards TD LgMarcus Monk 3 69 1 48Felix Jones 2 31 2 29Darren McFadden 2 27 0 19Damian Williams 2 14 0 15Ben Cleveland 1 18 0 18Chris Houston 1 12 0 12Cedric Washington 1 8 0 8Totals 12 179 3 48
Punting No Yds Avg Lg In20 TBJacob Skinner 5 176 35.2 43 0 0Team 1 0 0.0 0 0 0Totals 6 176 29.3 43 0 0
Punt Kickoff InterceptReturns No-Yds-Lg No-Yds-Lg No-Yds-LgReggie Fish 2-(-4)-1 0-0-0 0-0-0Felix Jones 0-0-0 4-68-22 0-0-0Antwain Robinson 0-0-0 0-0-0 1-40-40Weston Dacus 0-0-0 0-0-0 1-0-0Totals 2-(-4)-1 4-68-22 2-40-40
Field Goals Qtr Time Dist ResultJeremy Davis 1st 0:00 40 missed
Kickoffs No Yards Avg TB OBBrian Vavra 5 243 48.6 1 0
All-Purpose Run Rcv KR PR IR TotalFelix Jones 57 31 68 0 0 156Darren McFadden 73 27 0 0 0 100
FloridaRushing No Gain Loss Net TD Lg AvgPercy Harvin 6 106 1 105 1 67 17.5Kestahn Moore 3 32 0 32 0 28 10.7Tim Tebow 8 32 1 31 0 9 3.9Chris Leak 11 37 18 19 1 11 1.7Jemalle Cornelius 1 17 0 17 0 17 17.0DeShawn Wynn 1 0 2 -2 0 0 -2.0Totals 30 224 22 202 2 67 6.7
Passing C-A-I Yds TD Lg SackChris Leak 16-30-2 189 1 37 2Andre Caldwell 1-1-0 5 1 5 0Totals 17-31-2 194 2 37 2
Receiving No Yards TD LgCornelius Ingram 6 71 0 28Percy Harvin 5 62 1 37Andre Caldwell 3 31 0 20Dallas Baker 2 25 0 17Tate Casey 1 5 1 5Totals 17 194 2 37
Punting No Yds Avg Lg In20 TBEric Wilbur 6 224 37.3 54 3 0 Punt Kickoff InterceptReturns No-Yds-Lg No-Yds-Lg No-YdsBrandon James 4-15-10 1-5-5 0-0-0Jarred Fayson 1-14-0 0-0-0 0-0-0Kestahn Moore 0-0-0 2-18-11 0-0-0Reggie Lewis 0-0-0 0-0-0 1-0-0Ryan Smith 0-0-0 0-0-0 1-0-0Reggie Nelson 0-0-0 0-0-0 1-0-0Totals 5-29-10 3-23-11 3-0-0

49SEC Championship Game Record Book
Field Goals Qtr Time Dist ResultChris Hetland 1st 6:10 33 good
Kickoffs No Yards Avg TB OBJoey Ijjas 7 386 55.1 2 1
All-Purpose Run Rcv KR PR IR TotalPercy Harvin 105 62 0 0 0 167
Fumbles: Arkansas-Reggie Fish 1-1. Florida-Chris Leak 2-0, Brandon James 1-0.
Defensive LeadersArkansas Solo Ast Total Sacks-Yds TFL-Yds FF FR-Yds Int-Yds BrUp Blks QBHRandy Kelly 9 3 12 1.0-8 1.0-8 - - - - - -John Johnson 5 2 7 - - - - - 1 - -Sam Olajubutu 4 2 6 - - - - - - - -Totals 40 20 60 2-15 6-22 1 0-0 2-40 1 0 4
Florida Solo Ast Total Sacks-Yds TFL-Yds FF FR-Yds Int-Yds BrUp Blks QBHBrandon Siler 9 3 12 - - - - - - - -Earl Everett 3 3 6 - 0.5-0 - - - - - -Dorian Munroe 3 3 6 - 1.0-2 - - - - - -Totals 38 22 60 0-0 4-8 0 1-0 3-0 1 1 3
Drive Chart Drive Started Drive Ended ConsumedTeam Qtr Spot Time Obtained Spot Time How Lost Pl-Yds TOPAR 1st A20 15:00 Kickoff A27 12:22 Punt 3-7 2:38AR 1st A31 10:45 Punt A38 8:35 Punt 3-7 2:10AR 1st A30 6:10 Kickoff F22 0:00 Missed FG 12-48 6:10AR 2nd A10 12:25 Punt A23 9:23 Punt 5-13 3:02AR 2nd A26 8:44 Kickoff A28 7:25 Punt 3-2 1:19AR 2nd A34 4:02 Kickoff F00 1:55 Touchdown 3-66 2:07AR 2nd A45 0:03 Downs A45 0:00 Interception 1-0 0:03AR 3rd F32 14:24 Interception F00 12:06 Touchdown 7-32 2:18AR 3rd A26 10:40 Punt A29 8:55 Punt 3-3 1:45AR 3rd F00 8:33 Interception F00 8:33 Touchdown 0-0 0:00AR 3rd A00 0:00 Punt A00 3:47 Fumble 0-0 0:00AR 3rd A20 3:47 Kickoff A40 14:52 Punt 6-20 3:55AR 4th A37 14:22 Kickoff F00 12:29 Touchdown 4-63 1:53AR 4th A35 9:04 Kickoff A34 7:49 Interception 2-(-1) 1:15AR 4th A09 6:24 Punt F25 3:15 Interception 9-66 3:09AR 4th A45 0:04 Punt F43 0:00 End of Half 1-12 0:04Avg. Starting Field Position: AR31 Three and Out: 4
Drive Chart Drive Started Drive Ended ConsumedTeam Qtr Spot Time Obtained Spot Time How Lost Pl-Yds TOPUF 1st F43 12:22 Punt F38 10:45 Punt 3-(-5) 1:37UF 1st F37 8:35 Punt A16 6:10 Field Goal 6-47 2:25UF 2nd F23 15:00 Missed FG A43 12:25 Punt 7-34 2:35UF 2nd A09 9:23 Punt A00 08:54 Touchdown 1-9 0:29UF 2nd F26 7:25 Punt A00 04:02 Touchdown 8-74 3:23UF 2nd F28 1:55 Kickoff A45 00:03 Downs 8-27 1:52UF 2nd F03 0:00 Interception F03 00:00 End of Half 0-0 0:00UF 3rd F31 15:00 Kickoff F26 14:24 Interception 1-(-5) 0:36UF 3rd F31 12:06 Kickoff F34 10:40 Punt 3-3 1:26UF 3rd F43 8:55 Punt F43 08:33 Interception 1-0 0:22UF 3rd F15 8:33 Kickoff F41 03:47 Punt 7-26 4:46UF 3rd A00 3:47 Fumble A00 03:47 Touchdown 0-0 0:00UF 4th F33 14:52 Punt A00 14:22 Touchdown 1-67 0:30UF 4th F20 12:29 Kickoff A00 09:04 Touchdown 8-80 3:25UF 4th F43 7:49 Interception A48 06:24 Punt 3-9 1:25UF 4th F20 3:15 Interception F30 00:04 Punt 5-10 3:11Avg. Starting Field Position: UF34 Three and Out: 3
Scoring SummaryQtr Time Scoring Play Ply-Yds Time AR-UF1st 6:10 UF – Chris Hetland 33 field goal 6-47 2:25 0-32nd 8:54 UF – Chris Leak 9 run (Chris Hetland kick) 1-9 0:29 0-102nd 4:02 UF – Percy Harvin 37 pass from Chris Leak (Chris Hetland kick) 8-74 3:23 0-172nd 1:55 AR - Marcus Monk 48 pass from Casey Dick (Jeremy Davis kick) 3-66 2:07 7-173rd 12:06 AR - Felix Jones 2 pass from Darren McFadden (Jeremy Davis kick) 7-32 2:18 14-173rd 8:33 AR - Antwain Robinson 40 interception return (Jeremy Davis kick) - - 21-173rd 3:47 UF – Wondy Pierre-Louis 0 fumble return (Chris Hetland kick) - - 21-244th 14:22 UF – Percy Harvin 67 run (Chris Hetland kick) 1-67 0:30 21-314th 12:29 AR - Felix Jones 29 pass from Cedric Washington (Jeremy Davis kick) 4-63 1:53 28-314th 9:04 UF – Tate Casey 5 pass from Andre Caldwell (Chris Hetland kick) 8-80 3:25 28-38

50 SEC Championship Game Record Book
2005 SEC CHAMPIONSHIPGeorgia (10-2) 34, LSU (10-2) 14Dec. 2, 2005 | Atlanta, Ga. (Georgia Dome)Attendance: 73,717 | TV: CBSKickoff Time: 6:08 p.m. | End of Game: 9:35 p.m. | Time of Game: 3:27Officials: Referee: Rocky Goode; Umpire: Doug Linebarger; Linesman: Joe Dawson; Line Judge: Allama Matthews; Back Judge: Dale Keneipp; Field Judge: Gerald Hodges; Side Judge: Chris Conley.
Score by Quarters 1 2 3 4 TotalGeorgia 14 7 3 10 34LSU 0 7 0 7 14
UG LSUFIRST DOWNS 16 18 Rushing 10 9Passing 4 8Penalty 2 1NET YARDS RUSHING 138 74Rushing Attempts 42 36Average Per Rush 3.3 2.1Rushing Touchdowns 1 1Yards Gained Rushing 152 142Yards Lost Rushing 14 68NET YARDS PASSING 112 156Completions-Attempts-Int 6-12-0 14-30-2Average Per Attempt 9.3 5.2Average Per Completion 18.7 11.1Passing Touchdowns 2 1TOTAL OFFENSIVE YARDS 250 230Total Offensive Plays 54 66Average Gain Per Play 4.6 3.5Fumbles: Number-Lost 1-0 0-0Penalties: Number-Yards 2-15 9-78PUNTS-YARDS 4-183 6-201Average Yards Per Punt 45.8 33.5Net Yards Per Punt 45.8 30.2Inside 20 1 150+ Yards 2 0Touchbacks 0 0Fair Catch 2 4KICKOFFS-YARDS 7-434 2-130Average Yards Per Kickoff 62.0 65.0Net Yards Per Kickoff 47.3 43.5Touchbacks 3 0Punt Returns: Number-Yards-TD 2-20-0 0-0-0Average Per Return 10.0 0.0Kickoff Returns: Number-Yards-TD 2-43-0 4-43-0Average Per Return 21.5 10.8Interceptions: Number-Yards-TD 2-15-1 0-0-0Fumble Returns: Number-Yards-TD 0-0-0 0-0-0Miscellaneous Yards 0 0Possession Time 28:49 31:111st Quarter 4:50 10:102nd Quarter 7:24 7:363rd Quarter 9:05 5:554th Quarter 7:30 7:30Third-Down Conversions 5 of 12 5 of 12Fourth-Down Conversions 0 of 1 0 of 2Red Zone Scores-Chances 2-3 2-2Touchdowns 1 2Field Goals 1 0Sacks By: Number-Yards 5-56 1-6PAT Kicks 4-4 2-2Field Goals 2-2 0-0
GeorgiaRushing No Gain Loss Net TD Lg AvgThomas Brown 14 69 7 62 0 18 4.4Kregg Lumpkin 13 38 0 38 0 7 2.9Danny Ware 8 28 0 28 0 7 3.5D.J. Shockley 7 17 7 10 1 7 1.4Totals 42 152 14 138 1 18 3.3
Passing C-A-I Yds TD Lg SackD.J. Shockley 6-12-0 112 2 45 1
Receiving No Yards TD LgSean Bailey 2 74 2 45Mohammed Massaquoi 2 15 0 8Leonard Pope 1 17 0 17Bryan McClendon 1 6 0 6Totals 6 112 2 45
Punting No Yds Avg Lg In20 TBGordon Ely-Kelso 4 183 45.8 54 1 0
Punt Kickoff InterceptReturns No-Yds-Lg No-Yds-Lg No-Yds-LgBryan McClendon 1-18-0 0-0-0 0-0-0Thomas Flowers 1-2-2 0-0-0 0-0-0Ramarcus Brown 0-0-0 2-43-26 0-0-0Tim Jennings 0-0-0 0-0-0 1-15-15DeMario Minter 0-0-0 0-0-0 1-0-0Totals 2-20-2 2-43-26 2-15-15
Field Goals Qtr Time Dist ResultBrandon Coutu 3rd 9:52 22 goodBrandon Coutu 4th 14:40 51 good
Kickoffs No Yards Avg TB OBBrandon Coutu 7 434 62.0 3 0
All-Purpose Run Rcv KR PR IR TotalSean Bailey 0 74 0 0 0 74
LSURushing No Gain Loss Net TD Lg AvgShyrone Carey 10 47 4 43 0 14 4.3Skyler Green 2 26 0 26 0 17 13.0Justin Vincent 8 21 6 15 0 7 1.9Joseph Addai 2 7 0 7 0 6 3.5Jacob Hester 2 5 0 5 0 5 2.5Matt Flynn 4 21 20 1 0 14 0.2Chris Jackson 1 0 2 -2 0 0 -2.0JaMarcus Russell 7 15 36 -21 1 6 -3.0Totals 36 142 68 74 1 17 2.1
Passing C-A-I Yds TD Lg SackJaMarcus Russell 11-19-1 120 0 26 3Matt Flynn 3-11-1 36 1 19 2Totals 14-30-2 156 1 26 5
Receiving No Yards TD LgDwayne Bowe 5 74 1 20David Jones 2 28 0 26Shyrone Carey 2 18 0 12Early Doucet 1 16 0 16Craig Davis 1 12 0 12Jacob Hester 1 5 0 5Skyler Green 1 5 0 5Justin Vincent 1 -2 0 0Totals 14 156 1 26
Punting No Yds Avg Lg In20 TBChris Jackson 5 201 40.2 48 1 0Team 1 0 0.0 0 0 0Totals 6 201 33.5 48 1 0 Punt Kickoff InterceptReturns No-Yds-Lg No-Yds-Lg No-YdsSkyler Green 0-0-0 4-43-15 0-0-0
Field Goals Qtr Time Dist ResultNone
Kickoffs No Yards Avg TB OBChris Jackson 2 130 65.0 0 0

51SEC Championship Game Record Book
All-Purpose Run Rcv KR PR IR TotalDwayne Bowe 0 74 0 0 0 74
Fumbles: Georgia-Ramarcus Brown 1-0. LSU-None.
Defensive LeadersGeorgia Solo Ast Total Sacks-Yds TFL-Yds FF FR-Yds Int-Yds BrUp Blks QBHJarvis Jackson 6 2 8 - 1.0-3 - - - - - -Tim Jennings 5 1 6 1.0-12 2.0-14 - - 1-15 - - -Tony Taylor 5 1 6 - - - - - - - 1Greg Blue 4 2 6 - - - - - - - -Totals 47 12 59 5-56 11-88 0 0-0 2-15 3 1 6
LSU Solo Ast Total Sacks-Yds TFL-Yds FF FR-Yds Int-Yds BrUp Blks QBHCraig Steltz 6 2 8 - - - - - - - 1Melvin Oliver 5 2 7 - - - - - - - -LaRon Landry 4 2 6 - 1.0-3 - - - - - -Totals 45 15 60 1-6 3-13 0 0-0 0-0 2 0 3
Drive Chart Drive Started Drive Ended ConsumedTeam Qtr Spot Time Obtained Spot Time How Lost Pl-Yds TOPUG 1st G26 15:00 Kickoff G28 12:52 Punt 3-2 2:08UG 1st L45 10:27 Punt L00 10:19 Touchdown 1-45 0:08UG 1st G49 8:46 Interception L00 6:12 Touchdown 6-51 2:34UG 2nd G17 13:53 Kickoff G24 11:36 Punt 5-7 2:17UG 2nd L15 9:44 Downs L00 8:23 Touchdown 3-15 1:21UG 2nd G14 4:20 Punt G43 0:34 Punt 8-29 3:46UG 3rd G34 13:42 Punt L04 9:52 Field Goal 10-62 3:50UG 3rd G27 5:15 Punt L33 14:40 Field Goal 11-40 5:35UG 4th L00 14:18 Interception L00 14:18 Touchdown 0-0 0:00UG 4th G30 12:28 Punt G36 9:37 Punt 3-6 2:51UG 4th L34 4:54 Downs L04 0:35 Downs 6-30 4:19Avg. Starting Field Position: UG40 Three and Out: 2
Drive Chart Drive Started Drive Ended ConsumedTeam Qtr Spot Time Obtained Spot Time How Lost Pl-Yds TOPLSU 1st L22 12:52 Punt L09 10:27 Punt 3-(-13) 2:25LSU 1st L20 10:19 Kickoff L33 8:46 Interception 3-13 1:33LSU 1st L20 6:12 Kickoff G00 13:53 Touchdown 14-80 7:19LSU 2nd L40 11:36 Punt L15 9:44 Downs 4-(-25) 1:52LSU 2nd L20 8:23 Kickoff G47 4:20 Punt 8-33 4:03LSU 2nd L03 0:34 Punt L04 0:00 End of Half 1-1 0:34LSU 3rd L18 15:00 Kickoff L22 13:42 Punt 3-4 1:18LSU 3rd L11 9:52 Kickoff L25 5:15 Punt 9-14 4:37LSU 4th L08 14:40 Kickoff L08 14:18 Interception 2-0 0:22LSU 4th L20 14:18 Kickoff L33 12:28 Punt 5-13 1:50LSU 4th L21 9:37 Punt G00 5:38 Touchdown 9-79 3:59LSU 4th L46 5:38 Kickoff L34 4:54 Downs 4-(-12) 0:44LSU 4th L04 0:35 Downs L11 0:00 End of Half 1-7 0:35Avg. Starting Field Position: LSU19 Three and Out: 2
Scoring SummaryQtr Time Scoring Play Ply-Yds Time UG-LSU1st 10:19 UG - Sean Bailey 45 pass from D.J. Shockley (Brandon Coutu kick) 1-45 0:08 7-01st 6:12 UG - Sean Bailey 29 pass from D.J. Shockley (Brandon Coutu kick) 6-51 2:34 14-0
2nd 13:53 LSU - JaMarcus Russell 1 run (Colt David kick) 14-80 7:19 14-72nd 8:23 UG - D.J. Shockley 7 run (Brandon Coutu kick) 3-15 1:21 21-7
3rd 9:52 UG - Brandon Coutu 22 field goal 10-62 3:50 24-7
4th 14:40 UG - Brandon Coutu 51 field goal 11-40 5:35 27-74th 14:18 UG - Tim Jennings 15 interception return (Brandon Coutu kick) - - 34-74th 5:38 LSU - Dwayne Bowe 19 pass from Matt Flynn (Colt David kick) 9-79 3:59 34-14

52 SEC Championship Game Record Book
2004 SEC CHAMPIONSHIPAuburn (12-0) 38, Tennessee (9-3) 28Dec. 4, 2004 | Atlanta, Ga. (Georgia Dome)Attendance: 74,892 | TV: CBSKickoff Time: 6:17 p.m. | End of Game: 10:04 p.m. | Time of Game: 3:47Officials: Referee: Steve Landis; Umpire: Larry Leatherwood; Linesman: John Crawford; Line Judge: Julian Mapp; Back Judge: Dale Keneipp; Field Judge: Bobby Aillet; Side Judge: Don Shanks.
Score by Quarters 1 2 3 4 TotalAuburn 14 7 7 10 38Tennessee 7 0 14 7 28
AU UTFIRST DOWNS 31 9Rushing 13 5Passing 14 4 Penalty 4 0NET YARDS RUSHING 185 228Rushing Attempts 49 24Average Per Rush 3.8 9.5Rushing Touchdowns 2 3Yards Gained Rushing 222 233Yards Lost Rushing 37 5NET YARDS PASSING 374 69Completions-Attempts-Int 27-36-1 8-20-0Average Per Attempt 10.4 3.5Average Per Completion 13.9 8.6Passing Touchdowns 3 1TOTAL OFFENSIVE YARDS 559 297Total Offensive Plays 85 44Average Gain Per Play 6.6 6.8Fumbles: Number-Lost 3-1 0-0Penalties: Number-Yards 4-20 12-95PUNTS-YARDS 2-59 6-243Average Yards Per Punt 29.5 40.5Net Yards Per Punt 29.5 39.8Inside 20 0 350+ Yards 0 1Touchbacks 1 0Fair Catch 0 2KICKOFFS-YARDS 7-455 5-324Average Yards Per Kickoff 65.0 64.8Net Yards Per Kickoff 61.7 56.4Touchbacks 6 2Punt Returns: Number-Yards-TD 2-4-0 0-0-0Average Per Return 2.0 0.0Kickoff Returns: Number-Yards-TD 3-42-0 1-23-0Average Per Return 14.0 23.0Interceptions: Number-Yards-TD 0-0-0 1-0-0Fumble Returns: Number-Yards-TD 0-0-0 0-0-0Miscellaneous Yards 0 0Possession Time 39:31 20:291st Quarter 9:27 5:332nd Quarter 11:59 3:013rd Quarter 7:57 7:034th Quarter 10:08 4:52Third-Down Conversions 8 of 14 2 of 9Fourth-Down Conversions 2 of 3 0 of 1Red Zone Scores-Chances 4-6 3-3Touchdowns 3 3Field Goals 1 0 Sacks By: Number-Yards 0-0 1-5PAT Kicks 5-5 4-4Field Goals 1-1 0-0
AuburnRushing No Gain Loss Net TD Lg AvgCarnell Williams 19 106 6 100 1 17 5.3Jason Campbell 13 63 6 57 0 28 4.4Ronnie Brown 16 53 3 50 0 7 3.1Kody Bliss 1 0 22 -22 0 0 -22.0Cole Bennett 0 0 0 0 1 0 0.0Totals 49 222 37 185 2 28 3.8
Passing C-A-I Yds TD Lg SackJason Campbell 27-35-1 374 3 56 1Ronnie Brown 0-1-0 0 0 0 0Totals 27-36-1 374 3 56 1
Receiving No Yards TD LgCourtney Taylor 6 111 1 56Ben Obomanu 6 93 1 43Ronnie Brown 6 55 0 19Cooper Wallace 3 31 0 21Devin Aromashodu 2 58 1 53Carnell Williams 2 11 0 6Silas Daniels 1 9 0 9Anthony Mix 1 6 0 6Totals 27 374 3 56
Punting No Yds Avg Lg In20 TBKody Bliss 2 59 29.5 44 0 1
Punt Kickoff InterceptReturns No-Yds-Lg No-Yds-Lg No-Yds-LgCarnell Williams 2-4-2 3-42-14 0-0-0
Field Goals Qtr Time Dist ResultJohn Vaughn 4th 11:46 22 good
Kickoffs No Yards Avg TB OBPhilip Yost 7 455 6 0 0
All-Purpose Run Rcv KR PR IR TotalCarnell Williams 100 11 42 4 0 157Courtney Taylor 0 111 0 0 0 111
TennesseeRushing No Gain Loss Net TD Lg AvgGerald Riggs 11 182 0 182 2 80 16.5Cedric Houston 11 40 3 37 1 14 3.4Cory Anderson 1 11 0 11 0 11 11.0Team 1 0 2 -2 0 0 -2.0Totals 24 233 5 228 3 80 9.5
Passing C-A-I Yds TD Lg SackRick Clausen 8-20-0 69 1 17 0
Receiving No Yards TD LgTony Brown 3 28 0 16Cory Anderson 2 11 0 6Robert Meachem 1 17 1 17Cedric Houston 1 8 0 8Bret Smith 1 5 0 5Totals 8 69 1 17
Punting No Yds Avg Lg In20 TBDustin Colquitt 6 243 40.5 50 3 0 Punt Kickoff InterceptReturns No-Yds-Lg No-Yds-Lg No-YdsGerald Riggs 0-0-0 1-23-23 0-0-0Corey Campbell 0-0-0 0-0-0 1-0-0Totals 0-0-0 1-23-23 1-0-0
Field Goals Qtr Time Dist ResultNone
Kickoffs No Yards Avg TB OBJames Wilhoit 5 324 64.8 2 0
All-Purpose Run Rcv KR PR IR TotalGerald Riggs 182 0 23 0 0 205
Fumbles: Auburn-Carnell Williams 1-0, Kody Bliss-1-0, Jason Campbell 1-1. Tennessee-None.

53SEC Championship Game Record Book
Defensive LeadersAuburn Solo Ast Total Sacks-Yds TFL-Yds FF FR-Yds Int-Yds BrUp Blks QBHTravis Williams 7 1 8 - 1.0-3 - - - - - -Derrick Graves 2 3 5 - - - - - - - -Tommy Jackson 1 4 5 - - - - - - - -Totals 24 15 39 - 1-3 - - - 3 - 3
Tennessee Solo Ast Total Sacks-Yds TFL-Yds FF FR-Yds Int-Yds BrUp Blks QBHOmar Gaither 15 3 18 1.0-5 3.0-12 - - - - - -Kevin Barnett 10 3 13 - - 1 - - - - -Jonathan Hefney 6 2 8 - - - - - - - -Totals 73 17 90 1-5 5-15 2 1-0 1-0 - - 10
Drive Chart Drive Started Drive Ended ConsumedTeam Qtr Spot Time Obtained Spot Time How Lost Pl-Yds TOPAU 1st A14 15:00 Kickoff T00 13:24 Touchdown 4-86 1:36AU 1st A34 11:55 Punt T00 8:35 Touchdown 9-66 3:20AU 1st A35 6:48 Punt A40 5:13 Punt 3-5 1:35AU 1st A18 4:45 Punt A14 1:49 Downs 7-(-4) 2:56AU 2nd A20 15:00 Kickoff T00 9:15 Touchdown 10-80 5:45AU 2nd A13 6:21 Punt T11 0:07 Interception 16-76 6:14AU 3rd A13 12:21 Punt A20 11:34 Fumble 2-7 0:47AU 3rd A14 9:39 Kickoff T44 6:18 Punt 6-42 3:21AU 3rd A15 6:05 Kickoff T00 3:45 Touchdown 6-85 2:20AU 3rd T44 1:29 Punt T05 11:46 Field Goal 11-39 4:43AU 4th A20 10:07 Kickoff T00 6:56 Touchdown 6-80 3:11AU 4th T43 3:43 Downs T07 0:00 End of Half 6-36 3:43Avg. Starting Field Position: AU25 Three and Out: 1
Drive Chart Drive Started Drive Ended ConsumedTeam Qtr Spot Time Obtained Spot Time How Lost Pl-Yds TOPUT 1st T20 13:24 Kickoff T24 11:55 Punt 3-4 1:29UT 1st T23 8:35 Kickoff T27 6:48 Punt 3-4 1:47UT 1st T45 5:13 Punt T45 4:45 Punt 3-0 0:28UT 1st A14 1:49 Downs A00 0:00 Touchdown 4-14 1:49UT 2nd T20 9:15 Kickoff T39 6:21 Punt 6-19 2:54UT 2nd T20 0:07 Interception T18 0:00 End of Half 1-(-2) 0:07UT 3rd T20 15:00 Kickoff T46 12:21 Punt 6-26 2:39UT 3rd A19 11:34 Fumble A00 9:39 Touchdown 3-19 1:55UT 3rd T20 6:18 Punt A00 6:05 Touchdown 1-80 0:13UT 3rd T20 3:45 Kickoff T13 1:29 Punt 3-(-7) 2:16UT 4th T20 11:46 Kickoff A00 10:07 Touchdown 5-80 1:39UT 4th T20 6:56 Kickoff T44 3:43 Downs 6-24 3:13Avg. Starting Field Position: UT32 Three and Out: 4
Scoring SummaryQtr Time Scoring Play Ply-Yds Time AU-UT1st 13:24 AU - Cole Bennett 0 fumble return (John Vaughn kick) 4-86 1:36 7-01st 8:35 AU - Carnell Williams 5 run (John Vaughn kick) 9-66 3:20 14-01st 0:00 UT - Cedric Houston 2 run (James Wilhoit kick) 4-14 1:49 14-7
2nd 9:15 AU - Courtney Taylor 4 pass from Jason Campbell (John Vaughn kick) 10-80 5:45 21-7
3rd 9:39 UT - Robert Meachem 17 pass from Rick Clausen (James Wilhoit kick) 3-19 1:55 21-143rd 6:05 UT - Gerald Riggs 80 run (James Wilhoit kick) 1-80 0:13 21-213rd 3:45 AU - Devin Aromashodu 53 pass from Jason Campbell (John Vaughn kick) 6-85 2:20 28-21
4th 11:46 AU - John Vaughn 22 field goal 11-39 4:43 31-214th 10:07 UT - Gerald Riggs 9 run (James Wilhoit kick) 5-80 1:39 31-284th 6:56 AU - Ben Obomanu 43 pass from Jason Campbell (John Vaughn kick) 6-80 3:11 38-28

54 SEC Championship Game Record Book
2003 SEC CHAMPIONSHIPLSU (12-1) 34, Georgia (10-3) 13Dec. 6, 2003 | Atlanta, Ga. (Georgia Dome)Attendance: 74,913 | TV: CBSKickoff Time: 8:11 p.m. | End of Game: 11:39 p.m. | Time of Game: 3:28Officials: Referee: Thomas Ritter; Umpire: Daniel Pulley; Linesman: Gus Morris; Line Judge: Michael Shirey; Back Judge: George Ranager; Field Judge: Mike Washington; Side Judge: Blake Parks.
Score by Quarters 1 2 3 4 TotalGeorgia 0 3 10 0 13LSU 8 9 7 10 34
UG LSUFIRST DOWNS 14 17Rushing 4 11Passing 9 6Penalty 1 0NET YARDS RUSHING 50 293Rushing Attempts 25 46Average Per Rush 2.0 6.4Rushing Touchdowns 0 2Yards Gained Rushing 121 332Yards Lost Rushing 71 39NET YARDS PASSING 199 151Completions-Attempts-Int 17-41-3 14-22-1Average Per Attempt 4.9 6.9Average Per Completion 11.7 10.8Passing Touchdowns 1 1TOTAL OFFENSIVE YARDS 249 444Total Offensive Plays 66 68Average Gain Per Play 3.8 6.5Fumbles: Number-Lost 0-0 1-0Penalties: Number-Yards 3-24 5-45PUNTS-YARDS 6-232 6-256Average Yards Per Punt 38.7 42.7Net Yards Per Punt 33.2 42.8Inside 20 2 450+ Yards 0 0Touchbacks 0 0Fair Catch 3 2KICKOFFS-YARDS 5-320 7-408Average Yards Per Kickoff 64.0 58.3Net Yards Per Kickoff 53.0 49.9Touchbacks 2 1Punt Returns: Number-Yards-TD 3-(-1)-0 3-33-0Average Per Return -0.3 11.0Kickoff Returns: Number-Yards-TD 5-59-0 3-55-0Average Per Return 11.8 18.3Interceptions: Number-Yards-TD 1-0-0 3-18-1Fumble Returns: Number-Yards-TD 0-0-0 0-0-0Miscellaneous Yards 38 0Possession Time 24:22 35:381st Quarter 6:35 8:252nd Quarter 7:37 7:233rd Quarter 4:26 10:344th Quarter 5:44 9:16Third-Down Conversions 3 of 14 6 of 17Fourth-Down Conversions 0 of 3 1 of 1Red Zone Scores-Chances 1-2 3-4Touchdowns 1 1Field Goals 0 2Sacks By: Number-Yards 4-35 6-53PAT Kicks 1-1 2-4Field Goals 2-2 2-3
GeorgiaRushing No Gain Loss Net TD Lg AvgKregg Lumpkin 7 54 0 54 0 21 7.7Reggie Brown 1 35 0 35 0 35 35.0Michael Cooper 9 21 7 14 0 7 1.6Tyson Browning 2 11 0 11 0 7 5.5Gordon Ely-Kelso 1 0 15 -15 0 0 -15.0David Greene 5 0 49 -49 0 0 -9.8Totals 25 121 71 50 0 35 2.0
Passing C-A-I Yds TD Lg SackDavid Greene 17-41-3 199 1 39 5Michael Cooper 0-0-0 0 0 0 1Totals 17-41-3 199 1 39 6
Receiving No Yards TD LgBen Watson 4 86 1 39Fred Gibson 3 19 0 9Reggie Brown 2 55 0 29Michael Johnson 2 19 0 10Kregg Lumpkin 2 2 0 2Sean Bailey 1 10 0 10Michael Cooper 1 5 0 5Damien Gary 1 4 0 4Jeremy Thomas 1 -1 0 0Totals 17 199 1 39
Punting No Yds Avg Lg In20 TBGordon Ely-Kelso 6 232 38.7 47 2 0
Punt Kickoff InterceptReturns No-Yds-Lg No-Yds-Lg No-Yds-LgDamien Gary 3-(-1)-4 0-0-0 0-0-0Tyson Browning 0-0-0 4-38-14 0-0-0Kregg Lumpkin 0-0-0 1-21-21 0-0-0Bruce Thornton 0-0-0 0-0-0 1-0-0Totals 3-(-1)-4 5-59-21 1-0-0
Field Goals Qtr Time Dist ResultBilly Bennett 2nd 6:38 51 goodBilly Bennett 3rd 7:46 49 good
Kickoffs No Yards Avg TB OBBilly Bennett 5 320 64.0 2 0
All-Purpose Run Rcv KR PR IR TotalReggie Brown 35 55 0 0 0 90
LSURushing No Gain Loss Net TD Lg AvgJustin Vincent 18 202 1 201 2 87 11.2Joseph Addai 8 61 1 60 0 16 7.5Alley Broussard 11 47 0 47 0 8 4.3Devery Henderson 1 6 0 6 0 6 6.0Matt Mauck 8 16 37 -21 0 8 -2.6Totals 46 332 39 293 2 87 6.4
Passing C-A-I Yds TD Lg SackMatt Mauck 14-22-1 151 1 43 4
Receiving No Yards TD LgMichael Clayton 5 81 1 43Devery Henderson 4 47 0 33Skyler Green 3 11 0 8David Jones 1 9 0 9Joseph Addai 1 3 0 3Totals 14 151 1 43
Punting No Yds Avg Lg In20 TBDonnie Jones 6 256 42.7 47 4 0 Punt Kickoff InterceptReturns No-Yds-Lg No-Yds-Lg No-YdsSkyler Green 3-33-12 3-55-24 0-0-0Lionel Turner 0-0-0 0-0-0 1-18-18LaRon Landry 0-0-0 0-0-0 1-0-0Jack Hunt 0-0-0 0-0-0 1-0-0Totals 3-33-12 3-55-24 3-18-18

55SEC Championship Game Record Book
Field Goals Qtr Time Dist ResultChris Jackson 1st 9:34 48 blockedRyan Gaudet 2nd 9:37 35 goodRyan Gaudet 4th 7:12 22 good
Kickoffs No Yards Avg TB OBChris Jackson 7 408 58.3 1 0
All-Purpose Run Rcv KR PR IR TotalJustin Vincent 201 0 0 0 0 201
Fumbles: Georgia-None. LSU-Matt Mauck 1-0.
Defensive LeadersGeorgia Solo Ast Total Sacks-Yds TFL-Yds FF FR-Yds Int-Yds BrUp Blks QBHThomas Davis 5 6 11 - - - - - - - -Odell Thurman 4 7 11 1.0-10 3.0-13 - - - - - -Greg Blue 4 5 9 - - - - - - - -Sean Jones 3 6 9 1.0-8 1.0-8 - - - - 1 -Totals 35 54 89 4-35 7-39 1 0-0 1-0 1 2 -
LSU Solo Ast Total Sacks-Yds TFL-Yds FF FR-Yds Int-Yds BrUp Blks QBHTravis Daniels 5 1 6 - - - - - 2 - -Lionel Turner 1 5 6 - - - - 1-18 1 - -Eric Alexander 3 3 6 1.5-10 1.5-10 - - - - - -Totals 33 28 61 6-53 8-71 0 0-0 3-18 6 0 0
Drive Chart Drive Started Drive Ended ConsumedTeam Qtr Spot Time Obtained Spot Time How Lost Pl-Yds TOPUG 1st G12 15:00 Kickoff G24 12:13 Punt 6-12 2:47UG 1st G31 9:34 Missed FG L31 9:25 Interception 1-38 0:09UG 1st G41 7:09 Punt G46 5:08 Punt 5-5 2:01UG 1st G15 9:34 Kickoff G00 3:11 Safety 4-(-15) 6:23UG 2nd G20 14:51 Kickoff G05 13:04 Punt 3-(-15) 1:47UG 2nd G21 9:37 Kickoff L34 6:38 Field Goal 9-45 2:59UG 2nd G19 4:26 Punt G19 3:48 Punt 3-0 0:38UG 2nd G15 2:13 Punt G24 0:00 Punt 4-9 2:13UG 3rd L44 13:02 Interception L41 11:19 Punt 3-3 1:43UG 3rd L43 9:08 Punt L31 7:46 Field Goal 5-12 1:22UG 3rd G11 5:01 Punt G17 4:17 Interception 2-6 0:44UG 3rd G28 4:17 Kickoff L00 3:40 Touchdown 4-72 0:37UG 4th G14 14:54 Kickoff L10 11:26 Downs 10-76 3:28UG 4th G16 7:12 Kickoff L44 5:09 Downs 7-40 2:03UG 4th G16 3:48 Punt G16 3:35 Interception 2-0 0:13Avg. Starting Field Position: UG24 Three and Out: 3
Drive Chart Drive Started Drive Ended ConsumedTeam Qtr Spot Time Obtained Spot Time How Lost Pl-Yds TOPLSU 1st G46 12:13 Punt G31 9:34 Missed FG 7-15 2:39LSU 1st L08 9:25 Interception L06 7:09 Punt 3-(-2) 2:16LSU 1st L13 5:08 Punt G00 4:49 Touchdown 1-87 0:19LSU 1st L29 3:11 Kickoff G00 14:51 Touchdown 7-71 3:20LSU 2nd G37 13:04 Punt G17 9:37 Field Goal 8-20 3:27LSU 2nd L20 6:38 Kickoff L29 4:26 Punt 3-9 2:12LSU 2nd G47 3:48 Punt L48 2:13 Punt 3-(-5) 1:35LSU 2nd L29 0:00 Punt L29 15:00 End of Half 0-0 0:00LSU 3rd L20 15:00 Kickoff L34 13:02 Interception 5-14 1:58LSU 3rd L12 11:19 Punt L09 9:08 Punt 3-(-3) 2:11LSU 3rd L24 7:46 Kickoff L42 5:01 Punt 6-18 2:45LSU 3rd G00 4:17 Interception G00 4:17 Touchdown 0-0 0:00LSU 3rd L22 3:40 Kickoff G00 14:54 Touchdown 9-78 3:46LSU 4th L10 11:26 Downs G05 7:12 Field Goal 7-85 4:14LSU 4th L44 5:09 Downs L41 3:48 Punt 3-(-3) 1:21LSU 4th G44 3:35 Interception G14 0:00 End of Half 6-30 3:35Avg. Starting Field Position: LSU30 Three and Out: 5
Scoring SummaryQtr Time Scoring Play Ply-Yds Time UG-LSU1st 4:49 LSU - Justin Vincent 87 run (Chris Jackson kick failed) 1-87 0:19 0-61st 3:11 LSU - Team safety - - 0-82nd 14:51 LSU - Michael Clayton 43 pass from Matt Mauck (Chris Jackson kick blocked) 7-71 3:20 0-142nd 9:37 LSU - Ryan Gaudet 35 field goal 8-20 3:27 0-172nd 6:38 UG - Billy Bennett 51 field goal 9-45 2:59 3-173rd 7:46 UG - Billy Bennett 49 field goal 5-12 1:22 6-173rd 4:17 LSU - Lionel Turner 18 interception return (Ryan Gaudet kick) - - 6-243rd 3:40 UG - Ben Watson 18 pass from David Greene (Billy Bennett kick) 4-72 0:37 13-244th 14:54 LSU - Justin Vincent 3 run (Ryan Gaudet kick) 9-78 3:46 13-314th 7:12 LSU - Ryan Gaudet 22 field goal 7-85 4:14 13-34

56 SEC Championship Game Record Book
2002 SEC CHAMPIONSHIPGeorgia (12-1) 30, Arkansas (9-4) 3Dec. 7, 2002 | Atlanta, Ga. (Georgia Dome)Attendance: 74,835 | TV: CBSKickoff Time: 6:13 p.m. | End of Game: 9:37 p.m. | Time of Game: 3:24Officials: Referee: Penn Wagers; Umpire: Mike Wallace; Linesman: Gus Morris; Line Judge: Terry Walters; Back Judge: Jimmy Buchanan; Field Judge: Dan Moore; Side Judge: Len Harrington.
Score by Quarters 1 2 3 4 TotalArkansas 0 0 3 0 3Georgia 17 6 0 7 30
AR UGFIRST DOWNS 12 25Rushing 5 9Passing 4 12Penalty 3 4NET YARDS RUSHING 65 124Rushing Attempts 35 40Average Per Rush 1.9 3.1Rushing Touchdowns 0 2Yards Gained Rushing 113 156Yards Lost Rushing 48 32NET YARDS PASSING 74 257Completions-Attempts-Int 10-21-0 19-33-0Average Per Attempt 3.5 7.8Average Per Completion 7.4 13.5Passing Touchdowns 0 1TOTAL OFFENSIVE YARDS 139 381Total Offensive Plays 56 73Average Gain Per Play 2.5 5.2Fumbles: Number-Lost 0-0 0-0Penalties: Number-Yards 10-95 12-115PUNTS-YARDS 9-299 3-137Average Yards Per Punt 33.2 45.7Net Yards Per Punt 29.2 35.7Inside 20 3 050+ Yards 0 1Touchbacks 0 1Fair Catch 3 1KICKOFFS-YARDS 2-129 7-438Average Yards Per Kickoff 64.5 62.6Net Yards Per Kickoff 41.5 48.6Touchbacks 0 0Punt Returns: Number-Yards-TD 1-10-0 6-36-0Average Per Return 10.0 6.0Kickoff Returns: Number-Yards-TD 5-98-0 2-46-0Average Per Return 19.6 23.0Interceptions: Number-Yards-TD 0-0-0 0-0-0Fumble Returns: Number-Yards-TD 0-0-0 0-0-0Miscellaneous Yards 0 0Possession Time 28:39 31:211st Quarter 10:33 4:272nd Quarter 5:37 9:233rd Quarter 8:50 6:104th Quarter 3:39 11:21Third-Down Conversions 3 of 14 5 of 15Fourth-Down Conversions 0 of 1 0 of 1Red Zone Scores-Chances 1-1 5-6Touchdowns 0 3Field Goals 1 2Sacks By: Number-Yards 1-8 4-26PAT Kicks 0-0 3-3Field Goals 1-1 3-3
ArkansasRushing No Gain Loss Net TD Lg AvgFred Talley 17 56 5 51 0 12 3.0 De’Arrius Howard 3 14 0 14 0 13 4.7 Matt Jones 9 34 22 12 0 13 1.3 Kyle Dickerson 2 7 0 7 0 7 3.5 Cedric Cobbs 1 2 0 2 0 2 2.0 Tarvais Jackson 1 0 4 -4 0 0 -4.0 Decori Birmingham 1 0 4 -4 0 0 -4.0 Dedrick Poole 1 0 13 -13 0 0 -13.0 Totals 35 113 48 65 0 13 1.9
Passing C-A-I Yds TD Lg SackMatt Jones 9-17-0 60 0 16 3 Tarvaris Jackson 1-4-0 14 0 14 1 Totals 10-21-0 74 0 16 4
Receiving No Yards TD LgRichard Smith 5 36 0 13 Decori Birmingham 2 12 0 16 Sparky Hamilton 1 14 0 14 George Wilson 1 10 0 10 Mark Pierce 1 2 0 2 Totals 10 74 0 16
Punting No Yds Avg Lg In20 TBRichie Butler 8 299 37.4 48 3 0 Team 1 0 0.0 0 0 0 Totals 9 299 33.2 48 3 0
Punt Kickoff InterceptReturns No-Yds-Lg No-Yds-Lg No-Yds-LgDecori Birmingham 1-10-10 4-66-17 0-0-0 Cedric Cobbs 0-0-0 1-32-32 0-0-0 Totals 1-10-10 5-98-32 0-0-0
Field Goals Qtr Time Dist ResultDavid Carlton 3rd 0:52 27 good
Kickoffs No Yards Avg TB OBDavid Carlton 2 129 64.5 0 0
All-Purpose Run Rcv KR PR IR TotalDecori Birmingham -4 12 66 10 0 84
GeorgiaRushing No Gain Loss Net TD Lg AvgMusa Smith 19 112 6 106 2 21 5.6 David Greene 4 25 8 17 0 10 4.2 Tony Milton 8 14 8 6 0 10 0.8 Tyson Browning 2 3 0 3 0 2 1.5 J.T. Wall 2 2 0 2 0 2 1.0 D.J. Shockley 1 0 3 -3 0 0 -3.0 Team 4 0 7 -7 0 0 -1.8 Totals 40 156 32 124 2 21 3.1
Passing C-A-I Yds TD Lg SackDavid Greene 17-29-0 237 1 44 1 D.J. Shockley 2-4-0 20 0 11 0 Totals 19-33-0 257 1 44 1
Receiving No Yards TD LgTerrence Edwards 7 92 0 22 Fred Gibson 5 93 0 44 Reggie Brown 3 29 0 11 J.T. Wall 1 22 0 22 Benjamin Watson 1 20 1 20 Tony Milton 1 2 0 2 Musa Smith 1 -1 0 0 Totals 19 257 1 44
Punting No Yds Avg Lg In20 TBJonathan Kilgo 3 137 45.7 59 0 1 Punt Kickoff InterceptReturns No-Yds-Lg No-Yds-Lg No-YdsDamien Gary 5-19-9 0-0-0 0-0-0 Decory Bryant 1-10-0 0-0-0 0-0-0 Burt Jones 0-7-7 0-0-0 0-0-0 Fred Gibson 0-0-0 2-46-28 0-0-0 Totals 6-36-9 2-46-28 0-0-0

57SEC Championship Game Record Book
Field Goals Qtr Time Dist ResultBilly Bennett 1st 3:54 29 good Billy Bennett 2nd 12:10 42 good Billy Bennett 2nd 6:24 39 good
Kickoffs No Yards Avg TB OBBrett Kirouac 7 438 62.6 0 0
All-Purpose Run Rcv KR PR IR TotalFred Gibson 0 93 46 0 0 139Musa Smith 106 -1 0 0 0 105
Fumbles: Arkansas-None. Georgia-None.
Defensive LeadersArkansas Solo Ast Total Sacks-Yds TFL-Yds FF FR-Yds Int-Yds BrUp Blks QBHKen Hamlin 7 6 13 - 1.0-6 - - - - - -Clarke Moore 4 5 9 - 2.0-2 - - - - - 1Tony Bua 5 3 8 - - - - - - - -Totals 52 42 94 1-8 7-26 0 0-0 0-0 6 0 2
Georgia Solo Ast Total Sacks-Yds TFL-Yds FF FR-Yds Int-Yds BrUp Blks QBHBoss Bailey 3 3 6 1.0-6 2.0-10 - - - - - -Tony Gilbert 5 0 5 - 2.0-14 - - - 1 - -Chris Clemons 2 3 5 - 2.0-7 - - - - - -Totals 40 18 58 4-26 11-56 0 0-0 0-0 3 1 0
Drive Chart Drive Started Drive Ended ConsumedTeam Qtr Spot Time Obtained Spot Time How Lost Pl-Yds TOPAR 1st A21 15:00 Kickoff A19 12:00 Punt 3-(-2) 3:00 AR 1st A21 11:58 Kickoff A25 10:17 Punt 3-4 1:41 AR 1st A20 8:49 Kickoff A28 6:32 Punt 3-8 2:17 AR 1st A20 3:54 Kickoff A33 0:19 Punt 5-13 3:35 AR 2nd A35 12:10 Kickoff G39 9:46 Punt 5-26 2:24 AR 2nd A11 6:24 Kickoff A46 3:11 Punt 7-35 3:13 AR 3rd A21 11:31 Punt A35 9:01 Punt 5-14 2:30 AR 3rd A35 7:12 Punt G10 0:52 Field Goal 13-55 6:20 AR 4th A17 12:08 Kickoff A18 11:23 Punt 3-1 0:45 AR 4th A04 7:08 Downs A07 5:23 Punt 3-3 1:45 AR 4th A20 2:54 Punt A32 1:45 Downs 7-12 1:09 Avg. Starting Field Position: AR20 Three and Out: 5
Drive Chart Drive Started Drive Ended ConsumedTeam Qtr Spot Time Obtained Spot Time How Lost Pl-Yds TOPUG 1st A09 12:00 Punt A00 11:58 Touchdown 1-9 0:02 UG 1st G38 10:17 Punt A00 8:49 Touchdown 5-62 1:28 UG 1st G37 6:32 Punt A11 3:54 Field Goal 7-52 2:38 UG 1st G33 0:19 Punt A25 12:10 Field Goal 9-42 3:09 UG 2nd G28 9:46 Punt A22 6:24 Field Goal 9-50 3:22 UG 2nd G18 3:11 Punt G43 15:00 End of Half 12-25 3:11 UG 3rd G28 15:00 Kickoff G30 11:31 Punt 6-2 3:29 UG 3rd G19 9:01 Punt G38 7:12 Punt 5-19 1:49 UG 3rd G19 0:52 Kickoff A00 12:08 Touchdown 8-81 3:44 UG 4th G49 11:23 Punt A04 7:08 Downs 8-47 4:15 UG 4th A44 5:23 Punt A40 2:54 Punt 3-4 2:29 UG 4th A32 1:45 Downs A38 0:00 End of Half 3-(-6) 1:45 Avg. Starting Field Position: UG40 Three and Out: 1
Scoring SummaryQtr Time Scoring Play Ply-Yds Time AR-UG1st 11:58 UG -- Musa Smith 2 run (Billy Bennett kick) 1-9 0:02 0-71st 08:49 UG -- Musa Smith 17 run (Billy Bennett kick) 5-62 1:28 0-141st 03:54 UG -- Billy Bennett 29 field goal 7-52 2:38 0-17
2nd 12:10 UG -- Billy Bennett 42 field goal 9-42 3:09 0-202nd 6:24 UG -- Billy Bennett 39 field goal 9-50 3:22 0-23
3rd 0:52 AR -- David Carlton 27 field goal 13-55 6:20 3-23
4th 12:08 UG -- Benjamin Watson 20 pass from David Greene (Billy Bennett kick) 8-81 3:44 3-30

58 SEC Championship Game Record Book
2001 SEC CHAMPIONSHIPLSU (9-3) 31, Tennessee (10-2) 20Dec. 8, 2001 | Atlanta, Ga. (Georgia Dome)Attendance: 74,843 | TV: CBSKickoff Time: 8:16 p.m. | End of Game: 11:46 p.m. | Time of Game: 3:30Officials: Referee: Steve Shaw; Umpire: Butch Lambert; Linesman: Lane Thomas; Line Judge: Mike Taylor; Back Judge: Prince Pollard; Field Judge: Charlie Showalter; Side Judge: Matt Moore
Score by Quarters 1 2 3 4 TotalTennessee 0 17 0 3 20LSU 7 3 6 15 31
UT LSUFIRST DOWNS 17 20Rushing 3 10Passing 13 8Penalty 1 2NET YARDS RUSHING 50 134Rushing Attempts 18 42Average Per Rush 2.8 3.2Rushing Touchdowns 0 3Yards Gained Rushing 52 161Yards Lost Rushing 2 27NET YARDS PASSING 332 151Completions-Attempts-Int 27-43-0 14-35-0Average Per Attempt 7.7 4.3Average Per Completion 12.3 10.8Passing Touchdowns 2 0TOTAL OFFENSIVE YARDS 382 285Total Offensive Plays 61 77Average Gain Per Play 6.3 3.7Fumbles: Number-Lost 2-2 0-0Penalties: Number-Yards 10-78 5-32PUNTS-YARDS 4-157 4-181Average Yards Per Punt 39.2 45.2Net Yards Per Punt 32.0 41.0Inside 20 0 250+ Yards 0 2Touchbacks 1 0Fair Catch 1 1KICKOFFS-YARDS 5-310 7-401Average Yards Per Kickoff 62.0 57.3Net Yards Per Kickoff 53.6 43.1Touchbacks 2 1Punt Returns: Number-Yards-TD 2-17-0 2-29-0Average Per Return 8.5 14.5Kickoff Returns: Number-Yards-TD 6-99-0 3-42-0Average Per Return 16.5 14.0Interceptions: Number-Yards-TD 0-0-0 0-0-0Fumble Returns: Number-Yards-TD 0-0-0 1-10-0Miscellaneous Yards 0 0Possession Time 25:39 34:211st Quarter 5:47 9:132nd Quarter 6:05 8:553rd Quarter 7:48 7:124th Quarter 5:59 9:01Third-Down Conversions 4 of 12 9 of 20Fourth-Down Conversions 0 of 2 1 of 2Red Zone Scores-Chances 2-2 3-3Touchdowns 1 3Field Goals 1 0Sacks By: Number-Yards 2-11 1-2PAT Kicks 2-2 2-2Field Goals 2-2 3-4
TennesseeRushing No Gain Loss Net TD Lg AvgTravis Stephens 14 37 0 37 0 9 2.6Donte Stallworth 1 11 0 11 0 11 11.0Casey Clausen 3 4 2 2 0 3 0.7Totals 18 52 2 50 0 11 2.8
Passing C-A-I Yds TD Lg SackCasey Clausen 27-43-0 332 2 47 1
Receiving No Yards TD LgKelley Washington 9 140 1 47Donte Stallworth 7 96 0 18Jason Witten 3 40 0 28Bobby Graham 2 24 0 13Will Bartholomew 2 18 0 10Travis Stephens 2 7 0 4Eric Parker 1 4 0 4Troy Fleming 1 3 1 3Totals 27 332 2 47
Punting No Yds Avg Lg In20 TBDustin Colquitt 4 157 39.2 44 0 0
Punt Kickoff InterceptReturns No-Yds-Lg No-Yds-Lg No-Yds-LgDonte Stallworth 1-15-15 0-0-0 0-0-0Eric Parker 1-2-2 0-0-0 0-0-0Derrick Tinsley 0-0-0 3-49-17 0-0-0Leonard Scott 0-0-0 2-22-15 0-0-0Corey Larkins 0-0-0 1-28-28 0-0-0Totals 2-17-15 6-99-28 0-0-0
Field Goals Qtr Time Dist ResultAlex Walls 2nd 3:52 51 goodAlex Walls 4th 9:55 21 good
Kickoffs No Yards Avg TB OBAlex Walls 5 310 62.0 2 0
All-Purpose Run Rcv KR PR IR TotalKelley Washington 0 140 0 0 0 140Donte Stallworth 11 96 0 15 0 122
LSURushing No Gain Loss Net TD Lg AvgDomanick Davis 16 80 2 78 1 14 4.9Matt Mauck 12 50 7 43 2 13 3.6Labrandon Toefield 7 18 0 18 0 9 2.6Rohan Davey 4 13 8 5 0 11 1.2Team 3 0 10 -10 0 0 -3.3Totals 42 161 27 134 3 14 3.2
Passing C-A-I Yds TD Lg SackRohan Davey 9-20-0 84 0 24 1Matt Mauck 5-15-0 67 0 21 1Totals 14-35-0 151 0 24 2
Receiving No Yards TD LgJosh Reed 4 60 0 24Michael Clayton 4 54 0 21Robert Royal 2 17 0 9Jerel Myers 2 13 0 8Labrandon Toefield 1 5 0 5Devery Henderson 1 2 0 2Totals 14 151 0 24
Punting No Yds Avg Lg In20 TBDonnie Jones 4 181 45.2 58 2 0 Punt Kickoff InterceptReturns No-Yds-Lg No-Yds-Lg No-YdsDomanick Davis 2-29-23 3-42-16 0-0-0
Field Goals Qtr Time Dist ResultJohn Corbello 2nd 11:49 43 missedJohn Corbello 2nd 0:29 45 goodJohn Corbello 3rd 11:51 47 goodJohn Corbello 3rd 2:45 45 good
Kickoffs No Yards Avg TB OBJohn Corbello 7 401 57.3 1 0

59SEC Championship Game Record Book
All-Purpose Run Rcv KR PR IR TotalDomanick Davis 78 0 42 29 0 149
Fumbles: Tennessee-Donte Stallworth 1-1; Travis Stephens 1-1. LSU-None.
Defensive LeadersTennessee Solo Ast Total Sacks-Yds TFL-Yds FF FR-Yds Int-Yds BrUp Blks QBHEddie Moore 5 3 8 0.5-2 0.5-2 - - - 1 - -Julian Battle 5 0 5 - - - - - 1 - -Dominique Stevenson 4 1 5 - 1.0-2 - - - - - -Keyon Whiteside 4 1 5 - - - - - - - - Totals 47 12 59 2-11 4-17 0 0-0 0-0 5 0 0
LSU Solo Ast Total Sacks-Yds TFL-Yds FF FR-Yds Int-Yds BrUp Blks QBHBradie James 5 5 10 - - - - - - - -Randall Gay 2 3 5 - - - - - - - -Totals 41 14 55 1-2 1-2 2 2-10 0-0 3 0 0
Drive Chart Drive Started Drive Ended ConsumedTeam Qtr Spot Time Obtained Spot Time How Lost Pl-Yds TOPUT 1st T08 12:36 Punt T10 11:30 Punt 3-2 1:06UT 1st T28 8:14 Kickoff L44 4:19 Punt 6-28 3:55UT 1st T14 0:46 Punt T10 14:01 Punt 3-(-4) 1:45UT 2nd T27 11:49 Missed FG L00 9:04 Touchdown 6-73 2:45UT 2nd T32 7:21 Punt L00 6:18 Touchdown 4-68 1:03UT 2nd L22 4:41 Downs L34 3:52 Field Goal 4-(-12) 0:49UT 2nd T40 0:29 Kickoff L45 15:00 End of half 3-15 0:29UT 3rd T17 15:00 Kickoff T20 13:27 Punt 3-3 1:33UT 3rd T20 11:51 Kickoff L38 6:52 Downs 9-42 4:59UT 3rd T25 2:45 Kickoff T49 1:29 Fumble 3-24 1:16UT 4th T28 14:20 Kickoff L04 9:55 Field Goal 11-68 4:25UT 4th T48 8:38 Punt L34 8:30 Fumble 1-18 0:08UT 4th T15 2:26 Kickoff L49 1:00 Downs 7-36 1:26Avg. Starting Field Position: UT29 Three and Out: 3
Drive Chart Drive Started Drive Ended ConsumedTeam Qtr Spot Time Obtained Spot Time How Lost Pl-Yds TOPLS 1st L23 15:00 Kickoff L40 12:36 Punt 6-17 2:24LS 1st T41 11:30 Punt T00 8:14 Touchdown 8-41 3:16LS 1st L20 4:19 Punt T48 0:46 Punt 8-32 3:33LS 2nd T26 14:01 Punt T26 11:49 Missed FG 4-0 2:12LS 2nd L20 9:04 Kickoff L25 7:21 Punt 3-5 1:43LS 2nd L13 6:18 Kickoff L22 4:41 Downs 4-9 1:37LS 2nd L21 3:52 Kickoff T28 0:29 Field Goal 10-51 3:23LS 3rd L43 13:27 Punt T29 11:51 Field Goal 5-28 1:36LS 3rd L39 6:52 Downs T28 2:45 Field Goal 11-33 4:07LS 3rd T49 1:29 Fumble T00 14:20 Touchdown 5-49 2:09LS 4th L20 9:55 Kickoff L19 8:38 Punt 3--1 1:17LS 4th L35 8:30 Fumble T00 2:26 Touchdown 13-65 6:04LS 4th L49 1:00 Downs L39 0:00 End of Half 3-(-10) 1:00Avg. Starting Field Position: LSU35 Three and Out: 2
Scoring SummaryQtr Time Scoring Play Ply-Yds Time UT-LSU1st 8:14 LSU - Matt Mauck 4 run (John Corbello kick) 8-41 3:16 0-7
2nd 9:04 UT - Kelley Washington 31 pass from Casey Clausen (Alex Walls kick) 6-73 2:45 7-72nd 6:18 UT - Troy Fleming 3 pass from Casey Clausen (Alex Walls kick) 4-68 1:03 14-72nd 3:52 UT - Alex Walls 51 field goal 4-(-12) 0:49 17-72nd 0:29 LSU - John Corbello 45 field goal 10-51 3:23 17-10
3rd 11:51 LSU - John Corbello 47 field goal 5-28 1:36 17-133rd 2:45 LSU - John Corbello 45 field goal 11-33 4:07 17-16
4th 14:20 LSU - Matt Mauck 13 run (Josh Reed pass from Matt Mauck) 5-49 2:09 17-244th 9:55 UT - Alex Walls 21 field goal 11-68 4:25 20-244th 2:26 LSU - Domanick Davis 1 run (John Corbello kick) 13-65 6:04 20-31

60 SEC Championship Game Record Book
2000 SEC CHAMPIONSHIPFlorida (10-2) 28, Auburn (9-3) 6Dec. 2, 2000 | Atlanta, Ga. (Georgia Dome)Attendance: 73,427 | TV: ABCKickoff Time: 4:35 p.m. | End of Game: 7:50 p.m. | Time of Game: 3:15Officials: Referee: Doyle Jackson; Umpire: Jim Allison; Linesman: Ron Leath-erwood; Line Judge: James Bing; Back Judge: Mike New; Field Judge: Eddie Powers; Side Judge: Gerald Hodges.
Score by Quarters 1 2 3 4 TotalFlorida 14 7 7 0 28Auburn 0 3 3 0 6
UF AUFIRST DOWNS 20 19Rushing 9 6Passing 11 11Penalty 0 2NET YARDS RUSHING 191 120Rushing Attempts 35 28Average Per Rush 5.5 4.3Rushing Touchdowns 0 0Yards Gained Rushing 227 137Yards Lost Rushing 36 17NET YARDS PASSING 238 208Completions-Attempts-Int 17-26-1 23-43-2Average Per Attempt 9.2 4.8Average Per Completion 14.0 9.0Passing Touchdowns 4 0TOTAL OFFENSIVE YARDS 429 328Total Offensive Plays 61 71Average Gain Per Play 7.0 4.6Fumbles: Number-Lost 4-2 3-2Penalties: Number-Yards 8-61 5-19PUNTS-YARDS 4-178 5-206Average Yards Per Punt 44.5 41.2Net Yards Per Punt 41.2 35.2Inside 20 1 150+ Yards 1 1Touchbacks 1 1Fair Catch 1 1KICKOFFS-YARDS 5-319 2-127Average Yards Per Kickoff 63.8 63.5Net Yards Per Kickoff 57.0 41.5Touchbacks 3 0Punt Returns: Number-Yards-TD 2-30-0 1-13-0Average Per Return 15.0 13.0Kickoff Returns: Number-Yards-TD 2-44-0 2-34-0Average Per Return 22.0 17.0Interceptions: Number-Yards-TD 2-31-0 1-3-0Fumble Returns: Number-Yards-TD 0-0-0 1-(-3)-0Miscellaneous Yards 0 0Possession Time 28:11 31:491st Quarter 4:27 10:332nd Quarter 6:13 8:473rd Quarter 7:22 7:384th Quarter 10:09 4:51Third-Down Conversions 7 of 12 8 of 17Fourth-Down Conversions 0 of 1 1 of 2Red Zone Scores-Chances 0-0 0-0Touchdowns 0 0Field Goals 0 0Sacks By: Number-Yards 1-2 1-21PAT Kicks 4-4 0-0Field Goals 0-0 2-2
FloridaRushing No Gain Loss Net TD Lg AvgEarnest Graham 19 171 2 169 0 25 8.9Robert Gillespie 11 51 6 45 0 21 4.1Rex Grossman 5 5 28 -23 0 5 -4.6Totals 35 227 36 191 0 25 5.5
Passing C-A-I Yds TD Lg SackRex Grossman 17-26-1 238 4 66 1
Receiving No Yards TD LgJabar Gaffney 5 84 1 27Reche Caldwell 3 91 2 66Robert Gillespie 3 19 0 7Aaron Walker 2 27 0 15Brian Haugabrook 2 10 1 12Rod Frazier 1 9 0 9Earnest Graham 1 -2 0 0Totals 17 238 4 66
Punting No Yds Avg Lg In20 TBAlan Rhine 4 178 44.5 65 1 1
Punt Kickoff InterceptReturns No-Yds-Lg No-Yds-Lg No-Yds-LgLito Sheppard 2-30-18 1-27-27 2-31-24Keiwan Ratliff 0-0-0 1-17-17 0-0-0Totals 2-30-18 2-44-27 2-31-24
Field Goals Qtr Time Dist ResultNone
Kickoffs No Yards Avg TB OBJeff Chandler 5 319 63.8 3 0
All-Purpose Run Rcv KR PR IR TotalEarnest Graham 169 -2 0 0 0 167
AuburnRushing No Gain Loss Net TD Lg AvgHeath Evans 8 69 0 69 0 24 8.6Rudi Johnson 17 59 12 47 0 12 2.8Tim Carter 1 9 0 9 0 9 9.0Ben Leard 1 0 2 -2 0 0 -2.0Jeff Klein 1 0 3 -3 0 0 -3.0Totals 28 137 17 120 0 24 4.3
Passing C-A-I Yds TD Lg SackBen Leard 17-30-1 158 0 21 1Jeff Klein 6-13-1 50 0 13 0Totals 23-43-2 208 0 21 1
Receiving No Yards TD LgHeath Evans 4 45 0 21Lorenzo Diamond 4 42 0 15Deandre Green 3 25 0 9Clifton Robinson 3 24 0 20Ronney Daniels 3 22 0 11Rudi Johnson 2 21 0 11Reggie Worthy 1 10 0 10Marcel Willis 1 10 0 10Tim Carter 1 6 0 6Jeris McIntyre 1 3 0 3Totals 23 208 0 21
Punting No Yds Avg Lg In20 TBDamon Duval 5 206 41.2 52 1 1 Punt Kickoff InterceptReturns No-Yds-Lg No-Yds-Lg No-YdsClifton Robinson 1-13-13 0-0-0 0-0-0Roderick Hood 0-0-0 1-25-25 0-0-0Travaris Robinson 0-0-0 1-9-9 0-0-0Rodney Crayton 0-0-0 0-0-0 1-3-3Totals 1-13-13 2-34-25 1-3-3
Field Goals Qtr Time Dist ResultDamon Duval 2nd 0:00 44 goodDamon Duval 3rd 9:43 21 good
Kickoffs No Yards Avg TB OBDamon Duval 2 127 63.5 0 0

61SEC Championship Game Record Book
All-Purpose Run Rcv KR PR IR TotalHeath Evans 69 45 0 0 0 114
Fumbles: Florida-Rex Grossman 3-1; Earnest Graham 1-1. Auburn-Jeff Klein 1-0; Rudi Johnson 1-1; Reggie Worthy 1-1.
Defensive LeadersFlorida Solo Ast Total Sacks-Yds TFL-Yds FF FR-Yds Int-Yds BrUp Blks QBHByron Hardmon 6 1 7 - - - - - - - -Mike Nattiel 4 0 4 - - - 2-0 - - - -Alex Brown 4 0 4 - - - - - 2 - -Todd Johnson 2 2 4 - - - - - 1 - -Totals 44 4 48 1-2 3-14 1 2-0 2-31 6 0 0
Auburn Solo Ast Total Sacks-Yds TFL-Yds FF FR-Yds Int-Yds BrUp Blks QBHDontarrious Thomas 8 0 8 - 2.0-3 - - - - - -DeMarco McNeil 4 1 5 - 1.0-2 - 1-0 - - - -Totals 42 8 50 1-21 8-35 1 2-(-3) 1-3 1 0 0
Drive Chart Drive Started Drive Ended ConsumedTeam Qtr Spot Time Obtained Spot Time How Lost Pl-Yds TOPUF 1st A41 14:40 Fumble A00 13:09 Touchdown 5-41 1:31UF 1st F41 9:18 Punt F42 7:57 Punt 3-1 1:21UF 1st F31 4:17 Interception A00 2:42 Touchdown 3-69 1:35UF 2nd F03 11:06 Fumble A00 8:19 Touchdown 8-97 2:47UF 2nd F38 5:46 Punt F14 4:33 Punt 3-(-24) 1:13UF 2nd F17 2:48 Punt A37 0:35 Interception 6-46 2:13UF 3rd F17 15:00 Kickoff F24 13:18 Fumble 3-7 1:42UF 3rd F20 9:43 Kickoff A00 5:17 Touchdown 11-80 4:26UF 3rd F20 3:05 Punt F45 2:54 Fumble 1-25 0:11UF 3rd F23 1:03 Downs F35 12:47 Punt 6-12 3:16UF 4th F29 10:40 Punt A32 5:13 Downs 9-39 5:27UF 4th F49 3:36 Interception F49 1:07 Punt 3-0 2:29Avg. Starting Field Position: UF28 Three and Out: 2
Drive Chart Drive Started Drive Ended ConsumedTeam Qtr Spot Time Obtained Spot Time How Lost Pl-Yds TOPAU 1st A31 15:00 Kickoff A41 14:40 Fumble 1-10 :20AU 1st A09 13:09 Kickoff A32 9:18 Punt 8-23 3:51AU 1st A31 7:57 Punt F22 4:17 Interception 12-47 3:40AU 1st A20 2:42 Kickoff F03 11:06 Fumble 13-77 6:36AU 2nd A20 8:19 Kickoff A39 5:46 Punt 5-19 2:33AU 2nd A48 4:33 Punt F44 2:48 Punt 3-8 1:45AU 2nd A35 0:35 Interception F27 15:00 Field Goal 5-38 0:35AU 3rd F23 13:18 Fumble F05 9:43 Field Goal 7-18 3:35AU 3rd A20 5:17 Kickoff A48 3:05 Punt 4-28 2:12AU 3rd F48 2:54 Fumble F22 1:03 Downs 7-26 1:51AU 4th A20 12:47 Punt A24 10:40 Punt 3-4 2:07AU 4th A32 5:13 Downs A43 3:36 Interception 4-11 1:37AU 4th A16 1:07 Punt A35 0:00 End of Half 3-19 1:07Avg. Starting Field Position: AU31 Three and Out: 2
Scoring SummaryQtr Time Scoring Play Ply-Yds Time UF-AU1st 13:09 UF - Reche Caldwell 10 pass from Rex Grossman (Jeff Chandler kick) 5-41 1:31 7-01st 2:42 UF - Reche Caldwell 66 pass from Rex Grossman (Jeff Chandler kick) 3-69 1:35 14-0
2nd 8:19 UF - Jabar Gaffney 27 pass from Rex Grossman (Jeff Chandler kick) 8-97 2:47 21-02nd 0:00 AU - Damon Duval 44 field goal 5-38 0:35 21-3
3rd 9:43 AU - Damon Duval 21 field goal 7-18 3:35 21-63rd 5:17 UF - Brian Haugabrook 12 pass from Rex Grossman (Jeff Chandler kick) 11-80 4:26 28-6
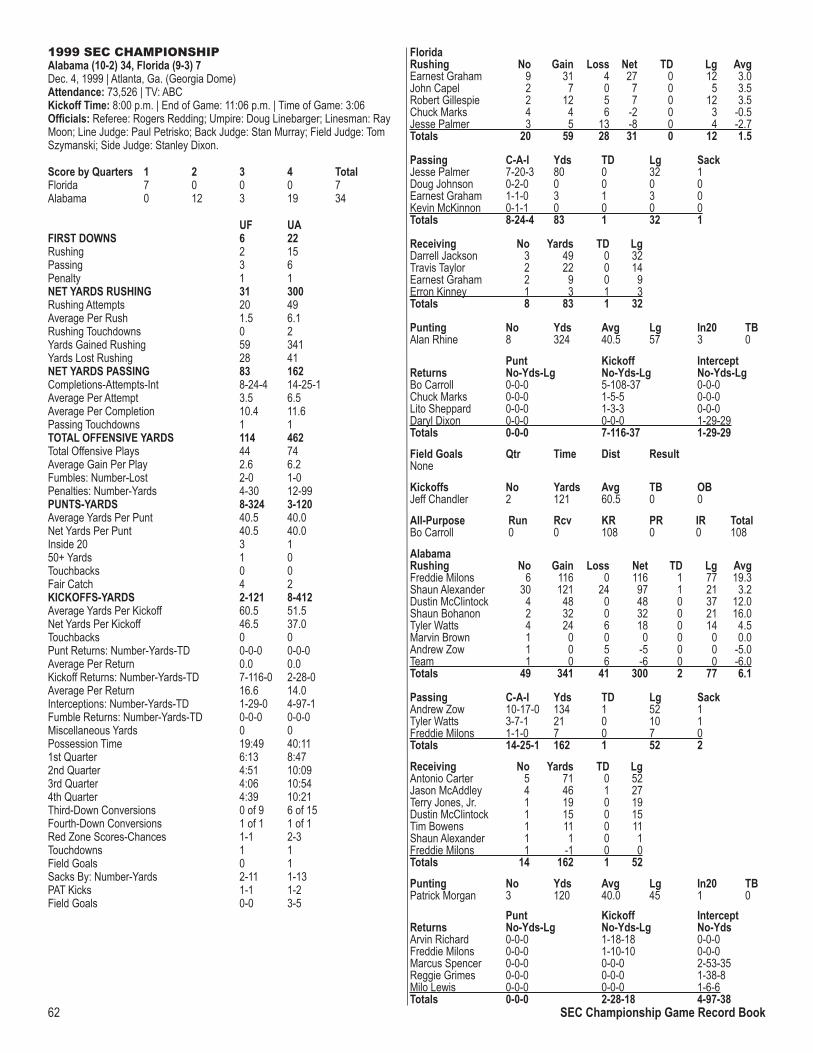
62 SEC Championship Game Record Book
1999 SEC CHAMPIONSHIPAlabama (10-2) 34, Florida (9-3) 7 Dec. 4, 1999 | Atlanta, Ga. (Georgia Dome)Attendance: 73,526 | TV: ABCKickoff Time: 8:00 p.m. | End of Game: 11:06 p.m. | Time of Game: 3:06Officials: Referee: Rogers Redding; Umpire: Doug Linebarger; Linesman: Ray Moon; Line Judge: Paul Petrisko; Back Judge: Stan Murray; Field Judge: Tom Szymanski; Side Judge: Stanley Dixon.
Score by Quarters 1 2 3 4 TotalFlorida 7 0 0 0 7Alabama 0 12 3 19 34
UF UAFIRST DOWNS 6 22Rushing 2 15Passing 3 6Penalty 1 1NET YARDS RUSHING 31 300Rushing Attempts 20 49Average Per Rush 1.5 6.1Rushing Touchdowns 0 2Yards Gained Rushing 59 341Yards Lost Rushing 28 41NET YARDS PASSING 83 162Completions-Attempts-Int 8-24-4 14-25-1Average Per Attempt 3.5 6.5Average Per Completion 10.4 11.6Passing Touchdowns 1 1TOTAL OFFENSIVE YARDS 114 462Total Offensive Plays 44 74Average Gain Per Play 2.6 6.2Fumbles: Number-Lost 2-0 1-0Penalties: Number-Yards 4-30 12-99PUNTS-YARDS 8-324 3-120Average Yards Per Punt 40.5 40.0Net Yards Per Punt 40.5 40.0Inside 20 3 150+ Yards 1 0Touchbacks 0 0Fair Catch 4 2KICKOFFS-YARDS 2-121 8-412Average Yards Per Kickoff 60.5 51.5Net Yards Per Kickoff 46.5 37.0Touchbacks 0 0Punt Returns: Number-Yards-TD 0-0-0 0-0-0Average Per Return 0.0 0.0Kickoff Returns: Number-Yards-TD 7-116-0 2-28-0Average Per Return 16.6 14.0Interceptions: Number-Yards-TD 1-29-0 4-97-1Fumble Returns: Number-Yards-TD 0-0-0 0-0-0Miscellaneous Yards 0 0Possession Time 19:49 40:111st Quarter 6:13 8:472nd Quarter 4:51 10:093rd Quarter 4:06 10:544th Quarter 4:39 10:21Third-Down Conversions 0 of 9 6 of 15Fourth-Down Conversions 1 of 1 1 of 1Red Zone Scores-Chances 1-1 2-3Touchdowns 1 1Field Goals 0 1Sacks By: Number-Yards 2-11 1-13PAT Kicks 1-1 1-2Field Goals 0-0 3-5
FloridaRushing No Gain Loss Net TD Lg AvgEarnest Graham 9 31 4 27 0 12 3.0John Capel 2 7 0 7 0 5 3.5Robert Gillespie 2 12 5 7 0 12 3.5Chuck Marks 4 4 6 -2 0 3 -0.5Jesse Palmer 3 5 13 -8 0 4 -2.7Totals 20 59 28 31 0 12 1.5
Passing C-A-I Yds TD Lg SackJesse Palmer 7-20-3 80 0 32 1Doug Johnson 0-2-0 0 0 0 0Earnest Graham 1-1-0 3 1 3 0Kevin McKinnon 0-1-1 0 0 0 0Totals 8-24-4 83 1 32 1
Receiving No Yards TD LgDarrell Jackson 3 49 0 32Travis Taylor 2 22 0 14Earnest Graham 2 9 0 9Erron Kinney 1 3 1 3Totals 8 83 1 32
Punting No Yds Avg Lg In20 TBAlan Rhine 8 324 40.5 57 3 0
Punt Kickoff InterceptReturns No-Yds-Lg No-Yds-Lg No-Yds-LgBo Carroll 0-0-0 5-108-37 0-0-0Chuck Marks 0-0-0 1-5-5 0-0-0Lito Sheppard 0-0-0 1-3-3 0-0-0Daryl Dixon 0-0-0 0-0-0 1-29-29Totals 0-0-0 7-116-37 1-29-29
Field Goals Qtr Time Dist ResultNone
Kickoffs No Yards Avg TB OBJeff Chandler 2 121 60.5 0 0
All-Purpose Run Rcv KR PR IR TotalBo Carroll 0 0 108 0 0 108
AlabamaRushing No Gain Loss Net TD Lg AvgFreddie Milons 6 116 0 116 1 77 19.3Shaun Alexander 30 121 24 97 1 21 3.2Dustin McClintock 4 48 0 48 0 37 12.0Shaun Bohanon 2 32 0 32 0 21 16.0Tyler Watts 4 24 6 18 0 14 4.5Marvin Brown 1 0 0 0 0 0 0.0Andrew Zow 1 0 5 -5 0 0 -5.0Team 1 0 6 -6 0 0 -6.0Totals 49 341 41 300 2 77 6.1
Passing C-A-I Yds TD Lg SackAndrew Zow 10-17-0 134 1 52 1Tyler Watts 3-7-1 21 0 10 1Freddie Milons 1-1-0 7 0 7 0Totals 14-25-1 162 1 52 2
Receiving No Yards TD LgAntonio Carter 5 71 0 52Jason McAddley 4 46 1 27Terry Jones, Jr. 1 19 0 19Dustin McClintock 1 15 0 15Tim Bowens 1 11 0 11Shaun Alexander 1 1 0 1Freddie Milons 1 -1 0 0Totals 14 162 1 52
Punting No Yds Avg Lg In20 TBPatrick Morgan 3 120 40.0 45 1 0 Punt Kickoff InterceptReturns No-Yds-Lg No-Yds-Lg No-YdsArvin Richard 0-0-0 1-18-18 0-0-0Freddie Milons 0-0-0 1-10-10 0-0-0 Marcus Spencer 0-0-0 0-0-0 2-53-35Reggie Grimes 0-0-0 0-0-0 1-38-8Milo Lewis 0-0-0 0-0-0 1-6-6Totals 0-0-0 2-28-18 4-97-38

63SEC Championship Game Record Book
Field Goals Qtr Time Dist ResultRyan Pflugner 1st 2:12 42 missedRyan Pflugner 2nd 11:03 29 goodRyan Pflugner 2nd 2:03 48 goodRyan Pflugner 3rd 3:12 49 goodRyan Pflugner 4th 5:31 36 missed
Kickoffs No Yards Avg TB OBLane Bearden 5 295 59.0 0 0Chris Kemp 3 117 39.0 0 0Totals 8 412 51.5 0 0
All-Purpose Run Rcv KR PR IR TotalFreddie Milons 116 -1 10 0 0 125
Fumbles: Florida-Bo Carroll 1-0; Chuck Marks 1-0. Alabama-Andrew Zow 1-0.
Defensive LeadersFlorida Solo Ast Total Sacks-Yds TFL-Yds FF FR-Yds Int-Yds BrUp Blks QBHMike Nattiel 6 5 11 - - - - - - - -Marquand Manuel 7 3 10 - - - - - 1 - -Daryl Dixon 3 4 7 - - - - 1-29 - - -Totals 47 28 65 2-11 9-39 1 0-0 1-29 3 0 0
Alabama Solo Ast Total Sacks-Yds TFL-Yds FF FR-Yds Int-Yds BrUp Blks QBHDarius Gilbert 2 2 4 - 1.0-5 - - - - - -Miguel Merritt 2 2 4 - - - - - - - -Totals 24 18 42 1-13 4-28 0 0-0 4-97 3 0 0
Drive Chart Drive Started Drive Ended ConsumedTeam Qtr Spot Time Obtained Spot Time How Lost Pl-Yds TOPUF 1st F45 15:00 Kickoff A00 13:20 Touchdown 4-55 1:40UF 1st A40 12:08 Punt A40 11:51 Interception 2-0 0:17UF 1st A40 08:16 Interception A42 06:08 Punt 3-(-2) 2:08UF 1st F25 02:12 Missed FG F29 00:04 Punt 3-4 2:08UF 2nd F22 11:03 Kickoff F32 08:29 Punt 5-10 2:34UF 2nd F02 05:29 Punt F04 04:03 Punt 3-2 1:26UF 2nd F31 02:03 Kickoff F31 01:42 Interception 2-0 0:21UF 2nd F15 00:30 Kickoff F21 15:00 End of half 1-6 0:30UF 3rd F20 11:21 Punt F22 10:27 Punt 3-2 0:54UF 3rd F26 03:12 Kickoff A44 14:53 Punt 9-30 3:19UF 4th F44 11:54 Kickoff F44 11:36 Interception 1-0 0:18UF 4th F23 11:36 Kickoff F23 10:33 Punt 3-0 1:03UF 4th F20 05:31 Missed FG F20 04:47 Interception 2-0 0:44UF 4th F33 03:58 Kickoff F35 01:31 Punt 3-2 2:27Avg. Starting Field Position: UF30 Three and Out: 6
Drive Chart Drive Started Drive Ended ConsumedTeam Qtr Spot Time Obtained Spot Time How Lost Pl-Yds TOPUA 1st A14 13:20 Kickoff A05 12:08 Punt 3-(-9) 1:12UA 1st A38 11:51 Interception F35 08:16 Interception 7-27 3:35UA 1st A04 06:08 Punt F25 02:12 Missed FG 8-71 3:56UA 1st A27 00:04 Punt F12 11:03 Field Goal 9-61 4:01UA 2nd A24 08:29 Punt F46 05:29 Punt 7-30 3:00UA 2nd F36 04:03 Punt F31 02:03 Field Goal 4-5 2:00UA 2nd F36 01:42 Interception F00 00:30 Touchdown 4-36 1:12UA 3rd A23 15:00 Kickoff A40 11:21 Punt 6-17 3:39UA 3rd A45 10:27 Punt F32 03:12 Field Goal 14-23 7:15UA 4th A08 14:53 Punt F00 11:54 Touchdown 5-92 2:59UA 4th F00 11:36 Interception F00 11:36 Touchdown 0-0 0:00UA 4th A39 10:33 Punt F19 05:31 Missed FG 7-42 5:02UA 4th F12 04:47 Interception F00 03:58 Touchdown 2-12 0:49UA 4th A08 01:31 Punt A19 00:00 End of half 3-11 1:31Avg. Starting Field Position: UA34 Three and Out: 1
Scoring SummaryQtr Time Scoring Play Ply-Yds Time UF-UA1st 13:20 UF - Erron Kinney 3 pass from Earnest Graham (Jeff Chandler kick) 4-55 1:40 7-0
2nd 11:03 UA - Ryan Pflugner 29 field goal 9-61 4:01 7-32nd 2:03 UA - Ryan Pflugner 48 field goal 4-5 2:00 7-62nd 0:30 UA - Jason McAddley 27 pass from Andrew Zow (Andrew Zow pass failed) 4-36 1:12 7-12
3rd 3:12 UA - Ryan Pflugner 49 field goal 14-23 7:15 7-15
4th 11:54 UA - Freddie Milons 77 run (Ryan Pflugner kick) 5-92 2:59 7-224th 11:36 UA - Reggie Grimes 38 interception return (Ryan Pflugner kick failed) - - 7-284th 3:58 UA - Shaun Alexander 7 run (TEAM rush failed) 2-12 0:49 7-34
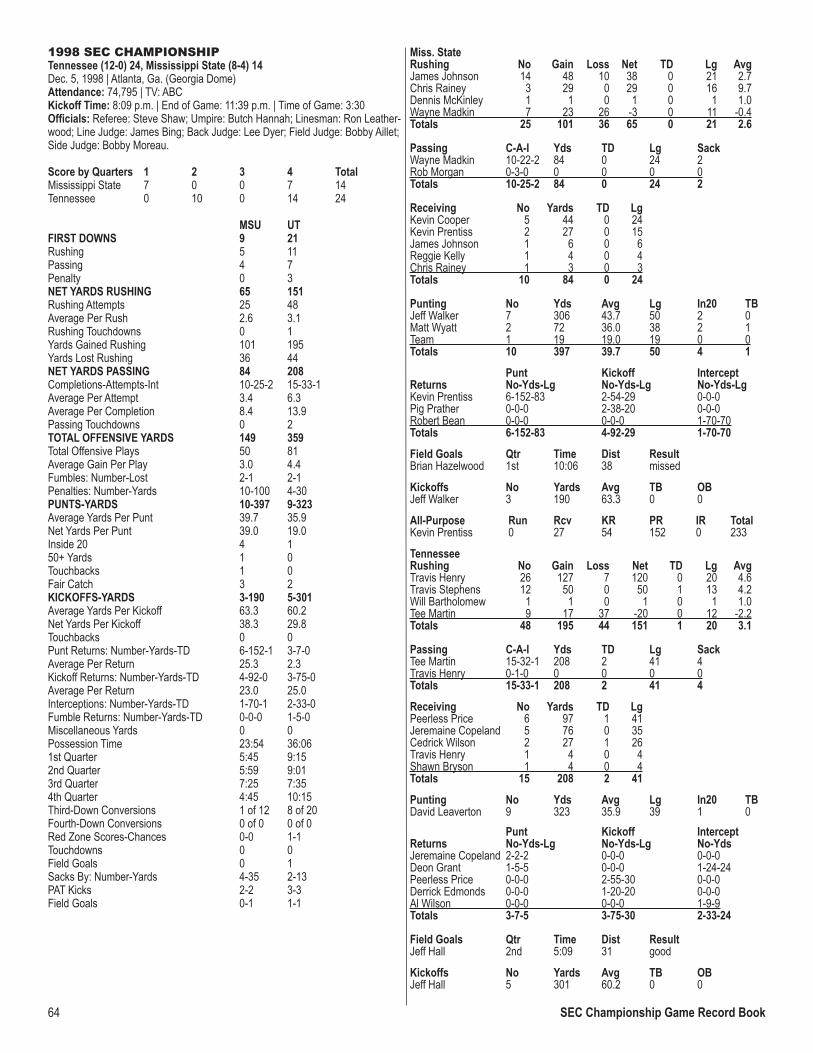
64 SEC Championship Game Record Book
1998 SEC CHAMPIONSHIPTennessee (12-0) 24, Mississippi State (8-4) 14Dec. 5, 1998 | Atlanta, Ga. (Georgia Dome)Attendance: 74,795 | TV: ABCKickoff Time: 8:09 p.m. | End of Game: 11:39 p.m. | Time of Game: 3:30Officials: Referee: Steve Shaw; Umpire: Butch Hannah; Linesman: Ron Leather-wood; Line Judge: James Bing; Back Judge: Lee Dyer; Field Judge: Bobby Aillet; Side Judge: Bobby Moreau.
Score by Quarters 1 2 3 4 TotalMississippi State 7 0 0 7 14Tennessee 0 10 0 14 24
MSU UTFIRST DOWNS 9 21Rushing 5 11Passing 4 7Penalty 0 3NET YARDS RUSHING 65 151Rushing Attempts 25 48Average Per Rush 2.6 3.1Rushing Touchdowns 0 1Yards Gained Rushing 101 195Yards Lost Rushing 36 44NET YARDS PASSING 84 208Completions-Attempts-Int 10-25-2 15-33-1Average Per Attempt 3.4 6.3Average Per Completion 8.4 13.9Passing Touchdowns 0 2TOTAL OFFENSIVE YARDS 149 359Total Offensive Plays 50 81Average Gain Per Play 3.0 4.4Fumbles: Number-Lost 2-1 2-1Penalties: Number-Yards 10-100 4-30PUNTS-YARDS 10-397 9-323Average Yards Per Punt 39.7 35.9Net Yards Per Punt 39.0 19.0Inside 20 4 150+ Yards 1 0Touchbacks 1 0Fair Catch 3 2KICKOFFS-YARDS 3-190 5-301Average Yards Per Kickoff 63.3 60.2Net Yards Per Kickoff 38.3 29.8Touchbacks 0 0Punt Returns: Number-Yards-TD 6-152-1 3-7-0Average Per Return 25.3 2.3Kickoff Returns: Number-Yards-TD 4-92-0 3-75-0Average Per Return 23.0 25.0Interceptions: Number-Yards-TD 1-70-1 2-33-0Fumble Returns: Number-Yards-TD 0-0-0 1-5-0Miscellaneous Yards 0 0Possession Time 23:54 36:061st Quarter 5:45 9:152nd Quarter 5:59 9:013rd Quarter 7:25 7:354th Quarter 4:45 10:15Third-Down Conversions 1 of 12 8 of 20Fourth-Down Conversions 0 of 0 0 of 0Red Zone Scores-Chances 0-0 1-1Touchdowns 0 0Field Goals 0 1Sacks By: Number-Yards 4-35 2-13PAT Kicks 2-2 3-3Field Goals 0-1 1-1
Miss. StateRushing No Gain Loss Net TD Lg AvgJames Johnson 14 48 10 38 0 21 2.7Chris Rainey 3 29 0 29 0 16 9.7Dennis McKinley 1 1 0 1 0 1 1.0Wayne Madkin 7 23 26 -3 0 11 -0.4Totals 25 101 36 65 0 21 2.6
Passing C-A-I Yds TD Lg SackWayne Madkin 10-22-2 84 0 24 2Rob Morgan 0-3-0 0 0 0 0Totals 10-25-2 84 0 24 2
Receiving No Yards TD LgKevin Cooper 5 44 0 24Kevin Prentiss 2 27 0 15James Johnson 1 6 0 6Reggie Kelly 1 4 0 4Chris Rainey 1 3 0 3Totals 10 84 0 24
Punting No Yds Avg Lg In20 TBJeff Walker 7 306 43.7 50 2 0Matt Wyatt 2 72 36.0 38 2 1Team 1 19 19.0 19 0 0Totals 10 397 39.7 50 4 1
Punt Kickoff InterceptReturns No-Yds-Lg No-Yds-Lg No-Yds-LgKevin Prentiss 6-152-83 2-54-29 0-0-0Pig Prather 0-0-0 2-38-20 0-0-0Robert Bean 0-0-0 0-0-0 1-70-70Totals 6-152-83 4-92-29 1-70-70
Field Goals Qtr Time Dist ResultBrian Hazelwood 1st 10:06 38 missed
Kickoffs No Yards Avg TB OBJeff Walker 3 190 63.3 0 0
All-Purpose Run Rcv KR PR IR TotalKevin Prentiss 0 27 54 152 0 233
TennesseeRushing No Gain Loss Net TD Lg AvgTravis Henry 26 127 7 120 0 20 4.6Travis Stephens 12 50 0 50 1 13 4.2Will Bartholomew 1 1 0 1 0 1 1.0Tee Martin 9 17 37 -20 0 12 -2.2Totals 48 195 44 151 1 20 3.1
Passing C-A-I Yds TD Lg SackTee Martin 15-32-1 208 2 41 4Travis Henry 0-1-0 0 0 0 0Totals 15-33-1 208 2 41 4
Receiving No Yards TD LgPeerless Price 6 97 1 41Jeremaine Copeland 5 76 0 35Cedrick Wilson 2 27 1 26Travis Henry 1 4 0 4Shawn Bryson 1 4 0 4Totals 15 208 2 41
Punting No Yds Avg Lg In20 TBDavid Leaverton 9 323 35.9 39 1 0 Punt Kickoff InterceptReturns No-Yds-Lg No-Yds-Lg No-YdsJeremaine Copeland 2-2-2 0-0-0 0-0-0Deon Grant 1-5-5 0-0-0 1-24-24Peerless Price 0-0-0 2-55-30 0-0-0Derrick Edmonds 0-0-0 1-20-20 0-0-0Al Wilson 0-0-0 0-0-0 1-9-9Totals 3-7-5 3-75-30 2-33-24
Field Goals Qtr Time Dist ResultJeff Hall 2nd 5:09 31 good
Kickoffs No Yards Avg TB OBJeff Hall 5 301 60.2 0 0

65SEC Championship Game Record Book
All-Purpose Run Rcv KR PR IR TotalPeerless Price 0 97 55 0 0 152Travis Henry 120 4 0 0 0 124
Fumbles: Miss. State – Wayne Madkin 1-1, Kevin Prentiss 1-0. Tennessee – Travis Henry 1-1, Team 1-0.
Defensive LeadersMiss. State Solo Ast Total Sacks-Yds TFL-Yds FF FR-Yds Int-Yds BrUp Blks QBHLarry Campbell 10 2 12 2.0-17 2.0-17 - - - - - -Tim Nelson 8 2 10 1.0-12 1.0-12 - - - - - -Cornell Menafee 6 2 8 - - - - - - - -Totals 59 16 75 4-35 7-41 0 0-0 1-70 1 0 0
Tennessee Solo Ast Total Sacks-Yds TFL-Yds FF FR-Yds Int-Yds BrUp Blks QBHDarwin Walker 4 1 5 - 1.0-4 - - - 1 - -Raynoch Thompson 4 0 4 - 1.0-1 - - - - - -Corey Terry 4 0 4 1.0-9 2.0-11 - - - - - -Al Wilson 4 0 4 - 1.0-1 - - 1-9 - - -Steve Johnson 4 0 4 - - - - - - - -Totals 39 2 41 2-13 7-24 - 1-5 2-33 1 0 0
Drive Chart Drive Started Drive Ended ConsumedTeam Qtr Spot Time Obtained Spot Time How Lost Pl-Yds TOPMSU 1st M30 15:00 Kickoff M35 13:50 Punt 3-5 1:10MSU 1st M46 12:20 Punt T21 10:06 Missed FG 5-33 2:14MSU 1st M28 6:07 Punt T43 3:46 Punt 4-29 2:21MSU 1st T00 0:05 Interception T00 0:05 Touchdown 0-0 0:00MSU 2nd M05 11:54 Punt M16 11:30 Interception 2-11 0:24MSU 2nd M20 9:32 Kickoff M26 7:02 Punt 5-6 2:30MSU 2nd M25 5:09 Kickoff M19 3:23 Punt 3-(-6) 1:46MSU 2nd M28 1:19 Punt M31 0:00 Punt 4-3 1:19MSU 3rd M23 12:32 Punt M21 10:57 Punt 3-(-2) 1:35MSU 3rd T45 9:57 Punt M41 7:51 Punt 4-(-14) 2:06MSU 3rd M32 6:20 Punt M32 5:32 Interception 1-0 0:48MSU 3rd M32 5:32 Fumble T47 2:36 Punt 6-21 2:56MSU 4th M27 14:26 Punt T45 11:54 Punt 7-28 2:32MSU 4th T00 8:43 Punt T00 8:43 Touchdown 0-0 0:00MSU 4th M30 6:15 Kickoff M31 5:55 Fumble 1-1 0:20MSU 4th M31 5:47 Kickoff M35 3:54 Punt 3-4 1:53Avg. Starting Field Position: MSU29 Three and Out: 4
Drive Chart Drive Started Drive Ended ConsumedTeam Qtr Spot Time Obtained Spot Time How Lost Pl-Yds TOPUT 1st T15 13:50 Punt T18 12:20 Punt 3-3 1:30UT 1st T21 10:06 Missed FG T47 6:07 Punt 7-26 3:59UT 1st T09 3:46 Punt T18 0:05 Interception 7-9 3:41UT 1st T25 0:05 Kickoff M35 11:54 Punt 6-40 3:11UT 2nd M20 11:30 Interception M00 9:32 Touchdown 5-20 1:58UT 2nd T33 7:02 Punt M14 5:09 Field Goal 6-53 1:53UT 2nd T36 3:23 Punt T41 1:19 Punt 6-5 2:04UT 2nd T50 0:00 Punt T50 15:00 End of Half 0-0 0:00UT 3rd T30 15:00 Kickoff T47 12:32 Punt 6-17 2:28UT 3rd T35 10:57 Punt T42 9:57 Punt 3-7 1:00UT 3rd T25 7:51 Punt T32 6:20 Punt 3-7 1:31UT 3rd M33 0:00 Interception M31 5:32 Fumble 2-2 0:00UT 3rd T20 2:36 Punt M48 14:26 Punt 9-32 3:10UT 4th T12 11:54 Punt T44 8:43 Punt 6-32 3:11UT 4th T25 8:43 Kickoff M00 6:15 Touchdown 5-75 2:28UT 4th M26 5:55 Fumble M00 5:47 Touchdown 1-26 0:08UT 4th T23 3:54 Punt M37 0:00 End of Half 7-40 3:54Avg. Starting Field Position: UT30 Three and Out: 3
Scoring SummaryQtr Time Scoring Play Ply-Yds Time MSU-UT1st 0:05 MSU – Robert Bean 70 interception return (Brian Hazelwood kick) - - 7-0
2nd 9:32 UT – Travis Stephens 2 run (Jeff Hall kick) 5-20 1:58 7-72nd 5:09 UT – Jeff Hall 31 field goal 6-53 1:53 7-10
4th 8:43 MSU – Kevin Prentiss 83 punt return (Brian Hazelwood kick) - - 14-104th 6:15 UT – Peerless Price 41 pass from Tee Martin (Jeff Hall kick) 5-75 2:28 14-174th 5:47 UT – Cedrick Wilson 26 pass from Tee Martin (Jeff Hall kick) 1-26 0:08 14-24

66 SEC Championship Game Record Book
1997 SEC CHAMPIONSHIPTennessee (11-1) 30, Auburn (9-3) 29Dec. 6, 1997 | Atlanta, Ga. (Georgia Dome)Attendance: 74,896 | TV: ABCKickoff Time: 8:06 p.m. | End of Game: 11:40 p.m. | Time of Game: 3:34Officials: Referee: Al Ford; Umpire: Bud Williams; Linesman: Billy Schroer; Line Judge: Paul Petrisko; Back Judge: Ned Wilford; Field Judge: Stanley Dixon; Side Judge: Ben Oldham.
Score by Quarters 1 2 3 4 TotalTennessee 7 3 13 7 30Auburn 13 7 9 0 29
UT AUFIRST DOWNS 22 9Rushing 7 2Passing 14 7Penalty 1 0NET YARDS RUSHING 129 -15Rushing Attempts 36 21Average Per Rush 3.6 -0.7Rushing Touchdowns 0 0Yards Gained Rushing 134 27Yards Lost Rushing 5 42NET YARDS PASSING 373 262Completions-Attempts-Int 25-43-2 14-34-0Average Per Attempt 8.7 7.7Average Per Completion 14.9 18.7Passing Touchdowns 4 2TOTAL OFFENSIVE YARDS 502 247Total Offensive Plays 79 55Average Gain Per Play 6.4 4.5Fumbles: Number-Lost 6-4 5-1Penalties: Number-Yards 9-49 12-78PUNTS-YARDS 5-182 10-438Average Yards Per Punt 36.4 43.8Net Yards Per Punt 33.4 26.7Inside 20 1 150+ Yards 1 2Touchbacks 0 0Fair Catch 2 0KICKOFFS-YARDS 6-355 6-390Average Yards Per Kickoff 59.2 65.0Net Yards Per Kickoff 44.3 62.2Touchbacks 1 5Punt Returns: Number-Yards-TD 8-171-0 2-15-0Average Per Return 21.4 7.5Kickoff Returns: Number-Yards-TD 1-17-0 4-89-0Average Per Return 17.0 22.3Interceptions: Number-Yards-TD 0-0-0 2-77-0Fumble Returns: Number-Yards-TD 0-0 1-24-1Miscellaneous Yards 0 0Possession Time 35:43 24:171st Quarter 8:45 6:152nd Quarter 7:01 7:593rd Quarter 10:52 4:084th Quarter 9:05 5:55Third-Down Conversions 9 of 17 1 of 13Fourth-Down Conversions 1 of 1 0 of 0Red Zone Scores-Chances 2-4 1-1Touchdowns 1 0Field Goals 1 1Sacks By: Number-Yards 4-24 1-2PAT Kicks 3-4 3-3Field Goals 1-1 2-3
TennesseeRushing No Gain Loss Net TD Lg AvgJamal Lewis 31 128 1 127 0 18 4.1Peyton Manning 4 6 4 2 0 5 0.5Shawn Bryson 1 0 0 0 0 0 0.0Totals 36 134 5 129 0 18 3.6
Passing C-A-I Yds TD Lg SackPeyton Manning 25-43-2 373 4 73 1
Receiving No Yards TD LgMarcus Nash 9 126 1 73Peerless Price 8 161 2 46Jeremaine Copeland 4 36 1 14Jamal Lewis 3 45 0 25Derrick Edmonds 1 5 0 5Totals 25 373 4 73
Punting No Yds Avg Lg In20 TBChris Hogue 5 182 36.4 50 1 0
Punt Kickoff InterceptReturns No-Yds-Lg No-Yds-Lg No-Yds-LgTerry Fair 7-157-45 1-17-17 0-0-0Jeremaine Copeland 1-14-14 0-0-0 0-0-0Totals 8-171-45 1-17-17 0-0-0
Field Goals Qtr Time Dist ResultJeff Hall 2nd 7:46 27 good
Kickoffs No Yards Avg TB OBJeff Hall 6 355 59.2 1 1
All-Purpose Run Rcv KR PR IR TotalTerry Fair 0 0 17 157 0 174Jamal Lewis 127 45 0 0 0 172Peerless Price 0 161 0 0 0 161Marcus Nash 0 126 0 0 0 126
AuburnRushing No Gain Loss Net TD Lg AvgRusty Williams 6 12 4 8 0 7 1.3Demontray Carter 2 3 0 3 0 3 1.5Fred Beasley 5 1 10 -9 0 1 -1.8Dameyune Craig 8 11 28 -17 0 11 -2.1Totals 21 27 42 -15 0 11 -0.7
Passing C-A-I Yds TD Lg SackDameyune Craig 14-34-0 262 2 69 4
Receiving No Yards TD LgHicks Poor 3 98 0 69Fred Beasley 3 56 1 24Tyrone Goodson 2 60 1 51Karsten Bailey 2 16 0 9Tyrone Dillard 1 13 0 13Kevin McLeod 1 13 0 13Errick Lowe 1 4 0 4Markeith Cooper 1 2 0 2Totals 14 262 2 69
Punting No Yds Avg Lg In20 TBJaret Holmes 10 438 43.8 53 1 0 Punt Kickoff InterceptReturns No-Yds-Lg No-Yds-Lg No-YdsMarkeith Cooper 2-15-8 4-89-46 0-0-0Jayson Bray 0-0-0 0-0-0 1-77-77Larry Casher 0-0-0 0-0-0 1-0-0Totals 2-15-8 4-89-46 2-77-77
Field Goals Qtr Time Dist ResultJaret Holmes 1st 10:25 30 goodJaret Holmes 1st 1:27 48 goodJaret Holmes 2nd 1:51 45 missed
Kickoffs No Yards Avg TB OBJaret Holmes 6 390 65.0 5 0
All-Purpose Run Rcv KR PR IR TotalHicks Poor 0 98 0 0 0 98
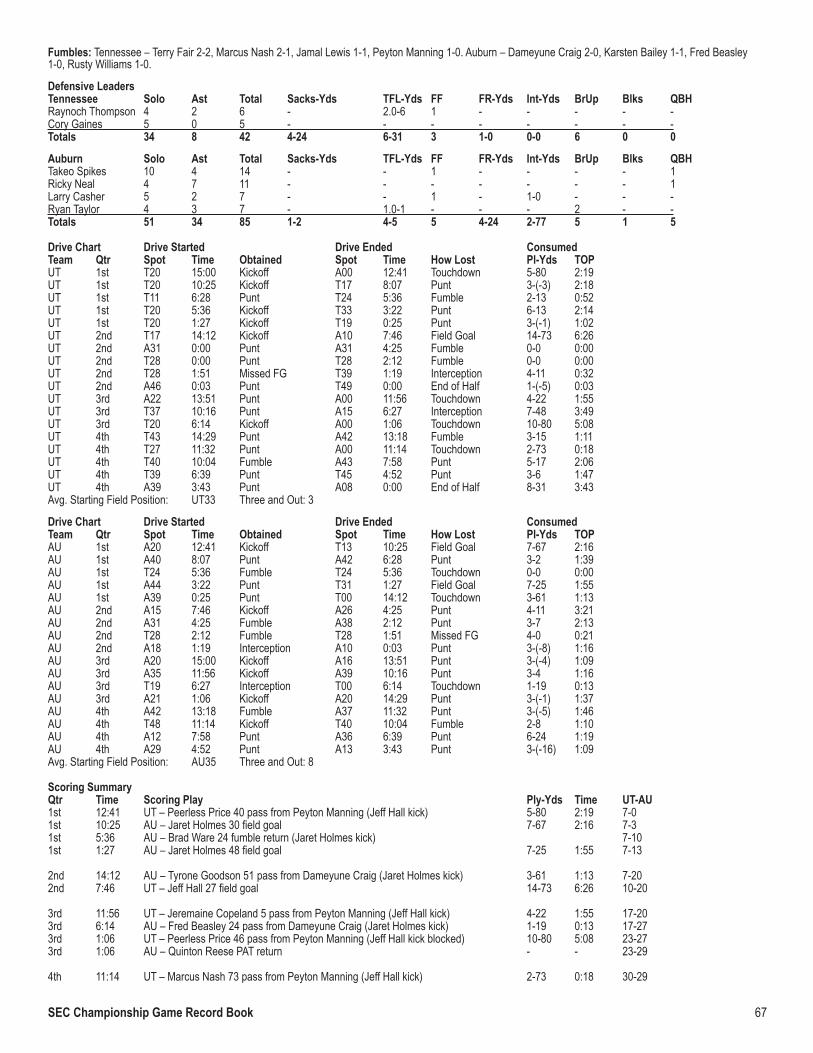
67SEC Championship Game Record Book
Fumbles: Tennessee – Terry Fair 2-2, Marcus Nash 2-1, Jamal Lewis 1-1, Peyton Manning 1-0. Auburn – Dameyune Craig 2-0, Karsten Bailey 1-1, Fred Beasley 1-0, Rusty Williams 1-0.
Defensive LeadersTennessee Solo Ast Total Sacks-Yds TFL-Yds FF FR-Yds Int-Yds BrUp Blks QBHRaynoch Thompson 4 2 6 - 2.0-6 1 - - - - -Cory Gaines 5 0 5 - - - - - - - -Totals 34 8 42 4-24 6-31 3 1-0 0-0 6 0 0
Auburn Solo Ast Total Sacks-Yds TFL-Yds FF FR-Yds Int-Yds BrUp Blks QBHTakeo Spikes 10 4 14 - - 1 - - - - 1Ricky Neal 4 7 11 - - - - - - - 1Larry Casher 5 2 7 - - 1 - 1-0 - - -Ryan Taylor 4 3 7 - 1.0-1 - - - 2 - -Totals 51 34 85 1-2 4-5 5 4-24 2-77 5 1 5
Drive Chart Drive Started Drive Ended ConsumedTeam Qtr Spot Time Obtained Spot Time How Lost Pl-Yds TOPUT 1st T20 15:00 Kickoff A00 12:41 Touchdown 5-80 2:19UT 1st T20 10:25 Kickoff T17 8:07 Punt 3-(-3) 2:18UT 1st T11 6:28 Punt T24 5:36 Fumble 2-13 0:52UT 1st T20 5:36 Kickoff T33 3:22 Punt 6-13 2:14UT 1st T20 1:27 Kickoff T19 0:25 Punt 3-(-1) 1:02UT 2nd T17 14:12 Kickoff A10 7:46 Field Goal 14-73 6:26UT 2nd A31 0:00 Punt A31 4:25 Fumble 0-0 0:00UT 2nd T28 0:00 Punt T28 2:12 Fumble 0-0 0:00UT 2nd T28 1:51 Missed FG T39 1:19 Interception 4-11 0:32UT 2nd A46 0:03 Punt T49 0:00 End of Half 1-(-5) 0:03UT 3rd A22 13:51 Punt A00 11:56 Touchdown 4-22 1:55UT 3rd T37 10:16 Punt A15 6:27 Interception 7-48 3:49UT 3rd T20 6:14 Kickoff A00 1:06 Touchdown 10-80 5:08UT 4th T43 14:29 Punt A42 13:18 Fumble 3-15 1:11UT 4th T27 11:32 Punt A00 11:14 Touchdown 2-73 0:18UT 4th T40 10:04 Fumble A43 7:58 Punt 5-17 2:06UT 4th T39 6:39 Punt T45 4:52 Punt 3-6 1:47UT 4th A39 3:43 Punt A08 0:00 End of Half 8-31 3:43Avg. Starting Field Position: UT33 Three and Out: 3
Drive Chart Drive Started Drive Ended ConsumedTeam Qtr Spot Time Obtained Spot Time How Lost Pl-Yds TOPAU 1st A20 12:41 Kickoff T13 10:25 Field Goal 7-67 2:16AU 1st A40 8:07 Punt A42 6:28 Punt 3-2 1:39AU 1st T24 5:36 Fumble T24 5:36 Touchdown 0-0 0:00AU 1st A44 3:22 Punt T31 1:27 Field Goal 7-25 1:55AU 1st A39 0:25 Punt T00 14:12 Touchdown 3-61 1:13AU 2nd A15 7:46 Kickoff A26 4:25 Punt 4-11 3:21AU 2nd A31 4:25 Fumble A38 2:12 Punt 3-7 2:13AU 2nd T28 2:12 Fumble T28 1:51 Missed FG 4-0 0:21AU 2nd A18 1:19 Interception A10 0:03 Punt 3-(-8) 1:16AU 3rd A20 15:00 Kickoff A16 13:51 Punt 3-(-4) 1:09AU 3rd A35 11:56 Kickoff A39 10:16 Punt 3-4 1:16AU 3rd T19 6:27 Interception T00 6:14 Touchdown 1-19 0:13AU 3rd A21 1:06 Kickoff A20 14:29 Punt 3-(-1) 1:37AU 4th A42 13:18 Fumble A37 11:32 Punt 3-(-5) 1:46AU 4th T48 11:14 Kickoff T40 10:04 Fumble 2-8 1:10AU 4th A12 7:58 Punt A36 6:39 Punt 6-24 1:19AU 4th A29 4:52 Punt A13 3:43 Punt 3-(-16) 1:09Avg. Starting Field Position: AU35 Three and Out: 8
Scoring SummaryQtr Time Scoring Play Ply-Yds Time UT-AU1st 12:41 UT – Peerless Price 40 pass from Peyton Manning (Jeff Hall kick) 5-80 2:19 7-01st 10:25 AU – Jaret Holmes 30 field goal 7-67 2:16 7-31st 5:36 AU – Brad Ware 24 fumble return (Jaret Holmes kick) 7-101st 1:27 AU – Jaret Holmes 48 field goal 7-25 1:55 7-13
2nd 14:12 AU – Tyrone Goodson 51 pass from Dameyune Craig (Jaret Holmes kick) 3-61 1:13 7-202nd 7:46 UT – Jeff Hall 27 field goal 14-73 6:26 10-20
3rd 11:56 UT – Jeremaine Copeland 5 pass from Peyton Manning (Jeff Hall kick) 4-22 1:55 17-203rd 6:14 AU – Fred Beasley 24 pass from Dameyune Craig (Jaret Holmes kick) 1-19 0:13 17-273rd 1:06 UT – Peerless Price 46 pass from Peyton Manning (Jeff Hall kick blocked) 10-80 5:08 23-273rd 1:06 AU – Quinton Reese PAT return - - 23-29
4th 11:14 UT – Marcus Nash 73 pass from Peyton Manning (Jeff Hall kick) 2-73 0:18 30-29

68 SEC Championship Game Record Book
1996 SEC CHAMPIONSHIPFlorida (11-1) 45, Alabama (9-3) 30Dec. 7, 1996 | Atlanta, Ga. (Georgia Dome)Attendance: 74,132 | TV: ABCKickoff Time: 8:09 p.m. | End of Game: 12:01 a.m. | Time of Game: 3:52Officials: Referee: Aster Sizemore; Umpire: Nate Anderson; Linesman: Tim Abel; Line Judge: Bobby Caldwell; Back Judge: Steve Freeman; Field Judge: Len Har-rington; Side Judge: Nick Buoni.
Score by Quarters 1 2 3 4 TotalAlabama 7 7 14 2 30Florida 6 18 14 7 45
UA UFFIRST DOWNS 13 22Rushing 4 6Passing 8 14Penalty 1 2NET YARDS RUSHING 27 69Rushing Attempts 27 37Average Per Rush 1.0 1.9Rushing Touchdowns 1 0Yards Gained Rushing 62 123Yards Lost Rushing 35 54NET YARDS PASSING 269 401Completions-Attempts-Int 20-46-1 20-35-2Average Per Attempt 5.8 11.5Average Per Completion 13.5 20.1Passing Touchdowns 3 6TOTAL OFFENSIVE YARDS 296 470Total Offensive Plays 73 72Average Gain Per Play 4.1 6.5Fumbles: Number-Lost 1-0 4-1Penalties: Number-Yards 7-45 14-95PUNTS-YARDS 8-326 4-148Average Yards Per Punt 40.8 37.0Net Yards Per Punt 39.3 37.0Inside 20 2 150+ Yards 0 0Touchbacks 1 0Fair Catch 3 3KICKOFFS-YARDS 5-290 9-568Average Yards Per Kickoff 58.0 63.1Net Yards Per Kickoff 41.4 53.7Touchbacks 1 4Punt Returns: Number-Yards-TD 0-0-0 2-12-0Average Per Return 0.0 6.0Kickoff Returns: Number-Yards-TD 5-85-0 4-83-0Average Per Return 17.0 20.8Interceptions: Number-Yards-TD 2-22-0 1-0-0Fumble Returns: Number-Yards-TD 0-0-0 0-0-0Miscellaneous Yards 0 0Possession Time 30:12 29:481st Quarter 7:15 7:452nd Quarter 9:46 5:143rd Quarter 7:07 7:534th Quarter 6:04 8:56Third-Down Conversions 7 of 18 4 of 14Fourth-Down Conversions 0 of 2 1 of 3Red Zone Scores-Chances 2-4 2-2Touchdowns 2 1Field Goals 0 1Sacks By: Number-Yards 4-17 5-31PAT Kicks 4-4 4-5Field Goals 0-1 1-1
AlabamaRushing No Gain Loss Net TD Lg AvgDennis Riddle 17 46 4 42 1 8 2.5Shaun Alexander 2 5 0 5 0 5 2.5Freddie Kitchens 8 11 31 -20 0 7 -2.5Totals 27 62 35 27 1 8 1.0
Passing C-A-I Yds TD Lg SackFreddie Kitchens 19-45-1 264 3 94 5Chad Goss 1-1-0 5 0 5 0Totals 20-46-1 269 3 94 5
Receiving No Yards TD LgDennis Riddle 6 82 1 36Michael Vaughn 5 142 2 94Shaun Alexander 3 4 0 10Shamari Buchanan 2 17 0 10Marcell West 1 17 0 17Warren Foust 1 5 0 5Chad Goss 1 3 0 3Curt Alexander 1 -1 0 0Totals 20 269 3 94
Punting No Yds Avg Lg In20 TBHayden Stockton 8 326 40.8 47 2 1
Punt Kickoff InterceptReturns No-Yds-Lg No-Yds-Lg No-Yds-LgMichael Vaughn 0-0-0 2-34-18 0-0-0Marcell West 0-0-0 3-51-28 0-0-0Ozell Powell 0-0-0 0-0-0 1-22-22Kevin Jackson 0-0-0 0-0-0 1-0-0Totals 0-0-0 5-85-28 2-22-22
Field Goals Qtr Time Dist ResultJon Brock 1st 3:11 24 missed
Kickoffs No Yards Avg TB OBWilliam Watts 5 290 58.0 1 0
All-Purpose Run Rcv KR PR IR TotalMichael Vaughn 0 142 34 0 0 176Dennis Riddle 42 82 0 0 0 124
FloridaRushing No Gain Loss Net TD Lg AvgFred Taylor 13 84 1 83 0 22 6.4Elijah Williams 3 8 0 8 0 5 2.7Terry Jackson 6 11 3 8 0 5 1.3Danny Wuerffel 14 20 31 -11 0 8 -0.8Team 1 0 19 -19 0 0 -19.0Totals 37 123 54 69 0 22 1.9
Passing C-A-I Yds TD Lg SackDanny Wuerffel 20-35-2 401 6 85 4
Receiving No Yards TD LgReidel Anthony 11 171 3 24Jacquez Green 3 106 1 85Ike Hilliard 3 74 1 46Elijah Williams 1 45 1 45Tremayne Allen 1 4 0 4Fred Taylor 1 1 0 1Totals 20 401 6 85
Punting No Yds Avg Lg In20 TBRobby Stevenson 4 148 37.0 43 1 0 Punt Kickoff InterceptReturns No-Yds-Lg No-Yds-Lg No-YdsIke Hilliard 1-10-10 3-67-26 0-0-0Jacquez Green 1-2-2 0-0-0 0-0-0Ernie Dubose 0-0-0 1-16-16 0-0-0Fred Weary 0-0-0 0-0-0 1-0-0Totals 2-12-10 4-83-26 1-0-0
Field Goals Qtr Time Dist ResultCollins Cooper 2nd 7:39 35 good
Kickoffs No Yards Avg TB OBMatt Teague 9 568 63.1 4 0

69SEC Championship Game Record Book
All-Purpose Run Rcv KR PR IR TotalReidel Anthony 0 171 0 0 0 171Ike Hilliard 0 74 67 10 0 151Jacquez Green 0 106 0 2 0 108
Fumbles: Alabama – Freddie Kitchens 1-0. Florida – Danny Wuerffel 1-1, Stevenson 1-0, Team 2-0.
Defensive LeadersAlabama Solo Ast Total Sacks-Yds TFL-Yds FF FR-Yds Int-Yds BrUp Blks QBHKelvin Sigler 4 3 7 1.0-4 - - - - 1 - -Cedric Samuel 6 0 6 - - - - - 1 - -Totals 50 16 66 4-17 9-29 - - 2-22 4 1 -
Florida Solo Ast Total Sacks-Yds TFL-Yds FF FR-Yds Int-Yds BrUp Blks QBHJames Bates 7 3 10 - 2.0-3 - - - 3 - -Johnny Rutledge 9 0 9 1.0-9 3.0-15 - - - - - -Totals 52 11 63 5-31 10-42 - - 1-0 10 - -
Drive Chart Drive Started Drive Ended ConsumedTeam Qtr Spot Time Obtained Spot Time How Lost Pl-Yds TOPUF 1st F26 15:00 Kickoff F31 13:32 Interception 3-5 1:28UF 1st F20 13:11 Missed FG F16 11:36 Punt 3-(-4) 1:35UF 1st F22 8:46 Kickoff A43 6:36 Punt 8-35 2:10UF 1st F21 4:59 Punt A00 3:11 Touchdown 5-79 1:48UF 1st F39 0:38 Punt A00 14:37 Touchdown 6-61 1:01UF 2nd F28 12:56 Punt A00 11:35 Touchdown 3-72 1:21UF 2nd A41 9:25 Punt A18 7:39 Field Goal 6-23 1:46UF 2nd F06 3:58 Punt F05 2:27 Punt 3-(-1) 1:31UF 2nd F41 0:23 Kickoff F41 0:16 Interception 1-0 0:07UF 3rd F20 10:58 Punt F06 9:17 Downs 4-(-14) 1:41UF 3rd F35 9:12 Kickoff A00 5:14 Touchdown 10-65 3:58UF 3rd F19 4:01 Kickoff A00 3:09 Touchdown 2-81 0:52UF 3rd F49 1:17 Punt A00 14:54 Touchdown 3-51 1:23UF 4th F17 12:43 Punt F32 9:47 Fumble 6-15 2:56UF 4th F02 6:42 Downs F00 4:32 Safety 4-(-2) 2:10UF 4th F29 3:54 Interception F29 0:10 Punt 6-0 3:44Avg. Starting Field Position: UF27 Three and Out: 2
Drive Chart Drive Started Drive Ended ConsumedTeam Qtr Spot Time Obtained Spot Time How Lost Pl-Yds TOPUA 1st F09 13:32 Interception F06 13:11 Missed FG 4-3 0:21UA 1st A49 11:36 Punt F00 8:52 Touchdown 6-51 2:44UA 1st A34 6:36 Punt A41 4:59 Punt 3-7 1:37UA 1st A20 2:55 Kickoff A25 0:38 Punt 3-5 2:17UA 2nd A20 14:37 Kickoff A28 12:56 Punt 3-8 1:41UA 2nd A20 11:35 Kickoff A05 9:25 Punt 3-(-15) 2:10UA 2nd A18 7:31 Kickoff F48 3:58 Punt 7-34 3:33UA 2nd F48 2:27 Punt F00 0:29 Touchdown 8-48 1:58UA 2nd A49 0:16 Interception A43 0:00 End of Half 2-(-6) 0:16UA 3rd A20 15:00 Kickoff F43 10:58 Punt 10-37 4:02UA 3rd F05 9:17 Downs F00 9:12 Touchdown 1-5 0:05UA 3rd A06 5:10 Kickoff F00 4:06 Touchdown 3-94 1:04UA 3rd A20 3:09 Kickoff A14 1:17 Punt 3-(-6) 1:52UA 4th A26 14:54 Kickoff A47 12:43 Punt 6-21 2:11UA 4th F32 9:47 Fumble F01 6:42 Downs 7-31 3:05UA 4th A36 4:32 Kickoff A36 3:54 Interception 4-0 0:38UA 4th A31 0:10 Punt A31 0:00 End of Half 1-0 0:10Avg. Starting Field Position: UA39 Three and Out: 5
Scoring SummaryQtr Time Scoring Play Ply-Yds Time UA-UF1st 8:52 UA – Dennis Riddle 36 pass from Freddie Kitchens (Jon Brock kick) 6-51 2:44 7-01st 3:11 UF – Ike Hilliard 46 pass from Danny Wuerffel (Collins Cooper kick blocked) 5-79 1:48 7-6
2nd 14:37 UF – Reidel Anthony 21 pass from Danny Wuerffel (Reidel Anthony pass from Danny Wuerffel) 6-61 1:01 7-142nd 11:35 UF – Elijah Williams 45 pass from Danny Wuerffel (Collins Cooper kick) 3-72 1:21 7-212nd 7:39 UF – Collins Cooper 35 field goal 6-23 1:46 7-242nd 0:29 UA – Michael Vaughn 8 pass from Freddie Kitchens (Jon Brock kick) 8-48 1:58 14-24
3rd 9:12 UA – Dennis Riddle 5 run (Jon Brock kick) 1-5 0:05 21-243rd 5:14 UF – Reidel Anthony 13 pass from Danny Wuerffel (Collins Cooper kick) 10-65 3:58 21-313rd 4:06 UA – Michael Vaughn 94 pass from Freddie Kitchens (Jon Brock kick) 3-94 1:08 28-313rd 3:09 UF – Jacquez Green 85 pass from Danny Wuerffel (Collins Cooper kick) 2-81 0:57 28-38
4th 14:54 UF – Reidel Anthony 21 pass from Danny Wuerffel (Collins Cooper kick) 3-51 1:23 28-454th 4:32 UA – Team safety - - 30-45
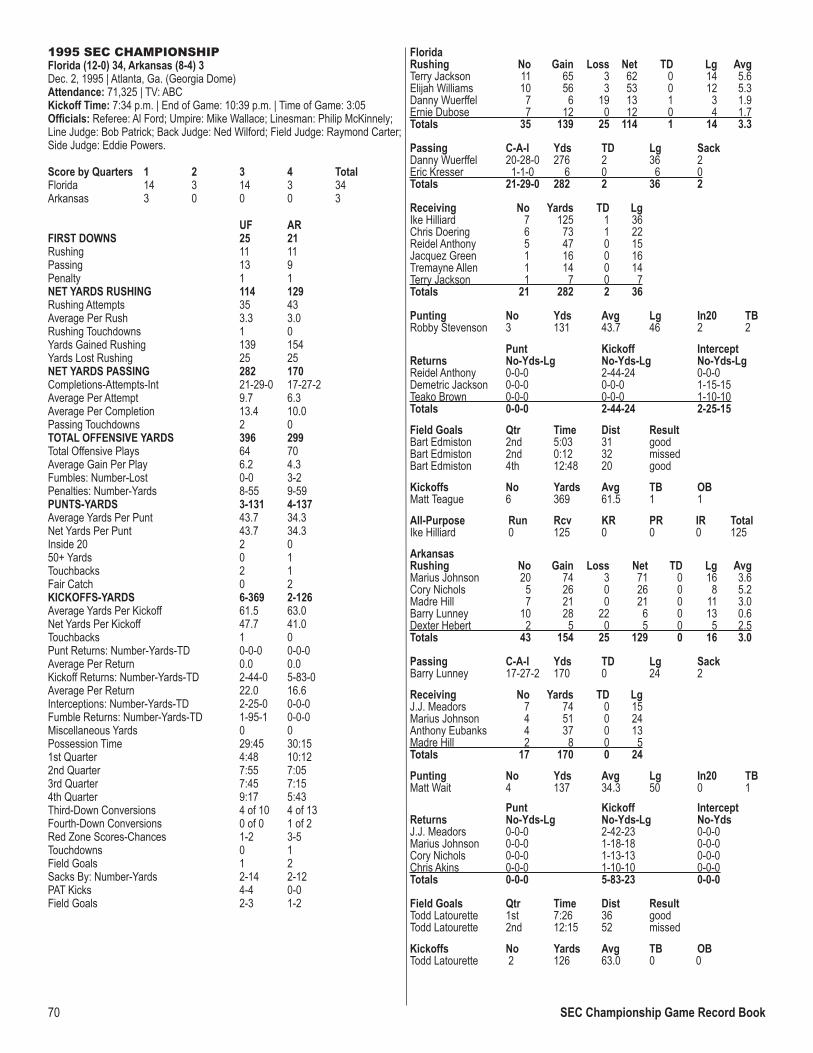
70 SEC Championship Game Record Book
1995 SEC CHAMPIONSHIPFlorida (12-0) 34, Arkansas (8-4) 3Dec. 2, 1995 | Atlanta, Ga. (Georgia Dome)Attendance: 71,325 | TV: ABCKickoff Time: 7:34 p.m. | End of Game: 10:39 p.m. | Time of Game: 3:05Officials: Referee: Al Ford; Umpire: Mike Wallace; Linesman: Philip McKinnely; Line Judge: Bob Patrick; Back Judge: Ned Wilford; Field Judge: Raymond Carter; Side Judge: Eddie Powers.
Score by Quarters 1 2 3 4 TotalFlorida 14 3 14 3 34Arkansas 3 0 0 0 3
UF ARFIRST DOWNS 25 21Rushing 11 11Passing 13 9Penalty 1 1NET YARDS RUSHING 114 129Rushing Attempts 35 43Average Per Rush 3.3 3.0Rushing Touchdowns 1 0Yards Gained Rushing 139 154Yards Lost Rushing 25 25NET YARDS PASSING 282 170Completions-Attempts-Int 21-29-0 17-27-2Average Per Attempt 9.7 6.3Average Per Completion 13.4 10.0Passing Touchdowns 2 0TOTAL OFFENSIVE YARDS 396 299Total Offensive Plays 64 70Average Gain Per Play 6.2 4.3Fumbles: Number-Lost 0-0 3-2Penalties: Number-Yards 8-55 9-59PUNTS-YARDS 3-131 4-137Average Yards Per Punt 43.7 34.3Net Yards Per Punt 43.7 34.3Inside 20 2 050+ Yards 0 1Touchbacks 2 1Fair Catch 0 2KICKOFFS-YARDS 6-369 2-126Average Yards Per Kickoff 61.5 63.0Net Yards Per Kickoff 47.7 41.0Touchbacks 1 0Punt Returns: Number-Yards-TD 0-0-0 0-0-0Average Per Return 0.0 0.0Kickoff Returns: Number-Yards-TD 2-44-0 5-83-0Average Per Return 22.0 16.6Interceptions: Number-Yards-TD 2-25-0 0-0-0Fumble Returns: Number-Yards-TD 1-95-1 0-0-0Miscellaneous Yards 0 0Possession Time 29:45 30:151st Quarter 4:48 10:122nd Quarter 7:55 7:053rd Quarter 7:45 7:154th Quarter 9:17 5:43Third-Down Conversions 4 of 10 4 of 13Fourth-Down Conversions 0 of 0 1 of 2Red Zone Scores-Chances 1-2 3-5Touchdowns 0 1Field Goals 1 2Sacks By: Number-Yards 2-14 2-12PAT Kicks 4-4 0-0Field Goals 2-3 1-2
FloridaRushing No Gain Loss Net TD Lg AvgTerry Jackson 11 65 3 62 0 14 5.6Elijah Williams 10 56 3 53 0 12 5.3Danny Wuerffel 7 6 19 13 1 3 1.9Ernie Dubose 7 12 0 12 0 4 1.7Totals 35 139 25 114 1 14 3.3
Passing C-A-I Yds TD Lg SackDanny Wuerffel 20-28-0 276 2 36 2Eric Kresser 1-1-0 6 0 6 0Totals 21-29-0 282 2 36 2
Receiving No Yards TD LgIke Hilliard 7 125 1 36Chris Doering 6 73 1 22Reidel Anthony 5 47 0 15Jacquez Green 1 16 0 16Tremayne Allen 1 14 0 14Terry Jackson 1 7 0 7Totals 21 282 2 36
Punting No Yds Avg Lg In20 TBRobby Stevenson 3 131 43.7 46 2 2
Punt Kickoff InterceptReturns No-Yds-Lg No-Yds-Lg No-Yds-LgReidel Anthony 0-0-0 2-44-24 0-0-0Demetric Jackson 0-0-0 0-0-0 1-15-15Teako Brown 0-0-0 0-0-0 1-10-10Totals 0-0-0 2-44-24 2-25-15
Field Goals Qtr Time Dist ResultBart Edmiston 2nd 5:03 31 goodBart Edmiston 2nd 0:12 32 missedBart Edmiston 4th 12:48 20 good
Kickoffs No Yards Avg TB OBMatt Teague 6 369 61.5 1 1
All-Purpose Run Rcv KR PR IR TotalIke Hilliard 0 125 0 0 0 125
ArkansasRushing No Gain Loss Net TD Lg AvgMarius Johnson 20 74 3 71 0 16 3.6Cory Nichols 5 26 0 26 0 8 5.2Madre Hill 7 21 0 21 0 11 3.0Barry Lunney 10 28 22 6 0 13 0.6Dexter Hebert 2 5 0 5 0 5 2.5Totals 43 154 25 129 0 16 3.0
Passing C-A-I Yds TD Lg SackBarry Lunney 17-27-2 170 0 24 2
Receiving No Yards TD LgJ.J. Meadors 7 74 0 15Marius Johnson 4 51 0 24Anthony Eubanks 4 37 0 13Madre Hill 2 8 0 5Totals 17 170 0 24
Punting No Yds Avg Lg In20 TBMatt Wait 4 137 34.3 50 0 1 Punt Kickoff InterceptReturns No-Yds-Lg No-Yds-Lg No-YdsJ.J. Meadors 0-0-0 2-42-23 0-0-0Marius Johnson 0-0-0 1-18-18 0-0-0Cory Nichols 0-0-0 1-13-13 0-0-0Chris Akins 0-0-0 1-10-10 0-0-0Totals 0-0-0 5-83-23 0-0-0
Field Goals Qtr Time Dist ResultTodd Latourette 1st 7:26 36 goodTodd Latourette 2nd 12:15 52 missed
Kickoffs No Yards Avg TB OBTodd Latourette 2 126 63.0 0 0

71SEC Championship Game Record Book
All-Purpose Run Rcv KR PR IR TotalMarius Johnson 71 51 18 0 0 140J.J. Meadors 0 74 42 0 0 116
Fumbles: Florida-None. Arkansas-Barry Lunney 2-1, Marius Johnson 1-0.
Defensive LeadersFlorida Solo Ast Total Sacks-Yds TFL-Yds FF FR-Yds Int-Yds BrUp Blks QBHLawrence Wright 8 1 9 - - - - - - - -Ben Hanks 6 3 9 1.0-8 1.0-8 - 1-95 - - - -David Barnard 5 4 9 - - - - - - - -Totals 58 21 79 2-14 5-17 0 2-95 2-25 0 0 0
Auburn Solo Ast Total Sacks-Yds TFL-Yds FF FR-Yds Int-Yds BrUp Blks QBHDel Delco 6 4 10 - - - - - - - -Steve Conley 9 0 9 1.0-6 1.0-6 - - - - - -Totals 56 17 73 2-12 3-15 0 0-0 0-0 2 0 0
Drive Chart Drive Started Drive Ended ConsumedTeam Qtr Spot Time Obtained Spot Time How Lost Pl-Yds TOPUF 1st F20 7:26 Kickoff A00 4:30 Touchdown 7-80 2:56UF 1st A47 3:17 Interception A00 1:25 Touchdown 5-47 1:52UF 2nd F35 12:15 Missed FG A43 10:26 Punt 7-22 1:49UF 2nd A45 9:16 Punt A14 5:03 Field Goal 9-31 4:13UF 2nd F36 2:05 Fumble A15 0:12 Missed FG 10-49 1:53UF 3rd F18 15:00 Kickoff A42 11:33 Punt 8-40 3:27UF 3rd F34 9:46 Punt A00 8:26 Touchdown 3-66 1:20UF 3rd F05 4:25 Fumble A00 4:25 Touchdown - -UF 3rd A34 2:58 Interception A03 12:48 Field Goal 9-31 5:10UF 4th F20 8:42 Punt F20 6:19 Punt 4-0 2:23UF 4th F49 4:42 Punt A16 0:00 End of Half 7-35 4:42Avg. Starting Field Position: UF39 Three and Out: 0
Drive Chart Drive Started Drive Ended ConsumedTeam Qtr Spot Time Obtained Spot Time How Lost Pl-Yds TOPAR 1st A16 15:00 Kickoff F19 7:26 Field Goal 16-65 7:34AR 1st A26 4:30 Kickoff A38 3:17 Interception 3-12 1:13AR 1st A27 1:25 Kickoff F34 12:15 Missed FG 12-39 4:10AR 2nd A20 10:26 Punt A14 9:16 Punt 4-(-6) 1:10AR 2nd A27 5:03 Kickoff F35 2:05 Fumble 7-38 2:58AR 2nd A20 0:12 Missed FG A20 0:00 End of Half 1-0 0:12AR 3rd A20 11:33 Punt A37 9:46 Punt 5-17 1:47AR 3rd A20 8:26 Kickoff F03 4:25 Fumble 12-77 4:01AR 3rd A35 4:25 Kickoff A40 2:58 Interception 3-5 1:27AR 4th A10 12:48 Kickoff A50 8:42 Punt 7-40 4:06AR 4th A34 6:19 Punt A24 4:42 Punt 4-(-10) 1:37Avg. Starting Field Position: AR24 Three and Out: 0
Scoring SummaryQtr Time Scoring Play Ply-Yds Time UF-AR1st 7:26 AR – Todd Latourette 36 field goal 16-65 7:34 0-31st 4:30 UF – Chris Doering 22 pass from Danny Wuerffel (Bart Edmiston kick) 7-80 2:56 7-31st 1:25 UF – Danny Wuerffel 1 run (Bart Edmiston kick) 5-47 1:52 14-3
2nd 5:03 UF – Bart Edmiston 31 field goal 9-31 4:13 17-3
3rd 8:26 UF – Ike Hilliard 29 pass from Danny Wuerffel (Bart Edmiston kick) 3-66 1:20 24-33rd 4:25 UF – Ben Hanks 95 fumble return (Bart Edmiston kick) - - 31-3
4th 12:48 UF – Bart Edmiston 20 field goal 9-31 5:10 34-3

72 SEC Championship Game Record Book
1994 SEC CHAMPIONSHIPFlorida (10-1-1) 24, Alabama (11-1) 23Dec. 3, 1994 | Atlanta, Ga. (Georgia Dome)Attendance: 74,751 | TV: ABCKickoff Time: 3:39 p.m. | End of Game: 6:47 p.m. | Time of Game: 3:08Officials: Referee: Dick Burleson; Umpire: Butch Hannah; Linesman: Billy Schor-er; Line Judge: Ron Leatherwood; Back Judge: Harold Mitchell; Field Judge: Joe Delany; Side Judge: Ben Oldham.
Score by Quarters 1 2 3 4 TotalAlabama 7 3 6 7 23Florida 7 10 0 7 24
UA UFFIRST DOWNS 16 14Rushing 10 3Passing 6 10Penalty 0 1NET YARDS RUSHING 116 44Rushing Attempts 48 24Average Per Rush 2.4 1.8Rushing Touchdowns 0 1Yards Gained Rushing 170 59Yards Lost Rushing 54 15NET YARDS PASSING 181 272Completions-Attempts-Int 10-19-2 25-43-2Average Per Attempt 9.5 6.3Average Per Completion 18.1 10.9Passing Touchdowns 1 2TOTAL OFFENSIVE YARDS 297 316Total Offensive Plays 67 67Average Gain Per Play 4.4 4.7Fumbles: Number-Lost 1-0 0-0Penalties: Number-Yards 6-30 2-10PUNTS-YARDS 6-206 6-248Average Yards Per Punt 34.3 41.3Net Yards Per Punt 34.2 33.8Inside 20 3 250+ Yards 0 1Touchbacks 1 0Fair Catch 2 1KICKOFFS-YARDS 6-382 5-325Average Yards Per Kickoff 63.7 65.0Net Yards Per Kickoff 63.5 56.4Touchbacks 3 3Punt Returns: Number-Yards-TD 2-45-0 1-1-0Average Per Return 22.5 1.0Kickoff Returns: Number-Yards-TD 2-43 3-58Average Per Return 21.5 19.3Interceptions: Number-Yards-TD 2-65-1 2-9-0Fumble Returns: Number-Yards-TD 0-0-0 0-0-0Miscellaneous Yards 0 0Possession Time 34:15 25:451st Quarter 9:30 5:302nd Quarter 5:58 9:023rd Quarter 10:24 4:364th Quarter 8:23 6:37Third-Down Conversions 5 of 17 2 of 12Fourth-Down Conversions 1 of 2 2 of 2Red Zone Scores-Chances 1-1 2-2Touchdowns 0 2Field Goals 1 0Sacks By: Number-Yards 1-5 5-39PAT Kicks 2-2 3-3Field Goals 3-3 1-1
AlabamaRushing No Gain Loss Net TD Lg AvgSherman Williams 29 104 5 99 0 16 3.4Tarrant Lynch 8 48 0 48 0 16 6.0Dennis Riddle 2 7 0 7 0 4 3.5Toderick Malone 1 6 0 6 0 6 6.0Jay Barker 8 5 49 -44 0 3 -5.5Totals 48 170 54 116 0 16 2.4
Passing C-A-I Yds TD Lg SackJay Barker 10-19-2 181 1 70 5
Receiving No Yards TD LgCurtis Brown 3 119 1 70Tarrant Lynch 3 28 0 20Sherman Williams 2 6 0 5Toderick Malone 1 14 0 14Patrick Hape 1 14 0 14Totals 10 181 1 70
Punting No Yds Avg Lg In20 TBBryne Diehl 5 203 40.6 49 3 1Team 1 3 3.0 3 0 0Totals 6 206 34.3 49 3 1
Punt Kickoff InterceptReturns No-Yds-Lg No-Yds-Lg No-Yds-LgDeshea Townsend 2-45-24 0-0-0 1-42-42Marcell West 0-0-0 2-43-22 0-0-0Dwayne Rudd 0-0-0 0-0-0 1-23-23Totals 2-45-24 2-43-22 2-65-42
Field Goals Qtr Time Dist ResultMichael Proctor 2nd 14:45 22 goodMichael Proctor 3rd 7:35 42 goodMichael Proctor 3rd 2:14 48 good
Kickoffs No Yards Avg TB OBWilliam Watts 6 382 63.7 3 0
All-Purpose Run Rcv KR PR IR TotalCurtis Brown 0 119 0 0 0 119Sherman Williams 99 6 0 0 0 105
FloridaRushing No Gain Loss Net TD Lg AvgFred Taylor 14 41 1 40 0 8 2.9Reidel Anthony 1 5 0 5 0 5 5.0Elijah Williams 3 3 3 0 0 3 0.0Danny Wuerffel 6 10 11 -1 1 9 -0.2Totals 24 59 15 44 1 9 1.8
Passing C-A-I Yds TD Lg SackDanny Wuerffel 23-41-2 227 2 36 1Eric Kresser 1-1-0 25 0 25 0Chris Doering 1-1-0 20 0 20 0Totals 25-43-2 272 2 36 1
Receiving No Yards TD LgReidel Anthony 8 105 1 36Fred Taylor 7 62 0 14Aubrey Hill 3 52 0 24Chris Doering 3 11 1 5Ike Hilliard 2 34 0 25Shawn Nunn 1 3 0 3Jack Jackson 1 5 0 5Totals 25 272 2 36
Punting No Yds Avg Lg In20 TBShayne Edge 6 248 41.3 52 2 0 Punt Kickoff InterceptReturns No-Yds-Lg No-Yds-Lg No-YdsSorola Palmer 1-1-1 0-0-0 0-0-0Reidel Anthony 0-0-0 2-44-22 0-0-0Jack Jackson 0-0-0 1-14-14 0-0-0Eddie Lake 0-0-0 0-0-0 1-9-9Fred Weary 0-0-0 0-0-0 1-0-0Totals 1-1-1 3-58-22 2-9-9
Field Goals Qtr Time Dist ResultJudd Davis 2nd 10:31 42 good

73SEC Championship Game Record Book
Kickoffs No Yards Avg TB OBShayne Edge 5 325 65.0 3 0
All-Purpose Run Rcv KR PR IR TotalReidel Anthony 5 105 44 0 0 154Fred Taylor 40 62 0 0 0 102
Fumbles: Alabama – Sherman Williams 1-0. Florida – None.
Defensive LeadersAlabama Solo Ast Total Sacks-Yds TFL-Yds FF FR-Yds Int-Yds BrUp Blks QBHDeshea Townsend 6 1 7 - - - - 1-42 - - -Tommy Johnson 5 1 6 - - - - - - - -Willie Gaston 3 3 6 - - - - - 2 - -Totals 48 13 61 1-5 3-9 0 0-0 2-65 4 0 0
Florida Solo Ast Total Sacks-Yds TFL-Yds FF FR-Yds Int-Yds BrUp Blks QBHKevin Carter 7 1 8 1.0-3 1.0-3 - - - - - -Kevin Freeman 5 3 8 - - - - - - - -Shea Showers 3 5 8 - - - - - - - -Michael Gilmore 4 3 7 - - - - - - - -Totals 59 21 80 5-39 11-56 0 0-0 2-9 1 1 0
Drive Chart Drive Started Drive Ended ConsumedTeam Qtr Spot Time Obtained Spot Time How Lost Pl-Yds TOPUA 1st A24 12:42 Punt F00 11:05 Touchdown 3-76 1:37UA 1st A19 9:32 Punt A34 5:46 Punt 6-15 3:46UA 1st A20 4:07 Kickoff F05 14:45 Field Goal 10-75 4:22UA 2nd A20 10:31 Kickoff A23 9:08 Interception 3-3 1:23UA 2nd F42 8:46 Interception F39 7:11 Punt 3-3 1:35UA 2nd F45 5:50 Punt A40 4:18 Blocked Punt 3-(-15) 1:32UA 2nd A20 1:15 Kickoff A25 1:02 Punt 3-5 1:13UA 3rd A21 15:00 Kickoff F45 12:11 Punt 7-34 2:49UA 3rd F43 10:19 Punt F30 7:35 Field Goal 7-13 2:44UA 3rd A43 7:05 Punt F30 2:14 Field Goal 9-27 4:51UA 4th A20 12:55 Punt A40 9:07 Punt 6-20 3:48UA 4th F23 8:56 Interception F00 8:56 Touchdown - -UA 4th A22 5:29 Kickoff A44 0:54 Interception 10-34 4:35Avg. Starting Field Position: UA31 Three and Out: 3
Drive Chart Drive Started Drive Ended ConsumedTeam Qtr Spot Time Obtained Spot Time How Lost Pl-Yds TOPUF 1st F20 15:00 Kickoff F28 12:42 Punt 3-8 2:18UF 1st F20 11:05 Kickoff F29 9:32 Punt 5-9 1:33UF 1st F28 5:46 Punt A00 4:07 Touchdown 6-72 1:39UF 2nd F20 14:45 Kickoff A24 10:31 Field Goal 10-56 4:14UF 2nd A29 9:08 Interception A22 8:46 Interception 7-3 0:22UF 2nd F20 7:11 Punt F29 5:50 Punt 3-9 1:21UF 2nd A43 4:18 Blocked Punt A00 1:15 Touchdown 8-43 3:03UF 2nd F26 0:02 Punt F25 0:00 End of Half 1-(-1) 0:02UF 3rd F12 12:11 Punt F19 10:19 Punt 3-7 1:52UF 3rd F22 7:35 Kickoff F22 7:05 Punt 3-0 0:30UF 3rd F23 2:14 Kickoff A47 12:55 Punt 9-30 4:19UF 4th F17 9:07 Punt F17 8:56 Interception 2-0 0:11UF 4th F20 8:56 Kickoff A00 5:29 Touchdown 10-80 3:27UF 4th F44 0:54 Interception F39 0:00 End of Half 2-(-5) 0:54Avg. Starting Field Position: UF27 Three and Out: 4
Scoring SummaryQtr Time Scoring Play Ply-Yds Time UA-UF1st 11:05 UA – Curtis Brown 70 pass from Jay Barker (Michael Proctor kick) 3-6 1:37 7-01st 4:07 UF – Reidel Anthony 26 pass from Danny Wuerffel (Judd Davis kick) 6-72 1:39 7-7
2nd 14:45 UA – Michael Proctor 22 field goal 10-75 4:22 10-72nd 10:31 UF – Judd Davis 42 field goal 10-56 4:14 10-102nd 1:15 UF – Danny Wuerffel 1 run (Judd Davis kick) 8-43 3:03 10-17
3rd 7:35 UA – Michael Proctor 42 field goal 7-13 2:44 13-173rd 2:14 UA – Michael Proctor 48 field goal 9-27 4:51 16-17
4th 8:56 UA – Dwayne Rudd 23 interception return - - 23-174th 5:29 UF – Chris Doering 2 pass from Danny Wuerffel (Judd Davis kick) 10-80 3:27 23-24

74 SEC Championship Game Record Book
1993 SEC CHAMPIONSHIPFlorida (10-2) 28, Alabama (8-3-1) 13Dec. 4, 1993 | Birmingham, Ala. (Legion Field)Attendance: 76,345 | TV: ABCKickoff Time: 2:34 p.m. | End of Game: 5:54 p.m. | Time of Game: 3:20Officials: Referee: Mack Gentry; Umpire: Nate Anderson; Linesman: Bert Acker-mann; Line Judge: Billy Schroer; Back Judge: Tobie Silberman; Field Judge: Joe Delaney; Side Judge: John Boni.
Score by Quarters 1 2 3 4 TotalFlorida 7 7 7 7 28Alabama 7 3 3 0 13
UF UAFIRST DOWNS 20 17Rushing 6 9Passing 14 7Penalty 0 1NET YARDS RUSHING 103 118Rushing Attempts 31 40Average Per Rush 3.3 2.9Rushing Touchdowns 2 1Yards Gained Rushing 141 165Yards Lost Rushing 38 47NET YARDS PASSING 271 161Completions-Attempts-Int 21-38-2 17-29-2Average Per Attempt 7.1 5.6Average Per Completion 12.9 9.5Passing Touchdowns 2 0TOTAL OFFENSIVE YARDS 374 279Total Offensive Plays 69 69Average Gain Per Play 5.4 4.0Fumbles: Number-Lost 1-0 3-0Penalties: Number-Yards 13-95 6-70PUNTS-YARDS 7-276 7-305Average Yards Per Punt 39.4 43.6Net Yards Per Punt 34.9 30.0Inside 20 3 150+ Yards 1 3Touchbacks 1 0Fair Catch 1 0KICKOFFS-YARDS 5-304 4-256Average Yards Per Kickoff 60.8 64.0Net Yards Per Kickoff 42.0 59.8Touchbacks 1 3Punt Returns: Number-Yards-TD 5-95-0 4-32Average Per Return 19.0 8.0Kickoff Returns: Number-Yards-TD 1-17-0 4-94-0Average Per Return 17.0 23.5Interceptions: Number-Yards-TD 2-0-0 2-18-0Fumble Returns: Number-Yards-TD 0-0-0 0-0-0Miscellaneous Yards 0 0Possession Time 27:43 32:171st Quarter 4:46 10:142nd Quarter 7:02 7:583rd Quarter 6:41 8:194th Quarter 9:14 5:46Third-Down Conversions 4 of 14 5 of 16Fourth-Down Conversions 2 of 2 1 of 2Red Zone Scores-Chances 3-3 2-3Touchdowns 3 1Field Goals 0 1Sacks By: Number-Yards 2-15 2-11PAT Kicks 4-4 1-1Field Goals 0-0 2-2
FloridaRushing No Gain Loss Net TD Lg AvgErrict Rhett 22 102 14 88 1 14 4.0Shayne Edge 1 20 0 20 0 20 20.0Terry Dean 8 19 24 -5 1 16 -0.6Totals 31 141 38 103 2 20 3.3
Passing C-A-I Yds TD Lg SackTerry Dean 20-37-2 256 2 43 2Chris Doering 1-1-0 15 0 15 0Totals 21-38-2 271 2 43 2
Receiving No Yards TD LgWillie Jackson 9 114 0 33Jack Jackson 4 62 1 43Harrison Houston 2 48 1 35Errict Rhett 2 17 0 11Charlie Dean 2 4 0 5Terry Dean 1 15 0 15Totals 21 271 2 43
Punting No Yds Avg Lg In20 TBShayne Edge 7 276 39.4 53 3 1
Punt Kickoff InterceptReturns No-Yds-Lg No-Yds-Lg No-Yds-LgSorola Palmer 5-95-33 0-0-0 0-0-0Jack Jackson 0-0-0 1-17-17 0-0-0Michael Gilmore 0-0-0 0-0-0 2-0-0Totals 5-95-33 1-17-17 2-0-0
Field Goals Qtr Time Dist ResultNone
Kickoffs No Yards Avg TB OBShayne Edge 5 304 60.8 1 0
All-Purpose Run Rcv KR PR IR TotalWillie Jackson 0 114 0 0 0 114Errict Rhett 88 17 0 0 0 105
AlabamaRushing No Gain Loss Net TD Lg AvgDavid Palmer 16 95 2 93 0 12 5.8Chris Anderson 8 41 15 26 0 12 3.3Brian Burgdorf 6 19 12 7 0 7 1.2Tarrant Lynch 1 1 0 1 1 1 1.0Brian Steger 1 1 0 1 0 1 1.0Taurus Turner 1 1 0 1 0 1 1.0Sherman Williams 6 7 11 -4 0 4 -0.7Kevin Lee 1 0 7 -7 0 0 -7.0Totals 40 165 47 118 1 12 2.9
Passing C-A-I Yds TD Lg SackDavid Palmer 8-16-1 90 0 20 1Brian Burgdorf 9-12-0 71 0 17 1Fred Kitchens 0-1-1 0 0 0 0Totals 17-29-2 161 0 20 2
Receiving No Yards TD LgToderick Malone 3 37 0 17David Palmer 3 22 0 10Chris Anderson 3 18 0 17Kevin Lee 2 23 0 14Tarrant Lynch 2 13 0 9Sherman Williams 2 11 0 7Brian Burgdorf 1 20 0 20Chad Key 1 17 0 17Totals 17 161 0 20
Punting No Yds Avg Lg In20 TBBryne Diehl 7 305 43.6 56 1 0 Punt Kickoff InterceptReturns No-Yds-Lg No-Yds-Lg No-YdsDavid Palmer 4-32-28 2-50-27 0-0-0Chris Anderson 0-0-0 2-44-29 0-0-0Tommy Johnson 0-0-0 0-0-0 2-18-18Totals 4-32-28 4-94-29 2-18-18

75SEC Championship Game Record Book
Field Goals Qtr Time Dist ResultMichael Proctor 2nd 12:02 45 goodMichael Proctor 3rd 2:14 25 good
Kickoffs No Yards Avg TB OBWilliam Watts 4 256 64.0 3 0
All-Purpose Run Rcv KR PR IR TotalDavid Palmer 93 22 32 50 0 197
Fumbles: Florida – Errict Rhett 1-0. Alabama – David Palmer 1-0, Brian Burgdorf 1-0, Sherman Williams 1-0.
Defensive LeadersFlorida Solo Ast Total Sacks-Yds TFL-Yds FF FR-Yds Int-Yds BrUp Blks QBHLarry Kennedy 10 1 11 - 1.0-1 - - - 1 - -Ben Hanks 7 2 9 - - - - - - - -Totals 61 15 76 2-15 9-43 0 0-0 2-0 3 0 0
Alabama Solo Ast Total Sacks-Yds TFL-Yds FF FR-Yds Int-Yds BrUp Blks QBHChris Donnelly 8 4 12 - - - - - - - -Willie Gaston 10 1 11 - - - - - - - -Totals 51 21 72 2-11 6-27 0 0-0 2-18 3 0 0
Drive Chart Drive Started Drive Ended ConsumedTeam Qtr Spot Time Obtained Spot Time How Lost Pl-Yds TOPUF 1st F20 10:13 Kickoff F39 8:14 Punt 5-19 1:59UF 1st A42 5:40 Punt A42 4:36 Punt 3-0 1:04UF 1st A44 2:45 Punt A00 1:02 Touchdown 4-44 1:43UF 2nd F21 12:02 Kickoff F21 11:42 Interception 1-0 0:20UF 2nd F06 10:06 Punt A42 5:08 Punt 12-52 4:58UF 2nd A35 2:54 Punt A00 1:10 Touchdown 6-35 1:44UF 3rd F20 15:00 Kickoff F22 13:22 Punt 3-4 1:38UF 3rd F25 11:49 Punt F38 9:44 Punt 4-13 2:05UF 3rd F28 7:24 Punt F29 6:33 Interception 4-1 0:41UF 3rd F20 2:14 Kickoff A00 0:28 Touchdown 7-80 1:46UF 3rd F46 0:21 Interception A00 11:59 Touchdown 9-54 3:22UF 4th F30 9:38 Punt A37 5:16 Punt 8-33 4:22UF 4th F19 2:01 Downs F05 0:19 Punt 3-(-14) 1:42UF 4th F01 0:09 Interception F02 0:00 End of Game 1-1 0:09Avg. Starting Field Position: UF31 Three and Out: 3
Drive Chart Drive Started Drive Ended ConsumedTeam Qtr Spot Time Obtained Spot Time How Lost Pl-Yds TOPUA 1st A29 15:00 Kickoff F00 10:13 Touchdown 8-71 4:47UA 1st A18 8:14 Punt A06 5:40 Punt 3-(-12) 2:34UA 1st A09 4:36 Punt A24 2:45 Punt 4-15 1:51UA 1st A28 1:02 Kickoff F28 12:02 Field Goal 9-44 1:44UA 2nd F41 11:42 Interception F41 10:06 Punt 3-0 1:36UA 2nd A10 5:08 Punt A17 2:54 Punt 3-7 2:14UA 2nd A25 1:10 Kickoff A48 0:00 End of Half 4-23 1:10UA 3rd F48 13:22 Punt F41 11:49 Punt 3-7 1:33UA 3rd A27 9:44 Punt A40 7:24 Punt 4-13 2:20UA 3rd A47 6:33 Interception F08 2:14 Field Goal 11-45 4:19UA 3rd A20 0:28 Kickoff A15 0:21 Interception 1-(-5) 0:07 UA 4th A33 11:59 Kickoff A08 9:38 Punt 3-(-25) 2:21UA 4th A20 5:16 Punt F19 2:01 Downs 12-61 3:15UA 4th F43 0:19 Punt F43 0:09 Interception 1-0 0:10Avg. Starting Field Position: UA32 Three and Out: 5
Scoring SummaryQtr Time Scoring Play Ply-Yds Time UF-UA1st 10:13 UA - Tarrant Lynch 1 run (Michael Proctor kick) 8-71 4:47 0-71st 1:02 UF - Harrison Houston 13 pass from Terry Dean (Judd Davis kick) 4-44 1:43 7-7
2nd 12:02 UA - Michael Proctor 45 field goal 9-44 4:00 7-102nd 1:10 UF - Terry Dean 2 run (Judd Davis kick) 6-35 1:44 14-10
3rd 2:14 UA - Michael Proctor 25 field goal 11-45 4:19 14-133rd 0:28 UF - Jack Jackson 43 pass from Terry Dean (Judd Davis kick) 7-80 1:46 21-13
4th 11:59 UF - Errict Rhett 3 run (Judd Davis kick) 9-54 3:22 28-13

76 SEC Championship Game Record Book
1992 SEC CHAMPIONSHIPAlabama (12-0) 28, Florida (8-4) 21Dec. 5, 1992 | Birmingham, Ala. (Legion Field)Attendance: 83,091 | TV: ABCKickoff Time: 2:41 p.m. | End of Game: 5:53 p.m. | Time of Game: 3:12Officials: Referee: Rom Gilbert; Umpire: Ted Davis; Linesman: Dan Dembinski; Line Judge: Bobby Caldwell; Back Judge: Tobie Silberman; Field Judge: Bill Stanton; Side Judge: Nick Buoni.
Score by Quarters 1 2 3 4 TotalAlabama 7 7 7 7 28Florida 7 0 7 7 21
UA UFFIRST DOWNS 15 22Rushing 9 5Passing 5 16Penalty 1 1NET YARDS RUSHING 132 30Rushing Attempts 41 30Average Per Rush 3.2 1.0Rushing Touchdowns 2 1Yards Gained Rushing 176 80Yards Lost Rushing 44 50NET YARDS PASSING 154 287Completions-Attempts-Int 10-18-0 30-49-2Average Per Attempt 8.6 5.9Average Per Completion 15.4 9.6Passing Touchdowns 1 2TOTAL OFFENSIVE YARDS 286 317Total Offensive Plays 59 79Average Gain Per Play 4.9 4.0Fumbles: Number-Lost 0-0 0-0Penalties: Number-Yards 11-75 4-30PUNTS-YARDS 10-326 7-279Average Yards Per Punt 32.6 40.0Net Yards Per Punt 30.3 35.4Inside 20 3 150+ Yards 1 0Touchbacks 0 2Fair Catch 1 2KICKOFFS-YARDS 5-254 4-146Average Yards Per Kickoff 50.8 36.5Net Yards Per Kickoff 36.6 33.0Touchbacks 0 0Punt Returns: Number-Yards-TD 3-31-0 4-23-0Average Per Return 10.3 5.8Kickoff Returns: Number-Yards-TD 3-14-0 5-71-0Average Per Return 4.7 14.2Interceptions: Number-Yards-TD 2-27-1 0-0-0Fumble Returns: Number-Yards-TD 0-0-0 0-0-0Miscellaneous Yards 0 0Possession Time 28:40 31:201st Quarter 6:44 8:162nd Quarter 5:55 8:053rd Quarter 6:13 8:474th Quarter 8:48 6:12Third-Down Conversions 2 of 13 4 of 15Fourth-Down Conversions 0 of 0 1 of 3Red Zone Scores-Chances 2-2 3-3Touchdowns 2 3Field Goals 0 0Sacks By: Number-Yards 3-21 3-23PAT Kicks 4-4 3-3Field Goals 0-0 0-1
AlabamaRushing No Gain Loss Net TD Lg AvgDerrick Lassic 21 121 4 117 2 25 5.6Martin Houston 6 22 0 22 0 6 3.7Chris Anderson 2 9 3 6 0 9 3.0Sherman Williams 1 2 0 2 0 2 2.0Jay Barker 8 21 25 -4 0 12 -0.5David Palmer 3 1 12 -11 0 1 -3.7Totals 41 176 44 132 2 25 3.2
Passing C-A-I Yds TD Lg SackJay Barker 10-18-0 154 1 39 3
Receiving No Yards TD LgDavid Palmer 5 101 0 39Sherman Williams 2 16 0 11Curtis Brown 1 30 1 30Kevin Lee 1 5 0 5Chris Anderson 1 2 0 2Totals 10 154 1 39
Punting No Yds Avg Lg In20 TBBryne Diehl 10 326 32.6 50 3 0
Punt Kickoff InterceptReturns No-Yds-Lg No-Yds-Lg No-Yds-LgDavid Palmer 3-31-20 0-0-0 0-0-0Craig Harris 0-0-0 2-14-10 0-0-0Sherman Williams 0-0-0 1-0-0 0-0-0Antonio Langham 0-0-0 0-0-0 1-27-27Michael Rogers 0-0-0 0-0-0 1-0-0Totals 3-31-20 3-14-10 2-27-27
Field Goals Qtr Time Dist ResultNone
Kickoffs No Yards Avg TB OBMichael Proctor 5 254 50.8 0 0
All-Purpose Run Rcv KR PR IR TotalDavid Palmer -11 101 0 31 0 121Derrick Lassic 117 0 0 0 0 117
FloridaRushing No Gain Loss Net TD Lg AvgErrict Rhett 22 72 13 59 1 15 2.7Kelvin Randolph 1 0 0 0 0 0 0.0Kedra Malone 1 0 4 -4 0 0 -4.0Shayne Edge 1 0 12 -12 0 0 -12.0Shane Matthews 5 8 21 -13 0 4 -2.6Totals 30 80 50 30 1 15 1.0
Passing C-A-I Yds TD Lg SackShane Matthews 30-49-2 287 2 19 3
Receiving No Yards TD LgErrict Rhett 10 82 1 18Willie Jackson 9 100 1 19Charlie Dean 3 31 0 13Kelvin Randolph 3 31 0 17Greg Keller 2 26 0 19Harrison Houston 2 10 0 6Tre Everett 1 7 0 7Totals 30 287 2 19
Punting No Yds Avg Lg In20 TBShayne Edge 7 279 39.9 48 1 2 Punt Kickoff InterceptReturns No-Yds-Lg No-Yds-Lg No-YdsMonty Duncan 4-23-14 0-0-0 0-0-0Harrison Houston 0-0-0 5-71-19 0-0-0Totals 4-23-14 5-71-19 0-0-0
Field Goals Qtr Time Dist ResultJudd Davis 3rd 6:47 51 missed
Kickoffs No Yards Avg TB OBRyan Ruland 4 146 36.5 0 0
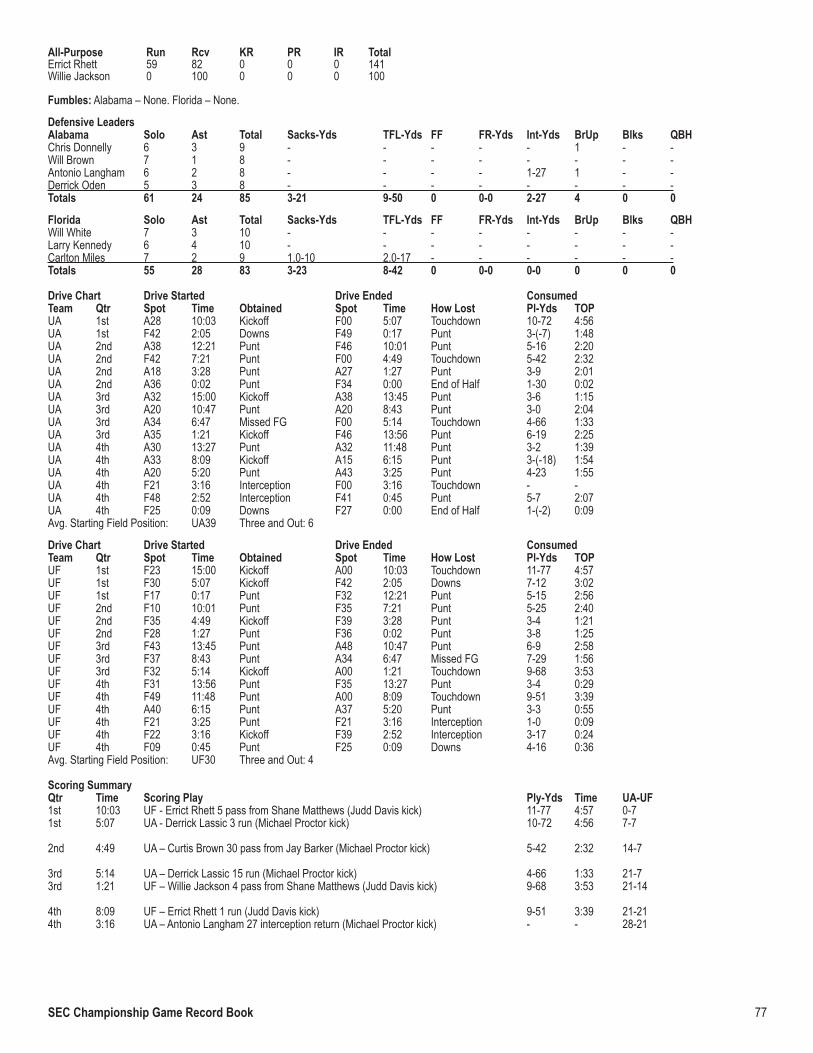
77SEC Championship Game Record Book
All-Purpose Run Rcv KR PR IR TotalErrict Rhett 59 82 0 0 0 141Willie Jackson 0 100 0 0 0 100
Fumbles: Alabama – None. Florida – None.
Defensive LeadersAlabama Solo Ast Total Sacks-Yds TFL-Yds FF FR-Yds Int-Yds BrUp Blks QBHChris Donnelly 6 3 9 - - - - - 1 - -Will Brown 7 1 8 - - - - - - - -Antonio Langham 6 2 8 - - - - 1-27 1 - -Derrick Oden 5 3 8 - - - - - - - -Totals 61 24 85 3-21 9-50 0 0-0 2-27 4 0 0
Florida Solo Ast Total Sacks-Yds TFL-Yds FF FR-Yds Int-Yds BrUp Blks QBHWill White 7 3 10 - - - - - - - -Larry Kennedy 6 4 10 - - - - - - - -Carlton Miles 7 2 9 1.0-10 2.0-17 - - - - - -Totals 55 28 83 3-23 8-42 0 0-0 0-0 0 0 0
Drive Chart Drive Started Drive Ended ConsumedTeam Qtr Spot Time Obtained Spot Time How Lost Pl-Yds TOPUA 1st A28 10:03 Kickoff F00 5:07 Touchdown 10-72 4:56UA 1st F42 2:05 Downs F49 0:17 Punt 3-(-7) 1:48UA 2nd A38 12:21 Punt F46 10:01 Punt 5-16 2:20UA 2nd F42 7:21 Punt F00 4:49 Touchdown 5-42 2:32UA 2nd A18 3:28 Punt A27 1:27 Punt 3-9 2:01UA 2nd A36 0:02 Punt F34 0:00 End of Half 1-30 0:02UA 3rd A32 15:00 Kickoff A38 13:45 Punt 3-6 1:15UA 3rd A20 10:47 Punt A20 8:43 Punt 3-0 2:04UA 3rd A34 6:47 Missed FG F00 5:14 Touchdown 4-66 1:33UA 3rd A35 1:21 Kickoff F46 13:56 Punt 6-19 2:25UA 4th A30 13:27 Punt A32 11:48 Punt 3-2 1:39UA 4th A33 8:09 Kickoff A15 6:15 Punt 3-(-18) 1:54UA 4th A20 5:20 Punt A43 3:25 Punt 4-23 1:55UA 4th F21 3:16 Interception F00 3:16 Touchdown - -UA 4th F48 2:52 Interception F41 0:45 Punt 5-7 2:07UA 4th F25 0:09 Downs F27 0:00 End of Half 1-(-2) 0:09Avg. Starting Field Position: UA39 Three and Out: 6
Drive Chart Drive Started Drive Ended ConsumedTeam Qtr Spot Time Obtained Spot Time How Lost Pl-Yds TOPUF 1st F23 15:00 Kickoff A00 10:03 Touchdown 11-77 4:57UF 1st F30 5:07 Kickoff F42 2:05 Downs 7-12 3:02UF 1st F17 0:17 Punt F32 12:21 Punt 5-15 2:56UF 2nd F10 10:01 Punt F35 7:21 Punt 5-25 2:40UF 2nd F35 4:49 Kickoff F39 3:28 Punt 3-4 1:21UF 2nd F28 1:27 Punt F36 0:02 Punt 3-8 1:25UF 3rd F43 13:45 Punt A48 10:47 Punt 6-9 2:58UF 3rd F37 8:43 Punt A34 6:47 Missed FG 7-29 1:56UF 3rd F32 5:14 Kickoff A00 1:21 Touchdown 9-68 3:53UF 4th F31 13:56 Punt F35 13:27 Punt 3-4 0:29UF 4th F49 11:48 Punt A00 8:09 Touchdown 9-51 3:39UF 4th A40 6:15 Punt A37 5:20 Punt 3-3 0:55UF 4th F21 3:25 Punt F21 3:16 Interception 1-0 0:09UF 4th F22 3:16 Kickoff F39 2:52 Interception 3-17 0:24UF 4th F09 0:45 Punt F25 0:09 Downs 4-16 0:36Avg. Starting Field Position: UF30 Three and Out: 4
Scoring SummaryQtr Time Scoring Play Ply-Yds Time UA-UF1st 10:03 UF - Errict Rhett 5 pass from Shane Matthews (Judd Davis kick) 11-77 4:57 0-71st 5:07 UA - Derrick Lassic 3 run (Michael Proctor kick) 10-72 4:56 7-7
2nd 4:49 UA – Curtis Brown 30 pass from Jay Barker (Michael Proctor kick) 5-42 2:32 14-7
3rd 5:14 UA – Derrick Lassic 15 run (Michael Proctor kick) 4-66 1:33 21-73rd 1:21 UF – Willie Jackson 4 pass from Shane Matthews (Judd Davis kick) 9-68 3:53 21-14
4th 8:09 UF – Errict Rhett 1 run (Judd Davis kick) 9-51 3:39 21-214th 3:16 UA – Antonio Langham 27 interception return (Michael Proctor kick) - - 28-21

78 SEC Championship Game Record Book
CHAMPIONSHIP GAME REFEREES2017 John McDaid2016 Matt Loeffler2015 Matt Austin (3)2014 Thomas Ritter (5)2013 Hubert Owens2012 Thomas Ritter (4)2011 Matt Austin (2)2010 Matt Moore2009 Matt Austin (1)2008 Thomas Ritter (3)2007 Thomas Ritter (2)2006 Steve Shaw (3)2005 Rocky Goode2004 Steve Landis2003 Thomas Ritter (1)2002 Penn Wagers2001 Steve Shaw (2)2000 Doyle Jackson1999 Rogers Redding1998 Steve Shaw (1) 1997 Al Ford (2)1996 Aster Sizemore1995 Al Ford (1)1994 Dick Burleson1993 Mack Gentry1992 Rom Gilbert
ALL-TIME SEC CHAMPIONSHIP GAME OFFICIALSATim Abel 1996Bobby Ables 2016Bert Ackermann 1993Bobby Aillet 2009, 2004, 1998Jim Allison 2000Nate Anderson 1996, 1993Matt Austin 2015, 2011, 2009
BTim Beard 2013James Bing 2000, 1998Tra Boger 2017John Boni 1993Jimmy Buchanan 2002Dick Burleson 1994Mick Buoni 1996, 1992
CBobby Caldwell 1996, 1992Raymond Carter 1995Chris Conley 2008, 2007, 2005Johnny Crawford 2013, 2010, 2004
DTed Davis 1992Joe Dawson 2005Jim Delany 1994, 1993Dan Dembinski 1992Stanley Dixon 1999, 1997Jesse Dupuy 2016Lee Dyer 1998
FAl Ford 1997, 1995Brad Freeman 2012, 2010Steve Freeman 1996
GMack Gentry 1993Rom Gilbert 1992Rocky Goode 2005
HWilbur Hackett 2011, 2009, 2007Martin Hankins 2017Butch Hannah 1998, 1994Len Harrington 2002, 1996Chad Hill 2017, 2013Dax Hill 2014Gerald Hodges 2005, 2000Wally Hough 2010
JDoyle Jackson 2000Gary Jayroe 2017, 2014, 2012, 2007Tony Josselyn 2016
KDale Keneipp 2008, 2005, 2004
LButch Lambert 2001Steve Landis 2004 Rodney Lawary 2015Larry Leatherwood 2004Ron Leatherwood 2000, 1998, 1994Doug Linebarger 2006, 2005, 1999Matt Loeffler 2016Chad Lorance 2017
MJulian Mapp 2008, 2006, 2004Rich Martinez 2012, 2010Allama Matthews 2009, 2005John McDaid 2017Philip McKinnely 1995Harold Mitchell 1994Ray Moon 1999Dan Moore 2007, 2002Matt Moore 2010, 2001Richard Morales 2008Bobby Moreau 2015, 2009, 2006, 1998Casey Moreland 2012Gus Morris 2016, 2008, 2006, 2003, 2002Stan Murray 2013, 2009, 2007, 1999
NMike New 2000
OBen Oldham 1997, 1994David Oliver 2014Hubert Owens 2013
PBlake Parks 2015, 2011, 2003Bob Patrick 1995Steven Patrick 2011, 2006Paul Petrisko 1999, 1997Prince Pollard 2001Eddie Powers 2000, 1995Daniel Pulley 2003Russ Pulley 2013, 2008
QTom Quick 2017
RGeorge Ranager 2003Rogers Redding 1999Thomas Ritter 2014, 2012, 2008, 2007, 2003Chuck Russ 2014, 2012Jimmy Russell 2015
SBilly Schroer 1997, 1994, 1993Don Shanks 2004Steve Shaw 2006, 2001, 1998Michael Shirey 2016, 2003Charlie Showalter 2001Tobie Silberman 1993, 1992 Tim Sistrunk 2015Aster Sizemore 1996Rob Skelton 2011Chris Snead 2016Bill Stanton 1992Tom Szymanski 1999
TMichael Taylor 2015, 2012, 2011, 2010, 2001Greg Thomas 2017, 2013, 2006Lane Thomas 2011, 2001
WPenn Wagers 2002Jabir Walker 2014Mike Wallace 2002, 1995Terry Walters 2009, 2007, 2002Mike Washington 2003Stan Weihe 2016, 2014Ned Wilford 1997, 1995Bud Williams 1997Mike Williams 2010
Most Games Officiated5 Gus Morris Thomas Ritter Michael Taylor
4 Gary Jayroe Bobby Moreau Stan Murray

79SEC Championship Game Record Book
SEC FOOTBALL LEGENDSSEC Football Legends is an annual award program designed to honor outstanding former college football players from each of the conference’s 14 member institutions. Begun in 1994, the Legends Dinner featuring video highlights of each honoree’s career is one of various events of the week leading up to the SEC Championship Game.The honorees are recognized at halftime of the game.
Eastern DivisionYear Florida Georgia Kentucky Missouri South Carolina Tennessee Vanderbilt1994 Neal Anderson Charley Trippi Babe Parilli - George Rogers Bob Johnson Bill Wade1995 Jack Youngblood Fran Tarkenton Derrick Ramsey - Alex Hawkins Doug Atkins Bob Asher1996 Nat Moore Bill Stanfill Wallace Jones - Sterling Sharpe Condredge Holloway John Hall1997 Carlos Alvarez Terry Hoage Jerry Claiborne - Todd Ellis John Michels Bucky Curtis1998 Glenn Cameron John Rauch Bob Gain - Bobby Bryant Richmond Flowers Charley Horton1999 Kerwin Bell Herschel Walker Steve Meilinger - Rick Sanford Steve Kiner Bob Werckle2000 John Reaves Kevin Butler Lou Michaels - Harold Green Steve DeLong Herb Rich2001 Huey Richardson Tommy Lyons Sam Ball - Robert Brooks Stanley Morgan Will Wolford2002 Brad Culpepper George Patton Art Still - Jeff Grantz Johnny Majors Jim Arnold2003 Larry Smith Scott Woerner Dermontti Dawson - Dickie Harris Reggie White Whit Taylor2004 Lomas Brown Mike Wilson George Blanda - Dan Reeves Frank Emanuel Boo Mitchell2005 Trace Armstrong Zeke Bratkowski Warren Bryant - Warren Muir Larry Seivers Chris Gaines2006 Louis Oliver Garrison Hearst Jeff Van Note - Willie Scott Chip Kell Eric Jones2007 Ralph Ortega Rex Robinson Larry Seiple - Duce Staley Willie Gault Chuck Scott2008 Errict Rhett Eric Zeier Irv Goode - Brad Edwards Doug Dickey Shelton Quarles2009 Reidel Anthony Matt Stinchcomb Jim Kovach - Tommy Suggs Heath Shuler Jamie Duncan2010 Kevin Carter Ben Zambiasi Tim Couch - Andrew Provence Al Wilson Corey Chavous2011 Ike Hilliard Boss Bailey Rodger Bird - Brandon Bennett Bobby Majors Corey Harris2012 Steve Tannen David Greene Sonny Collins Johnny Roland Ko Simpson Peerless Price Hunter Hillenmeyer2013 Wes Chandler Tim Worley Wilbur Hackett Phil Bradley Max Runager Inky Johnson Jimmy R. Williams2014 Lito Sheppard John Little Derek Abney Kellen Winslow Sheldon Brown Todd Kelly Jonathan Goff2015 Fred Taylor Richard Seymour Dave Roller Roger Wehrli André Goodman Chuck Smith Earl Bennett2016 Steve Spurrier Jon Stinchcomb James Whalen Justin Smith Travelle Wharton Deon Grant Chris Williams2017 Danny Wuerffel Champ Bailey Nate Northington Brad Smith John Abraham Chad Clifton Don Orr2018 Lawrence Wright Hines Ward Rich Brooks Devin West Eric Norwood Phillip Fulmer Zac Stacy
Western DivisionYear Alabama Arkansas Auburn LSU Ole Miss Mississippi State Texas A&M1994 Lee Roy Jordan Lance Alworth Tracy Rocker Jim Taylor Charlie Conerly Johnny Baker -1995 Harry Gilmer Joe Ferguson Tucker Frederickson Dalton Hilliard Barney Poole Jimmy Webb -1996 Billy Neighbors Chuck Dicus Joe Cribbs Billy Cannon Johnny Vaught Hunter Corhern -1997 John Hannah Jim Benton Zeke Smith Charles Alexander John “Kayo” Dottley Steve Freeman -1998 Holt Rast Clyde Scott Pat Sullivan Bert Jones Archie Manning Johnie Cooks -1999 Johnny Musso Bill Montgomery Jackie Burkett Jerry Stovall Charlie Flowers D. D. Lewis -2000 Dwight Stephenson Ronnie Caveness Stacy Danley Roy Winston Robert Khayat Kent Hull -2001 Joe Namath Steve Atwater Mike Kolen Tommy Hodson Ray Poole Rockey Felker -2002 Vaughn Mancha Loyd Phillips Terry Beasley Mike Anderson Ben Williams Harper Davis -2003 Jeremiah Castille Wayne Harris Steve Wallace Wendell Davis Billy Ray Adams Tyrone Keys -2004 Bob Baumhower Fred Marshall Jimmy “Red” Phillips Paul Dietzel Allen Brown Art Davis -2005 Cornelius Bennett Quinn Grovey Ed Dyas Eric Martin Andre Townsend Joe Fortunato -2006 Steve Sloan Cliff Powell Bo Jackson Y. A. Tittle Jake Gibbs Wayne Harris -2007 Ken Stabler Ken Hatfield Ken Rice Tommy Casanova Wesley Walls Billy Jackson -2008 Bart Starr Billy Ray Smith, Jr. Al Del Greco Lance Smith Bobby Ray Franklin Tom Goode -2009 Antonio Langham Gary Anderson Quentin Riggins Michael Brooks Jimmy Lear Billy Stacy -2010 Cornelius Griffin Frank Broyles Gregg Carr Fred Miller Everett Lindsay Eric Moulds -2011 Dennis Homan Leotis Harris Buddy McClinton George Bevan Deuce McAllister Tom Neville -2012 Paul Crane Pat Summerall James C. Owens Kevin Mawae Glynn Griffing Walt Harris John David Crow2013 Marty Lyons Wayne Martin Frank Sanders Kevin Faulk Jeff Herrod Glen Collins Dat Nguyen2014 Bobby Humphrey Jerry Lamb Carnell Williams Doug Moreau Stan Hindman Fred Smoot Jacob Green2015 Woodrow Lowe Madre Hill Takeo Spikes Alan Faneca Ken Lucas Mario Haggan Bubba Bean2016 Chris Samuels Shawn Andrews Jason Campbell Robert Dugas Kris Mangum Randy Thomas Ray Mickens2017 Gene Stallings Dan Hampton Carlos Rogers Glenn Dorsey Terrence Metcalf Floyd Womack Dave Elmendorf2018 Shaun Alexander Darren McFadden Ronnie Brown Ronnie Estay Jim Miller Mardye McDole Pat Thomas

SEC Championship Game Record Book