SEC 3 Descriptive Statistics
30
SEC “ 3 ” Descriptive Statistics
Transcript of SEC 3 Descriptive Statistics

SEC “ 3 ” Descriptive Statistics

(A) MEASURE OF CENTRAL TENDENCY :
• A measure of central tendency is a summary statistic that represents thecenter point or typical value of a dataset. You can think of it as thetendency of data to cluster around a middle value.
• In statistics, the three most common measures of central tendency arethe mean, median, and mode. Each of these measures calculates thelocation of the central point using a different method.
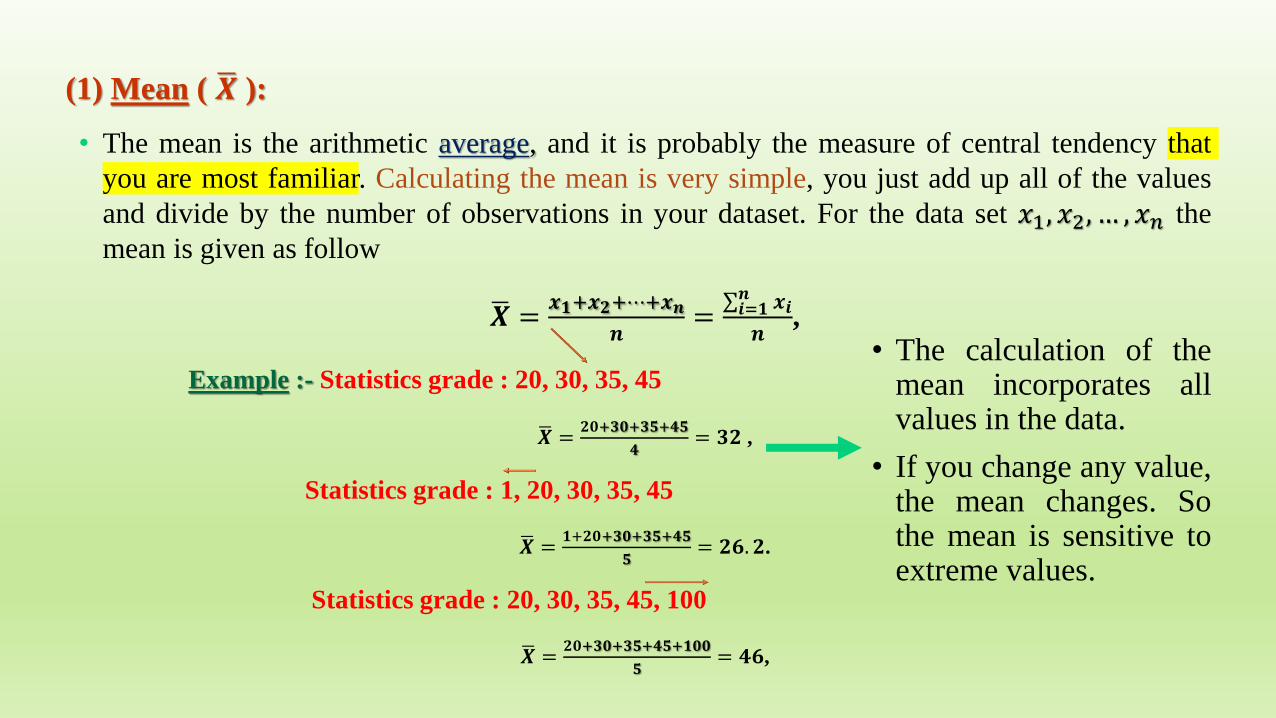
(1) Mean ( ഥ𝑿 ):
• The mean is the arithmetic average, and it is probably the measure of central tendency that
you are most familiar. Calculating the mean is very simple, you just add up all of the values
and divide by the number of observations in your dataset. For the data set 𝑥1, 𝑥2, … , 𝑥𝑛 the
mean is given as follow
ഥ𝑿 =𝒙𝟏+𝒙𝟐+⋯+𝒙𝒏
𝒏=
σ𝒊=𝟏𝒏 𝒙𝒊
𝒏,
Example :- Statistics grade : 20, 30, 35, 45
ഥ𝑿 =𝟐𝟎+𝟑𝟎+𝟑𝟓+𝟒𝟓
𝟒= 𝟑𝟐 ,
Statistics grade : 1, 20, 30, 35, 45
ഥ𝑿 =𝟏+𝟐𝟎+𝟑𝟎+𝟑𝟓+𝟒𝟓
𝟓= 𝟐𝟔. 𝟐.
Statistics grade : 20, 30, 35, 45, 100
ഥ𝑿 =𝟐𝟎+𝟑𝟎+𝟑𝟓+𝟒𝟓+𝟏𝟎𝟎
𝟓= 𝟒𝟔,
• The calculation of themean incorporates allvalues in the data.
• If you change any value,the mean changes. Sothe mean is sensitive toextreme values.

(2) Median :
• The median is the middle value. It is the value that splits the dataset in half. To find
the median :
➢ Order your data from smallest to largest.
➢ The method for locating the median varies slightly depending on whether your
dataset has an even or odd number of values.
Median =
𝒙 𝒏+𝟏
𝟐
, 𝐢𝐟 𝐭𝐡𝐞 𝐬𝐚𝐦𝐩𝐥𝐞 𝐬𝐢𝐳𝐞 𝐢𝐬 𝐚𝐧 𝐨𝐝𝐝 𝐧𝐮𝐦𝐛𝐞𝐫
𝒙 𝒏𝟐+𝒙 𝒏
𝟐+𝟏
𝟐, 𝐢𝐟 𝐭𝐡𝐞 𝐬𝐚𝐦𝐩𝐥𝐞 𝐬𝐢𝐳𝐞 𝐢𝐬 𝐚𝐧 𝐞𝐯𝐞𝐧 𝐧𝐮𝐦𝐛𝐞𝐫
Smallest Largest
10, 20, 30
𝑥2 = 20
10, 20, 30,40𝑥2 + 𝑥3
2
=20 + 30
2= 25
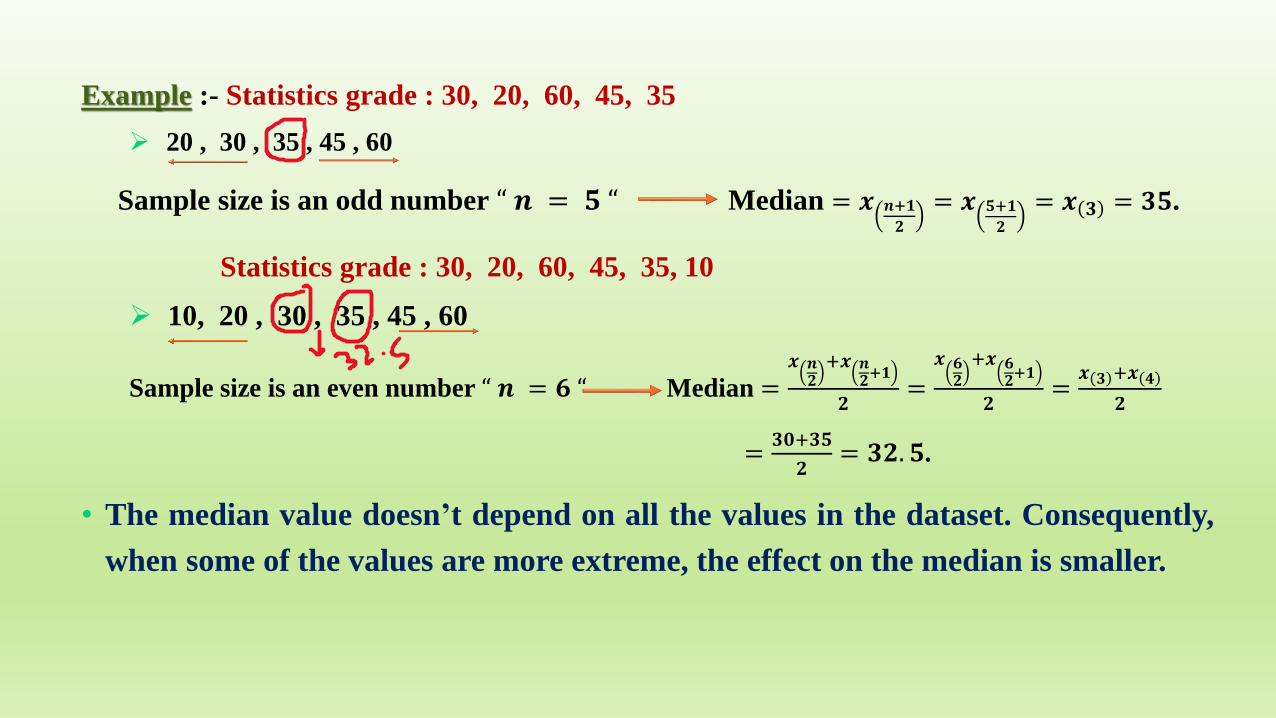
Example :- Statistics grade : 30, 20, 60, 45, 35
➢ 20 , 30 , 35 , 45 , 60
Sample size is an odd number “ 𝒏 = 𝟓 “ Median = 𝒙 𝒏+𝟏
𝟐
= 𝒙 𝟓+𝟏
𝟐
= 𝒙 𝟑 = 𝟑𝟓.
Statistics grade : 30, 20, 60, 45, 35, 10
➢ 10, 20 , 30 , 35 , 45 , 60
Sample size is an even number “ 𝒏 = 𝟔 “ Median =𝒙 𝒏
𝟐+𝒙 𝒏
𝟐+𝟏
𝟐=
𝒙 𝟔𝟐
+𝒙 𝟔𝟐+𝟏
𝟐=
𝒙 𝟑 +𝒙 𝟒
𝟐
=𝟑𝟎+𝟑𝟓
𝟐= 𝟑𝟐. 𝟓.
• The median value doesn’t depend on all the values in the dataset. Consequently,
when some of the values are more extreme, the effect on the median is smaller.
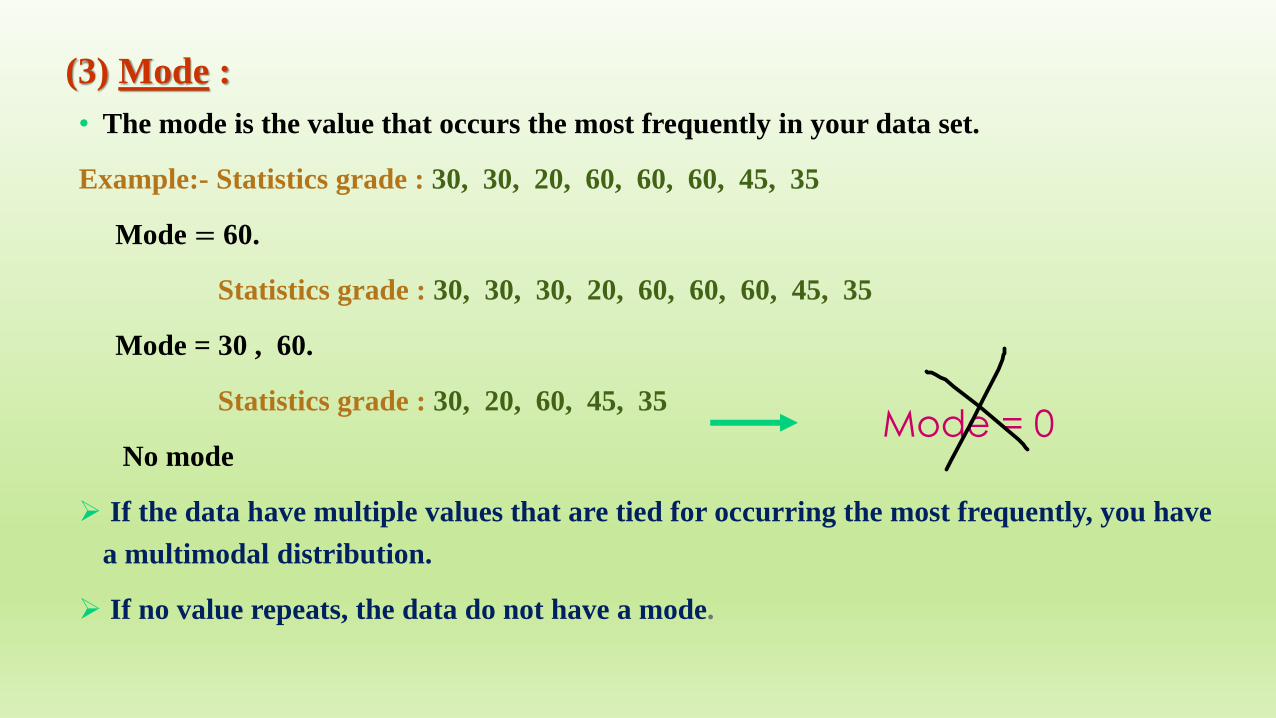
(3) Mode :
• The mode is the value that occurs the most frequently in your data set.
Example:- Statistics grade : 30, 30, 20, 60, 60, 60, 45, 35
Mode = 60.
Statistics grade : 30, 30, 30, 20, 60, 60, 60, 45, 35
Mode = 30 , 60.
Statistics grade : 30, 20, 60, 45, 35
No mode
➢ If the data have multiple values that are tied for occurring the most frequently, you have
a multimodal distribution.
➢ If no value repeats, the data do not have a mode.
Mode = 0

𝑴𝒐𝒅𝒆 < 𝑴𝒆𝒅𝒊𝒂𝒏 < 𝑴𝒆𝒂𝒏

𝑴𝒐𝒅𝒆 > 𝑴𝒆𝒅𝒊𝒂𝒏 > 𝑴𝒆𝒂𝒏

𝑴𝒐𝒅𝒆 = 𝑴𝒆𝒅𝒊𝒂𝒏 = 𝑴𝒆𝒂𝒏
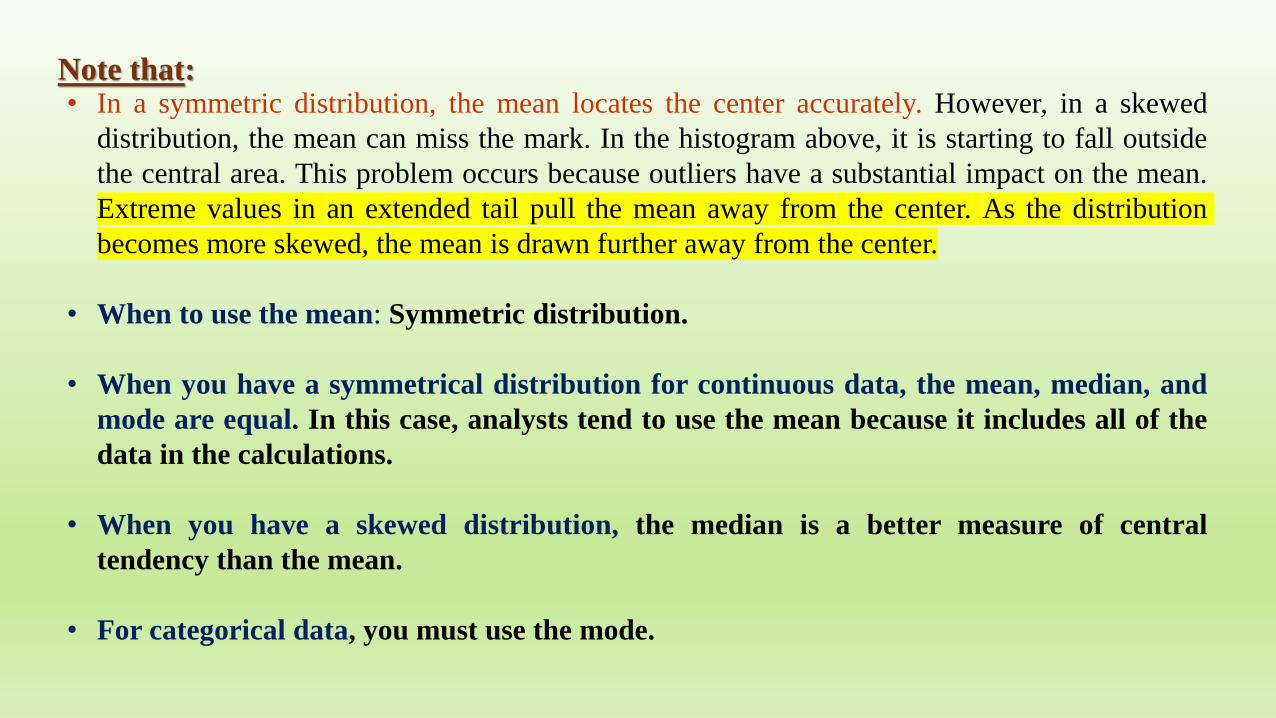
Note that:• In a symmetric distribution, the mean locates the center accurately. However, in a skewed
distribution, the mean can miss the mark. In the histogram above, it is starting to fall outside
the central area. This problem occurs because outliers have a substantial impact on the mean.
Extreme values in an extended tail pull the mean away from the center. As the distribution
becomes more skewed, the mean is drawn further away from the center.
• When to use the mean: Symmetric distribution.
• When you have a symmetrical distribution for continuous data, the mean, median, and
mode are equal. In this case, analysts tend to use the mean because it includes all of the
data in the calculations.
• When you have a skewed distribution, the median is a better measure of central
tendency than the mean.
• For categorical data, you must use the mode.

SHEET (2)
9. The lengths of time, in minutes, that 10 patients waited in a doctor's office beforereceiving treatment were recorded as follows: 5, 11, 9, 5, 10, 15, 6, 10, 5, and 10.Treating the data as a random sample, find (a) the mean; (b) the median; (c) the mode.
Answer
(a) Mean =𝟓+𝟏𝟏+𝟗+⋯+𝟏𝟎
𝟏𝟎= 𝟖. 𝟔
(b) 5 5 5 6 9 10 10 10 11 15
𝒏 = 𝟏𝟎 ” even ”
Median =𝒙𝟓+𝒙𝟔
𝟐=
𝟗+𝟏𝟎
𝟐= 𝟗. 𝟓
(c) Mode = 5 , 10.
Sheet (2): 8, 10.

(B) MEASURE OF DISPERSION :
• The measures of central tendency are not adequate to describe data.Two data sets can have the same mean, but they can be entirelydifferent. Thus to describe data, one needs to know the extent ofvariability. This is given by the measures of dispersion.
• In statistics, dispersion (also called variability, scatter, or spread) isthe extent to which a distribution is stretched or squeezed.
• The three most common measures of dispersion arethe Range, interquartile range, and (variance , standard deviation).

(1) Range ( R ):
• The range is the difference between the largest and the smallest observation in
the data.
Range ‘ R ‘ = largest value – smallest value
• Advantage : Is that it is easy to calculate.
• Disadvantages : It is very sensitive to outliers and does not use all the
observations in a data set.
Example :- Statistics grade ( A ) : 20, 30, 35, 45
Statistics grade ( B ) : 1, 30, 35, 45
Statistics grade ( C ) : 20, 30, 35, 100
Who had the greater spread of marks?
𝒄 has a great spread of marks, because 𝑅𝐶 > 𝑅𝐵 > 𝑅𝐴
𝑅𝐴 = 45 − 20 = 25
𝑅𝐵 = 45 − 1 = 44
𝑅𝐶 = 100 − 20 = 80

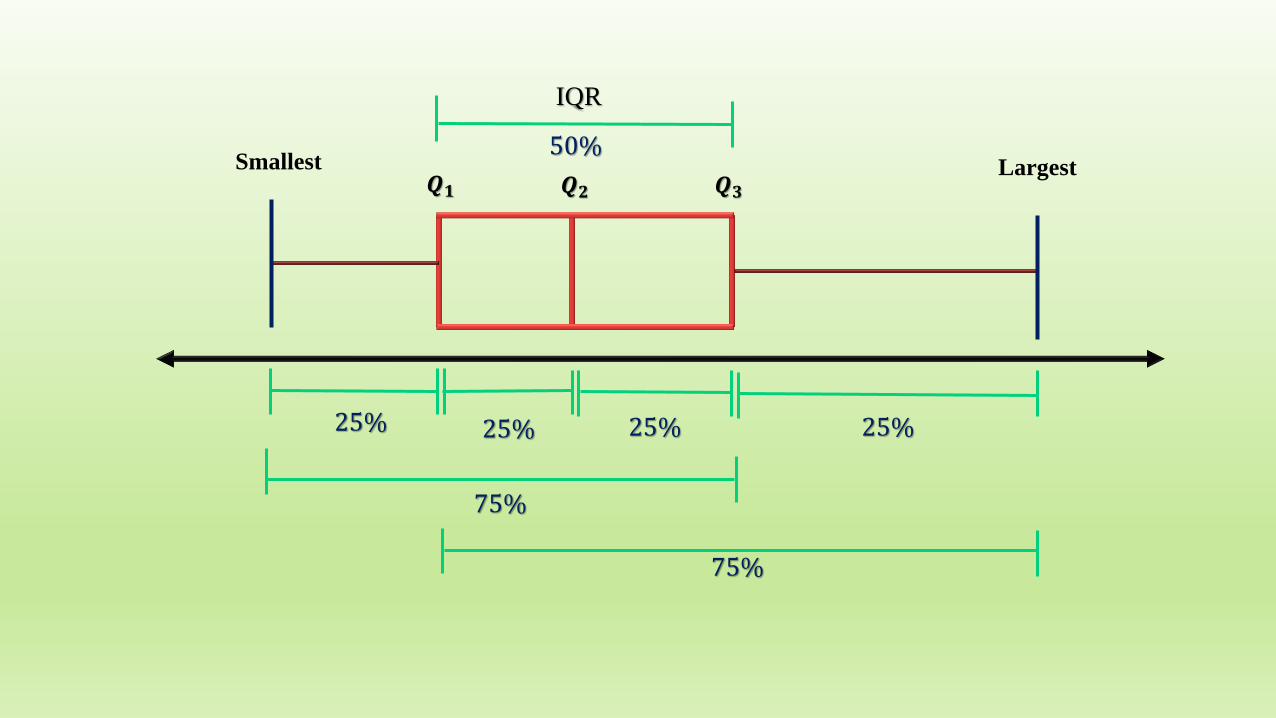
(2) Interquartile Range ( IQR ):
• The interquartile range describes the middle 50% of observations.
• If the interquartile range is large it means that the middle 50% of observations are
spaced wide apart.
• Advantage : Is that it is not affected by extreme values.
• Disadvantages : It does not use all the observations in a data set.
❑ To get the value of the interquartile range, follow these steps:
➢ put the data in order “ from smallest to largest”
➢ Find the median of all data : 𝑸𝟐
➢ Find the median of the data before 𝑸𝟐: 𝑸𝟏
➢ Find the median of the data after 𝑸𝟐: 𝑸𝟑
➢ IQR = 𝑸𝟑- 𝑸𝟏
Smallest Largest𝑸𝟐
𝟓𝟎% 𝟓𝟎%
𝑸𝟏
25% 25%
𝑸𝟑
25% 25%
IQR
the middle 𝟓𝟎%

• Example (1) :- Statistics grade : 60, 35, 25, 45, 30, 37, 45, 10
(1) 10 25 30 35 37 45 45 60
(2) n = 8 “ even 𝑸𝟐 =𝒙𝟒+𝒙𝟓
𝟐=
𝟑𝟓+𝟑𝟕
𝟐= 𝟑𝟔
(3) 10 25 30 35
𝑸𝟏 =𝟐𝟓+𝟑𝟎
𝟐= 𝟐𝟕. 𝟓
(4) 37 45 45 60
𝑸𝟑 =𝟒𝟓+𝟒𝟓
𝟐= 𝟒𝟓
(5) IQR = 𝑸𝟑 - 𝑸𝟏 = 45 - 27.5 = 17.5

• Example (2):- Statistics grade : 60, 35, 45, 30, 37, 45, 10
(1) 10 30 35 37 45 45 60
(2) n = 7 “ odd, 𝑸𝟐 = 𝒙 𝒏+𝟏
𝟐
= 𝒙 𝟖
𝟐
= 𝒙 𝟒 = 𝟑𝟕
(3) 10 30 35
𝑸𝟏 = 𝟑𝟎
(4) 45 45 60
𝑸𝟑 = 𝟒𝟓
(5) IQR = 𝑸𝟑 −𝑸𝟏= 45 - 30 = 15
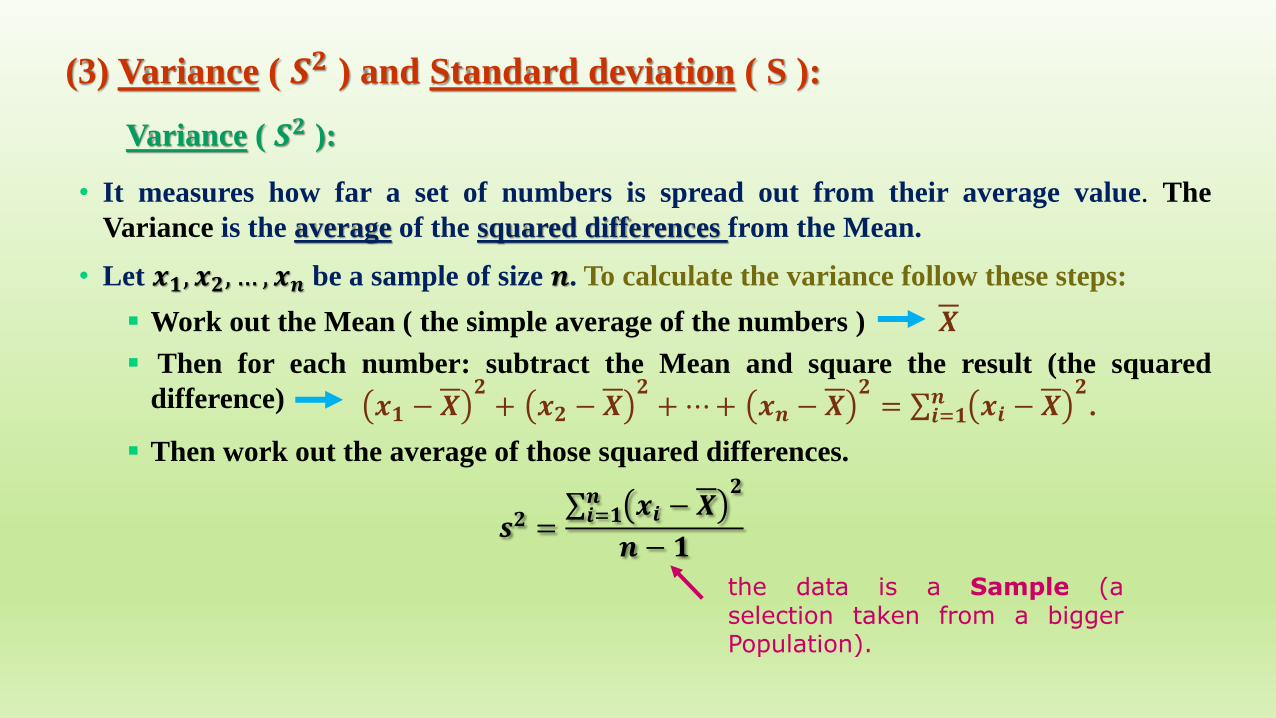
(3) Variance ( 𝑺𝟐 ) and Standard deviation ( S ):
Variance ( 𝑺𝟐 ):
• It measures how far a set of numbers is spread out from their average value. The
Variance is the average of the squared differences from the Mean.
• Let 𝒙𝟏, 𝒙𝟐, … , 𝒙𝒏 be a sample of size 𝒏. To calculate the variance follow these steps:
▪ Work out the Mean ( the simple average of the numbers ) 𝑿
▪ Then for each number: subtract the Mean and square the result (the squared
difference)
▪ Then work out the average of those squared differences.
𝒔𝟐 =σ𝒊=𝟏𝒏 𝒙𝒊 − 𝑿
𝟐
𝒏 − 𝟏
𝒙𝟏 − 𝑿𝟐+ 𝒙𝟐 − 𝑿
𝟐+⋯+ 𝒙𝒏 − 𝑿
𝟐= σ𝒊=𝟏
𝒏 𝒙𝒊 − 𝑿𝟐.
the data is a Sample (aselection taken from a biggerPopulation).

Standard deviation ( 𝑺𝟐 ):
• The Standard Deviation is a measure of how spread out numbers. It is a measure of how
far typical value tends to be from the mean.
• It is the square root of the Variance 𝑺 = 𝑺𝟐.
Example : 9, 2, 5, 4, 12, 7.
Find the Standard Deviation?
❑ 𝒏 = 𝟔.
❑ 𝑿 =σ𝒊=𝟏𝟔 𝒙𝒊
𝟔=
𝟗+𝟐+⋯+𝟕
𝟔= 𝟔. 𝟓
❑ σ𝒊=𝟏𝟔 𝒙𝒊 − 𝑿
𝟐= 𝟗 − 𝟔. 𝟓 𝟐 + 𝟐 − 𝟔. 𝟓 𝟐 +⋯+ 𝟕 − 𝟔. 𝟓 𝟐 = 𝟔𝟓. 𝟓
❑ 𝑺𝟐 =σ𝒊=𝟏𝟔 𝒙𝒊−𝑿
𝟐
𝟔−𝟏=
𝟔𝟓.𝟓
𝟓= 𝟏𝟑. 𝟏
❑ 𝑺 = 𝑺𝟐 = 𝟏𝟑. 𝟏 = 𝟑. 𝟔𝟏𝟗

SHEET (2)
11. The following measurements were recorded for the drying time, in hours, of a certain
brand of latex paint.
Answer
(a) Sample Mean 𝑿 =σ𝒊=𝟏𝟏𝟓 𝒙𝒊
𝟏𝟓=
𝟑.𝟒+𝟐.𝟓+⋯+𝟒.𝟖
𝟏𝟓= 𝟑. 𝟕𝟖𝟕
(b) 2.5 2.8 2.8 2.9 3.0 3.3 3.4 3.6 3.7 4.0 4.4 4.8 4.8 5.2 5.6n : odd Median = 𝒙 𝒏+𝟏
𝟐
= 𝒙 𝟏𝟔
𝟐
= 𝒙 𝟖 = 𝟑. 𝟔
(c) σ𝒊=𝟏𝟏𝟓 𝒙𝒊 − 𝑿
𝟐= 𝟑. 𝟒 − 𝟑. 𝟕𝟖𝟕 𝟐 +⋯+ 𝟒. 𝟖 − 𝟑. 𝟕𝟖𝟕 𝟐 = 𝟏𝟑. 𝟏𝟗𝟕𝟑𝟑
𝑺𝟐 =σ𝒊=𝟏𝟏𝟓 𝒙𝒊−𝑿
𝟐
𝟏𝟓−𝟏=
𝟏𝟑.𝟏𝟗𝟕𝟑𝟑
𝟏𝟒= 𝟎. 𝟗𝟒𝟑 𝑺 = 𝑺𝟐 = 𝟎. 𝟗𝟒𝟑 = 𝟎. 𝟗𝟕𝟏
3.4 2.5 4.8 2.9 3.6
2.8 3.3 5.6 3.7 2.8
4.4 4.0 5.2 3.0 4.8
(a)Calculate the sample mean for these data.
(b) Calculate the sample median.
(c) Compute the sample variance and
sample standard deviation.
𝑛 = 5 × 3 = 15

BOX PLOT
• A boxplot, also called a box and whisker plot, is a way to show thespread and skewness of a data set.
• Steps:
➢put the data in order “ from smallest to largest”
➢ Find the median of all data : 𝑸𝟐 “ Median“
➢ Find the median of the data before 𝑸𝟐: 𝑸𝟏 “ Lower Quartile “
➢ Find the median of the data after 𝑸𝟐: 𝑸𝟑 “ upper Quartile “
𝑸𝟏 𝑸𝟐 𝑸𝟑Smallest Largest
𝑸𝟏 𝑸𝟐 𝑸𝟑
Smallest Largest
IQR
50%
25% 25% 25% 25%
75%
75%
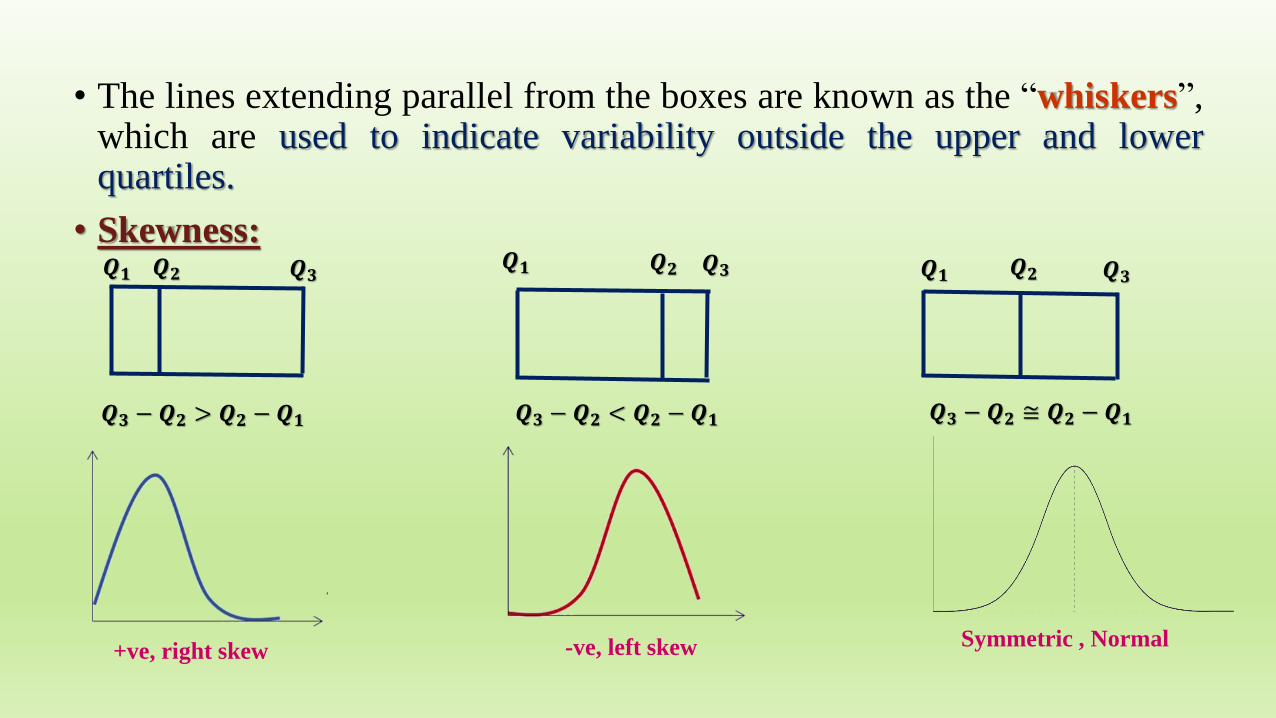
• The lines extending parallel from the boxes are known as the “whiskers”,which are used to indicate variability outside the upper and lowerquartiles.
• Skewness:𝑸𝟏 𝑸𝟐 𝑸𝟑
𝑸𝟏 𝑸𝟐 𝑸𝟑 𝑸𝟏 𝑸𝟐 𝑸𝟑
𝑸𝟑 − 𝑸𝟐 > 𝑸𝟐 −𝑸𝟏 𝑸𝟑 − 𝑸𝟐 < 𝑸𝟐 −𝑸𝟏 𝑸𝟑 − 𝑸𝟐 ≅ 𝑸𝟐 −𝑸𝟏
+ve, right skew -ve, left skew Symmetric , Normal

Outliers:
• Outliers are data points that are far from other data points. In other words,
they’re unusual values in a dataset.
• Calculating the Outlier Fences Using the Interquartile Range :
➢ any value > 𝑸𝟑 + 𝟏. 𝟓 ∗ 𝑰𝑸𝑹
➢ any value < 𝑸𝟏 − 𝟏. 𝟓 ∗ 𝑰𝑸𝑹
𝑸𝟏 𝑸𝟐 𝑸𝟑
Smallest Largest
IQR 1.5*IQR1.5*IQR 𝑸𝟑 +1.5*IQR𝑸𝟏 −1.5*IQR

SHEET (2)
2. Draw a box plot for the following set of data.
4.7, 3.8, 3.9, 3.9, 4.6, 4.5, 5
Answer
• Organize the data from the smallest to largest:
3.8 3.9 3.9 4.5 4.6 4.7 5
• Smallest = 𝟑. 𝟖 , Largest = 𝟓
• 𝑸𝟐 = 𝟒. 𝟓
• 𝑸𝟏 = 𝟑. 𝟗
• 𝑸𝟑 = 𝟒. 𝟕

SHEET (2)
6. For the following list of numbers, draw a box and whisker plot showing outliersvalues:
-6, 4.5, 5.5, 6.5, 8.5, 10, 12, 30
Answer
• Smallest = −𝟔 , Largest = 𝟑𝟎
-6 4.5 5.5 6.5 8.5 10 12 30
• 𝑸𝟐 =𝟔.𝟓+𝟖.𝟓
𝟐= 𝟕. 𝟓
• 𝑸𝟏 =𝟒.𝟓+𝟓.𝟓
𝟐= 𝟓
• 𝑸𝟑 =𝟏𝟎+𝟏𝟐
𝟐= 𝟏𝟏
𝟕. 𝟓

• Outliers:
➢ 𝑰𝑸𝑹 = 𝑸𝟑 −𝑸𝟏 = 𝟏𝟏 − 𝟓 = 𝟔
➢𝟏. 𝟓 ∗ 𝑰𝑸𝑹 = 𝟏. 𝟓 ∗ 𝟔 = 𝟗
➢any value > 𝑸𝟑 + 𝟏. 𝟓 ∗ 𝑰𝑸𝑹
> 𝟏𝟏+ 𝟗
> 𝟐𝟎 30
➢any value < 𝑸𝟏 − 𝟏. 𝟓 ∗ 𝑰𝑸𝑹
< 𝟓 − 𝟗
< −𝟒 - 6
Outliers = 30, -6
Sheet (2): 1, 3, 5, 7.
SHEET (2)
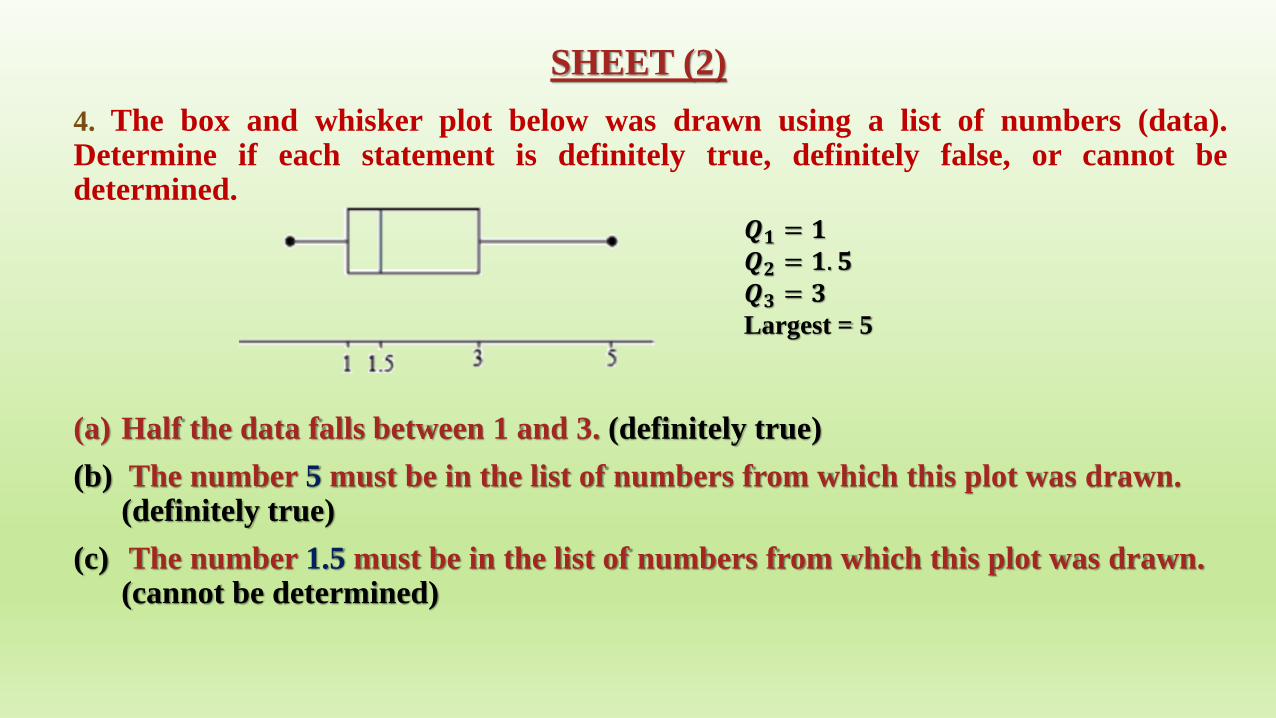
4. The box and whisker plot below was drawn using a list of numbers (data).Determine if each statement is definitely true, definitely false, or cannot bedetermined.
(a) Half the data falls between 1 and 3. (definitely true)
(b) The number 5 must be in the list of numbers from which this plot was drawn. (definitely true)
(c) The number 1.5 must be in the list of numbers from which this plot was drawn. (cannot be determined)
𝑸𝟏 = 𝟏𝑸𝟐 = 𝟏. 𝟓𝑸𝟑 = 𝟑Largest = 5

SHEET (2)
Which must be in the list of numbers from which this box and whisker plot wasdrawn?
(a) 10
(b) 40
(c) 50
(d) 55
(e) 65
𝑸𝟏 = 𝟒𝟎𝑸𝟑 = 𝟓𝟎Smallest = 10
Largest = 55
SHEET (2)
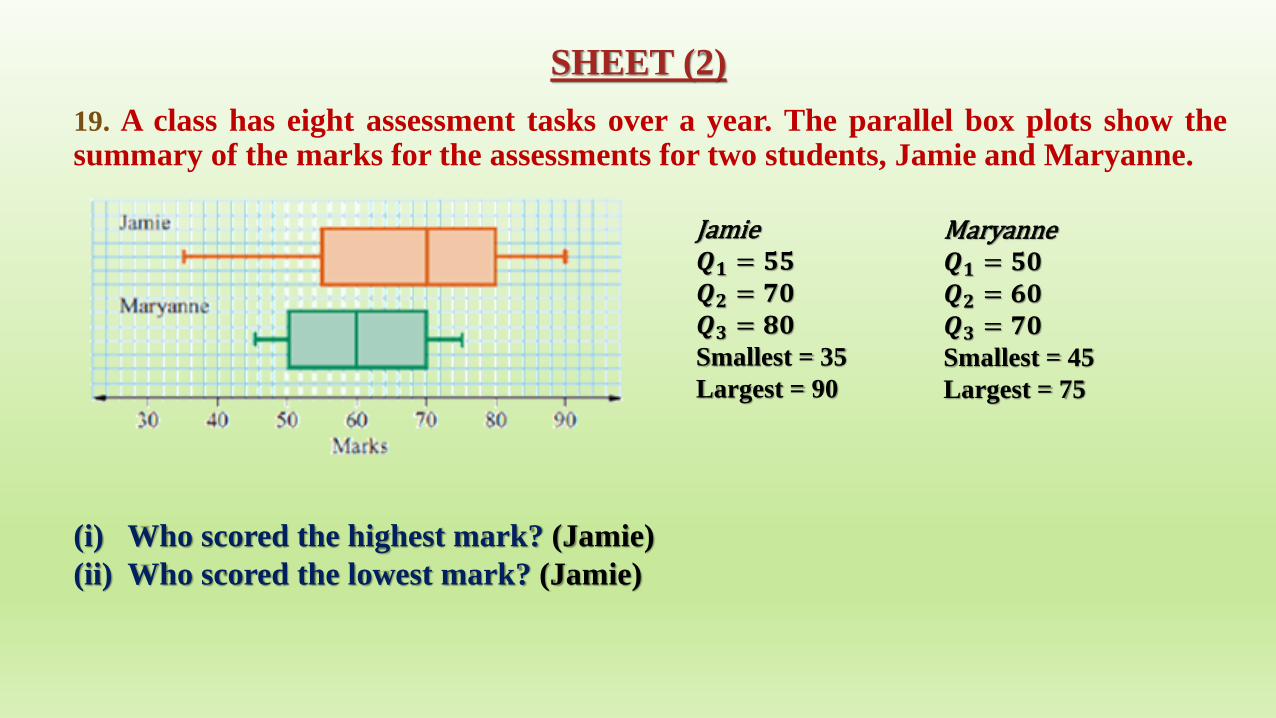
19. A class has eight assessment tasks over a year. The parallel box plots show thesummary of the marks for the assessments for two students, Jamie and Maryanne.
Jamie𝑸𝟏 = 𝟓𝟓𝑸𝟐 = 𝟕𝟎𝑸𝟑 = 𝟖𝟎Smallest = 35
Largest = 90
Maryanne𝑸𝟏 = 𝟓𝟎𝑸𝟐 = 𝟔𝟎𝑸𝟑 = 𝟕𝟎Smallest = 45
Largest = 75
(i) Who scored the highest mark? (Jamie)
(ii) Who scored the lowest mark? (Jamie)

(iii) What was the range of marks for each student?
𝑹Jamie = 𝟗𝟎 − 𝟑𝟓 = 𝟓𝟓
𝑹𝑀𝑎𝑟𝑦𝑎𝑛𝑛𝑒 = 𝟕𝟓 − 𝟒𝟓 = 𝟑𝟎
(iv) Who had the greater spread of marks?
𝑹Jamie > 𝑹𝑀𝑎𝑟𝑦𝑎𝑛𝑛𝑒(Jamie)
(v) What was the interquartile range for each student?
𝑰𝑸𝑹Jamie = 𝟖𝟎 − 𝟓𝟓 = 𝟐𝟓
𝑰𝑸𝑹𝑀𝑎𝑟𝑦𝑎𝑛𝑛𝑒 = 𝟕𝟎 − 𝟓𝟎 = 𝟐𝟎