SEC 20-IS 2013 RFM - Definitive 20-IS... · attached the Corporation’s Definitive ... Upon...
178
30 May 2013 DISCLOSURE DEPARTMENT The Philippine Stock Exchange, Inc. 4/F PSE Centre, Exchange Road, Ortigas Center, Pasig City Attention : JANET A. ENCARNACION HEAD, Disclosure Department Re : Definitive SEC 20-IS 2013 Annual Stockholders’ Meeting ------------------------------------------------------------------------- Dear Ms. Encarnacion, In compliance with Section 20 of the Securities Regulation Code, please find attached the Corporation’s Definitive Information Statement (SEC Form 20-IS) for the 2013 Annual Stockholders’ Meeting of the Corporation, a copy of which was submitted with the Securities & Exchange Commission. Thank you. Very truly yours, ROWEL S. BARBA Corporate Information Officer VP, Head - Corporate Legal & Human Resources Divisions RFM CORPORATION RFM Corporate Center, Pioneer corner Sheridan Streets, Mandaluyong City 1550, Metro Manila, Philippines Telephone: (63-2) 631-8101 Facsimile: (63-2) 632-0839 Website: www.rfmfoods.com
Transcript of SEC 20-IS 2013 RFM - Definitive 20-IS... · attached the Corporation’s Definitive ... Upon...
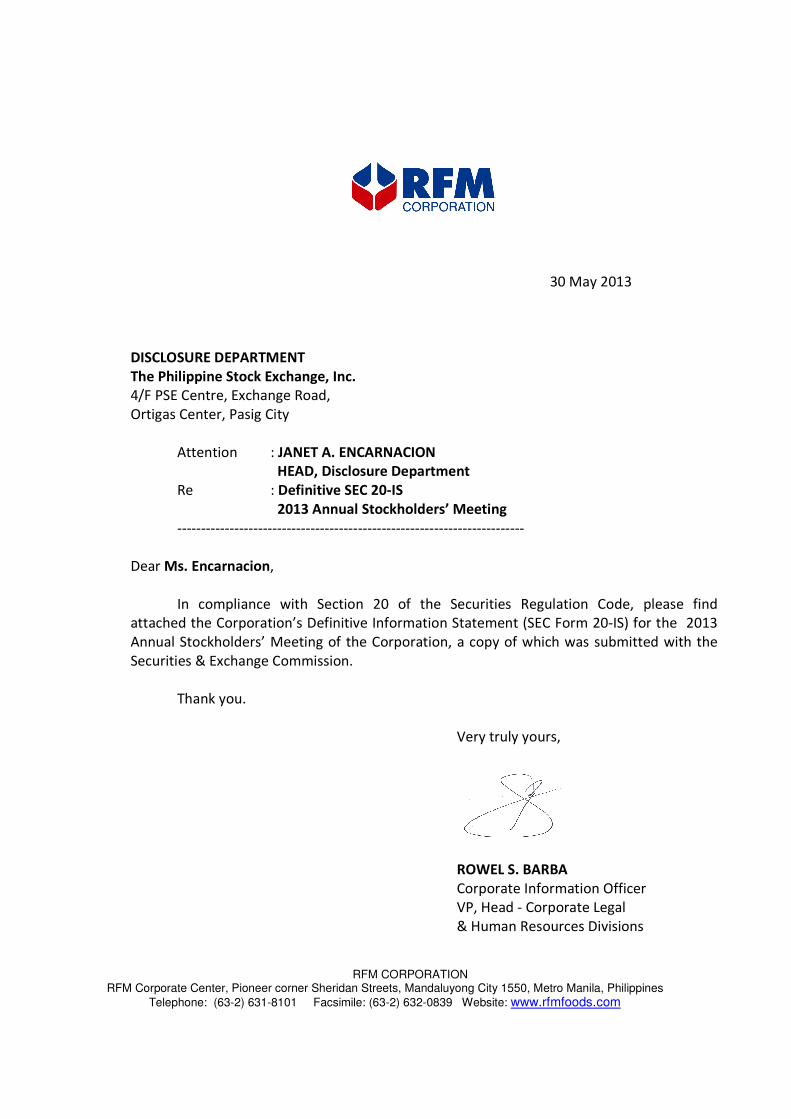
30 May 2013
DISCLOSURE DEPARTMENT
The Philippine Stock Exchange, Inc.
4/F PSE Centre, Exchange Road,
Ortigas Center, Pasig City
Attention : JANET A. ENCARNACION
HEAD, Disclosure Department
Re : Definitive SEC 20-IS
2013 Annual Stockholders’ Meeting
-------------------------------------------------------------------------
Dear Ms. Encarnacion,
In compliance with Section 20 of the Securities Regulation Code, please find
attached the Corporation’s Definitive Information Statement (SEC Form 20-IS) for the 2013
Annual Stockholders’ Meeting of the Corporation, a copy of which was submitted with the
Securities & Exchange Commission.
Thank you.
Very truly yours,
ROWEL S. BARBA
Corporate Information Officer
VP, Head - Corporate Legal
& Human Resources Divisions
RFM CORPORATION
RFM Corporate Center, Pioneer corner Sheridan Streets, Mandaluyong City 1550, Metro Manila, Philippines
Telephone: (63-2) 631-8101 Facsimile: (63-2) 632-0839 Website: www.rfmfoods.com
2
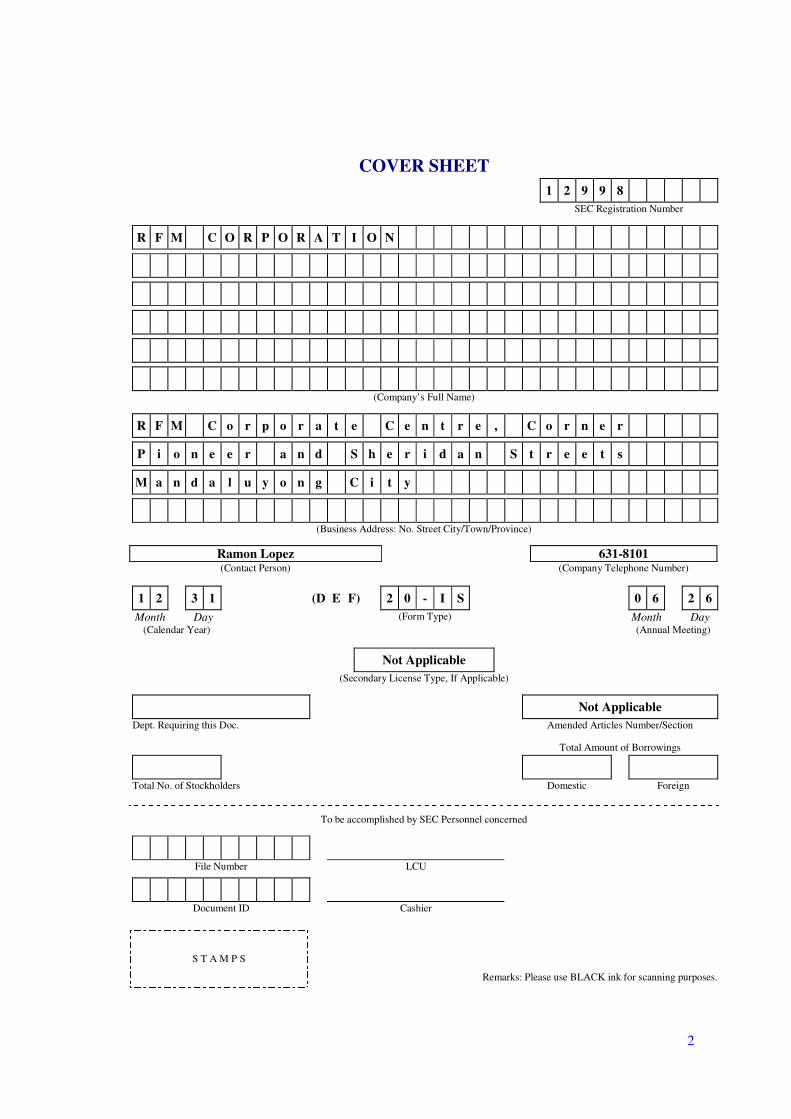
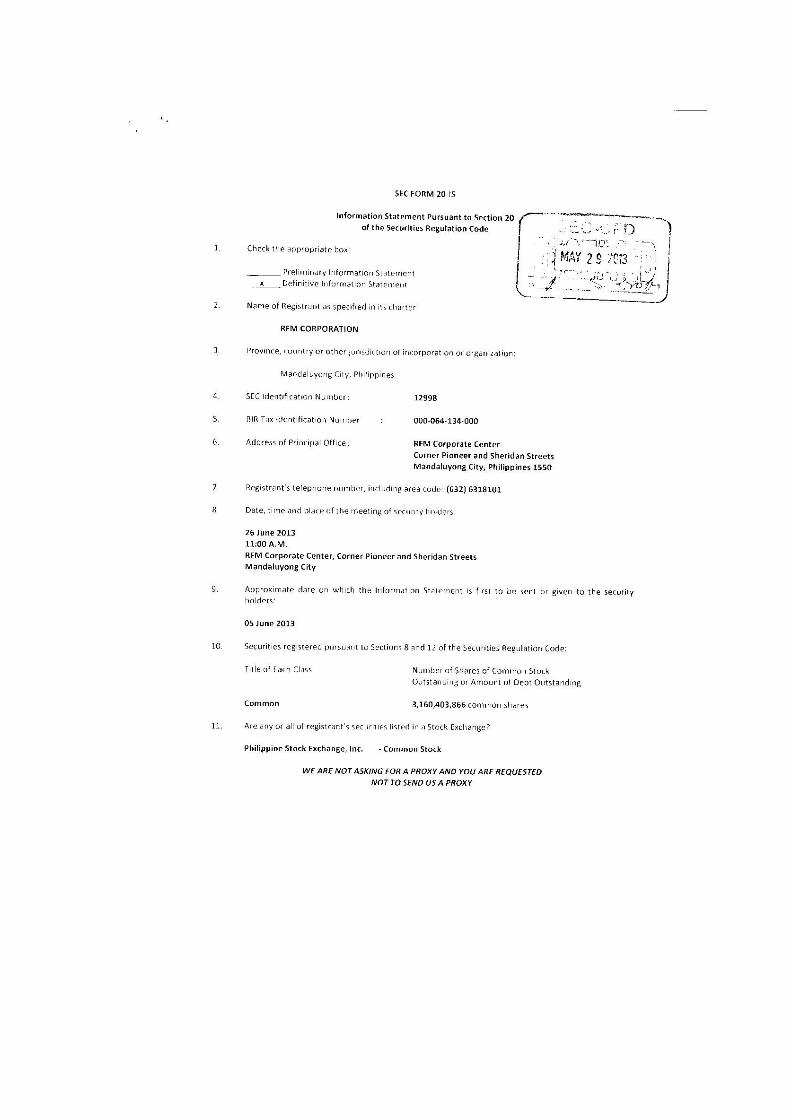
COVER SHEET
1 2 9 9 8
SEC Registration Number
R F M C O R P O R A T I O N
(Company’s Full Name)
R F M C o r p o r a t e C e n t r e , C o r n e r
P i o n e e r a n d S h e r i d a n S t r e e t s
M a n d a l u y o n g C i t y
(Business Address: No. Street City/Town/Province)
Ramon Lopez 631-8101 (Contact Person) (Company Telephone Number)
1 2 3 1 (D E F) 2 0 - I S 0 6 2 6
Month Day (Form Type) Month Day (Calendar Year) (Annual Meeting)
Not Applicable
(Secondary License Type, If Applicable)
Not Applicable
Dept. Requiring this Doc. Amended Articles Number/Section
Total Amount of Borrowings
Total No. of Stockholders Domestic Foreign
To be accomplished by SEC Personnel concerned
File Number LCU
Document ID Cashier
S T A M P S
Remarks: Please use BLACK ink for scanning purposes.

N O T I C E O F A N N U A L S T O C K H O L D E R S ’ M E E T I N G
NOTICE IS HEREBY GIVEN that the Annual Meeting of the Stockholders of RFM
CORPORATION will be held at the RFM Corporate Center, Pioneer cor. Sheridan Sts.,
Mandaluyong City 1550 on Wednesday, 26 June 2013 at 11:00 A.M. with the following AGENDA:
I. Call to Order
II. Certification of Notice and Quorum
III. Approval of the Minutes of the Annual Stockholders’ Meeting held on 27 June 2012
IV. President’s Report for 2012 and Audited Financial Statements ending December 31,
2012
V. Ratification of the acts of Management and Board of Directors
VI. Election of Directors for 2013
VII. Appointment of External Auditor
VIII. Other matters
IX. Adjournment
Stockholders of record as of 29 May 2013 shall be entitled to vote at this
meeting. Stockholders are requested to bring this Notice and present valid identification
cards with picture upon registration for verification purpose. If a stockholder cannot
personally attend the meeting, he may appoint a proxy to represent him by
accomplishing a Proxy form and by submitting the same with the Office of the Corporate
Secretary at the above address before the date of the meeting.
The stock and transfer books of the Corporation will not be closed.
Given this 22nd of May 2013, Mandaluyong City.
ATTY. ROWEL S. BARBA
Corporate Secretary
A. GENERAL INFORMATION
Item 1. Date, Time and Place of Meeting of Security Holders
(a) Date of Meeting: 26 June 2013
Time of Meeting: 11:00 A.M.
Place of Meeting: RFM Corporate Center
Corner Pioneer and Sheridan Streets
Mandaluyong City
Mailing Address: RFM Corporate Center
Corner Pioneer and Sheridan Streets
Mandaluyong City, Philippines 1550
(b) Approximate Date of Sending Information
Statement to Security Holders: 05 June 2013
Item 2. Dissenters' Right of Appraisal
The appraisal right may be exercised by any stockholder who shall have voted against (1) an
amendment to the Articles of Incorporation that changes or restricts the rights of any stockholder or class of
shares, or authorizes preferences in any respect superior to the outstanding shares of any class, or extends or
shortens the corporate existence; (2) a sale, lease, exchange, transfer, mortgage, pledge or other disposition of
all or substantially all of the corporate property and assets; or (3) a merger and consolidation; by making a
written demand on the Corporation for payment of the fair value of his share(s). The written demand together
with the share certificate/s of the withdrawing stockholder must be received by the Corporation within thirty
(30) calendar days from the date on which the vote was taken. Failure to make the written demand and/or to
surrender the share certificate/s within such period shall be deemed a waiver of the appraisal right.
If within a period of sixty (60) days from the date the corporate action was approved by the
stockholders, the withdrawing stockholder and the Corporation cannot agree on the fair value of the shares, it
shall be determined and appraised by three (3) disinterested persons, one of whom shall be named by the
stockholder, another by the Corporation, and the third by the two thus chosen. The findings of the majority of
the appraisers shall be final, and their award shall be paid by the Corporation within thirty (30) days after such
award is made.
No payment shall be made to any withdrawing stockholder unless the Corporation has unrestricted
retained earnings in its books to cover such payment.
Upon payment by the Corporation of the agreed or awarded price, the stockholders shall forthwith
transfer his shares to the Corporation.
The appraisal right is also available to a dissenting stockholder in case the Corporation decides to
invest its funds in another corporation or business or for any purpose other than the primary purpose as
provided in Section 42 of the Corporation Code.
Item 3. Interest of Certain Persons In or Opposition to Matters to be Acted Upon
Each of the incumbent Directors, Nominees for Directors or Officers of the Corporation since the
beginning of the last fiscal year or any associate of said persons do not have any substantial interest, direct or
indirect, by security holdings, or otherwise, in any matter to be acted upon other than election to the office.

There is no Director who has informed the Corporation, either verbally or in writing, of his intention to
oppose any action to be taken by the Corporation at the meeting.
B. CONTROL AND COMPENSATION INFORMATION
Item 4. Voting Securities and Principal Holders Thereof
Stockholders of record of the Corporation as of 29 May 2013 shall be entitled to vote during the
meeting. The outstanding capital stock of the Corporation as of 30 April 2013 is 3,160,403,866 common shares
with a par value of Php1.00 per share, all of which are entitled to vote. For the purpose of voting the shares in
the meeting, one common share is entitled to one vote.
Manner of Voting
Article 11 of the By-laws of the Corporation provides that the stockholders may vote in person or by
proxy.
In accordance with Section 24 of the Corporation Code of the Philippines, each stockholder may vote
in any one of the following manner:
1. He may vote such number of shares for as many persons as there are Directors to be elected;
2. He may cumulate said shares and give one candidate as many votes as the number of Directors to be
elected multiplied by his shares;
3. He may distribute them on the same principle to as many candidates as he may see fit. In any of these
instances, the total number of votes cast by the stockholder should not exceed the number of shares
owned by him as shown in the books of the Corporation multiplied by the total number of Directors to
be elected.
Security Ownership of Certain Record and Beneficial Owners and Management
(1) Security Ownership of Certain Record and Beneficial Owners
Security Ownership of Certain Record and Beneficial Owners as of 30 April 2013 of more than 5% of the
Corporation's Voting Securities
(1) Title of
Class
(2) Name & Address
of Record Owner &
Relationship to
Issuer
(3) Name of
Beneficial Owner &
Relationship to
Record Owner
(4)
Citizenship
(5) No. of
Shares
(6) Percentage
(%)
Common Triple Eight Holdings
Inc.
507 Buendia Avebue,
North Forbes Park,
Makati City
Stockholder
Triple Eight Holdings,
Inc. Filipino 658,561,450 20.837889
Common Horizons Realty, Inc.
11 Kawayan Road
N. Forbes Park,
Makati City
Stockholder
Horizons Realty, Inc. Filipino 635,269,804 20.100906
Common PCD Nominee Corp.
(Filipino)
PCD Participants Filipino 460,692,976 14.577029

G/F MKSE Building
Ayala Avenue, Makati
Stockholder
Common BJS Dev. Corp.
1869 P. Domingo St.
Makati City
Stockholder
BJS Dev. Corp. Filipino 311,210,184 9.847165
Common PCD Nominee Corp.
(Foreign)
G/F MKSE Building
Ayala Avenue, Makati
Stockholder
PCD Participants Filipino 280,241,154 8.867258
Common RPMC Resources, Inc.
(formerly Renaissance
Property Management
Corp.)
FEATI University Bldg.
Carlos Palanca , Sta.
Cruz
Manila
Stockholder
RPMC Resources, Inc. Filipino 201, 982,966 6.391049
List of person or persons acting together to direct the voting or disposition of the shares held by:
I. Horizons Realty, Inc.
1. Jose Ma. A. Concepcion III
2. Ma. Victoria Herminia C. Young
3. Luis Bernardo A. Concepcion
4. John Marie A. Concepcion
5. Ma. Lourdes Celine C. Lebron
6. Ma. Victoria Ana C. Monasterio
7. Mary Elizabeth C.Santos
8. Michelle C. Reyes
II. Triple Eight Holdings Inc.
1. Jose Ma. A. Concepcion III
2. Ma. Victoria Ana A. Concepcion
3. Ma. Luisa O. Concepcion
4. Margarita O. Concepcion
5. Monica O. Concepcion
6. Martha O. Uy
III. PCD Nominee Corporation – The PCD is the depository of RFM common shares which are traded in the
Philippine Stock Exchange. It is a wholly-owned subsidiary of Philippine Central Depository, Inc. and is
the registered owner of the shares in the books of the Corporation's transfer agent, Securities Transfer
Services, Inc. PCD was organized by major institutions actively participating in the Philippine capital
markets to implement an automated book-entry system of handling securities transactions in the
Philippines. The beneficial owners of the shares are PCD's participants, who hold the shares on their
behalf or in behalf of their clients. Where shareholders are called upon to vote on similar matter, the
PCD Nominee Corporation only informs its participant brokers of such event. In turn, participant brokers
get in touch with their clients who are the beneficial owners of shares lodged with the PCD. It is the
beneficial owners who have the voting power. The Corporation is not aware that a participant holds
more than 5% of outstanding common shares of the Corporation.
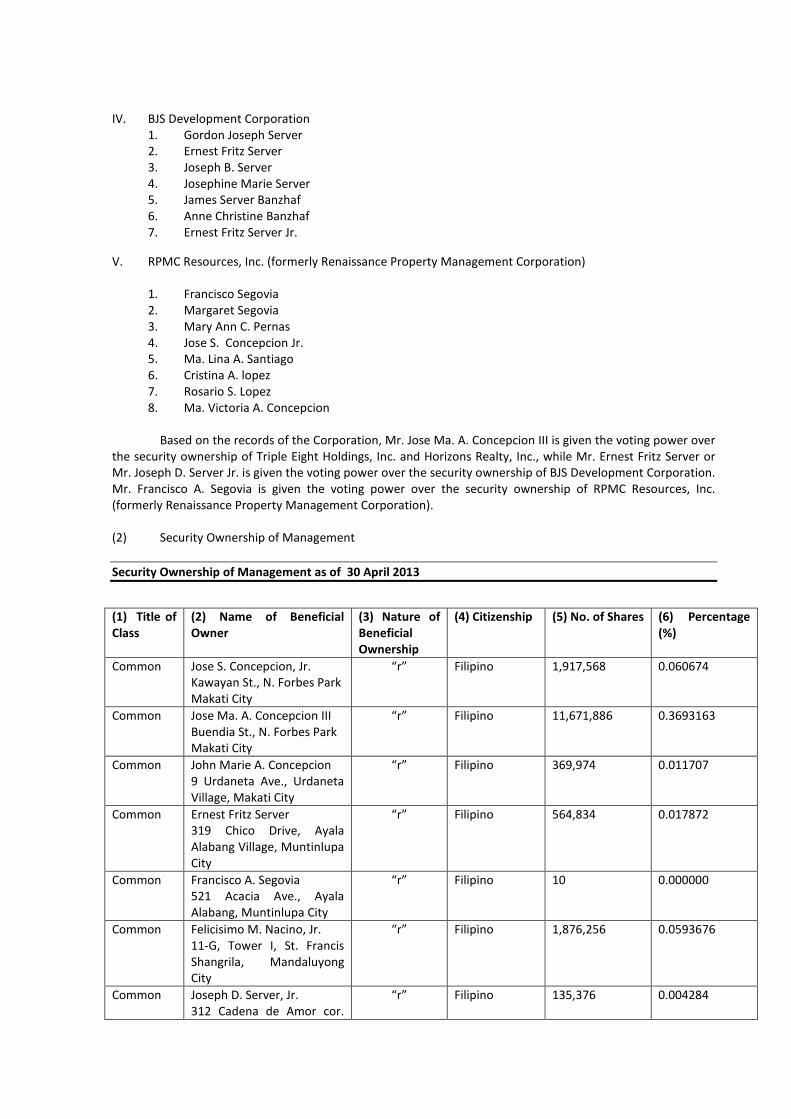
IV. BJS Development Corporation
1. Gordon Joseph Server
2. Ernest Fritz Server
3. Joseph B. Server
4. Josephine Marie Server
5. James Server Banzhaf
6. Anne Christine Banzhaf
7. Ernest Fritz Server Jr.
V. RPMC Resources, Inc. (formerly Renaissance Property Management Corporation)
1. Francisco Segovia
2. Margaret Segovia
3. Mary Ann C. Pernas
4. Jose S. Concepcion Jr.
5. Ma. Lina A. Santiago
6. Cristina A. lopez
7. Rosario S. Lopez
8. Ma. Victoria A. Concepcion
Based on the records of the Corporation, Mr. Jose Ma. A. Concepcion III is given the voting power over
the security ownership of Triple Eight Holdings, Inc. and Horizons Realty, Inc., while Mr. Ernest Fritz Server or
Mr. Joseph D. Server Jr. is given the voting power over the security ownership of BJS Development Corporation.
Mr. Francisco A. Segovia is given the voting power over the security ownership of RPMC Resources, Inc.
(formerly Renaissance Property Management Corporation).
(2) Security Ownership of Management
Security Ownership of Management as of 30 April 2013
(1) Title of
Class
(2) Name of Beneficial
Owner
(3) Nature of
Beneficial
Ownership
(4) Citizenship (5) No. of Shares (6) Percentage
(%)
Common Jose S. Concepcion, Jr.
Kawayan St., N. Forbes Park
Makati City
“r” Filipino 1,917,568 0.060674
Common Jose Ma. A. Concepcion III
Buendia St., N. Forbes Park
Makati City
“r” Filipino 11,671,886 0.3693163
Common John Marie A. Concepcion
9 Urdaneta Ave., Urdaneta
Village, Makati City
“r” Filipino 369,974
0.011707
Common Ernest Fritz Server
319 Chico Drive, Ayala
Alabang Village, Muntinlupa
City
“r” Filipino 564,834 0.017872
Common Francisco A. Segovia
521 Acacia Ave., Ayala
Alabang, Muntinlupa City
“r” Filipino 10 0.000000
Common Felicisimo M. Nacino, Jr.
11-G, Tower I, St. Francis
Shangrila, Mandaluyong
City
“r” Filipino 1,876,256 0.0593676
Common Joseph D. Server, Jr.
312 Cadena de Amor cor.
“r” Filipino 135,376 0.004284
Ilang-Ilang St., Ayala
Alabang Village, Muntinlupa
City
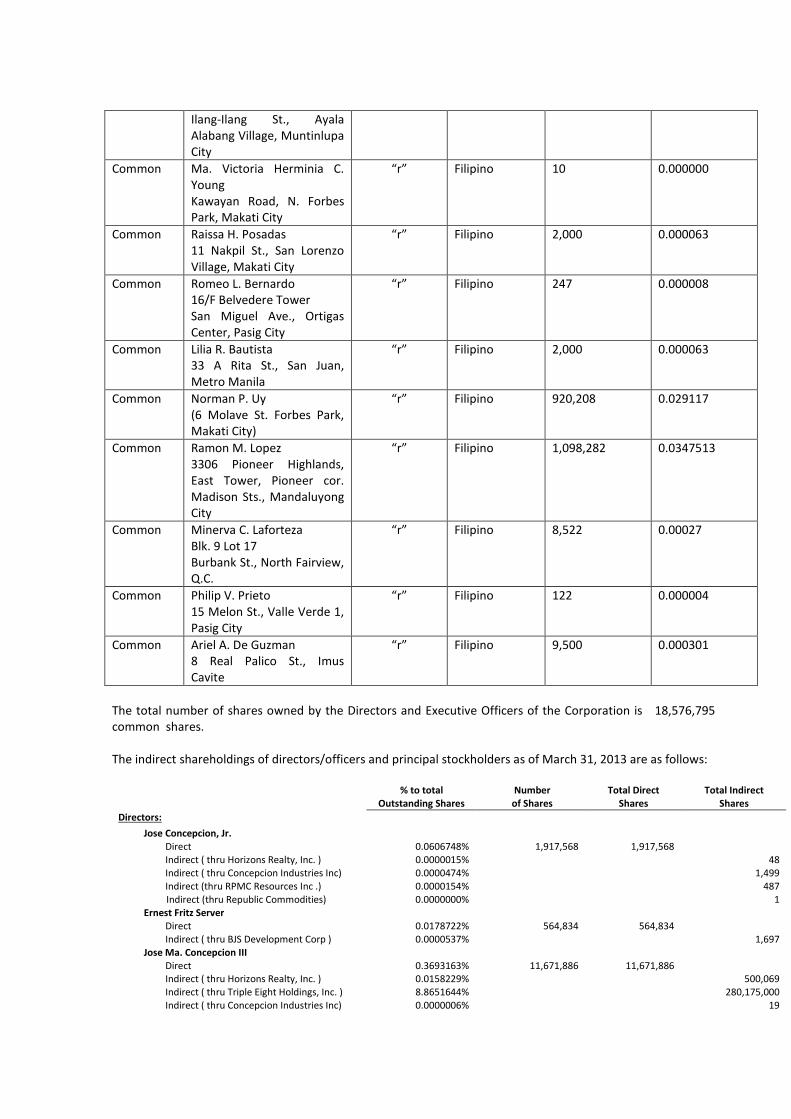
Common Ma. Victoria Herminia C.
Young
Kawayan Road, N. Forbes
Park, Makati City
“r” Filipino 10 0.000000
Common Raissa H. Posadas
11 Nakpil St., San Lorenzo
Village, Makati City
“r” Filipino 2,000 0.000063
Common Romeo L. Bernardo
16/F Belvedere Tower
San Miguel Ave., Ortigas
Center, Pasig City
“r” Filipino 247 0.000008
Common Lilia R. Bautista
33 A Rita St., San Juan,
Metro Manila
“r” Filipino 2,000 0.000063
Common Norman P. Uy
(6 Molave St. Forbes Park,
Makati City)
“r” Filipino 920,208 0.029117
Common Ramon M. Lopez
3306 Pioneer Highlands,
East Tower, Pioneer cor.
Madison Sts., Mandaluyong
City
“r” Filipino 1,098,282 0.0347513
Common Minerva C. Laforteza
Blk. 9 Lot 17
Burbank St., North Fairview,
Q.C.
“r” Filipino 8,522 0.00027
Common Philip V. Prieto
15 Melon St., Valle Verde 1,
Pasig City
“r” Filipino 122 0.000004
Common Ariel A. De Guzman
8 Real Palico St., Imus
Cavite
“r” Filipino 9,500 0.000301
The total number of shares owned by the Directors and Executive Officers of the Corporation is 18,576,795
common shares.
The indirect shareholdings of directors/officers and principal stockholders as of March 31, 2013 are as follows:
% to total Number Total Direct Total Indirect
Outstanding Shares of Shares Shares Shares
Directors:
Jose Concepcion, Jr.
Direct 0.0606748% 1,917,568 1,917,568
Indirect ( thru Horizons Realty, Inc. ) 0.0000015% 48
Indirect ( thru Concepcion Industries Inc) 0.0000474% 1,499
Indirect (thru RPMC Resources Inc .) 0.0000154% 487
Indirect (thru Republic Commodities) 0.0000000% 1
Ernest Fritz Server
Direct 0.0178722% 564,834 564,834
Indirect ( thru BJS Development Corp ) 0.0000537% 1,697
Jose Ma. Concepcion III
Direct 0.3693163% 11,671,886 11,671,886
Indirect ( thru Horizons Realty, Inc. ) 0.0158229% 500,069
Indirect ( thru Triple Eight Holdings, Inc. ) 8.8651644% 280,175,000
Indirect ( thru Concepcion Industries Inc) 0.0000006% 19
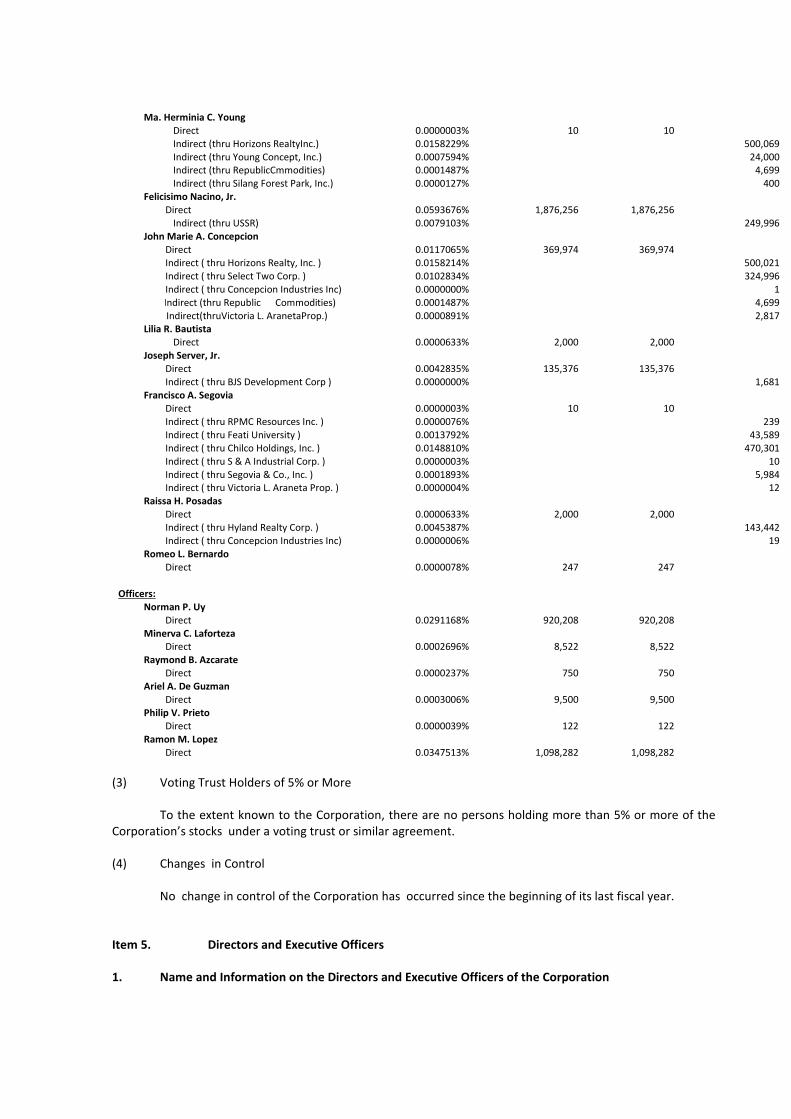
Ma. Herminia C. Young
Direct 0.0000003% 10 10
Indirect (thru Horizons RealtyInc.) 0.0158229% 500,069
Indirect (thru Young Concept, Inc.) 0.0007594% 24,000
Indirect (thru RepublicCmmodities) 0.0001487% 4,699
Indirect (thru Silang Forest Park, Inc.) 0.0000127% 400
Felicisimo Nacino, Jr.
Direct 0.0593676% 1,876,256 1,876,256
Indirect (thru USSR) 0.0079103% 249,996
John Marie A. Concepcion
Direct 0.0117065% 369,974 369,974
Indirect ( thru Horizons Realty, Inc. ) 0.0158214% 500,021
Indirect ( thru Select Two Corp. ) 0.0102834% 324,996
Indirect ( thru Concepcion Industries Inc) 0.0000000% 1
InIndirect (thru Republic Commodities) 0.0001487% 4,699
Indirect(thruVictoria L. AranetaProp.) 0.0000891% 2,817
Lilia R. Bautista
Direct 0.0000633% 2,000 2,000
Joseph Server, Jr.
Direct 0.0042835% 135,376 135,376
Indirect ( thru BJS Development Corp ) 0.0000000% 1,681
Francisco A. Segovia
Direct 0.0000003% 10 10
Indirect ( thru RPMC Resources Inc. ) 0.0000076% 239
Indirect ( thru Feati University ) 0.0013792% 43,589
Indirect ( thru Chilco Holdings, Inc. ) 0.0148810% 470,301
Indirect ( thru S & A Industrial Corp. ) 0.0000003% 10
Indirect ( thru Segovia & Co., Inc. ) 0.0001893% 5,984
Indirect ( thru Victoria L. Araneta Prop. ) 0.0000004% 12
Raissa H. Posadas
Direct 0.0000633% 2,000 2,000
Indirect ( thru Hyland Realty Corp. ) 0.0045387% 143,442
Indirect ( thru Concepcion Industries Inc) 0.0000006% 19
Romeo L. Bernardo
Direct 0.0000078% 247 247
Officers:
Norman P. Uy
Direct 0.0291168% 920,208 920,208
Minerva C. Laforteza
Direct 0.0002696% 8,522 8,522
Raymond B. Azcarate
Direct 0.0000237% 750 750
Ariel A. De Guzman
Direct 0.0003006% 9,500 9,500
Philip V. Prieto
Direct 0.0000039% 122 122
Ramon M. Lopez
Direct 0.0347513% 1,098,282 1,098,282
(3) Voting Trust Holders of 5% or More
To the extent known to the Corporation, there are no persons holding more than 5% or more of the
Corporation’s stocks under a voting trust or similar agreement.
(4) Changes in Control
No change in control of the Corporation has occurred since the beginning of its last fiscal year.
Item 5. Directors and Executive Officers
1. Name and Information on the Directors and Executive Officers of the Corporation

(Please refer to the Management Report hereto attached for the names and information on the
Directors and Executive Officers of the Corporation.)
The Nomination Committee of the Corporation pursuant to its Manual on Corporate Governance
adopted the following criteria for the selection of an independent director:
Qualifications:
1. Holder of at least one (1) share of stock of the Corporation;
2. He shall be at least a college graduate or have sufficient experience in business management
to substitute for such formal education;
3. He shall be at least twenty one (21) years old;
4. He shall have proven to possess integrity and probity;
5. He shall be diligent;
6. He shall have practical understanding of the business of the Corporation;
7. He shall have membership in good standing in relevant industry, business or professional
organizations; and
8. He shall have previous business experience.
Permanent Disqualifications:
1. No person shall qualify or be eligible for nomination or election to the Board of Directors if he
is engaged in any business or activity which competes with or is antagonistic to that of the
Corporation or any of its subsidiaries and affiliates, which disqualification may be waived by a
majority vote of the Board of Directors, upon the recommendation of the Nomination
Committee.
2. Any person finally convicted judicially of an offense involving moral turpitude or fraud,
embezzlement, theft, estafa, counterfeiting, misappropriation, forgery, bribery, false
affirmation, perjury or similar fraudulent acts or transgressions;
3. Any person finally found by the Commission or a court or other administrative body to have
willfully violated, or willfully aided, abetted, counseled, induced or procured the violation of,
any provision of the Securities Regulation Code, the Corporation Code, or any other law
administered by the Commission or Bangko Sentral ng Pilipinas, or any rule, regulation or
order of the Commission or Bangko Sentral ng Pilipinas;
4. Any person judicially declared to be insolvent;
5. Any person finally found guilty by a foreign court or equivalent financial regulatory authority
of acts, violations or misconduct similar to any of the acts, violations or misconduct listed in
the foregoing paragraphs; and
6. Conviction by final judgment of an offense punishable by imprisonment for a period
exceeding six (6) years, or a violation of the Corporation Code, committed within five (5)
years prior to the date of his election or appointment.
Temporary Disqualifications:
Any of the following shall be a ground for the temporary disqualification of a director:
1. Refusal to fully disclose the extent of his business interest as required under the Securities
Regulation Code and its Implementing Rules and Regulations. This disqualification shall be in
effect as long as his refusal persists;
2. Absence or non-participation for whatever reason/s for more than fifty percent (50%) of all
meetings, both regular and special, of the Board of directors during his incumbency, or any
twelve (12) month period during said incumbency unless absence is due to illness, death in
the immediate family or serious accident. This disqualification applies for purposes of the
succeeding election. A director, however, shall not be considered absent if he participates in
the meetings via teleconferences;
3. Dismissal/termination from directorship in another listed corporation the shares of which are
listed on the Exchange, for cause. This disqualification shall be in effect until he has cleared
himself of any involvement in the alleged irregularity;
4. Being under preventive suspension by the Corporation;
5. In the case of independent director,
i. his beneficial equity ownership in the corporation or any of its subsidiaries and
affiliates exceeds two percent (2%) of its subscribed capital stock. The
disqualification shall be lifted if the limit is later complied with;
ii. In the case of independent directors, the additional grounds for temporary
disqualification shall be those provided under Rule 38 of the Amended Implementing
Rules and Regulations of the Securities Regulation Code.
6. Conviction that has not yet become final referred to in the grounds for the disqualification of
directors.
A temporarily disqualified director shall, within sixty (60) business days from such disqualification, take
the appropriate action to remedy or correct the disqualification. If he fails or refuses to do so for
unjustified reasons, the disqualification shall become permanent.
1. Any person finally convicted judicially of an offense involving moral turpitude or fraudulent
act or transgressions;
2. Any person finally found by the Commission or a court or other administrative body to have
willfully violated, or willfully aided, abetted, counseled, induced or procured the violation of,
any provision of the Securities Regulation Code, the Corporation Code, or any other law
administered by the Commission or Bangko Sentral ng Pilipinas, or any rule, regulation or
order of the Commission or Bangko Sentral ng Pilipinas;
3. Any person judicially declared to be insolvent;
4. Any person finally found guilty by a foreign court or equivalent financial regulatory authority
of acts, violations or misconduct similar to any of the acts, violations or misconduct listed in
the foregoing paragraphs; and
5. Conviction by final judgment of an offense punishable by imprisonment for a period
exceeding six (6) years, or a violation of the Corporation Code, committed within five (5)
years prior to the date of his election or appointment.
After the required pre-screening of the qualifications above-stated, the incumbent independent directors Mr.
Romeo L. Bernardo and Ms. Lilia R. Bautista, are again nominated for the same positions. Mr. Bernardo was
first nominated in 2002 by Triple Eight Holdings, Inc., Horizons Realty, Inc., BJS Development Corporation and
Renaissance Property Mgt. Corp., and Ms. Lilia R. Bautista was first nominated in September 2005 by Mr. Jose
S. Concepcion, Jr. Mr. Bernardo is not in any way related to nor does he hold any position in the corporations
that recommended him as independent director, although the said corporations belong to the top 20
stockholders of RFM Corporation. Neither is Ms. Bautista in any way related to Mr. Jose S. Concepcion, Jr.
2. Significant Employees
There are no persons other than the Executive Officers who are expected by the Corporation to make
significant contribution to its business.
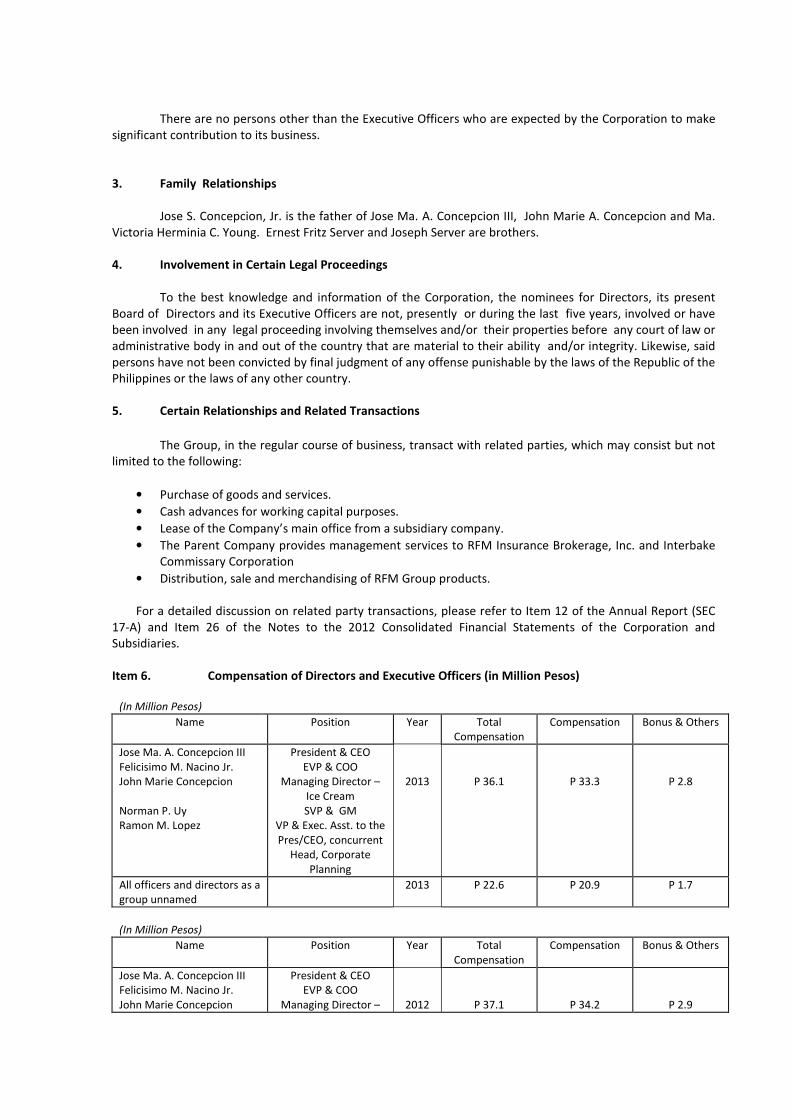
3. Family Relationships
Jose S. Concepcion, Jr. is the father of Jose Ma. A. Concepcion III, John Marie A. Concepcion and Ma.
Victoria Herminia C. Young. Ernest Fritz Server and Joseph Server are brothers.
4. Involvement in Certain Legal Proceedings
To the best knowledge and information of the Corporation, the nominees for Directors, its present
Board of Directors and its Executive Officers are not, presently or during the last five years, involved or have
been involved in any legal proceeding involving themselves and/or their properties before any court of law or
administrative body in and out of the country that are material to their ability and/or integrity. Likewise, said
persons have not been convicted by final judgment of any offense punishable by the laws of the Republic of the
Philippines or the laws of any other country.
5. Certain Relationships and Related Transactions
The Group, in the regular course of business, transact with related parties, which may consist but not
limited to the following:
• Purchase of goods and services.
• Cash advances for working capital purposes.
• Lease of the Company’s main office from a subsidiary company.
• The Parent Company provides management services to RFM Insurance Brokerage, Inc. and Interbake
Commissary Corporation
• Distribution, sale and merchandising of RFM Group products.
For a detailed discussion on related party transactions, please refer to Item 12 of the Annual Report (SEC
17-A) and Item 26 of the Notes to the 2012 Consolidated Financial Statements of the Corporation and
Subsidiaries.
Item 6. Compensation of Directors and Executive Officers (in Million Pesos)
(In Million Pesos)
Name Position Year Total
Compensation
Compensation Bonus & Others
Jose Ma. A. Concepcion III
Felicisimo M. Nacino Jr.
John Marie Concepcion
Norman P. Uy
Ramon M. Lopez
President & CEO
EVP & COO
Managing Director –
Ice Cream
SVP & GM
VP & Exec. Asst. to the
Pres/CEO, concurrent
Head, Corporate
Planning
2013
P 36.1
P 33.3
P 2.8
All officers and directors as a
group unnamed
2013 P 22.6
P 20.9 P 1.7
(In Million Pesos)
Name Position Year Total
Compensation
Compensation Bonus & Others
Jose Ma. A. Concepcion III
Felicisimo M. Nacino Jr.
John Marie Concepcion
President & CEO
EVP & COO
Managing Director –
2012
P 37.1
P 34.2
P 2.9
Norman P. Uy
Raymond B.Azcarate*
Ice Cream
SVP & GM
SVP & CFO
All officers and directors as a
group unnamed
2012 P 22.4
P 20.7 P 1.7
*Raymond B. Azcarate retired from the company effective 31 March 2013.
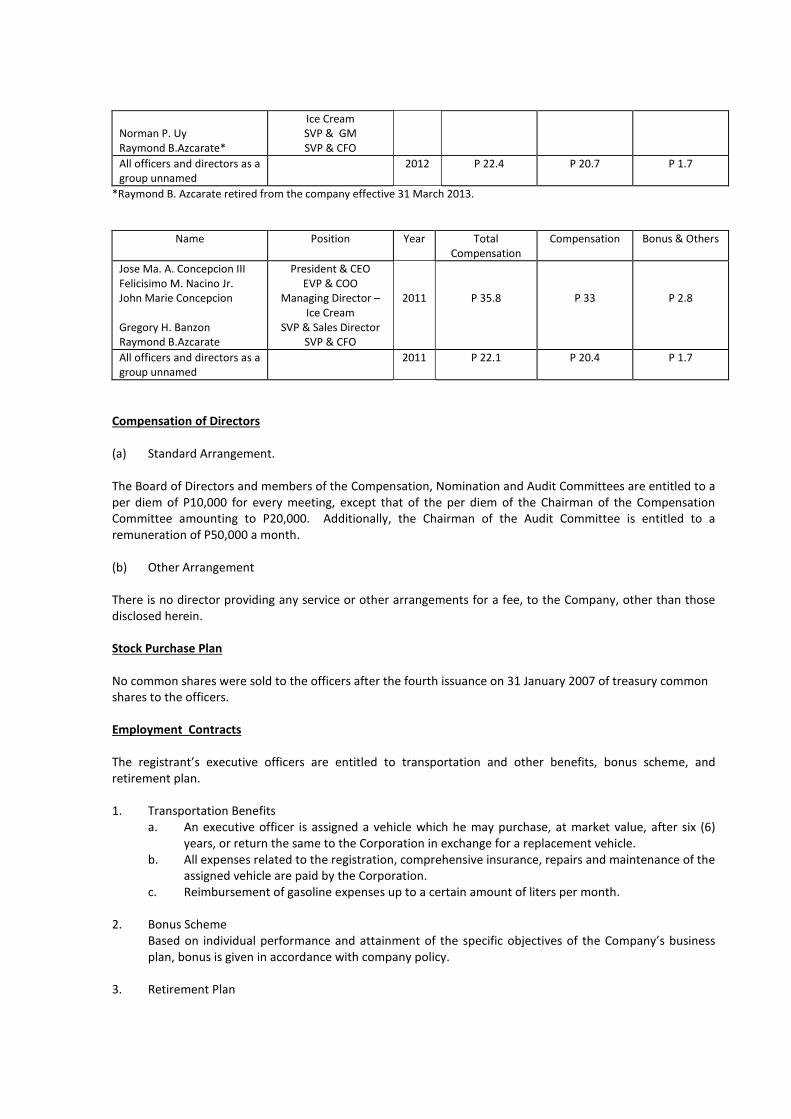
Name Position Year Total
Compensation
Compensation Bonus & Others
Jose Ma. A. Concepcion III
Felicisimo M. Nacino Jr.
John Marie Concepcion
Gregory H. Banzon
Raymond B.Azcarate
President & CEO
EVP & COO
Managing Director –
Ice Cream
SVP & Sales Director
SVP & CFO
2011
P 35.8
P 33
P 2.8
All officers and directors as a
group unnamed
2011 P 22.1
P 20.4 P 1.7
Compensation of Directors
(a) Standard Arrangement.
The Board of Directors and members of the Compensation, Nomination and Audit Committees are entitled to a
per diem of P10,000 for every meeting, except that of the per diem of the Chairman of the Compensation
Committee amounting to P20,000. Additionally, the Chairman of the Audit Committee is entitled to a
remuneration of P50,000 a month.
(b) Other Arrangement
There is no director providing any service or other arrangements for a fee, to the Company, other than those
disclosed herein.
Stock Purchase Plan
No common shares were sold to the officers after the fourth issuance on 31 January 2007 of treasury common
shares to the officers.
Employment Contracts
The registrant’s executive officers are entitled to transportation and other benefits, bonus scheme, and
retirement plan.
1. Transportation Benefits
a. An executive officer is assigned a vehicle which he may purchase, at market value, after six (6)
years, or return the same to the Corporation in exchange for a replacement vehicle.
b. All expenses related to the registration, comprehensive insurance, repairs and maintenance of the
assigned vehicle are paid by the Corporation.
c. Reimbursement of gasoline expenses up to a certain amount of liters per month.
2. Bonus Scheme
Based on individual performance and attainment of the specific objectives of the Company’s business
plan, bonus is given in accordance with company policy.
3. Retirement Plan

Availment of the retirement benefit is provided after the individual has rendered at least five (5) years
of service with the Company at 25% of basic pay per year of service. The value increases by 5% per
additional year of service up to a maximum of 125%.
4. Other Benefits
a. Hospitalization Plan: A hospitalization plan is provided for the executive officers and his
immediate dependents in accordance with company policy.
b. Vacation Leave: 15 days per year, accumulated up to 30 days but not encashable.
c. Sick Leave: 15 days per year, accumulated up to 45 days but not encashable.
d. Executive Check-up: Once every four (4) years; SPEC 24 KSAT blood test every two (2) years.
Warrants and Options Outstanding: Repricing
There are no outstanding warrants or stock options held by the directors or executive officers. As such, there
are no price or stock warrants or options that are adjusted or amended. There were no material transactions
during the past three (3) years between the Corporation and its executive officers other than the regular
employment agreements.
Item 7. Independent Public Accountants
Sycip Gorres Velayo & Co. is the external auditor of the Corporation. The firm or such other reputable
auditing firm will be recommended for appointment at the meeting. The representatives of the firms to be
nominated are expected to be present during the meeting and will have the opportunity to make a statement if
they so desire and will be available to respond to appropriate questions. During the last five fiscal years, there
have been no disagreements between the Corporation and its auditors on matters related to accounting
principles or practices, financial statement disclosures or auditing scope or procedure.
Pursuant to SRC Rule 68 (3) (b) (iv), the Corporation has changed its engagement partner, the former
being Mr. Martin Guantes who was engaged for the period January 2007 until December 2012, while the
present engagement partner is Ms. Ana Lea C. Bergado.
Audit and Audit Related Fees
For the years 2012, 2011 and 2010, the Company engaged the professional services of SGV. The
Group incurred an aggregate audit fee of P2.7 million for 2012, excluding out of pocket expenses. The
engagement involves the examination of the Company’s financial statements in accordance with generally
accepted auditing standards. It includes on a test basis review and evaluation of system, documentation and
procedures to ascertain that adequate internal controls are in placed. Also, they provide updates on latest
regulatory or compliance requirement with government agencies such as Securities and Exchange Commission
and other government agencies.
The audit committee’s approval policies and procedure for external auditors are:
1. Statutory audit of company's annual F/S
a. The Audit Committee ensures that the services of the external auditor conform with the provision
of the company's manual of corporate governance specifically articles 2.3.4.1; 2.3.4.3 and 2.3.4.4
b. The Audit Committee makes an assessment of the quality of prior year audit work services, scope,
and deliverables and makes a determination of the reasonableness of the audit fee based on the
proposed audit plan for the current year.
c. The Audit Committee approved the final audit plan and scope of audit presented by the external
auditor before the conduct of audit. The final audit plan was already the output after the
conclusion of the series of pre-audit planning with Management.
d. The Audit Committee reports to the Board the approved audit plan.
2. For other services other than annual F/S audit:
a. The Audit Committee evaluates the necessity of the proposed services presented by Management
taking into consideration the following:
i. The effectiveness of company's internal control and risk management arrangement,
systems and procedures, and management degree of compliance.
ii. The effect and impact of new tax and accounting regulations and standards.
iii. Availability of in-house technical expertise.
iv. Cost benefit of the proposed undertaking.
b. The Audit Committee approves and ensures that other services provided by the external auditor
shall not be in conflict with the functions of the external auditor for the annual audit of its
financial statements.
Item 8. Compensation Plans
No action will be taken with respect to any plan pursuant to which cash or non-cash compensation
may be paid or distributed to the Corporations' officers and employees. Likewise, no action will be taken with
regard to granting of extension of any option, warrant or right to purchase any securities.
C. ISSUANCE AND EXCHANGE OF SECURITIES
Items 9-14. Issuance and Exchange of Securities, Modification or Exchange of Securities, Financial and
Other Information, Mergers, Consolidations, Acquisitions and Similar Matter, Acquisition or Disposition of
Property and Restatement of Accounts
No securities are to be issued in exchange for existing securities.
D. OTHER MATTERS
Item 11. Authorization of Issuance of Securities Otherwise than for Exchange
Since no securities are to be issued in exchange for existing securities, no authorization has been
issued to this effect.
Item 15. Action with Respect to Reports
Approval of the Management Report for the fiscal year 2012 and Minutes of the previous Annual
Stockholders’ Meetings.
A. Summary of the Annual Stockholders' Meeting held on 27 June 2012
1. Approval of Previous Minutes
The minutes of the Annual Stockholders' Meeting held on 29 June 2011 was approved and
ordered filed.
2. Presentation of the Presidents’ Annual Report and Audited Financial Statements
The 2011 Annual Report was noted and appended to the minutes while the 2011 Audited
Financial Statements was likewise noted and approved.
3. Ratification of Acts of Management
The minutes of all meetings of the Board of Directors and the acts of the corporate officers
for the period between the 2011 Annual Stockholders’ Meeting until the 2012 Annual Stockholders'
Meeting were ratified, approved and confirmed. Further, all resolutions adopted by the Board of
Directors at said meetings were ratified and adopted and all acts and proceedings of all Corporate
Officers and Directors since the Annual Meeting were also ratified, approved and confirmed by the
stockholders.
4. Election of Directors
The following directors were elected:
Jose S. Concepcion Jr.
Jose Ma. A. Concepcion III
John Marie A. Concepcion
Ma. Herminia Victoria C. Young
Ernest Fritz Server
Joseph D. Server Jr.
Felicisimo M. Nacino, Jr.
Raissa H. Posadas
Francisco A. Segovia
Romeo L. Bernardo as Independent Director
Lilia R. Bautista as Independent Director
5. Appointment of External Auditor
The appointment of External Auditor was delegated to the Board of Directors.
Item 16. Matters Not Required to be Submitted
Approval and ratification of all acts of Management and the Board of Directors for the fiscal year 2012
which are considered purely administrative, such as but not limited to:
1. Renewal of credit facilities, foreign exchange lines, domestic bills line and omnibus line with
banks.
2. Authority to purchase, sell, negotiate, trade and transact foreign exchange with CC currency.
3. Application and Acceptance of short term credit lines and finance accommodation with
banks.
4. Amendment of authorized signatories for bank, Long Term Commercial Paper and treasury-
related transactions.
5. Opening of peso/dollar CASA/ investment in short term Money Market and Temporary
Placement instruments with banks.
6. Others.
Item 17. Amendment of Charter, By-laws or Other Documents
None.

Item 18. Voting Procedures
Pursuant to the By-laws of the Corporation, in all regular and special stockholders’ meetings, the
presence of shareholders who represent a majority of the outstanding capital stock entitled to vote shall
constitute a quorum and all decisions made by the majority shall be final. However, the amendment of the
Articles of Incorporation of the Corporation to be carried into effect requires the approval of two-thirds (2/3) of
the outstanding common stock of the Corporation.
On the election of the member of the Board of Directors, the nominees receiving the highest number
of votes shall be declared elected under Section 24 of the Corporation Code of the Philippines and as provided
for in Item 4 hereof. Likewise, the nominee for external auditor with the highest number of votes shall be
declared elected as such.
The method by which the votes of security holders will be counted is in accordance with the general
provisions of the Corporation Code of the Philippines. The counting of votes will be done by the Corporate
Secretary.
PART III
SIGNATURE PAGE
After reasonable inquiry to the best of my knowledge and belief, I certify that the information set
forth in this report is true, complete and correct. This report is signed in Mandaluyong City on 22 May 2013.
RFM CORPORATION
By:
ATTY. ROWEL S. BARBA
Corporate Secretary
MANAGEMENT REPORT OF RFM CORPORATION
I. CONSOLIDATED AUDITED FINANCIAL STATEMENTS
The 2012 Audited Consolidated Financial Statements and the latest Interim Unaudited Financial
Statement (Quarterly Report) for 2013 are incorporated herein by reference and are filed as part of this
Management Report.
II. INFORMATION CONCERNING DISAGREEMENT WITH ACCOUNTANTS ON ACCOUNTING AND
FINANCIAL DISCLOSURE
There is no event in the past five (5) years wherein the Company had any disagreement with regard to
any matter relating to accounting principles or practices, financial statement disclosure or auditing scope or
procedure.
The Company regularly adopts New Statement of Financial Accounting Standards (SFAS)/ International
Accounting Standards (IAS) where applicable.
III. MANAGEMENT DISCUSSION AND ANALYSIS (MD &A) OR PLAN OF OPERATION
Introduction
This discussion summarizes the significant factors affecting the consolidated operating results and financial
condition of RFM Corporation and its Subsidiaries for the period December 31, 2012. The following discussion
should be read in conjunction with the attached audited consolidated financial statements of the Company as
of December 31, 2012 and 2011, and the related consolidated statements of income, changes in stockholders’
equity, and cash flows for each of the two years in the period ended December 31, 2012. All necessary
adjustments to present the Company’s consolidated financial position as of
December 31, 2012 and 2011 and the results of operations and cash flow for the years then ended have been
made.
Analysis of Results of Operations
First Quarter 2013 vs. First Quarter 2012
Food and beverage company RFM Corporation posted an 18% growth in its net income for the first quarter of
the year, reaching P153.7 Million, and ahead of its internal target for the period. This was on the back of
around
P2.2 billion sales revenue for the first quarter, around 8% lower than last year’s P2.4 billion, primarily due to its
disposal of the meat business late last year.
The income growth is credited to better margins in its core businesses. Lower commodity input costs such as
sugar and wheat, as well as better yields due to scale economies, have contributed to improved margins,
especially for Selecta ice cream and Fiesta pasta.
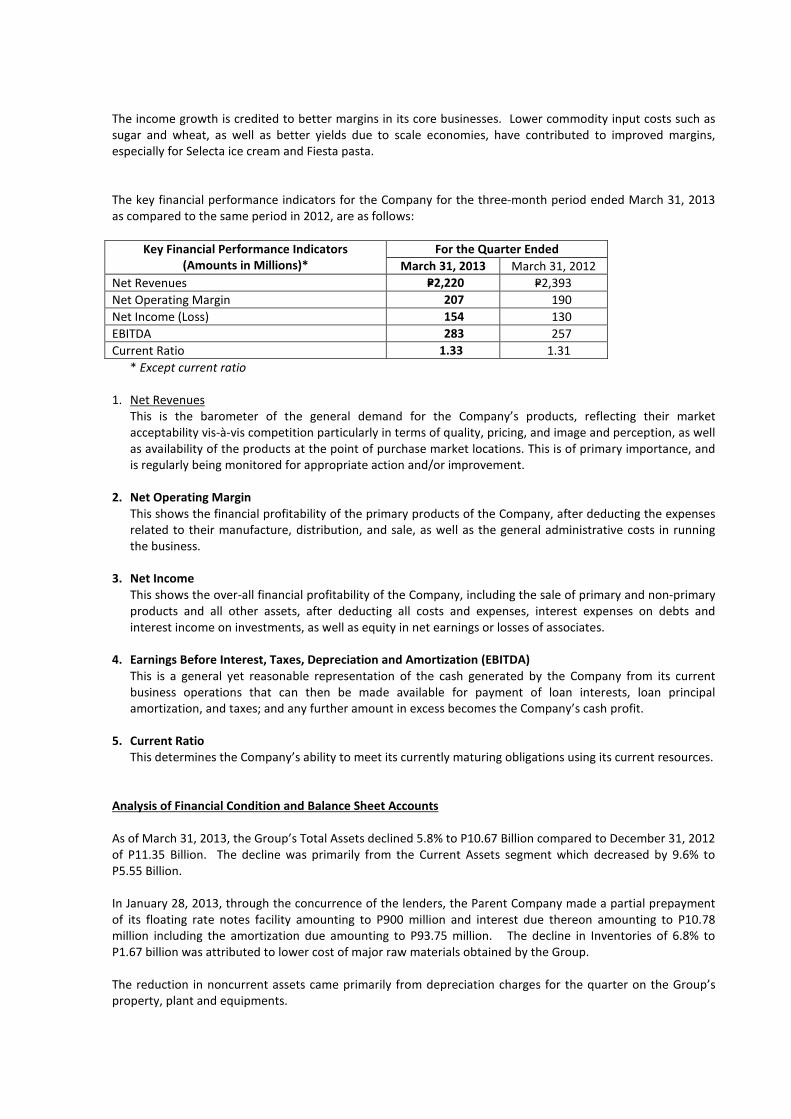
The key financial performance indicators for the Company for the three-month period ended March 31, 2013
as compared to the same period in 2012, are as follows:
For the Quarter Ended Key Financial Performance Indicators
(Amounts in Millions)* March 31, 2013 March 31, 2012
Net Revenues P=2,220 P=2,393
Net Operating Margin 207 190
Net Income (Loss) 154 130
EBITDA 283 257
Current Ratio 1.33 1.31
* Except current ratio
1. Net Revenues
This is the barometer of the general demand for the Company’s products, reflecting their market
acceptability vis-à-vis competition particularly in terms of quality, pricing, and image and perception, as well
as availability of the products at the point of purchase market locations. This is of primary importance, and
is regularly being monitored for appropriate action and/or improvement.
2. Net Operating Margin
This shows the financial profitability of the primary products of the Company, after deducting the expenses
related to their manufacture, distribution, and sale, as well as the general administrative costs in running
the business.
3. Net Income
This shows the over-all financial profitability of the Company, including the sale of primary and non-primary
products and all other assets, after deducting all costs and expenses, interest expenses on debts and
interest income on investments, as well as equity in net earnings or losses of associates.
4. Earnings Before Interest, Taxes, Depreciation and Amortization (EBITDA)
This is a general yet reasonable representation of the cash generated by the Company from its current
business operations that can then be made available for payment of loan interests, loan principal
amortization, and taxes; and any further amount in excess becomes the Company’s cash profit.
5. Current Ratio
This determines the Company’s ability to meet its currently maturing obligations using its current resources.
Analysis of Financial Condition and Balance Sheet Accounts
As of March 31, 2013, the Group’s Total Assets declined 5.8% to P10.67 Billion compared to December 31, 2012
of P11.35 Billion. The decline was primarily from the Current Assets segment which decreased by 9.6% to
P5.55 Billion.
In January 28, 2013, through the concurrence of the lenders, the Parent Company made a partial prepayment
of its floating rate notes facility amounting to P900 million and interest due thereon amounting to P10.78
million including the amortization due amounting to P93.75 million. The decline in Inventories of 6.8% to
P1.67 billion was attributed to lower cost of major raw materials obtained by the Group.
The reduction in noncurrent assets came primarily from depreciation charges for the quarter on the Group’s
property, plant and equipments.
Total liabilities have declined by 14.2% to P4.98 billion primarily due to the reduction in long-term debts as
discussed above.
The Group has a current ratio of 1.33 and 1.42 on March 31, 2013 and December 31, 2012, respectively. The
Group’s Debt to Equity ratio was 0.87 and 1.04 on March 31, 2013 and December 31, 2012, respectively.
Notes to Financial Statements
The Company’s financial statements for the second calendar quarter have been prepared in accordance with
Philippine Financial Reporting Standards. The same accounting policies and methods of computation used are
consistent with the most recent audited financial statements.
The Company discloses the following:
(a) There are no unusual items as to the nature and amount affecting assets, liabilities, equity, net income,
or cash flows, except those stated in Management’s Discussion and Analysis of Results of Operations and
Financial Condition;.
(b) There are no material changes in estimates of amounts reported in prior financial periods, other than
those disclosed in the most recent audited financial statements;
(c) Except as disclosed, there are no known trends, demand, commitments, events or uncertainties that may
have an impact on sales and income from continuing operations;
(d) There are no issuances, repurchases and repayments of debt and equity securities other than mentioned;
(e) There are no known trends, demands, commitments, events or uncertainties that will have material
impact on the Company’s liquidity nor have a favorable or unfavorable impact on revenues or income
from continuing operations;
(f) There are no dividends paid separately for ordinary shares and other shares;
(g) There are no material events subsequent to the end of the interim period that have not been reflected in
the financial statements;
(h) Other than mentioned, there are no material changes in the business composition of the Company during
the interim period, including business combinations, acquisition or disposal of subsidiaries and long-term
investments, restructuring, and discontinuing operations;
(i) There is no change in contingent liabilities since the most recent audited financial statements;
(j) There were no known events that will trigger direct or contingent financial obligation that is material to
the Company, including any default or acceleration of an obligation that remain outstanding as of
March 31, 2013;
(k) There were no material off-balance sheet transactions, arrangements, obligations, and other relationship
of the Company with unconsolidated entities or other persons created during the reporting period.
Year ended December 31, 2012 vs. 2011
Management Report on Operations
Food and beverage company RFM Corporation finished the year 2012 with P682 Million net income, or a 34%
income growth over the previous year’s P508 Million net income. This was on the back of an 11% sales growth
to P11.0 billion for the period.

The accelerated income growth was credited to stronger sales of its higher margin businesses. Better margins
were achieved due to the lower commodity input costs this year, such as for milk, wheat and sugar, as well as
better yields due to scale economies as we reach higher volumes in our key brands, such as Selecta ice cream,
and Fiesta spaghetti.
The positive economic climate have further boosted consumer confidence and spending, which led to
continued growth practically in all the company’s brands, led by Selecta ice cream, Fiesta pasta, White King
cake and sauce mixes, Selecta milk and Sunkist juice.
Financial Position
Analysis of Balance Sheet Accounts
As of December 31, 2012, the Group’s total assets increased to P11.35 billion from P10.76 billion last year.
Total current assets of the Group increased by P1.26 billion to P6.13 billion, mainly due to its receivables which
grew 26.5% to P2.68 billion from last year’s P2.12 billion, contributed by the growth in revenues during the
period.
The total non-current assets rose to P5.22 billion due mainly to the increase in plant, property and equipment
by P84.15 million to P4.30 billion. The increase in group plant, property and equipment was due to new
investments to boost plant capacity and to improve manufacturing efficiencies.
The total liabilities increased by P196.57 million to P5.80 billion. Total current liabilities increased by P646.65
million mainly due to the increase in Accounts payable and accruals which primarily funded the increase in
inventory position as of year end. Meanwhile, the combined long-term debt and long-term obligations have
declined by P345.10 million to P1.82 billion due to payment of loan amortizations.
Year ended December 31, 2011 vs. 2010
Management Report on Operations
Food and beverage company RFM Corporation’s full year net income of P508.3 million in 2011 surpassed
market analysts’ year-end estimate of P420-430 million.
Higher revenues and easing of commodity cost inputs such as milk and sugar in the second half, coupled with
internal production improvements pushed-up profitability to P295 million in the second half, up 38.8% from
first half income.
Topline sales registered a faster growth of 27.2% for the second semester, versus 7% growth in the first half of
the year, ending the year with P10.3 Billion sales revenue, 13.6% higher compared to P9.1 Billion in 2010. The
focus on core food and beverage business has built stronger brand equity and product innovations have
influenced the shift in buying pattern and frequency in a number of categories.
Selecta Ice Cream, a joint venture with world giant Unilever, is increasing its leadership of the industry with
market share going beyond 71%, coming from around 66% at the start of 2011. Remarkable growth was seen
in Selecta-Hersheys, Supreme, Classic and Cornetto lines, with innovations backed by strong marketing
campaigns. Flour-based businesses led by White King Fiesta spaghetti likewise continued to hit record sales
levels, with growth close to 50%, hitting rated capacity starting September, and pushing up its recent market
share in its biggest key account to 35% by year-end, from 28% in January last year. White King Champorado
and Arroz-Caldo mixes, Sunkist litro pack and Swift Mighty Meaty and Corned Beef Swak also performed very
well as the company rationalized and focused its brand portfolio, supported by more exciting product
repackaging, aggressive merchandising and trade-related programs.
Financial Position
Analysis of Balance Sheet Accounts
As of December 31, 2011, the Group’s total assets reached P10.8 billion from P10.6 billion last year.
Total current assets of the Group decreased by P546.4 million to P4.88 billion, mainly due to the distribution to
RFM shareholders of its investment in Swift preferred shares, which were classified as AFS investments in the
Balance Sheet.
The total non-current assets rose to P6.0 billion due mainly to the increase in plant, property and equipment by
P742.7 million to P4.2 billion. The increase in group plant, property and equipment was due to new
investments to boost plant capacity and to improve manufacturing efficiencies.
The total liabilities increased by P814.7 million to P5.7 billion. Total current liabilities increased by
P622.1 million mainly due to maturing long-term debt and other obligations for the succeeding year 2012.
Total non-current liabilities increased by P192.6 million to P2.0 billion mainly due to availment of additional
long-term debts of P650 million. These loans are used to fund the Company’s capital expenditures and
additional working capital.
Year ended December 31, 2010 vs. 2009
Management Report on Operations
Diversified food and beverage firm RFM Corporation registered P625.7 million in net income, an increase by
71% from 2009.
The Company’s revenues attained P9.1 billion. The improvement in the Philippine economy as it recovers from
the effect of global economic slump provided a favorable environment for the revenue growth. The
Company’s ability to fulfill the increasing Filipino consumer demands for affordable quality food enabled it to
grow its revenues by 9.7%.
The Company earned gross profit margins of P3.1 billion. This grew by 35% compared to previous year. The
gross profit rate margin increased by 5.9% points compared to previous year. This is a reflection of the
Company’s overall improvements in its cost structure. It has inherent strengths in supply chain function as it
sourced it commodity materials at opportune timing. The Company also reaped the benefits from its capital
expenditure investments for plant efficiency improvements and manufacturing capacity increase.
The operating expenses increased by 31% to P2.4 billion as the Company invested in marketing and selling
programs in order to communicate better with its target markets and for its products to be placed in locations
which are convenient for its targeted consumers.
The Company’s operating income increased by 34.7% to P708.9 million.
With record-breaking Fiesta volumes in the last quarter this year, Fiesta spaghetti sustained its market
leadership in spaghetti category for the entire year. This was attained through value-for-money proposition of
Tipid Pack, storefront billboards, merchandising and TV advertisement using an endorser.
The Fiesta brand is the company’s second market leader. It follows the Selecta brand that has continued to
dominate the Philippine ice cream market with over 50 percent market share.
Financial Position
Analysis of Balance Sheet Accounts
As of December 31, 2010, the Group’s total assets reached P10.58 billion an increase by P1.66 billion or 18.6%
from last year’s P8.9 billion.
Total current assets of the Group increased by P555 million to P4.58 billion, mainly due to its inventory position
which increased by P434 million. The increase in inventory position was in anticipation to the increase in prices
of key commodity materials. Cash and cash equivalents increased by P153 million or 31% from previous year.
Net receivables decreased by P135 million mainly due to additional provisions in allowance for doubtful
accounts.
The total non-current assets rose to P1.1 billion due mainly to the increase in plant, property and equipment by
P985 million to P3.52 billion. The increase in group plant, property and equipment was due to new
investments to boost plant capacity and to improve manufacturing efficiencies. The Group also acquired
investment properties.
The total liabilities increased by P1.03 billion to P4.86 billion. Total current liabilities increased by
P92.5 million while total non-current liabilities increased by P938 million to P1.82 billion. Accounts payable and
accruals increased by P429.5 million to P2 billion, which primarily funded the increase in inventory position as
of year end. The combined current and non-current portion of long term debt increased by P488 million.
Current portion of long term debts declined by P376 million to zero balance. This was in line with the
retirement of the various bank loans with a total value of P1.31 billion (current and non-current portion) on
October 27, 2010. Several banking institutions granted the Parent Company a peso-denominated floating rate
note facility with an aggregate amount of P1.5 billion on October 25, 2010.
Key Performance Indicators
For the full fiscal years 2012, 2011 & 2010 the Company’s and majority-owned subsidiaries’ top five (5) key
performance indicators are as follows:
In Millions December 2012 December 2011 December 2010
Revenues 10,998 10,336 9,098
Operating Margin 889 791 709
Net Income (Loss) 682 508 625
EBITDA 1,204 1,042 890
Current Ratio 1.42 1.33 1.78
(a) Revenue Growth
These indicate external performance of the Company and its subsidiaries in relation to the movement of
consumer demand and the competitors’ action to the market behavior. These also express market acceptability
and room for development and innovations. These are being monitored and compared as a basis for further
study and development.
(b) Operating Margin
This shows the result after operating expenses have been deducted. Operating expenses are examined,
checked and traced for major expenses. These are being analyzed and compared to budget, and previous
years, to ensure prudence and discipline in spending behind marketing and selling activities.
(c) Net Income
This represents the outcome or results of operations. This measures the over-all performance of the team, the
consequence of all the contributory factors affecting supply, demand, utilization and decisions.
(d) EBITDA
This measures the Company’s ability to generate cash from operation by adding back non-cash expenses (i.e.
depreciation and amortization expense) to earnings before interest and tax.
(e) Current Ratio
This determines the company’s ability to meet its maturing obligations using its current resources. It indicates
the possible tolerable shrinkage in current resources without threat to the claims of current creditors.
Causes for Any Material Changes from Period to Period of FS, which shall include vertical and horizontal
analyses of any material item
Please refer to the discussions under Results of Operations and Financial Position for the year ended December
31, 2012 vs. 2011, year ended December 31, 2011 vs. 2010 and year ended December 31, 2010 vs. 2009.
The Company is not aware of the following:
(i) Any events that will trigger direct or contingent financial obligation that is material to the company,
including any default or acceleration of an obligation.
(ii) All material off-balance sheet transaction, arrangements, obligations (including contingent obligations),
and other relationships of the company with unconsolidated entities or other persons created during the
reporting period.
Seasonal Aspects that has Material Effect on the FS
There is no material effect with the seasonal aspect of certain raw materials specifically wheat on the financial
statements.
Audit and Audit Related Fees
For the years 2011, 2010 and 2009, the Company engaged the professional services of SGV. The Group
incurred an aggregate audit fee of P2.4 million for 2011, excluding out of pocket expenses. The engagement
involves the examination of the Company’s financial statements in accordance with generally accepted auditing
standards. It includes on a test basis review and evaluation of system, documentation and procedures to
ascertain that adequate internal controls are in placed. Also, they provide updates on latest regulatory or
compliance requirement with government agencies such as Securities and Exchange Commission and other
government agencies.
The audit committee’s approval policies and procedure for external auditors are:
1. Statutory audit of company's annual F/S
a. The Audit Committee ensures that the services of the external auditor conform with the provision
of the company's manual of corporate governance specifically articles 2.3.4.1; 2.3.4.3 and 2.3.4.4
b. The Audit Committee makes an assessment of the quality of prior year audit work services, scope,
and deliverables and makes a determination of the reasonableness of the audit fee based on the
proposed audit plan for the current year.

c. The Audit Committee approved the final audit plan and scope of audit presented by the external
auditor before the conduct of audit. The final audit plan was already the output after the
conclusion of the series of pre-audit planning with Management.
d. The Audit Committee reports to the Board the approved audit plan.
2. For other services other than annual F/S audit:
a. The Audit Committee evaluates the necessity of the proposed services presented by Management
taking into consideration the following:
i. The effectiveness of company's internal control and risk management arrangement,
systems and procedures, and management degree of compliance.
ii. The effect and impact of new tax and accounting regulations and standards.
iii. Availability of in-house technical expertise.
iv. Cost benefit of the proposed undertaking.
b. The Audit Committee approves and ensures that other services provided by the external auditor
shall not be in conflict with the functions of the external auditor for the annual audit of its
financial statements.
IV. BRIEF DESCRIPTION OF THE GENERAL NATURE AND SCOPE OF THE BUSINESS
PART I – BUSINESS AND GENERAL INFORMATION
Item 1 - Business
The RFM Group
RFM Corporation (the “Company”) is a major player in the food and beverage industry in the Philippines,
specifically in the processing and manufacture of flour, flour-based products like pasta, sauces and cake mixes,
milk and juice drinks, canned and processed meats, and ice cream.
The Company also operates non-food businesses, which include barging services (Rizal Lighterage Corporation)
and insurance brokerage (RFM Insurance Brokers, Inc.), and leasing of commercial/office spaces (Invest Asia
Corporation) that mainly serves the internal requirement of the various operating divisions.
History and Business Development
RFM Corporation was incorporated on August 16, 1957 as Republic Flour Mills, Inc. to manufacture flour in the
Philippines, a country which does not grow wheat, in order to contribute to the country’s greater self-reliance
in basic food. From its original business of flour milling, the Company diversified into poultry and livestock
production and areas of food manufacturing that includes flour-based products, margarine, milk & juices,
canned and processed meat, ice cream, and bottled mineral water.
After RFM established itself in the flour milling business, the Company, in 1963, commissioned new plant
facilities to produce cooking oil and margarine. This was then followed by the establishment of a feed mill in
1965 to manufacture poultry and hog feeds, of which key raw materials - bran and pollard - were by-products
of the flour operations.

In the early 1971, RFM integrated forward into hog and poultry breeding. It entered into a licensing agreement
with Peterson Industries and H & N Layers to breed day-old chicks. The Company, though, divested from the
hog operation in 1994, and in the poultry business in 2003 by way of property dividends to its shareholders.
In 1973, the Company signed an exclusive licensing agreement with Swift and Company of Illinois (now Armour
Swift & Echrich of the ConAgra Group). This move initiated the entry of RFM into the business of chilled and
canned meat processing using the “Swift” brand name. A continuous meat processing plant, the first in the
country, was constructed in 1975. The “Swift” brand name was eventually purchased by RFM in 1987, allowing
the Company the rights to its exclusive use in the Philippines. The “Swift” brand name is being shared by RFM
and Swift Foods, Inc. in their production and sale of processed meat and chicken products, respectively.
From the 1970s to 1980s, RFM concentrated primarily on growing its established core businesses. It also
introduced grocery items, such as cake mixes, hotcake mixes, and ingredient mixes during this period.
As RFM began to enter the 1990s, it envisioned itself to become a truly diversified Food Company catering to
the Filipino taste. This goal was and continues to be implemented through two approaches: strategic
acquisition of Filipino companies with strong local brands, and partnerships with internationally-renowned
food institutions.
This vision was first manifested in the purchase of Cosmos Bottling Corporation (Cosmos), a Filipino softdrinks
company, in 1989, from the Wong Family. Then in 1990, RFM acquired the “Selecta” trademark from the Arce
Family. RFM invested in new machinery under a new company, Selecta Dairy Products, Inc. (Selecta), to mass
produce the locally famous ice cream flavors within international health standards. And in 1993, the Company
ventured into the production of ready-to-drink ultra-heat treated (UHT) milk and juices in tetra-packaged
format using the brand names Selecta Moo and Sunkist, respectively.
In 1994, Swift, Selecta, and Cosmos conducted an initial public offering of its shares of stock through the
Philippine Stock Exchange.
A year later, in 1995, the Company incorporated RFM Properties and Holdings, Inc. to consolidate its real estate
assets as well as to break into the land and housing development business. The company was later renamed
Philippine Townships, Inc. In 2008, the company was again renamed to Philtown Properties, Inc.
RFM continued to expand its businesses as it ventured into noodle manufacturing, tuna processing, bakeshop
business with the acquisition of the Rolling Pin trademark, food franchising with the use of Little Ceasar’s Pizza
brand of the USA, and thrift banking under Consumer Bank.
The Asian Financial Crisis of 1997, however, put a halt to the business expansion of RFM. The ensuing
economic slowdown, more cutthroat market competition, and the dearth of capital financing weighed heavily
on the financial operations of the Company. Furthermore, the US$83.7M bond, which it obtained in 1996,
became due in 2001, and its payment forced RFM to sell many of its operating subsidiaries, including Consumer
Bank which was sold to Philippine Bank of Communications, and Cosmos which was sold to Coca-Cola Inc. and
San Miguel Corporation.
In 2003, the company’s common shares from Swift Foods, Inc. were declared as property dividends to its
stockholders. Likewise, the company’s common shares from Philtown Properties, Inc. (formerly Philippine
Townships, Inc.), the property company, were declared as property dividends in tranches in 2008, 2009 and
2012. However, the company remains committed in liquidating its landholdings through the development of
middle income housing enclaves. It also builds condominium projects in saleable areas in Fort Bonifacio,
Rockwell, and Taft.
The remaining business, nevertheless, gives RFM the foundation to build on. Within the Parent Company, the
original business of flour making continues; as well as branded food products such as Swift processed chilled
and canned meats like hotdogs, vienna sausage, and corned beef, Sunkist Juices, Selecta Milk, Fiesta Pasta
Noodles, White King Hot Cake, Butterfresh Margarine, among others. The ice cream business remains
profitable and is presently co-owned with Unilever Philippines, under a new corporate name, Unilever-RFM Ice
Cream Inc.
In late 2012, RFM entered into a Trademark and Asset Purchase Agreement with The Pacific Meat Company,
Inc. (PMCI). The terms of this agreement includes RFM’s sale of the “Swift” brand, together with finished
goods and raw material inventories, the goodwill of the business connected with the trademarks used for its
canned, pouch flexible heat sterilized, refrigerated, chilled and frozen meat products, and certain machinery
and equipment, as well as all product formulations, processes, know-how and other technical information
relating to the production of meat products.
The Group and the Products
Food Businesses
RFM Corporation (Parent Company)
RFM Corporation (the parent company) operates two major business segments:
- Institutional segment, which primarily manufactures and sells flour, pasta, bakery and other bakery
products to institutional customers; and
- Consumer segment, that manufactures and sells ice cream, meat, milk and juices, pasta products, and
flour and rice based mixes.
See table on sales.
Unilever-RFM Ice Cream Inc. (formerly Selecta Wall’s Inc.)
Unilever-RFM Ice Cream Corporation is a joint venture enterprise owned 50%-50% by RFM Corporation and
Unilever Philippines Inc. It is engaged in the business of manufacturing, marketing, distributing and selling,
importing and exporting of ice cream, ice cream desserts and ice cream novelties, and similar food products.
Interbake Commissary Corporation
Interbake Commissary Corporation was established in 1998, and operates a high-speed Bun Production Line.
It’s first, and continues to be the biggest customer, is McDonald’s. Interbake supplies the bun requirements to
McDonald’s over 260 stores in Luzon. Through the years, Interbake has gained an outstanding reputation for
delivering world-class quality buns, enabling it to further expand its customer base which now includes other
quick service restaurants such as Wendy’s and KFC. Since 2007, Interbake’s bread sales volume had an average
annual increase of 10%.
RFM Foods Philippines Corporation
Established in 1991 as RFM-Indofood Philippines Corporation, then a joint venture company between RFM
Corporation and Indofood of the Salim Group of Indonesia, the company’s main product lines were instant
noodles of various flavors and packaging. The Company, however, ceased operations in October 2000 due to
operating losses. The company has been renamed RFM Foods Philippines Corporation, and remains dormant.
Southstar Bottled Water Company, Inc.
Southstar Bottled Water Company, Inc. (Southstar) was incorporated in 1992 to manufacture and distribute all
kinds and classes of bottle water, carbonated water, drinking water, fluoridated water, mineral water, natural
water, purified water, spring water, well water, flavored water, as well as bottling equipment, purification
equipment, coolers, dispensers, water treatment plants, water bottling plants, bottles, crates, including their
accessories, attachments, spare parts and any merchandise of similar nature. Southstar, however, suspended
its operations due to sustained operating losses.
FWBC Holdings, Inc.

FWBC Holdings, Inc. is 83.38% owned by RFM Corporation, and organized in 2001 to hold and manage Filipinas
Water Bottling Corporation (FWBC). FWBC is involved in the processing and distribution of bottled mountain
spring water. FWBC, however, ceased operations in June 2012 due to operating losses.
Non-Food Businesses
RFM Equities, Inc.
RFM Equities Inc. is a holding company that is 100% owned by RFM. It was organized in 1996 to hold and
manage RFM Corporation’s holdings in two small financial services subsidiaries – Conglomerate Securities and
Financing Corporation (CSFC) and RFM Insurance Brokers, Inc. (RIBI). CSFC provides consumer-financing
services mainly to the managers and employees of the RFM Group. RIBI meanwhile services the insurance
needs mainly of the RFM Group, affiliates and business partners.
Rizal Lighterage Corporation
Rizal Lighterage Corporation (RLC) is a barging company that is 94% owned by RFM Corporation. It is primarily
engaged in providing lighterage and cargo handling services.
WS Holdings, Inc.
WS Holdings, Inc. is 60% owned by RFM Corporation and 40% owned by Unilever Philippines, Inc. It was
incorporated and registered with the Securities and Exchange Commission in 1999 to invest in, purchase and
own shares of stocks, bonds and other securities of obligations including real estate and personal property of
any foreign or domestic corporation, or partnership, or association.
Selecta Wall’s Land Corporation
Selecta Wall’s Land Corporation was incorporated in 1999 to acquire, own, use, develop and hold for
investment all kinds of real estate. RFM Corporation owns 35% of this company.
Cabuyao Meat Processing Corporation
Formerly Bringmenow, Inc., the company was renamed into Cabuyao Meat Processing Corporation (CMPC) in
2005 upon the transfer into it of the meat manufacturing assets. This is 100% owned by RFM Corporation, and
its primary possession is the processing plant in Cabuyao, Laguna, which produces hotdogs, corned beef, hams,
and other meat products under the Swift brand. In October 2012, the Company sold its finished goods and raw
material inventories, as well as specific processed meat equipment.
Invest Asia Corporation
Invest Asia Corporation, which owns the RFM head office building and land where the building is located leases
commercial and office spaces to its affiliates and third party tenants. RFM Corporation acquired 96% equity
interest of Invest Asia and became a subsidiary of the Parent Company on August 2, 2010.
Contribution to Sales
The Group is primarily engaged in manufacturing, milling, and marketing of food and beverage products. The
Group operates its business through the business units identified below. Information as to the relative
contribution of the divisions and business to total sales are as follows:
Business Unit
Products
Brands
Contribution to
Sales
Institutional Flour Products Republic Special, Cinderella, Hi-Pro 34.7%
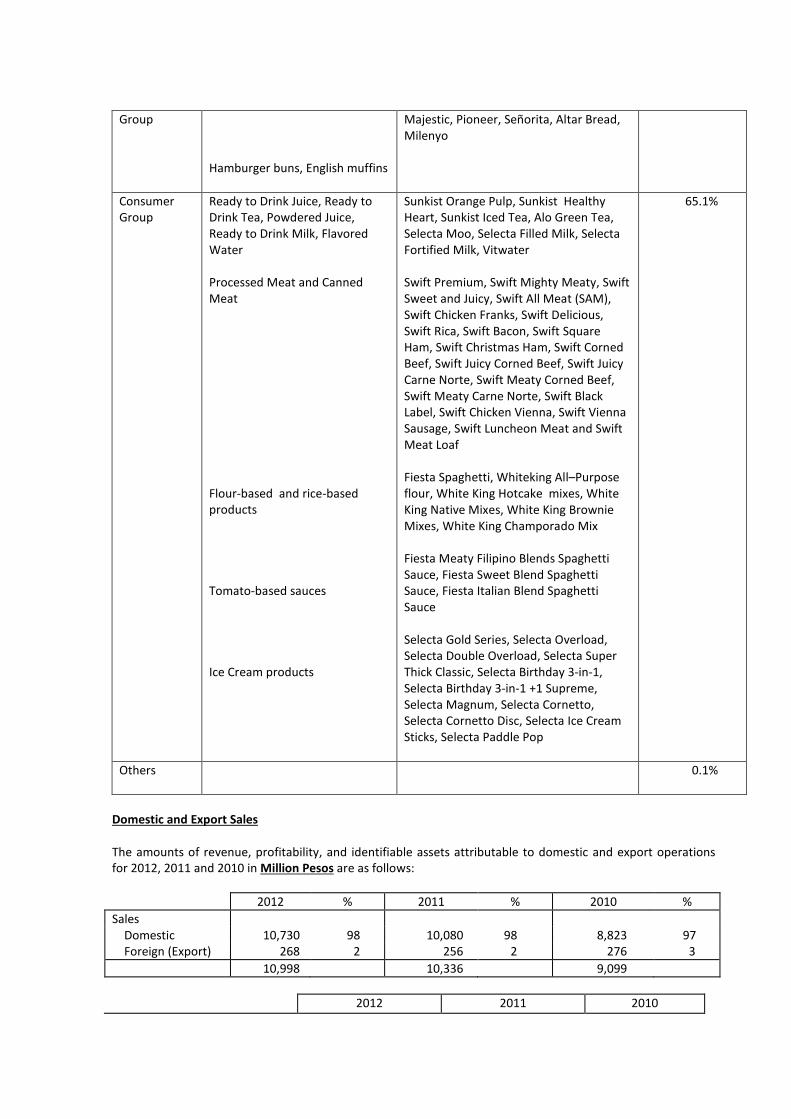
Group
Hamburger buns, English muffins
Majestic, Pioneer, Señorita, Altar Bread,
Milenyo
Consumer
Group
Ready to Drink Juice, Ready to
Drink Tea, Powdered Juice,
Ready to Drink Milk, Flavored
Water
Processed Meat and Canned
Meat
Flour-based and rice-based
products
Tomato-based sauces
Ice Cream products
Sunkist Orange Pulp, Sunkist Healthy
Heart, Sunkist Iced Tea, Alo Green Tea,
Selecta Moo, Selecta Filled Milk, Selecta
Fortified Milk, Vitwater
Swift Premium, Swift Mighty Meaty, Swift
Sweet and Juicy, Swift All Meat (SAM),
Swift Chicken Franks, Swift Delicious,
Swift Rica, Swift Bacon, Swift Square
Ham, Swift Christmas Ham, Swift Corned
Beef, Swift Juicy Corned Beef, Swift Juicy
Carne Norte, Swift Meaty Corned Beef,
Swift Meaty Carne Norte, Swift Black
Label, Swift Chicken Vienna, Swift Vienna
Sausage, Swift Luncheon Meat and Swift
Meat Loaf
Fiesta Spaghetti, Whiteking All–Purpose
flour, White King Hotcake mixes, White
King Native Mixes, White King Brownie
Mixes, White King Champorado Mix
Fiesta Meaty Filipino Blends Spaghetti
Sauce, Fiesta Sweet Blend Spaghetti
Sauce, Fiesta Italian Blend Spaghetti
Sauce
Selecta Gold Series, Selecta Overload,
Selecta Double Overload, Selecta Super
Thick Classic, Selecta Birthday 3-in-1,
Selecta Birthday 3-in-1 +1 Supreme,
Selecta Magnum, Selecta Cornetto,
Selecta Cornetto Disc, Selecta Ice Cream
Sticks, Selecta Paddle Pop
65.1%
Others 0.1%
Domestic and Export Sales
The amounts of revenue, profitability, and identifiable assets attributable to domestic and export operations
for 2012, 2011 and 2010 in Million Pesos are as follows:
2012 % 2011 % 2010 %
Sales
Domestic 10,730 98 10,080 98 8,823 97
Foreign (Export) 268 2 256 2 276 3
10,998 10,336 9,099
2012 2011 2010
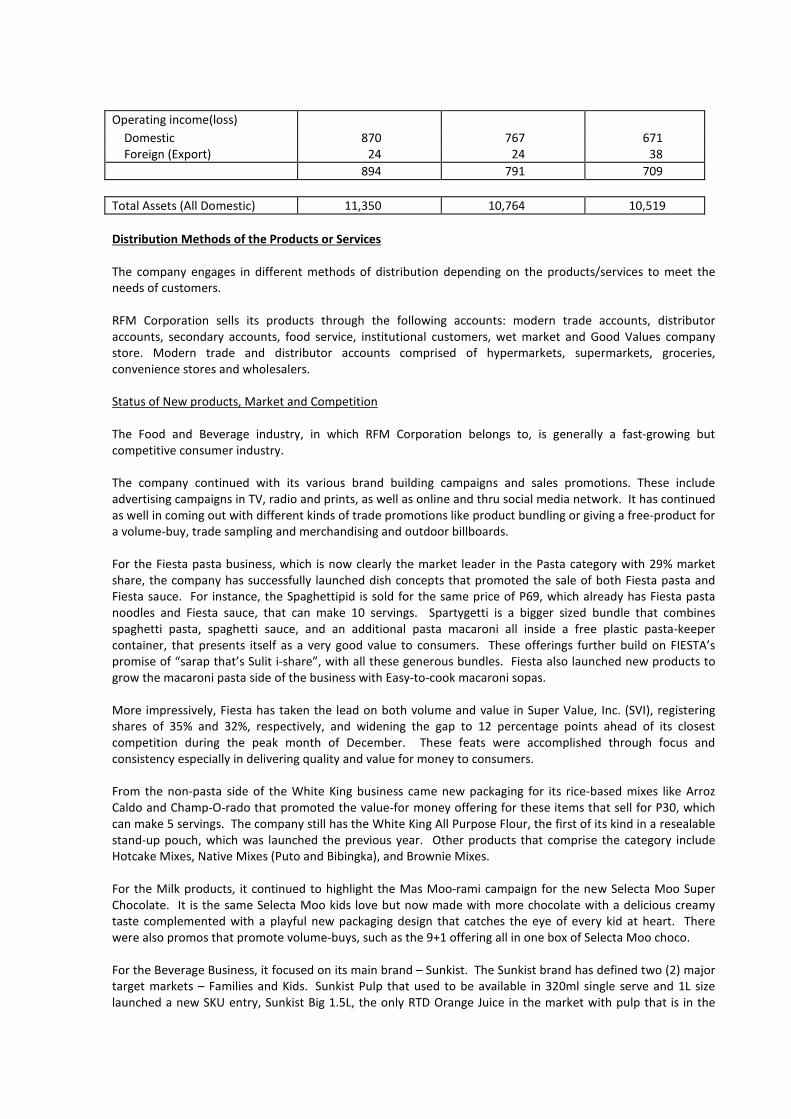
Operating income(loss)
Domestic 870 767 671
Foreign (Export) 24 24 38
894 791 709
Total Assets (All Domestic) 11,350 10,764 10,519
Distribution Methods of the Products or Services
The company engages in different methods of distribution depending on the products/services to meet the
needs of customers.
RFM Corporation sells its products through the following accounts: modern trade accounts, distributor
accounts, secondary accounts, food service, institutional customers, wet market and Good Values company
store. Modern trade and distributor accounts comprised of hypermarkets, supermarkets, groceries,
convenience stores and wholesalers.
Status of New products, Market and Competition
The Food and Beverage industry, in which RFM Corporation belongs to, is generally a fast-growing but
competitive consumer industry.
The company continued with its various brand building campaigns and sales promotions. These include
advertising campaigns in TV, radio and prints, as well as online and thru social media network. It has continued
as well in coming out with different kinds of trade promotions like product bundling or giving a free-product for
a volume-buy, trade sampling and merchandising and outdoor billboards.
For the Fiesta pasta business, which is now clearly the market leader in the Pasta category with 29% market
share, the company has successfully launched dish concepts that promoted the sale of both Fiesta pasta and
Fiesta sauce. For instance, the Spaghettipid is sold for the same price of P69, which already has Fiesta pasta
noodles and Fiesta sauce, that can make 10 servings. Spartygetti is a bigger sized bundle that combines
spaghetti pasta, spaghetti sauce, and an additional pasta macaroni all inside a free plastic pasta-keeper
container, that presents itself as a very good value to consumers. These offerings further build on FIESTA’s
promise of “sarap that’s Sulit i-share”, with all these generous bundles. Fiesta also launched new products to
grow the macaroni pasta side of the business with Easy-to-cook macaroni sopas.
More impressively, Fiesta has taken the lead on both volume and value in Super Value, Inc. (SVI), registering
shares of 35% and 32%, respectively, and widening the gap to 12 percentage points ahead of its closest
competition during the peak month of December. These feats were accomplished through focus and
consistency especially in delivering quality and value for money to consumers.
From the non-pasta side of the White King business came new packaging for its rice-based mixes like Arroz
Caldo and Champ-O-rado that promoted the value-for money offering for these items that sell for P30, which
can make 5 servings. The company still has the White King All Purpose Flour, the first of its kind in a resealable
stand-up pouch, which was launched the previous year. Other products that comprise the category include
Hotcake Mixes, Native Mixes (Puto and Bibingka), and Brownie Mixes.
For the Milk products, it continued to highlight the Mas Moo-rami campaign for the new Selecta Moo Super
Chocolate. It is the same Selecta Moo kids love but now made with more chocolate with a delicious creamy
taste complemented with a playful new packaging design that catches the eye of every kid at heart. There
were also promos that promote volume-buys, such as the 9+1 offering all in one box of Selecta Moo choco.
For the Beverage Business, it focused on its main brand – Sunkist. The Sunkist brand has defined two (2) major
target markets – Families and Kids. Sunkist Pulp that used to be available in 320ml single serve and 1L size
launched a new SKU entry, Sunkist Big 1.5L, the only RTD Orange Juice in the market with pulp that is in the

1.5L size – a size ideal for sharing with the family or friends. In addition, Sunkist Pulp Big 1.5L is priced at the
same price as other RTD Juice in 1L in the market but with 500ml more. The launch was done via
announcement in “Eat Bulaga”, one of the country’s favorite shows as well as in electronic billboards in Metro
Manila.
Capturing the other target market segment of Sunkist, the kids, is the Sunkist Tetra packs. The same Sunkist
tetra packs that consumers have grown up with has solidified its foothold in the RTD Juice segment for kids via
partnership with Rovio’s well loved digital app character, Angry Birds. All the packs and label designs featured
the four (4) most popular birds of the Angry Birds game app. The tetra packs also contained collectible
standees at the back of every 235ml pack and once all the 8 birds are collected, one may get a limited edition
Sunkist Angry Birds school bag. The excitement on the labels were brought to life with a TV Commercial that
seemed to make Sunkist as part of the game app. The combined efforts of Sunkist targeted for families and
targeted for kids propelled the beverage business to significant growth in 2012.
The re-launch of Vitamin-enhanced water Vitwater is expected to promote this product as the healthier and
tastier alternative to all the functional drinks in the market. Vitpower still comes in 350ml bottles and is priced
at P15.00 per bottle SRP. It has higher contents of Taurine, Inositol, Vitamin B and Ginseng that aids in the
breakdown of fats and absorption of vitamins.
The Selecta ice cream business, under the joint venture with Unilever Philippines, continued to dominate the
ice cream category with 76% market share. It has launched various ice cream innovations both in the bulk ice
cream category (in containers) and the impulse (single-served) category. For the bulk ice cream, it launched
several best-selling flavors under the Supreme Overload, Super-thick and New co-branded product variants. It
also offered Pinoy Sorbetes Birthday pack and 3-in-1 + 1 (4 flavors in one pack). The year also saw the launch of
numerous Selecta Cornetto variants, as well as the successful grand launch of the new Magnum (Belgian
chocolate enrobed ice cream on stick) which performed beyond expectation during the year.
For the flour business, the company continues to provide commodity flour to several institutional accounts and
flour-based product manufacturers and retailers like biscuits, noodles cakes and breadmakers. There are
eleven flour millers in the country, under two trade associations – Philippine Association of Flour Millers
(PAFMIL) and Chamber of Philippine Flour Millers Inc (Champflour). RFM Corporation is a member PAFMIL.
The Company has about 8% to 9% of total industry volume sales.
Purchases of Raw Materials and Supplies
RFM Corporation sources raw materials and packaging materials both overseas and domestically.
The company imports from the US and Australia (wheat,), New Zealand (anhydrous milk fat), India and
Australia (skimmed milk powder), Switzerland, Spain and other countries.
The payment forms vary for each supplier. It ranges from Letter of Credit, drawn against payment, down
payment, and various credit terms offered by supplier
Customers
RFM Corporation has a wide range of products that cater to all socio-economic class and all age groups.
Its products are sold through hypermarkets, supermarkets, groceries, convenience stores, drug stores,
wholesalers, distributors, institutional customers, food establishments, wet market and the company store.
RFM Corporation is not dependent on any single or few customers that might have any material adverse effect
on its business, except for the processing and exclusive sale of hamburger buns by Interbake Commissary
Corporation to Golden Arches (Mc Donalds). These hamburger buns account for about 85% of the total sales of
Interbake Commissary Corporation in 2012 and 48% in 2011.
Related Party Transactions
The Group, in the regular course of business, transact with related parties, which may consist but not limited to
the following:
• Purchase of goods and services.
• Cash advances for working capital purposes.
• Lease of the Company’s main office from a subsidiary company.
• The Parent Company provides management services to RFM Insurance Brokerage, Inc. and Interbake
Commissary Corporation
• Distribution, sale and merchandising of RFM Group products.
Trademark, Royalty and Patents
A Trademark License Agreement was entered into with Unilever-RFM Ice Cream, Inc. for the exclusive right to
use the “Selecta” trademarks in its ice cream products and to manufacture, market, and sell Selecta
trademarked products. The agreement shall be co-terminus with the Joint Venture Agreement between RFM
Corporation and Unilever-RFM Ice Cream, Inc. The license is free from royalty fee and any similar kind of
payment. On December 3, 2008, the Trademark License Agreement was extended for another ten (10) years,
or from March 30, 2009 to March 29, 2019.
On 01 January 1995, RFM entered into a Trademark License Agreement with Sunkist Growers, Inc. (Sunkist).
Under the said agreement, Sunkist grants RFM (a) exclusive right, without the right to sublicense, to use the
Sunkist Trademark(s) and related Trade dress approved by Sunkist, in connection with the marketing,
distribution and sale of licensed products in the Philippines; (b) exclusive right, without the right to sublicense,
to use the Know-How within the Philippines for the production and sale of Licensed Products; (c) the right and
privilege to receive technical assistance regarding the implementation of Know-How; and (d) to make available
Base Ingredients directly or through authorized Base Ingredients Suppliers to enable RFM to manufacture
Licensed Products. For and in consideration of the rights granted above, RFM pays an annual royalty to Sunkist.
The Amendment to the TLA was extended for another five (5) years or from 01 January 2005 to 31 December
2009. Another Amendment extending the TLA for another five years was signed by the Parties on 27 January
2010.
On 13 March 2009, Swift Foods, Inc. (SFI) re-assigned and returned to RFM all its rights and interests in the
well-known Swift trademark. IPO registration of the mark has been transferred under RFM and a new
Certificate of Registration has accordingly been issued to RFM.
In late 2012, RFM entered into a Trademark and Asset Purchase Agreement with The Pacific Meat Company,
Inc. (PMCI). The terms of this agreement includes RFM’s sale of the “Swift” brand, together with finished
goods and raw material inventories, the goodwill of the business connected with the trademarks used for its
canned, pouch flexible heat sterilized, refrigerated, chilled and frozen meat products, and certain machinery
and equipment, as well as all product formulations, processes, know-how and other technical information
relating to the production of meat products.
Need for Any Government Approval of Principal Products and Compliance with Environmental Laws
The Group complies with environmental laws and secures government approval for all its products. The
Company has existing permits from various government agencies that include the Bureau of Food and Drug
(BFAD) and the City Environment and Natural Resources Office. The Company also complies with the
requirements of Laguna Lake Development Authority (LLDA) for environmental sanitation purposes.
The Company believes that it has complied with all applicable environmental laws and regulations, and
incurred about P382,000 and P360,000 during the years 2012 and 2011, respectively, for payment of annual
permits and fees.
The Group has no knowledge of recent or impending legislation, the implementation of which can result in a
material adverse effect on the business or financial condition.
Research and Development Activities
The Company conducts research and development activities to improve existing products and to create new
product lines, as well as to improve production processes, quality control measures, and packaging to meet the
continuing and changing demands of the consumers at the least possible cost. The Company spent about P14.5
million and P15 million in 2012 and 2011 respectively, for research and development.
Employees
As of December 31, 2012, the Company and its subsidiaries had approximately 570 employees, of which 16 are
executives, 45 managers and 133 supervisory staff and 376 were non-supervisory staff. The Company does not
anticipate any significant increase in the number of its employees in year 2013.
About 24% of the total employees of the Company and its subsidiaries are members of various labor unions.
The Company and its subsidiaries have collective bargaining agreements with these unions.
The Company believes that its relationship with its employees is generally good. The Company has not recently
experienced any material interruption of operations due to labor disagreements. Labor-Management Councils
(LCMs) regularly meet to discuss and resolve work-place issues and production matters.
The employees are covered by retirement plans per division. The plans are trusteed, noncontributory defined
benefit pension plan covering substantially all permanent employees of the Company. The Company has no
stock option plan.
With the sale of its “Swift” brand and related machineries during the last quarter of 2012, the Company and its
meat subsidiary, CMPC, had no choice but to retrench affected employees.
Effective May 2013, the Tetra operations in Manggahan, Pasig City will be moved to CMPC Light Industrial
Plant, Cabuyao, Laguna resulting to the transfer of the remaining MJ employees. However, the Company
offered a voluntary retirement program to qualified MJ rank and file employees who opted not to join the
transfer.
Except for the affected employees in MJ and some remaining employees in Meat, the Company and its
subsidiaries do not expect any significant change in its existing workforce level within the ensuing twelve (12)
months.
Working Capital
The Company funds its working capital requirements through internally-generated funds and from bank
borrowings. The working capital finances the purchase of raw materials, inventory, salaries, administrative
expenses, tax payments, and sales receivables until such sales receivables are converted into cash.
Major Business Risks
Like any other business, risks are always considered in the ability or inability to achieve the business objectives
and execute strategy effectively. RFM Corporation and its subsidiaries perceive the following business risks:
Financial Risk Management Objectives and Policies
The Group’s principal financial instruments include non-derivative instruments such as cash and cash
equivalents, AFS financial assets, accounts receivable, bank loans, accounts payable and accrued liabilities,
long-term debts and obligations and advances to and from related parties. The main purpose of these financial
instruments includes raising funds for the Group’s operations and managing identified financial risks. The
Group has various other financial assets and financial liabilities such as other current receivables, other current
assets, trust receipts payable and customers’ deposits which arise directly from its operations. The main risk
arising from the use of financial instruments is credit risk, liquidity risk, interest rate risk, foreign exchange risk
and equity price risk.
Credit risk
Credit risk arises from the risk of counterparties defaulting. Management is tasked to minimize credit risk
through strict implementation of credit, treasury and financial policies. The Group deals only with reputable
counterparties, financial institutions and customers. To the extent possible, the Group obtains collateral to
secure sales of its products to customers. In addition, the Group transacts with financial institutions belonging
to the top 25% of the industry, and/or those which provide the Group with long-term loans and/or short-term
credit facilities.
The Group does not have significant concentrations of credit risk and does not enter into financial instruments
to manage credit risk. With respect to credit risk arising from financial assets other than instalment contracts
and accounts receivable (such as cash and cash equivalents and AFS financial assets), the Group's exposure to
credit risk arises from default of the counterparties, with a maximum exposure equal to the carrying amount of
these instruments.
Credit quality of cash in banks and cash equivalents and AFS financial assets are based on the nature of the
counterparty and the Group’s internal rating system.
Financial assets that are neither past due nor impaired are classified as “Excellent” account when these are
expected to be collected or liquidated on or before their due dates, or upon call by the Group if there are no
predetermined defined due dates. All other financial assets that are neither past due or impaired are classified
as “Good” accounts.
Liquidity risk
Liquidity risk arises from the possibility that the Group may encounter difficulties in raising fund to meet
commitments from financial instruments.
Management is tasked to minimize liquidity risk through prudent financial planning and execution to meet the
funding requirements of the various operating divisions within the Group; through long-term and short-term
debts obtained from financial institutions; through strict implementation of credit and collection policies,
particularly in containing trade receivables; and through capital raising, including equity, as may be necessary.
Presently, the Group has existing long-term debts that fund capital expenditures. Working capital
requirements, on the other hand, are adequately addressed through short-term credit facilities from financial
institutions. Trade receivables are kept within manageable levels.
Interest rate risk
The Group’s exposure to changes in interest rates relates primarily to the Group’s short-term and long-term
debt obligations.
Management is tasked to minimize interest rate risk through interest rate swaps and options, and having a mix
of variable and fixed interest rates on its loans. Presently, the Group’s short-term and long-term debts and
obligations are market-determined, with the long-term debts and obligations interest rates based on PDST-F-1
plus a certain spread.
There is no other impact on the Group’s equity other than those affecting the profit or loss.
Foreign exchange risk

The Group’s exposure to foreign exchange risk results from the Parent Company and URICI’s business
transactions and financing agreements denominated in foreign currencies.
Management is tasked to minimize foreign exchange risk through the natural hedges arising from its export
business and through external currency hedges. Presently, trade importations are immediately paid or
converted into Peso obligations as soon as these are negotiated with suppliers. The Group has not done any
external currency hedges in 2012 and 2011.
Equity price risk
Equity price risk is such risk where the fair values of investments in quoted equity securities could decrease as a
result of changes in the levels of equity indices and the value of individual stock. Management strictly monitors
the movement of the share prices pertaining to its investments. The Group is exposed to equity securities price
risk because of quoted common and golf club shares, which are classified as AFS financial assets (see Note 12).
Market risks
Market risks stems from new and/or existing re-launched products and/or new packaging at low prices being
introduced in the market place by competitors. To address these competitive pressures, the Company
continues to develop new products in innovative packaging formats to keep a hold on its consumers and
increase market share. The strategy requires significant resources for market research, product development,
and marketing and promotions. Attendant risks are inventory overstocks, spoilage, and warehousing cost if the
new product launched in the market fails to take off. To manage these risks the Company has established a
system where success indicators in the target market are closely being monitored and supported by effective
supply chain management.
Technological changes
RFM Corporation has been in the flour manufacturing for several decades, and its operating mills are older than
many of its competitors which have more modern equipment and, thus, better rated operating yields. To meet
these challenges, the Company continues to provide sufficient repairs and maintenance on its equipment and
continually upgrades sections of its facilities to remain at par with the modern machineries. Recent installations
are a Buhler blending system which allowed for more efficiency in product mixing and customization; and a
Buhler carousel packing and weighing system provides very accurate weighing of flour in bags. In addition, the
Company spends in research and development, particularly in the areas of process engineering and wheat
mixtures to produce higher flour yields.
In 2008, the Company invested in a new Buhler C-line Pasta Machine to service its growing market in the
spaghetti noodles, under the Fiesta brand. The machine incorporates the patented Polymatik Extrusion
Technology, which is presently one of the most advanced in raw material mixing processes, and produces pasta
that is firmer, brighter, and with excellent heat tolerance.
Improvements, upgrades, and regular maintenance and repairs of its Aseptic Production Line allow the Milk
and Juice Division to produce good quality ready-to-drink milk and chocolate-flavored milk as well as fruit juices
under the Selecta and Sunkist brands. In 2008 and 2009, investments were made in automated PET bottle
injection, blowing, filling, and packing facilities to cater to a newly developing packaging format for juice and
tea drinks.
Technological advances in manufacturing sector contributed to hectic product competition in the market, RFM
recognizes the need to update its technology for a more reliable quality and higher productivity. In 2011 and
2012, the Milk and Juice Division invested in improving and replacing its line instrumentation system which
resulted to a fast and more accurate product quality monitoring which ensures that every package conforms to
the quality standards.
Collaboration with technical experts in the field of food science and technology as well as manufacturing has
been extended to foreign and local business partners to be updated in the latest food trends, equipment and
raw materials sourcing. It has its sources of technology information via attendance to seminars, conferences,

conventions, journal subscription and internet access to further enhance its research and development skills
and manufacturing processes.
Labor Unrest
Like other firms in the food and beverage industry, RFM also partakes of the usual risk of labor unrest, and
strikes.
The pending cases are those which are related to the retrenchment of 116 trade merchandisers in 2006.
Eventually, three (3) separate groups of employees and three (3) individuals filed separate complaints for illegal
dismissal. Two cases were settled in 2012, but a small group of complainants who received financial
settlement questioned the settlement in one case. This was dismissed by the NLRC and the case is now
pending with the Court of Appeals. One case was dismissed due to prescription.
As of December 31, 2012, there were two pending cases in the Supreme Court and another case pending in the
National Labor Relations Commission. All the said cases are currently being handled by external counsel
specializing on labor matters on behalf of the Company.
.
Item 2 – Properties
RFM Corporation owns a flour milling plant with a daily rated capacity of 980 metric tons per day, and is
located in Barangay Pineda, Pasig City. A pasta plant with a rated capacity of 3,000 kgs (Input) per hour is also
located at RFM Pioneer Plant, Barangay Pineda, Pasig City. A milk and juice plant is located in Manggahan,
Pasig City, and has a rated capacity of 9.7 million packs per month. The milk and juice Tetra plant currently has
four (4) production lines, of which two (2) are owned and two (2) are under financing lease. Lines are running
at 15 hours operation per line for 25 days. The 2 PET lines are completely owned by RFM, with combined
production capacity of 12000 cases a day at 26 days operation per month and are located in Cabuyao, Laguna.
Wholly owned food subsidiary Interbake Commissary Corporation owns a margarine plant with a capacity of
23MT per day located in Pioneer, Pasig City.
Invest Asia Corporation, a 96% owned subsidiary, owns the RFM head office building and land the building is
built on.
In accordance with various loan agreements, the Company and its subsidiaries are restricted from performing
certain corporate acts without the prior approval of the creditors, the more significant of which relate to
entering into a corporate merger or consolidation, acting as guarantor or surety of obligation and acquiring
treasury stocks. The Company and its subsidiaries are also required to maintain certain financial ratios. As of
December 31, 2012, the Company is in compliance with terms and conditions of these agreements.
A. Flour Division:
Description LOCATION CONDITION
Land – 28,951 sq. m. Pineda, Pasig City
Flour Mills Plant/Building/Silos/
Warehouse
Pineda, Pasig City In good condition
Flour Mills-Furniture & Office
Equipment
Pineda, Pasig City In good condition
Flour Mills - Machinery and
Equipment
Pineda, Pasig City With a capacity of 980 metric tons per day
B. Pasta Contract Manufacturing Division

Description LOCATION CONDITION
Land - 2,356 sq. m. Pineda, Pasig City In good condition
Pasta Plant/Office/Conference
Room/Die Washing Room
Pineda, Pasig City In good condition
Pasta Plant – Furniture & Office
Equipment
Pineda, Pasig City In good condition
Pasta Plant – Long goods line Pineda, Pasig City With a capacity of 3,000 kgs per hour
Pasta Plant – Short goods line Pineda, Pasig City Will become operational in August 2013
C. Milk and Juice Division:
Owned Properties
Description LOCATION CONDITION
Land -20,002 SQ.M
SDD Warehouse
Manggahan, Pasig City
Milk & Juices Tetra Machines Manggahan, Pasig City In good condition
Pioneer Business Park Building Fairlane, Pasig City Two (2) storey Building
Pet Line Machines Cabuyao, Laguna With capacity of 4 million bottles per month
Leased Properties
Description LOCATION CONDITION Expiration Date TERMS OF
RENEWAL
M& J Plant
Warehouse (URICI)
Manggahan, Pasig
City
Leased Property Yearly Automatic
Renewal
D. Cabuyao Meat Processing Corporation
Description LOCATION CONDITION
Land & Improvements Cabuyao, Laguna In good working condition
Building & Improvements Cabuyao, Laguna In good working condition
Machinery & Equipment Cabuyao, Laguna In good working condition
E. Interbake Commissary Corporation:
Description LOCATION CONDITION
Bun Line Fairlane, Pasig City With capacity of 2200 dozen per hour by end of
2012; capacity to increase to 3000 dozens per
hour by August 2013
Muffin Line Fairlane, Pasig City With capacity of 600 dozens per hour
Private Label Fairlane, Pasig City With capacity of 6 tons per day
Margarine Plant Fairlane, Pasig City With capacity of 8 tons a day
F. Invest Asia Corporation
RFM Building
Corner Pioneer & Sheridan
Streets, Mandaluyong City
Eight (8)-storey building with Penthouse
Item 3 – Legal Proceedings
Lawsuits and legal actions are in the ordinary course of the Company’s business. However, the Company or any
of its subsidiaries is not currently involved in any material pending litigation or legal proceeding that could be
expected to have a material adverse effect on the Company’s financial position or its result of operations.

Item 4 – Submission of Matters to a Vote of Security Holders
There were no matters submitted to a vote of security holders during the fourth quarter of this calendar year
covered by this report.
V. DIRECTORS AND EXECUTIVE OFFICERS
(a) The following nominees for the Directors are also the incumbent directors of the Corporation:
(1) List of Directors, Including Independent Directors, and Executive Officers as of 30 April 2013
Name of Director/
Executive Officer
Position
Age
Term as
Director
Jose S. Concepcion Jr. Chairman of the Board, Chairman,
Nomination Com.
81 30
Ernest Fritz Server Vice Chairman, Chairman, Investment Com.,
Member, Compensation Com.
69 24
Jose Ma. A. Concepcion III Director/President & CEO 54 26
Joseph D. Server Director, Member, Audit Com. & Investment
Com.
72 33
Felicisimo M. Nacino Jr. Director/EVP & COO, Member, Audit Com. 60 17
John Marie A. Concepcion Director/Managing Director, Ice Cream,
Member, Audit Com.
51 25
Ma.Victoria Herminia C. Young Director/VP & GM, White King Division & ICC 53 6
Francisco A. Segovia Director, Member, Investment Com. 59 26
Raissa H. Posadas Director, Member, Compensation Com. &
Nomination Com.
52 15
Romeo L. Bernardo Independent Director, Chairman,
Compensation Com., Member, Investment
Com., Nomination Com. & Audit Com.
58 10
Lilia R. Bautista Independent Director, Chairman, Audit Com.,
Member, Investment Com.
77 6
Rowel S. Barba Corporate Secretary/VP & Head, Corporate
Legal & HR Division
48 NA
Norman P. Uy SVP & GM, Flour Based Group 54 NA
Ramon M. Lopez VP & Exec. Assistant to the President & CEO
and concurrent Head, Corporate Planning
52 NA
Minerva C. Laforteza VP, CFO, Treasurer & Head, Management
Accounting
48 NA
Ariel A. de Guzman VP, Internal Audit 49 NA
Philip V. Prieto VP, Corporate Purchasing & General Services 54 NA
Eduardo M. Policarpio VP & Head of Sales 51 NA
Melchor B. Bacsa VP & Head of Operations 52 NA
Charmaine C. Bautista VP & Marketing Manager, BFG 38 NA
Susan A. Atienza AVP, Research & Development, Flour Based
Group
55 NA
Faye Christine B. Matriano AVP, Marketing Manager, WK 38 NA
As provided in the Company’s amended Articles of Incorporation, eleven (11) directors were elected to its
Board of Directors during the last Annual Stockholders meeting. The officers, on the other hand, were elected
during the Organizational Meeting following the Annual Stockholders’ meeting, each to hold office until the

corresponding meeting of the Board of Directors in the next year or until a successor shall have been qualified
and elected or appointed.
The Company’s Board of Directors has committees for Audit, Compensation, Nomination, and Investment.
There are two (2) independent directors, one of whom is the Chairman of the Audit Committee and the other
heads the Compensation Committee.
The following sets forth certain information as to the directors and executive officers of the Company as of
April 30, 2013:
Directors
Jose S. Concepcion, Jr.
81 years old
Filipino
Born on 29 December 1931, has an Associate’s degree in Business Administration from De La Salle University
and a Bachelor’s degree in Agriculture from Araneta University. He is the Chairman of the Board of Directors of
RFM Corporation and of Swift Foods, Inc. at the same time Chief Executive Officer. He also holds the Chairman
position in the Asean-Business Advisory Council – Philippines, and East-Asia Business Council - Philippines. He
is the Founding Chairman of the National Citizens Movement for Free Elections (NAMFREL), Special Resource
Person of UCPB CIIF Finance Development. He is a member of the Board of Directors of Philtown Properties,
Inc. (formerly Philippine Townships, Inc.), and Member of the Board of Trustees of CARITAS and RFM
Foundation, Inc. He was previously the Secretary of the Department of Trade and Industry, Chairman of the
Board of Investments, member of the Central Bank Monetary Board from 1986-1991, Co-Chairman of Bishops-
Businessmen Conference from 1991-1998, and a delegate to the 1971 Constitutional Convention. He served as
director of the Corporation from years 1970 to 1985 and was first elected on 3 April 1997 as Chairman of the
Board. He is also the Chairman of the Nomination Committee of RFM Corporation.
Ernest Fritz Server
69 years old
Filipino
Born on 08 July 1943, has a Bachelor of Arts degree in Economics from the Ateneo de Manila University and a
Master’s degree in Business Administration from the Wharton School of the University of Pennsylvania. He is
Vice Chairman of the Board of Directors of RFM Corporation. He is also a Vice Chairman of Philtown Properties,
Inc., and a Director of RFM Equities, Inc. and RFM Foundation, Inc. He is the President of Superior Las Pinas,
Inc., Westview Properties, Inc., Capital Mediaworks, Inc. Multimedia Telephony, Inc. (Broadband Philippines)
and Seacage Industries, Inc. He is a member of the Board of Directors of BJS Development Corporation, Phil
Stratbase Consultancy, Inc. and Chairman of Arrakis Holding, Inc. He was the President of Philam Fund,
Philippine Home Cable Holdings, Inc., Trans-Pacific Properties, Inc. and United Housing Corporation. He became
the Chairman of Intercity Properties, Inc. and Vice Chairman of Commercial Bank of Manila, Consumer Bank,
Cosmos Bottling, Co. He also served as a Director of Farmingtown, Rizal Lighterage Corporation, RFM Insurance
Brokers, Inc. and Psi Technologies. He first became a director of the Corporation on 27 October 1988. He is also
the Chairman of the Investment Committee and a member of the Compensation Committee of RFM
Corporation.
Jose Ma. A. Concepcion III
54 years old
Filipino
Born on 23 June 1958, has a Bachelor's degree in Business Management from Dela Salle University. He is the
President and Chief Executive Officer of the Corporation. In 2005, he was appointed by the President of the
Philippines as the Presidential Consultant for Entrepreneurship which he held until 2010. He is the Chairman of
the Board of Directors of Cabuyao Meat Processing Corporation, Interbake Commissary Corporation, RFM
Equities, Inc., RFM Insurance Brokers, Inc., FWBC Holdings, Inc., Filipinas Water Bottling Company, Inc.,
Unilever RFM Ice Cream, Inc.(formerly Selecta Walls, Inc.), He is a director of Concepcion Industries Inc., the
largest air-conditioner and refrigerator manufacturer in the country. He was an awardee of the Ten
Outstanding Young Men of the Philippines (TOYM) in 1995 and Time Global 100 List of Young Leaders for the
New Millennium in 1994. He is associated with major business and industry and various socio-civic
associations. He is the founding Trustee of the Philippine Center for Entrepreneurship-Go Negosyo. He first
became a director of the Corporation on 30 October 1986 and was elected President and Chief Executive
Officer in 1989.
Joseph D. Server Jr.
72 years old
Filipino
Born on 08 October 1940, has a Bachelor of Arts degree in Economics from the Ateneo de Manila University
and a Master’s degree in Business Administration from the Wharton School of the University of Pennsylvania in
the United States. He is Chairman of the Board of BJS Development Corporation. He first became a director of
the Corporation on 30 August 1979. He is presently a member of the Audit and Investment Committees of RFM
Corporation.
Felicisimo M. Nacino, Jr.
61 years old
Filipino
Born on 09 May, 1952, has a Bachelor of Arts degree in Economics and a Master’s degree in Business
Administration, both from the University of the Philippines. He is the Executive Vice-President & Chief
Operating Officer of the Corporation and serves as Director of RFM Corporation, Unilever RFM Ice Cream Inc.,
RFM Insurance Brokers, Inc., Conglomerate Securities & Financing Corporation, and other companies in the
RFM Group. He first became a director of RFM Corporation on 30 March 1995. He is also a member of the
Audit Committee of the Corporation.
John Marie A. Concepcion
51 years old
Filipino
Born on 13 January 1962, has a degree in Business Administration from Seattle University, Washington, U.S.A.
He is the Chief Executive Officer & Managing Director of Unilever RFM - Ice Cream Inc. He is also a director
and treasurer of Selecta Walls Land Corporation (SWLC).He became a director of the RFM Corporation on 29
October 1987.
Ma. Victoria Herminia C. Young
53 years old
Filipino
Born on 4 August 1959, has a Bachelor of Science Degree in Management and Marketing from Assumption
College in 1981. She is currently the General Manager of Interbake Commissary Corporation and Vice
President of White King Division, a division in the Branded Food Group of the Corporation. She is a Trustee and
President of RFM Foundation, Inc., Trustee of Soul Mission Org., Ronald McDonald House of Charities and a
Director of Interbake Commissary Commission. He became a director of the RFM Corporation on 27 September
2006.
Francisco A. Segovia
59 years old
Filipino
Born on 17 January 1954, has a Bachelor of Science degree in Business Management from the Ateneo De
Manila University. He is President of Segovia & Corporation, Inc., Fritz International Philippines, Inc.,
Horseworld, Inc., Big A. Aviation Corporation, Intellicon, Inc., Regina Realty/Chilco Holdings, Araneta Institute of
Agriculture, Republic Dynamics Corporation and Republic Consolidated Corporation. He is a director of, RFM
Insurance Brokers, Inc., RFM Equities, Inc., and Philtown Properties, Inc. (formerly Philippine Townships, Inc.).
He first became a director of the RFM Corporation on 30 October 1986. He is also a member of the Investment
Committee of the Corporation.
Raissa Hechanova Posadas
52 years old
Filipino
Born on 16 April 1960, has a Master's degree in Business Administration from Imede (now IMD) Lausanne,
Switzerland and a degree in Bachelor of Arts major in Applied Economics from De La Salle University. She
joined the Corporation as director in April 1997, replacing her father, Mr. Rafael G. Hechanova, former
Chairman of the Board of Directors of RFM Corporation. She is a member of the Compensation and
Nomination Committees of the Corporation.
Romeo L. Bernardo
58 years old
Filipino
Born on 5 September 1954, Mr. Bernardo received a Bachelor of Science degree in Business Economics from
the University of the Philippines (Magna Cum Laude) and a Masters Degree in Development Economics from
Williams College, Mass. USA. He has had a varied career in public institutions before he co-founded LBT (with
former Energy Secretary Del Lazaro and corporate lawyer Helen Tiu) in 1997. His public sector work spans
teaching finance at the state university, a career in the Department of Finance rising to the Undersecretary
post , and working in multilateral institutions such as the IMF and the World Bank, based in Washington DC, as
well as the ADB in Manila. Presently, he provides business advice as board director in leading listed Philippine
companies such as ALFM family of funds (Chairman), Bank of the Philippine Islands, Globe Telecom, Aboitiz
Power, National Reinsurance Corporation of the Philippines, Philippine Investment Management (PHINMA)
Inc., and Institute of Development and Econometric Analysis, Inc. He Also does/has done policy advisory for
multilateral and bilateral institutions and he Philippine government in public finance, capital markets, public-
private partnership, pension reform, economic governance. He is the lead Philippine partner/advisor to Global
Source Partners, a global network of independent analysts. He first became an independent director of RFM
Corporation on 25 September 2002. He is presently the Chairman of the Compensation Committee and
member of the Audit, Investment and Nomination Committees of RFM Corporation.
Lilia R. Bautista
77 years old
Filipino
Born on 16 August 1935, Filipino is an Independent Director of the Company since September 2006. She is also
an independent director of Transnational Diversified Group and a professional lecturer at the Philippine Judicial
Academy. Recently, she was appointed as Dean of the College of Law of Jose Rizal University. She previously
held several positions including as a Member of the Appellate Body of the World Trade Organization, Chairman,
Securities and Exchange Commission, Ex-Officio Member, Anti-Money Laundering Council, Senior DTI
Undersecretary & Special Trade Negotiator and subsequently acting DTI Secretary. Ex-officio member of the
Monetary Board, Chairman of the Board of Investments, National Development Company and other DTI
agencies. Thereafter, she was appointed Ambassador to the United Nations and other international agencies in
Geneva, Switzerland. She holds an L.L.B., University of the Philippines, LLM, University of Michigan (Dewitt
Fellow), M.B.A., University of the Philippines, and attended special courses in corporate finance and
reorganization, New York University and Investment negotiation course, Georgetown University. She is
presently the Chairman of the Audit Committee and a member of the Investment Committee of RFM
Corporation.
Executive Officers
Management is comprised of owner-managers and professional managers. Mr. Jose Maria A. Concepcion III is
the President and Chief Executive officer of RFM Corporation, and is also a major shareholder. He joined the
Company in 1980 as a route salesman, and occupied positions in sales and marketing before he became
President and Chief Executive Officer in 1989.
Norman P. Uy
54 years old
Filipino
Born on 23 December 1958, has a Bachelor of Arts Degree in Philosophy from the University of the Philippines
and was awarded “Athlete of the Year” in 1980. Prior to joining RFM Corporation, he was Assistant to the Vice
President of Marketing at CFC-URC, then held the position of Operations Manager for Robinsons Commercial
Complex, and was Project Coordinator for ADMACOR based in Indonesia. He is currently Senior Vice President
& General Manager, Flour Based Group. He joined RFM in 1989 as General Services Division Manager.
Ramon M. Lopez
52 years old
Filipino
Born on 26 October 1960, has a Bachelor of Arts degree major in Economics from U.P School of Economics and
a Masters Degree in Economics at Williams College, Massachusetts, U.S.A. He is a member of the Board of
Directors of Phil. Chamber of Food Manufacturers. He is currently Vice President & Executive Assistant to the
President and CEO, and concurrent Head, Corporate Planning. He joined the Corporate Planning Department
of RFM Corporation in 1994.
Rowel S. Barba
48 years old
Filipino
Born on 13 May 1964, has a Bachelor of Arts degree major in Political Science and Bachelor of Laws degree,
both from the University of the Philippines (Diliman). Prior to joining the Corporation, he was the Corporate
Secretary, Director, Member of the Management Committee and Chief Legal Counsel and Head of the Legal
Division of Jaka Investments Corporation. While with Jaka, he also served as the Corporate Secretary and
director in various subsidiaries and affiliates, and the Operating Unit Head of the Transport Division. He was
the former Governor for Southern Luzon of the Integrated Bar of the Philippines and Legal Counsel of the
Philippine Practical Shooting Association. He is currently the Vice President and Head of Corporate Legal
Division of the Corporation. He is also the Corporate Secretary of RFM Insurance Brokers, Inc. and Rizal
Lighterage Corporation. He joined RFM Corporation in April 2007.
Minerva C. Laforteza
48 years old
Filipino
Born on 9 March 1965, has a Bachelor of Science degree in Business Administration and Accountancy and a
Masters degree in Business Administration from the University of the Philippines. She joined RFM Corporation
in 1989 as Accounting Supervisor. She is currently the Vice-President & Head, Management Accounting
Ariel A. de Guzman
49 years old
Filipino
Born on 5 March 1964, a CPA and a graduate of Bachelor of Science in Commerce major in Accounting from
Imus Institute. He joined RFM Corporation in 1988 as a financial analyst and rose the ranks to become the
Corporate Accounting Manager of the RFM Group of Companies. He later joined Philtown Properties Inc, then
a subsidiary of RFM Corporation, as AVP Controller from 2006 to 2010. Then in August 2010, he rejoined RFM
Corporation as Vice President of the Internal Audit department. He is also currently the director of
Conglomerate Securities & Financing Company, as well as the RDC Holdings Inc.
Philip V. Prieto
54 years old
Filipino
Born on 20 August 1958, has a Bachelors of Arts degree from the University of San Francisco. He is the VP,
Corporate Procurement and Materials Management. He joined the corporation in 1995 as the Purchasing
Manager of Cosmos Bottling Corporation when this was still owned by RFM Corporation.
Susan A. Atienza
55 years old
Filipino
Born on 2 May 1957, has a Bachelor of Science Degree in Food Technology from the Philippine Women’s
University. She was the Plant Manager at Leslie Corporation from 1979 to 1987. She held the position of R&D
Manager for Branded Snacks of San Miguel Mills, Inc. from 2003 to 2009. She initially joined RFM Corporation
in 1987 until 2001 as R&D Manager of the Bakery Group and re-joined the company in December 2009 as
Assistant Vice President - Research & Development of the Flour Based Group.
Eduardo M. Policarpio
51 years old
Filipino
Born on 25 September 1961, has a Bachelor of Science Degree in Medical Technology from the University of
Santo Tomas. He was the District Manager of Merck Pharmaceuticals after passing the board in 1983. Prior to
joining RFM Corporation, he was with Universal Robina Corporation from 1995 to 2010 and held the position of
National Sales Director – Beverage Group for 2.5 years. He joined RFM in December 2010 as Vice President and
Head of Sales.
Melchor B. Bacsa
52 years old
Filipino
Born on 6 January 1961, a Licensed Chemical Engineer, has a Bachelor of Science Degree in Chemical
Engineering from the Adamson University. Prior to joining RFM Corporation, he was the Director for
Operations, Branded Consumer Foods Division from 2008 to 2010 at Universal Robina Corporation, where he
started his career in 1983. He also held top positions in professional organizations namely Production
Management Association of the Philippines (PROMAP) and First Cavite Industrial Estate Association (FCIEA). He
joined the company in January 2011 as Vice President and Head of Operations.
Charmaine C. Bautista
38 years old
Filipino
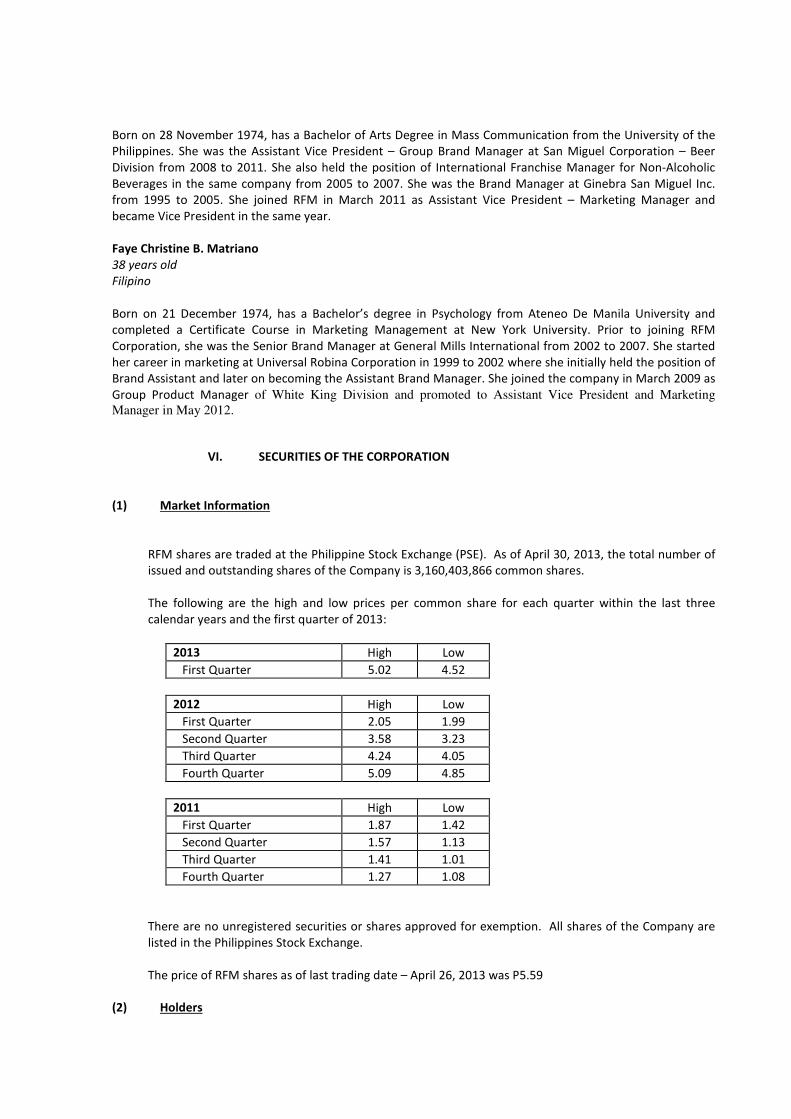
Born on 28 November 1974, has a Bachelor of Arts Degree in Mass Communication from the University of the
Philippines. She was the Assistant Vice President – Group Brand Manager at San Miguel Corporation – Beer
Division from 2008 to 2011. She also held the position of International Franchise Manager for Non-Alcoholic
Beverages in the same company from 2005 to 2007. She was the Brand Manager at Ginebra San Miguel Inc.
from 1995 to 2005. She joined RFM in March 2011 as Assistant Vice President – Marketing Manager and
became Vice President in the same year.
Faye Christine B. Matriano
38 years old
Filipino
Born on 21 December 1974, has a Bachelor’s degree in Psychology from Ateneo De Manila University and
completed a Certificate Course in Marketing Management at New York University. Prior to joining RFM
Corporation, she was the Senior Brand Manager at General Mills International from 2002 to 2007. She started
her career in marketing at Universal Robina Corporation in 1999 to 2002 where she initially held the position of
Brand Assistant and later on becoming the Assistant Brand Manager. She joined the company in March 2009 as
Group Product Manager of White King Division and promoted to Assistant Vice President and Marketing Manager in May 2012.
VI. SECURITIES OF THE CORPORATION
(1) Market Information
RFM shares are traded at the Philippine Stock Exchange (PSE). As of April 30, 2013, the total number of
issued and outstanding shares of the Company is 3,160,403,866 common shares.
The following are the high and low prices per common share for each quarter within the last three
calendar years and the first quarter of 2013:
2013 High Low
First Quarter 5.02 4.52
2012 High Low
First Quarter 2.05 1.99
Second Quarter 3.58 3.23
Third Quarter 4.24 4.05
Fourth Quarter 5.09 4.85
2011 High Low
First Quarter 1.87 1.42
Second Quarter 1.57 1.13
Third Quarter 1.41 1.01
Fourth Quarter 1.27 1.08
There are no unregistered securities or shares approved for exemption. All shares of the Company are
listed in the Philippines Stock Exchange.
The price of RFM shares as of last trading date – April 26, 2013 was P5.59
(2) Holders
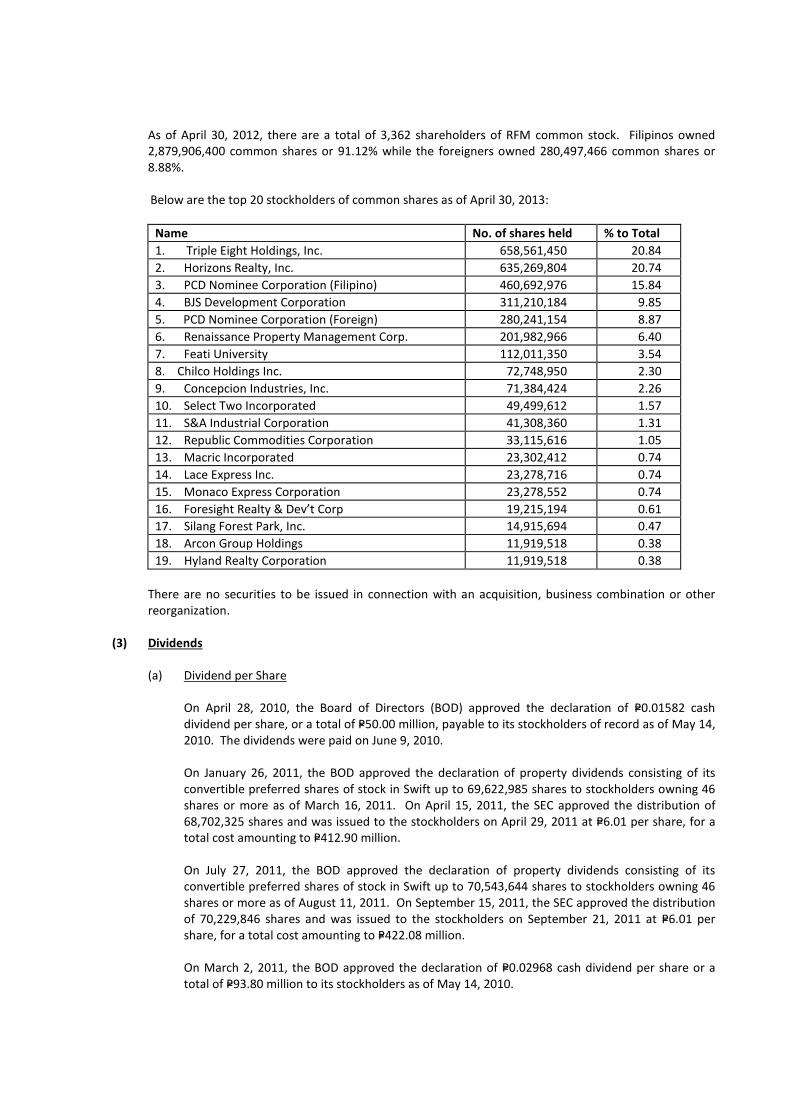
As of April 30, 2012, there are a total of 3,362 shareholders of RFM common stock. Filipinos owned
2,879,906,400 common shares or 91.12% while the foreigners owned 280,497,466 common shares or
8.88%.
Below are the top 20 stockholders of common shares as of April 30, 2013:
Name No. of shares held % to Total
1. Triple Eight Holdings, Inc. 658,561,450 20.84
2. Horizons Realty, Inc. 635,269,804 20.74
3. PCD Nominee Corporation (Filipino) 460,692,976 15.84
4. BJS Development Corporation 311,210,184 9.85
5. PCD Nominee Corporation (Foreign) 280,241,154 8.87
6. Renaissance Property Management Corp. 201,982,966 6.40
7. Feati University 112,011,350 3.54
8. Chilco Holdings Inc. 72,748,950 2.30
9. Concepcion Industries, Inc. 71,384,424 2.26
10. Select Two Incorporated 49,499,612 1.57
11. S&A Industrial Corporation 41,308,360 1.31
12. Republic Commodities Corporation 33,115,616 1.05
13. Macric Incorporated 23,302,412 0.74
14. Lace Express Inc. 23,278,716 0.74
15. Monaco Express Corporation 23,278,552 0.74
16. Foresight Realty & Dev’t Corp 19,215,194 0.61
17. Silang Forest Park, Inc. 14,915,694 0.47
18. Arcon Group Holdings 11,919,518 0.38
19. Hyland Realty Corporation 11,919,518 0.38
There are no securities to be issued in connection with an acquisition, business combination or other
reorganization.
(3) Dividends
(a) Dividend per Share
On April 28, 2010, the Board of Directors (BOD) approved the declaration of P=0.01582 cash
dividend per share, or a total of P=50.00 million, payable to its stockholders of record as of May 14,
2010. The dividends were paid on June 9, 2010.
On January 26, 2011, the BOD approved the declaration of property dividends consisting of its
convertible preferred shares of stock in Swift up to 69,622,985 shares to stockholders owning 46
shares or more as of March 16, 2011. On April 15, 2011, the SEC approved the distribution of
68,702,325 shares and was issued to the stockholders on April 29, 2011 at P=6.01 per share, for a
total cost amounting to P=412.90 million.
On July 27, 2011, the BOD approved the declaration of property dividends consisting of its
convertible preferred shares of stock in Swift up to 70,543,644 shares to stockholders owning 46
shares or more as of August 11, 2011. On September 15, 2011, the SEC approved the distribution
of 70,229,846 shares and was issued to the stockholders on September 21, 2011 at P=6.01 per
share, for a total cost amounting to P=422.08 million.
On March 2, 2011, the BOD approved the declaration of P=0.02968 cash dividend per share or a
total of P=93.80 million to its stockholders as of May 14, 2010.
On July 27, 2011, the BOD approved the declaration of P=0.02965 cash dividend per share or a total
of P=93.71 million representing the full declaration of 30% of recurring net income for 2010 to its
stockholders as of August 11, 2011.
On February 29, 2012, the BOD approved the declaration of P=0.02391 cash dividend per share, or
a total of P=74.07 million representing the first tranche of the 30% of recurring net income for 2011
to its stockholders of record as of March 14, 2012. The dividends were paid on April 12, 2012.
On June 27, 2012, the BOD approved the declaration of property dividends consisting of the
Parent Company’s 41,431,346 common shares in Philtown Properties, Inc. to stockholders owning
77 shares or more as of July 11, 2012. On August 13, 2012, the SEC approved the distribution of
41,042,080 shares and was issued to the stockholders on September 7, 2012 at P=3.49 per share,
for a total of P=144.75 million.
On November 14, 2012, the BOD approved the declaration of P=0.02434 cash dividend per share,
or a total of P=76.92 million representing the full declaration of the 30% recurring net income for
2011 to its stockholders of record as of November 28, 2012. The dividends were paid on
December 26, 2012.
(b) Dividends Restriction
The Parent Company’s retained earnings as of December 31, 2012 is restricted to the extent of
the amount of the undistributed equity in net earnings of associates included in its retained
earnings amounting to P=105.05 million. These will only be available for declaration as dividends
when these are actually received.
The long-term loan agreements entered into by RFM Corporation with its creditors allows the
Company to declare and pay cash dividends upon compliance with the required current ratio and
debt-to-equity ratio
VII. LEADING PRACTICES ON CORPORATE GOVERNANCE
(a) Evaluation System to Measure Compliance with Manual of Corporate Governance
There is no particular system presently being applied to measure the Corporation’s compliance with the
provisions of its Manual on Good Corporate Governance. Compliance with the Manual on good
Corporate Governance is validated by the Corporation using the Corporate Scorecard For Publicly Listed
Companies and recently implemented PSE Corporate Governance Guidelines: Disclosure Survey.
(b) Measure being Undertaken to Fully Comply with the Adopted Leading Practices on Good Corporate
Governance
The following are some of the measures undertaken by the Company to ensure that full compliance with
the leading practices on good governance are observed:
1. During the scheduled meetings of the Board of Directors, the attendance of each director is
monitored and recorded;
2. The Compliance Officer has been designated to monitor compliance with the provisions and
requirements of the Corporation’s Manual on Corporate Governance;
3. The Corporation has designated an audit committee, compensation committee, nomination
committee, and investment committee;
4. The Board has elected independent directors of at least two or 20% of the member of such Board,
whichever is lesser;
5. The nomination committee pre-screens and shortlists all candidates nominated to become
directors in accordance with the qualification and disqualification set up and established;
6. The directors and officers were given copies of the Manual of the Corporate Governance of the
Corporation for their information, guidance and compliance.
7. On 24 March 2010, the Board approved a revised Manual of Corporate Governance incorporating
the changes under SEC Memorandum Circular No. 6, Series of 2009.
8. On 3 March 2011, a refresher course on Corporate Governance was conducted by SyCip Gorres
Velayo & Co. and Knowledge Institute to directors and key personnel.
(c) Deviation from the Corporation’s Manual of Corporate Governance
Per records, no director failed to meet the fifty percent (50%) attendance requirement in all board
meetings, whether regular or special, during his incumbency, or any twelve (12) month period during the
said incumbency in accordance with the Revised Manual on Corporate Governance of the Company.
(d) Any plan to improve corporate governance of the company
The Company will continue monitoring compliance with its Revised Manual on Corporate Governance to
ensure full compliance thereto. The Company will improve its Revised Corporate Governance Manual as
needed and proper in its best judgment.
VIII. REGISTRANT'S MANAGEMENT REPORT
The Corporation shall undertake to provide without charge, a copy of the registrant's Management
Report on SEC Form 17-A upon written request to:
Mr. Ramon M. Lopez
VP/Exec. Asst. to the Pres. & CEO
8/F RFM Corporate Center
Corner Pioneer and Sheridan Streets
Mandaluyong City
RFM CORPORATION
By:
ATTY. ROWEL S. BARBA
Corporate Secretary
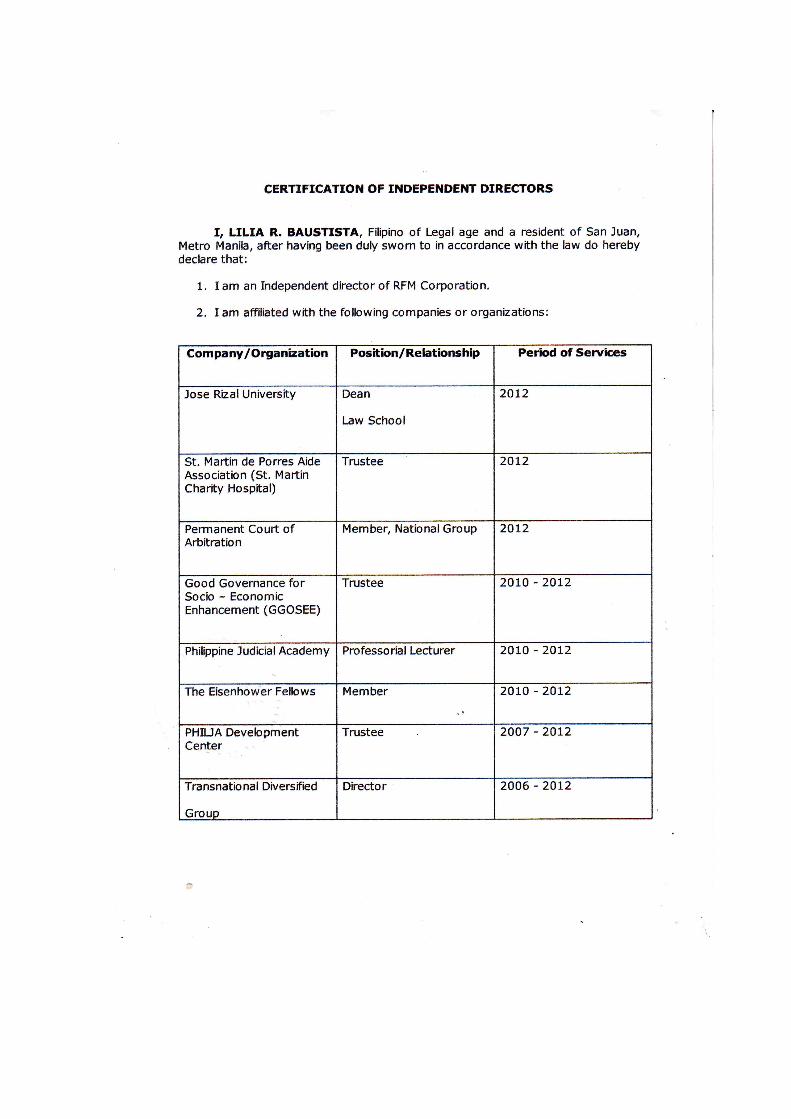

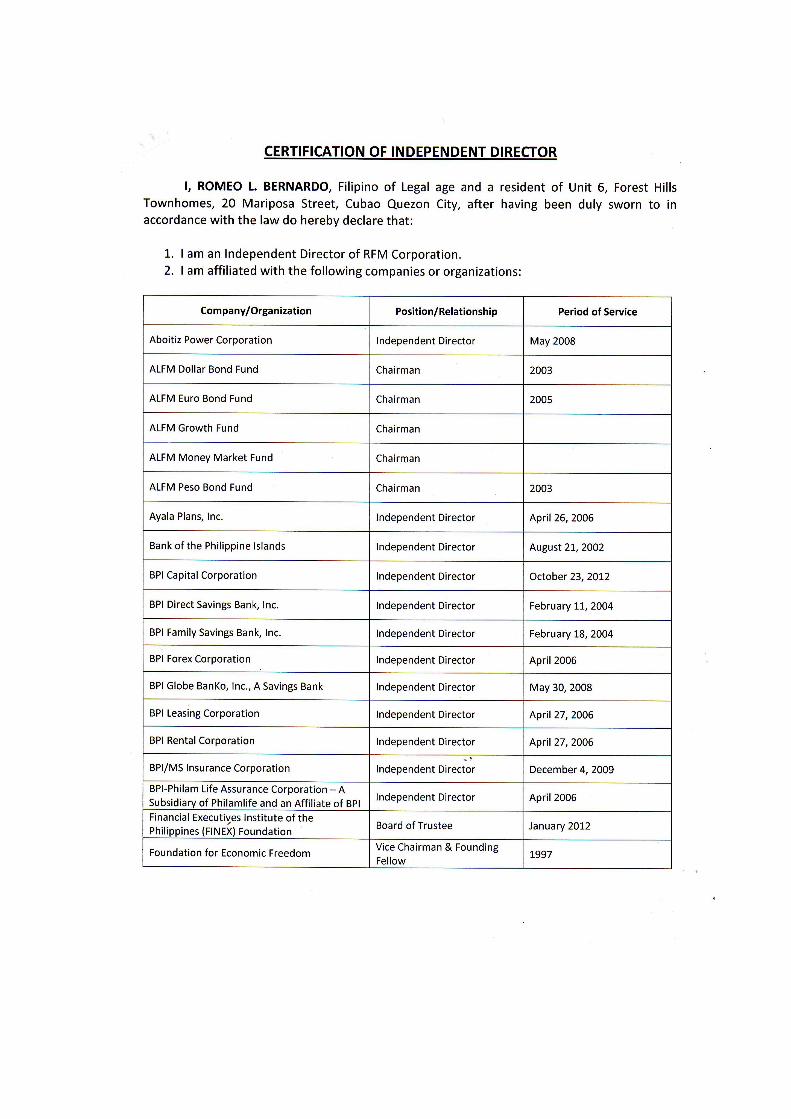


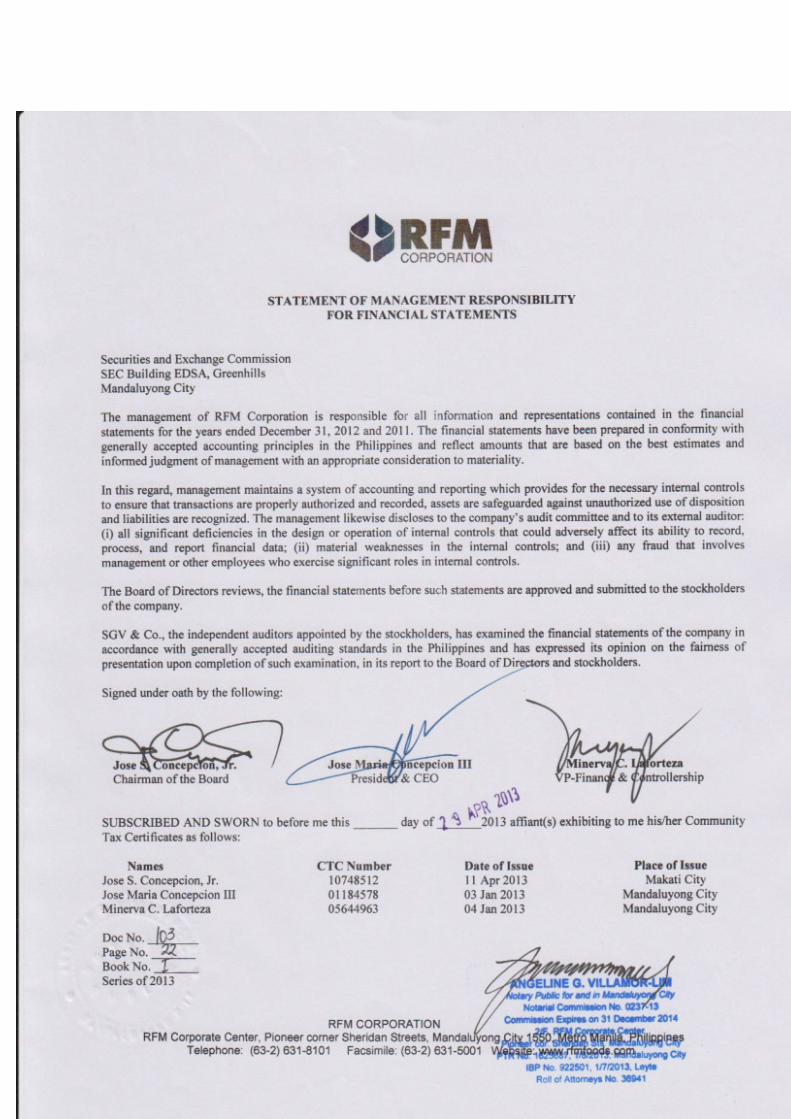
RFM Corporation and Subsidiaries
Consolidated Financial Statements December 31, 2012 and 2011 and Years Ended December 31, 2012, 2011 and 2010 and Independent Auditors’ Report SyCip Gorres Velayo & Co.
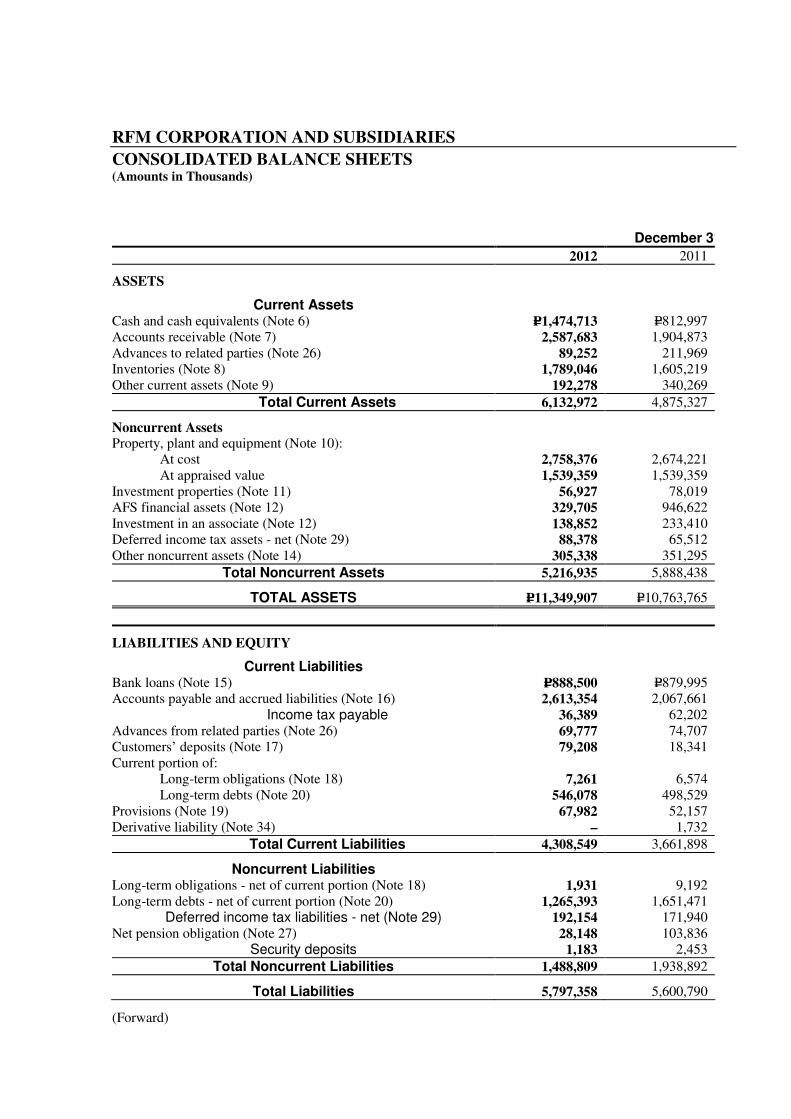
RFM CORPORATION AND SUBSIDIARIES
CONSOLIDATED BALANCE SHEETS (Amounts in Thousands)
December 31
2012 2011
ASSETS
Current Assets Cash and cash equivalents (Note 6) P=1,474,713 P=812,997 Accounts receivable (Note 7) 2,587,683 1,904,873 Advances to related parties (Note 26) 89,252 211,969 Inventories (Note 8) 1,789,046 1,605,219 Other current assets (Note 9) 192,278 340,269
Total Current Assets 6,132,972 4,875,327
Noncurrent Assets Property, plant and equipment (Note 10): At cost 2,758,376 2,674,221 At appraised value 1,539,359 1,539,359 Investment properties (Note 11) 56,927 78,019 AFS financial assets (Note 12) 329,705 946,622 Investment in an associate (Note 12) 138,852 233,410 Deferred income tax assets - net (Note 29) 88,378 65,512 Other noncurrent assets (Note 14) 305,338 351,295
Total Noncurrent Assets 5,216,935 5,888,438
TOTAL ASSETS P=11,349,907 P=10,763,765
LIABILITIES AND EQUITY
Current Liabilities Bank loans (Note 15) P=888,500 P=879,995 Accounts payable and accrued liabilities (Note 16) 2,613,354 2,067,661
Income tax payable 36,389 62,202 Advances from related parties (Note 26) 69,777 74,707 Customers’ deposits (Note 17) 79,208 18,341 Current portion of: Long-term obligations (Note 18) 7,261 6,574 Long-term debts (Note 20) 546,078 498,529 Provisions (Note 19) 67,982 52,157 Derivative liability (Note 34) – 1,732
Total Current Liabilities 4,308,549 3,661,898
Noncurrent Liabilities Long-term obligations - net of current portion (Note 18) 1,931 9,192 Long-term debts - net of current portion (Note 20) 1,265,393 1,651,471
Deferred income tax liabilities - net (Note 29) 192,154 171,940 Net pension obligation (Note 27) 28,148 103,836
Security deposits 1,183 2,453
Total Noncurrent Liabilities 1,488,809 1,938,892
Total Liabilities 5,797,358 5,600,790
(Forward)
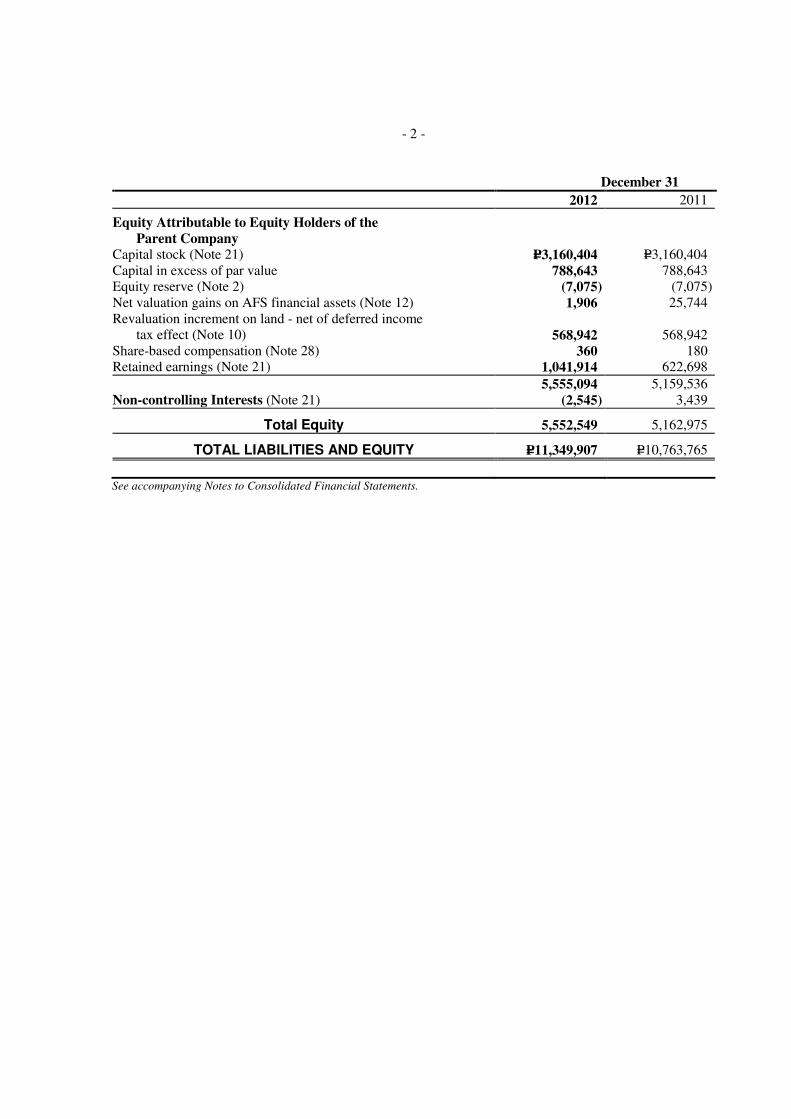
- 2 - December 31
2012 2011
Equity Attributable to Equity Holders of the Parent Company
Capital stock (Note 21) P=3,160,404 P=3,160,404 Capital in excess of par value 788,643 788,643 Equity reserve (Note 2) (7,075) (7,075) Net valuation gains on AFS financial assets (Note 12) 1,906 25,744 Revaluation increment on land - net of deferred income
tax effect (Note 10) 568,942 568,942 Share-based compensation (Note 28) 360 180 Retained earnings (Note 21) 1,041,914 622,698
5,555,094 5,159,536 Non-controlling Interests (Note 21) (2,545) 3,439
Total Equity 5,552,549 5,162,975
TOTAL LIABILITIES AND EQUITY P=11,349,907 P=10,763,765
See accompanying Notes to Consolidated Financial Statements.
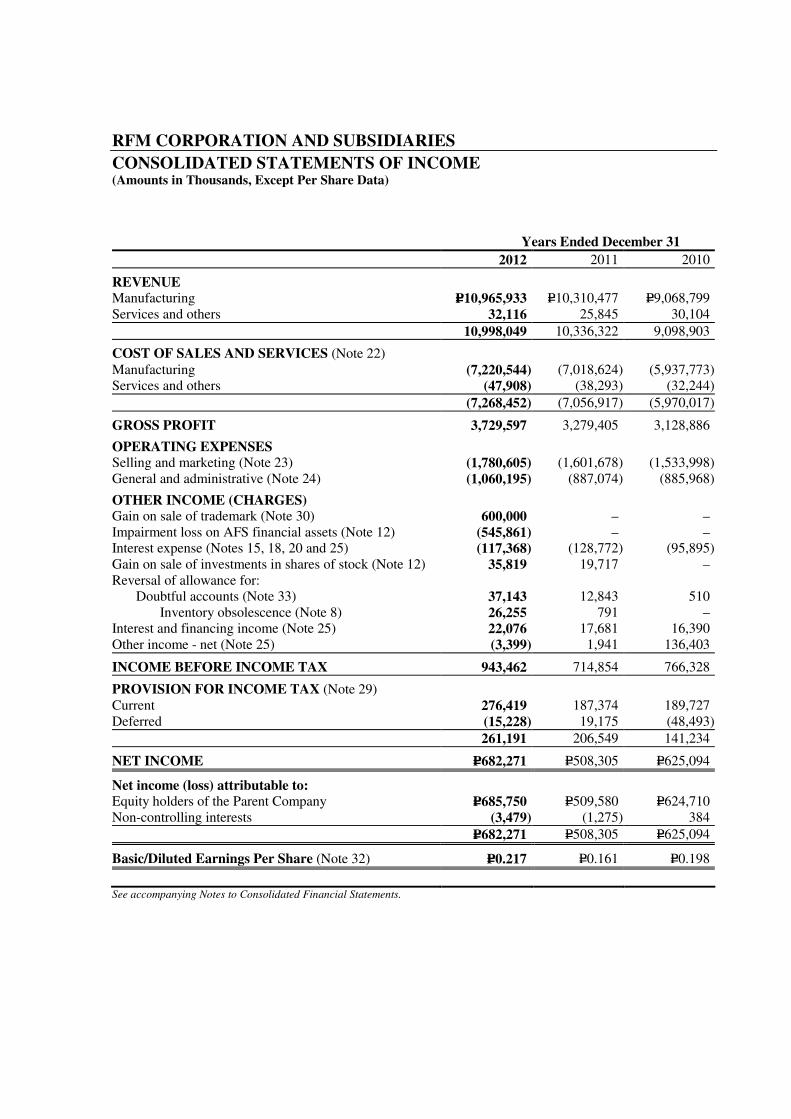
RFM CORPORATION AND SUBSIDIARIES
CONSOLIDATED STATEMENTS OF INCOME (Amounts in Thousands, Except Per Share Data) Years Ended December 31
2012 2011 2010
REVENUE Manufacturing P=10,965,933 P=10,310,477 P=9,068,799 Services and others 32,116 25,845 30,104
10,998,049 10,336,322 9,098,903
COST OF SALES AND SERVICES (Note 22) Manufacturing (7,220,544) (7,018,624) (5,937,773) Services and others (47,908) (38,293) (32,244)
(7,268,452) (7,056,917) (5,970,017)
GROSS PROFIT 3,729,597 3,279,405 3,128,886
OPERATING EXPENSES Selling and marketing (Note 23) (1,780,605) (1,601,678) (1,533,998) General and administrative (Note 24) (1,060,195) (887,074) (885,968)
OTHER INCOME (CHARGES) Gain on sale of trademark (Note 30) 600,000 – – Impairment loss on AFS financial assets (Note 12) (545,861) – – Interest expense (Notes 15, 18, 20 and 25) (117,368) (128,772) (95,895) Gain on sale of investments in shares of stock (Note 12) 35,819 19,717 – Reversal of allowance for: Doubtful accounts (Note 33) 37,143 12,843 510 Inventory obsolescence (Note 8) 26,255 791 – Interest and financing income (Note 25) 22,076 17,681 16,390 Other income - net (Note 25) (3,399) 1,941 136,403
INCOME BEFORE INCOME TAX 943,462 714,854 766,328
PROVISION FOR INCOME TAX (Note 29) Current 276,419 187,374 189,727 Deferred (15,228) 19,175 (48,493)
261,191 206,549 141,234
NET INCOME P=682,271 P=508,305 P=625,094
Net income (loss) attributable to: Equity holders of the Parent Company P=685,750 P=509,580 P=624,710 Non-controlling interests (3,479) (1,275) 384
P=682,271 P=508,305 P=625,094
Basic/Diluted Earnings Per Share (Note 32) P=0.217 P=0.161 P=0.198
See accompanying Notes to Consolidated Financial Statements.
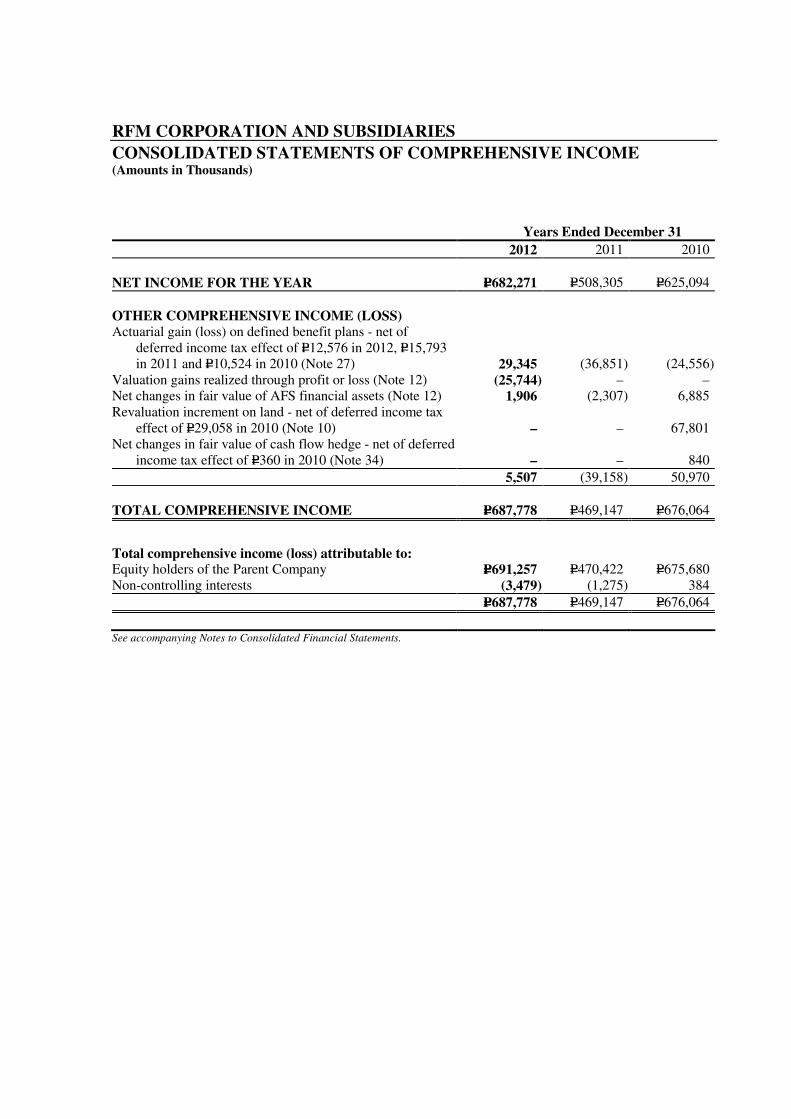
RFM CORPORATION AND SUBSIDIARIES
CONSOLIDATED STATEMENTS OF COMPREHENSIVE INCOME (Amounts in Thousands) Years Ended December 31
2012 2011 2010
NET INCOME FOR THE YEAR P=682,271 P=508,305 P=625,094
OTHER COMPREHENSIVE INCOME (LOSS) Actuarial gain (loss) on defined benefit plans - net of
deferred income tax effect of P=12,576 in 2012, P=15,793 in 2011 and P=10,524 in 2010 (Note 27) 29,345 (36,851) (24,556)
Valuation gains realized through profit or loss (Note 12) (25,744) – – Net changes in fair value of AFS financial assets (Note 12) 1,906 (2,307) 6,885 Revaluation increment on land - net of deferred income tax
effect of P=29,058 in 2010 (Note 10) – – 67,801 Net changes in fair value of cash flow hedge - net of deferred
income tax effect of P=360 in 2010 (Note 34) – – 840
5,507 (39,158) 50,970
TOTAL COMPREHENSIVE INCOME P=687,778 P=469,147 P=676,064
Total comprehensive income (loss) attributable to: Equity holders of the Parent Company P=691,257 P=470,422 P=675,680 Non-controlling interests (3,479) (1,275) 384
P=687,778 P=469,147 P=676,064
See accompanying Notes to Consolidated Financial Statements.
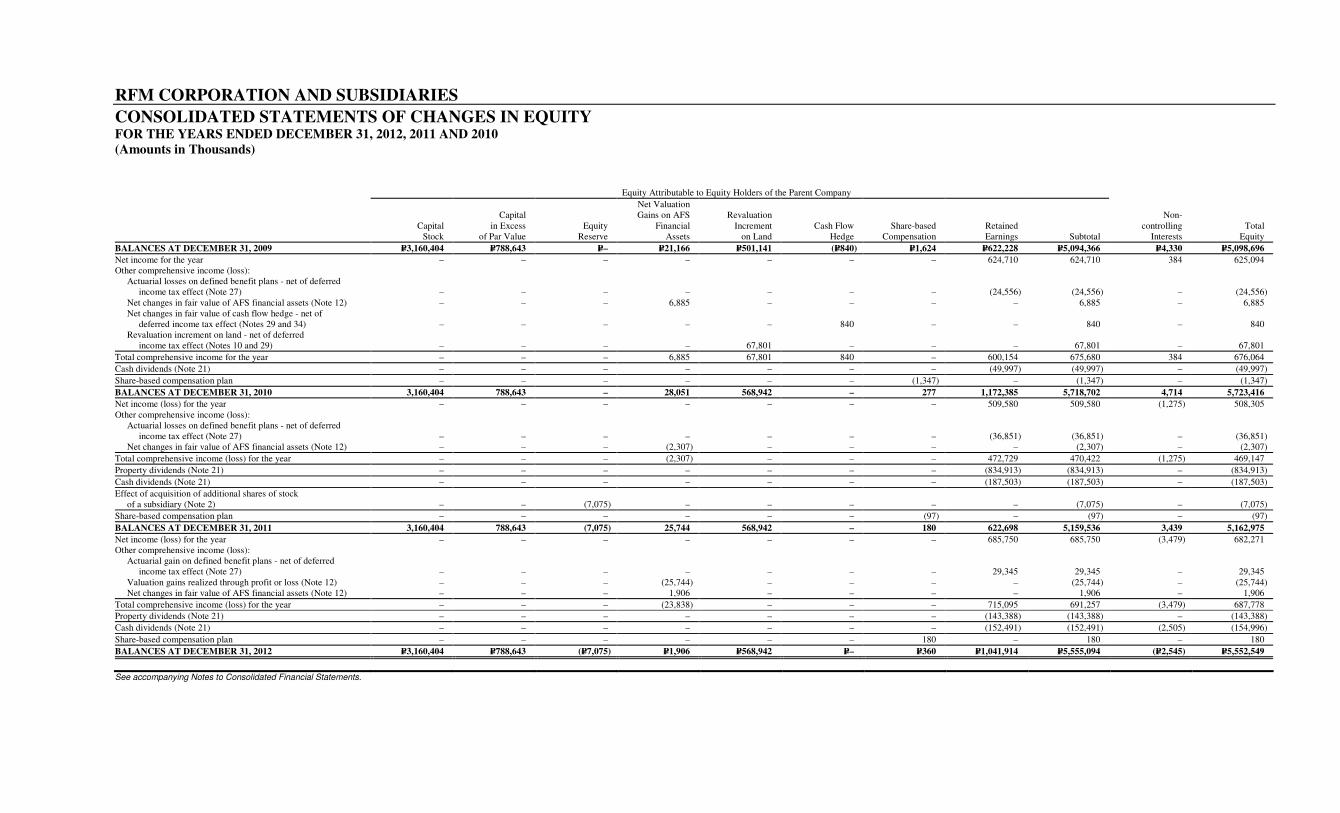
RFM CORPORATION AND SUBSIDIARIES
CONSOLIDATED STATEMENTS OF CHANGES IN EQUITY FOR THE YEARS ENDED DECEMBER 31, 2012, 2011 AND 2010 (Amounts in Thousands) Equity Attributable to Equity Holders of the Parent Company
Net Valuation Capital Gains on AFS Revaluation Non- Capital in Excess Equity Financial Increment Cash Flow Share-based Retained controlling Total Stock of Par Value Reserve Assets on Land Hedge Compensation Earnings Subtotal Interests Equity
BALANCES AT DECEMBER 31, 2009 P=3,160,404 P=788,643 P=– P=21,166 P=501,141 (P=840) P=1,624 P=622,228 P=5,094,366 P=4,330 P=5,098,696
Net income for the year – – – – – – – 624,710 624,710 384 625,094 Other comprehensive income (loss): Actuarial losses on defined benefit plans - net of deferred income tax effect (Note 27)
–
–
–
–
–
–
–
(24,556)
(24,556)
–
(24,556)
Net changes in fair value of AFS financial assets (Note 12) – – – 6,885 – – – – 6,885 – 6,885 Net changes in fair value of cash flow hedge - net of deferred income tax effect (Notes 29 and 34) – – – – – 840 – – 840 – 840 Revaluation increment on land - net of deferred income tax effect (Notes 10 and 29)
–
–
–
–
67,801
–
–
–
67,801
–
67,801
Total comprehensive income for the year – – – 6,885 67,801 840 – 600,154 675,680 384 676,064
Cash dividends (Note 21) – – – – – – – (49,997) (49,997) – (49,997)
Share-based compensation plan – – – – – – (1,347) – (1,347) – (1,347)
BALANCES AT DECEMBER 31, 2010 3,160,404 788,643 – 28,051 568,942 – 277 1,172,385 5,718,702 4,714 5,723,416
Net income (loss) for the year – – – – – – – 509,580 509,580 (1,275) 508,305 Other comprehensive income (loss): Actuarial losses on defined benefit plans - net of deferred income tax effect (Note 27)
–
–
–
–
–
–
–
(36,851)
(36,851)
–
(36,851)
Net changes in fair value of AFS financial assets (Note 12) – – – (2,307) – – – – (2,307) – (2,307)
Total comprehensive income (loss) for the year – – – (2,307) – – – 472,729 470,422 (1,275) 469,147
Property dividends (Note 21) – – – – – – – (834,913) (834,913) – (834,913)
Cash dividends (Note 21) – – – – – – – (187,503) (187,503) – (187,503)
Effect of acquisition of additional shares of stock of a subsidiary (Note 2)
–
–
(7,075)
–
–
–
–
–
(7,075)
–
(7,075)
Share-based compensation plan – – – – – – (97) – (97) – (97)
BALANCES AT DECEMBER 31, 2011 3,160,404 788,643 (7,075) 25,744 568,942 – 180 622,698 5,159,536 3,439 5,162,975
Net income (loss) for the year – – – – – – – 685,750 685,750 (3,479) 682,271 Other comprehensive income (loss): Actuarial gain on defined benefit plans - net of deferred income tax effect (Note 27)
–
–
–
–
–
–
– 29,345 29,345 – 29,345
Valuation gains realized through profit or loss (Note 12) – – – (25,744) – – – – (25,744) – (25,744) Net changes in fair value of AFS financial assets (Note 12) – – – 1,906 – – – – 1,906 – 1,906
Total comprehensive income (loss) for the year – – – (23,838) – – – 715,095 691,257 (3,479) 687,778
Property dividends (Note 21) – – – – – – – (143,388) (143,388) – (143,388)
Cash dividends (Note 21) – – – – – – – (152,491) (152,491) (2,505) (154,996)
Share-based compensation plan – – – – – – 180 – 180 – 180
BALANCES AT DECEMBER 31, 2012 P=3,160,404 P=788,643 (P=7,075) P=1,906 P=568,942 P=– P=360 P=1,041,914 P=5,555,094 (P=2,545) P=5,552,549
See accompanying Notes to Consolidated Financial Statements.
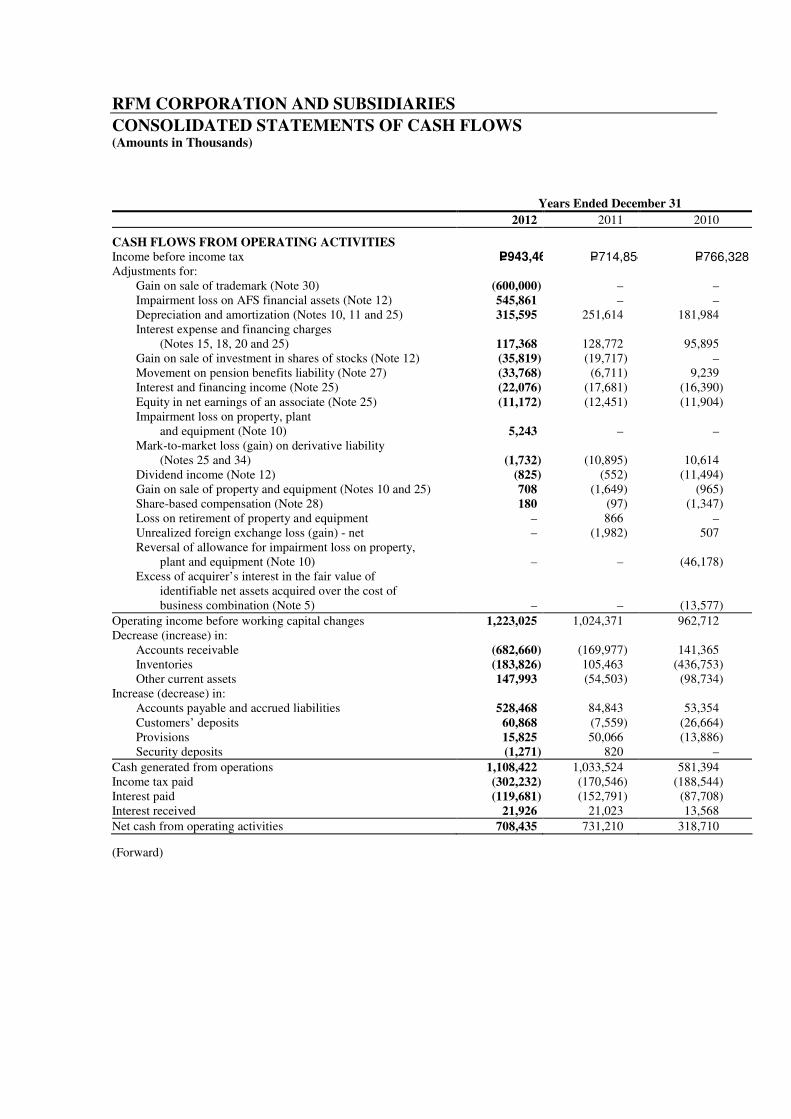
RFM CORPORATION AND SUBSIDIARIES
CONSOLIDATED STATEMENTS OF CASH FLOWS (Amounts in Thousands) Years Ended December 31
2012 2011 2010
CASH FLOWS FROM OPERATING ACTIVITIES Income before income tax P=943,462 P=714,854 P=766,328 Adjustments for: Gain on sale of trademark (Note 30) (600,000) – – Impairment loss on AFS financial assets (Note 12) 545,861 – – Depreciation and amortization (Notes 10, 11 and 25) 315,595 251,614 181,984 Interest expense and financing charges
(Notes 15, 18, 20 and 25) 117,368 128,772 95,895 Gain on sale of investment in shares of stocks (Note 12) (35,819) (19,717) – Movement on pension benefits liability (Note 27) (33,768) (6,711) 9,239 Interest and financing income (Note 25) (22,076) (17,681) (16,390) Equity in net earnings of an associate (Note 25) (11,172) (12,451) (11,904) Impairment loss on property, plant
and equipment (Note 10) 5,243 – – Mark-to-market loss (gain) on derivative liability
(Notes 25 and 34) (1,732)
(10,895)
10,614 Dividend income (Note 12) (825) (552) (11,494) Gain on sale of property and equipment (Notes 10 and 25) 708 (1,649) (965) Share-based compensation (Note 28) 180 (97) (1,347) Loss on retirement of property and equipment – 866 – Unrealized foreign exchange loss (gain) - net – (1,982) 507 Reversal of allowance for impairment loss on property,
plant and equipment (Note 10) –
–
(46,178) Excess of acquirer’s interest in the fair value of
identifiable net assets acquired over the cost of business combination (Note 5) –
–
(13,577)
Operating income before working capital changes 1,223,025 1,024,371 962,712 Decrease (increase) in: Accounts receivable (682,660) (169,977) 141,365 Inventories (183,826) 105,463 (436,753) Other current assets 147,993 (54,503) (98,734) Increase (decrease) in: Accounts payable and accrued liabilities 528,468 84,843 53,354 Customers’ deposits 60,868 (7,559) (26,664) Provisions 15,825 50,066 (13,886) Security deposits (1,271) 820 –
Cash generated from operations 1,108,422 1,033,524 581,394 Income tax paid (302,232) (170,546) (188,544) Interest paid (119,681) (152,791) (87,708) Interest received 21,926 21,023 13,568
Net cash from operating activities 708,435 731,210 318,710
(Forward)
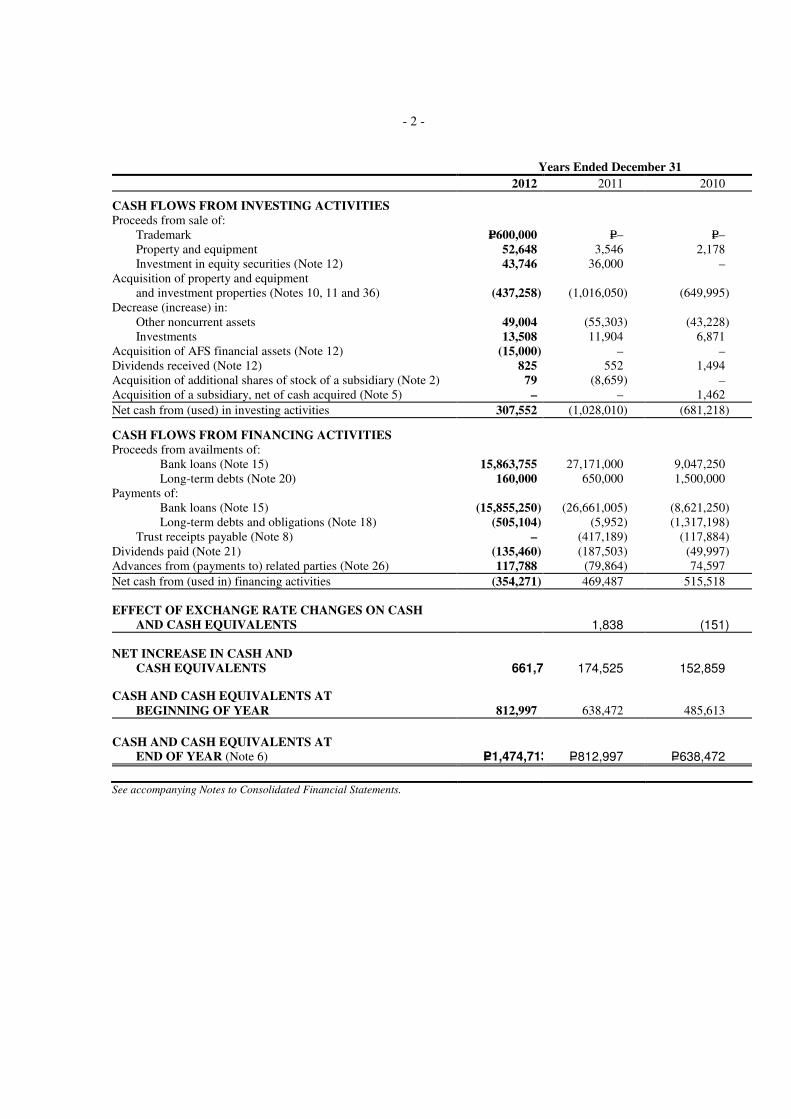
- 2 - Years Ended December 31
2012 2011 2010
CASH FLOWS FROM INVESTING ACTIVITIES Proceeds from sale of: Trademark P=600,000 P=– P=– Property and equipment 52,648 3,546 2,178 Investment in equity securities (Note 12) 43,746 36,000 – Acquisition of property and equipment and investment properties (Notes 10, 11 and 36) (437,258)
(1,016,050)
(649,995)
Decrease (increase) in: Other noncurrent assets 49,004 (55,303) (43,228) Investments 13,508 11,904 6,871 Acquisition of AFS financial assets (Note 12) (15,000) – – Dividends received (Note 12) 825 552 1,494 Acquisition of additional shares of stock of a subsidiary (Note 2) 79 (8,659) – Acquisition of a subsidiary, net of cash acquired (Note 5) – – 1,462
Net cash from (used) in investing activities 307,552 (1,028,010) (681,218)
CASH FLOWS FROM FINANCING ACTIVITIES Proceeds from availments of: Bank loans (Note 15) 15,863,755 27,171,000 9,047,250 Long-term debts (Note 20) 160,000 650,000 1,500,000 Payments of: Bank loans (Note 15) (15,855,250) (26,661,005) (8,621,250) Long-term debts and obligations (Note 18) (505,104) (5,952) (1,317,198) Trust receipts payable (Note 8) – (417,189) (117,884) Dividends paid (Note 21) (135,460) (187,503) (49,997) Advances from (payments to) related parties (Note 26) 117,788 (79,864) 74,597
Net cash from (used in) financing activities (354,271) 469,487 515,518
EFFECT OF EXCHANGE RATE CHANGES ON CASH AND CASH EQUIVALENTS 1,838 (151)
NET INCREASE IN CASH AND CASH EQUIVALENTS 661,71 174,525 152,859
CASH AND CASH EQUIVALENTS AT BEGINNING OF YEAR 812,997 638,472 485,613
CASH AND CASH EQUIVALENTS AT END OF YEAR (Note 6) P=1,474,713 P=812,997 P=638,472
See accompanying Notes to Consolidated Financial Statements.
RFM CORPORATION AND SUBSIDIARIES
NOTES TO CONSOLIDATED FINANCIAL STATEMENTS (Amounts in Thousands, Except Number of Shares or When Otherwise Indicated)
1. Corporate Information and Authorization for the Issuance of the Consolidated Financial Statements
Corporate Information RFM Corporation (the Parent Company) was incorporated and registered with the Philippine Securities and Exchange Commission (SEC) on August 16, 1957. On July 9, 2007, the SEC approved the extension of the Company’s corporate life from August 22, 2007 to October 13, 2056. The Parent Company is a public company under Section 17.2 of the Securities Regulation Code and its shares are listed in the Philippine Stock Exchange (PSE) starting in 1966. The Parent Company is mainly involved in the manufacturing, processing and selling of wheat, flour and flour products, pasta, meat, milk, juices, margarine, and other food and beverage products. The Parent Company and its subsidiaries are collectively referred to as the Group.
The registered business address of the Parent Company is RFM Corporate Center, corner Pioneer and Sheridan Streets, Mandaluyong City.
Authorization for the Issuance of the Consolidated Financial Statements The consolidated financial statements were authorized for issuance by the Board of Directors (BOD) on April 26, 2013.
2. Summary of Significant Accounting Policies and Financial Reporting Practices
Basis of Preparation The consolidated financial statements of the Group have been prepared using the historical cost basis, except for the Group’s land, which are stated at appraised values, and available-for-sale (AFS) financial assets and derivative liability that are measured at fair value. The consolidated financial statements are presented in Philippine peso (Peso), which is the Parent Company’s functional currency. All values are rounded off to the nearest thousand pesos (P=000), except for the number of shares or when otherwise indicated.
Statement of Compliance The consolidated financial statements of the Group have been prepared in compliance with Philippine Financial Reporting Standards (PFRS).
Changes in Accounting Policies and Disclosures
The accounting policies adopted are consistent with those of the previous financial year, except for the following amended PFRS and Philippine Accounting Standards (PAS) which were adopted as of January 1, 2012. Except as otherwise indicated, the adoption of these changes in PFRS did not have any significant impact on the Group’s financial statements:
• PFRS 7, Financial Instruments: Disclosures - Transfers of Financial Assets (Amendments), requires additional disclosures about financial assets that have been transferred but not derecognized to enhance the understanding of the relationship between those assets that have not been derecognized and their associated liabilities. In addition, the amendments require disclosures about continuing involvement in derecognized assets to enable users of financial
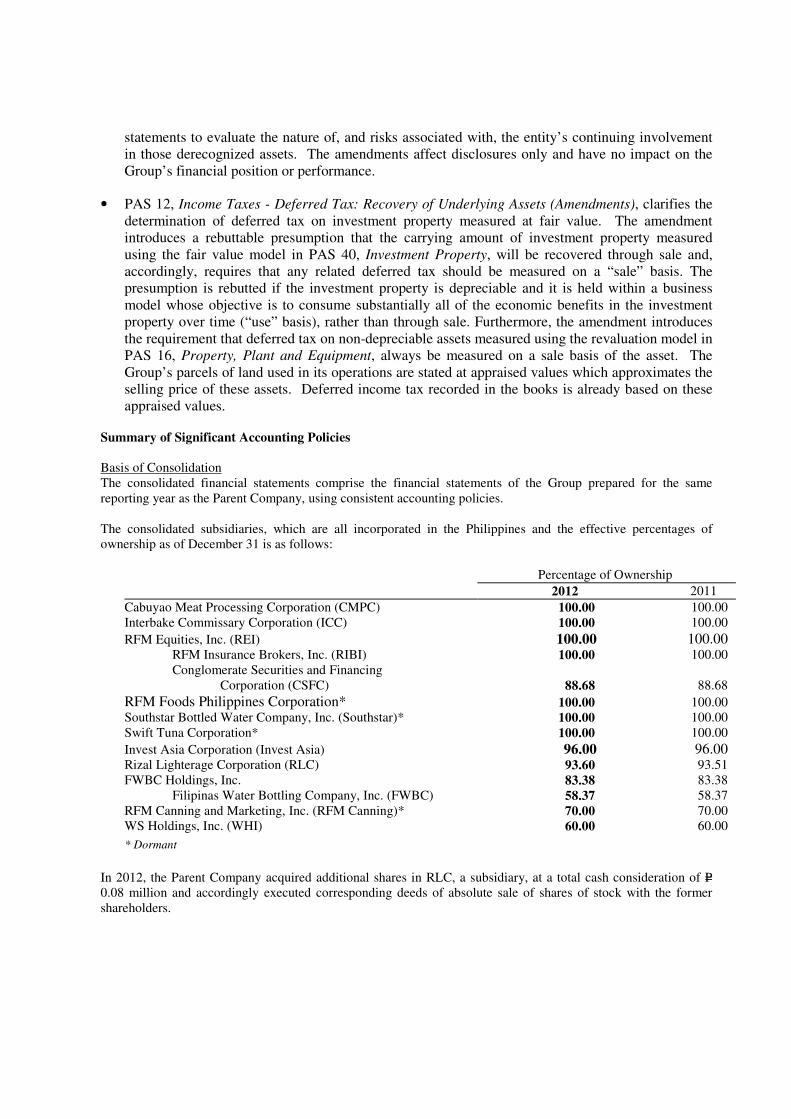
statements to evaluate the nature of, and risks associated with, the entity’s continuing involvement in those derecognized assets. The amendments affect disclosures only and have no impact on the Group’s financial position or performance.
• PAS 12, Income Taxes - Deferred Tax: Recovery of Underlying Assets (Amendments), clarifies the determination of deferred tax on investment property measured at fair value. The amendment introduces a rebuttable presumption that the carrying amount of investment property measured using the fair value model in PAS 40, Investment Property, will be recovered through sale and, accordingly, requires that any related deferred tax should be measured on a “sale” basis. The presumption is rebutted if the investment property is depreciable and it is held within a business model whose objective is to consume substantially all of the economic benefits in the investment property over time (“use” basis), rather than through sale. Furthermore, the amendment introduces the requirement that deferred tax on non-depreciable assets measured using the revaluation model in PAS 16, Property, Plant and Equipment, always be measured on a sale basis of the asset. The Group’s parcels of land used in its operations are stated at appraised values which approximates the selling price of these assets. Deferred income tax recorded in the books is already based on these appraised values.
Summary of Significant Accounting Policies
Basis of Consolidation The consolidated financial statements comprise the financial statements of the Group prepared for the same reporting year as the Parent Company, using consistent accounting policies.
The consolidated subsidiaries, which are all incorporated in the Philippines and the effective percentages of ownership as of December 31 is as follows:
Percentage of Ownership
2012 2011
Cabuyao Meat Processing Corporation (CMPC) 100.00 100.00 Interbake Commissary Corporation (ICC) 100.00 100.00
RFM Equities, Inc. (REI) 100.00 100.00 RFM Insurance Brokers, Inc. (RIBI) 100.00 100.00 Conglomerate Securities and Financing Corporation (CSFC)
88.68
88.68
RFM Foods Philippines Corporation* 100.00 100.00 Southstar Bottled Water Company, Inc. (Southstar)* 100.00 100.00 Swift Tuna Corporation* 100.00 100.00
Invest Asia Corporation (Invest Asia) 96.00 96.00 Rizal Lighterage Corporation (RLC) 93.60 93.51 FWBC Holdings, Inc. 83.38 83.38 Filipinas Water Bottling Company, Inc. (FWBC) 58.37 58.37 RFM Canning and Marketing, Inc. (RFM Canning)* 70.00 70.00 WS Holdings, Inc. (WHI) 60.00 60.00
* Dormant
In 2012, the Parent Company acquired additional shares in RLC, a subsidiary, at a total cash consideration of P=0.08 million and accordingly executed corresponding deeds of absolute sale of shares of stock with the former shareholders.

In 2011, the Parent Company acquired additional 10.53% ownership interest in RLC, a subsidiary, at a total cost of P=8.66 million, and accordingly executed corresponding deeds of absolute sale of shares of stock with the former shareholders.
Subsidiaries
Subsidiaries are entities over which the Parent Company has the power to govern the financial and operating policies of the entities, or generally have an interest of more than one half of the voting rights of the entities. The existence and effect of potential voting rights that are currently exercisable or convertible are considered when assessing whether the Parent Company controls another entity. Subsidiaries are fully consolidated from the date of acquisition, being the date on which the Parent Company or the Group obtains control, directly or through the holding companies, and continue to be consolidated until the date that such control ceases. The financial statements of the subsidiaries are prepared for the same accounting period as the Parent Company using consistent accounting policies. Control is achieved when the Parent Company has the power to govern the financial and operating policies of an entity so as to obtain benefits from its activities. They are deconsolidated from the date on which control ceases. All intra-group balances, transactions, income and expenses, and profits and losses resulting from intra-group transactions are eliminated in full. However, intra-group losses are also eliminated but are considered an impairment indicator of the assets transferred. A change in the ownership interest in a subsidiary, without a loss of control, is accounted for as an equity transaction. If the Group loses control over a subsidiary, it derecognizes the carrying amounts of the assets (including goodwill) and liabilities of the subsidiary, carrying amount of any non-controlling interest (including any attributable components of other comprehensive income recorded in equity), and recognizes the fair value of the consideration received, fair value of any investment retained, and any surplus or deficit recognized in the consolidated statement of income. The Group also reclassifies the Parent Company’s share of components previously recognized in other comprehensive income to profit or loss or retained earnings, as appropriate.
Non-controlling interest Non-controlling interest represents the portion of profit or loss and the net assets not held by the Group. Profit or loss and each component of other comprehensive income (loss) are attributed to the equity holders of the Parent Company and to the non-controlling interest. Total comprehensive income (loss) is attributed to the equity holders of the Parent Company and to the non-controlling interest even if this results in the non-controlling interest having a deficit balance. Transactions with non-controlling interest are accounted for as an equity transaction.
Business Combination and Goodwill
Business combinations are accounted for using the acquisition method. The cost of an acquisition is measured as the aggregate of the consideration transferred, measured at acquisition date fair value and the amount of any non-controlling interest in the acquiree. For each business combination, the acquirer measures the non-controlling interest in the acquiree either at fair value or at the proportionate share of the acquiree’s identifiable net assets. Acquisition-related costs incurred are expensed and included in general and administrative expenses.
When the Group acquires a business, it assesses the financial assets and financial liabilities assumed for appropriate classification and designation in accordance with the contractual terms, economic circumstances and pertinent conditions as at the acquisition date. This includes the separation of embedded derivatives in host contracts by the acquiree.
If the business combination is achieved in stages, the acquisition date fair value of the acquirer’s previously held equity interest in the acquiree is remeasured to fair value at the acquisition date and any gain or loss on remeasurement is recognized in the consolidated statement of income.
Any contingent consideration to be transferred by the acquirer will be recognized at fair value at the acquisition date. Subsequent changes to the fair value of the contingent consideration which is deemed to be an asset or liability, will be recognized in accordance with PAS 39 either in the consolidated statement of income or as a

change to other comprehensive income. If the contingent consideration is classified as equity, it should not be remeasured until it is finally settled within equity.
Goodwill is initially measured at cost being the excess of the aggregate of the consideration transferred and the amount recognized for non-controlling interest over the net identifiable assets acquired and liabilities assumed. If this consideration is lower than the fair value of the net assets of the subsidiary acquired, the difference is recognized in the consolidated statement of income.
After initial recognition, goodwill is measured at cost less any accumulated impairment losses. For the purpose of impairment testing, goodwill acquired in a business combination is, from the acquisition date, allocated to each of the Group’s cash-generating units (CGU) that are expected to benefit from the combination, irrespective of whether other assets or liabilities of the acquiree are assigned to those units.
Where goodwill forms part of a CGU and part of the operation within that unit is disposed of, the goodwill associated with the operation disposed of is included in the carrying amount of the operation when determining the gain or loss on disposal of the operation. Goodwill disposed of in this circumstance is measured based on the relative values of the operation disposed of and the portion of the CGU retained.
Goodwill is reviewed for impairment, annually or more frequently if events or changes in circumstances indicate that the carrying value may be impaired.
Impairment is determined for goodwill by assessing the recoverable amount of the CGU or group of CGUs to which the goodwill relates. Where the recoverable amount of the CGU or group of CGUs is less than the carrying amount of the CGU or group of CGUs to which goodwill has been allocated, an impairment loss is recognized. Impairment losses relating to goodwill cannot be reversed in future periods. The Group performs its impairment test of goodwill annually every December 31.
Cash and Cash Equivalents Cash includes cash on hand and in banks. Cash equivalents are short-term, highly liquid investments that are readily convertible to known amounts of cash with original maturities of three months or less from dates of acquisition and that are subject to an insignificant risk of change in value.
Financial Instruments Date of recognition
The Group recognizes a financial asset or a financial liability in the consolidated balance sheet when it becomes a party to the contractual provisions of the instrument. Purchases and sales of financial assets that require delivery of assets within the time frame by regulation or convention in the marketplace are recognized on the settlement date.
Initial recognition and classification of financial instruments
All financial assets and financial liabilities are recognized initially at fair value. Except for securities at fair value through profit or loss (FVPL), the initial measurement of financial assets includes transactions costs. The Group’s financial assets are further classified into the following categories: financial assets at FVPL (as derivatives designated as hedging instruments in an effective hedge, as appropriate), loans and receivables, held-to-maturity (HTM) investments and AFS financial assets. The Group also classifies its financial liabilities as financial liabilities at FVPL (as derivatives designated as hedging instruments in an effective hedge, as appropriate) and other financial liabilities. The classification depends on the purpose for which the investments were acquired or whether they are quoted in an active market. The Group determines the classification of its financial instruments at initial recognition and, where allowed and appropriate, re-evaluates such designation at each balance sheet date.
Financial instruments are classified as liability or equity in accordance with the substance of the contractual arrangement. Interest, dividends, gains and losses relating to a financial instrument or a component that is a financial liability, are reported as expense or income. Distributions to holders of financial instruments classified as equity are charged directly to equity, net of any related income tax benefits.
As of December 31, 2012 and 2011, the Group has no financial assets at FVPL and HTM investments. Financial liabilities at FVPL of the Group include derivative liability as of December 31, 2011 and nil as of December 31, 2012.
Determination of fair value
The fair value of financial instruments traded in active markets at the balance sheet date is based on the quoted market price or dealer price quotations (bid price for long positions and ask price for short positions), without any deduction for transaction costs. When current bid and asking prices are not available, the price of the most recent transaction provides evidence of current fair value as long as there has not been a significant change in economic circumstances since the time of transaction.
For all other financial instruments not listed in an active market, the fair value is determined by using appropriate valuation methodologies. Valuation methodologies include net present value techniques, comparison to similar instruments for which market observable prices exist, options pricing models and other relevant valuation models.
Fair value measurements are disclosed by source of inputs using a three-level hierarchy for each class of financial instrument. Fair value measurement under Level 1 is based on quoted prices in active markets for identical financial assets or financial liabilities; Level 2 is based on inputs other than quoted prices included within Level 1 that are observable for the financial asset or financial liability, either directly or indirectly; and Level 3 is based on inputs for the financial asset or financial liability that are not based on observable market data.
Day 1 difference
Where the transaction price in a non-active market is different from the fair value from other observable current market transactions in the same instrument or based on a valuation technique whose variables include only data from observable market, the Group recognizes the difference between the transaction price and fair value (a Day 1 difference) in the consolidated statement of income unless it qualifies for the recognition as some other type of asset. In cases where use is made of data which is not observable, the difference between the transaction price and model value is only recognized in the consolidated statement of income when the inputs become observable or when the instrument is derecognized. For each transaction, the Group determines the appropriate method of recognizing the Day 1 difference amount.
Loans and receivables
Loans and receivables are nonderivative financial assets with fixed or determinable payments that are not quoted in an active market. They arise when the Group provides money, goods or services directly to a debtor with no intention of trading the receivables. After initial measurement, loans and receivables are subsequently carried at cost or amortized cost using the effective interest method less any allowance for impairment. Gains and losses are recognized in the consolidated statement of income when the loans and receivables are derecognized or impaired, as well as through the amortization process. Loans and receivables are classified as current assets if maturity is within 12 months from the balance sheet date or the normal operating cycle, whichever is longer. Otherwise, these are classified as noncurrent assets.
As of December 31, 2012 and 2011, the Group’s loans and receivables include cash in banks and cash equivalents, accounts receivable, advances to related parties and other current assets.
AFS financial assets
AFS financial assets are non-derivative financial assets that are designated as AFS or are not classified in any of the three other categories. The Group designates financial instruments as AFS financial assets if they are purchased and held indefinitely and may be sold in response to liquidity requirements or changes in market conditions. After initial recognition, AFS financial assets are measured at fair value with unrealized gains or losses being recognized in the consolidated statement of comprehensive income as “Net changes in fair value of AFS financial assets”. When the financial asset is disposed of, the cumulative gain or loss previously recorded in the consolidated statement of comprehensive income is recognized in the consolidated statement of income. Interest earned on the investments is reported as interest income using the effective interest method. Dividends earned on financial assets are recognized in the consolidated statement of income as “Dividend income” when the right of payment has been established. The Group considers several factors in making a decision on the eventual disposal of the investments. The major factor of this decision is whether or not the Group will experience inevitable further losses on investments. These financial assets are classified as noncurrent unless there is intention to dispose of such assets within 12 months of the balance sheet date.
AFS financial assets in unquoted equity securities are carried at historical cost, net of impairment.
As of December 31, 2012 and 2011, the Group’s AFS financial assets include investments in unquoted redeemable preferred and common shares, and quoted common and golf club shares.
Other financial liabilities
This category pertains to financial liabilities that are not held for trading or not designated as at FVPL upon the inception of the liability. These include liabilities arising from operations or borrowings (e.g., payables, accruals).
The financial liabilities are initially recognized at fair value and are subsequently carried at amortized cost, taking into account the impact of applying the effective interest method of amortization (or accretion) for any related premium, discount and any directly attributable transaction costs.
Financial liabilities are classified as current, except for maturities greater than twelve months after the balance sheet date. These are classified as noncurrent liabilities.
As of December 31, 2012 and 2011, the Group’s other financial liabilities include bank loans, accounts payable and accrued liabilities, customers’ deposits, long-term debts and obligations, including current maturities, and advances from related parties.
Derivatives Derivative financial instruments (swaps and option contracts to economically hedge exposure to fluctuations in interest rates) are initially recognized at fair value on the date on which a derivative contract is entered into and are subsequently remeasured at fair value. Derivatives are carried as assets when the fair value is positive and as liabilities when the fair value is negative.
Derivatives are accounted for as at FVPL, where any gains or losses arising from changes in fair value on derivatives are taken directly to consolidated statement of income for the year, unless the transaction is a designated and effective hedging instrument.
Impairment of Financial Assets The Group assesses at each balance sheet date whether a financial asset or group of financial assets is impaired.
Loans and receivables
The Group first assesses whether objective evidence of impairment exists individually for financial assets that are individually significant or collectively for financial assets that are not individually significant. Objective evidence includes observable data that comes to the attention of the Group about loss events such as but not limited to significant financial difficulty of the counterparty, a breach of contract, such as a default or delinquency in interest or principal payments, probability that the borrower will enter bankruptcy or other financial reorganization. If there is objective evidence that an impairment loss on loans and receivables carried at amortized cost has been incurred, the amount of loss is measured as a difference between the asset’s carrying amount and the present value of estimated future cash flows (excluding future credit losses that have not been incurred) discounted at the financial asset’s original effective interest rate (i.e., the effective interest rate computed at initial recognition). The carrying amount of the asset shall be reduced through the use of an allowance account. The amount of impairment loss is recognized in the consolidated statement of income. Interest income continues to be accrued on the reduced carrying amount based on the original effective interest rate of the asset. If it is determined that no objective evidence of impairment exists for an individually assessed financial asset, whether significant or not, the asset is included in the group of financial assets with similar credit risk and characteristics and that group of financial assets is collectively assessed for impairment. Assets that are individually assessed for impairment and for which an impairment loss is or continues to be recognized are not included in a collective assessment of impairment. Loans and receivables, together with the related allowance, are written off when there is no realistic prospect of future recovery and all collateral has been realized. If, in subsequent period, the amount of the impairment loss decreases and the decrease can be related objectively to an event occurring after the impairment was recognized, the previously recognized impairment loss is reversed. Any subsequent reversal of an impairment loss is recognized in the consolidated statement of income, to the extent that the carrying value of the
asset does not exceed its amortized cost at the reversal date.
In relation to receivables, a provision for impairment is made when there is objective evidence (such as the probability of insolvency or significant financial difficulties of the debtor) that the Group will not be able to
collect all of the amounts due under the original terms of the invoice. The carrying amount of the receivable is reduced either directly or through the use of an allowance account. Impaired financial assets carried at amortized cost are derecognized when they are assessed as uncollectible either at a direct reduction of the carrying amount or through use of an allowance account when impairment has been previously recognized in the said amount.
AFS financial assets
For AFS financial assets, the Group assesses at each balance sheet date whether there is objective evidence that a financial asset or group of financial assets is impaired. In case of equity investments classified as AFS financial assets, this would include a significant or prolonged decline in the fair value of the investments below its cost. The determination of what is “significant” or “prolonged” requires judgment. The Group treats “significant” generally as 30% or more and “prolonged” as greater than 12 months for quoted equity securities. Where there is evidence of impairment, the cumulative loss measured as the difference between the acquisition cost and the current fair value, less any impairment loss on that financial asset previously recognized in the consolidated statement of income is removed from the consolidated statement of comprehensive income and recognized in the consolidated statement of income.
Impairment losses on equity investments are recognized in the consolidated statement of income. Increases in fair value after impairment are recognized directly in the consolidated statement of comprehensive income. In the case of debt instruments classified as AFS financial assets, impairment is assessed based on the same criteria as financial assets carried at amortized cost. Future interest income is based on the reduced carrying amount and is accrued based on the rate of interest used to discount future cash flows for the purpose of measuring impairment loss. Such accrual is recorded as part of “Interest income” account in the consolidated statement of income. If, in a subsequent year, the fair value of a debt instrument increases and that increase can be objectively related to an event occurring after the impairment loss was recognized in consolidated statement of income, the impairment loss is reversed through the consolidated statement of income.
Derecognition of Financial Assets and Financial Liabilities Financial asset
A financial asset (or, where applicable, a part of a financial asset or part of a group of similar financial assets) is derecognized when:
• the right to receive cash flows from the asset has expired;
• the Group retains the right to receive cash flows from the asset, but has assumed an obligation to pay them in full without material delay to a third party under a “pass-through” arrangement; or
• the Group has transferred its right to receive cash flows from the asset and either (a) has transferred substantially all the risks and rewards of the asset, or (b) has neither transferred nor retained substantially all the risks and rewards of the asset, but has transferred control of the asset.
Where the Group has transferred its right to receive cash flows from an asset or has entered into a “pass-through” arrangement, and has neither transferred nor retained substantially all the risks and rewards of the asset nor transferred control of the asset, the asset is recognized to the extent of the Group’s continuing involvement in the asset. Continuing involvement that takes the form of a guarantee over the transferred asset is measured at the lower of the original carrying amount of the asset and the maximum amount of consideration that the Group could be required to repay.
Financial liability
A financial liability is derecognized when the obligation under the liability is discharged, cancelled or has expired.
Where an existing financial liability is replaced by another from the same lender on substantially different terms, or the terms of an existing liability are substantially modified, such an exchange or modification is treated as a derecognition of the original liability and the recognition of a new liability, and the difference in the respective carrying amounts is recognized in the consolidated statement of income.
Offsetting Financial Instruments Financial assets and financial liabilities are offset and the net amount reported in the consolidated balance sheet if, and only if, there is a currently enforceable legal right to offset the recognized amounts and there is an intention to settle on a net basis, or to realize the asset and settle the liability simultaneously. This is not generally the case with master netting agreements, and the related assets and liabilities are presented gross in the consolidated balance sheet.

Inventories Inventories are valued at the lower of cost and net realizable value (NRV). Costs incurred in bringing the product to its present location and condition are accounted for as follows:
Finished goods and goods in process - determined using the weighted average method;
cost includes direct materials, direct labor and a proportion of manufacturing overhead costs based on normal operating capacity
Raw materials, spare parts and supplies - purchase cost using the weighted average method
NRV of finished goods and goods in process is the estimated selling price in the ordinary course of business, less the estimated costs of completion and the estimated costs necessary to make the sale.
For goods in process, cost includes the applicable allocation of fixed and variable overhead costs.
For raw materials, NRV is the current replacement cost. In case of spare parts and supplies, NRV is the estimated realizable value of the inventories when disposed of at their condition at the balance sheet date.
An allowance for inventory obsolescence is provided for slow-moving, obsolete, defective and damaged inventories based on physical inspection and management evaluation.
Investment Properties Investment properties consist of land and building and improvement that are not occupied substantially for use by, or in the operations of the Company, nor for sale in the ordinary course of business, but are held primarily to earn rental income and for capital appreciation.
Investment properties are measured initially at cost, including transaction costs. The carrying amount includes the cost of replacing part of an existing investment property at the time that cost is incurred if the recognition criteria are met; and excludes the costs of day to day servicing of an investment property. Subsequent to initial recognition, investment properties, except for land, are carried at cost less accumulated depreciation and any impairment losses.
Depreciation of investment properties is computed using the straight-line method over the estimated useful lives of the assets.
Depreciation ceases at the earlier of the date the item is classified as held for sale (or included in a disposal group that is classified as held for sale) in accordance with PFRS 5, Noncurrent Assets Held for Sale and Discontinued
Operations, and the date the investment property is derecognized.
The estimated useful lives and depreciation method are reviewed periodically to ensure that the periods and method of depreciation are consistent with the expected pattern of economic benefits from items of investment properties.
Investment properties are derecognized from the accounts when they have been either disposed of or when the investment properties are permanently withdrawn from use and no future economic benefits are expected from its disposal. Any gains or losses on the retirement or disposal of investment properties are recognized in the statement of income in the year of retirement or disposal.
Transfers are made to or from investment property only when there is a change in use. For a transfer from investment property to owner occupied property, the deemed cost for subsequent accounting is the fair value at the date of change in use. If owner occupied property becomes an investment property, the Group accounts for such property in accordance with the policy stated under property and equipment up to the date of change in use.
Property, Plant and Equipment Property, plant and equipment, except land, are stated at cost less accumulated depreciation and amortization, and any impairment in value.
Land is stated at appraised value based on a valuation performed by an independent firm of appraisers. The increase in the valuation of land is credited to “Revaluation increment on land” account, net of deferred income tax effect, and presented under the equity section of the consolidated balance sheet.
Revaluation of land is made so that the carrying amount does not differ materially from that which would be determined using the fair value at the balance sheet date. For subsequent revaluations, any resulting increase in the assets’ carrying amount as a result of the revaluation is credited to “Revaluation increment on land” account, net of deferred income tax effect, in the consolidated statement of comprehensive income. Any resulting decrease is directly charged against any related revaluation increment to the extent that the decrease does not exceed the amount of the revaluation increment in respect of the same assets.
The initial cost of items of property, plant and equipment consists of its purchase price, including import duties and any directly attributable costs of bringing the asset to its working condition and location for its intended use. Expenditures incurred after the fixed assets have been put into operation, such as repairs and maintenance and overhaul costs, are normally charged to the consolidated statement of income in the period the costs are incurred. In situations where it can be clearly demonstrated that the expenditures have resulted in an increase in the future economic benefits expected to be obtained from the use of an item of property, plant and equipment beyond its originally assessed standard of performance, the expenditures are capitalized as an additional cost of the item of property, plant and equipment.
Depreciation or amortization are computed on a straight-line basis over the estimated useful lives of the assets as follows:
Number of Years
Land improvements 5 to 20 Silos, buildings and improvements 5 to 30 Machinery and equipment 5 to 25 Office furniture and fixtures 2 to 10 Transportation and delivery equipment 5
Leasehold improvements are amortized over the life of the assets or the lease term, whichever is shorter.
Construction in progress are properties in the course of construction for production, rental or administrative purposes, or for purposes not yet determined, which are carried at cost less any recognized impairment loss. These assets are not depreciated until such time that the relevant assets are completed and available for use.
Depreciation or amortization of an item of property, plant and equipment begins when it becomes available for use, i.e., when it is in the location and condition necessary for it to be capable of operating in the manner intended by management. Depreciation or amortization ceases at the earlier of the date that the item is classified as held for sale (or included in a disposal group that is classified as held for sale) in accordance with PFRS 5, Noncurrent
Assets Held for Sale and Discontinued Operations, and the date the asset is derecognized.
The estimated useful lives and depreciation and amortization method are reviewed periodically to ensure that the periods and method of depreciation and amortization are consistent with the expected pattern of economic benefits from items of property, plant and equipment.
Fully depreciated assets are retained in the accounts until they are no longer in use and no further depreciation is recognized in the consolidated statement of income. When assets are retired or otherwise disposed of, the cost and the related accumulated depreciation and amortization and any impairment in value are removed from the accounts and any resulting gain or loss is recognized in the consolidated statement of income.
Borrowing Costs Borrowing costs are capitalized if they are directly attributable to the acquisition, construction or production of a qualifying asset. Capitalization of borrowing costs commences when the activities to prepare the asset are in progress and expenditures and borrowing costs are being incurred. Borrowing costs are capitalized until the assets are substantially ready for their intended use. If the resulting carrying amount of the asset exceeds its recoverable amount, an impairment loss is recorded. Borrowing costs include interest charges and other costs incurred in connection with the borrowing of funds.
Other borrowing costs are recognized as expense in the period in which they are incurred.
Investment in an Associate Investment in an associate is accounted for under the equity method of accounting. An associate is an entity in which the Group has significant influence and which is neither a subsidiary nor a joint venture of the Group. As of December 31, 2012 and 2011, the Group has a 35% interest in Selecta Walls Land Corporation (SWLC) accounted for under the equity method.
In 2011, the Parent Company sold its 30% interest in Philstar Global Corporation (Philstar) with a carrying value of P=16.28 million. Total cash consideration for the sale amounted to P=36.00 million resulting to a gain of P=19.72 million (see Note 12).
Under the equity method, such investment in an associate is carried in the consolidated balance sheet at cost plus post-acquisition changes in the Group’s share in the net assets of the associate. Goodwill relating to an associate is included in the carrying amount of the investment and is not amortized. The consolidated statement of income reflects the Group’s share of the results of operations of the associate. Where there has been a change recognized directly in the equity of the associate, the Group recognizes its share of any changes, and discloses this when applicable, in the details of the changes in equity. After application of the equity method, the Group determines whether it is necessary to recognize any additional impairment loss with respect to the Group’s investment in the associate. Unrealized gains and losses resulting from transactions between the Group and the associate are eliminated to the extent of the interest in the associate.
Interest in a Joint Venture The interest in a 50%-owned joint venture, Unilever RFM Ice Cream, Inc. (URICI), is accounted for using the proportionate consolidation method, which involves consolidating a proportionate share of the joint venture’s assets, liabilities, income and expenses with similar items in the consolidated financial statements on a line-by-line basis. The financial statements of the joint venture are prepared for the same reporting period as the Parent Company.
Adjustments are made in the Group’s consolidated financial statements to eliminate the Group’s share of intragroup balances, income and expenses and unrealized gains and losses on transactions between the Group and its jointly controlled entity to the extent of its share in interest in joint venture. Losses on transactions are recognized immediately if the loss provides evidence of a reduction in the net realizable value of the current assets or an impairment loss. The joint venture is proportionately consolidated until the date on which the Group ceases to have joint control over the joint venture.
Impairment of Noncurrent Non-financial Assets The carrying values of property, plant and equipment, and investment in an associate are reviewed for impairment when events or changes in circumstances indicate that the carrying values may not be recoverable. If any such indication exists and where the carrying value exceeds the estimated recoverable amount, the asset or CGU is written down to their recoverable amount. The recoverable amount of the noncurrent non-financial assets is the greater of fair value less cost to sell and value-in-use. The fair value less cost to sell is the amount obtainable from the sale of an asset in an arm’s length transaction. In assessing value-in-use, the estimated future cash flows are discounted to their present value using a pre-tax discount rate that reflects current market assessments of the time value of money and the risks specific to the asset. For an asset that does not generate largely independent cash inflows, the recoverable amount is determined for the CGU to which the asset belongs. Impairment losses, if any, are recognized in the consolidated statement of income in those expense categories consistent with the function of the impaired asset.
Previously recognized impairment loss is reversed only if there has been a change in the assumptions used to determine the recoverable amount of an asset, but not, however, to an amount higher than the carrying amount that would have been determined (net of any depreciation and amortization) had there been no impairment loss recognized for the asset in prior years. A reversal of an impairment loss is recognized in the consolidated statement of income.
Capital Stock Capital stock is stated at par value for all shares issued and outstanding. When the Parent Company issues more than one class of stock, a separate account is maintained for each class of stock and the number of shares issued.
When the shares are sold at a premium, the difference between the proceeds and the par value is credited to the “Capital in excess of par value” account. When shares are issued for a consideration other than cash, the proceeds are measured by the fair value of the consideration received. In case shares are issued to extinguish or to settle the

liability of the Parent Company, the share shall be measured at either the fair value of the shares issued or fair value of the liability settled, whichever is more reliably determinable.
Direct costs incurred related to equity issuance, such as underwriting, accounting and legal fees, printing costs and taxes are charged to the “Capital in excess of par value” account.
Equity Reserve Equity reserve is the difference between the acquisition cost of an entity under common control and the Parent Company’s proportionate share in the net assets of the entity acquired as a result of a business combination accounted for using the pooling-of-interests method. Equity reserve is derecognized when the subsidiary is deconsolidated, which is the date on which control ceases.
Share-based Compensation Plan URICI, through Unilever Philippines, Inc., operates equity-settled, share-based compensation plans. The fair value of the employee services received in exchange for the grant of the options is recognized as an expense. The total amount to be expensed over the vesting period is determined by reference to the fair value of the options granted and including any market performance conditions, excluding the impact of any service and non-market performance vesting conditions (e.g. profitability, sales growth targets, employee of the entity remaining over a specified time period, etc.) and impact of any non-vesting conditions (e.g. the requirement for employees to serve).
Non-market vesting conditions are included in the assumptions on the number of options that are expected to vest. The total expense is recognized over the vesting period, which is the period over which all of the specified vesting conditions are to be satisfied. At the end of each reporting period, the entity revises its estimates of the number of options that are expected to vest based on the non-market vesting conditions. It recognizes the impact of the revision to original estimates, if any, in profit or loss, with a corresponding adjustment to equity.
When the options are exercised, URICI issues new shares. The proceeds received, net of any directly attributable transaction costs, are credited to share capital (nominal value) and share premium when the options are exercised. The grant of options over its equity instruments to the employees of URICI is treated as a capital contribution.
Retained Earnings Retained earnings represent the cumulative balance of periodic net income or loss, dividend contributions, correction of prior year errors, effect of changes in accounting policy and other capital adjustments. When the retained earnings account has a debit balance, it is called “deficit.” A deficit is not an asset but a deduction from equity.
Unappropriated retained earnings represent that portion which is free and can be declared as dividends to stockholders. Appropriated retained earnings represent that portion which has been restricted and, therefore, not available for dividend declaration.
Dividends on Common Shares Cash and property dividends on common shares are recognized as liability and deducted from equity when approved by the BOD of the Company. Stock dividends are treated as transfers from retained earnings to common shares.
Dividends for the year that are approved after the balance sheet date are dealt with as an event after the balance sheet date.
Revenue Recognition Revenue from sale of goods and services from manufacturing and service operations is recognized to the extent that it is probable that the economic benefits will flow to the Group and the amount of revenue can be reliably measured. Revenue is measured at the fair value of the consideration received or receivable excluding value-added tax (VAT), returns and discounts. The Group assesses its revenue arrangements against specific criteria in order to determine if it is acting as principal or an agent. The Group has concluded that it is acting as a principal in all of its revenue arrangements, except for RIBI, an insurance broker, which acts as an agent. The following specific recognition criteria must also be met before revenue is recognized.
Sale of goods (Manufacturing)

Revenue is recognized, net of applicable discounts, when the significant risks and rewards of ownership of the goods have passed to the buyer and there is actual delivery made and the same is accepted by the buyer.
Sale of services (Service)
Revenue is recognized upon performance of services in accordance with the substance of the relevant agreements.
Rent Rent income is recognized on a straight-line basis over the terms of the lease.
Interest and financing income
Interest income is recognized as the interest accrues using the effective interest method.
Dividend income Dividend income on investments in shares of stock is recognized when the Group’s right to receive the payment is established, which is the date when the dividend declaration is approved by the investee’s BOD and/or the stockholders.
Cost and Expense Recognition Cost of sales and services
Cost of sales is recognized when goods are delivered to and accepted by the buyer. Cost of services is recognized when the related services are performed.
Selling and marketing, and general and administrative expenses
Selling and marketing expenses are costs incurred to sell or distribute the goods. It includes export and documentation processing and delivery, among others. General and administrative expenses constitute costs of administering the business. Selling and marketing, and general and administrative expenses are expensed as incurred. Other Comprehensive Income (Loss)
Other comprehensive income (loss) comprises items of income and expense (including items previously presented under the consolidated statement of changes in equity) that are not recognized in the consolidated statement of income for the year in accordance with PFRS.
Pension Benefits The Group has defined benefit pension plans covering all permanent, regular, full-time employees administered by trustee banks. The cost of providing benefits under the defined benefit plans is determined using the projected unit credit actuarial valuation method. Actuarial gains and losses arising from experience adjustment and change in actuarial assumptions are reported in retained earnings in the period they are recognized as other comprehensive income.
The past service cost is recognized as an expense on a straight-line basis over the average period until the benefits become vested. If the benefits are already vested, immediately following the introduction of, or changes to, a pension plan, past service cost is recognized immediately. Gains or losses on the curtailment or settlement of pension benefits are recognized when the curtailment or settlement occurs.
The net pension obligation is the aggregate of the present value of the defined benefit obligation less past service cost not yet recognized and the fair value of plan assets out of which the obligation is to be settled directly.
Leases Finance leases, which transfer to the Group substantially all the risks and rewards incidental to ownership of the leased item, are capitalized at the inception of the lease at the fair value of the leased property or, if lower, at the present value of the minimum lease payments. Lease payments are apportioned between the finance charges and reduction of the lease liability so as to achieve a constant rate of interest on the remaining balance of the liability. Finance charges are recognized in the consolidated statement of income.
Capitalized leased assets are depreciated over the shorter of the estimated useful lives of the assets or the respective lease terms.
Leases where lessors retain substantially all the risks and benefits of ownership of the asset are classified as operating leases. Operating leases are recognized as expense in the consolidated statement of income on a straight-line basis over the lease term.
Income Taxes Current income tax
Current income tax assets and liabilities for the current and prior periods are measured at the amount expected to be recovered from or paid to the taxation authorities. The tax rates and tax laws used as basis to compute the amount are those that have been enacted or substantively enacted at the balance sheet date.
Deferred income tax Deferred income tax is provided, using the balance sheet liability method, on all temporary differences at the balance sheet date between the tax bases of assets and liabilities and their carrying amounts for financial reporting purposes.
Deferred income tax liabilities are recognized for all taxable temporary differences. Deferred income tax assets are recognized for all deductible temporary differences and carryforward benefits of unused tax credit from excess of minimum corporate income tax (MCIT) over regular corporate income tax (RCIT) [excess MCIT], and unused net operating loss carryover (NOLCO), to the extent that it is probable that sufficient future taxable profits will be available against which the deductible temporary differences and carryforward benefits of unused excess MCIT and NOLCO can be utilized.
The carrying amount of deferred income tax assets is reviewed at each balance sheet date and reduced to the extent that it is no longer probable that sufficient future taxable profits will be available to allow all or part of the deferred income tax assets to be utilized. Unrecognized deferred income tax assets are reassessed at each balance sheet date and are recognized to the extent that it has become probable that sufficient future taxable profits will allow the deferred income tax asset to be recovered.
Deferred income tax assets and deferred income tax liabilities are measured at the tax rates that are expected to apply to the year when the asset is realized or the liability is settled, based on tax rates and tax laws that have been enacted or substantively enacted at the balance sheet date.
Deferred income tax assets and deferred income tax liabilities are offset, if a legally enforceable right exists to offset current income tax assets against current income tax liabilities and the deferred income taxes relate to the same taxable entity and the same taxation authority.
Deferred income tax relating to items recognized directly in equity is recognized in the statement of comprehensive income. Deferred tax items are recognized in correlation to the underlying transaction either in other comprehensive income or directly in equity.
Earnings Per Share Basic earnings per share is computed by dividing the net income for the year by the weighted average number of common shares outstanding during the year after giving retroactive effect to any stock split or stock dividends declared and stock rights exercised during the year, if any.
The Group does not have potentially dilutive common shares.
Segment Reporting The Group’s operating businesses are organized and managed separately according to the nature of the products provided, with each segment representing a strategic business unit that offers different products and serves different markets.
Foreign Currency-Denominated Transactions and Translations Transactions in foreign currencies are recorded using the functional currency exchange rate at the date of the transaction. Outstanding monetary assets and liabilities denominated in foreign currencies are translated using the closing exchange rate at the balance sheet date. All differences are taken to the consolidated statement of income. Non-monetary items that are measured in terms of historical cost in a foreign currency are translated using the exchange rates as at the dates of the initial transactions.
When a gain or loss on a non-monetary item is recognized in other comprehensive income, any foreign exchange component of that gain or loss shall be recognized in the Parent Company statement of comprehensive income. Conversely, when a gain or loss on a non-monetary item is recognized in the profit or loss, any exchange component of that gain or loss shall be recognized in the Parent Company statement of income. Provisions and Contingencies Provisions are recognized when the Group has a present obligation (legal or constructive) as a result of a past event, it is probable (i.e., more likely than not) that an outflow of resources embodying economic benefits will be required to settle the obligation, and a reliable estimate can be made of the amount of the obligation. Where the Group expects some or all of the provision to be reimbursed, the reimbursement is recognized as a separate asset, but only when the reimbursement is virtually certain. The expense relating to any provision is presented in the consolidated statement of income, net of reimbursement. If the effect of the time value of money is material, provisions are discounted using the current pre-tax rate that reflects, where appropriate, the risks specific to the liability. Where discounting is used, the increase in the provision due to the passage of time is recognized as interest expense.
Contingent liabilities are not recognized in the consolidated financial statements but are disclosed in the notes to consolidated financial statements unless the outflow of resources embodying economic benefits is remote. Contingent assets are not recognized in the consolidated financial statements but disclosed in the notes to consolidated financial statements when an inflow of economic benefits is probable.
Events After the Balance Sheet Date Events after the balance sheet date that provide additional information about the Group’s position at the balance sheet date (adjusting events) are reflected in the consolidated financial statements. Events after the balance sheet date that are not adjusting events are disclosed in the notes to the consolidated financial statements when material.
Future Changes in Accounting Policies
The Group will adopt the following standards and interpretations when these become effective. Except as otherwise indicated, the Group does not expect the adoption of these new and amended PFRS, PAS and Philippine Interpretations based on International Financial Reporting Interpretations Committee (IFRIC) interpretations to have significant impact on its financial statements:
Effective in 2013
• PFRS 7, Financial Instruments: Disclosures - Offsetting Financial Assets and Financial Liabilities, requires an entity to disclose information about rights of set-off and related arrangements (such as collateral agreements). The new disclosures are required for all recognized financial instruments that are set off in accordance with PAS 32. These disclosures also apply to recognized financial instruments that are subject to an enforceable master netting arrangement or “similar agreement”, irrespective of whether they are set-off in accordance with PAS 32. The amendments require entities to disclose, in a tabular format unless another format is more appropriate, the following minimum quantitative information. This is presented separately for financial assets and financial liabilities recognized at the end of the reporting period:
a. The gross amounts of those recognized financial assets and recognized financial liabilities; b. The amounts that are set off in accordance with the criteria in PAS 32 when determining the net amounts
presented in the balance sheet; c. The net amounts presented in the balance sheet; d. The amounts subject to an enforceable master netting arrangement or similar agreement that are not
otherwise included in (b) above, including: i. Amounts related to recognized financial instruments that do not meet some or all of the offsetting
criteria in PAS 32; and, ii. Amounts related to financial collateral (including cash collateral); and,
e. The net amount after deducting the amounts in (d) from the amounts in (c) above.
The amendments to PFRS 7 are to be retrospectively applied for annual periods beginning on or after January 1, 2013. The amendments affect disclosures only and have no impact on the Group’s financial position or performance.
• PFRS 10, Consolidated Financial Statements, replaces the portion of PAS 27, Consolidated and Separate
Financial Statements, that addresses the accounting for consolidated financial statements. It also includes the

issues raised in Standards Interpretations Committee (SIC) 12, Consolidation - Special Purpose Entities. PFRS 10 establishes a single control model that applies to all entities including special purpose entities. The changes introduced by PFRS 10 will require management to exercise significant judgment to determine which entities are controlled, and therefore, are required to be consolidated by a parent, compared with the requirements that were in PAS 27.
A reassessment of control was performed by the Parent Company on all its subsidiaries in accordance with the provisions of PFRS 10. Following the reassessment, the Parent Company determined that it has control on all of its subsidiaries currently being consolidated to its consolidated financial statements. Such, the Parent Company will continue to include those subsidiaries in its consolidated financial statements.
• PFRS 11, Joint Arrangements, replaces PAS 31, Interests in Joint Ventures, and SIC 13, Jointly Controlled
Entities - Non-Monetary Contributions by Venturers. PFRS 11 removes the option to account for jointly controlled entities using proportionate consolidation. Instead, jointly controlled entities that meet the definition of a joint venture must be accounted for using the equity method.
The Parent Company has an existing joint venture arrangement with a domestic entity that falls within the scope of this standard. Currently, proportionate consolidation is applied for this joint venture.
On November 22, 2012, the Parent Company was granted by the Philippine SEC an exemptive relief on the adoption of this standard given the peculiarities of its arrangement with the other joint venturer. Such, the Parent Company will continue to consolidate proportionately the said joint venture in 2013 when this PFRS becomes effective.
• PFRS 12, Disclosure of Interests in Other Entities, includes all of the disclosures related to consolidated financial statements that were previously in PAS 27, as well as all the disclosures that were previously included in PAS 31 and PAS 28, Investments in Associates. These disclosures relate to an entity’s interests in subsidiaries, joint arrangements, associates and structured entities. A number of new disclosures are also required. The adoption of PFRS 12 will affect disclosures only and have no impact on the Group’s financial position or performance.
• PFRS 13, Fair Value Measurement, establishes a single source of guidance under PFRS for all fair value measurements. PFRS 13 does not change when an entity is required to use fair value, but rather provides guidance on how to measure fair value under PFRS when fair value is required or permitted. This standard should be applied prospectively as of the beginning of the annual period in which it is initially applied. Its disclosure requirements need not be applied in comparative information provided for periods before initial application of PFRS 13. The Group does not anticipate that the adoption of this standard will have a significant impact on its financial position and performance.
• PAS 1, Presentation of Financial Statements - Presentation of Items of Other Comprehensive Income or OCI
(Amendments), changes the grouping of items presented in OCI. Items that can be reclassified (or “recycled”) to profit or loss at a future point in time (for example, upon derecognition or settlement) will be presented separately from items that will never be recycled. The amendments will be applied retrospectively and will result to the modification of the presentation of items of OCI.
• PAS 19, Employee Benefits (Revised), ranges from fundamental changes such as removing the corridor mechanism and the concept of expected returns on plan assets to simple clarifications and rewording. The revised standard also requires new disclosures such as, among others, a sensitivity analysis for each significant actuarial assumption, information on asset-liability matching strategies, duration of the defined benefit obligation, and disaggregation of plan assets by nature and risk. Once effective, the Group has to apply the amendments retroactively to the earliest period presented.
The Parent Company reviewed its existing employee benefits and determined that the amended standard has significant impact on its accounting for retirement benefits. The Parent Company obtained the services of an external actuary to compute the impact to the financial statements upon adoption of the standard. The effects are detailed below:
Increase (decrease) in: Statement of Comprehensive Income 2012 2011
Net pension benefit cost P=9,645 P=4,541
Net income for the year (9,645) (4,541)Other comprehensive income 9,645 4,541
• PAS 27, Separate Financial Statements (as revised in 2011), limits its contents to accounting for subsidiaries, jointly controlled entities, and associates in separate financial statements as a consequence of the new PFRS 10 and PFRS 12. This amendment has no impact on the Group’s financial position or performance.
• PAS 28, Investments in Associates and Joint Ventures (as revised in 2011), renames PAS 28 as PAS 28, Investments in Associates and Joint Ventures, as a consequence of the new PFRS 11 and PFRS 12. It describes the application of the equity method to investments in joint ventures in addition to associates. The Group is already applying the equity method in accounting its investment in an associate.
• Philippine Interpretation IFRIC 20, Stripping Costs in the Production Phase of a Surface Mine, applies to waste removal (stripping) costs incurred in surface mining activity, during the production phase of the mine. The interpretation addresses the accounting for the benefit from the stripping activity. This new interpretation is not relevant to the Group.
Effective in 2014
• PAS 32, Financial Instruments: Presentation - Offsetting Financial Assets and Financial Liabilities
(Amendments), clarify the meaning of “currently has a legally enforceable right to set-off” and also clarify the application of the PAS 32 offsetting criteria to settlement systems (such as central clearing house systems) which apply gross settlement mechanisms that are not simultaneous. The amendments affect presentation only and have no impact on the Group’s financial position or performance. The amendments to PAS 32 are to be retrospectively applied for annual periods beginning on or after January 1, 2014.
Effective in 2015
• PFRS 9, Financial Instruments: Classification and Measurement, as issued, reflects the first phase on the replacement of PAS 39, Financial Instruments: Recognition and Measurement, and applies to the classification and measurement of financial assets and liabilities as defined in PAS 39. Work on impairment of financial instruments and hedge accounting is still ongoing, with a view to replacing PAS 39 in its entirety. PFRS 9 requires all financial assets to be measured at fair value at initial recognition. A debt financial asset may, if the fair value option (FVO) is not invoked, be subsequently measured at amortized cost if it is held within a business model that has the objective to hold the assets to collect the contractual cash flows and its contractual terms give rise, on specified dates, to cash flows that are solely payments of principal and interest on the principal outstanding. All other debt instruments are subsequently measured at fair value through profit or loss. All equity financial assets are measured at fair value either through other comprehensive income (OCI) or profit or loss. Equity financial assets held for trading must be measured at fair value through profit or loss. For FVO liabilities, the amount of change in the fair value of a liability that is attributable to changes in credit risk must be presented in OCI. The remainder of the change in fair value is presented in profit or loss, unless presentation of the fair value change in respect of the liability’s credit risk in OCI would create or enlarge an accounting mismatch in profit or loss. All other PAS 39 classification and measurement requirements for financial liabilities have been carried forward into PFRS 9, including the embedded derivative separation rules and the criteria for using the FVO. The adoption of the first phase of PFRS 9 will have an effect on the classification and measurement of the Group’s financial assets, but will potentially have no impact on the classification and measurement of financial liabilities. The Group is in the process of determining the impact of this standard on its financial position or performance.
Deferred by SEC
• Philippine Interpretation IFRIC 15, Agreements for the Construction of Real Estate, covers accounting for revenue and associated expenses by entities that undertake the construction of real estate directly or through subcontractors. The interpretation requires that revenue on construction of real estate be recognized only upon completion, except when such contract qualifies as construction contract to be accounted for under PAS 11 or involves rendering of services in which case revenue is recognized based on stage of completion. Contracts involving provision of services with the construction materials and where the risks and reward of ownership are transferred to the buyer on a
continuous basis will also be accounted for based on stage of completion. The SEC and the Financial Reporting Standards Council (FRSC) have deferred the effectivity of this interpretation until the final Revenue standard is issued by the International Accounting Standards Board (IASB) and an evaluation of the requirements of the final Revenue standard against the practices of the Philippine real estate industry is completed. This interpretation is not relevant to the Group.
Annual Improvements to PFRS (2009-2011 cycle)
The Annual Improvements to PFRS (2009-2011 cycle) contain non-urgent but necessary amendments to PFRS. The amendments are effective for annual periods beginning on or after January 1, 2013 and are applied retrospectively. Earlier application is permitted.
• PFRS 1, First-time Adoption of PFRS - Borrowing Costs, clarifies that, upon adoption of PFRS, an entity that capitalized borrowing costs in accordance with its previous generally accepted accounting principles, may carry forward, without any adjustment, the amount previously capitalized in its opening statement of financial position at the date of transition. Subsequent to the adoption of PFRS, borrowing costs are recognized in accordance with PAS 23, Borrowing Costs.
• PAS 1, Presentation of Financial Statements - Clarification of the Requirements for Comparative
Information, clarifies the requirements for comparative information that are disclosed voluntarily and those that are mandatory due to retrospective application of an accounting policy, or retrospective restatement or reclassification of items in the financial statements. An entity must include comparative information in the related notes to the financial statements when it voluntarily provides comparative information beyond the minimum required comparative period. The additional comparative period does not need to contain a complete set of financial statements. On the other hand, supporting notes for the third balance sheet (mandatory when there is a retrospective application of an accounting policy, or retrospective restatement or reclassification of items in the financial statements) are not required.
• PAS 16, Property, Plant and Equipment - Classification of Servicing Equipment, clarifies that spare parts, stand-by equipment and servicing equipment should be recognized as property, plant and equipment when they meet the definition of property, plant and equipment and should be recognized as inventory, if otherwise.
• PAS 32, Financial Instruments: Presentation - Tax Effect of Distribution to Holders of Equity Instruments, clarifies that income taxes relating to distributions to equity holders and to transaction costs of an equity transaction are accounted for in accordance with PAS 12, Income Taxes.
• PAS 34, Interim Financial Reporting - Interim Financial Reporting and Segment Information for Total Assets
and Liabilities, clarifies that the total assets and liabilities for a particular reportable segment need to be disclosed only when the amounts are regularly provided to the chief operating decision maker and there has been a material change from the amount disclosed in the entity’s previous annual financial statements for that reportable segment.
The Group continues to assess the impact of the above new and amended accounting standards and interpretations effective subsequent to the December 31, 2012 financial statements. Additional disclosures required by these amendments will be included in the financial statements when these amendments are adopted.
3. Management’s Use of Significant Judgments, Accounting Estimates and Assumptions
The preparation of the Group’s consolidated financial statements requires management to exercise judgments, make accounting estimates and use assumptions that affect the amounts reported and the disclosures made. The estimates and assumptions used in the consolidated financial statements are based upon management’s evaluation of relevant facts and circumstances as of the date of the financial statements. Actual results could differ from these estimates, and such estimates will be adjusted accordingly, when the effects become determinable.
Accounting judgments, estimates and assumptions are continually evaluated and are based on historical experience and other factors, including expectations of future events that are believed to be reasonable under the circumstances.
Judgments
In the process of applying the Group’s accounting policies, management has made the following judgments apart from those involving estimations, which have the most significant effect in the amounts recognized in the consolidated financial statements.
Classification of financial instruments
The Group exercises judgment in classifying financial instruments in accordance with PAS 39. The Group classifies a financial instrument, or its component parts, on initial recognition as a financial asset, a financial liability or an equity instrument in accordance with the substance of the contractual arrangement and the definitions of a financial asset, a financial liability or an equity instrument. The substance of a financial instrument, rather than its legal form, governs its classification in the consolidated balance sheet. Classification of financial instruments is reviewed at each balance sheet date.
The classifications of financial assets and liabilities are presented in Note 33.
Impairment of AFS financial assets
The Group determines that AFS financial assets are impaired when there has been a significant or prolonged decline in the fair value below their cost. This determination of what is “significant” or “prolonged” requires judgment. The Group treats “significant” generally as 20% or more and “prolonged” as greater than 12 months for the quoted equity securities. Impairment may be appropriate when there is evidence of deterioration in the financial health of the investee, industry and sector performance, changes in technology, and operational and financing cash flows. As of December 31, 2012 and 2011, AFS financial assets in equity securities amounted to P=329.71 million and P=946.62 million, respectively (see Note 12a). In 2012, in light of the changing business model of Philtown, the Group performed an impairment testing of its AFS financial assets in Philtown using the “Adjusted Net Asset Method”. In using this method, the fair values of the assets and liabilities of Philtown were determined as of impairment testing date, December 31, 2012. The computed fair values of the total assets of Philtown were applied against the computed fair values of its total liabilities according to priority and the residual assets were applied against the amount of the preferred and common shares held by the Group. The Group determined that its AFS financial assets are impaired.
Impairment loss was recognized on its AFS financial assets amounting to P=545.86 million in 2012. No impairment loss was recognized in 2011 and 2010 (see Note 12a).
Provisions and contingencies
The estimate of the probable costs for the resolution of possible third party claims has been developed in consultation with outside consultant/legal counsel handling the Group’s defense on these matters and is based upon an analysis of potential results. When management and its outside consultant/legal counsel believe that the eventual liabilities under these and any other claims, if any, will not have a material effect on the consolidated financial statements, no provision for probable losses is recognized in the Group’s consolidated financial statements. The amount of provision is being reassessed at least on an annual basis to consider new relevant information.
Total provisions amounted to P=67.98 million and P=52.16 million as of December 31, 2012 and 2011, respectively (see Notes 19 and 31d).
Determination of the classification of leases
The Group has entered into various lease agreements as a lessee. The Group accounts for lease arrangements as finance lease when the lease term is for the major part of the life of the asset and the Group has the option to purchase the asset at a price that is expected to be sufficiently lower than the fair value at the date the option is exercisable. Otherwise, the leases are accounted for as operating leases.
Obligations under finance lease and aggregate minimum lease payments are disclosed under Note 18.
Accounting Estimates and Assumptions The key estimates and assumptions concerning the future and other key sources of estimation at the balance sheet date that have a significant risk of causing a material adjustment to the carrying amount of assets and liabilities within the next financial year are discussed below.
Determination of fair value of financial instruments
Financial assets and financial liabilities, on initial recognition, are accounted for at fair value. The fair values of financial assets and financial liabilities, on initial recognition are normally the transaction price. In the case of those financial assets that have no active markets, fair values are determined using an appropriate valuation technique. Valuation techniques are used particularly for financial assets and financial liabilities (including derivatives) that are not quoted in an active market. Where valuation techniques are used to determine fair values (discounted cash flow, option models), they are periodically reviewed by qualified personnel who are independent of the trading function. All models are calibrated to ensure that outputs reflect actual data and comparative market prices. To the extent practicable, models use only observable data as valuation inputs. However, other inputs such as credit risk (whether that of the Group or the counterparties), forward prices, volatilities and correlations, require management to develop estimates or make adjustments to observable data of comparable instruments. The amount of changes in fair values would differ if the Group uses different valuation assumptions or other acceptable methodologies. Any change in fair value of these financial instruments (including derivatives) would affect either the consolidated statement of income or comprehensive income.
The carrying values and the fair values of financial assets and financial liabilities as of December 31, 2012 and 2011 are disclosed in Note 34.
Estimation of allowance for doubtful accounts
The Group maintains allowance for doubtful accounts based on the results of the individual and collective assessments. Under the individual assessment, the Group is required to obtain the present value of estimated cash flows using the receivable’s original effective interest rate. Impairment loss is determined as the difference between the receivable’s carrying balance and the computed present value. If no future cash flows is expected, impairment loss is equal to the carrying balance of the receivables. Factors considered in individual assessment are payment history, inactive accounts, past due status and term. The collective assessment would require the Group to classify its receivables based on the credit risk characteristics (customer type, payment history, past due status and term) of the customers. Impairment loss is then determined based on historical loss experience of the receivables grouped per credit risk profile. Historical loss experience is adjusted on the basis of current observable data to reflect the effects of current conditions that did not affect the period on which the historical loss experience is based and to remove the effects of conditions in the historical period that do not exist currently. The methodology and assumptions used for the individual and collective assessments are based on management’s judgment and estimate. Therefore, the amount and timing of recorded expense for any period would differ depending on the judgments and estimates made during the year.
As of December 31, 2012 and 2011, the carrying value of accounts receivable amounted to P=2,587.68 million and P=1,904.87 million, respectively (see Note 7). As of December 31, 2012 and 2011, advances to related parties amounted to P=89.25 million and P=211.97 million, respectively (see Note 26). The related allowance for doubtful accounts for both accounts amounted to P=894.03 million and P=1,590.37 million as of December 31, 2012 and 2011, respectively (see Notes 7, 26 and 33).
In 2012 and 2011, the Group wrote off P=736.43 million and P=62.15 million from its accounts receivable and advances to related parties (Note 33).
Estimation of inventory obsolescence
The Group estimates the allowance for inventory obsolescence related to inventories based on a certain percentage of non-moving inventories. The level of allowance is evaluated by management based on past experiences and other factors affecting the salability of goods such as present demand in the market and emergence of new products, among others.
The Group’s allowance for inventory obsolescence amounted to P=151.37 million and P=159.35 million as of December 31, 2012 and 2011, respectively (see Note 8). As of December 31, 2012 and 2011, the carrying values of inventories at cost amounted to P=1,557.82 million and P=1,425.51 million, respectively (see Note 8).
Determination of NRV of inventories
The Group’s estimates of the NRV of inventories are based on the most reliable evidence available at the time the estimates are made, of the amount that the inventories are expected to be realized. These estimates consider the fluctuations of price or cost directly relating to events occurring after the end of the period to the extent that such
events confirm conditions existing at the end of the period. A new assessment is made at NRV in each subsequent period. When the circumstances that previously caused inventories to be written down below cost no longer exist or when there is a clear evidence of an increase in NRV because of change in economic circumstances, the amount of the write-down is reversed so that the new carrying amount is the lower of the cost and the revised NRV. The Group’s inventories stated at NRV amounted to P=231.23 million and P=179.71 million as of December 31, 2012 and 2011, respectively (see Note 8).
The Group’s inventories amounting to P=127.69 million and P=153.95 million as of December 31, 2012 and 2011, respectively, were fully provided with allowance (see Note 8).
Estimation of allowance for probable losses
Allowance for probable losses of prepaid expenses is based on the ability of the Group to recover the carrying value of the assets. Accounts estimated to be potentially unrecoverable are provided with adequate allowance through charges to the consolidated statement of income in the form of allowance for probable loss.
The allowance for probable losses pertaining to prepaid expenses amounted to P=33.65 million as of December 31, 2012 and 2011 (see Note 9). Other current assets amounted to P=192.23 million and P=340.27 million as of December 31, 2012 and 2011, respectively.
Estimation of useful lives of property, plant and equipment and investment properties The Group estimates the useful lives of depreciable property, plant and equipment and investment properties based on a collective assessment of similar businesses, internal technical evaluation and experience with similar assets. Estimated useful lives are based on the periods over which the assets are expected to be available for use. The estimated useful lives are reviewed periodically and are updated if expectations differ from previous estimates due to physical wear and tear, technical and commercial obsolescence and legal or other limits on the use of the assets. It is possible, however, that future results of operations could be materially affected by changes in the amounts and timing of recorded expenses brought about by changes in the factors mentioned above. A reduction in the estimated useful life of any item of property, plant and equipment and investment properties would increase the recorded operating expenses and decrease the carrying value of the assets and vice versa. The estimated useful lives of property, plant and equipment and investment properties are discussed in Note 2 to the consolidated financial statements. There had been no changes in the estimated useful lives of property, plant and equipment and investment properties in 2012 and 2011.
The carrying values of these property, plant and equipment valued at cost amounted to P=2,758.38 million and P=2,674.22 million as of December 31, 2012 and 2011, respectively (see Note 10). The carrying values of investment properties amounted to P=56.93 million and P=78.02 million as of December 31, 2012 and 2011, respectively (see Note 11).
Valuation of land under revaluation basis The Group’s parcels of land are carried at revalued amounts, which approximate their fair values at the date of the revaluation, less any subsequent accumulated depreciation and accumulated impairment losses. The revaluation is performed by professionally qualified appraisers. Revaluations are made every three to five years to ensure that the carrying amounts do not differ materially from those which would be determined using fair values at the balance sheet date.
The appraisal increase on the valuation of land based on the appraisal report amounting to P=568.94 million as of December 31, 2012 and 2011 is presented as “Revaluation increment on land” account, net of deferred income tax effect of P=243.83 million, in the equity section of the consolidated balance sheets (see Notes 10 and 29).
Impairment of property, plant and equipment, investment properties
and investment in an associate
The Group assesses whether there are indications of impairment on its property, plant and equipment, investment properties and investment in an associate, at least on an annual basis. If there are, impairment testing is performed. This requires an estimation of the value-in-use of the CGUs to which the assets belong. Estimating the value-in-use requires the Group to make an estimate of the expected future cash flows from the CGU and also to choose a suitable discount rate in order to calculate the present value of those cash flows.
Impairment loss recognized on property, plant and equipment amounted to P=5.24 million in 2012 and nil in 2011 and 2010. The carrying value of property, plant and equipment valued at cost amounted to P=2,758.38 million and P=2,674.22 million as of December 31, 2012 and 2011, respectively (see Note 10). Accumulated impairment loss on property, plant and equipment amounted to P=26.54 million and P=21.30 million as of December 31, 2012 and 2011. The carrying value of investment properties amounted to P=56.93 million as of December 31, 2012 and P=78.02 million as of December 31, 2011 (see Note 11).
As of December 31, 2012 and 2011, the carrying value of investment in an associate amounted to P=138.85 million and P=233.41 million, respectively (see Note 12b). No impairment loss was recognized for investment properties and investment in an associate in 2012, 2011 and 2010.
Impairment of goodwill
The Group reviews the carrying value of goodwill for impairment annually or more frequently if events or changes in circumstances indicate that the carrying value may be impaired. The Group performs impairment test of goodwill annually every December 31. Impairment is determined for goodwill by assessing the recoverable amount of the CGU or group of CGUs to which the goodwill relates. Assessments require the use of estimates and assumptions such as discount rates, future capital requirements and operating performance. If the recoverable amount of the unit exceeds the carrying amount of the CGU, the CGU and the goodwill allocated to that CGU shall be regarded as not impaired. Where the recoverable amount of the CGU or group of CGUs is less than the carrying amount of the CGU or group of CGUs to which goodwill has been allocated, an impairment loss is recognized. In 2012, the Parent Company performed an impairment test with respect to its goodwill resulting from its acquisition of URICI amounting to P=190.56 million as of December 31, 2012 and 2011 (see Note 14). The Parent Company used a discount rate of 4.11% and a growth rate on sales of URICI by 15% to 17% for the succeeding five years. No impairment losses were recognized for the years ended December 31, 2012 and 2011.
Recognition of deferred income tax assets
The Group reviews the carrying amounts of deferred income tax assets at each balance sheet date and adjusts the balance of deferred income tax assets to the extent that it is no longer probable that sufficient future taxable profits will be available to allow all or part of the deferred income tax assets to be utilized.
Deferred income tax assets recognized amounted to P=141.35 million and P=137.40 million as of December 31, 2012 and 2011, respectively (see Note 29).
Deferred income tax assets on certain deductible temporary differences, carryforward benefits of NOLCO and excess MCIT amounting to P=1,156.65 million and P=1,818.42 million as of December 31, 2012 and 2011, respectively, were not recognized because the Group believes that it is not probable that it will have sufficient future taxable profits against which these items can be utilized (see Note 29).
Estimation of pension benefits obligations and costs
The determination of the Group’s obligation and costs of pension benefits depends on the selection by management of certain assumptions used by the actuary in calculating such amounts. Those assumptions are described in Note 27 and include, among others the discount rate, expected rate of return and rate of salary increase. The Group recognizes all actuarial gains and losses in the consolidated statement of comprehensive income, and therefore generally affects the recorded obligation. While management believes that the Group’s assumptions are reasonable and appropriate, significant differences in actual experience or significant changes in assumptions may materially affect the Group’s pension obligation.
Net pension obligation amounted to P=28.15 million and P=103.84 million as of December 31, 2012 and 2011, respectively. Pension benefits costs amounted to P=19.41 million in 2012, P=18.04 million in 2011 and P=24.23 million in 2010 (see Note 27).
Use of effective interest rate
The Group made reference to the prevailing market interest rates for instruments of the same tenor in choosing the discount rates used to determine the net present value of long-term non-interest-bearing receivable from Manila Electric Company (Meralco), advances to and from related parties and other long-term financial assets and obligations.
Receivable from Meralco, included under “Other current assets” account in the 2012 and 2011 consolidated balance sheets, amounted to nil and P=3.04 million, respectively (see Note 9).

4. Segment Information
The Group’s management reports its operating business segments into the following: (a) institutional business, (b) consumer business, and (c) other operations. The institutional business segment primarily manufactures and sells flour, pasta, bakery and other bakery products to institutional customers. The consumer business segment manufactures and sells ice cream, meat, milk and juices, pasta products, and flour and rice-based mixes. Other segments consist of insurance, financing, lighterage, moving, cargo handling, office space leasing and other services shown in aggregate as “Other operations”.
The operating businesses are organized and managed separately according to the nature of the products and services provided, with each segment representing a strategic business unit that offers different products and serves different markets. All operating business segments used by the Group meet the definition of reportable segment under PFRS 8.
Management monitors the operating results of its business units separately for the purpose of making decisions about resource allocation and performance assessment. Segment performance is evaluated based on operating profit or loss and is measured consistently with operating profit or loss in the consolidated financial statements.
Segment assets include all operating assets used by a segment and consist principally of operating cash, receivables, inventories and property, plant and equipment, net of allowances and provisions. Segment liabilities include all operating liabilities and consist principally of trade, wages and taxes currently payable and accrued liabilities.
Intersegment transactions, i.e., segment revenues, segment expenses and segment results, include transfers between business segments. Those transfers are eliminated in consolidation and reflected in the “eliminations” column.
The Group does not have a single external customer from which revenue generated amounted to 10% or more of the total revenue of the Group.
Information with regard to the Group’s significant business segments follows:
2012
Consumer
Business
Institutional
Business
Other
Operations
Unallocated Corporate
Balances
Total
Eliminations
Consolidated
Net Sales External sales P=7,159,702 P=3,816,614 P=6,669 P=15,064 P=10,998,049 P=– P=10,998,049 Intersegment sales 3,340 626,232 92,430 – 722,002 (722,002) –
P=7,163,042 P=4,442,846 P=99,099 P=15,064 P=11,720,051 (P=722,002) P=10,998,049
Results Interest and other financial charges - net (P=18,866) (P=4,308) (P=5,165) (P=66,954) (P=95,293) P=– (P=95,292)
Equity in net earnings of an associate P=– P=– P=11,172 P=– P=11,172 P=– P=11,172
Income (loss) before provision for income tax and non-controlling interest P=362,585 P=867,225 (P=50,075) P=225,228 P=1,404,963 (P=461,501) P=943,462
Provision for income tax (172,608) (32,654) (1,505) (54,424) (261,191) – (261,191)
Net income (loss) P=189,977 P=834,571 (P=51,580) P=170,804 P=1,143,772 (P=461,501) P=682,271
Other information Segment assets P=7,767,427 P=7,618,668 P=1,202,663 P=2,773,421 P=19,362,179 (P=8,569,207) P=10,792,972 Investments 463,323 – 107,362 1,134,380 1,705,065 (1,236,508) 468,557 Deferred income tax assets 82,859 3,239 2,280 – 88,378 – 88,378
Consolidated Total Assets P=8,313,609 P=7,621,907 P=1,312,305 P=3,907,801 P=21,155,622 (P=9,805,715) P=11,349,907
Consolidated Total Liabilities P=8,360,641 P=2,575,207 P=1,127,751 P=2,890,214 P=14,953,813 (P=9,156,455) P=5,797,358
Capital expenditures P=477,973 P=93,300 P=25,629 P=7,396 P=604,298 P=– P=604,298 Depreciation and amortization 172,241 80,428 57,742 5,184 315,595 – Noncash expenses other than depreciation
and amortization 23,361 76,392 5,494 110,256 215,503 – 215,503
2011
Consumer Business
Institutional
Business
Other
Operations
Unallocated Corporate Balances
Total
Eliminations
Consolidated
Net Sales External sales P=6,233,238 P=4,076,155 P=26,929 P=– P=10,336,322 P=– P=10,336,322 Intersegment sales 62,177 484,677 47,092 – 593,946 (593,946) –
P=6,295,415 P=4,560,832 P=74,021 P=– P=10,930,268 (P=593,946) P=10,336,322
Results Interest and other financial charges - net (P=65,863) (P=1,251) P=9,341 (P=53,318) (P=111,091) P=– (P=111,091)
Equity in net earnings of an associate
P=–
P=–
P=12,451
P=–
P=12,451
P=–
P=12,451
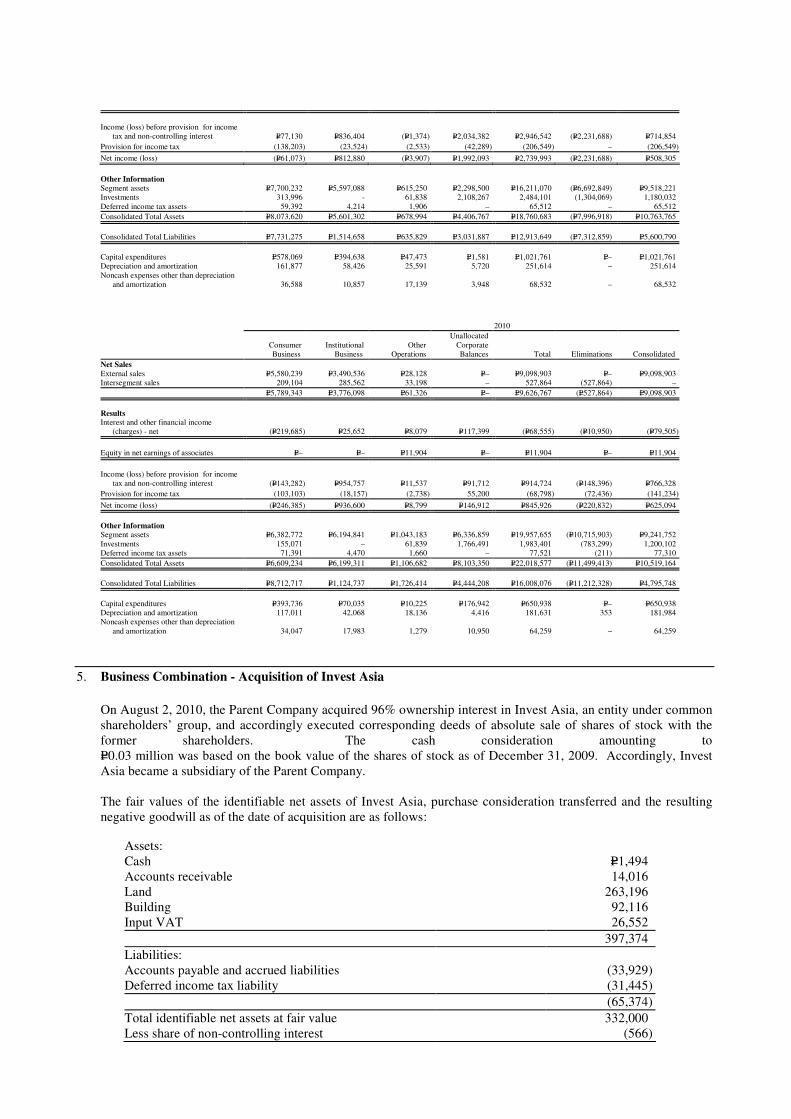
Income (loss) before provision for income tax and non-controlling interest
P=77,130
P=836,404
(P=1,374)
P=2,034,382
P=2,946,542
(P=2,231,688)
P=714,854
Provision for income tax (138,203) (23,524) (2,533) (42,289) (206,549) – (206,549)
Net income (loss) (P=61,073) P=812,880 (P=3,907) P=1,992,093 P=2,739,993 (P=2,231,688) P=508,305
Other Information Segment assets P=7,700,232 P=5,597,088 P=615,250 P=2,298,500 P=16,211,070 (P=6,692,849) P=9,518,221 Investments 313,996 - 61,838 2,108,267 2,484,101 (1,304,069) 1,180,032 Deferred income tax assets 59,392 4,214 1,906 – 65,512 – 65,512
Consolidated Total Assets P=8,073,620 P=5,601,302 P=678,994 P=4,406,767 P=18,760,683 (P=7,996,918) P=10,763,765
Consolidated Total Liabilities P=7,731,275 P=1,514,658 P=635,829 P=3,031,887 P=12,913,649 (P=7,312,859) P=5,600,790
Capital expenditures P=578,069 P=394,638 P=47,473 P=1,581 P=1,021,761 P=– P=1,021,761 Depreciation and amortization 161,877 58,426 25,591 5,720 251,614 – 251,614 Noncash expenses other than depreciation
and amortization
36,588
10,857
17,139
3,948
68,532
–
68,532
2010
Consumer Business
Institutional
Business
Other
Operations
Unallocated Corporate Balances
Total
Eliminations
Consolidated
Net Sales External sales P=5,580,239 P=3,490,536 P=28,128 P=– P=9,098,903 P=– P=9,098,903 Intersegment sales 209,104 285,562 33,198 – 527,864 (527,864) –
P=5,789,343 P=3,776,098 P=61,326 P=– P=9,626,767 (P=527,864) P=9,098,903
Results Interest and other financial income
(charges) - net
(P=219,685)
P=25,652
P=8,079
P=117,399
(P=68,555)
(P=10,950)
(P=79,505)
Equity in net earnings of associates
P=–
P=–
P=11,904
P=–
P=11,904
P=–
P=11,904
Income (loss) before provision for income tax and non-controlling interest
(P=143,282)
P=954,757
P=11,537
P=91,712
P=914,724
(P=148,396)
P=766,328
Provision for income tax (103,103) (18,157) (2,738) 55,200 (68,798) (72,436) (141,234)
Net income (loss) (P=246,385) P=936,600 P=8,799 P=146,912 P=845,926 (P=220,832) P=625,094
Other Information Segment assets P=6,382,772 P=6,194,841 P=1,043,183 P=6,336,859 P=19,957,655 (P=10,715,903) P=9,241,752 Investments 155,071 – 61,839 1,766,491 1,983,401 (783,299) 1,200,102 Deferred income tax assets 71,391 4,470 1,660 – 77,521 (211) 77,310
Consolidated Total Assets P=6,609,234 P=6,199,311 P=1,106,682 P=8,103,350 P=22,018,577 (P=11,499,413) P=10,519,164
Consolidated Total Liabilities P=8,712,717 P=1,124,737 P=1,726,414 P=4,444,208 P=16,008,076 (P=11,212,328) P=4,795,748
Capital expenditures P=393,736 P=70,035 P=10,225 P=176,942 P=650,938 P=– P=650,938 Depreciation and amortization 117,011 42,068 18,136 4,416 181,631 353 181,984 Noncash expenses other than depreciation
and amortization
34,047
17,983
1,279
10,950
64,259
–
64,259
5. Business Combination - Acquisition of Invest Asia
On August 2, 2010, the Parent Company acquired 96% ownership interest in Invest Asia, an entity under common shareholders’ group, and accordingly executed corresponding deeds of absolute sale of shares of stock with the former shareholders. The cash consideration amounting to P=0.03 million was based on the book value of the shares of stock as of December 31, 2009. Accordingly, Invest Asia became a subsidiary of the Parent Company.
The fair values of the identifiable net assets of Invest Asia, purchase consideration transferred and the resulting negative goodwill as of the date of acquisition are as follows:
Assets: Cash P=1,494 Accounts receivable 14,016 Land 263,196 Building 92,116 Input VAT 26,552
397,374
Liabilities: Accounts payable and accrued liabilities (33,929) Deferred income tax liability (31,445)
(65,374)
Total identifiable net assets at fair value 332,000 Less share of non-controlling interest (566)

in the net assets
Fair value of identifiable net assets acquired 331,434 Less purchase consideration transferred 317,857
Excess of acquirer’s interest in the fair value of identifiable net assets acquired over the cost of business combination (“negative goodwill”) P=13,577
The purchase consideration transferred amounting to P=317.86 million consists of the cash consideration of P=0.03 million and RFM’s advances to Invest Asia of P=317.83 million, which was considered extinguished under PFRS 3.
6. Cash and Cash Equivalents
2012 2011
Cash on hand and in banks P=251,544 P=404,399 Short-term investments 1,223,169 408,598
P=1,474,713 P=812,997
Cash in banks earns interest at the respective bank deposit rates. Short-term investments are made for varying periods of up to three months depending on the immediate cash requirements of the Group, and earn interest at the respective short-term investment rates. Interest income earned from cash in banks and short-term investments amounted to P=15.41 million in 2012, P=8.23 million in 2011 and P=9.03 million in 2010 (see Note 25).
7. Accounts Receivable
2012 2011
Trade receivables: Third parties P=2,550,078 P=2,085,771 Related parties (Note 26) 388,593 386,859 Current portion of loan receivable 17,689 5,569 Nontrade receivables 148,928 149,759 Advances to officers and employees 48,674 47,261 Other receivables 140,231 108,769
3,294,193 2,783,988 Less allowance for doubtful accounts (Note 33) 706,510 879,115
P=2,587,683 P=1,904,873
Trade receivables are non-interest-bearing and are generally on 30 to 60 days term.
Nontrade receivables are amounts collectible from third parties other than the Group’s normal customers for transactions and events not directly related to sales of inventories.
Advances to officers and employees include car loans and cash advances which are deductible against the employees’ monthly salary.
Other receivables include receivables from insurance companies, dividend receivables and interest receivables.
8. Inventories
2012 2011
At NRV: Finished goods P=127,689 P=98,249 Raw materials 71,843 76,138 Spare parts and supplies 31,693 5,321
231,225 179,708
At Cost: Finished goods 226,484 322,751

Goods in process 6,876 564 Raw materials 658,451 589,806 Spare parts and supplies 170,051 86,347 Raw materials in transit 495,959 426,043
1,557,821 1,425,511
P=1,789,046 P=1,605,219
Finished goods, raw materials, and spare parts and supplies amounting to P=127.69 million and P=153.95 million as of December 31, 2012 and 2011, respectively, have been fully provided with allowance for inventory obsolescence. Allowance for inventory obsolescence amounting to P=23.68 million and P=5.40 million as of December 31, 2012 and 2011, respectively, pertains to the inventories of the Group valued at NRV.
The movements in the allowance for inventory obsolescence account are as follows:
2012 2011
At January 1 P=159,347 P=161,864 Provisions during the year (Note 22) 36,084 – Reversals (26,255) (791) Write-offs (17,806) (1,726)
At December 31 P=151,370 P=159,347
Cost of inventories charged to cost of sales amounted to P=5,733.46 million in 2012, P=5,677.68 million in 2011 and P=4,702.68 million in 2010. Inventories which were directly written off and charged to cost of sales amounted to P=24.71 million, P=9.43 million and P=13.59 million in 2012, 2011 and 2010, respectively (see Note 22).
In previous years, the Parent Company had entered into agreements covering trust receipts payable on certain raw materials, spare parts and supplies. All trust receipts payable were already fully paid in 2011 and no trust agreement was entered into in 2012 and 2011. Interest expense on the trust receipts payable recognized in the consolidated statement of income amounted to P=4.31 million in 2011 and P=9.10 million in 2010 (see Note 25). Interest rates for trust receipts payable ranged from 3.25% to 4.10% in 2011 and 2010.
9. Other Current Assets
2012 2011
Creditable withholding taxes P=60,425 P=73,737 Input VAT 50,638 47,697 Prepaid expenses - net of allowance for probable losses of
P=33,649 in both years 42,805 157,679 Deposits on purchases 33,825 53,568 Receivable from Meralco – 3,037 Others 4,585 4,551
P=192,278 P=340,269
Interest income earned from the receivable from Meralco amounted to nil in 2012 and 2011 and P=0.65 million in 2010 (see Note 25).
10. Property, Plant and Equipment As of December 31, 2012:
Silos, Machinery Transportation Office Land Buildings and and and Delivery Furniture Construction Improvements Improvements Equipment Equipment and Fixtures in Progress Total
At Cost Cost: At January 1 P=31,413 P=788,795 P=3,461,034 P=197,431 P=125,225 P=171,555 P=4,775,453 Additions 598 35,306 75,398 40,625 4,398 278,189 434,514 Write-off/disposal (936) – (119,204) (17,605) – – (137,745)
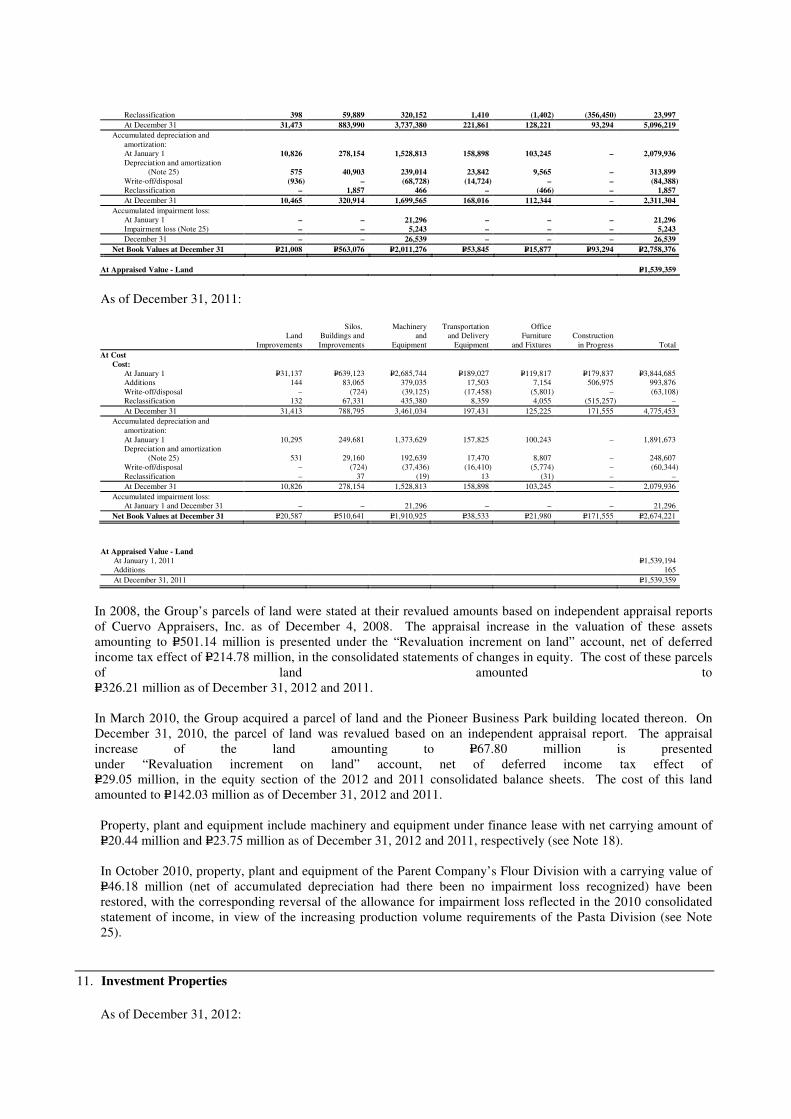
Reclassification 398 59,889 320,152 1,410 (1,402) (356,450) 23,997
At December 31 31,473 883,990 3,737,380 221,861 128,221 93,294 5,096,219
Accumulated depreciation and amortization: At January 1 10,826 278,154 1,528,813 158,898 103,245 – 2,079,936 Depreciation and amortization (Note 25) 575 40,903 239,014 23,842 9,565 – 313,899 Write-off/disposal (936) – (68,728) (14,724) – – (84,388) Reclassification – 1,857 466 – (466) – 1,857
At December 31 10,465 320,914 1,699,565 168,016 112,344 – 2,311,304
Accumulated impairment loss: At January 1 – – 21,296 – – – 21,296 Impairment loss (Note 25) – – 5,243 – – – 5,243
December 31 – – 26,539 – – – 26,539
Net Book Values at December 31 P=21,008 P=563,076 P=2,011,276 P=53,845 P=15,877 P=93,294 P=2,758,376
At Appraised Value - Land P=1,539,359
As of December 31, 2011:
Silos, Machinery Transportation Office Land Buildings and and and Delivery Furniture Construction Improvements Improvements Equipment Equipment and Fixtures in Progress Total
At Cost Cost: At January 1 P=31,137 P=639,123 P=2,685,744 P=189,027 P=119,817 P=179,837 P=3,844,685 Additions 144 83,065 379,035 17,503 7,154 506,975 993,876 Write-off/disposal – (724) (39,125) (17,458) (5,801) – (63,108) Reclassification 132 67,331 435,380 8,359 4,055 (515,257) –
At December 31 31,413 788,795 3,461,034 197,431 125,225 171,555 4,775,453
Accumulated depreciation and amortization: At January 1 10,295 249,681 1,373,629 157,825 100,243 – 1,891,673 Depreciation and amortization (Note 25) 531 29,160 192,639 17,470 8,807 – 248,607 Write-off/disposal – (724) (37,436) (16,410) (5,774) – (60,344) Reclassification – 37 (19) 13 (31) – –
At December 31 10,826 278,154 1,528,813 158,898 103,245 – 2,079,936
Accumulated impairment loss: At January 1 and December 31 – – 21,296 – – – 21,296
Net Book Values at December 31 P=20,587 P=510,641 P=1,910,925 P=38,533 P=21,980 P=171,555 P=2,674,221
At Appraised Value - Land At January 1, 2011 P=1,539,194 Additions 165
At December 31, 2011 P=1,539,359
In 2008, the Group’s parcels of land were stated at their revalued amounts based on independent appraisal reports of Cuervo Appraisers, Inc. as of December 4, 2008. The appraisal increase in the valuation of these assets amounting to P=501.14 million is presented under the “Revaluation increment on land” account, net of deferred income tax effect of P=214.78 million, in the consolidated statements of changes in equity. The cost of these parcels of land amounted to P=326.21 million as of December 31, 2012 and 2011.
In March 2010, the Group acquired a parcel of land and the Pioneer Business Park building located thereon. On December 31, 2010, the parcel of land was revalued based on an independent appraisal report. The appraisal increase of the land amounting to P=67.80 million is presented under “Revaluation increment on land” account, net of deferred income tax effect of P=29.05 million, in the equity section of the 2012 and 2011 consolidated balance sheets. The cost of this land amounted to P=142.03 million as of December 31, 2012 and 2011.
Property, plant and equipment include machinery and equipment under finance lease with net carrying amount of P=20.44 million and P=23.75 million as of December 31, 2012 and 2011, respectively (see Note 18).
In October 2010, property, plant and equipment of the Parent Company’s Flour Division with a carrying value of P=46.18 million (net of accumulated depreciation had there been no impairment loss recognized) have been restored, with the corresponding reversal of the allowance for impairment loss reflected in the 2010 consolidated statement of income, in view of the increasing production volume requirements of the Pasta Division (see Note 25).
11. Investment Properties
As of December 31, 2012:
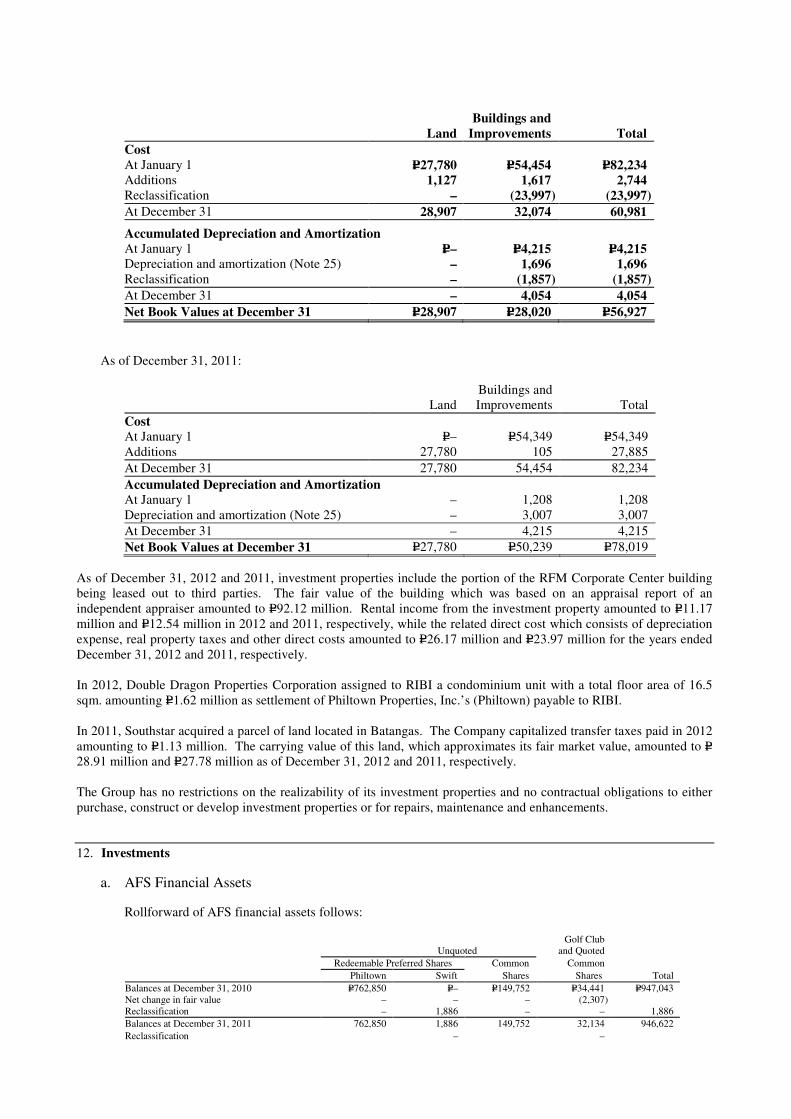
Buildings and Land Improvements Total
Cost At January 1 P=27,780 P=54,454 P=82,234 Additions 1,127 1,617 2,744 Reclassification – (23,997) (23,997)
At December 31 28,907 32,074 60,981
Accumulated Depreciation and Amortization At January 1 P=– P=4,215 P=4,215 Depreciation and amortization (Note 25) – 1,696 1,696 Reclassification – (1,857) (1,857)
At December 31 – 4,054 4,054
Net Book Values at December 31 P=28,907 P=28,020 P=56,927
As of December 31, 2011:
Buildings and Land Improvements Total
Cost At January 1 P=– P=54,349 P=54,349 Additions 27,780 105 27,885
At December 31 27,780 54,454 82,234
Accumulated Depreciation and Amortization At January 1 – 1,208 1,208 Depreciation and amortization (Note 25) – 3,007 3,007
At December 31 – 4,215 4,215
Net Book Values at December 31 P=27,780 P=50,239 P=78,019
As of December 31, 2012 and 2011, investment properties include the portion of the RFM Corporate Center building being leased out to third parties. The fair value of the building which was based on an appraisal report of an independent appraiser amounted to P=92.12 million. Rental income from the investment property amounted to P=11.17 million and P=12.54 million in 2012 and 2011, respectively, while the related direct cost which consists of depreciation expense, real property taxes and other direct costs amounted to P=26.17 million and P=23.97 million for the years ended December 31, 2012 and 2011, respectively.
In 2012, Double Dragon Properties Corporation assigned to RIBI a condominium unit with a total floor area of 16.5 sqm. amounting P=1.62 million as settlement of Philtown Properties, Inc.’s (Philtown) payable to RIBI.
In 2011, Southstar acquired a parcel of land located in Batangas. The Company capitalized transfer taxes paid in 2012 amounting to P=1.13 million. The carrying value of this land, which approximates its fair market value, amounted to P=28.91 million and P=27.78 million as of December 31, 2012 and 2011, respectively.
The Group has no restrictions on the realizability of its investment properties and no contractual obligations to either purchase, construct or develop investment properties or for repairs, maintenance and enhancements.
12. Investments
a. AFS Financial Assets
Rollforward of AFS financial assets follows:
Golf Club Unquoted and Quoted
Redeemable Preferred Shares Common Common
Philtown Swift Shares Shares Total
Balances at December 31, 2010 P=762,850 P=– P=149,752 P=34,441 P=947,043 Net change in fair value – – – (2,307) Reclassification – 1,886 – – 1,886
Balances at December 31, 2011 762,850 1,886 149,752 32,134 946,622
Reclassification – –
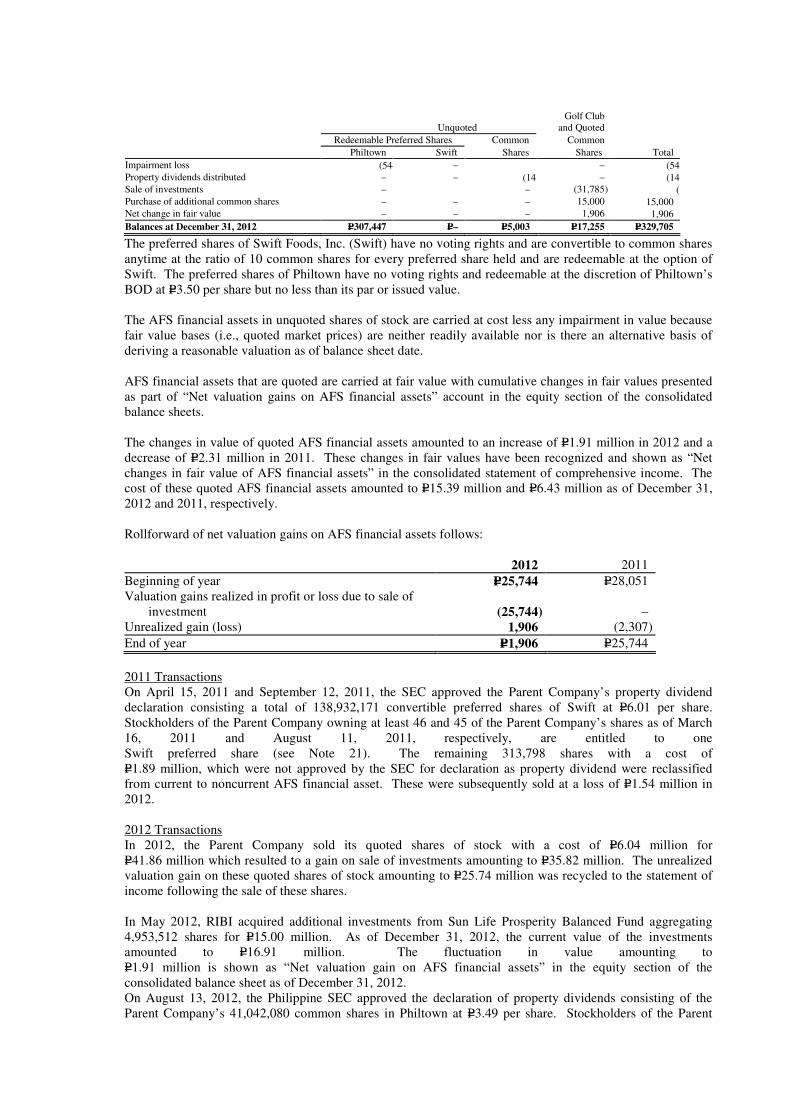
Golf Club Unquoted and Quoted
Redeemable Preferred Shares Common Common
Philtown Swift Shares Shares Total
Impairment loss (544,500) – – (545,861)Property dividends distributed – – (143,388) – (143,388)Sale of investments – – (31,785) (33,671)Purchase of additional common shares – – – 15,000 15,000 Net change in fair value – – – 1,906 1,906
Balances at December 31, 2012 P=307,447 P=– P=5,003 P=17,255 P=329,705
The preferred shares of Swift Foods, Inc. (Swift) have no voting rights and are convertible to common shares anytime at the ratio of 10 common shares for every preferred share held and are redeemable at the option of Swift. The preferred shares of Philtown have no voting rights and redeemable at the discretion of Philtown’s BOD at P=3.50 per share but no less than its par or issued value.
The AFS financial assets in unquoted shares of stock are carried at cost less any impairment in value because fair value bases (i.e., quoted market prices) are neither readily available nor is there an alternative basis of deriving a reasonable valuation as of balance sheet date.
AFS financial assets that are quoted are carried at fair value with cumulative changes in fair values presented as part of “Net valuation gains on AFS financial assets” account in the equity section of the consolidated balance sheets.
The changes in value of quoted AFS financial assets amounted to an increase of P=1.91 million in 2012 and a decrease of P=2.31 million in 2011. These changes in fair values have been recognized and shown as “Net changes in fair value of AFS financial assets” in the consolidated statement of comprehensive income. The cost of these quoted AFS financial assets amounted to P=15.39 million and P=6.43 million as of December 31, 2012 and 2011, respectively.
Rollforward of net valuation gains on AFS financial assets follows:
2012 2011
Beginning of year P=25,744 P=28,051 Valuation gains realized in profit or loss due to sale of
investment (25,744) – Unrealized gain (loss) 1,906 (2,307)
End of year P=1,906 P=25,744
2011 Transactions On April 15, 2011 and September 12, 2011, the SEC approved the Parent Company’s property dividend declaration consisting a total of 138,932,171 convertible preferred shares of Swift at P=6.01 per share. Stockholders of the Parent Company owning at least 46 and 45 of the Parent Company’s shares as of March 16, 2011 and August 11, 2011, respectively, are entitled to one Swift preferred share (see Note 21). The remaining 313,798 shares with a cost of P=1.89 million, which were not approved by the SEC for declaration as property dividend were reclassified from current to noncurrent AFS financial asset. These were subsequently sold at a loss of P=1.54 million in 2012.
2012 Transactions In 2012, the Parent Company sold its quoted shares of stock with a cost of P=6.04 million for P=41.86 million which resulted to a gain on sale of investments amounting to P=35.82 million. The unrealized valuation gain on these quoted shares of stock amounting to P=25.74 million was recycled to the statement of income following the sale of these shares.
In May 2012, RIBI acquired additional investments from Sun Life Prosperity Balanced Fund aggregating 4,953,512 shares for P=15.00 million. As of December 31, 2012, the current value of the investments amounted to P=16.91 million. The fluctuation in value amounting to P=1.91 million is shown as “Net valuation gain on AFS financial assets” in the equity section of the consolidated balance sheet as of December 31, 2012. On August 13, 2012, the Philippine SEC approved the declaration of property dividends consisting of the Parent Company’s 41,042,080 common shares in Philtown at P=3.49 per share. Stockholders of the Parent
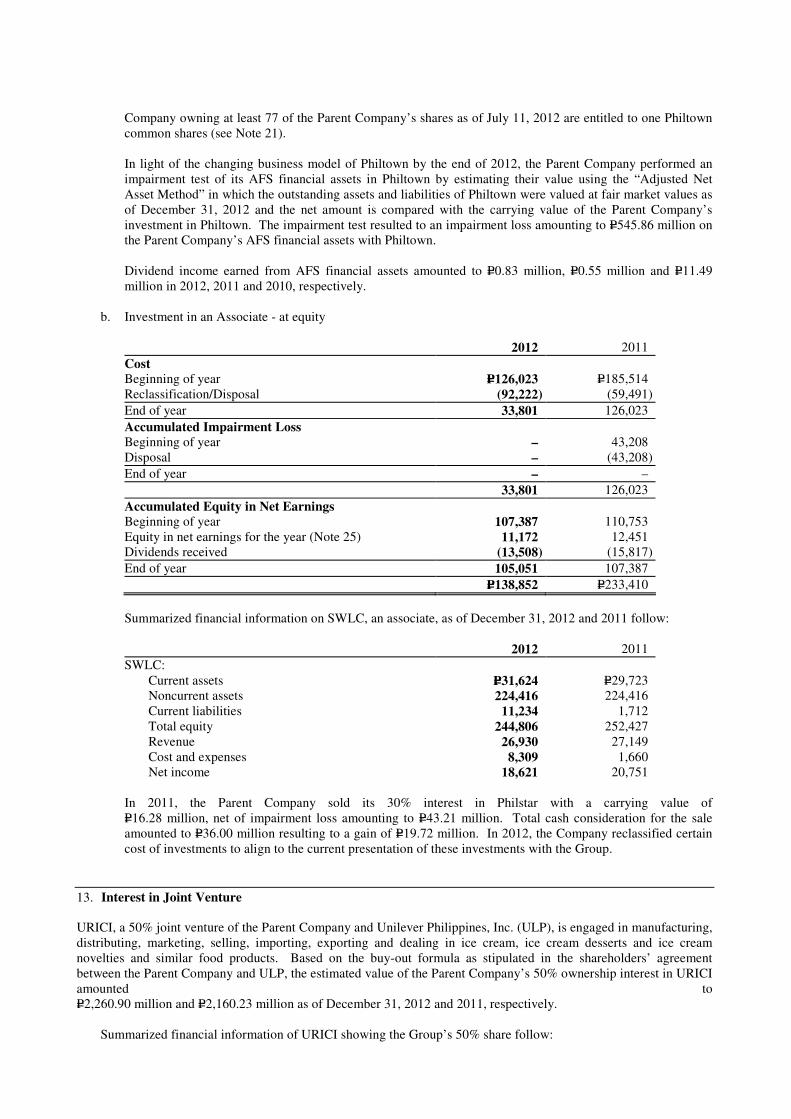
Company owning at least 77 of the Parent Company’s shares as of July 11, 2012 are entitled to one Philtown common shares (see Note 21).
In light of the changing business model of Philtown by the end of 2012, the Parent Company performed an impairment test of its AFS financial assets in Philtown by estimating their value using the “Adjusted Net Asset Method” in which the outstanding assets and liabilities of Philtown were valued at fair market values as of December 31, 2012 and the net amount is compared with the carrying value of the Parent Company’s investment in Philtown. The impairment test resulted to an impairment loss amounting to P=545.86 million on the Parent Company’s AFS financial assets with Philtown.
Dividend income earned from AFS financial assets amounted to P=0.83 million, P=0.55 million and P=11.49 million in 2012, 2011 and 2010, respectively.
b. Investment in an Associate - at equity
2012 2011
Cost Beginning of year P=126,023 P=185,514 Reclassification/Disposal (92,222) (59,491)
End of year 33,801 126,023
Accumulated Impairment Loss Beginning of year – 43,208 Disposal – (43,208)
End of year – –
33,801 126,023
Accumulated Equity in Net Earnings Beginning of year 107,387 110,753 Equity in net earnings for the year (Note 25) 11,172 12,451 Dividends received (13,508) (15,817)
End of year 105,051 107,387
P=138,852 P=233,410
Summarized financial information on SWLC, an associate, as of December 31, 2012 and 2011 follow:
2012 2011
SWLC: Current assets P=31,624 P=29,723 Noncurrent assets 224,416 224,416 Current liabilities 11,234 1,712 Total equity 244,806 252,427 Revenue 26,930 27,149 Cost and expenses 8,309 1,660 Net income 18,621 20,751
In 2011, the Parent Company sold its 30% interest in Philstar with a carrying value of P=16.28 million, net of impairment loss amounting to P=43.21 million. Total cash consideration for the sale amounted to P=36.00 million resulting to a gain of P=19.72 million. In 2012, the Company reclassified certain cost of investments to align to the current presentation of these investments with the Group.
13. Interest in Joint Venture URICI, a 50% joint venture of the Parent Company and Unilever Philippines, Inc. (ULP), is engaged in manufacturing, distributing, marketing, selling, importing, exporting and dealing in ice cream, ice cream desserts and ice cream novelties and similar food products. Based on the buy-out formula as stipulated in the shareholders’ agreement between the Parent Company and ULP, the estimated value of the Parent Company’s 50% ownership interest in URICI amounted to P=2,260.90 million and P=2,160.23 million as of December 31, 2012 and 2011, respectively.
Summarized financial information of URICI showing the Group’s 50% share follow:
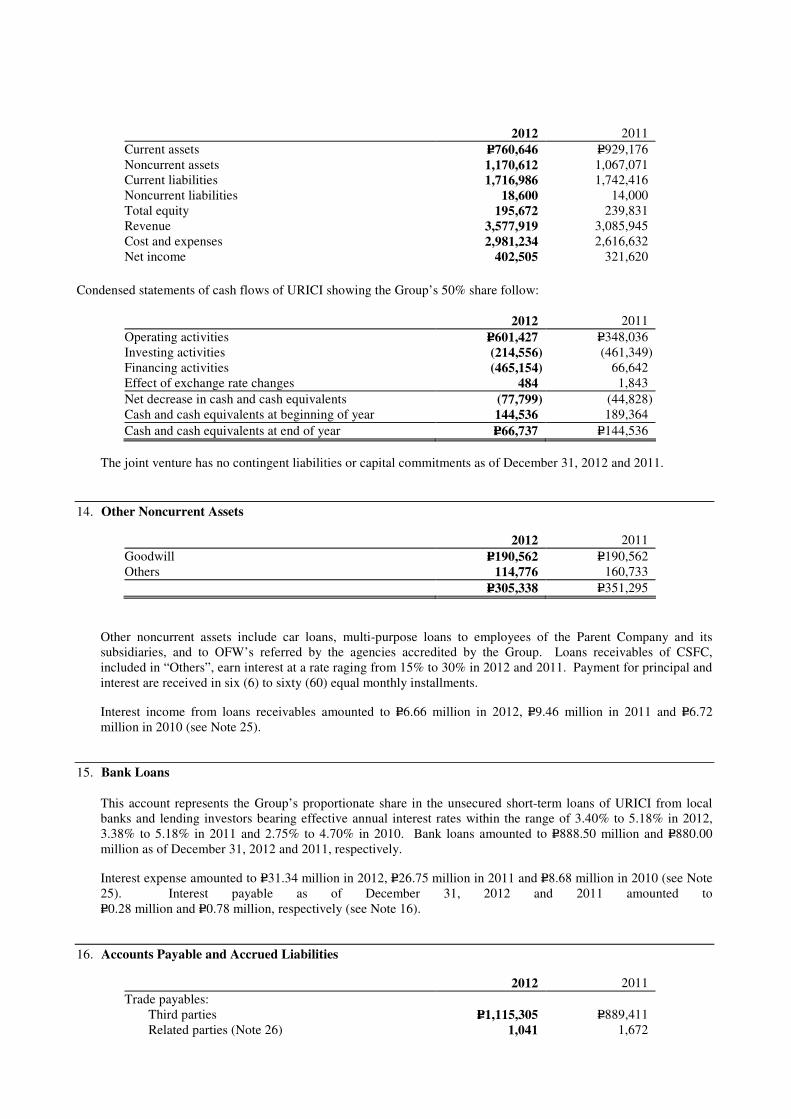
2012 2011
Current assets P=760,646 P=929,176 Noncurrent assets 1,170,612 1,067,071 Current liabilities 1,716,986 1,742,416 Noncurrent liabilities 18,600 14,000 Total equity 195,672 239,831 Revenue 3,577,919 3,085,945 Cost and expenses 2,981,234 2,616,632 Net income 402,505 321,620
Condensed statements of cash flows of URICI showing the Group’s 50% share follow:
2012 2011
Operating activities P=601,427 P=348,036 Investing activities (214,556) (461,349) Financing activities (465,154) 66,642 Effect of exchange rate changes 484 1,843
Net decrease in cash and cash equivalents (77,799) (44,828) Cash and cash equivalents at beginning of year 144,536 189,364
Cash and cash equivalents at end of year P=66,737 P=144,536
The joint venture has no contingent liabilities or capital commitments as of December 31, 2012 and 2011.
14. Other Noncurrent Assets
2012 2011
Goodwill P=190,562 P=190,562 Others 114,776 160,733
P=305,338 P=351,295
Other noncurrent assets include car loans, multi-purpose loans to employees of the Parent Company and its subsidiaries, and to OFW’s referred by the agencies accredited by the Group. Loans receivables of CSFC, included in “Others”, earn interest at a rate raging from 15% to 30% in 2012 and 2011. Payment for principal and interest are received in six (6) to sixty (60) equal monthly installments.
Interest income from loans receivables amounted to P=6.66 million in 2012, P=9.46 million in 2011 and P=6.72 million in 2010 (see Note 25).
15. Bank Loans
This account represents the Group’s proportionate share in the unsecured short-term loans of URICI from local banks and lending investors bearing effective annual interest rates within the range of 3.40% to 5.18% in 2012, 3.38% to 5.18% in 2011 and 2.75% to 4.70% in 2010. Bank loans amounted to P=888.50 million and P=880.00 million as of December 31, 2012 and 2011, respectively.
Interest expense amounted to P=31.34 million in 2012, P=26.75 million in 2011 and P=8.68 million in 2010 (see Note 25). Interest payable as of December 31, 2012 and 2011 amounted to P=0.28 million and P=0.78 million, respectively (see Note 16).
16. Accounts Payable and Accrued Liabilities
2012 2011
Trade payables: Third parties P=1,115,305 P=889,411 Related parties (Note 26) 1,041 1,672

Accrued liabilities: Advertisements and promotions 406,829 309,388 Importation 295,029 29,129
Manpower services 76,487 17,370 Profit bonus 73,288 61,308 Freight and handling 58,617 85,813
Merchandising charges 56,470 7,666 Payroll 42,957 22,095
Taxes 24,328 48,525 Others 237,151 319,765 Dividends payable 25,714 6,178 Cash bond - distributors 20,741 41,530 Interest payable (Notes 15, 18 and 20) 14,171 16,483 Subscriptions payable 2,758 2,258 Other payables 162,468 209,070
P=2,613,354 P=2,067,661
Other accrued liabilities consist of accruals made for utilities, rentals and others.
Cash bond pertains to cash received from the distributors as security to retain their credit line.
Other payables include advances from officers and employees, withholding taxes and other liabilities to third parties.
17. Customers’ Deposits As of December 31, 2012 and 2011, customers’ deposits pertain to the advances from the Parent Company’s customers for future purchases amounting to P=79.21 million and P=18.34 million, respectively.
18. Long-term Obligations
This account consists of obligations under finance leases as follows:
2012 2011
Total P=9,192 P=15,766 Less current portion 7,261 6,574
Noncurrent portion P=1,931 P=9,192
Interest expense incurred from long-term obligations amounted to P=1.28 million, P=1.90 million and P=2.46 million in 2012, 2011 and 2010, respectively (see Note 25).
Details of machinery and equipment under capital lease arrangements, shown as part of “Property, plant and equipment” account in the consolidated balance sheets, follow:
2012 2011
Cost P=49,557 P=49,557 Less accumulated depreciation 29,116 25,812
P=20,441 P=23,745
The aggregate future minimum payments under finance leases follow:
2012 2011
Within one year P=7,852 P=7,852 Over one year up to 2014 1,963 9,816
Total minimum lease obligations 9,815 17,668 Less amounts representing interest 623 1,902
Present value of minimum lease payments 9,192 15,766 Less current portion 7,261 6,574
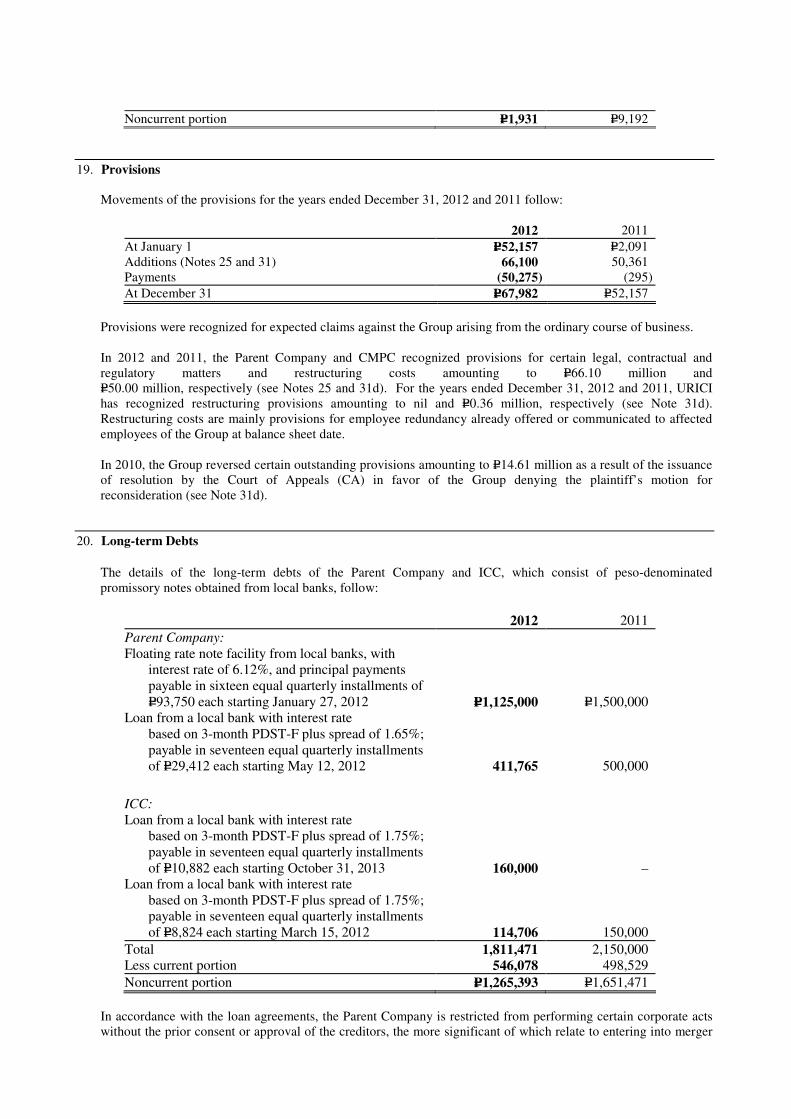
Noncurrent portion P=1,931 P=9,192
19. Provisions
Movements of the provisions for the years ended December 31, 2012 and 2011 follow:
2012 2011
At January 1 P=52,157 P=2,091 Additions (Notes 25 and 31) 66,100 50,361 Payments (50,275) (295)
At December 31 P=67,982 P=52,157
Provisions were recognized for expected claims against the Group arising from the ordinary course of business.
In 2012 and 2011, the Parent Company and CMPC recognized provisions for certain legal, contractual and regulatory matters and restructuring costs amounting to P=66.10 million and P=50.00 million, respectively (see Notes 25 and 31d). For the years ended December 31, 2012 and 2011, URICI has recognized restructuring provisions amounting to nil and P=0.36 million, respectively (see Note 31d). Restructuring costs are mainly provisions for employee redundancy already offered or communicated to affected employees of the Group at balance sheet date.
In 2010, the Group reversed certain outstanding provisions amounting to P=14.61 million as a result of the issuance of resolution by the Court of Appeals (CA) in favor of the Group denying the plaintiff’s motion for reconsideration (see Note 31d).
20. Long-term Debts
The details of the long-term debts of the Parent Company and ICC, which consist of peso-denominated promissory notes obtained from local banks, follow:
2012 2011
Parent Company: Floating rate note facility from local banks, with
interest rate of 6.12%, and principal payments payable in sixteen equal quarterly installments of P=93,750 each starting January 27, 2012 P=1,125,000 P=1,500,000
Loan from a local bank with interest rate based on 3-month PDST-F plus spread of 1.65%; payable in seventeen equal quarterly installments of P=29,412 each starting May 12, 2012 411,765 500,000
ICC: Loan from a local bank with interest rate
based on 3-month PDST-F plus spread of 1.75%; payable in seventeen equal quarterly installments of P=10,882 each starting October 31, 2013 160,000 –
Loan from a local bank with interest rate based on 3-month PDST-F plus spread of 1.75%; payable in seventeen equal quarterly installments of P=8,824 each starting March 15, 2012 114,706 150,000
Total 1,811,471 2,150,000 Less current portion 546,078 498,529
Noncurrent portion P=1,265,393 P=1,651,471
In accordance with the loan agreements, the Parent Company is restricted from performing certain corporate acts without the prior consent or approval of the creditors, the more significant of which relate to entering into merger

or consolidation, entering into guaranty or surety of obligation and acquiring treasury stock. The Parent Company is also required to maintain certain financial ratios based on the consolidated financial statements. As of December 31, 2012 and 2011, the Parent Company is in compliance with the terms and conditions of the loan agreements with the banks.
On October 26, 2010, several bank institutions granted the Parent Company a Peso-denominated floating rate notes facility in the aggregate principal amount of P=1.50 billion, which has been fully drawn on the same date. The principal amount of the note facility shall be paid within five years and one day from and after the issue date with interest rate of 6.12%. The payments are to be made in sixteen (16) equal quarterly installments of P=93.75 million each to commence at the end of the fifteenth month from the issue date.
On October 27, 2010, the Parent Company settled all its outstanding long-term debts with the local banks amounting to P=1.31 billion.
On May 13, 2011, the Parent Company availed of an additional loan from a local bank amounting to P=500.00 million. The principal amount of the loan shall be paid within five years from initial drawdown date with interest rate of 3.68%. The payments are to be made in seventeen (17) equal quarterly installments of P=29.41 million each to commence at the end of the fourth quarter following the date of borrowing.
On March 15, 2011, ICC obtained a P=150.00 million unsecured and interest-bearing long-term debt from a local bank payable in seventeen (17) equal quarterly installments of P=8.82 million each starting March 15, 2012. The interest rate will be based on 3-month PDST-F + 1.75% per annum subject to repricing every quarter. The proceeds of the debt were used by ICC to finance the acquisitions of new machinery and equipment, and construction of a warehouse building extension to house the newly acquired assets. The loan agreement provides certain financial ratios that ICC is required to maintain. As of December 31, 2012 and 2011, ICC is in compliance with the terms and conditions of the loan agreement with the bank.
On October 19, 2012, ICC obtained another unsecured and interest-bearing long-term debt from the same local bank amounting to P=185.00 million payable in seventeen (17) equal quarterly installments of P=10.88 million starting October 31, 2013. The interest rate will be based on 3-month PDST-F + 1.75% per annum subject to repricing per quarter. Interest rates for the period October 15 to December 31, 2012 range from 2.69% to 4.51%. The proceeds of the loan were used to finance the acquisitions of machinery and equipment. The loan agreement provides certain financial ratios that ICC is required to maintain. ICC is in compliance with the terms and conditions of the loan agreement as of December 31, 2012. The proceeds of the loan are to be drawn by ICC based on a committed drawdown date. As of December 31, 2012, a total of P=160.00 million have already been drawn by ICC.
Interest expense incurred from the long-term debts amounted to P=82.29 million, P=92.19 million and P=74.64 million in 2012, 2011 and 2010, respectively (see Note 25). Actual interest rates for the long-term debts ranged from 2.97% to 4.82% in 2012, 3.20% to 6.43% in 2011 and 6.48% to 7.89% in 2010.
21. Equity
Capital stock
As of December 31, 2012 and 2011, the Parent Company has 3,978,265,025 authorized common stock with P=1 par value. Issued and outstanding common shares of 3,160,403,866 are held by 3,391 and 3,482 stockholders as of December 31, 2012 and 2011, respectively.
Below is a summary of the capital stock movement of the Parent Company:
Year Date of Transaction Common Stock
Transactions
1993 185,800,356 1994 August 3, 1994 93,304,663 (a)
1995 April 7, 1995 1,116,420,076 (b)
1997 February 25, 1997 5,950,650 (c)
1998 20,042,392 (c)
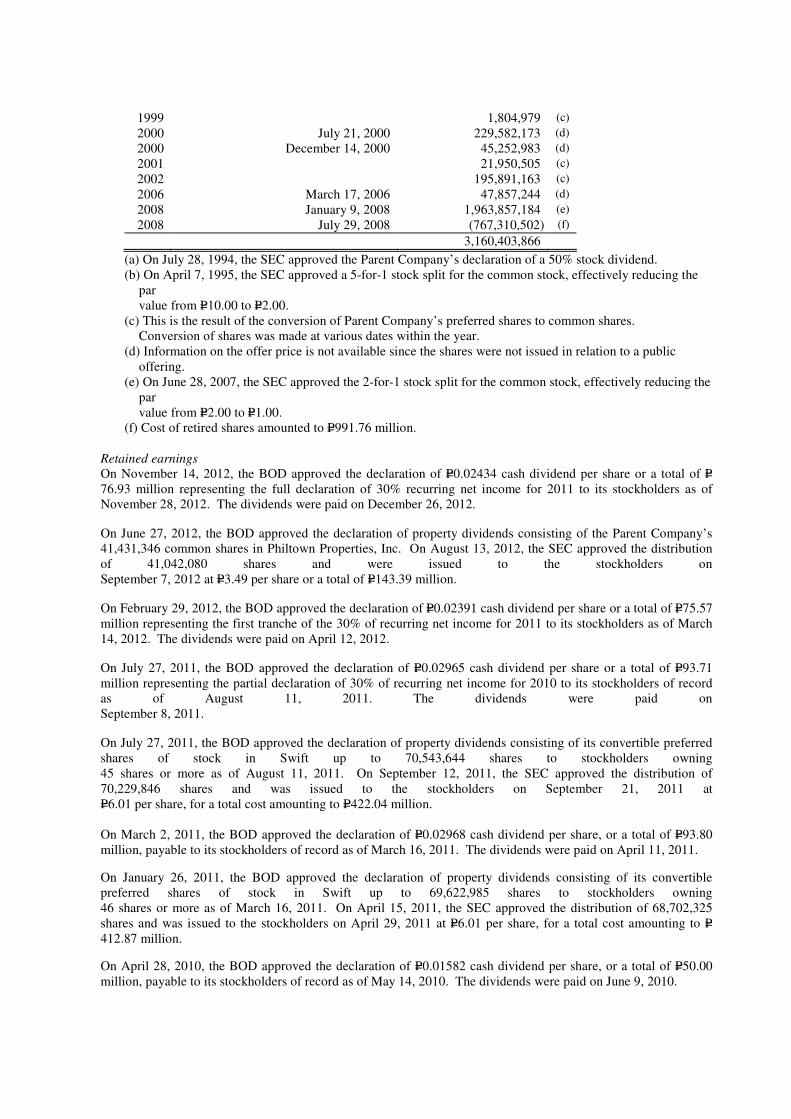
1999 1,804,979 (c)
2000 July 21, 2000 229,582,173 (d)
2000 December 14, 2000 45,252,983 (d)
2001 21,950,505 (c)
2002 195,891,163 (c)
2006 March 17, 2006 47,857,244 (d)
2008 January 9, 2008 1,963,857,184 (e)
2008 July 29, 2008 (767,310,502) (f)
3,160,403,866
(a) On July 28, 1994, the SEC approved the Parent Company’s declaration of a 50% stock dividend. (b) On April 7, 1995, the SEC approved a 5-for-1 stock split for the common stock, effectively reducing the
par value from P=10.00 to P=2.00.
(c) This is the result of the conversion of Parent Company’s preferred shares to common shares. Conversion of shares was made at various dates within the year.
(d) Information on the offer price is not available since the shares were not issued in relation to a public offering.
(e) On June 28, 2007, the SEC approved the 2-for-1 stock split for the common stock, effectively reducing the par value from P=2.00 to P=1.00.
(f) Cost of retired shares amounted to P=991.76 million.
Retained earnings
On November 14, 2012, the BOD approved the declaration of P=0.02434 cash dividend per share or a total of P=76.93 million representing the full declaration of 30% recurring net income for 2011 to its stockholders as of November 28, 2012. The dividends were paid on December 26, 2012.
On June 27, 2012, the BOD approved the declaration of property dividends consisting of the Parent Company’s 41,431,346 common shares in Philtown Properties, Inc. On August 13, 2012, the SEC approved the distribution of 41,042,080 shares and were issued to the stockholders on September 7, 2012 at P=3.49 per share or a total of P=143.39 million.
On February 29, 2012, the BOD approved the declaration of P=0.02391 cash dividend per share or a total of P=75.57 million representing the first tranche of the 30% of recurring net income for 2011 to its stockholders as of March 14, 2012. The dividends were paid on April 12, 2012.
On July 27, 2011, the BOD approved the declaration of P=0.02965 cash dividend per share or a total of P=93.71 million representing the partial declaration of 30% of recurring net income for 2010 to its stockholders of record as of August 11, 2011. The dividends were paid on September 8, 2011.
On July 27, 2011, the BOD approved the declaration of property dividends consisting of its convertible preferred shares of stock in Swift up to 70,543,644 shares to stockholders owning 45 shares or more as of August 11, 2011. On September 12, 2011, the SEC approved the distribution of 70,229,846 shares and was issued to the stockholders on September 21, 2011 at P=6.01 per share, for a total cost amounting to P=422.04 million. On March 2, 2011, the BOD approved the declaration of P=0.02968 cash dividend per share, or a total of P=93.80 million, payable to its stockholders of record as of March 16, 2011. The dividends were paid on April 11, 2011.
On January 26, 2011, the BOD approved the declaration of property dividends consisting of its convertible preferred shares of stock in Swift up to 69,622,985 shares to stockholders owning 46 shares or more as of March 16, 2011. On April 15, 2011, the SEC approved the distribution of 68,702,325 shares and was issued to the stockholders on April 29, 2011 at P=6.01 per share, for a total cost amounting to P=412.87 million.
On April 28, 2010, the BOD approved the declaration of P=0.01582 cash dividend per share, or a total of P=50.00 million, payable to its stockholders of record as of May 14, 2010. The dividends were paid on June 9, 2010.
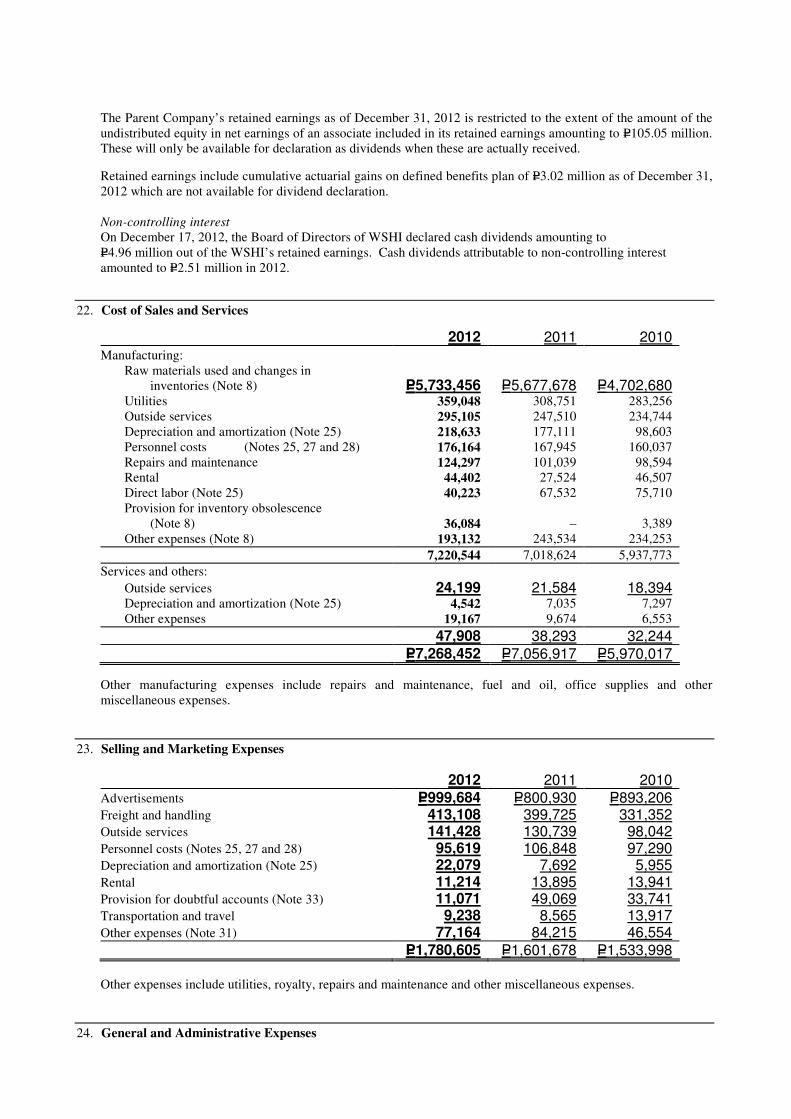
The Parent Company’s retained earnings as of December 31, 2012 is restricted to the extent of the amount of the undistributed equity in net earnings of an associate included in its retained earnings amounting to P=105.05 million. These will only be available for declaration as dividends when these are actually received.
Retained earnings include cumulative actuarial gains on defined benefits plan of P=3.02 million as of December 31, 2012 which are not available for dividend declaration.
Non-controlling interest
On December 17, 2012, the Board of Directors of WSHI declared cash dividends amounting to P=4.96 million out of the WSHI’s retained earnings. Cash dividends attributable to non-controlling interest amounted to P=2.51 million in 2012.
22. Cost of Sales and Services
2012 2011 2010 Manufacturing: Raw materials used and changes in inventories (Note 8) P=5,733,456 P=5,677,678 P=4,702,680 Utilities 359,048 308,751 283,256 Outside services 295,105 247,510 234,744 Depreciation and amortization (Note 25) 218,633 177,111 98,603 Personnel costs (Notes 25, 27 and 28) 176,164 167,945 160,037
Repairs and maintenance 124,297 101,039 98,594 Rental 44,402 27,524 46,507 Direct labor (Note 25) 40,223 67,532 75,710 Provision for inventory obsolescence (Note 8) 36,084 – 3,389 Other expenses (Note 8) 193,132 243,534 234,253
7,220,544 7,018,624 5,937,773
Services and others:
Outside services 24,199 21,584 18,394 Depreciation and amortization (Note 25) 4,542 7,035 7,297 Other expenses 19,167 9,674 6,553
47,908 38,293 32,244 P=7,268,452 P=7,056,917 P=5,970,017
Other manufacturing expenses include repairs and maintenance, fuel and oil, office supplies and other miscellaneous expenses.
23. Selling and Marketing Expenses
2012 2011 2010 Advertisements P=999,684 P=800,930 P=893,206 Freight and handling 413,108 399,725 331,352 Outside services 141,428 130,739 98,042 Personnel costs (Notes 25, 27 and 28) 95,619 106,848 97,290 Depreciation and amortization (Note 25) 22,079 7,692 5,955 Rental 11,214 13,895 13,941 Provision for doubtful accounts (Note 33) 11,071 49,069 33,741 Transportation and travel 9,238 8,565 13,917 Other expenses (Note 31) 77,164 84,215 46,554 P=1,780,605 P=1,601,678 P=1,533,998
Other expenses include utilities, royalty, repairs and maintenance and other miscellaneous expenses.
24. General and Administrative Expenses
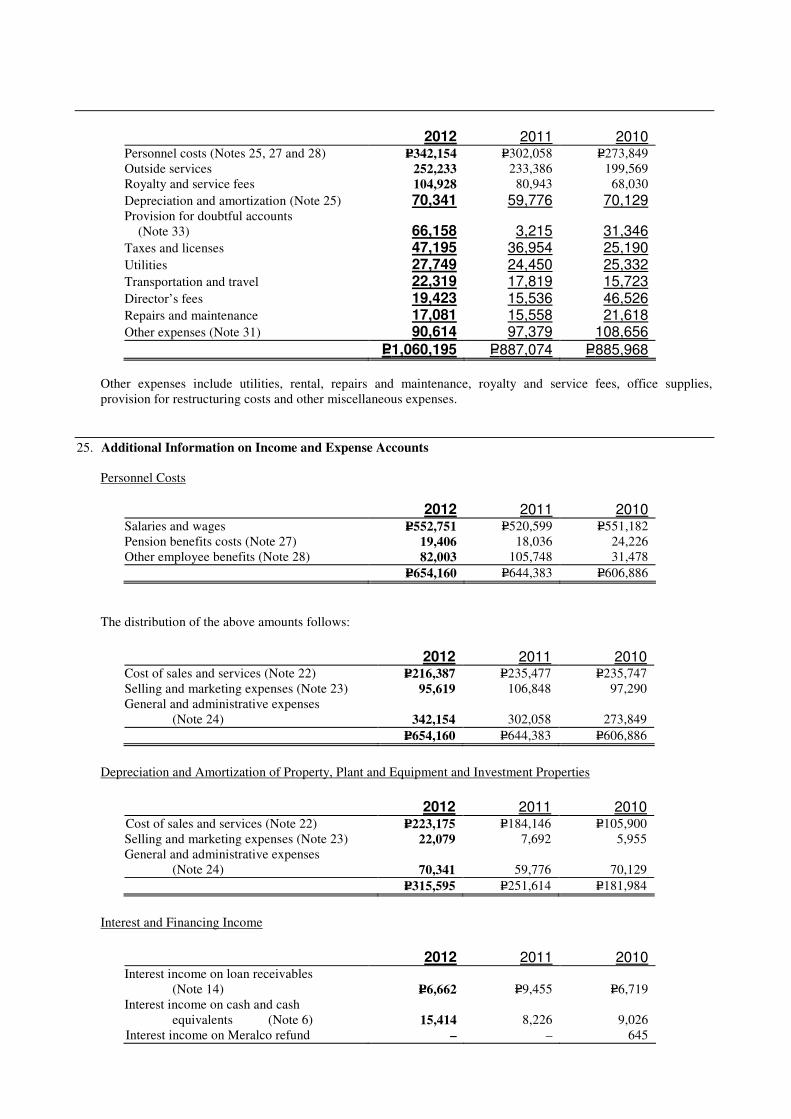
2012 2011 2010 Personnel costs (Notes 25, 27 and 28) P=342,154 P=302,058 P=273,849 Outside services 252,233 233,386 199,569 Royalty and service fees 104,928 80,943 68,030
Depreciation and amortization (Note 25) 70,341 59,776 70,129 Provision for doubtful accounts
(Note 33) 66,158 3,215 31,346 Taxes and licenses 47,195 36,954 25,190 Utilities 27,749 24,450 25,332 Transportation and travel 22,319 17,819 15,723 Director’s fees 19,423 15,536 46,526 Repairs and maintenance 17,081 15,558 21,618 Other expenses (Note 31) 90,614 97,379 108,656
P=1,060,195 P=887,074 P=885,968
Other expenses include utilities, rental, repairs and maintenance, royalty and service fees, office supplies, provision for restructuring costs and other miscellaneous expenses.
25. Additional Information on Income and Expense Accounts
Personnel Costs
2012 2011 2010 Salaries and wages P=552,751 P=520,599 P=551,182 Pension benefits costs (Note 27) 19,406 18,036 24,226 Other employee benefits (Note 28) 82,003 105,748 31,478
P=654,160 P=644,383 P=606,886
The distribution of the above amounts follows:
2012 2011 2010 Cost of sales and services (Note 22) P=216,387 P=235,477 P=235,747 Selling and marketing expenses (Note 23) 95,619 106,848 97,290 General and administrative expenses (Note 24) 342,154 302,058 273,849
P=654,160 P=644,383 P=606,886
Depreciation and Amortization of Property, Plant and Equipment and Investment Properties
2012 2011 2010 Cost of sales and services (Note 22) P=223,175 P=184,146 P=105,900 Selling and marketing expenses (Note 23) 22,079 7,692 5,955 General and administrative expenses (Note 24) 70,341 59,776 70,129
P=315,595 P=251,614 P=181,984
Interest and Financing Income
2012 2011 2010
Interest income on loan receivables (Note 14) P=6,662 P=9,455 P=6,719 Interest income on cash and cash equivalents (Note 6) 15,414 8,226 9,026 Interest income on Meralco refund – – 645

(Note 9)
P=22,076 P=17,681 P=16,390
Interest Expense
2012 2011 2010
Interest expense on long-term debts (Note 20) P=82,290 P=92,194 P=74,643 Interest expense on bank loans (Note 15) 31,339 26,748 8,683 Interest expense on long-term obligations
(Note 18) 1,278 1,900 2,463 Interest expense on trust receipts payable
(Note 8) – 4,310 9,099 Others 2,461 3,620 1,007
P=117,368 P=128,772 P=95,895
Other Income (Charges)
2012 2011 2010 Other income: Equity in net earnings of an associate (Note 12b) P=11,172 P=12,451 P=11,904 Foreign exchange gain - net 9,141 – – Realized mark-to-market gain 1,732 5,952 3,227
Dividend income (Note 12a) 825 552 11,494 Gain on sale of property and equipment 708 1,649 965 Income from toll processing 672 451 14,449 Unrealized mark-to-market gain (Note 34) – 4,943 7,387
Reversal of allowance for impairment loss on property, plant and equipment (Note 10) – – 46,178 Reversal of provision for lawsuit accrual (Note 19) – – 14,608 Excess of acquirer’s interest in the fair value of identifiable net assets acquired over the cost of business combination (Note 5) – – 13,577
Others - net 43,694 26,071 15,528
67,944 52,069 139,317
Other charges: Provisions for probable losses (Notes 19 and 31) (66,100) (50,000) – Impairment loss on property and equipment (Note 10) (5,243) – – Foreign exchange loss - net – (128) (2,914)
(71,343) (50,128) (2,914) (P=3,399) P=1,941 P=136,403
26. Related Party Transactions
Related party relationship exists when the party has the ability to control, directly or indirectly, through one or more intermediaries, or exercise significant influence over the other party in making financial and operating decisions. Such relationships also exist between and/or among entities which are under common control with the
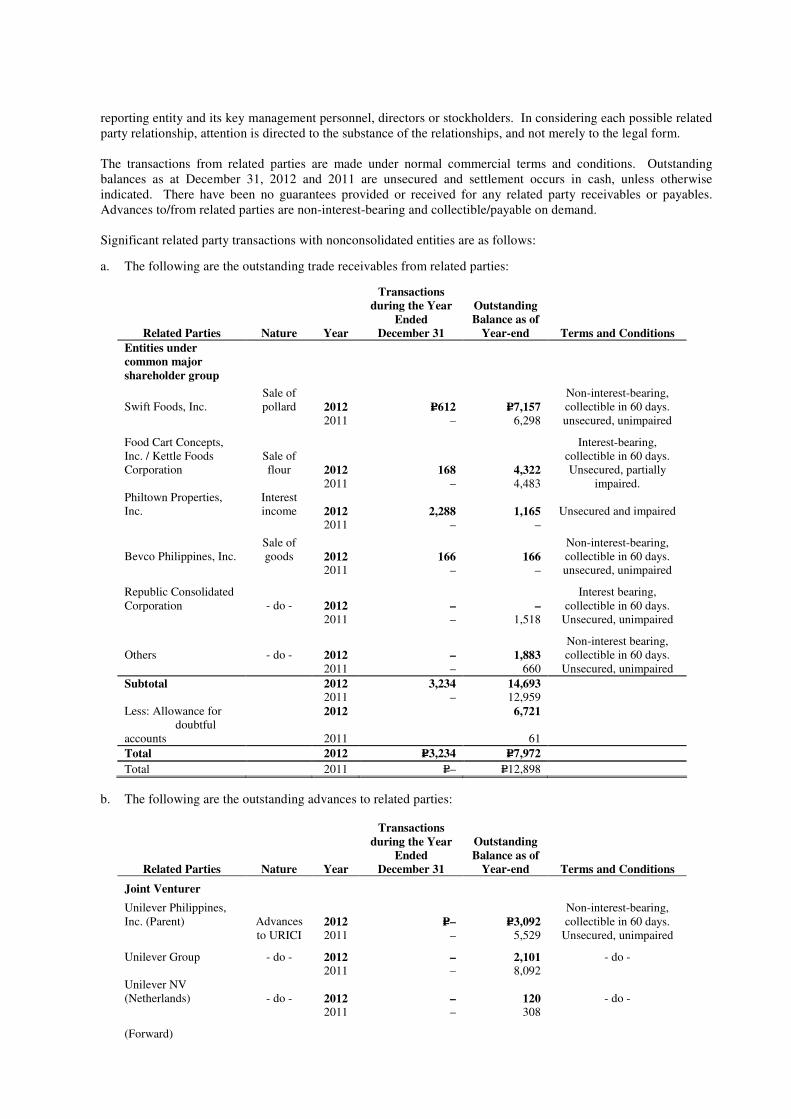
reporting entity and its key management personnel, directors or stockholders. In considering each possible related party relationship, attention is directed to the substance of the relationships, and not merely to the legal form. The transactions from related parties are made under normal commercial terms and conditions. Outstanding balances as at December 31, 2012 and 2011 are unsecured and settlement occurs in cash, unless otherwise indicated. There have been no guarantees provided or received for any related party receivables or payables. Advances to/from related parties are non-interest-bearing and collectible/payable on demand.
Significant related party transactions with nonconsolidated entities are as follows:
a. The following are the outstanding trade receivables from related parties:
Related Parties Nature Year
Transactions during the Year
Ended December 31
Outstanding Balance as of
Year-end Terms and Conditions
Entities under common major shareholder group
Swift Foods, Inc. Sale of pollard 2012 P=612 P=7,157
Non-interest-bearing, collectible in 60 days.
2011 – 6,298 unsecured, unimpaired
Food Cart Concepts, Inc. / Kettle Foods Corporation
Sale of flour 2012 168 4,322
Interest-bearing, collectible in 60 days. Unsecured, partially
2011 – 4,483 impaired. Philtown Properties, Inc.
Interest income 2012 2,288 1,165 Unsecured and impaired
2011 – –
Bevco Philippines, Inc. Sale of goods 2012 166 166
Non-interest-bearing, collectible in 60 days.
2011 – – unsecured, unimpaired
Republic Consolidated Corporation - do - 2012 – –
Interest bearing, collectible in 60 days.
2011 – 1,518 Unsecured, unimpaired
Others - do - 2012 – 1,883 Non-interest bearing, collectible in 60 days.
2011 – 660 Unsecured, unimpaired
Subtotal 2012 3,234 14,693 2011 – 12,959 Less: Allowance for 2012 6,721 doubtful accounts 2011 61
Total 2012 P=3,234 P=7,972
Total 2011 P=– P=12,898
b. The following are the outstanding advances to related parties:
Related Parties Nature Year
Transactions during the Year
Ended December 31
Outstanding Balance as of
Year-end Terms and Conditions
Joint Venturer
Unilever Philippines, Inc. (Parent) Advances 2012 P=– P=3,092
Non-interest-bearing, collectible in 60 days.
to URICI 2011 – 5,529 Unsecured, unimpaired
Unilever Group - do - 2012 – 2,101 - do - 2011 – 8,092 Unilever NV (Netherlands) - do - 2012 – 120 - do - 2011 – 308
(Forward)
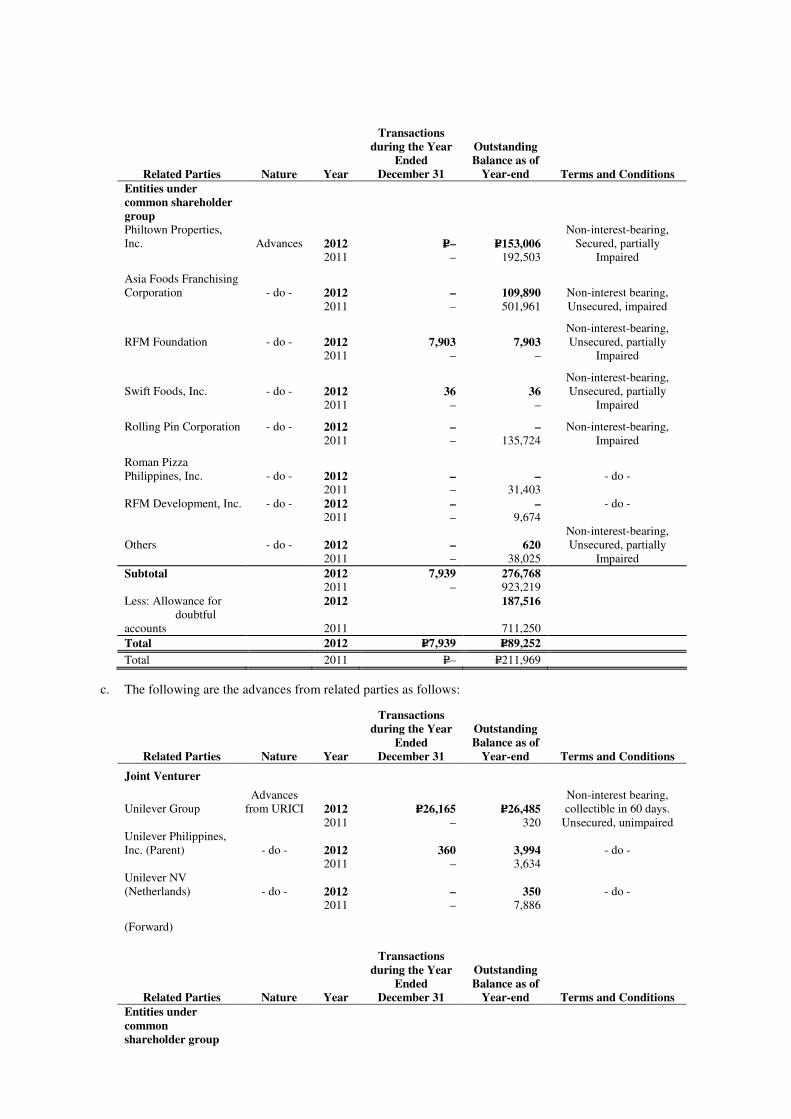
Related Parties Nature Year
Transactions during the Year
Ended December 31
Outstanding Balance as of
Year-end Terms and Conditions
Entities under common shareholder group Philtown Properties, Inc. Advances 2012 P=– P=153,006
Non-interest-bearing, Secured, partially
2011 – 192,503 Impaired
Asia Foods Franchising Corporation - do - 2012 – 109,890 Non-interest bearing, 2011 – 501,961 Unsecured, impaired
RFM Foundation - do - 2012 7,903 7,903 Non-interest-bearing, Unsecured, partially
2011 – – Impaired
Swift Foods, Inc. - do - 2012 36 36 Non-interest-bearing, Unsecured, partially
2011 – – Impaired
Rolling Pin Corporation - do - 2012 – – Non-interest-bearing, 2011 – 135,724 Impaired
Roman Pizza Philippines, Inc. - do - 2012 – – - do - 2011 – 31,403 RFM Development, Inc. - do - 2012 – – - do - 2011 – 9,674
Others - do - 2012 – 620 Non-interest-bearing, Unsecured, partially
2011 – 38,025 Impaired
Subtotal 2012 7,939 276,768 2011 – 923,219 Less: Allowance for 2012 187,516 doubtful accounts 2011 711,250
Total 2012 P=7,939 P=89,252
Total 2011 P=– P=211,969
c. The following are the advances from related parties as follows:
Related Parties Nature Year
Transactions during the Year
Ended December 31
Outstanding Balance as of
Year-end Terms and Conditions
Joint Venturer
Unilever Group Advances
from URICI 2012 P=26,165 P=26,485 Non-interest bearing, collectible in 60 days.
2011 – 320 Unsecured, unimpaired Unilever Philippines, Inc. (Parent) - do - 2012 360 3,994 - do - 2011 – 3,634 Unilever NV (Netherlands) - do - 2012 – 350 - do - 2011 – 7,886
(Forward)
Related Parties Nature Year
Transactions during the Year
Ended December 31
Outstanding Balance as of
Year-end Terms and Conditions
Entities under common shareholder group
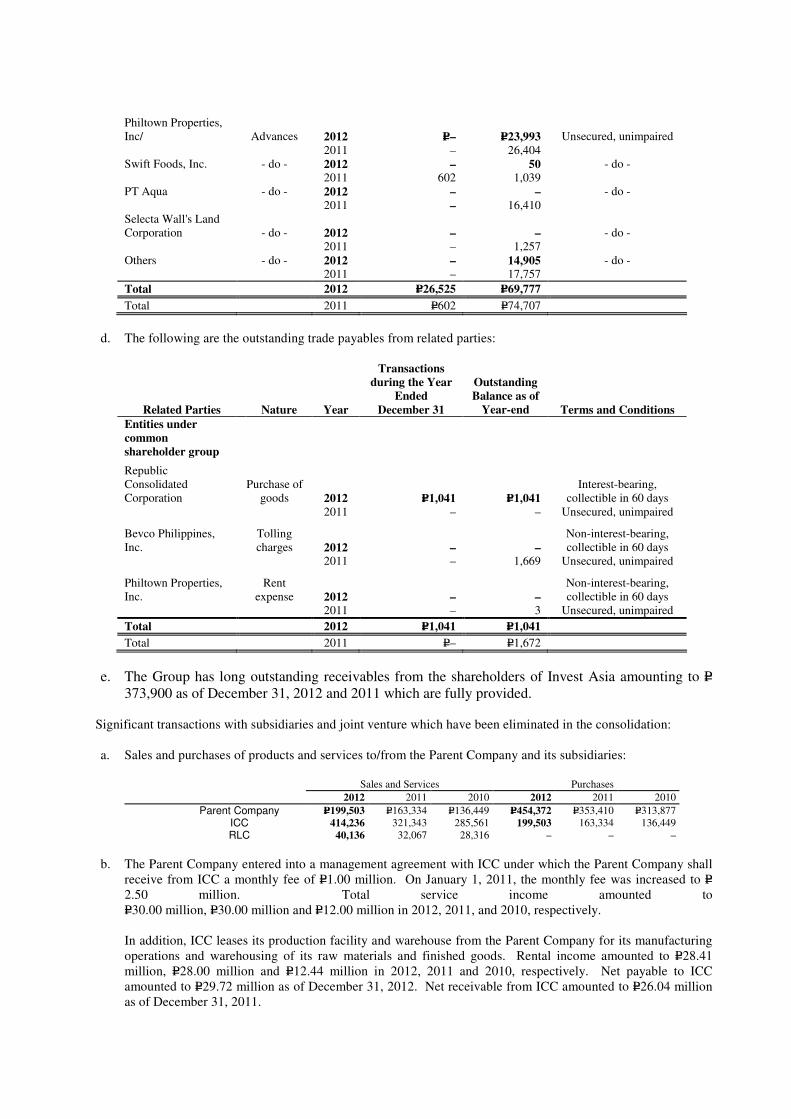
Philtown Properties, Inc/ Advances 2012 P=– P=23,993 Unsecured, unimpaired 2011 – 26,404 Swift Foods, Inc. - do - 2012 – 50 - do - 2011 602 1,039 PT Aqua - do - 2012 – – - do - 2011 – 16,410 Selecta Wall's Land Corporation - do - 2012 – – - do - 2011 – 1,257 Others - do - 2012 – 14,905 - do - 2011 – 17,757
Total 2012 P=26,525 P=69,777
Total 2011 P=602 P=74,707
d. The following are the outstanding trade payables from related parties:
Related Parties Nature Year
Transactions during the Year
Ended December 31
Outstanding Balance as of
Year-end Terms and Conditions
Entities under common shareholder group
Republic Consolidated Corporation
Purchase of goods 2012 P=1,041 P=1,041
Interest-bearing, collectible in 60 days
2011 – – Unsecured, unimpaired
Bevco Philippines, Inc.
Tolling charges 2012 – –
Non-interest-bearing, collectible in 60 days
2011 – 1,669 Unsecured, unimpaired
Philtown Properties, Inc.
Rent expense 2012 – –
Non-interest-bearing, collectible in 60 days
2011 – 3 Unsecured, unimpaired
Total 2012 P=1,041 P=1,041
Total 2011 P=– P=1,672
e. The Group has long outstanding receivables from the shareholders of Invest Asia amounting to P=373,900 as of December 31, 2012 and 2011 which are fully provided.
Significant transactions with subsidiaries and joint venture which have been eliminated in the consolidation:
a. Sales and purchases of products and services to/from the Parent Company and its subsidiaries:
Sales and Services Purchases
2012 2011 2010 2012 2011 2010
Parent Company P=199,503 P=163,334 P=136,449 P=454,372 P=353,410 P=313,877 ICC 414,236 321,343 285,561 199,503 163,334 136,449 RLC 40,136 32,067 28,316 – – –
b. The Parent Company entered into a management agreement with ICC under which the Parent Company shall
receive from ICC a monthly fee of P=1.00 million. On January 1, 2011, the monthly fee was increased to P=2.50 million. Total service income amounted to P=30.00 million, P=30.00 million and P=12.00 million in 2012, 2011, and 2010, respectively.
In addition, ICC leases its production facility and warehouse from the Parent Company for its manufacturing operations and warehousing of its raw materials and finished goods. Rental income amounted to P=28.41 million, P=28.00 million and P=12.44 million in 2012, 2011 and 2010, respectively. Net payable to ICC amounted to P=29.72 million as of December 31, 2012. Net receivable from ICC amounted to P=26.04 million as of December 31, 2011.

c. The Parent Company utilizes RLC for its lighterage requirements. Service fee to RLC amounted to P=40.14 million in 2012, P=32.07 million in 2011 and P=28.32 million in 2010. Deposits on purchases amounted to P=15.96 as of December 31 2012 and accounts payable amounted to P=1.23 million as of December 31, 2011.
d. The Parent Company has availments/extensions of both interest-bearing and non-interest-bearing cash
advances mainly for working capital purposes and investment activities from/to subsidiaries and other related parties with no fixed repayment terms. Advances to a subsidiary are subject to annual interest of 9% on the monthly outstanding balance. Total interest earned by the Parent Company amounted to P=25.75 million in 2012, P=82.12 million in 2011 and P=57.10 million in 2010.
e. Distribution services provided by the Parent Company to URICI for the export of frozen dairy
dessert/mellorine whereby URICI pays service fees equivalent to 7% of the total net sales value of goods distributed. Service fees amounted to P=25.87 million, P=5.63 million and P=10.29 million for the years ended December 31, 2012, 2011 and 2010, respectively.
f. Management services of the Parent Company to RIBI wherein RIBI pays the Parent Company a yearly
management fee equivalent to 5% of income before income tax or a fixed amount based on the level of net sales, whichever is higher. Management fee for the years ended December 31, 2012, 2011 and 2010 amounted to P=0.50 million each year.
g. The Parent Company has a lease agreement for office space with Invest Asia, a subsidiary. The lease covers a
one-year period, renewable every two years at the option of the Parent Company. Lease expense amounted to nil and P=2.88 million in 2012 and 2011.
Compensation of key management personnel of the Group by benefit type follows:
2012 2011 2010
Salaries and other short-term benefits P=79,652 P=72,020 P=71,707 Proportionate share in share-based
compensation of URICI 562 883 481 Pension benefits costs 11,123 5,813 4,531
P=91,337 P=78,716 P=76,719
27. Pension Benefits
The Parent Company, joint venture and certain subsidiaries have funded, noncontributory defined benefits pension plans (the Plans) covering substantially all their permanent employees.
a. Pension Benefits Costs
The components of pension benefits costs recognized in the consolidated statements of income for the years ended December 31 follow:
2012 2011 2010
Current service cost P=24,098 P=18,542 P=14,842 Interest cost on benefits obligation 24,467 24,972 22,906 Expected return on plan assets (29,159) (25,478) (13,522)
Pension benefits costs P=19,406 P=18,036 P=24,226
Actual return on plan assets P=69,451 P=10,931 P=27,848
b. Net Pension Obligation
The details of the net pension obligation and the amounts recognized in the consolidated balance sheets as of December 31, 2012 and 2011 follow:
2012 2011
Defined benefits obligation P=406,609 P=395,269 Fair value of plan assets (397,187) (291,433)

9,422 103,836 Unrecognized asset due to asset ceiling limit 18,726 –
Net pension obligation P=28,148 P=103,836
Changes in the present value of the defined benefits obligation follow:
2012 2011
Defined benefits obligation, January 1 P=395,269 P=316,783 Interest cost on benefit obligation 24,467 24,972 Current service cost 24,098 18,542 Actuarial loss (20,356) 38,100 Benefits paid (16,869) (965) Transfers – (2,163)
Defined benefits obligation, December 31 P=406,609 P=395,269
Changes in the fair value of plan assets follow:
2012 2011
Fair value of plan assets, January 1 P=291,433 P=259,848 Expected return on plan assets 29,159 25,478 Contributions 39,108 23,782 Benefits paid (2,805) (965) Actuarial gain (loss) 40,292 (14,547) Transfers – (2,163)
Fair value of plan assets, December 31 P=397,187 P=291,433
Transfers pertain to the plan asset share of certain employees of URICI transferred to Unilever Philippines, Inc.
Categories of plan assets as a percentage of the fair value of total plan assets follow:
2012 2011
Investments in: Bonds 36.44% 42.43% Financial instruments 31.02% 32.66% Real estate 2.95% 7.55% Cash and cash equivalents 28.69% 15.63% Loans and other receivables 1.15% 1.91% Payable to trustee (0.25%) (0.18%)
100.00% 100.00%
The overall expected return on the plan assets is determined based on the market prices prevailing on that date applicable to the period over which the obligation is to be settled. As of December 31, 2012, 2011 and 2010, the principal assumptions used in determining pension benefits costs and liability for the Group’s plan follow:
December 31
2012 2011 2010
Discount rate per annum 5% to 6% 6% to 8% 7% to 8% Expected annual rate of return on plan assets 6% to 10% 6% to 10% 8% to 10% Future annual increase in salary rate 5% to 6% 6% to 7% 7% to 8%
The latest actuarial valuation of the Group is as of December 31, 2012. Annual contribution to the retirement plan consists of a payment to cover the current service cost for the year plus payment toward funding the actuarial accrued liability. The Group’s expected contribution to the fund assets in 2013 amounted to P=5.34 million.
The amounts for the current and previous periods of the fair value of the plan assets, the present value of the defined benefits obligations and the experience adjustments, follow:
2012 2011 2010 2009 2008
Fair value of plan assets P=397,187 P=291,433 P=259,848 P=230,439 P=172,882 Defined benefits obligation (406,609) (395,269) (316,783) (238,287) (71,129)
Surplus (deficit) (9,422) (103,836) (56,935) (7,848) 101,753

Experience adjustments on the defined benefit obligation 20,356 (38,100) (54,174)
(153,017)
(203,413)
Experience adjustments on plan assets 40,292 (14,547) 14,326 37,609 (28,857)
Actuarial gains in 2012 and actuarial losses in 2011 and 2010 on defined benefit plan, net of deferred income tax, recognized in other comprehensive income amounted to P=29.35 million and P=36.85 million and P=24.56 million, respectively. Cumulative actuarial gain and cumulative actuarial loss on defined benefits plan, net of deferred income tax, recognized in retained earnings amounted to P=3.02 million and P=26.32 million as of December 31, 2012 and 2011, respectively.
28. Share-based Compensation Plan
URICI has the following share-based compensation plans, wherein key management of URICI are participating in the following share options and purchase plans of Unilever N.V. (NV) and Unilever PLC (PLC).
Executive Option Plan (EOP)
The plan was introduced in 2005 to reward key employees of URICI of NV shares for their contribution to the enhancement of URICI’s longer term future and their commitment to URICI over a sustained period. Under this plan, options are granted to employees of the group on a discretionary basis. The grant is dependent on the performance of URICI and the individual employee. The share options under this plan become exercisable after a three-year period from the date of grant and have a maximum term of ten (10) years.
The economic fair value of the share options awarded is calculated using an option pricing model (adjusted Black-Scholes model) and the resulting cost is recognized as employee benefit cost over the vesting period of the grant. The exercise price is the market price at the date of grant.
Global Share Incentive Plan (GSIP)
Under the GSIP, annual awards of shares in NV and PLC are granted to executive directors along with other senior employees. The actual number of shares received at vesting after three years depends on the satisfaction of performance conditions linked to improvements in URICI’s performance.
The vesting share will be conditional on the achievement of three distinct performance conditions over the performance period. The performance period is a 3-year calendar period. These are: (a) vesting of 40% of the shares in the award is based on a condition measuring URICI’s relative total shareholder return; (b) vesting of a further 30% of the shares in the award is conditional on average underlying sales growth performance over the three-year period; and (c) the vesting of the final 30% of the shares in the award is conditional on cumulative ungeared free cash flow performance which is the basic driver of returns URICI is able to generate to its stockholders.
Management Co-Investment Plan (MCIP)
The Management Co-Investment Plan further enhances alignment with shareholder’s interest. Under the MCIP, key executives can elect to invest up to 60% of their annual bonus in Unilever NV and PLC shares (Investment Shares). These are then matched with an equivalent number of shares.
The matching shares will vest in 3 years at 0% to 200% depending on Unilever’s achievement of the vesting conditions. The vesting conditions are: (1) Underlying Sales Growth, (2) Average Underlying Operating Margin and (3) Cumulative Operating Cash Flow.
During the vesting period, the match shares can earn dividend equivalents. These dividend shares are re-invested as additional MCIP target shares.
Share-based compensation plan recognized in equity consist of MCIP amounting to P=0.36 million and P=0.18 million as of December 31, 2012 and 2011, respectively.
Share-based compensation expense relating to key executives that transferred employment within the Unilever Group entities (including URICI) are recognized in the entity where the services have been rendered. Share-based compensation expense in relation to these key executives are recognized by URICI within personnel costs in the consolidated statement of income.
In 2012 and 2011, NV and PLC charged URICI an amount equal to the fair value at grant date of the share options provided by URICI under GPSP, GSIP and SMP share-based plans. As a result, the related amounts of share
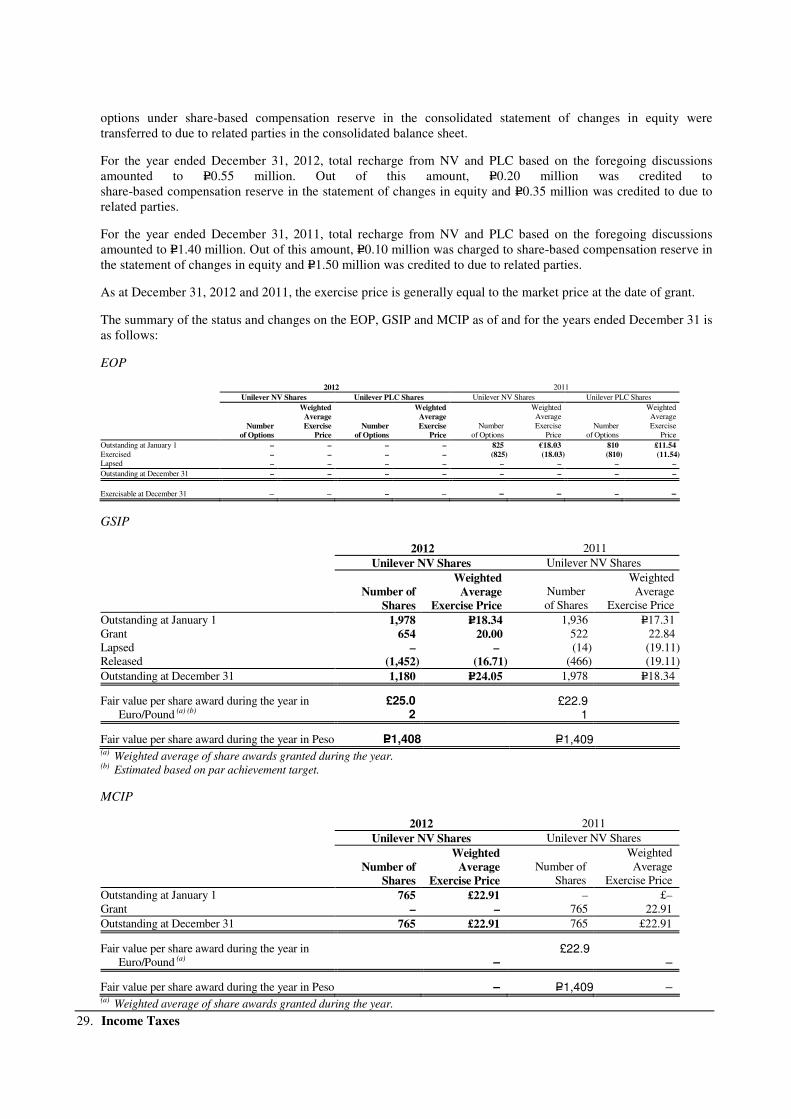
options under share-based compensation reserve in the consolidated statement of changes in equity were transferred to due to related parties in the consolidated balance sheet.
For the year ended December 31, 2012, total recharge from NV and PLC based on the foregoing discussions amounted to P=0.55 million. Out of this amount, P=0.20 million was credited to share-based compensation reserve in the statement of changes in equity and P=0.35 million was credited to due to related parties.
For the year ended December 31, 2011, total recharge from NV and PLC based on the foregoing discussions amounted to P=1.40 million. Out of this amount, P=0.10 million was charged to share-based compensation reserve in the statement of changes in equity and P=1.50 million was credited to due to related parties.
As at December 31, 2012 and 2011, the exercise price is generally equal to the market price at the date of grant.
The summary of the status and changes on the EOP, GSIP and MCIP as of and for the years ended December 31 is as follows:
EOP
2012 2011
Unilever NV Shares Unilever PLC Shares Unilever NV Shares Unilever PLC Shares
Weighted Weighted Weighted Weighted Average Average Average Average Number Exercise Number Exercise Number Exercise Number Exercise of Options Price of Options Price of Options Price of Options Price
Outstanding at January 1 – – – – 825 €18.03 810 £11.54 Exercised – – – – (825) (18.03) (810) (11.54)Lapsed – – – – – – – –
Outstanding at December 31 – – – – – – – –
Exercisable at December 31 – – – – – – – –
GSIP
2012 2011
Unilever NV Shares Unilever NV Shares
Number of
Shares
Weighted Average
Exercise Price Number of Shares
Weighted Average
Exercise Price
Outstanding at January 1 1,978 P=18.34 1,936 P=17.31 Grant 654 20.00 522 22.84 Lapsed – – (14) (19.11)Released (1,452) (16.71) (466) (19.11)
Outstanding at December 31 1,180 P=24.05 1,978 P=18.34
Fair value per share award during the year in Euro/Pound (a) (b)
£25.02
£22.91
Fair value per share award during the year in Peso P=1,408 P=1,409 (a) Weighted average of share awards granted during the year. (b) Estimated based on par achievement target.
MCIP
2012 2011
Unilever NV Shares Unilever NV Shares
Number of
Shares
Weighted Average
Exercise Price
Number of
Shares
Weighted Average
Exercise Price
Outstanding at January 1 765 £22.91 – £– Grant – – 765 22.91
Outstanding at December 31 765 £22.91 765 £22.91
Fair value per share award during the year in Euro/Pound (a) –
£22.9–
Fair value per share award during the year in Peso – P=1,409 – (a) Weighted average of share awards granted during the year.
29. Income Taxes
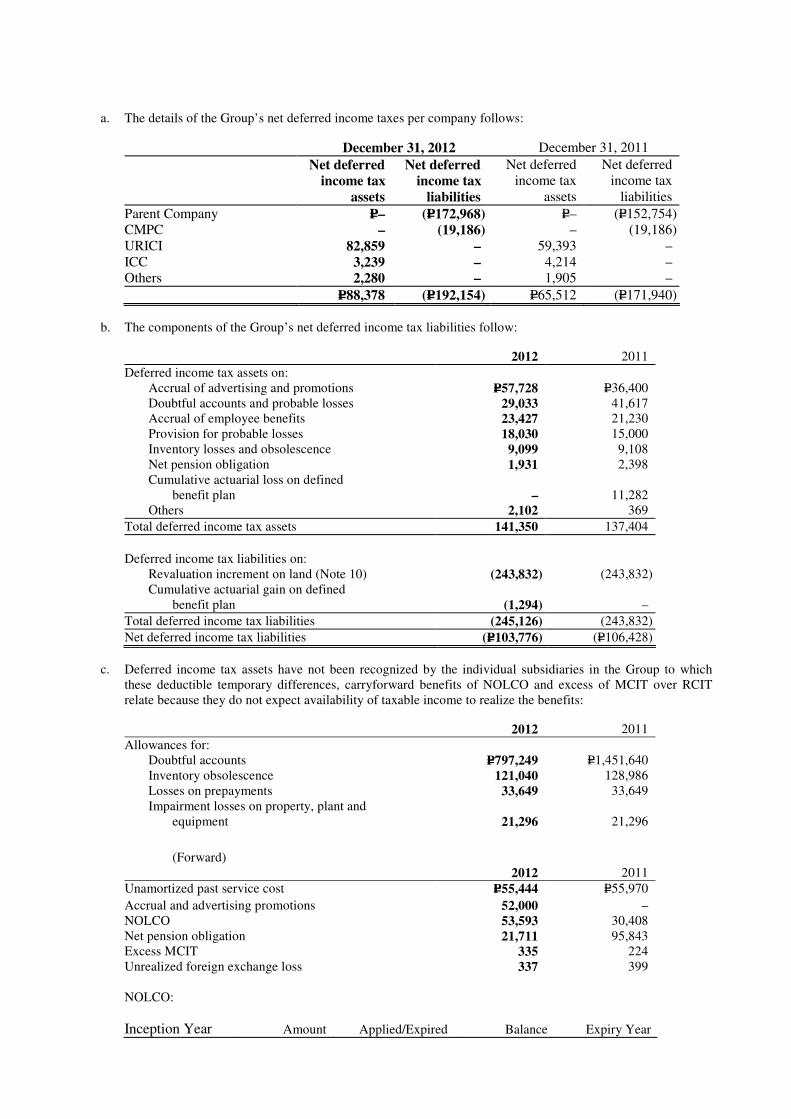
a. The details of the Group’s net deferred income taxes per company follows:
December 31, 2012 December 31, 2011
Net deferred income tax
assets
Net deferred income tax
liabilities
Net deferred income tax
assets
Net deferred income tax
liabilities
Parent Company P=– (P=172,968) P=– (P=152,754) CMPC – (19,186) – (19,186) URICI 82,859 – 59,393 – ICC 3,239 – 4,214 – Others 2,280 – 1,905 –
P=88,378 (P=192,154) P=65,512 (P=171,940)
b. The components of the Group’s net deferred income tax liabilities follow:
2012 2011
Deferred income tax assets on: Accrual of advertising and promotions P=57,728 P=36,400 Doubtful accounts and probable losses 29,033 41,617 Accrual of employee benefits 23,427 21,230 Provision for probable losses 18,030 15,000 Inventory losses and obsolescence 9,099 9,108 Net pension obligation 1,931 2,398 Cumulative actuarial loss on defined
benefit plan – 11,282 Others 2,102 369
Total deferred income tax assets 141,350 137,404
Deferred income tax liabilities on: Revaluation increment on land (Note 10) (243,832) (243,832) Cumulative actuarial gain on defined
benefit plan (1,294) –
Total deferred income tax liabilities (245,126) (243,832)
Net deferred income tax liabilities (P=103,776) (P=106,428)
c. Deferred income tax assets have not been recognized by the individual subsidiaries in the Group to which these deductible temporary differences, carryforward benefits of NOLCO and excess of MCIT over RCIT relate because they do not expect availability of taxable income to realize the benefits:
2012 2011
Allowances for: Doubtful accounts P=797,249 P=1,451,640 Inventory obsolescence 121,040 128,986 Losses on prepayments 33,649 33,649 Impairment losses on property, plant and
equipment 21,296
21,296
(Forward) 2012 2011
Unamortized past service cost P=55,444 P=55,970
Accrual and advertising promotions 52,000 – NOLCO 53,593 30,408 Net pension obligation 21,711 95,843 Excess MCIT 335 224 Unrealized foreign exchange loss 337 399
NOLCO:
Inception Year Amount Applied/Expired Balance Expiry Year
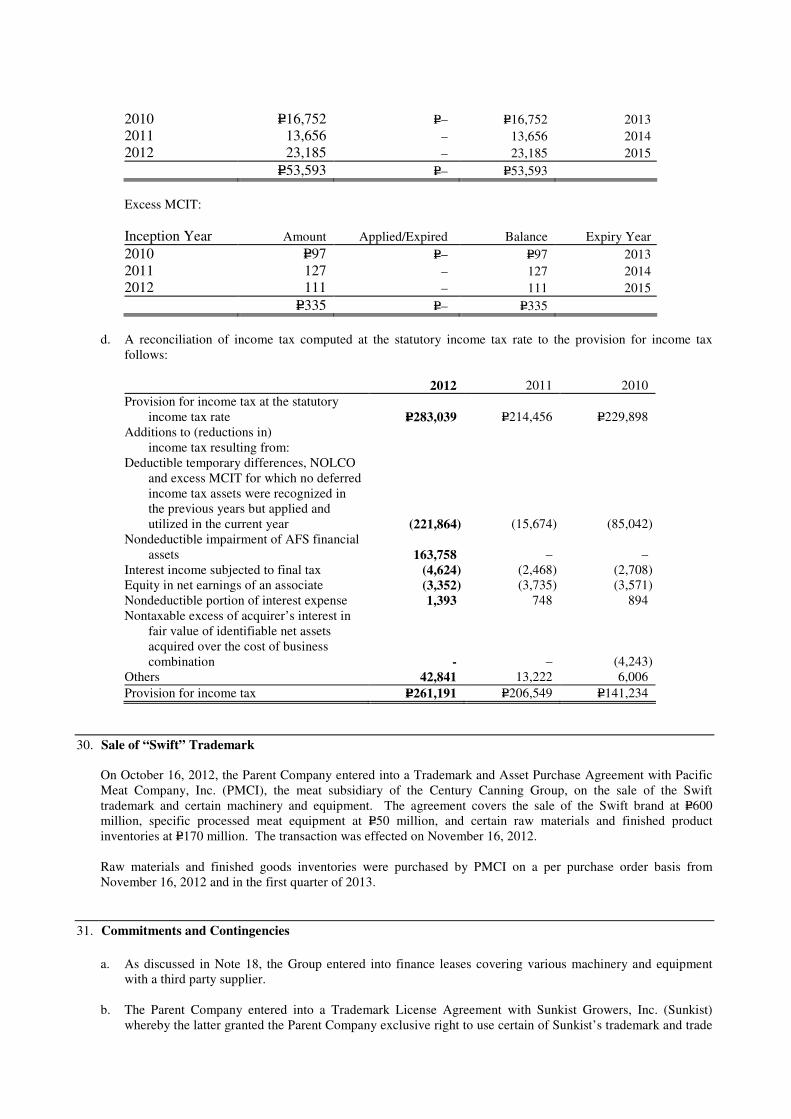
2010 P=16,752 P=– P=16,752 2013
2011 13,656 – 13,656 2014
2012 23,185 – 23,185 2015
P=53,593 P=– P=53,593
Excess MCIT:
Inception Year Amount Applied/Expired Balance Expiry Year
2010 P=97 P=– P=97 2013
2011 127 – 127 2014
2012 111 – 111 2015
P=335 P=– P=335
d. A reconciliation of income tax computed at the statutory income tax rate to the provision for income tax
follows:
2012 2011 2010
Provision for income tax at the statutory income tax rate P=283,039
P=214,456
P=229,898
Additions to (reductions in) income tax resulting from: Deductible temporary differences, NOLCO
and excess MCIT for which no deferred income tax assets were recognized in the previous years but applied and
utilized in the current year (221,864) (15,674) (85,042) Nondeductible impairment of AFS financial
assets 163,758 – – Interest income subjected to final tax (4,624) (2,468) (2,708) Equity in net earnings of an associate (3,352) (3,735) (3,571) Nondeductible portion of interest expense 1,393 748 894 Nontaxable excess of acquirer’s interest in
fair value of identifiable net assets acquired over the cost of business
combination - – (4,243) Others 42,841 13,222 6,006
Provision for income tax P=261,191 P=206,549 P=141,234
30. Sale of “Swift” Trademark
On October 16, 2012, the Parent Company entered into a Trademark and Asset Purchase Agreement with Pacific Meat Company, Inc. (PMCI), the meat subsidiary of the Century Canning Group, on the sale of the Swift trademark and certain machinery and equipment. The agreement covers the sale of the Swift brand at P=600 million, specific processed meat equipment at P=50 million, and certain raw materials and finished product inventories at P=170 million. The transaction was effected on November 16, 2012.
Raw materials and finished goods inventories were purchased by PMCI on a per purchase order basis from November 16, 2012 and in the first quarter of 2013.
31. Commitments and Contingencies
a. As discussed in Note 18, the Group entered into finance leases covering various machinery and equipment
with a third party supplier.
b. The Parent Company entered into a Trademark License Agreement with Sunkist Growers, Inc. (Sunkist) whereby the latter granted the Parent Company exclusive right to use certain of Sunkist’s trademark and trade
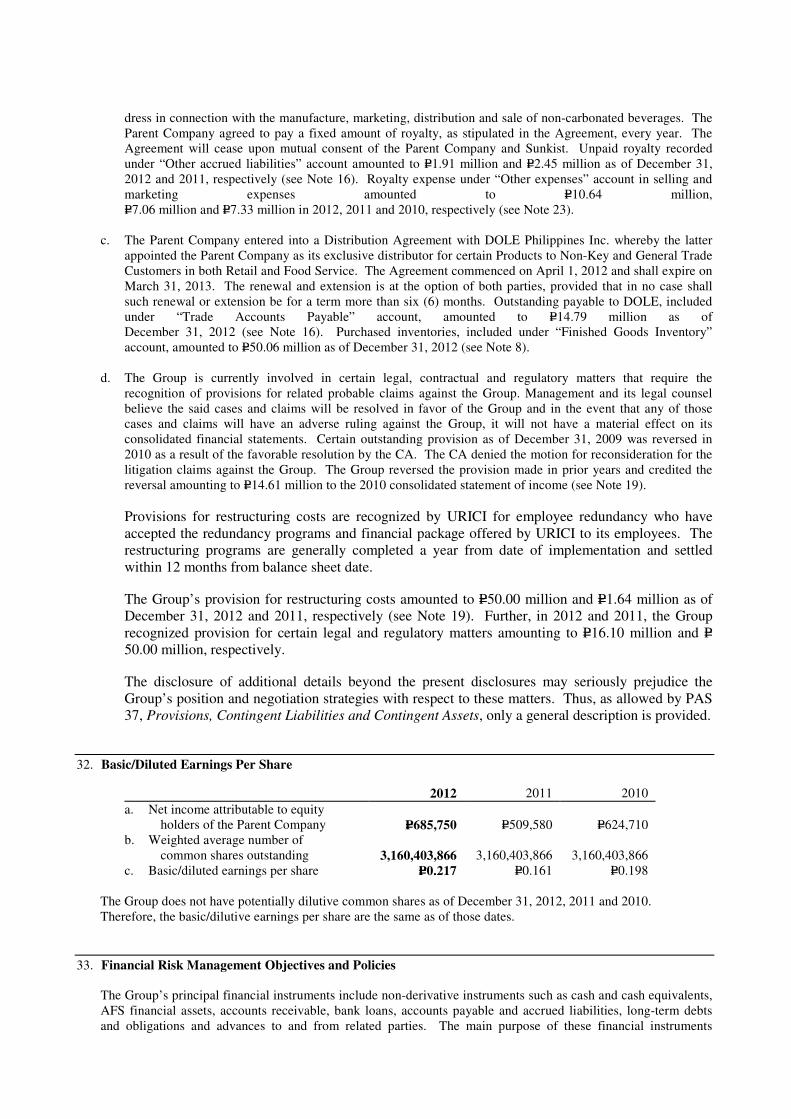
dress in connection with the manufacture, marketing, distribution and sale of non-carbonated beverages. The Parent Company agreed to pay a fixed amount of royalty, as stipulated in the Agreement, every year. The Agreement will cease upon mutual consent of the Parent Company and Sunkist. Unpaid royalty recorded under “Other accrued liabilities” account amounted to P=1.91 million and P=2.45 million as of December 31, 2012 and 2011, respectively (see Note 16). Royalty expense under “Other expenses” account in selling and marketing expenses amounted to P=10.64 million, P=7.06 million and P=7.33 million in 2012, 2011 and 2010, respectively (see Note 23).
c. The Parent Company entered into a Distribution Agreement with DOLE Philippines Inc. whereby the latter
appointed the Parent Company as its exclusive distributor for certain Products to Non-Key and General Trade Customers in both Retail and Food Service. The Agreement commenced on April 1, 2012 and shall expire on March 31, 2013. The renewal and extension is at the option of both parties, provided that in no case shall such renewal or extension be for a term more than six (6) months. Outstanding payable to DOLE, included under “Trade Accounts Payable” account, amounted to P=14.79 million as of December 31, 2012 (see Note 16). Purchased inventories, included under “Finished Goods Inventory” account, amounted to P=50.06 million as of December 31, 2012 (see Note 8).
d. The Group is currently involved in certain legal, contractual and regulatory matters that require the
recognition of provisions for related probable claims against the Group. Management and its legal counsel believe the said cases and claims will be resolved in favor of the Group and in the event that any of those cases and claims will have an adverse ruling against the Group, it will not have a material effect on its consolidated financial statements. Certain outstanding provision as of December 31, 2009 was reversed in 2010 as a result of the favorable resolution by the CA. The CA denied the motion for reconsideration for the litigation claims against the Group. The Group reversed the provision made in prior years and credited the reversal amounting to P=14.61 million to the 2010 consolidated statement of income (see Note 19).
Provisions for restructuring costs are recognized by URICI for employee redundancy who have accepted the redundancy programs and financial package offered by URICI to its employees. The restructuring programs are generally completed a year from date of implementation and settled within 12 months from balance sheet date.
The Group’s provision for restructuring costs amounted to P=50.00 million and P=1.64 million as of December 31, 2012 and 2011, respectively (see Note 19). Further, in 2012 and 2011, the Group recognized provision for certain legal and regulatory matters amounting to P=16.10 million and P=50.00 million, respectively.
The disclosure of additional details beyond the present disclosures may seriously prejudice the Group’s position and negotiation strategies with respect to these matters. Thus, as allowed by PAS 37, Provisions, Contingent Liabilities and Contingent Assets, only a general description is provided.
32. Basic/Diluted Earnings Per Share
2012 2011 2010
a. Net income attributable to equity holders of the Parent Company P=685,750 P=509,580 P=624,710
b. Weighted average number of common shares outstanding 3,160,403,866 3,160,403,866 3,160,403,866
c. Basic/diluted earnings per share P=0.217 P=0.161 P=0.198
The Group does not have potentially dilutive common shares as of December 31, 2012, 2011 and 2010. Therefore, the basic/dilutive earnings per share are the same as of those dates.
33. Financial Risk Management Objectives and Policies
The Group’s principal financial instruments include non-derivative instruments such as cash and cash equivalents, AFS financial assets, accounts receivable, bank loans, accounts payable and accrued liabilities, long-term debts and obligations and advances to and from related parties. The main purpose of these financial instruments
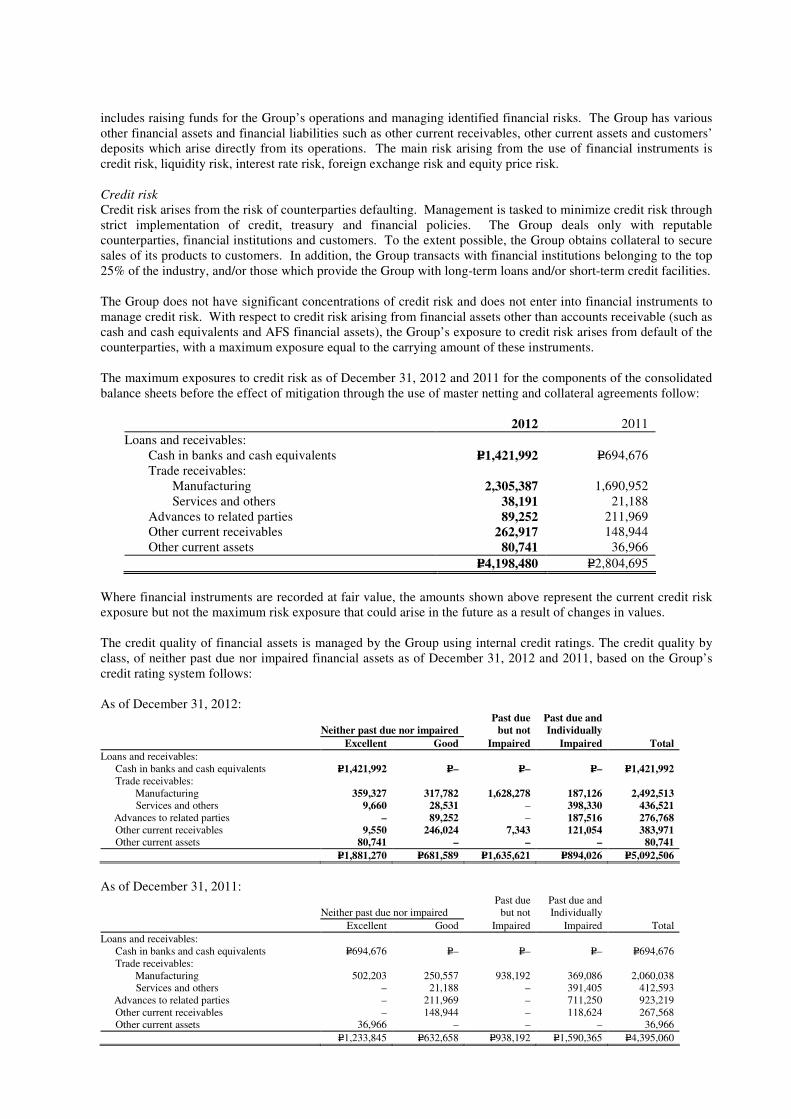
includes raising funds for the Group’s operations and managing identified financial risks. The Group has various other financial assets and financial liabilities such as other current receivables, other current assets and customers’ deposits which arise directly from its operations. The main risk arising from the use of financial instruments is credit risk, liquidity risk, interest rate risk, foreign exchange risk and equity price risk.
Credit risk
Credit risk arises from the risk of counterparties defaulting. Management is tasked to minimize credit risk through strict implementation of credit, treasury and financial policies. The Group deals only with reputable counterparties, financial institutions and customers. To the extent possible, the Group obtains collateral to secure sales of its products to customers. In addition, the Group transacts with financial institutions belonging to the top 25% of the industry, and/or those which provide the Group with long-term loans and/or short-term credit facilities.
The Group does not have significant concentrations of credit risk and does not enter into financial instruments to manage credit risk. With respect to credit risk arising from financial assets other than accounts receivable (such as cash and cash equivalents and AFS financial assets), the Group’s exposure to credit risk arises from default of the counterparties, with a maximum exposure equal to the carrying amount of these instruments.
The maximum exposures to credit risk as of December 31, 2012 and 2011 for the components of the consolidated balance sheets before the effect of mitigation through the use of master netting and collateral agreements follow:
2012 2011
Loans and receivables: Cash in banks and cash equivalents P=1,421,992 P=694,676 Trade receivables: Manufacturing 2,305,387 1,690,952 Services and others 38,191 21,188 Advances to related parties 89,252 211,969 Other current receivables 262,917 148,944 Other current assets 80,741 36,966
P=4,198,480 P=2,804,695
Where financial instruments are recorded at fair value, the amounts shown above represent the current credit risk exposure but not the maximum risk exposure that could arise in the future as a result of changes in values.
The credit quality of financial assets is managed by the Group using internal credit ratings. The credit quality by class, of neither past due nor impaired financial assets as of December 31, 2012 and 2011, based on the Group’s credit rating system follows:
As of December 31, 2012: Past due Past due and Neither past due nor impaired but not Individually
Excellent Good Impaired Impaired Total
Loans and receivables: Cash in banks and cash equivalents P=1,421,992 P=– P=– P=– P=1,421,992 Trade receivables: Manufacturing 359,327 317,782 1,628,278 187,126 2,492,513
Services and others 9,660 28,531 – 398,330 436,521 Advances to related parties – 89,252 – 187,516 276,768
Other current receivables 9,550 246,024 7,343 121,054 383,971 Other current assets 80,741 – – – 80,741
P=1,881,270 P=681,589 P=1,635,621 P=894,026 P=5,092,506
As of December 31, 2011: Past due Past due and Neither past due nor impaired but not Individually
Excellent Good Impaired Impaired Total
Loans and receivables: Cash in banks and cash equivalents P=694,676 P=– P=– P=– P=694,676 Trade receivables: Manufacturing 502,203 250,557 938,192 369,086 2,060,038
Services and others – 21,188 – 391,405 412,593 Advances to related parties – 211,969 – 711,250 923,219
Other current receivables – 148,944 – 118,624 267,568 Other current assets 36,966 – – – 36,966
P=1,233,845 P=632,658 P=938,192 P=1,590,365 P=4,395,060

Credit quality of cash in banks and cash equivalents and AFS financial assets are based on the nature of the counterparty and the Group’s internal rating system.
Financial assets that are neither past due nor impaired are classified as “Excellent” account when these are expected to be collected or liquidated on or before their due dates, or upon call by the Group if there are no predetermined defined due dates. All other financial assets that are neither past due or impaired are classified as “Good” accounts.
The aging analysis of past due but not impaired financial assets as of December 31, 2012 and 2011 follows:
As of December 31, 2012:
Past due but not impaired
Less than 31 to 61 to 91 to More than 30 days 60 days 90 days 365 days 365 days Total
Loans and receivables: Trade receivables P=515,141 P=503,194 P=117,955 P=117,140 P=374,848 P=1,628,278 Other current receivables 7,343 – – – – 7,343
P=522,484 P=503,194 P=117,955 P=117,140 P=374,848 P=1,635,621
As of December 31, 2011:
Past due but not impaired
Less than 31 to 61 to 91 to More than 30 days 60 days 90 days 365 days 365 days Total
Loans and receivables: Trade receivables P=486,069 P=206,640 P=53,710 P=86,507 P=105,266 P=938,192
Reconciliation of the allowance for doubtful accounts for loans and receivables by class follows:
As of December 31, 2012:
January 1,
2012Charges for
the year Write-offsReclassification ReversalsDecember 31,
Trade receivables : Manufacturing P=369,086 P=47,474 (P=189,510 (P=2,781)(P=37,143) P=187,126 Services and others 391,405 – 398,330Advances to related parties 711,250 20,400 (546,915) – 187,516Other current receivables 118,624 – 121,054
P=1,590,365 P=77,229 (P=736,425 (P=37,143) P=894,026
Individual impairment P=448,151 P=11,071 (P=173,227 (P=2,781(P=24,918) P=258,296Collective impairment 1,142,214 66,158 (563,198 (12,225) 635,730
P=1,590,365 P=77,229 (P=736,425) (P=37,143) P=894,026
As of December 31, 2011:
January 1, Charges for
the year Write-offsReclassification ReversalsDecember 31,
Trade receivables : Manufacturing P=347,078 P=51,821 (P=28,970) (P=843) P=369,086 Services and others 391,159 – 391Advances to related parties 753,209 (30,000) (12,000) 711Other current receivables 121,626 – 118
P=1,613,072 P=52,284 (P=62,148) (P=12,843) P=1,590,365
(Forward)
January 1, Charges for
the year Write-offsReclassification ReversalsDecember 31,
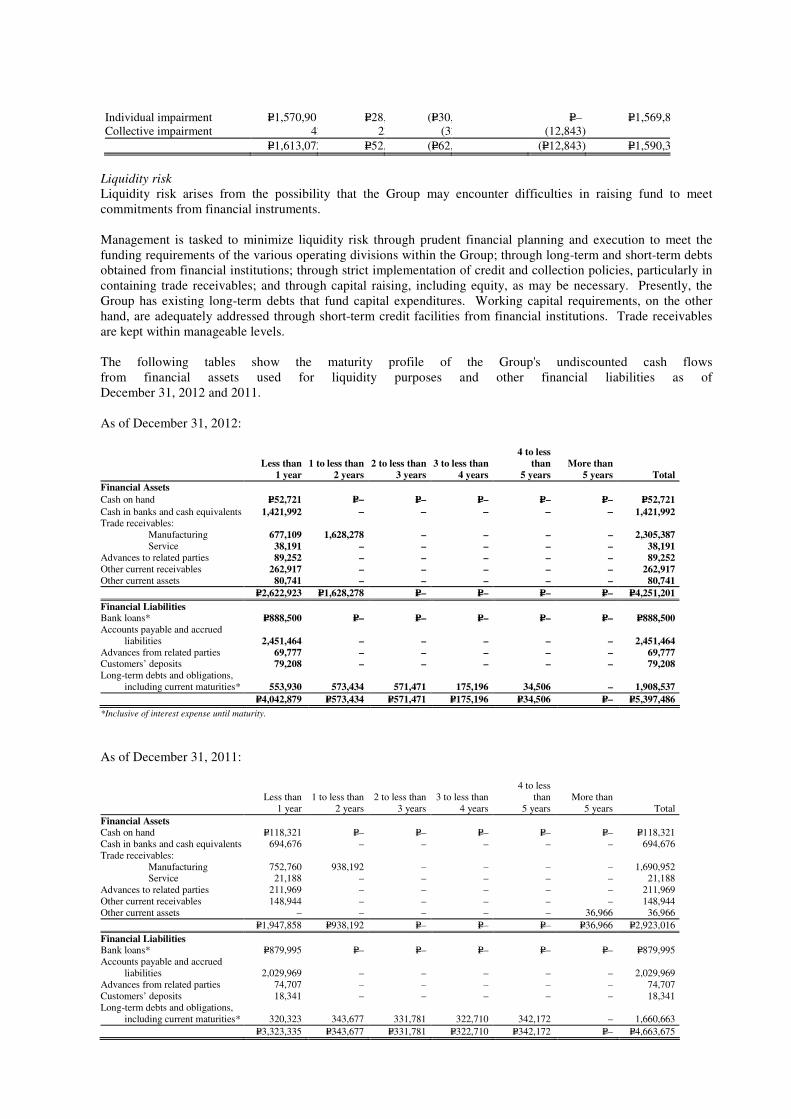
Individual impairment P=1,570,901 P=28,979 (P=30,000) P=– P=1,569,880Collective impairment 42,171 23,305 (32,148) (12,843)
P=1,613,072 P=52,284 (P=62,148) (P=12,843) P=1,590,365
Liquidity risk Liquidity risk arises from the possibility that the Group may encounter difficulties in raising fund to meet commitments from financial instruments.
Management is tasked to minimize liquidity risk through prudent financial planning and execution to meet the funding requirements of the various operating divisions within the Group; through long-term and short-term debts obtained from financial institutions; through strict implementation of credit and collection policies, particularly in containing trade receivables; and through capital raising, including equity, as may be necessary. Presently, the Group has existing long-term debts that fund capital expenditures. Working capital requirements, on the other hand, are adequately addressed through short-term credit facilities from financial institutions. Trade receivables are kept within manageable levels.
The following tables show the maturity profile of the Group's undiscounted cash flows from financial assets used for liquidity purposes and other financial liabilities as of December 31, 2012 and 2011.
As of December 31, 2012:
Less than
1 year 1 to less than
2 years 2 to less than
3 years 3 to less than
4 years
4 to less than
5 years More than
5 years Total
Financial Assets
Cash on hand P=52,721 P=– P=– P=– P=– P=– P=52,721
Cash in banks and cash equivalents 1,421,992 – – – – – 1,421,992 Trade receivables: Manufacturing 677,109 1,628,278 – – – – 2,305,387 Service 38,191 – – – – – 38,191 Advances to related parties 89,252 – – – – – 89,252 Other current receivables 262,917 – – – – – 262,917 Other current assets 80,741 – – – – – 80,741
P=2,622,923 P=1,628,278 P=– P=– P=– P=– P=4,251,201
Financial Liabilities Bank loans* P=888,500 P=– P=– P=– P=– P=– P=888,500 Accounts payable and accrued
liabilities 2,451,464 – – – – – 2,451,464 Advances from related parties 69,777 – – – – – 69,777 Customers’ deposits 79,208 – – – – – 79,208 Long-term debts and obligations,
including current maturities* 553,930 573,434 571,471 175,196 34,506 – 1,908,537
P=4,042,879 P=573,434 P=571,471 P=175,196 P=34,506 P=– P=5,397,486
*Inclusive of interest expense until maturity.
As of December 31, 2011:
Less than
1 year 1 to less than
2 years 2 to less than
3 years 3 to less than
4 years
4 to less than
5 years More than
5 years Total
Financial Assets Cash on hand P=118,321 P=– P=– P=– P=– P=– P=118,321 Cash in banks and cash equivalents 694,676 – – – – – 694,676 Trade receivables: Manufacturing 752,760 938,192 – – – – 1,690,952 Service 21,188 – – – – – 21,188 Advances to related parties 211,969 – – – – – 211,969 Other current receivables 148,944 – – – – – 148,944 Other current assets – – – – – 36,966 36,966
P=1,947,858 P=938,192 P=– P=– P=– P=36,966 P=2,923,016
Financial Liabilities Bank loans* P=879,995 P=– P=– P=– P=– P=– P=879,995 Accounts payable and accrued
liabilities 2,029,969 – – – – – 2,029,969 Advances from related parties 74,707 – – – – – 74,707 Customers’ deposits 18,341 – – – – – 18,341 Long-term debts and obligations,
including current maturities* 320,323 343,677 331,781 322,710 342,172 – 1,660,663
P=3,323,335 P=343,677 P=331,781 P=322,710 P=342,172 P=– P=4,663,675
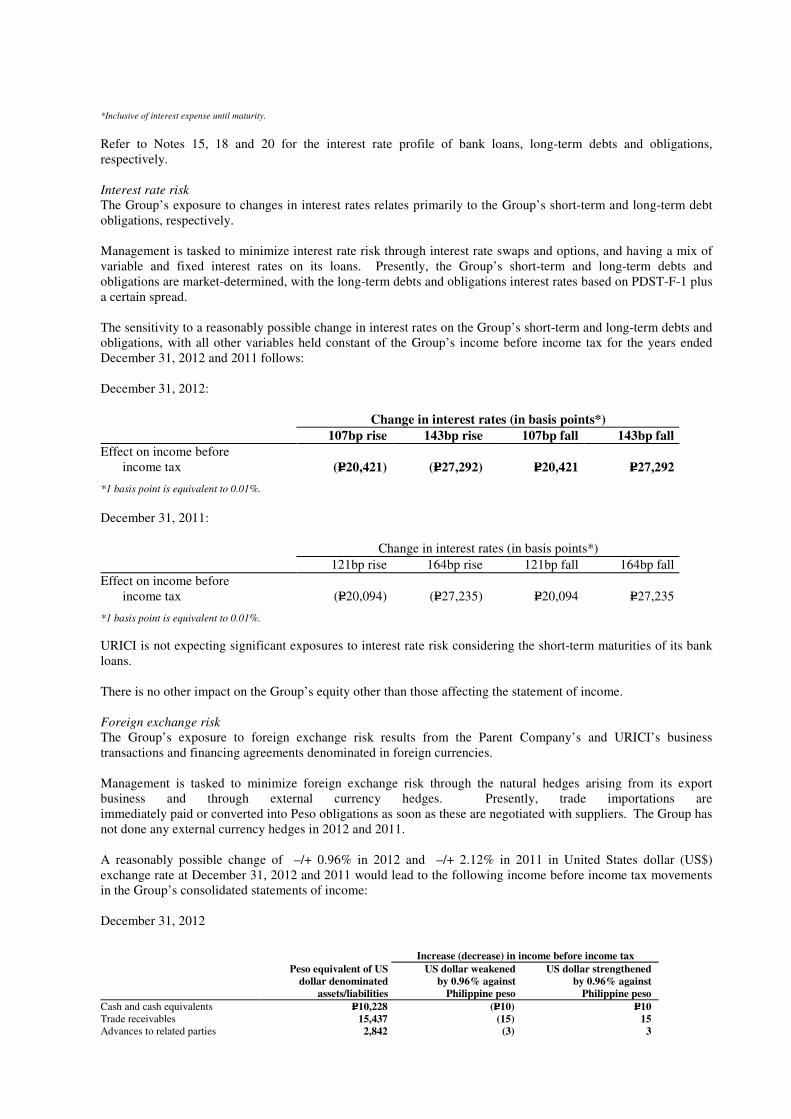
*Inclusive of interest expense until maturity.
Refer to Notes 15, 18 and 20 for the interest rate profile of bank loans, long-term debts and obligations, respectively.
Interest rate risk
The Group’s exposure to changes in interest rates relates primarily to the Group’s short-term and long-term debt obligations, respectively.
Management is tasked to minimize interest rate risk through interest rate swaps and options, and having a mix of variable and fixed interest rates on its loans. Presently, the Group’s short-term and long-term debts and obligations are market-determined, with the long-term debts and obligations interest rates based on PDST-F-1 plus a certain spread.
The sensitivity to a reasonably possible change in interest rates on the Group’s short-term and long-term debts and obligations, with all other variables held constant of the Group’s income before income tax for the years ended December 31, 2012 and 2011 follows:
December 31, 2012:
Change in interest rates (in basis points*) 107bp rise 143bp rise 107bp fall 143bp fall
Effect on income before income tax (P=20,421) (P=27,292) P=20,421 P=27,292
*1 basis point is equivalent to 0.01%.
December 31, 2011:
Change in interest rates (in basis points*)
121bp rise 164bp rise 121bp fall 164bp fall
Effect on income before income tax (P=20,094) (P=27,235) P=20,094 P=27,235
*1 basis point is equivalent to 0.01%.
URICI is not expecting significant exposures to interest rate risk considering the short-term maturities of its bank loans.
There is no other impact on the Group’s equity other than those affecting the statement of income.
Foreign exchange risk
The Group’s exposure to foreign exchange risk results from the Parent Company’s and URICI’s business transactions and financing agreements denominated in foreign currencies.
Management is tasked to minimize foreign exchange risk through the natural hedges arising from its export business and through external currency hedges. Presently, trade importations are immediately paid or converted into Peso obligations as soon as these are negotiated with suppliers. The Group has not done any external currency hedges in 2012 and 2011.
A reasonably possible change of –/+ 0.96% in 2012 and –/+ 2.12% in 2011 in United States dollar (US$) exchange rate at December 31, 2012 and 2011 would lead to the following income before income tax movements in the Group’s consolidated statements of income:
December 31, 2012
Increase (decrease) in income before income tax
Peso equivalent of US
dollar denominated US dollar weakened
by 0.96% against US dollar strengthened
by 0.96% against assets/liabilities Philippine peso Philippine peso
Cash and cash equivalents P=10,228 (P=10) P=10 Trade receivables 15,437 (15) 15 Advances to related parties 2,842 (3) 3

Other assets 97 (0) 0 Accounts payable (40,352) 39 (39) Advances from related parties (22,842) 22 (22)
(P=34,590) P=33 (P=33)
December 31, 2011
Increase (decrease) in income before income tax
Peso equivalent of US
dollar denominated US dollar weakened
by 2.12% against US dollar strengthened
by 2.12% against assets/liabilities Philippine peso Philippine peso
Cash and cash equivalents P=41,870 (P=887) P=887 Trade receivables 34,000 (721) 721 Advances to related parties 8,418 (178) 178 Other assets 2,861 (61) 61 Accounts payable (22,303) 473 (473) Advances from related parties (327) 7 (7)
P=64,519 (P=1,367) P=1,367
The exchange rate of the Peso to the US Dollar is P=41.05 and P=43.84 as of December 31, 2012 and 2011, respectively.
There is no other impact on the Group’s equity other than those affecting the statement of income.
Equity price risk
Equity price risk is such risk where the fair values of investments in quoted equity securities could decrease as a result of changes in the levels of equity indices and the value of individual stock. Management strictly monitors the movement of the share prices pertaining to its investments. The Group is exposed to equity securities price risk because of quoted common and golf club shares, which are classified as AFS financial assets (see Note 12). These investments, totaling P=17.26 million and P=32.13 million as of December 31, 2012 and 2011, respectively, represent 0.30% and 0.33% of the total assets of the Group.
The effects on equity, as a result of a reasonably possible change in the fair value of the Group’s equity instruments held as AFS financial assets as of December 31, 2012 and 2011, which could be brought by changes in quoted prices with all other variables held constant, follow:
Change in quoted prices of investments carried
at fair value 2012 2011
Increase by 10% P=1,726 P=3,213 Increase by 5% 863 1,607 Decrease by 10% (1,726) (3,213) Decrease by 5% (863) (1,607)
There is no other impact on the Group’s equity other than those affecting the statement of income.
34. Financial Assets and Financial Liabilities The following summarizes the carrying values and fair values of the Group’s financial assets and financial
liabilities as of December 31:
December 31, 2012 December 31, 2011
Carrying
Value Fair
Value Carrying
Value Fair
Value
Financial Assets Cash on hand P=52,721 P=52,721 P=118,321 P=118,321
Loans and receivables: Cash in bank and cash equivalent 1,421,992 1,421,992 694,676 694,676 Trade receivables: Manufacturing 2,305,387 2,305,387 1,690,952 1,690,952 Services and others 38,191 38,191 21,188 21,188
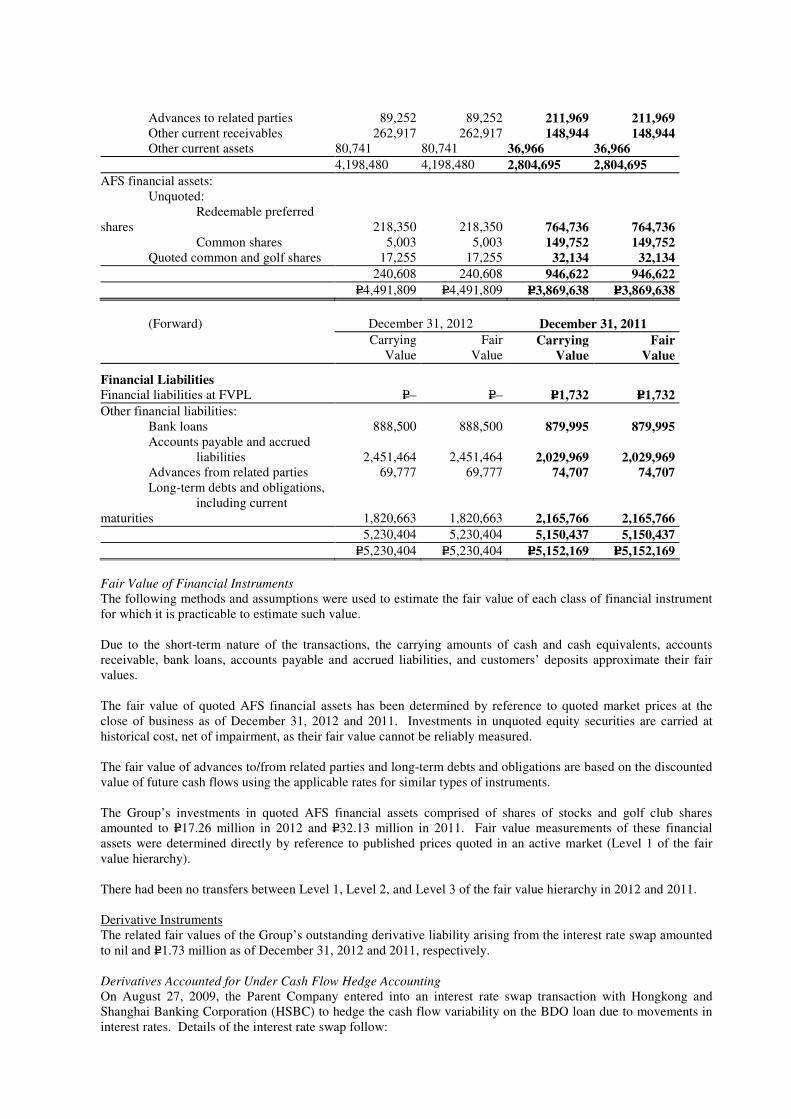
Advances to related parties 89,252 89,252 211,969 211,969 Other current receivables 262,917 262,917 148,944 148,944 Other current assets 80,741 80,741 36,966 36,966
4,198,480 4,198,480 2,804,695 2,804,695
AFS financial assets: Unquoted: Redeemable preferred shares 218,350 218,350 764,736 764,736 Common shares 5,003 5,003 149,752 149,752 Quoted common and golf shares 17,255 17,255 32,134 32,134
240,608 240,608 946,622 946,622
P=4,491,809 P=4,491,809 P=3,869,638 P=3,869,638
(Forward) December 31, 2012 December 31, 2011
Carrying
Value Fair
Value Carrying
Value Fair
Value
Financial Liabilities Financial liabilities at FVPL P=– P=– P=1,732 P=1,732
Other financial liabilities: Bank loans 888,500 888,500 879,995 879,995 Accounts payable and accrued liabilities 2,451,464 2,451,464 2,029,969 2,029,969 Advances from related parties 69,777 69,777 74,707 74,707 Long-term debts and obligations, including current maturities 1,820,663 1,820,663 2,165,766 2,165,766
5,230,404 5,230,404 5,150,437 5,150,437
P=5,230,404 P=5,230,404 P=5,152,169 P=5,152,169
Fair Value of Financial Instruments
The following methods and assumptions were used to estimate the fair value of each class of financial instrument for which it is practicable to estimate such value.
Due to the short-term nature of the transactions, the carrying amounts of cash and cash equivalents, accounts receivable, bank loans, accounts payable and accrued liabilities, and customers’ deposits approximate their fair values.
The fair value of quoted AFS financial assets has been determined by reference to quoted market prices at the close of business as of December 31, 2012 and 2011. Investments in unquoted equity securities are carried at historical cost, net of impairment, as their fair value cannot be reliably measured.
The fair value of advances to/from related parties and long-term debts and obligations are based on the discounted value of future cash flows using the applicable rates for similar types of instruments.
The Group’s investments in quoted AFS financial assets comprised of shares of stocks and golf club shares amounted to P=17.26 million in 2012 and P=32.13 million in 2011. Fair value measurements of these financial assets were determined directly by reference to published prices quoted in an active market (Level 1 of the fair value hierarchy).
There had been no transfers between Level 1, Level 2, and Level 3 of the fair value hierarchy in 2012 and 2011.
Derivative Instruments The related fair values of the Group’s outstanding derivative liability arising from the interest rate swap amounted to nil and P=1.73 million as of December 31, 2012 and 2011, respectively.
Derivatives Accounted for Under Cash Flow Hedge Accounting
On August 27, 2009, the Parent Company entered into an interest rate swap transaction with Hongkong and Shanghai Banking Corporation (HSBC) to hedge the cash flow variability on the BDO loan due to movements in interest rates. Details of the interest rate swap follow:
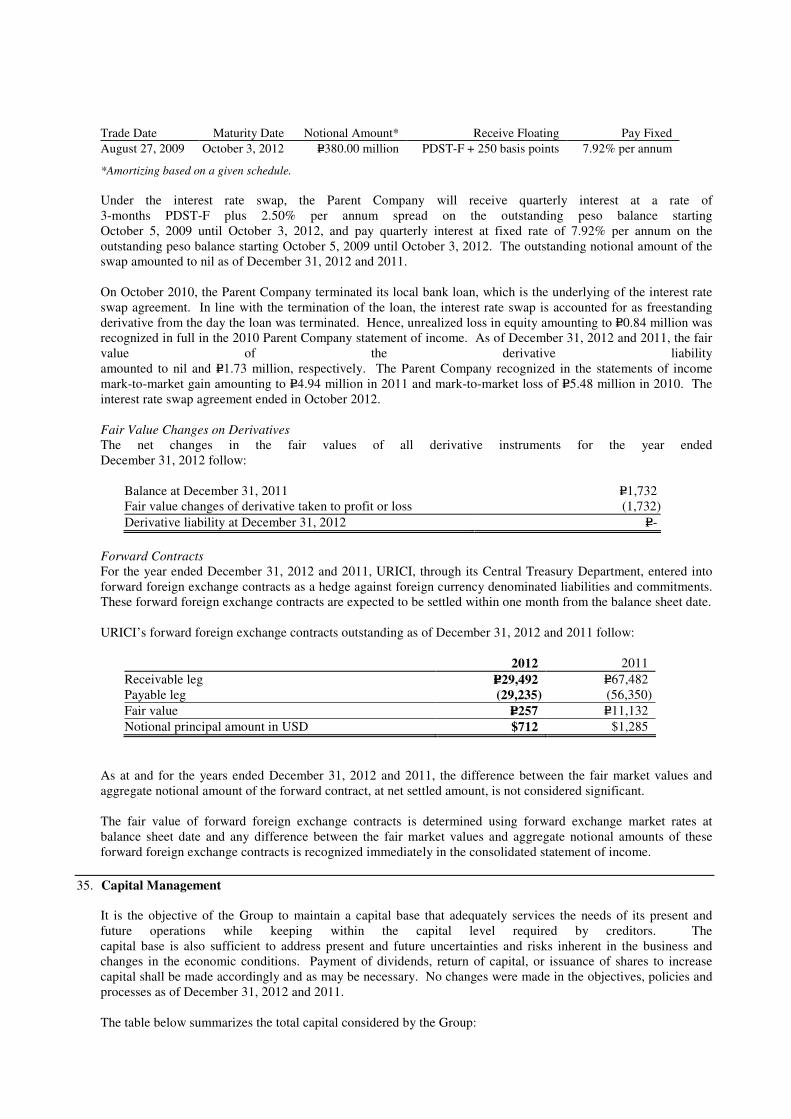
Trade Date Maturity Date Notional Amount* Receive Floating Pay Fixed
August 27, 2009 October 3, 2012 P=380.00 million PDST-F + 250 basis points 7.92% per annum
*Amortizing based on a given schedule.
Under the interest rate swap, the Parent Company will receive quarterly interest at a rate of 3-months PDST-F plus 2.50% per annum spread on the outstanding peso balance starting October 5, 2009 until October 3, 2012, and pay quarterly interest at fixed rate of 7.92% per annum on the outstanding peso balance starting October 5, 2009 until October 3, 2012. The outstanding notional amount of the swap amounted to nil as of December 31, 2012 and 2011.
On October 2010, the Parent Company terminated its local bank loan, which is the underlying of the interest rate swap agreement. In line with the termination of the loan, the interest rate swap is accounted for as freestanding derivative from the day the loan was terminated. Hence, unrealized loss in equity amounting to P=0.84 million was recognized in full in the 2010 Parent Company statement of income. As of December 31, 2012 and 2011, the fair value of the derivative liability amounted to nil and P=1.73 million, respectively. The Parent Company recognized in the statements of income mark-to-market gain amounting to P=4.94 million in 2011 and mark-to-market loss of P=5.48 million in 2010. The interest rate swap agreement ended in October 2012.
Fair Value Changes on Derivatives
The net changes in the fair values of all derivative instruments for the year ended December 31, 2012 follow:
Balance at December 31, 2011 P=1,732 Fair value changes of derivative taken to profit or loss (1,732)
Derivative liability at December 31, 2012 P=-
Forward Contracts
For the year ended December 31, 2012 and 2011, URICI, through its Central Treasury Department, entered into forward foreign exchange contracts as a hedge against foreign currency denominated liabilities and commitments. These forward foreign exchange contracts are expected to be settled within one month from the balance sheet date.
URICI’s forward foreign exchange contracts outstanding as of December 31, 2012 and 2011 follow:
2012 2011
Receivable leg P=29,492 P=67,482 Payable leg (29,235) (56,350)
Fair value P=257 P=11,132
Notional principal amount in USD $712 $1,285
As at and for the years ended December 31, 2012 and 2011, the difference between the fair market values and aggregate notional amount of the forward contract, at net settled amount, is not considered significant.
The fair value of forward foreign exchange contracts is determined using forward exchange market rates at balance sheet date and any difference between the fair market values and aggregate notional amounts of these forward foreign exchange contracts is recognized immediately in the consolidated statement of income.
35. Capital Management
It is the objective of the Group to maintain a capital base that adequately services the needs of its present and future operations while keeping within the capital level required by creditors. The capital base is also sufficient to address present and future uncertainties and risks inherent in the business and changes in the economic conditions. Payment of dividends, return of capital, or issuance of shares to increase capital shall be made accordingly and as may be necessary. No changes were made in the objectives, policies and processes as of December 31, 2012 and 2011.
The table below summarizes the total capital considered by the Group:

2012 2011
Capital stock P=3,160,404 P=3,160,404
Capital in excess of par value 788,643 788,643
Retained earnings 1,041,914 622,698
P=4,990,961 P=4,571,745
36. Notes to Consolidated Statements of Cash Flows
Noncash Investing Activities
a. In 2012, Double Dragon Properties Corporation assigned to RIBI a condominium unit with a total floor area
of 16.5 sqm. amounting to P=1.62 million as settlement of Philtown’s payable to RIBI.
b. The Group’s noncash investing activity in 2011 pertains to acquisitions of property and equipment amounting to P=5.71 million which were not paid as of December 31, 2011. These amounts are included as part of the “Accounts payable and accrued liabilities” account in the 2011 consolidated balance sheet.
c. The Group’s noncash investing activity in 2010 pertains to the reversal of allowance for impairment loss on
property, plant and equipment amounting to P=46.18 million, dividend receivable from Philtown amounting to P=10.00 million, and acquisitions of property and equipment amounting to P=0.94 million which were not paid as of December 31, 2010. The related receivables and payables are included as part of “Other receivables” and “Accounts payable and accrued liabilities” accounts in the 2010 consolidated balance sheet.
Noncash Financing Activities
a. The Group’s noncash financing activity in 2010 pertains to the interest rate swap that was used as hedge
amounting to P=6.68 million for the exposure to change in the fair value of the Group’s P=380.00 million fixed-rate loan.
37. Event After the Balance Sheet Date
a. On January 28, 2013, through the concurrence of the lenders, the Parent Company made a partial prepayment of its floating rate notes facility amounting to P=900.00 million and interest due thereon amounting to P=10.78 million including the amortization due amounting to P=93.75 million. After the said transaction, the outstanding balance of the floating rate note facility amounted to P=0.54 million which is payable in subsequent quarterly installments from April 2013 to April 2014.
In the first quarter of 2013, the Parent Company initiated the transfer of the operating facilities of the Milk and Juice Division from its Manggahan plant to Cabuyao at CMPC’s plant facilities.
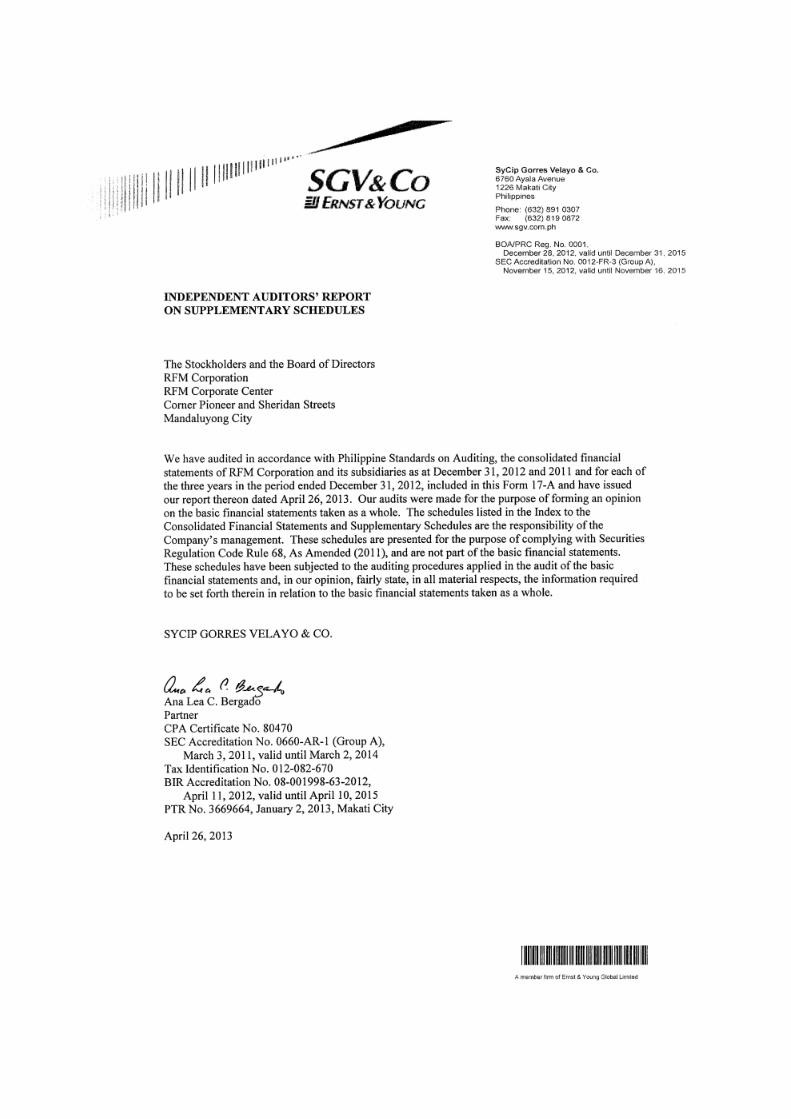
RFM CORPORATION AND SUBSIDIARIES Schedule A. Financial Assets For the year Ended December 31, 2012 (Amounts in Million Pesos unless otherwise stated)
Name of Issuing entity and association of each issue
Number of shares or principal amount of bonds and
notes
Amount shown in the
Balance Sheet
Valued based on market
quotation at end of
reporting period
Income received
and accrued
Philtown Inc. Preferred 218,349,995 307 Not listed 0
Sun Life Prosperity Balanced Fund 4,953,512 17 Not listed 0
Republic Dynamics Corporation 1,630,935 4 Not listed 0
PSI Technologies, Inc., (formerly PACSEM) 2,253 1 Not listed 0
Philtown Inc. Common 389,382 0 Not listed
Makati Sports Club, Inc. 1 0 Not listed 0
Philippine Long Distance Telephone Company, Inc. 5,670 0 Yes 0
Asia Finance Corporation, Ltd. 100,000 0 Not listed 0
Club Filipino, Inc. 1 0 Not listed 0
Philippine Exporters Trading Corporation 1 0 Not listed 0
Universal Rightfield 500,000 0 Not listed 0
Wellex Industries 280,000 0 Yes 0
Total 330 0
RFM CORPORATION AND SUBSIDIARIES Schedule B. Amounts Receivable from Directors, Officers, Employees, Related Parties and Principal Stockholders (Other than Affiliates) For the year Ended December 31, 2012 (Amounts in Million Pesos unless otherwise stated)
Name and Designation of Debtor
Balance at the
beginning of period Additions
Amounts Collected
Amounts written
off Current Not
Current
Balance at end of period
If collections was other
than in cash, explain
If for write off, give reasons
Concepcion, Jose Jr. 0 0 0
Concepcion, John Marie 0 0 0
Concepcion, Jose Maria III 13 13 13
Nacino, Felicisimo Jr. 1 1 1
Monasterio, Vina 1 1 1
Others 1 1 1
17 17 - 17

RFM CORPORATION AND SUBSIDIARIES Schedule C. Amounts Receivable from Related Parties which are eliminated during the Consolidation of
Financial Statements For the year Ended December 31, 2012 (Amounts in Million Pesos unless otherwise stated)
Name and Designation of Debtor
Balance at the beginning of
period Balance at the end of period
If collections was other than in cash, explain
If for write off, give reasons
Cabuyao Meat Processing Corporation 529 441
Interbake Commissary Corporation 26 187
RFM Foods Philippines Corporation 182 185
RFM Tuna Corporation 141 142
Filipinas Water Bottling Company, Inc. 21 24
RFM Canning & Marketing, Inc. 35 35
Total 934 1,014

60
RFM CORPORATION AND SUBSIDIARIES Schedule D. Intangible Assets - Other Assets For the year Ended December 31, 2012 (Amounts in Million Pesos unless otherwise stated)
Name and Designation of Debtor
Balance at the
beginning of period Additions
Amounts Collected
Amounts written
off Current Not
Current
Balance at end of period
If collections was other
than in cash, explain
If for write off,
give reasons
Goodwill 191 191 191

61
RFM CORPORATION AND SUBSIDIARIES Schedule E. LONG TERM DEBT For the year Ended December 31, 2012 (Amounts in Million Pesos unless otherwise stated)
Title of Issue and type of obligation Amount
authorized by
Indenture
Amount shown under caption "Current
portion of long-term debt" in related
balance sheet
Amount shown under caption "Long-term
debt" in related balance sheet
Floating rate note facility from local banks, with interest rate of 6.12% 1,500.00 375.00 750.00
Loan from local bank with interest rate based on 3-month PDST-F plus spread of 1.65% 500.00 117.65 294.12
Loan from local bank with interest rate based on 3-month PDST-F plus spread of 1.75% 160.00 - 160.00
Loan from local bank with interest rate based on 3-month PDST-F plus spread of 1.75% 150.00 53.43 61.27
Total 2,310.00 546.08 1,265.39
RFM CORPORATION AND SUBSIDIARIES Schedule F. INDEBTEDNESS TO RELATED PARTIES For the year Ended December 31, 2012 (Amounts in Million Pesos unless otherwise stated)
Name and Designation of Debtor Balance at the
beginning of period Balance at the end of
period
Unilever Group (0) (26)
Unilever Philippines Inc. (Parent) (4) (4)
Unilever NV (Netherlands) (8) (0)
Philtown Propeties, Inc. (26) (24)
Swift Foods Inc. (1) (0)
PT Aqua (16) -
Selecta Wall's Land Corporation (1) -
Others (18) (15)
Total (75) (70)

62
RFM CORPORATION AND SUBSIDIARIES Schedule H. CAPITAL STOCK For the year Ended December 31, 2012 (Amounts in Million Pesos unless otherwise stated)
Number of Shared Held By
Title of Issue
Number of
Shares Authorized
Number of Shares Issued
and Outstanding*
Number of Shares Reserved for
Options, Warrants, Conversions, and
Other Rights
Affiliates
Directors,
Officers and Employees
Others
Common stock – P1 par value
3,978,265,025
3,160,403,866
-
-
21,622,695
3,138,781,171
3,978,265,025 3,160,403,866 - - 21,622,695 3,138,781,171
RFM CORPORATION AND SUBSIDIARIES Schedule I. List of Philippine Financial Reporting Standards (PFRSs) [which consist of
PFRSs, Philippine Accounting Standards (PASs) and Philippine Interpretations] effective as of December 31, 2012
PHILIPPINE FINANCIAL REPORTING STANDARDS AND INTERPRETATIONS Effective as of December 31, 2012
Adopted Not Early Adopted
Not Applicable
Framework for the Preparation and Presentation of Financial Statements Conceptual Framework Phase A: Objectives and qualitative characteristics •
PFRSs Practice Statement Management Commentary •
Philippine Financial Reporting Standards
First-time Adoption of Philippine Financial Reporting Standards •
Amendments to PFRS 1 and PAS 27: Cost of an Investment in a Subsidiary, Jointly Controlled Entity or Associate •
Amendments to PFRS 1: Additional Exemptions for First-time Adopters •
Amendment to PFRS 1: Limited Exemption from Comparative PFRS 7 Disclosures for First-time Adopters •
Amendments to PFRS 1: Severe Hyperinflation and Removal of Fixed Date for First-time Adopters •
PFRS 1 (Revised)
Amendments to PFRS 1: Government Loans •
Share-based Payment •
Amendments to PFRS 2: Vesting Conditions and Cancellations •
PFRS 2
Amendments to PFRS 2: Group Cash-settled Share-based Payment Transactions •
PFRS 3 Business Combinations •
63
PHILIPPINE FINANCIAL REPORTING STANDARDS AND INTERPRETATIONS Effective as of December 31, 2012
Adopted Not Early Adopted
Not Applicable
(Revised)
Insurance Contracts • PFRS 4
Amendments to PAS 39 and PFRS 4: Financial Guarantee Contracts •
PFRS 5 Non-current Assets Held for Sale and Discontinued Operations •
PFRS 6 Exploration for and Evaluation of Mineral Resources •
Financial Instruments: Disclosures • PFRS 7
Amendments to PFRS 7: Transition •
PHILIPPINE FINANCIAL REPORTING STANDARDS AND INTERPRETATIONS Effective as of December 31, 2012
Adopted Not Early Adopted
Not Applicable
Amendments to PAS 39 and PFRS 7: Reclassification of Financial Assets •
Amendments to PAS 39 and PFRS 7: Reclassification of Financial Assets - Effective Date and Transition •
Amendments to PFRS 7: Improving Disclosures about Financial Instruments •
Amendments to PFRS 7: Disclosures - Transfers of Financial Assets •
Amendments to PFRS 7: Disclosures - Offsetting Financial Assets and Financial Liabilities •
PFRS 7
Amendments to PFRS 7: Mandatory Effective Date of PFRS 9 and Transition Disclosures •
PFRS 8 Operating Segments •
Financial Instruments • PFRS 9
Amendments to PFRS 9: Mandatory Effective Date of PFRS 9 and Transition Disclosures •
PFRS 10 Consolidated Financial Statements •
PFRS 11 Joint Arrangements* •
PFRS 12 Disclosure of Interests in Other Entities •
PFRS 13 Fair Value Measurement •
Philippine Accounting Standards
Presentation of Financial Statements •
Amendment to PAS 1: Capital Disclosures •
PAS 1 (Revised)
Amendments to PAS 32 and PAS 1: Puttable Financial Instruments and Obligations Arising on
•
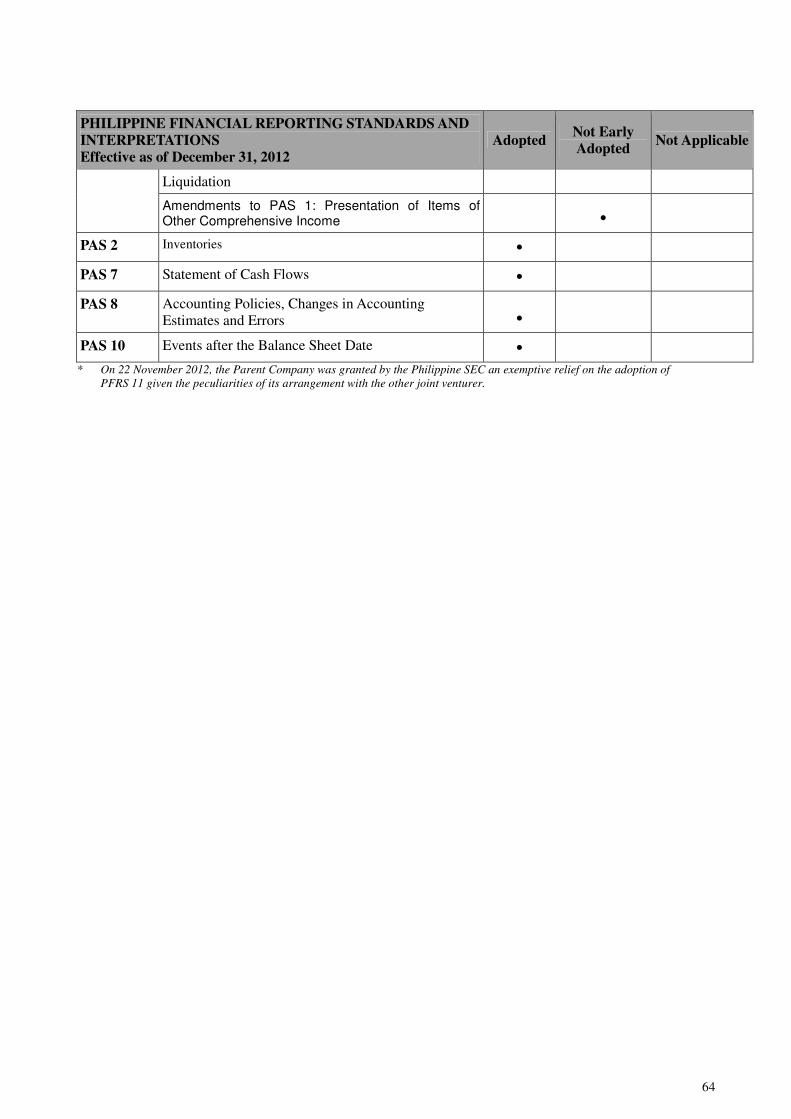
64
PHILIPPINE FINANCIAL REPORTING STANDARDS AND INTERPRETATIONS Effective as of December 31, 2012
Adopted Not Early Adopted
Not Applicable
Liquidation
Amendments to PAS 1: Presentation of Items of Other Comprehensive Income •
PAS 2 Inventories •
PAS 7 Statement of Cash Flows •
PAS 8 Accounting Policies, Changes in Accounting Estimates and Errors •
PAS 10 Events after the Balance Sheet Date • * On 22 November 2012, the Parent Company was granted by the Philippine SEC an exemptive relief on the adoption of
PFRS 11 given the peculiarities of its arrangement with the other joint venturer.

65
PHILIPPINE FINANCIAL REPORTING STANDARDS AND INTERPRETATIONS Effective as of December 31, 2012
Adopted Not Early Adopted
Not Applicable
PAS 11 Construction Contracts •
Income Taxes • PAS 12
Amendment to PAS 12 - Deferred Tax: Recovery of Underlying Assets •
PAS 16 Property, Plant and Equipment •
PAS 17 Leases •
PAS 18 Revenue •
PAS 19 Employee Benefits •
Amendments to PAS 19: Actuarial Gains and Losses, Group Plans and Disclosures •
PAS 19 (Amended)
Employee Benefits •
PAS 20 Accounting for Government Grants and Disclosure of Government Assistance •
The Effects of Changes in Foreign Exchange Rates • PAS 21
Amendment: Net Investment in a Foreign Operation •
PAS 23 (Revised)
Borrowing Costs •
PAS 24 (Revised)
Related Party Disclosures •
PAS 26 Accounting and Reporting by Retirement Benefit Plans •
PAS 27 (Amended)
Separate Financial Statements •
PAS 28 (Amended)
Investments in Associates and Joint Ventures •
PAS 29 Financial Reporting in Hyperinflationary Economies •
PAS 31 Interests in Joint Ventures •
Financial Instruments: Disclosure and Presentation •
Amendments to PAS 32 and PAS 1: Puttable Financial Instruments and Obligations Arising on Liquidation •
Amendment to PAS 32: Classification of Rights Issues •
PAS 32
Amendments to PAS 32: Offsetting Financial Assets and Financial Liabilities •
PAS 33 Earnings per Share •
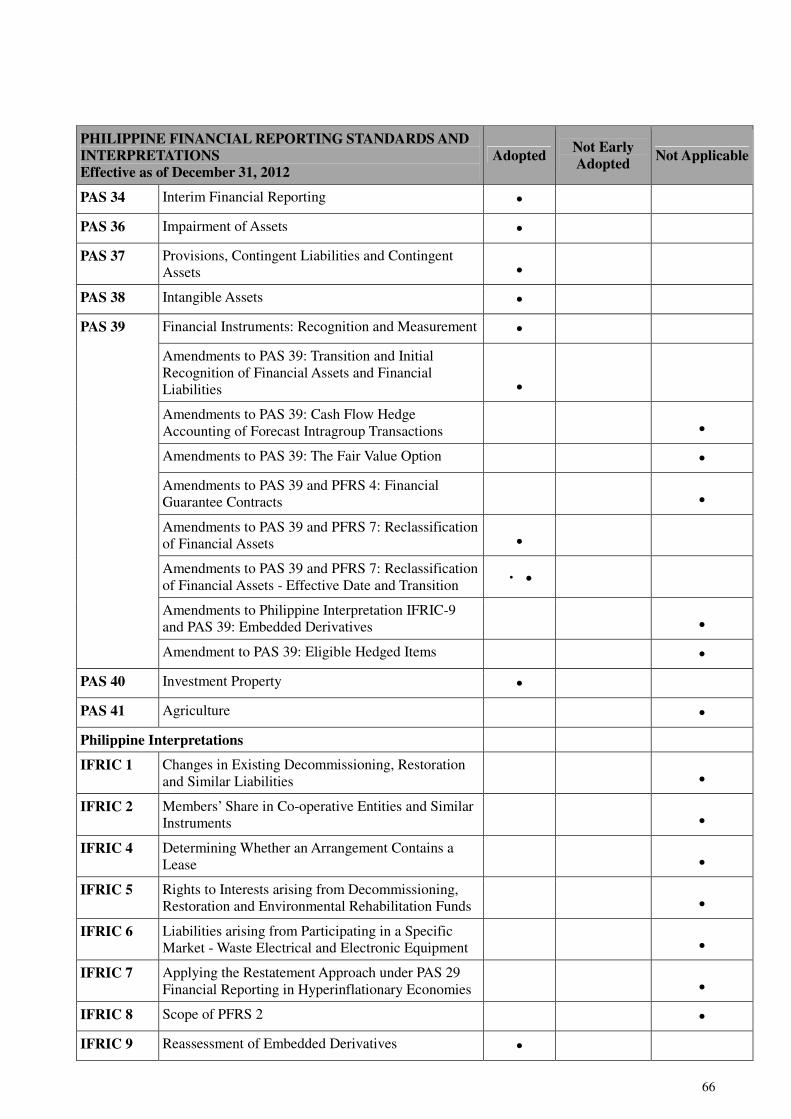
66
PHILIPPINE FINANCIAL REPORTING STANDARDS AND INTERPRETATIONS Effective as of December 31, 2012
Adopted Not Early Adopted
Not Applicable
PAS 34 Interim Financial Reporting •
PAS 36 Impairment of Assets •
PAS 37 Provisions, Contingent Liabilities and Contingent Assets •
PAS 38 Intangible Assets •
Financial Instruments: Recognition and Measurement •
Amendments to PAS 39: Transition and Initial Recognition of Financial Assets and Financial Liabilities •
Amendments to PAS 39: Cash Flow Hedge Accounting of Forecast Intragroup Transactions •
Amendments to PAS 39: The Fair Value Option •
Amendments to PAS 39 and PFRS 4: Financial Guarantee Contracts •
Amendments to PAS 39 and PFRS 7: Reclassification of Financial Assets •
Amendments to PAS 39 and PFRS 7: Reclassification of Financial Assets - Effective Date and Transition •
Amendments to Philippine Interpretation IFRIC-9 and PAS 39: Embedded Derivatives •
PAS 39
Amendment to PAS 39: Eligible Hedged Items •
PAS 40 Investment Property •
PAS 41 Agriculture •
Philippine Interpretations
IFRIC 1 Changes in Existing Decommissioning, Restoration and Similar Liabilities •
IFRIC 2 Members’ Share in Co-operative Entities and Similar Instruments •
IFRIC 4 Determining Whether an Arrangement Contains a Lease •
IFRIC 5 Rights to Interests arising from Decommissioning, Restoration and Environmental Rehabilitation Funds •
IFRIC 6 Liabilities arising from Participating in a Specific Market - Waste Electrical and Electronic Equipment •
IFRIC 7 Applying the Restatement Approach under PAS 29 Financial Reporting in Hyperinflationary Economies •
IFRIC 8 Scope of PFRS 2 •
IFRIC 9 Reassessment of Embedded Derivatives •
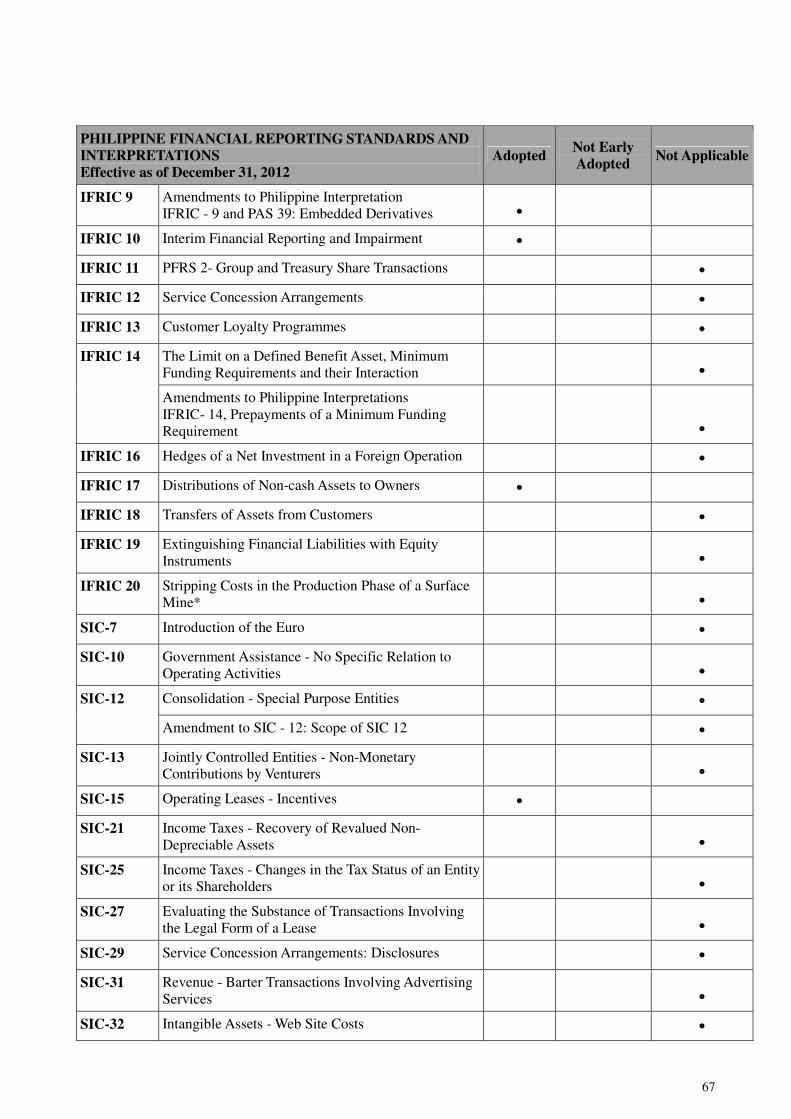
67
PHILIPPINE FINANCIAL REPORTING STANDARDS AND INTERPRETATIONS Effective as of December 31, 2012
Adopted Not Early Adopted
Not Applicable
IFRIC 9 Amendments to Philippine Interpretation IFRIC - 9 and PAS 39: Embedded Derivatives •
IFRIC 10 Interim Financial Reporting and Impairment •
IFRIC 11 PFRS 2- Group and Treasury Share Transactions •
IFRIC 12 Service Concession Arrangements •
IFRIC 13 Customer Loyalty Programmes •
The Limit on a Defined Benefit Asset, Minimum Funding Requirements and their Interaction •
IFRIC 14
Amendments to Philippine Interpretations IFRIC- 14, Prepayments of a Minimum Funding Requirement •
IFRIC 16 Hedges of a Net Investment in a Foreign Operation •
IFRIC 17 Distributions of Non-cash Assets to Owners •
IFRIC 18 Transfers of Assets from Customers •
IFRIC 19 Extinguishing Financial Liabilities with Equity Instruments •
IFRIC 20 Stripping Costs in the Production Phase of a Surface Mine* •
SIC-7 Introduction of the Euro •
SIC-10 Government Assistance - No Specific Relation to Operating Activities •
Consolidation - Special Purpose Entities • SIC-12
Amendment to SIC - 12: Scope of SIC 12 •
SIC-13 Jointly Controlled Entities - Non-Monetary Contributions by Venturers •
SIC-15 Operating Leases - Incentives •
SIC-21 Income Taxes - Recovery of Revalued Non-Depreciable Assets •
SIC-25 Income Taxes - Changes in the Tax Status of an Entity or its Shareholders •
SIC-27 Evaluating the Substance of Transactions Involving the Legal Form of a Lease •
SIC-29 Service Concession Arrangements: Disclosures •
SIC-31 Revenue - Barter Transactions Involving Advertising Services •
SIC-32 Intangible Assets - Web Site Costs •
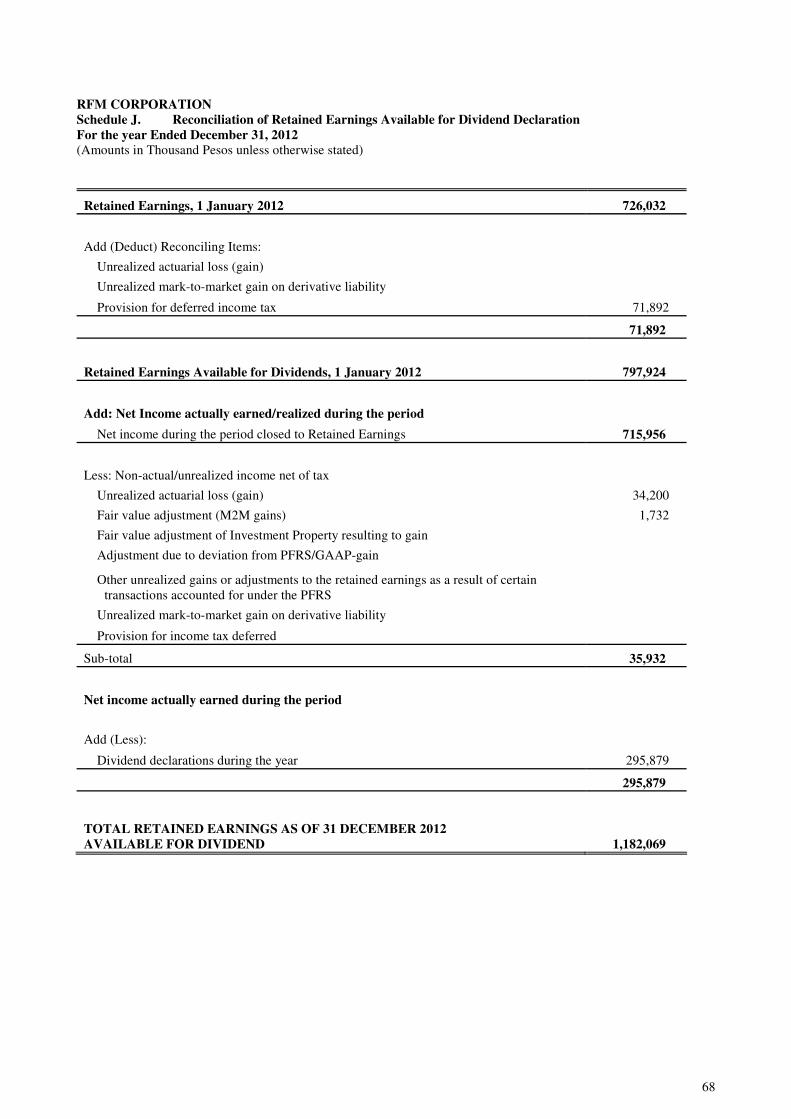
68
RFM CORPORATION Schedule J. Reconciliation of Retained Earnings Available for Dividend Declaration For the year Ended December 31, 2012 (Amounts in Thousand Pesos unless otherwise stated)
Retained Earnings, 1 January 2012 726,032
Add (Deduct) Reconciling Items:
Unrealized actuarial loss (gain)
Unrealized mark-to-market gain on derivative liability
Provision for deferred income tax 71,892
71,892
Retained Earnings Available for Dividends, 1 January 2012 797,924
Add: Net Income actually earned/realized during the period
Net income during the period closed to Retained Earnings 715,956
Less: Non-actual/unrealized income net of tax
Unrealized actuarial loss (gain) 34,200
Fair value adjustment (M2M gains) 1,732
Fair value adjustment of Investment Property resulting to gain
Adjustment due to deviation from PFRS/GAAP-gain
Other unrealized gains or adjustments to the retained earnings as a result of certain transactions accounted for under the PFRS
Unrealized mark-to-market gain on derivative liability
Provision for income tax deferred
Sub-total 35,932
Net income actually earned during the period
Add (Less):
Dividend declarations during the year 295,879
295,879
TOTAL RETAINED EARNINGS AS OF 31 DECEMBER 2012 AVAILABLE FOR DIVIDEND 1,182,069
69
RFM CORPORATION AND SUBSIDIARIES Schedule K. Conglomerate Mapping As of December 31, 2012

70
RFM CORPORATION AND SUBSIDIARIES Schedule L. Financial Soundness Indicators
Years ended December 31
2012 2011
1 Current Ratio 1.42 1.33
2 Debt-to-Equity Ratio 1.04 1.08
3 Asset to Equity Ratio 2.04 2.08
4 Interest Rate Coverage Ratio 10.32 8.09
5 Gross Profit Rate 33.91% 31.73%
6 Net income Rate 6.20% 4.92%
- 2 -

- 71 -

- 72 -
December 31
2009 2008
Equity (Note 19)
COVER SHEET
1 2 9 9 8
SEC Registration Number
COVER SHEET
1 2 9 9 8
SEC Registration Number
- 73 -
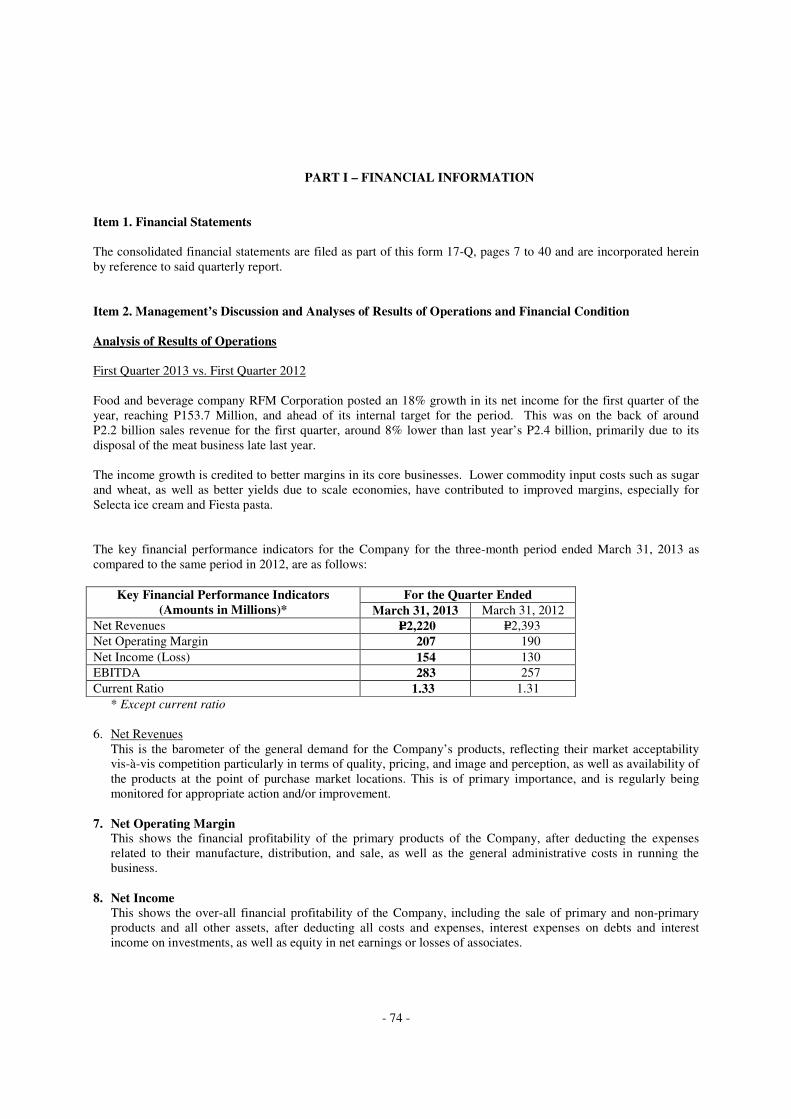
- 74 -
PART I – FINANCIAL INFORMATION Item 1. Financial Statements The consolidated financial statements are filed as part of this form 17-Q, pages 7 to 40 and are incorporated herein by reference to said quarterly report. Item 2. Management’s Discussion and Analyses of Results of Operations and Financial Condition
Analysis of Results of Operations First Quarter 2013 vs. First Quarter 2012 Food and beverage company RFM Corporation posted an 18% growth in its net income for the first quarter of the year, reaching P153.7 Million, and ahead of its internal target for the period. This was on the back of around P2.2 billion sales revenue for the first quarter, around 8% lower than last year’s P2.4 billion, primarily due to its disposal of the meat business late last year. The income growth is credited to better margins in its core businesses. Lower commodity input costs such as sugar and wheat, as well as better yields due to scale economies, have contributed to improved margins, especially for Selecta ice cream and Fiesta pasta. The key financial performance indicators for the Company for the three-month period ended March 31, 2013 as compared to the same period in 2012, are as follows:
For the Quarter Ended Key Financial Performance Indicators (Amounts in Millions)* March 31, 2013 March 31, 2012
Net Revenues P=2,220 P=2,393
Net Operating Margin 207 190
Net Income (Loss) 154 130
EBITDA 283 257
Current Ratio 1.33 1.31
* Except current ratio
6. Net Revenues
This is the barometer of the general demand for the Company’s products, reflecting their market acceptability vis-à-vis competition particularly in terms of quality, pricing, and image and perception, as well as availability of the products at the point of purchase market locations. This is of primary importance, and is regularly being monitored for appropriate action and/or improvement.
7. Net Operating Margin This shows the financial profitability of the primary products of the Company, after deducting the expenses related to their manufacture, distribution, and sale, as well as the general administrative costs in running the business.
8. Net Income This shows the over-all financial profitability of the Company, including the sale of primary and non-primary products and all other assets, after deducting all costs and expenses, interest expenses on debts and interest income on investments, as well as equity in net earnings or losses of associates.
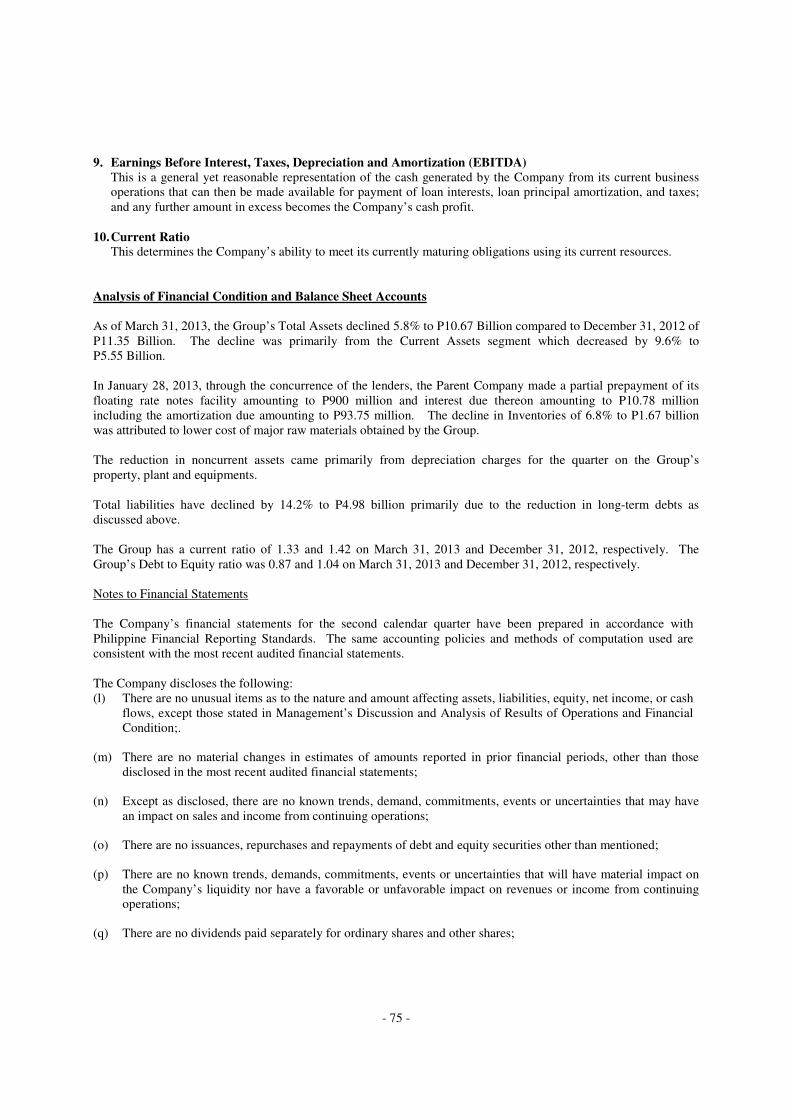
- 75 -
9. Earnings Before Interest, Taxes, Depreciation and Amortization (EBITDA)
This is a general yet reasonable representation of the cash generated by the Company from its current business operations that can then be made available for payment of loan interests, loan principal amortization, and taxes; and any further amount in excess becomes the Company’s cash profit.
10. Current Ratio This determines the Company’s ability to meet its currently maturing obligations using its current resources.
Analysis of Financial Condition and Balance Sheet Accounts As of March 31, 2013, the Group’s Total Assets declined 5.8% to P10.67 Billion compared to December 31, 2012 of P11.35 Billion. The decline was primarily from the Current Assets segment which decreased by 9.6% to P5.55 Billion. In January 28, 2013, through the concurrence of the lenders, the Parent Company made a partial prepayment of its floating rate notes facility amounting to P900 million and interest due thereon amounting to P10.78 million including the amortization due amounting to P93.75 million. The decline in Inventories of 6.8% to P1.67 billion was attributed to lower cost of major raw materials obtained by the Group. The reduction in noncurrent assets came primarily from depreciation charges for the quarter on the Group’s property, plant and equipments. Total liabilities have declined by 14.2% to P4.98 billion primarily due to the reduction in long-term debts as discussed above. The Group has a current ratio of 1.33 and 1.42 on March 31, 2013 and December 31, 2012, respectively. The Group’s Debt to Equity ratio was 0.87 and 1.04 on March 31, 2013 and December 31, 2012, respectively. Notes to Financial Statements The Company’s financial statements for the second calendar quarter have been prepared in accordance with Philippine Financial Reporting Standards. The same accounting policies and methods of computation used are consistent with the most recent audited financial statements. The Company discloses the following: (l) There are no unusual items as to the nature and amount affecting assets, liabilities, equity, net income, or cash
flows, except those stated in Management’s Discussion and Analysis of Results of Operations and Financial Condition;.
(m) There are no material changes in estimates of amounts reported in prior financial periods, other than those disclosed in the most recent audited financial statements;
(n) Except as disclosed, there are no known trends, demand, commitments, events or uncertainties that may have an impact on sales and income from continuing operations;
(o) There are no issuances, repurchases and repayments of debt and equity securities other than mentioned;
(p) There are no known trends, demands, commitments, events or uncertainties that will have material impact on the Company’s liquidity nor have a favorable or unfavorable impact on revenues or income from continuing operations;
(q) There are no dividends paid separately for ordinary shares and other shares;
- 76 -
(r) There are no material events subsequent to the end of the interim period that have not been reflected in the financial statements;
(s) Other than mentioned, there are no material changes in the business composition of the Company during the interim period, including business combinations, acquisition or disposal of subsidiaries and long-term investments, restructuring, and discontinuing operations;
(t) There is no change in contingent liabilities since the most recent audited financial statements;
(u) There were no known events that will trigger direct or contingent financial obligation that is material to the Company, including any default or acceleration of an obligation that remain outstanding as of March 31, 2013;
(v) There were no material off-balance sheet transactions, arrangements, obligations, and other relationship of the Company with unconsolidated entities or other persons created during the reporting period.
PART II – OTHER INFORMATION The Company has no other pertinent information to disclose in this quarterly report.

- 77 -

- 78 -
RFM CORPORATION AND SUBSIDIARIES
CONSOLIDATED BALANCE SHEETS (Amounts in Millions) For the period ended
March 31, 2013 December 31, 2012
ASSETS
Current Assets Cash and cash equivalents P=987 P=1,475
Accounts receivable (Note 5) 2,688 2,677
Inventories (Note 6) 1,668 1,789 Other current assets (Note 7) 203 192
Total Current Assets 5,546 6,133
Noncurrent Assets Property, equipment and investment property (Note 8) 4,271 4,354
Investment (Note 9) 469 469
Other noncurrent Asset (Note 10) 400 394
Total Noncurrent Assets 5,140 5,217
TOTAL ASSETS P=10,686 P=11,350
LIABILITIES AND EQUITY
Current Liabilities Bank loans P=853 P= 889
Accounts payable and accrued liabilities (Note 11) 2,950 2,800 Current portion of:
Long-term obligations 8 7
Long-term debts 280 546
Provisions 85 68
Total Current Liabilities 4,176 4,310
Noncurrent Liabilities Long-term obligations - net of current portion 1 2
Long-term debts - net of current portion 575 1,265 Other noncurrent liabilities (Note 12) 224 221
Total Noncurrent Liabilities 800 1,488
Total Liabilities 4,976 5,798
Equity attributable to equity holders of the Parent Company (Note 13) Capital stock 3,160 3,160 Capital in excess of par value 789 789 Equity reserve (7) (7) Net valuation gains on AFS financial assets (Note 16) 2 2 Revaluation increment on land - net of deferred income tax effect 569 569 Retained earnings 1,196 1,042
Non-controlling interests 1 (3)
Total Equity 5,710 5,552
TOTAL LIABILITIES AND EQUITY P=10,686 P=11,350
See accompanying Notes to Unaudited Consolidated Financial Statements.
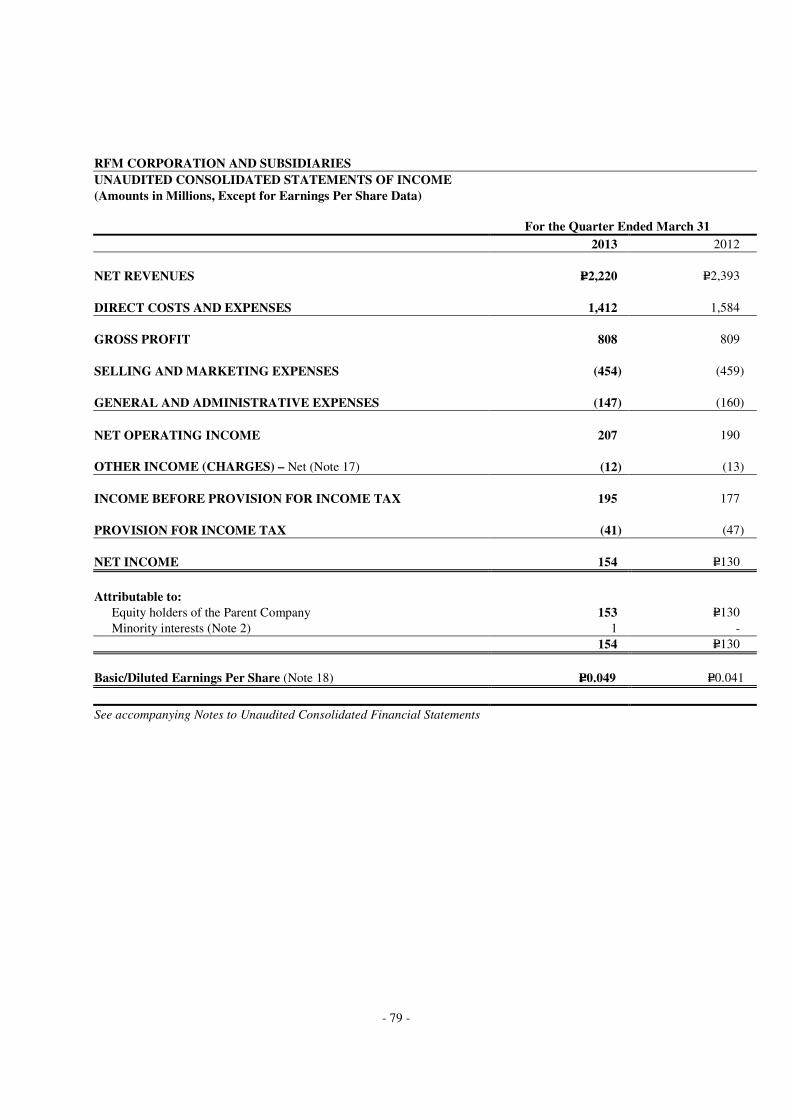
- 79 -
RFM CORPORATION AND SUBSIDIARIES
UNAUDITED CONSOLIDATED STATEMENTS OF INCOME
(Amounts in Millions, Except for Earnings Per Share Data)
For the Quarter Ended March 31
2013 2012
NET REVENUES P=2,220 P=2,393
DIRECT COSTS AND EXPENSES 1,412 1,584
GROSS PROFIT 808 809
SELLING AND MARKETING EXPENSES (454) (459)
GENERAL AND ADMINISTRATIVE EXPENSES (147) (160)
NET OPERATING INCOME 207 190
OTHER INCOME (CHARGES) – Net (Note 17) (12) (13)
INCOME BEFORE PROVISION FOR INCOME TAX 195 177
PROVISION FOR INCOME TAX (41) (47)
NET INCOME 154 P=130
Attributable to:
Equity holders of the Parent Company 153 P=130
Minority interests (Note 2) 1 -
154 P=130
Basic/Diluted Earnings Per Share (Note 18) P=0.049 P=0.041
See accompanying Notes to Unaudited Consolidated Financial Statements

- 80 -
RFM CORPORATION AND SUBSIDIARIES
UNAUDITED CONSOLIDATED STATEMENTS OF COMPREHENSIVE INCOME
(Amounts in Millions)
For the Quarter
Ended March 31
2013 2012
NET INCOME P=154 P=130
OTHER COMPREHENSIVE INCOME – –
Total comprehensive income for the period P=154 P=130
Attributable to:
Equity holders of the Parent Company 153 P=130
Minority interests (Note 2) 1 -
154 P=130
See accompanying Notes to Unaudited Consolidated Financial Statements
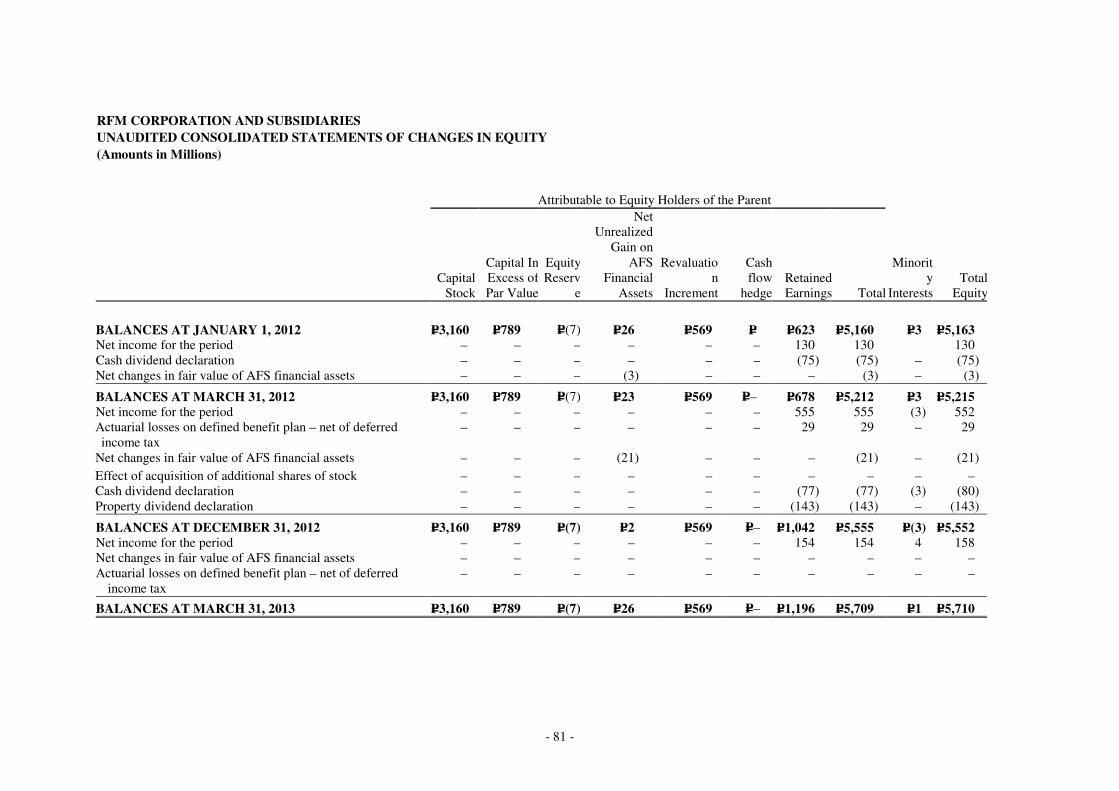
- 81 -
RFM CORPORATION AND SUBSIDIARIES
UNAUDITED CONSOLIDATED STATEMENTS OF CHANGES IN EQUITY
(Amounts in Millions) Attributable to Equity Holders of the Parent
Capital Stock
Capital In Excess of Par Value
EquityReserv
e
Net Unrealized
Gain on AFS
Financial Assets
Revaluation
Increment
Cash flow
hedgeRetained Earnings Total
Minority
InterestsTotal
Equity
BALANCES AT JANUARY 1, 2012 P=3,160 P=789 P=(7) P=26 P=569 P= P=623 P=5,160 P=3 P=5,163 Net income for the period – – – – – – 130 130 130 Cash dividend declaration – – – – – – (75) (75) – (75) Net changes in fair value of AFS financial assets – – – (3) – – – (3) – (3)
BALANCES AT MARCH 31, 2012 P=3,160 P=789 P=(7) P=23 P=569 P=– P=678 P=5,212 P=3 P=5,215 Net income for the period – – – – – – 555 555 (3) 552 Actuarial losses on defined benefit plan – net of deferred income tax
– – – – – – 29 29 – 29
Net changes in fair value of AFS financial assets – – – (21) – – – (21) – (21)
Effect of acquisition of additional shares of stock – – – – – – – – – – Cash dividend declaration – – – – – – (77) (77) (3) (80) Property dividend declaration – – – – – – (143) (143) – (143)
BALANCES AT DECEMBER 31, 2012 P=3,160 P=789 P=(7) P=2 P=569 P=– P=1,042 P=5,555 P=(3) P=5,552 Net income for the period – – – – – – 154 154 4 158 Net changes in fair value of AFS financial assets – – – – – – – – – – Actuarial losses on defined benefit plan – net of deferred
income tax – – – – – – – – – –
BALANCES AT MARCH 31, 2013 P=3,160 P=789 P=(7) P=26 P=569 P=– P=1,196 P=5,709 P=1 P=5,710

- 82 -
RFM CORPORATION AND SUBSIDIARIES CONSOLIDATED STATEMENTS OF CASH FLOWS (Amounts in Millions)
For the Period Ended March 31
2013 2012 CASH FLOWS FROM OPERATING ACTIVITIES Income after income tax P=154 P=130 Adjustments for: Depreciation and amortization 76 67
Operating income (loss) before working capital changes 230 197 Decrease (increase) in: Accounts receivable (46) 23 Inventories 121 (523) Other current assets (11) (310) Increase (decrease) in: Accounts payable and accrued liabilities 151 385 Other current liabilities 17 40
Net Cash generated from (used in) operations 462 (188)
CASH FLOWS FROM INVESTING ACTIVITIES Acquisition of investments and property and equipment 45 2 Decrease (Increase) in other noncurrent assets (6) 14
Net cash used in investing activities 39 16
CASH FLOWS FROM FINANCING ACTIVITIES Availments of Long-term debt and obligations / bank loans 156 500 Repayments of Long-term debt and obligations / bank loans (1,148) (608) Increase (decrease) in minority interests and other noncurrent liabilities 3 2
Net cash from financing activities (989) (106)
NET INCREASE (DECREASE) IN CASH AND CASH EQUIVALENTS (488) (278) CASH AND CASH EQUIVALENTS, JANUARY 1 1,475 813
CASH AND CASH EQUIVALENTS, MARCH 31 P=987 P=535
See accompanying Notes to Consolidated Financial Statements

- 83 -
RFM CORPORATION AND SUBSIDIARIES
NOTES TO CONSOLIDATED FINANCIAL STATEMENTS
38. Corporate Information RFM Corporation (the Parent Company) was incorporated and registered with the Philippine Securities and Exchange Commission (SEC) on August 16, 1957. On July 9, 2007, the SEC approved the extension of the Company’s corporate life from August 22, 2007 to October 13, 2056. The Parent Company is a public company under Section 17.2 of the Securities Regulation Code and its shares are listed in the Philippine Stock Exchange (PSE) starting in 1966. The Parent Company is mainly involved in the manufacturing, processing and selling of wheat, flour and flour products, pasta, meat, milk, juices, margarine, and other food and beverage products. The Parent Company and its subsidiaries are collectively referred to as the Group. The registered office address of the Parent Company is RFM Corporate Center, Pioneer corner Sheridan Streets, Mandaluyong City.
39. Summary of Significant Accounting and Financial Reporting Practices Basis of Preparation The consolidated financial statements of the Group have been prepared using the historical cost basis, except for the Group’s land, which are stated at appraised values, and available-for-sale (AFS) financial assets and derivative liability that are measured at fair value. The consolidated financial statements are presented in Philippine peso (Peso), which is the Parent Company’s functional currency. All values are rounded off to the nearest million pesos (P=000,000), except for the number of shares or when otherwise indicated. Statement of Compliance The consolidated financial statements of the Group have been prepared in compliance with Philippine Financial Reporting Standards (PFRS). Changes in Accounting Policies and Disclosures
The accounting policies adopted are consistent with those of the previous financial year, except for the following amended PFRS and Philippine Accounting Standards (PAS) which were adopted as of January 1, 2013. Except as otherwise indicated, the adoption of these changes in PFRS did not have any significant impact on the Group’s financial statements:
• PFRS 7, Financial Instruments: Disclosures - Offsetting Financial Assets and Financial Liabilities, requires an entity to disclose information about rights of set-off and related arrangements (such as collateral agreements). The new disclosures are required for all recognized financial instruments that are set off in accordance with PAS 32. These disclosures also apply to recognized financial instruments that are subject to an enforceable master netting arrangement or “similar agreement”, irrespective of whether they are set-off in accordance with PAS 32. The amendments require entities to disclose, in a tabular format unless another format is more appropriate, the following minimum quantitative information. This is presented separately for financial assets and financial liabilities recognized at the end of the reporting period:
f. The gross amounts of those recognized financial assets and recognized financial liabilities; g. The amounts that are set off in accordance with the criteria in PAS 32 when determining the net
amounts presented in the balance sheet; h. The net amounts presented in the balance sheet; i. The amounts subject to an enforceable master netting arrangement or similar agreement that are not
otherwise included in (b) above, including: i. Amounts related to recognized financial instruments that do not meet some or all of the offsetting
criteria in PAS 32; and, ii. Amounts related to financial collateral (including cash collateral); and,
j. The net amount after deducting the amounts in (d) from the amounts in (c) above.
- 84 -
The amendments to PFRS 7 are to be retrospectively applied for annual periods beginning on or after January 1, 2013. The amendments affect disclosures only and have no impact on the Group’s financial position or performance.
• PFRS 10, Consolidated Financial Statements, replaces the portion of PAS 27, Consolidated and Separate
Financial Statements, that addresses the accounting for consolidated financial statements. It also includes the issues raised in Standards Interpretations Committee (SIC) 12, Consolidation - Special Purpose Entities. PFRS 10 establishes a single control model that applies to all entities including special purpose entities. The changes introduced by PFRS 10 will require management to exercise significant judgment to determine which entities are controlled, and therefore, are required to be consolidated by a parent, compared with the requirements that were in PAS 27.
A reassessment of control was performed by the Parent Company on all its subsidiaries in accordance with the provisions of PFRS 10. Following the reassessment, the Parent Company determined that it has control on all of its subsidiaries currently being consolidated to its consolidated financial statements. Such, the Parent Company will continue to include those subsidiaries in its consolidated financial statements.
• PFRS 11, Joint Arrangements, replaces PAS 31, Interests in Joint Ventures, and SIC 13, Jointly Controlled
Entities - Non-Monetary Contributions by Venturers. PFRS 11 removes the option to account for jointly controlled entities using proportionate consolidation. Instead, jointly controlled entities that meet the definition of a joint venture must be accounted for using the equity method.
The Parent Company has an existing joint venture arrangement with a domestic entity that falls within the scope of this standard. Currently, proportionate consolidation is applied for this joint venture.
On November 22, 2012, the Parent Company was granted by the Philippine SEC an exemptive relief on the adoption of this standard given the peculiarities of its arrangement with the other joint venturer. Such, the Parent Company will continue to consolidate proportionately the said joint venture in 2013 when this PFRS becomes effective.
• PFRS 12, Disclosure of Interests in Other Entities, includes all of the disclosures related to consolidated financial statements that were previously in PAS 27, as well as all the disclosures that were previously included in PAS 31 and PAS 28, Investments in Associates. These disclosures relate to an entity’s interests in subsidiaries, joint arrangements, associates and structured entities. A number of new disclosures are also required. The adoption of PFRS 12 will affect disclosures only and have no impact on the Group’s financial position or performance.
• PFRS 13, Fair Value Measurement, establishes a single source of guidance under PFRS for all fair value measurements. PFRS 13 does not change when an entity is required to use fair value, but rather provides guidance on how to measure fair value under PFRS when fair value is required or permitted. This standard should be applied prospectively as of the beginning of the annual period in which it is initially applied. Its disclosure requirements need not be applied in comparative information provided for periods before initial application of PFRS 13. The Group does not anticipate that the adoption of this standard will have a significant impact on its financial position and performance.
• PAS 1, Presentation of Financial Statements - Presentation of Items of Other Comprehensive Income or
OCI (Amendments), changes the grouping of items presented in OCI. Items that can be reclassified (or “recycled”) to profit or loss at a future point in time (for example, upon derecognition or settlement) will be presented separately from items that will never be recycled. The amendments will be applied retrospectively and will result to the modification of the presentation of items of OCI.
• PAS 19, Employee Benefits (Revised), ranges from fundamental changes such as removing the corridor mechanism and the concept of expected returns on plan assets to simple clarifications and rewording. The revised standard also requires new disclosures such as, among others, a sensitivity analysis for each significant actuarial assumption, information on asset-liability matching strategies, duration of the defined benefit obligation, and disaggregation of plan assets by nature and risk. Once effective, the Group has to apply the amendments retroactively to the earliest period presented.

- 85 -
The Parent Company reviewed its existing employee benefits and determined that the amended standard has significant impact on its accounting for retirement benefits. The Parent Company obtained the services of an external actuary to compute the impact to the financial statements upon adoption of the standard. The effects are detailed below:
Increase (decrease) in: Statement of Comprehensive Income 2012 2011
Net pension benefit cost P=9,645 P=4,541 Net income for the year (9,645) (4,541)Other comprehensive income 9,645 4,541
• PAS 27, Separate Financial Statements (as revised in 2011), limits its contents to accounting for subsidiaries, jointly controlled entities, and associates in separate financial statements as a consequence of the new PFRS 10 and PFRS 12. This amendment has no impact on the Group’s financial position or performance.
• PAS 28, Investments in Associates and Joint Ventures (as revised in 2011), renames PAS 28 as PAS 28, Investments in Associates and Joint Ventures, as a consequence of the new PFRS 11 and PFRS 12. It describes the application of the equity method to investments in joint ventures in addition to associates. The Group is already applying the equity method in accounting its investment in an associate.
• Philippine Interpretation IFRIC 20, Stripping Costs in the Production Phase of a Surface Mine, applies to waste removal (stripping) costs incurred in surface mining activity, during the production phase of the mine. The interpretation addresses the accounting for the benefit from the stripping activity. This new interpretation is not relevant to the Group.
The following standard is not applicable for adoption by the Group:
• PFRS 1, First-time Adoption of Philippine Financial Reporting Standards – Government Loans
(Amendments), allows first-time adopters to apply the amendments prospectively relating to the treatment of government loans as defined in PAS 20, Accounting for Government Grants and Disclosure of Government
Assistance. The Group has no existing government loans or grants.
Summary of Significant Accounting Policies Basis of Consolidation The consolidated financial statements comprise the financial statements of the Group prepared for the same reporting year as the Parent Company, using consistent accounting policies.
The consolidated subsidiaries, which are all incorporated in the Philippines and the effective percentages of ownership is as follows:
Percentage of Ownership
March 31, 2013 December 31, 2012
Cabuyao Meat Processing Corporation (CMPC) 100.00 100.00 Interbake Commissary Corporation (ICC) 100.00 100.00 RFM Equities, Inc. (REI) 100.00 100.00 RFM Insurance Brokers, Inc. (RIBI) 100.00 100.00 Conglomerate Securities and Financing Corporation (CSFC) 88.68 88.68 RFM Foods Philippines Corporation* 100.00 100.00 Southstar Bottled Water Company, Inc. (Southstar)* 100.00 100.00 Swift Tuna Corporation* 100.00 100.00 Invest Asia Corporation (Invest Asia) 96.00 96.00 Rizal Lighterage Corporation (RLC) 93.60 93.51 FWBC Holdings, Inc. 83.38 83.38 Filipinas Water Bottling Company, Inc. (FWBC) 58.37 58.37 RFM Canning and Marketing, Inc. (RFM Canning)* 70.00 70.00 WS Holdings, Inc. (WHI) 60.00 60.00
* Dormant

- 86 -
In 2012, the Parent Company acquired additional shares in RLC, a subsidiary, at a total cash consideration of P=0.08 million and accordingly executed corresponding deeds of absolute sale of shares of stock with the former shareholders. In 2011, the Parent Company acquired additional 10.53% ownership interest in RLC, a subsidiary, at a total cost of P=8.66 million, and accordingly executed corresponding deeds of absolute sale of shares of stock with the former shareholders. Subsidiaries
Subsidiaries are entities over which the Parent Company has the power to govern the financial and operating policies of the entities, or generally have an interest of more than one half of the voting rights of the entities. The existence and effect of potential voting rights that are currently exercisable or convertible are considered when assessing whether the Parent Company controls another entity. Subsidiaries are fully consolidated from the date of acquisition, being the date on which the Parent Company or the Group obtains control, directly or through the holding companies, and continue to be consolidated until the date that such control ceases. Control is achieved where the Parent Company has the power to govern the financial and operating policies of an entity so as to obtain benefits from its activities. They are deconsolidated from the date on which control ceases. All intra-group balances, transactions, income and expenses, and profits and losses resulting from intra-group transactions are eliminated in full. However, intra-group losses are also eliminated but are considered an impairment indicator of the assets transferred. A change in the ownership interest in a subsidiary, without a loss of control, is accounted for as an equity transaction. If the Group loses control over a subsidiary, it derecognizes the carrying amounts of the assets (including goodwill) and liabilities of the subsidiary, carrying amount of any non-controlling interest (including any attributable components of other comprehensive income recorded in equity), and recognizes the fair value of the consideration received, fair value of any investment retained, and any surplus or deficit recognized in the consolidated statement of income. The Group also reclassifies the Parent Company’s share of components previously recognized in other comprehensive income to profit or loss or retained earnings, as appropriate. Non-controlling Interest
Non-controlling interest represents the portion of profit or loss and the net assets not held by the Group. Profit or loss and each component of other comprehensive income (loss) are attributed to the equity holders of the Parent Company and to the non-controlling interest. Total comprehensive income (loss) is attributed to the equity holders of the Parent Company and to the non-controlling interest even if this results in the non-controlling interest having a deficit balance. Transactions with non-controlling interest are accounted for as an equity transaction. Business Combination and Goodwill Business combinations are accounted for using the acquisition method. The cost of an acquisition is measured as the aggregate of the consideration transferred, measured at acquisition date fair value and the amount of any non-controlling interest in the acquiree. For each business combination, the acquirer measures the non-controlling interest in the acquiree either at fair value or at the proportionate share of the acquiree’s identifiable net assets. Acquisition-related costs incurred are expensed and included in general and administrative expenses. When the Group acquires a business, it assesses the financial assets and financial liabilities assumed for appropriate classification and designation in accordance with the contractual terms, economic circumstances and pertinent conditions as at the acquisition date. This includes the separation of embedded derivatives in host contracts by the acquiree. If the business combination is achieved in stages, the acquisition date fair value of the acquirer’s previously held equity interest in the acquiree is remeasured to fair value at the acquisition date and any gain or loss on remeasurement is recognized in the consolidated statement of income. Any contingent consideration to be transferred by the acquirer will be recognized at fair value at the acquisition date. Subsequent changes to the fair value of the contingent consideration which is deemed to be an asset or liability, will be recognized in accordance with PAS 39 either in the consolidated statement of income or as a

- 87 -
change to other comprehensive income. If the contingent consideration is classified as equity, it should not be remeasured until it is finally settled within equity. Goodwill is initially measured at cost being the excess of the aggregate of the consideration transferred and the amount recognized for non-controlling interest over the net identifiable assets acquired and liabilities assumed. If this consideration is lower than the fair value of the net assets of the subsidiary acquired, the difference is recognized in the consolidated statement of income. After initial recognition, goodwill is measured at cost less any accumulated impairment losses. For the purpose of impairment testing, goodwill acquired in a business combination is, from the acquisition date, allocated to each of the Group’s cash-generating units (CGU) that are expected to benefit from the combination, irrespective of whether other assets or liabilities of the acquiree are assigned to those units. Where goodwill forms part of a CGU and part of the operation within that unit is disposed of, the goodwill associated with the operation disposed of is included in the carrying amount of the operation when determining the gain or loss on disposal of the operation. Goodwill disposed of in this circumstance is measured based on the relative values of the operation disposed of and the portion of the CGU retained. Goodwill is reviewed for impairment, annually or more frequently if events or changes in circumstances indicate that the carrying value may be impaired. Impairment is determined for goodwill by assessing the recoverable amount of the CGU or group of CGUs to which the goodwill relates. Where the recoverable amount of the CGU or group of CGUs is less than the carrying amount of the CGU or group of CGUs to which goodwill has been allocated, an impairment loss is recognized. Impairment losses relating to goodwill cannot be reversed in future periods. The Group performs its impairment test of goodwill annually every December 31. Cash and Cash Equivalents Cash includes cash on hand and in banks. Cash equivalents are short-term, highly liquid investments that are readily convertible to known amounts of cash with original maturities of up to three months or less from dates of acquisition and that are subject to an insignificant risk of change in value. Financial Instruments Date of recognition
The Group recognizes a financial asset or a financial liability in the consolidated balance sheet when it becomes a party to the contractual provisions of the instrument. Purchases and sales of financial assets that require delivery of assets within the time frame by regulation or convention in the marketplace are recognized on the settlement date.
Initial recognition and classification of financial instruments
All financial assets and financial liabilities are recognized initially at fair value. Except for securities at fair value through profit and loss (FVPL), the initial measurement of financial assets includes any transactions costs. The Group’s financial assets are further classified into the following categories: financial assets at FVPL (as derivatives designated as hedging instruments in an effective hedge, as appropriate), loans and receivables, held-to-maturity (HTM) investments and AFS financial assets. The Group also classifies its financial liabilities as financial liabilities at FVPL (as derivatives designated as hedging instruments in an effective hedge, as appropriate) and other financial liabilities. The classification depends on the purpose for which the investments were acquired or whether they are quoted in an active market. The Group determines the classification of its financial instruments at initial recognition and, where allowed and appropriate, re-evaluates such designation at each balance sheet date. Financial instruments are classified as liability or equity in accordance with the substance of the contractual arrangement. Interest, dividends, gains and losses relating to a financial instrument or a component that is a financial liability, are reported as expense or income. Distributions to holders of financial instruments classified as equity are charged directly to equity, net of any related income tax benefits. As of March 31, 2013 and December 31, 2012, the Group has no financial assets at FVPL and HTM investments. Financial liabilities at FVPL of the Group have no derivative liability as of March 31, 2012 and as of December 31, 2012.
- 88 -
Determination of fair value
The fair value of financial instruments traded in active markets at the balance sheet date is based on the quoted
market price or dealer price quotations (bid price for long positions and ask price for short positions), without
any deduction for transaction costs. When current bid and asking prices are not available, the price of the most
recent transaction provides evidence of current fair value as long as there has not been a significant change in
economic circumstances since the time of transaction. For all other financial instruments not listed in an active market, the fair value is determined by using appropriate valuation methodologies. Valuation methodologies include net present value techniques, comparison to similar instruments for which market observable prices exist, options pricing models and other relevant valuation models.
Fair value measurements are disclosed by source of inputs using a three-level hierarchy for each class of financial instrument. Fair value measurement under Level 1 is based on quoted prices in active markets for identical financial assets or financial liabilities; Level 2 is based on inputs other than quoted prices included within Level 1 that are observable for the financial asset or financial liability, either directly or indirectly; and Level 3 is based on inputs for the financial asset or financial liability that are not based on observable market data.
Day 1 difference
Where the transaction price in a non-active market is different from the fair value from other observable current market transactions in the same instrument or based on a valuation technique whose variables include only data from observable market, the Group recognizes the difference between the transaction price and fair value (a Day 1 difference) in the consolidated statement of income unless it qualifies for the recognition as some other type of asset. In cases where use is made of data which is not observable, the difference between the transaction price and model value is only recognized in the consolidated statement of income when the inputs become observable or when the instrument is derecognized. For each transaction, the Group determines the appropriate method of recognizing the Day 1 difference amount.
Loans and receivables
Loans and receivables are nonderivative financial assets with fixed or determinable payments that are not quoted in an active market. They arise when the Group provides money, goods or services directly to a debtor with no intention of trading the receivables. After initial measurement, loans and receivables are subsequently carried at cost or amortized cost using the effective interest method less any allowance for impairment. Gains and losses are recognized in the consolidated statement of income when the loans and receivables are derecognized or impaired, as well as through the amortization process. Loans and receivables are classified as current assets if maturity is within 12 months from the balance sheet date or the normal operating cycle, whichever is longer. Otherwise, these are classified as noncurrent assets. As of March 31, 2013 and December 31, 2012, the Group’s loans and receivables include cash in banks and cash equivalents, accounts receivable, advances to related parties and other current assets. AFS financial assets
AFS financial assets are non-derivative financial assets that are designated as AFS or are not classified in any of the three other categories. The Group designates financial instruments as AFS financial assets if they are purchased and held indefinitely and may be sold in response to liquidity requirements or changes in market conditions. After initial recognition, AFS financial assets are measured at fair value with unrealized gains or losses being recognized in the consolidated statement of comprehensive income as “Net changes in fair value of AFS financial assets”. When the financial asset is disposed of, the cumulative gain or loss previously recorded in the consolidated statement of comprehensive income is recognized in the consolidated statement of income. Interest earned on the investments is reported as interest income using the effective interest method. Dividends earned on financial assets are recognized in the consolidated statement of income as “Dividend income” when the right of payment has been established. The Group considers several factors in making a decision on the eventual disposal of the investments. The major factor of this decision is whether or not the Group will experience inevitable further losses on investments. These financial assets are classified as noncurrent unless there is intention to dispose of such assets within 12 months of the balance sheet date.
AFS financial assets in unquoted equity securities are carried at historical cost, net of impairment.

- 89 -
As of March 31, 2013 and December 31, 2012, the Group’s AFS financial assets include investments in unquoted redeemable preferred and common shares, and quoted common and golf club shares.
Other financial liabilities
This category pertains to financial liabilities that are not held for trading or not designated as at FVPL upon the inception of the liability. These include liabilities arising from operations or borrowings (e.g., payables, accruals).
The financial liabilities are initially recognized at fair value and are subsequently carried at amortized cost, taking into account the impact of applying the effective interest method of amortization (or accretion) for any related premium, discount and any directly attributable transaction costs. Financial liabilities are classified as current, except for maturities greater than twelve months after the balance sheet date. These are classified as noncurrent liabilities. As of March 31, 2013 and December 31, 2012, the Group’s other financial liabilities include bank loans, accounts payable and accrued liabilities, customers’ deposits, long-term debts and obligations, including current maturities, and advances from related parties. Derivatives Derivative financial instruments (swaps and option contracts to economically hedge exposure to fluctuations in interest rates) are initially recognized at fair value on the date on which a derivative contract is entered into and are subsequently remeasured at fair value. Derivatives are carried as assets when the fair value is positive and as liabilities when the fair value is negative.
Derivatives are accounted for as at FVPL, where any gains or losses arising from changes in fair value on derivatives are taken directly to consolidated statement of income for the year, unless the transaction is a designated and effective hedging instrument.
Impairment of Financial Assets The Group assesses at each balance sheet date whether a financial asset or group of financial assets is impaired.
Loans and receivables
The Group first assesses whether objective evidence of impairment exists individually for financial assets that are individually significant or collectively for financial assets that are not individually significant. Objective evidence includes observable data that comes to the attention of the Group about loss events such as but not limited to significant financial difficulty of the counterparty, a breach of contract, such as a default or delinquency in interest or principal payments, probability that the borrower will enter bankruptcy or other financial reorganization. If there is objective evidence that an impairment loss on loans and receivables carried at amortized cost has been incurred, the amount of loss is measured as a difference between the asset’s carrying amount and the present value of estimated future cash flows (excluding future credit losses that have not been incurred) discounted at the financial asset’s original effective interest rate (i.e., the effective interest rate computed at initial recognition). The carrying amount of the asset shall be reduced through the use of an allowance account. The amount of impairment loss is recognized in the consolidated statement of income. Interest income continues to be accrued on the reduced carrying amount based on the original effective interest rate of the asset. If it is determined that no objective evidence of impairment exists for an individually assessed financial asset, whether significant or not, the asset is included in the group of financial assets with similar credit risk and characteristics and that group of financial assets is collectively assessed for impairment. Assets that are individually assessed for impairment and for which an impairment loss is or continues to be recognized are not included in a collective assessment of impairment. Loans and receivables, together with the related allowance, are written off when there is no realistic prospect of future recovery and all collateral has been realized. If, in subsequent period, the amount of the impairment loss decreases and the decrease can be related objectively to an event occurring after the impairment was recognized, the previously recognized impairment loss is reversed. Any subsequent reversal of an impairment loss is recognized in the consolidated statement of income, to the extent that the carrying value of the asset does not exceed its amortized cost at the reversal date.
- 90 -
In relation to receivables, a provision for impairment is made when there is objective evidence (such as the probability of insolvency or significant financial difficulties of the debtor) that the Group will not be able to collect all of the amounts due under the original terms of the invoice. The carrying amount of the receivable is reduced either directly or through the use of an allowance account. Impaired financial assets carried at amortized cost are derecognized when they are assessed as uncollectible either at a direct reduction of the carrying amount or through use of an allowance account when impairment has been previously recognized in the said amount.
AFS financial assets
For AFS financial assets, the Group assesses at each balance sheet date whether there is objective evidence that a financial asset or group of financial assets is impaired. In case of equity investments classified as AFS financial assets, this would include a significant or prolonged decline in the fair value of the investments below its cost. The determination of what is “significant” or “prolonged” requires judgment. The Group treats “significant” generally as 30% or more and “prolonged” as greater than 12 months for quoted equity securities. Where there is evidence of impairment, the cumulative loss measured as the difference between the acquisition cost and the current fair value, less any impairment loss on that financial asset previously recognized in consolidated statement of income is removed from the consolidated statement of comprehensive income and recognized in consolidated statement of income. Impairment losses on equity investments are recognized in consolidated statement of income. Increases in fair value after impairment are recognized directly in the consolidated statement of comprehensive income. In the case of debt instruments classified as AFS financial assets, impairment is assessed based on the same criteria as financial assets carried at amortized cost. Future interest income is based on the reduced carrying amount and is accrued based on the rate of interest used to discount future cash flows for the purpose of measuring impairment loss. Such accrual is recorded as part of “Interest income” account in the consolidated statement of income. If, in a subsequent year, the fair value of a debt instrument increases and that increase can be objectively related to an event occurring after the impairment loss was recognized in consolidated statement of income, the impairment loss is reversed through the consolidated statement of income.
Derecognition of Financial Assets and Financial Liabilities Financial asset
A financial asset (or, where applicable, a part of a financial asset or part of a group of similar financial assets) is derecognized where:
• the right to receive cash flows from the asset has expired; the Group retains the right to receive cash flows from the asset, but has assumed an obligation to pay them in full without material delay to a third party under a “pass-through” arrangement; or
• the Group has transferred its right to receive cash flows from the asset and either (a) has transferred substantially all the risks and rewards of the asset, or (b) has neither transferred nor retained substantially all the risks and rewards of the asset, but has transferred control of the asset.
Where the Group has transferred its right to receive cash flows from an asset or has entered into a “pass-through” arrangement, and has neither transferred nor retained substantially all the risks and rewards of the asset nor transferred control of the asset, the asset is recognized to the extent of the Group’s continuing involvement in the asset. Continuing involvement that takes the form of a guarantee over the transferred asset is measured at the lower of the original carrying amount of the asset and the maximum amount of consideration that the Group could be required to repay.
Financial liability
A financial liability is derecognized when the obligation under the liability is discharged, cancelled or has expired. Where an existing financial liability is replaced by another from the same lender on substantially different terms, or the terms of an existing liability are substantially modified, such an exchange or modification is treated as a derecognition of the original liability and the recognition of a new liability, and the difference in the respective carrying amounts is recognized in the consolidated statement of income. Offsetting Financial Instruments Financial assets and financial liabilities are offset and the net amount reported in the consolidated balance sheet if, and only if, there is a currently enforceable legal right to offset the recognized amounts and there is an intention to settle on a net basis, or to realize the asset and settle the liability simultaneously. This is not
- 91 -
generally the case with master netting agreements, and the related assets and liabilities are presented gross in the consolidated balance sheet.
Inventories Inventories are valued at the lower of cost and net realizable value (NRV). Costs incurred in bringing the product to its present location and condition are accounted for as follows:
Finished goods and goods in process - direct materials, direct labor, and a proportion of manufacturing overhead costs, determined using the weighted average method
Raw materials, spare parts and supplies - purchase cost using the weighted average method NRV is the selling price in the ordinary course of business, less the estimated costs of completion and the estimated costs necessary to make the sale.
For goods in process, cost includes the applicable allocation of fixed and variable overhead costs. For raw materials, NRV is the current replacement cost. In case of spare parts and supplies, NRV is the estimated realizable value of the inventories when disposed of at their condition at the balance sheet date. An allowance for inventory obsolescence is provided for slow-moving, obsolete, defective and damaged inventories based on physical inspection and management evaluation.
Investment Properties Investment properties consist of land and building and improvement that are not occupied substantially for use by, or in the operations of the Company, nor for sale in the ordinary course of business, but are held primarily to earn rental income and for capital appreciation. Investment properties are measured initially at cost, including transaction costs. The carrying amount includes the cost of replacing part of an existing investment property at the time that cost is incurred if the recognition criteria are met; and excludes the costs of day to day servicing of an investment property. Subsequent to initial recognition, investment properties, except for land, are carried at cost less accumulated depreciation and any impairment losses. Depreciation of investment properties is computed using the straight-line method over the useful lives of the assets, Depreciation ceases at the earlier of the date the item is classified as held for sale (or included in a disposal group that is classified as held for sale) in accordance with PFRS 5, Noncurrent Assets Held for Sale and Discontinued
Operations, and the date the investment property is derecognized. The estimated useful lives and depreciation method are reviewed periodically to ensure that the periods and method of depreciation are consistent with the expected pattern of economic benefits from items of investment properties. Investment properties are derecognized from the accounts when they have been either disposed of or when the investment properties are permanently withdrawn from use and no future economic benefits are expected from its disposal. Any gains or losses on the retirement or disposal of investment properties are recognized in profit or loss in the year of retirement or disposal. Transfers are made to or from investment property only when there is a change in use. For a transfer from investment property to owner occupied property, the deemed cost for subsequent accounting is the fair value at the date of change in use. If owner occupied property becomes an investment property, the Group accounts for such property in accordance with the policy stated under property and equipment up to the date of change in use. Property, Plant and Equipment Property, plant and equipment, except land, are stated at cost less accumulated depreciation and amortization, and any impairment in value.
- 92 -
Land is stated at appraised value based on a valuation performed by an independent firm of appraisers. The increase in the valuation of land is credited to “Revaluation increment on land” account, net of deferred income tax effect, and presented under the equity section of the consolidated balance sheet.
Revaluation of land is made so that the carrying amount does not differ materially from that which would be determined using the fair value at the balance sheet date. For subsequent revaluations, any resulting increase in the assets’ carrying amount as a result of the revaluation is credited to “Revaluation increment on land” account, net of deferred income tax effect, in the consolidated statement of comprehensive income. Any resulting decrease is directly charged against any related revaluation increment to the extent that the decrease does not exceed the amount of the revaluation increment in respect of the same assets. The initial cost of items of property, plant and equipment consists of its purchase price, including import duties and any directly attributable costs of bringing the asset to its working condition and location for its intended use. Expenditures incurred after the fixed assets have been put into operation, such as repairs and maintenance and overhaul costs, are normally charged to the consolidated statement of income in the period the costs are incurred. In situations where it can be clearly demonstrated that the expenditures have resulted in an increase in the future economic benefits expected to be obtained from the use of an item of property, plant and equipment beyond its originally assessed standard of performance, the expenditures are capitalized as an additional cost of the item of property, plant and equipment.
Depreciation or amortization are computed on a straight-line basis over the estimated useful lives of the assets as follows:
Number of Years
Land improvements 5 to 20 Silos, buildings and improvements 5 to 30 Machinery and equipment 5 to 25 Office furniture and fixtures 2 to 10 Transportation and delivery equipment 5
Leasehold improvements are amortized over the life of the assets or the lease term, whichever is shorter. Construction in progress are properties in the course of construction for production, rental or administrative purposes, or for purposes not yet determined, which are carried at cost less any recognized impairment loss. These assets are not depreciated until such time that the relevant assets are completed and available for use. Depreciation or amortization of an item of property, plant and equipment begins when it becomes available for use, i.e., when it is in the location and condition necessary for it to be capable of operating in the manner intended by management. Depreciation or amortization ceases at the earlier of the date that the item is classified as held for sale (or included in a disposal group that is classified as held for sale) in accordance with PFRS 5, Noncurrent Assets Held for Sale and Discontinued Operations, and the date the asset is derecognized.
The estimated useful lives and depreciation and amortization method are reviewed periodically to ensure that the
periods and method of depreciation and amortization are consistent with the expected pattern of economic benefits from items of property, plant and equipment.
Fully depreciated assets are retained in the accounts until they are no longer in use and no further depreciation is recognized in the consolidated statement of income. When assets are retired or otherwise disposed of, the cost and the related accumulated depreciation and amortization and any impairment in value are removed from the accounts and any resulting gain or loss is recognized in the consolidated statement of income.
Borrowing Costs Borrowing costs are capitalized if they are directly attributable to the acquisition, construction or production of a qualifying asset. Capitalization of borrowing costs commences when the activities to prepare the asset are in progress and expenditures and borrowing costs are being incurred. Borrowing costs are capitalized until the assets are substantially ready for their intended use. If the resulting carrying amount of the asset exceeds its recoverable amount, an impairment loss is recorded. Borrowing costs include interest charges and other costs incurred in connection with the borrowing of funds. Other borrowing costs are recognized as expense in the period in which they are incurred.
- 93 -
Investments in Associates Investments in associates are accounted for under the equity method of accounting. An associate is an entity in which the Group has significant influence and which is neither a subsidiary nor a joint venture of the Group. As of March 31. 2013 and December 31, 2012, the Group has a 35% interest in Selecta Walls Land Corporation (SWLC) accounted for under the equity method.
Under the equity method, such investments in associates are carried in the consolidated balance sheet at cost plus post-acquisition changes in the Group’s share in the net assets of the associates. Goodwill relating to an associate is included in the carrying amount of the investment and is not amortized. The consolidated statement of income reflects the Group’s share of the results of operations of the associates. Where there has been a change recognized directly in the equity of the associate, the Group recognizes its share of any changes, and discloses this when applicable, in the details of the changes in equity. After application of the equity method, the Group determines whether it is necessary to recognize any additional impairment loss with respect to the Group’s investment in the associates. Unrealized gains and losses resulting from transactions between the Group and the associate are eliminated to the extent of the interest in the associate.
Interest in Joint Ventures The interest in 50%-owned joint venture, Unilever RFM Ice Cream, Inc. (URICI), is accounted for using the proportionate consolidation method, which involves consolidating a proportionate share of the joint ventures’ assets, liabilities, income and expenses with similar items in the consolidated financial statements on a line-by-line basis. The financial statements of the joint venture are prepared for the same reporting period as the Parent Company. Adjustments are made in the Group’s consolidated financial statements to eliminate the Group’s share of intragroup balances, income and expenses and unrealized gains and losses on transactions between the Group and its jointly controlled entity to the extent of its share in interest in joint venture. Losses on transactions are recognized immediately if the loss provides evidence of a reduction in the net realizable value of the current assets or an impairment loss. The joint venture is proportionately consolidated until the date on which the Group ceases to have joint control over the joint venture. Impairment of Noncurrent Non-financial Assets The carrying values of property, plant and equipment, and investments in joint ventures and associates are reviewed for impairment when events or changes in circumstances indicate that the carrying values may not be recoverable. If any such indication exists and where the carrying value exceeds the estimated recoverable amount, the asset or cash-generating units (CGU) is written down to their recoverable amount. The recoverable amount of the noncurrent non-financial asset is the greater of fair value less cost to sell and value-in-use. The fair value less cost to sell is the amount obtainable from the sale of an asset in an arm’s length transaction. In assessing value-in-use, the estimated future cash flows are discounted to their present value using a pre-tax discount rate that reflects current market assessments of the time value of money and the risks specific to the asset. For an asset that does not generate largely independent cash inflows, the recoverable amount is determined for the CGU to which the asset belongs. Impairment losses, if any, are recognized in the consolidated statement of income in those expense categories consistent with the function of the impaired asset.
Previously recognized impairment loss is reversed only if there has been a change in the assumptions used to determine the recoverable amount of an asset, but not, however, to an amount higher than the carrying amount that would have been determined (net of any depreciation and amortization) had there been no impairment loss recognized for the asset in prior years. A reversal of an impairment loss is recognized in the consolidated statement of income.
Capital Stock
Capital stock is stated at par value for all shares issued and outstanding. When the Parent Company issues more
than one class of stock, a separate account is maintained for each class of stock and the number of shares issued.
When the shares are sold at a premium, the difference between the proceeds and the par value is credited to the
“Capital in excess of par value” account. When shares are issued for a consideration other than cash, the proceeds
are measured by the fair value of the consideration received. In case shares are issued to extinguish or to settle
the liability of the Parent Company, the share shall be measured at either the fair value of the shares issued or fair
value of the liability settled, whichever is more reliably determinable.

- 94 -
Direct costs incurred related to equity issuance, such as underwriting, accounting and legal fees, printing costs
and taxes are charged to the “Capital in excess of par value” account.
Equity Reserve
Equity reserve is the difference between the acquisition cost of an entity under common control and the Parent
Company’s proportionate share in the net assets of the entity acquired as a result of a business combination
accounted for using the pooling-of-interests method. Equity reserve is derecognized when the subsidiary is
deconsolidated, which is the date on which control ceases.
Share-based Compensation Plan URICI, through Unilever Philippines, Inc., operates equity-settled, share-based compensation plans. The fair value of the employee services received in exchange for the grant of the options is recognized as an expense. The total amount to be expensed over the vesting period is determined by reference to the fair value of the options granted and including any market performance conditions, excluding the impact of any service and non-market performance vesting conditions (e.g. profitability, sales growth targets, employee of the entity remaining over a specified time period, etc.) and impact of any non-vesting conditions (e.g. the requirement for employees to serve). Non-market vesting conditions are included in assumptions about the number of options that are expected to become exercisable. At each balance sheet date, the entity revises its estimates of the number of options that are expected to become exercisable. It recognizes the impact of the revision of original estimates, if any, in the consolidated statement of income, with a corresponding adjustment to equity.
When the options are exercised, URICI issues new shares. The proceeds received, net of any directly attributable transaction costs, are credited to share capital (nominal value) and share premium when the options are exercised. The grant of options over its equity instruments to the employees of URICI is treated as a capital contribution.
Retained Earnings Retained earnings represent the cumulative balance of periodic net income or loss, dividend contributions, prior period adjustments, effect of changes in accounting policy and other capital adjustments. When the retained earnings account has a debit balance, it is called “deficit.” A deficit is not an asset but a deduction from equity.
Unappropriated retained earnings represent that portion which is free and can be declared as dividends to stockholders. Appropriated retained earnings represent that portion which has been restricted and, therefore, not available for dividend declaration. Dividends on Common Shares Cash and property dividends on common shares are recognized as liability and deducted from equity when approved by the BOD of the Company. Stock dividends are treated as transfers from retained earnings to common shares. Dividends for the year that are approved after the balance sheet date are dealt with as an event after the balance sheet date. Revenue Recognition Revenue from sale of goods and services from manufacturing and service operations is recognized to the extent that it is probable that the economic benefits will flow to the Group and the amount of revenue can be reliably measured. Revenue is measured at the fair value of the consideration received or receivable excluding value-added tax (VAT), returns and discounts. The Group assesses its revenue arrangements against specific criteria in order to determine if it is acting as principal or an agent. The Group has concluded that it is acting as a principal in all of its revenue arrangements, except for RIBI, an insurance broker, which acts as an agent. The following specific recognition criteria must also be met before revenue is recognized.
Sale of goods (Manufacturing)
Revenue is recognized when the significant risks and rewards of ownership of the goods have passed to the buyer and there is actual delivery made and the same is accepted by the buyer.
- 95 -
Sale of services (Service)
Revenue is recognized upon performance of services in accordance with the substance of the relevant agreements.
Rent Rent income is recognized on a straight-line basis over the terms of the lease.
Interest and financing income
Interest income is recognized as the interest accrues using the effective interest method.
Dividend Income Dividend income on investments in shares of stock is recognized when the Group’s right to receive the payment
is established, which is the date when the dividend declaration is approved by the investee’s BOD and the stockholders.
Cost and Expense Recognition Cost of Sales and Services
Cost of sales is recognized when goods are delivered to and accepted by the buyer. Cost of services is
recognized when the related services are performed.
Selling and Marketing, and General and Administrative Expenses
Selling and marketing expenses are costs incurred to sell or distribute merchandise. It includes export and
documentation processing and delivery, among others. General and administrative expenses constitute costs of
administering the business. Selling and marketing, and general and administrative expenses are expensed as
incurred.
Other Comprehensive Income (Loss)
Other comprehensive income (loss) comprises items of income and expense (including items previously
presented under the consolidated statement of changes in equity) that are not recognized in the consolidated
statement of income for the year in accordance with PFRS.
Pension Benefits The Group has defined benefit pension plans covering all permanent, regular, full-time employees administered by trustee banks. The cost of providing benefits under the defined benefit plans is determined using the projected unit credit actuarial valuation method. Actuarial gains and losses arising from experience adjustment and change in actuarial assumptions are reported in retained earnings in the period they are recognized as other comprehensive income.
The past service cost is recognized as an expense on a straight-line basis over the average period until the benefits become vested. If the benefits are already vested, immediately following the introduction of, or changes to, a pension plan, past service cost is recognized immediately. Gains or losses on the curtailment or settlement of pension benefits are recognized when the curtailment or settlement occurs.
The net pension obligation is the aggregate of the present value of the defined benefit obligation less past service cost not yet recognized and the fair value of plan assets out of which the obligation is to be settled directly.
Leases Finance leases, which transfer to the Group substantially all the risks and rewards incidental to ownership of the leased item, are capitalized at the inception of the lease at the fair value of the leased property or, if lower, at the present value of the minimum lease payments. Lease payments are apportioned between the finance charges and reduction of the lease liability so as to achieve a constant rate of interest on the remaining balance of the liability. Finance charges are recognized in the consolidated statement of income.
Capitalized leased assets are depreciated over the shorter of the estimated useful lives of the assets or the respective lease terms.
Leases where lessors retain substantially all the risks and benefits of ownership of the asset are classified as operating leases. Operating leases are recognized as expense in the consolidated statement of income on a straight-line basis over the lease term.
- 96 -
Income Taxes
Current income tax
Current income tax assets and liabilities for the current and prior periods are measured at the amount expected to be recovered from or paid to the taxation authorities. The tax rates and tax laws used as basis to compute the amount are those that have been enacted or substantively enacted at the balance sheet date.
Deferred income tax
Deferred income tax is provided, using the balance sheet liability method, on all temporary differences at the balance sheet date between the tax bases of assets and liabilities and their carrying amounts for financial reporting purposes. Deferred income tax liabilities are recognized for all taxable temporary differences. Deferred income tax assets are recognized for all deductible temporary differences and carryforward benefits of unused tax credit from excess of minimum corporate income tax (MCIT) over regular corporate income tax (RCIT) [excess MCIT], and unused net operating loss carryover (NOLCO), to the extent that it is probable that sufficient future taxable profits will be available against which the deductible temporary differences and carryforward benefits of unused excess MCIT and NOLCO can be utilized. The carrying amount of deferred income tax assets is reviewed at each balance sheet date and reduced to the extent that it is no longer probable that sufficient future taxable profits will be available to allow all or part of the deferred income tax assets to be utilized. Unrecognized deferred income tax assets are reassessed at each balance sheet date and are recognized to the extent that it has become probable that sufficient future taxable profits will allow the deferred income tax asset to be recovered. Deferred income tax assets and deferred income tax liabilities are measured at the tax rates that are expected to apply to the year when the asset is realized or the liability is settled, based on tax rates and tax laws that have been enacted or substantively enacted at the balance sheet date.
Deferred income tax assets and deferred income tax liabilities are offset, if a legally enforceable right exists to
offset current income tax assets against current income tax liabilities and the deferred income taxes relate to the same taxable entity and the same taxation authority.
Deferred income tax relating to items recognized directly in equity is recognized in the statement of comprehensive income. Deferred tax items are recognized in correlation to the underlying transaction either in other comprehensive income or directly in equity.
Earnings Per Share Basic earnings per share is computed by dividing the net income for the year by the weighted average number of common shares outstanding during the year after giving retroactive effect to any stock split or stock dividends declared and stock rights exercised during the year, if any. The Group does not have potentially dilutive common shares. Segment Reporting
The Group’s operating businesses are organized and managed separately according to the nature of the market
being serviced, with each segment representing a strategic business unit that offers different products and serves
different markets. Foreign Currency-Denominated Transactions and Translations Transactions in foreign currencies are recorded using the functional currency exchange rate at the date of the transaction. Outstanding monetary assets and liabilities denominated in foreign currencies are translated using the closing exchange rate at balance sheet date. Non-monetary items that are measured in terms of historical cost in a foreign currency are translated using the exchange rates as at the dates of the initial transactions. When a gain or loss on a non-monetary item is recognized in other comprehensive income, any foreign exchange component of that gain or loss shall be recognized in the parent company statement of comprehensive income. Conversely, when a gain or loss on a non-monetary item is recognized in the profit or loss, any exchange component of that gain or loss shall be recognized in the parent company statement of income.
- 97 -
Provisions and Contingencies
Provisions are recognized when the Group has a present obligation (legal or constructive) as a result of a past
event, it is probable (i.e., more likely than not) that an outflow of resources embodying economic benefits will be
required to settle the obligation, and a reliable estimate can be made of the amount of the obligation. Where the
Group expects some or all of the provision to be reimbursed, the reimbursement is recognized as a separate asset,
but only when the reimbursement is virtually certain. The expense relating to any provision is presented in the
consolidated statement of income, net of reimbursement. If the effect of the time value of money is material,
provisions are discounted using the current pre-tax rate that reflects, where appropriate, the risks specific to the
liability. Where discounting is used, the increase in the provision due to the passage of time is recognized as
interest expense.
Contingent liabilities are not recognized in the consolidated financial statements but are disclosed unless the
outflow of resources embodying economic benefits is remote. Contingent assets are not recognized in the
consolidated financial statements but disclosed when an inflow of economic benefits is probable.
Events After the Balance Sheet Date
Events after the balance sheet date that provide additional information about the Group’s position at the balance
sheet date (adjusting events) are reflected in the consolidated financial statements. Events after the balance sheet
date that are not adjusting events are disclosed in the notes to the consolidated financial statements when
material.
Future Changes in Accounting Policies
The Group will adopt the following standards and interpretations when these become effective. Except as otherwise indicated, the Group does not expect the adoption of these new and amended PFRS, PAS and Philippine Interpretations based on International Financial Reporting Interpretations Committee (IFRIC) interpretations to have significant impact on its financial statements:
Effective in 2014
• PAS 32, Financial Instruments: Presentation - Offsetting Financial Assets and Financial Liabilities
(Amendments), clarify the meaning of “currently has a legally enforceable right to set-off” and also clarify the application of the PAS 32 offsetting criteria to settlement systems (such as central clearing house systems) which apply gross settlement mechanisms that are not simultaneous. The amendments affect presentation only and have no impact on the Group’s financial position or performance. The amendments to PAS 32 are to be retrospectively applied for annual periods beginning on or after January 1, 2014.
Effective in 2015
• PFRS 9, Financial Instruments: Classification and Measurement, as issued, reflects the first phase on the replacement of PAS 39, Financial Instruments: Recognition and Measurement, and applies to the classification and measurement of financial assets and liabilities as defined in PAS 39. Work on impairment of financial instruments and hedge accounting is still ongoing, with a view to replacing PAS 39 in its entirety. PFRS 9 requires all financial assets to be measured at fair value at initial recognition. A debt financial asset may, if the fair value option (FVO) is not invoked, be subsequently measured at amortized cost if it is held within a business model that has the objective to hold the assets to collect the contractual cash flows and its contractual terms give rise, on specified dates, to cash flows that are solely payments of principal and interest on the principal outstanding. All other debt instruments are subsequently measured at fair value through profit or loss. All equity financial assets are measured at fair value either through other comprehensive income (OCI) or profit or loss. Equity financial assets held for trading must be measured at fair value through profit or loss. For FVO liabilities, the amount of change in the fair value of a liability that is attributable to changes in credit risk must be presented in OCI. The remainder of the change in fair value is presented in profit or loss, unless presentation of the fair value change in respect of the liability’s credit risk in OCI would create or enlarge an accounting mismatch in profit or loss. All other PAS 39 classification and measurement requirements for financial liabilities have been carried forward into PFRS 9, including the embedded derivative separation rules and the criteria for using the FVO. The adoption of the first phase of PFRS 9 will have an effect on the classification and measurement of the Group’s financial assets, but will potentially have no impact on the classification and measurement of financial liabilities. The Group is in the process of determining the impact of this standard on its financial position or performance.

- 98 -
Deferred by SEC
• Philippine Interpretation IFRIC 15, Agreements for the Construction of Real Estate, covers accounting for revenue and associated expenses by entities that undertake the construction of real estate directly or through subcontractors. The interpretation requires that revenue on construction of real estate be recognized only upon completion, except when such contract qualifies as construction contract to be accounted for under PAS 11 or involves rendering of services in which case revenue is recognized based on stage of completion. Contracts involving provision of services with the construction materials and where the risks and reward of ownership are transferred to the buyer on a continuous basis will also be accounted for based on stage of completion. The SEC and the Financial Reporting Standards Council (FRSC) have deferred the effectivity of this interpretation until the final Revenue standard is issued by the International Accounting Standards Board (IASB) and an evaluation of the requirements of the final Revenue standard against the practices of the Philippine real estate industry is completed. This interpretation is not relevant to the Group.
Annual Improvements to PFRS (2009-2011 cycle)
The Annual Improvements to PFRS (2009-2011 cycle) contain non-urgent but necessary amendments to PFRS. The amendments are effective for annual periods beginning on or after January 1, 2013 and are applied retrospectively. Earlier application is permitted.
• PFRS 1, First-time Adoption of PFRS - Borrowing Costs, clarifies that, upon adoption of PFRS, an entity that capitalized borrowing costs in accordance with its previous generally accepted accounting principles, may carry forward, without any adjustment, the amount previously capitalized in its opening statement of financial position at the date of transition. Subsequent to the adoption of PFRS, borrowing costs are recognized in accordance with PAS 23, Borrowing Costs.
• PAS 1, Presentation of Financial Statements - Clarification of the Requirements for Comparative
Information, clarifies the requirements for comparative information that are disclosed voluntarily and those that are mandatory due to retrospective application of an accounting policy, or retrospective restatement or reclassification of items in the financial statements. An entity must include comparative information in the related notes to the financial statements when it voluntarily provides comparative information beyond the minimum required comparative period. The additional comparative period does not need to contain a complete set of financial statements. On the other hand, supporting notes for the third balance sheet (mandatory when there is a retrospective application of an accounting policy, or retrospective restatement or reclassification of items in the financial statements) are not required.
• PAS 16, Property, Plant and Equipment - Classification of Servicing Equipment, clarifies that spare parts, stand-by equipment and servicing equipment should be recognized as property, plant and equipment when they meet the definition of property, plant and equipment and should be recognized as inventory, if otherwise.
• PAS 32, Financial Instruments: Presentation - Tax Effect of Distribution to Holders of Equity Instruments, clarifies that income taxes relating to distributions to equity holders and to transaction costs of an equity transaction are accounted for in accordance with PAS 12, Income Taxes.
• PAS 34, Interim Financial Reporting - Interim Financial Reporting and Segment Information for Total
Assets and Liabilities, clarifies that the total assets and liabilities for a particular reportable segment need to be disclosed only when the amounts are regularly provided to the chief operating decision maker and there has been a material change from the amount disclosed in the entity’s previous annual financial statements for that reportable segment.
The Group continues to assess the impact of the above new and amended accounting standards and interpretations effective subsequent to the December 31, 2012 financial statements. Additional disclosures required by these amendments will be included in the financial statements when these amendments are adopted.

- 99 -
40. Management’s Use of Significant Judgments, Accounting Estimates and Assumptions
The preparation of the Group’s consolidated financial statements requires management to exercise judgments, make accounting estimates and use assumptions that affect the amounts reported and the disclosures made. The estimates and assumptions used in the consolidated financial statements are based upon management’s evaluation of relevant facts and circumstances as of the date of the financial statements. Actual results could differ from these estimates, and such estimates will be adjusted accordingly, when the effects become determinable.
Accounting judgments, estimates and assumptions are continually evaluated and are based on historical experience and other factors, including expectations of future events that are believed to be reasonable under the circumstances.
Judgments
In the process of applying the Group’s accounting policies, management has made the following judgments apart from those involving estimations, which have the most significant effect in the amounts recognized in the consolidated financial statements.
Classification of financial instruments
The Group classifies a financial instrument, or its component parts, on initial recognition as a financial asset, a financial liability or an equity instrument in accordance with the substance of the contractual arrangement and the definitions of a financial asset, a financial liability or an equity instrument. The substance of a financial instrument, rather than its legal form, governs its classification in the consolidated balance sheet. Classification of financial instruments is reviewed at each balance sheet date.
Impairment of AFS financial assets
The Group determines that AFS financial assets are impaired when there has been a significant or prolonged
decline in the fair value below their cost. This determination of what is “significant” or “prolonged” requires
judgment. The Group treats “significant” generally as 20% or more and “prolonged” as greater than 12 months
for the quoted equity securities. Impairment may be appropriate when there is evidence of deterioration in the
financial health of the investee, industry and sector performance, changes in technology, and operational and
financing cash flows.
In 2012, in light of the changing business model of Philtown, the Group performed an impairment testing of its AFS financial assets in Philtown using the “Adjusted Net Asset Method”. In using this method, the fair values of the assets and liabilities of Philtown were determined as of impairment testing date, December 31, 2012. The computed fair values of the total assets of Philtown were applied against the computed fair values of its total liabilities according to priority and the residual assets were applied against the amount of the preferred and common shares held by the Group. The Group determined that its AFS financial assets are impaired.
Impairment loss was recognized on its AFS financial assets amounting to P=545.86 million in 2012. No
impairment loss was recognized in 2013.
Provisions and contingencies
The estimate of the probable costs for the resolution of possible third party claims has been developed in
consultation with outside consultant/legal counsel handling the Group’s defense on these matters and is based
upon an analysis of potential results. When management and its outside consultant/legal counsel believe that the
eventual liabilities under these and any other claims, if any, will not have a material effect on the consolidated
financial statements, no provision for probable losses is recognized in the Group’s consolidated financial
statements. The amount of provision is being reassessed at least on an annual basis to consider new relevant
information.
Determination of the classification of leases
The Group has entered into various lease agreements as a lessee. The Group accounts for lease arrangements as finance lease when the lease term is for the major part of the life of the asset and the Group has the option to purchase the asset at a price that is expected to be sufficiently lower than the fair value at the date the option is exercisable. Otherwise, the leases are accounted for as operating leases.

- 100 -
Accounting Estimates and Assumptions
The key estimates and assumptions concerning the future and other key sources of estimation at the balance sheet date that have a significant risk of causing a material adjustment to the carrying amount of asset and liabilities within the next financial year are discussed below.
Determination of fair value of financial instruments
Financial assets and financial liabilities, on initial recognition, are accounted for at fair value. The fair values of financial assets and financial liabilities, on initial recognition are normally the transaction price. In the case of those financial assets that have no active markets, fair values are determined using an appropriate valuation technique. Valuation techniques are used particularly for financial assets and financial liabilities (including derivatives) that are not quoted in an active market. Where valuation techniques are used to determine fair values (discounted cash flow, option models), they are periodically reviewed by qualified personnel who are independent of the trading function. All models are calibrated to ensure that outputs reflect actual data and comparative market prices. To the extent practicable, models use only observable data as valuation inputs. However, other inputs such as credit risk (whether that of the Group or the counterparties), forward prices, volatilities and correlations, require management to develop estimates or make adjustments to observable data of comparable instruments. The amount of changes in fair values would differ if the Group uses different valuation assumptions or other acceptable methodologies. Any change in fair value of these financial instruments (including derivatives) would affect either the consolidated statement of income or comprehensive income. Estimation of allowance for doubtful accounts
The Group maintains allowance for doubtful accounts based on the results of the individual and collective assessments. Under the individual assessment, the Group is required to obtain the present value of estimated cash flows using the receivable’s original effective interest rate. Impairment loss is determined as the difference between the receivable’s carrying balance and the computed present value. If no future cash flows is expected, impairment loss is equal to the carrying balance of the receivables. Factors considered in individual assessment are payment history, inactive accounts, past due status and term. The collective assessment would require the Group to classify its receivables based on the credit risk characteristics (customer type, payment history, past due status and term) of the customers. Impairment loss is then determined based on historical loss experience of the receivables grouped per credit risk profile. Historical loss experience is adjusted on the basis of current observable data to reflect the effects of current conditions that did not affect the period on which the historical loss experience is based and to remove the effects of conditions in the historical period that do not exist currently. The methodology and assumptions used for the individual and collective assessments are based on management’s judgment and estimate. Therefore, the amount and timing of recorded expense for any period would differ depending on the judgments and estimates made during the year.
Estimation of inventory obsolescence
The Group estimates the allowance for inventory obsolescence related to inventories based on a certain percentage of non-moving inventories. The level of allowance is evaluated by management based on past experiences and other factors affecting the saleability of goods such as present demand in the market and emergence of new products, among others.
Determnination of NRV of inventories
The Group’s estimates of the NRV of inventories are based on the most reliable evidence available at the time the estimates are made, of the amount that the inventories are expected to be realized. These estimates consider the fluctuations of price or cost directly relating to events occurring after the end of the period to the extent that such events confirm conditions existing at the end of the period. A new assessment is made at NRV in each subsequent period. When the circumstances that previously caused inventories to be written down below cost no longer exist or when there is a clear evidence of an increase in NRV because of change in economic circumstances, the amount of the write-down is reversed so that the new carrying amount is the lower of the cost and the revised NRV.
Estimation of allowance for probable losses
Allowance for probable losses of prepaid expenses is based on the ability of the Group to recover the carrying value of the assets. Accounts estimated to be potentially unrecoverable are provided with adequate allowance through charges to the consolidated statement of income in the form of allowance for probable loss.

- 101 -
Estimation of useful lives of property, plant and equipment and investment property The Group estimates the useful life of depreciable property, plant and equipment and investment property based on a collective assessment of similar businesses, internal technical evaluation and experience with similar assets. Estimated useful lives are based on the periods over which the assets are expected to be available for use. The estimated useful lives are reviewed periodically and are updated if expectations differ from previous estimates due to physical wear and tear, technical and commercial obsolescence and legal or other limits on the use of the assets. It is possible, however, that future results of operations could be materially affected by changes in the amounts and timing of recorded expenses brought about by changes in the factors mentioned above. A reduction in the estimated useful life of any item of property, plant and equipment and investment property would increase the recorded operating expenses and decrease the carrying value of the assets and vice versa. The estimated useful lives of property, plant and equipment and investment property are discussed in Note 2 to the consolidated financial statements. There had been no changes in the estimated useful lives of property, plant and equipment and investment property in 2013 and 2012.
Valuation of land under revaluation basis The Group’s parcels of land are carried at revalued amounts, which approximate their fair values at the date of the revaluation, less any subsequent accumulated depreciation and accumulated impairment losses. The revaluation is performed by professionally qualified appraisers. Revaluations are made every three to five years to ensure that the carrying amounts do not differ materially from those which would be determined using fair values at the balance sheet date. The appraisal increase on the valuation of land based on the appraisal report amounting to P=568.94 million as of March 31, 2013 and December 31, 2012 is presented as “Revaluation increment on land” account, net of deferred income tax effect of P=243.83 million, in the equity section of the consolidated balance sheets. Impairment of property, plant and equipment, investment properties and investments in associates The Group assesses whether there are indications of impairment on its property, plant and equipment, investment properties and investments in associates, at least on an annual basis. If there are, impairment testing is performed. This requires an estimation of the value-in-use of the CGUs to which the assets belong. Estimating the value-in-use requires the Group to make an estimate of the expected future cash flows from the CGU and also to choose a suitable discount rate in order to calculate the present value of those cash flows. Impairment of goodwill The Group reviews the carrying value of goodwill for impairment annually or more frequently if events or changes in circumstances indicate that the carrying value may be impaired. The Group performs impairment test of goodwill annually every December 31. Impairment is determined for goodwill by assessing the recoverable amount of the CGU or group of CGUs to which goodwill relates. Assessments require the use of estimates and assumptions such as discount rates, future capital requirements and operating performance. If the recoverable amount of the unit exceeds the carrying amount of the CGU, the CGU and the goodwill allocated to that CGU shall be regarded as not impaired. Where the recoverable amount of the CGU or group of CGUs is less than the carrying amount of the CGU or group of CGUs to which goodwill has been allocated, an impairment loss is recognized. In 2012, the Parent Company performed an impairment test with respect to its goodwill resulting from its acquisition of URICI amounting to P=190.56 million as of March 31, 2013 and December 31, 2012. The Parent Company used a discount rate of 4.11% and a growth rate on sales of URICI by 15% to 17% for the succeeding five years. No impairment losses were recognized for the years ended December 31, 2012 and 2011.
Recognition of deferred income tax assets
The Group reviews the carrying amounts of deferred income tax assets at each balance sheet date and adjusts the balance of deferred income tax assets to the extent that it is no longer probable that sufficient future taxable profits will be available to allow all or part of the deferred income tax assets to be utilized.
Estimation of pension benefits obligations and costs
The determination of the Group’s obligation and costs of pension benefits depends on the selection by management of certain assumptions used by the actuary in calculating such amounts. Those assumptions include, among others the discount rate, expected rate of return and rate of salary increase. The Group recognizes all actuarial gains and losses in the consolidated statement of comprehensive income, and therefore generally affects the recorded obligation. While management believes that the Group’s assumptions are reasonable and appropriate, significant differences in actual experience or significant changes in assumptions may materially affect the Group’s pension obligation.
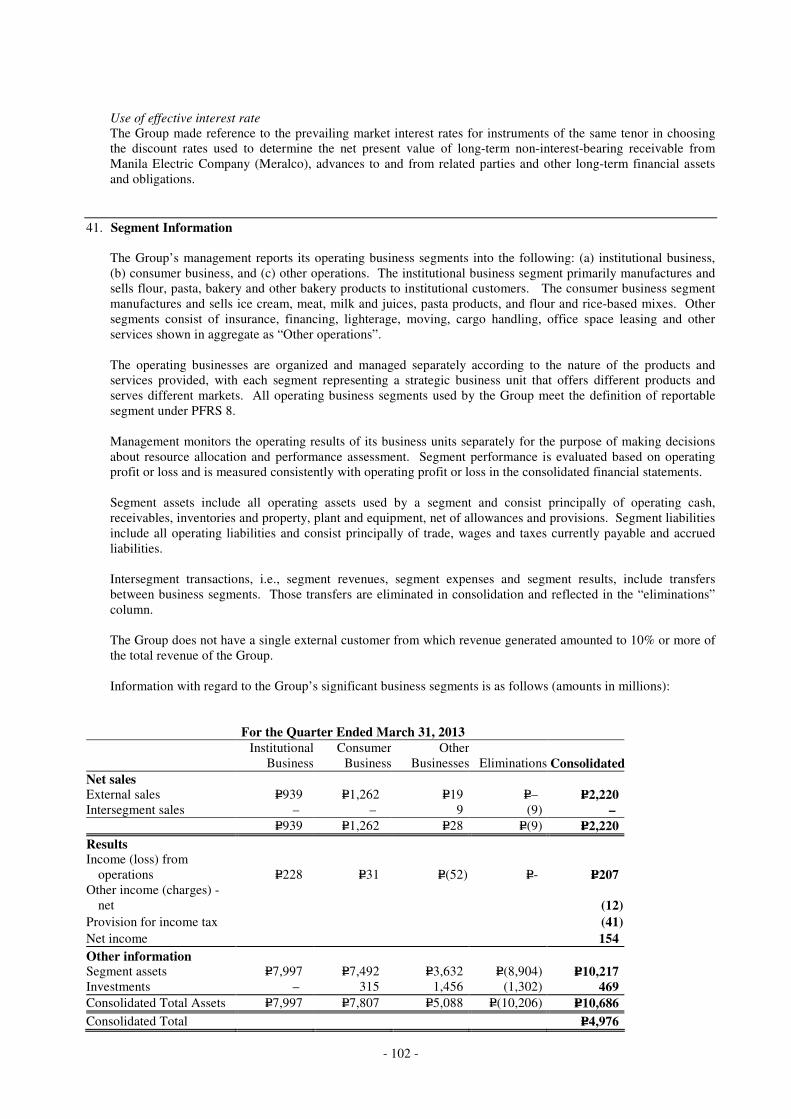
- 102 -
Use of effective interest rate
The Group made reference to the prevailing market interest rates for instruments of the same tenor in choosing the discount rates used to determine the net present value of long-term non-interest-bearing receivable from Manila Electric Company (Meralco), advances to and from related parties and other long-term financial assets and obligations.
41. Segment Information
The Group’s management reports its operating business segments into the following: (a) institutional business, (b) consumer business, and (c) other operations. The institutional business segment primarily manufactures and sells flour, pasta, bakery and other bakery products to institutional customers. The consumer business segment manufactures and sells ice cream, meat, milk and juices, pasta products, and flour and rice-based mixes. Other segments consist of insurance, financing, lighterage, moving, cargo handling, office space leasing and other services shown in aggregate as “Other operations”.
The operating businesses are organized and managed separately according to the nature of the products and services provided, with each segment representing a strategic business unit that offers different products and serves different markets. All operating business segments used by the Group meet the definition of reportable segment under PFRS 8.
Management monitors the operating results of its business units separately for the purpose of making decisions about resource allocation and performance assessment. Segment performance is evaluated based on operating profit or loss and is measured consistently with operating profit or loss in the consolidated financial statements.
Segment assets include all operating assets used by a segment and consist principally of operating cash, receivables, inventories and property, plant and equipment, net of allowances and provisions. Segment liabilities include all operating liabilities and consist principally of trade, wages and taxes currently payable and accrued liabilities.
Intersegment transactions, i.e., segment revenues, segment expenses and segment results, include transfers between business segments. Those transfers are eliminated in consolidation and reflected in the “eliminations” column.
The Group does not have a single external customer from which revenue generated amounted to 10% or more of the total revenue of the Group. Information with regard to the Group’s significant business segments is as follows (amounts in millions):
For the Quarter Ended March 31, 2013
Institutional Business
Consumer Business
Other Businesses Eliminations Consolidated
Net sales External sales P=939 P=1,262 P=19 P=– P=2,220 Intersegment sales – – 9 (9) – P=939 P=1,262 P=28 P=(9) P=2,220
Results Income (loss) from
operations P=228 P=31 P=(52) P=- P=207 Other income (charges) -
net (12)
Provision for income tax (41)
Net income 154
Other information Segment assets P=7,997 P=7,492 P=3,632 P=(8,904) P=10,217 Investments – 315 1,456 (1,302) 469
Consolidated Total Assets P=7,997 P=7,807 P=5,088 P=(10,206) P=10,686
Consolidated Total P=4,976

- 103 -
Liabilities
Depreciation and amortization P=76

- 104 -
For the Quarter Ended March 31, 2012
Institutional Business
Consumer Business
Other Businesses Eliminations Consolidated
Net sales External sales P=925 P=1,453 P=15 P=– P=2,393 Intersegment sales – – 11 (11) – P=925 P=1,453 P=26 P=(11) P=2,393
Results Income (loss) from
operations P=218 P=68 P=(96) P=- P=190 Other income (charges) -
net (13)
Provision for income tax (47)
Net income 130
Other information Segment assets P=6,168 P=5,201 P=4,982 P=(6,388) P=9,963 Investments – 155 2,162 (1,069) 1,248
Consolidated Total Assets P=6,168 P=5,356 P=7,144 P=(7,457) P=11,211
Consolidated Total Liabilities P=5,919
Depreciation and amortization P=67
42. Accounts Receivable March 31, 2013
(Unaudited)
(amounts in millions) Trade receivables P=2,529 P=2,550 Advances to related parties 394 389 Other receivables 471 445

- 105 -
3,394 3,384 Less allowance for doubtful accounts 706 707
P=2,688 P=2,677
43. Inventories
This include finished goods and goods in process, raw materials, and spare parts and supplies.
44. Other Current Assets
March 31, 2013 (Unaudited)
(amounts in millions) Deposits on purchases P=32 P=34 Creditable withholding taxes 63 60 Input VAT 51 50 Prepaid expenses and other current assets – net of allowance for
probable losses 57 48
P=203 P=192
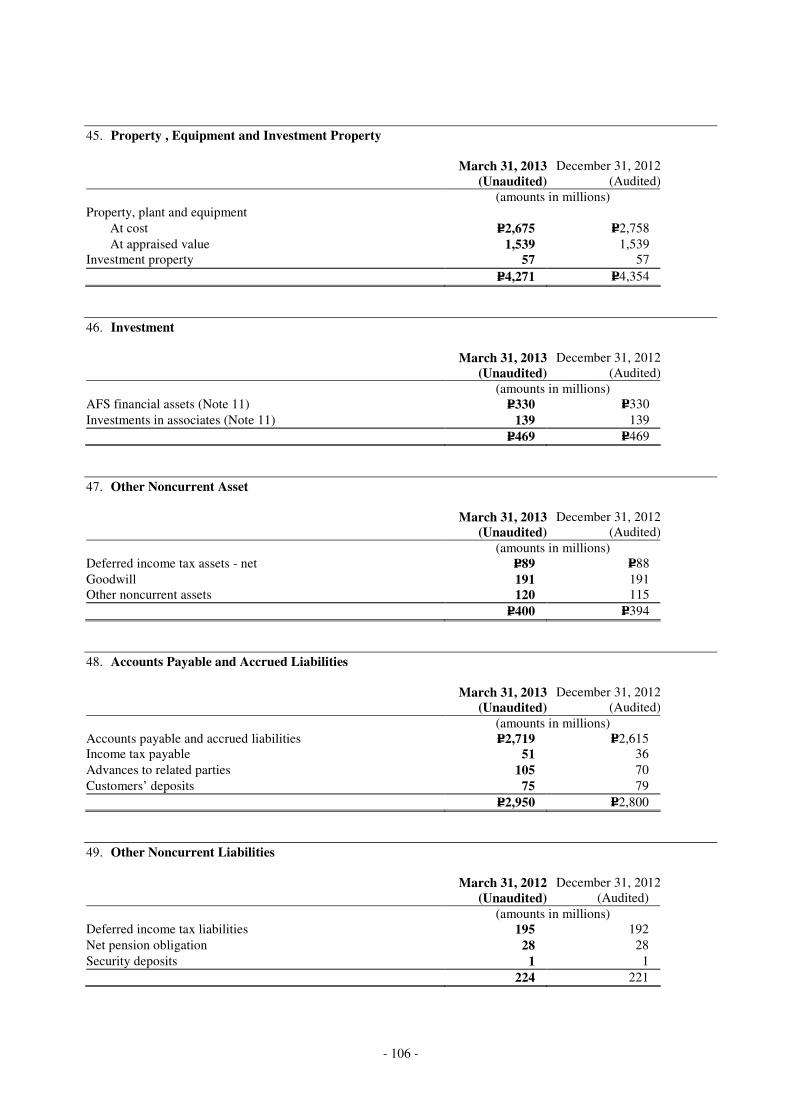
- 106 -
45. Property , Equipment and Investment Property March 31, 2013
(Unaudited)December 31, 2012
(Audited)
(amounts in millions) Property, plant and equipment
At cost P=2,675 P=2,758
At appraised value 1,539 1,539 Investment property 57 57
P=4,271 P=4,354
46. Investment March 31, 2013
(Unaudited)December 31, 2012
(Audited)
(amounts in millions) AFS financial assets (Note 11) P=330 P=330
Investments in associates (Note 11) 139 139
P=469 P=469
47. Other Noncurrent Asset March 31, 2013
(Unaudited)December 31, 2012
(Audited)
(amounts in millions) Deferred income tax assets - net P=89 P=88
Goodwill Other noncurrent assets
191 120
191 115
P=400 P=394
48. Accounts Payable and Accrued Liabilities March 31, 2013
(Unaudited)December 31, 2012
(Audited)
(amounts in millions) Accounts payable and accrued liabilities P=2,719 P=2,615 Income tax payable 51 36
Advances to related parties 105 70
Customers’ deposits 75 79
P=2,950 P=2,800
49. Other Noncurrent Liabilities March 31, 2012
(Unaudited)December 31, 2012
(Audited)
(amounts in millions) Deferred income tax liabilities 195 192
Net pension obligation 28 28
Security deposits 1 1
224 221
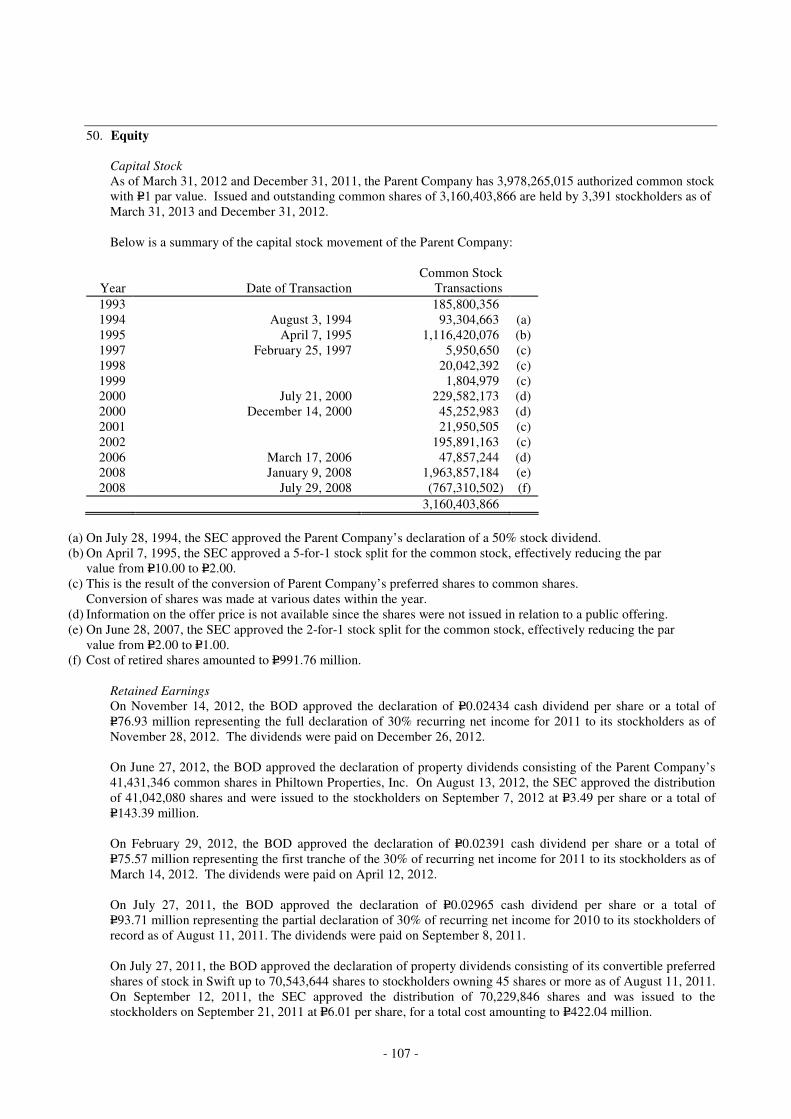
- 107 -
50. Equity
Capital Stock
As of March 31, 2012 and December 31, 2011, the Parent Company has 3,978,265,015 authorized common stock with P=1 par value. Issued and outstanding common shares of 3,160,403,866 are held by 3,391 stockholders as of March 31, 2013 and December 31, 2012. Below is a summary of the capital stock movement of the Parent Company:
Year Date of Transaction Common Stock
Transactions
1993 185,800,356 1994 August 3, 1994 93,304,663 (a) 1995 April 7, 1995 1,116,420,076 (b) 1997 February 25, 1997 5,950,650 (c) 1998 20,042,392 (c) 1999 1,804,979 (c) 2000 July 21, 2000 229,582,173 (d) 2000 December 14, 2000 45,252,983 (d) 2001 21,950,505 (c) 2002 195,891,163 (c) 2006 March 17, 2006 47,857,244 (d) 2008 January 9, 2008 1,963,857,184 (e) 2008 July 29, 2008 (767,310,502) (f)
3,160,403,866
(a) On July 28, 1994, the SEC approved the Parent Company’s declaration of a 50% stock dividend. (b) On April 7, 1995, the SEC approved a 5-for-1 stock split for the common stock, effectively reducing the par
value from P=10.00 to P=2.00. (c) This is the result of the conversion of Parent Company’s preferred shares to common shares.
Conversion of shares was made at various dates within the year. (d) Information on the offer price is not available since the shares were not issued in relation to a public offering. (e) On June 28, 2007, the SEC approved the 2-for-1 stock split for the common stock, effectively reducing the par
value from P=2.00 to P=1.00. (f) Cost of retired shares amounted to P=991.76 million.
Retained Earnings
On November 14, 2012, the BOD approved the declaration of P=0.02434 cash dividend per share or a total of P=76.93 million representing the full declaration of 30% recurring net income for 2011 to its stockholders as of November 28, 2012. The dividends were paid on December 26, 2012.
On June 27, 2012, the BOD approved the declaration of property dividends consisting of the Parent Company’s 41,431,346 common shares in Philtown Properties, Inc. On August 13, 2012, the SEC approved the distribution of 41,042,080 shares and were issued to the stockholders on September 7, 2012 at P=3.49 per share or a total of P=143.39 million.
On February 29, 2012, the BOD approved the declaration of P=0.02391 cash dividend per share or a total of
P=75.57 million representing the first tranche of the 30% of recurring net income for 2011 to its stockholders as of March 14, 2012. The dividends were paid on April 12, 2012.
On July 27, 2011, the BOD approved the declaration of P=0.02965 cash dividend per share or a total of P=93.71 million representing the partial declaration of 30% of recurring net income for 2010 to its stockholders of record as of August 11, 2011. The dividends were paid on September 8, 2011.
On July 27, 2011, the BOD approved the declaration of property dividends consisting of its convertible preferred shares of stock in Swift up to 70,543,644 shares to stockholders owning 45 shares or more as of August 11, 2011. On September 12, 2011, the SEC approved the distribution of 70,229,846 shares and was issued to the stockholders on September 21, 2011 at P=6.01 per share, for a total cost amounting to P=422.04 million.
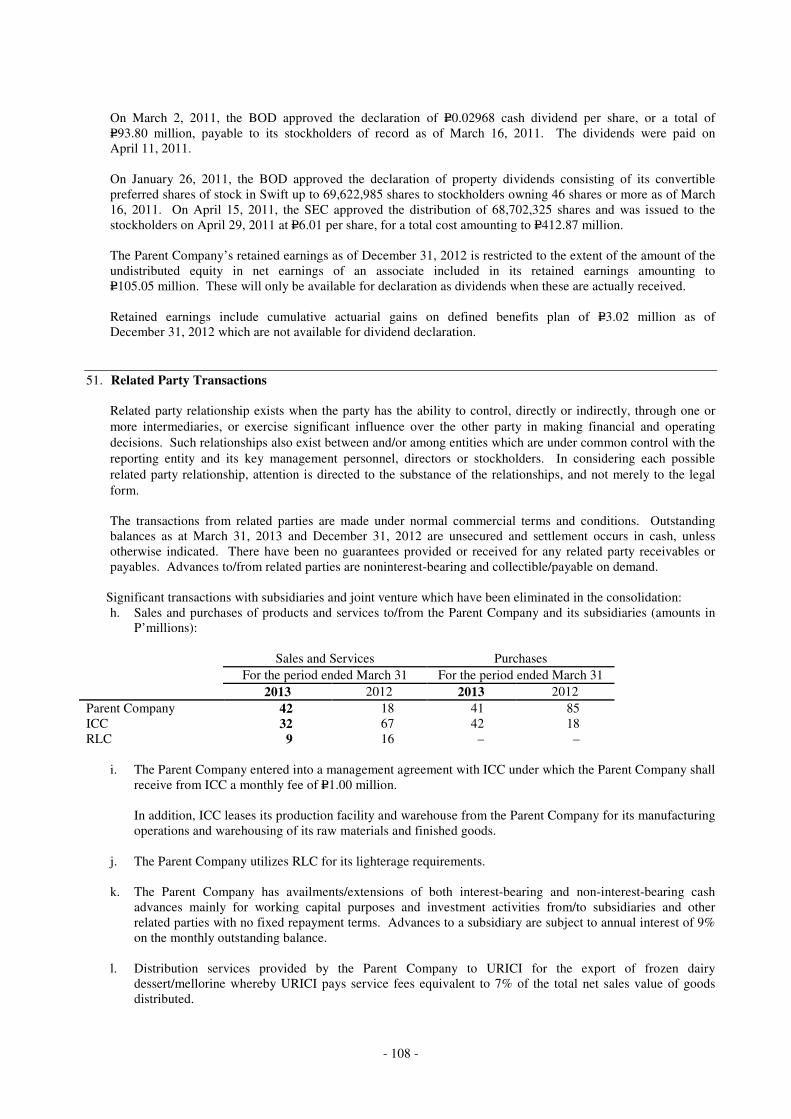
- 108 -
On March 2, 2011, the BOD approved the declaration of P=0.02968 cash dividend per share, or a total of P=93.80 million, payable to its stockholders of record as of March 16, 2011. The dividends were paid on April 11, 2011.
On January 26, 2011, the BOD approved the declaration of property dividends consisting of its convertible preferred shares of stock in Swift up to 69,622,985 shares to stockholders owning 46 shares or more as of March 16, 2011. On April 15, 2011, the SEC approved the distribution of 68,702,325 shares and was issued to the stockholders on April 29, 2011 at P=6.01 per share, for a total cost amounting to P=412.87 million.
The Parent Company’s retained earnings as of December 31, 2012 is restricted to the extent of the amount of the undistributed equity in net earnings of an associate included in its retained earnings amounting to P=105.05 million. These will only be available for declaration as dividends when these are actually received.
Retained earnings include cumulative actuarial gains on defined benefits plan of P=3.02 million as of December 31, 2012 which are not available for dividend declaration.
51. Related Party Transactions
Related party relationship exists when the party has the ability to control, directly or indirectly, through one or
more intermediaries, or exercise significant influence over the other party in making financial and operating
decisions. Such relationships also exist between and/or among entities which are under common control with the
reporting entity and its key management personnel, directors or stockholders. In considering each possible
related party relationship, attention is directed to the substance of the relationships, and not merely to the legal
form. The transactions from related parties are made under normal commercial terms and conditions. Outstanding
balances as at March 31, 2013 and December 31, 2012 are unsecured and settlement occurs in cash, unless otherwise indicated. There have been no guarantees provided or received for any related party receivables or payables. Advances to/from related parties are noninterest-bearing and collectible/payable on demand.
Significant transactions with subsidiaries and joint venture which have been eliminated in the consolidation:
h. Sales and purchases of products and services to/from the Parent Company and its subsidiaries (amounts in P’millions):
Sales and Services Purchases
For the period ended March 31 For the period ended March 31
2013 2012 2013 2012
Parent Company 42 18 41 85 ICC 32 67 42 18 RLC 9 16 – –
i. The Parent Company entered into a management agreement with ICC under which the Parent Company shall receive from ICC a monthly fee of P=1.00 million.
In addition, ICC leases its production facility and warehouse from the Parent Company for its manufacturing operations and warehousing of its raw materials and finished goods.
j. The Parent Company utilizes RLC for its lighterage requirements.
k. The Parent Company has availments/extensions of both interest-bearing and non-interest-bearing cash advances mainly for working capital purposes and investment activities from/to subsidiaries and other related parties with no fixed repayment terms. Advances to a subsidiary are subject to annual interest of 9% on the monthly outstanding balance.
l. Distribution services provided by the Parent Company to URICI for the export of frozen dairy
dessert/mellorine whereby URICI pays service fees equivalent to 7% of the total net sales value of goods distributed.
- 109 -
m. Management services of the Parent Company to RIBI wherein RIBI pays the Parent Company a yearly management fee equivalent to 5% of income before income tax or a fixed amount based on the level of net sales, whichever is higher.
n. The Parent Company has a lease agreement for office space with Invest Asia, a subsidiary. The lease covers
a one-year period, renewable every two years at the option of the Parent Company.
52. Financial Risk Management Objectives and Policies The Group’s principal financial instruments include non-derivative instruments such as cash and cash equivalents, AFS financial assets, accounts receivable, bank loans, accounts payable and accrued liabilities, long-term debts and obligations and advances to and from related parties. The main purpose of these financial instruments includes raising funds for the Group’s operations and managing identified financial risks. The Group has various other financial assets and financial liabilities such as other current receivables, other current assets, trust receipts payable and customers’ deposits which arise directly from its operations. The main risk arising from the use of financial instruments is credit risk, liquidity risk, interest rate risk, foreign exchange risk and equity price risk.
Credit risk
Credit risk arises from the risk of counterparties defaulting. Management is tasked to minimize credit risk through strict implementation of credit, treasury and financial policies. The Group deals only with reputable counterparties, financial institutions and customers. To the extent possible, the Group obtains collateral to secure sales of its products to customers. In addition, the Group transacts with financial institutions belonging to the top 25% of the industry, and/or those which provide the Group with long-term loans and/or short-term credit facilities.
The Group does not have significant concentrations of credit risk and does not enter into financial instruments to
manage credit risk. With respect to credit risk arising from financial assets other than installment contracts and accounts receivable (such as cash and cash equivalents and AFS financial assets), the Group's exposure to credit risk arises from default of the counterparties, with a maximum exposure equal to the carrying amount of these instruments.
The credit quality of financial assets is managed by the Group using internal credit ratings.
Credit quality of cash in banks and cash equivalents and AFS financial assets are based on the nature of the counterparty and the Group’s internal rating system.
Financial assets that are neither past due nor impaired are classified as “Excellent” account when these are
expected to be collected or liquidated on or before their due dates, or upon call by the Group if there are no
predetermined defined due dates. All other financial assets that are neither past due or impaired are classified as
“Good” accounts. Liquidity risk Liquidity risk arises from the possibility that the Group may encounter difficulties in raising fund to meet
commitments from financial instruments. Management is tasked to minimize liquidity risk through prudent financial planning and execution to meet the
funding requirements of the various operating divisions within the Group; through long-term and short-term debts obtained from financial institutions; through strict implementation of credit and collection policies, particularly in containing trade receivables; and through capital raising, including equity, as may be necessary. Presently, the Group has existing long-term debts that fund capital expenditures. Working capital requirements, on the other hand, are adequately addressed through short-term credit facilities from financial institutions. Trade receivables are kept within manageable levels.
Interest rate risk
The Group’s exposure to changes in interest rates relates primarily to the Group’s short-term and long-term debt obligations.
- 110 -
Management is tasked to minimize interest rate risk through interest rate swaps and options, and having a mix of
variable and fixed interest rates on its loans. Presently, the Group’s short-term and long-term debts and obligations are market-determined, with the long-term debts and obligations interest rates based on PDST-F-1 plus a certain spread.
URICI is not expecting significant exposures to interest rate risk considering the short-term maturities of its bank loans.
There is no other impact on the Group’s equity other than those affecting the income.
Foreign exchange risk
The Group’s exposure to foreign exchange risk results from the Parent Company and URICI’s business transactions and financing agreements denominated in foreign currencies.
Management is tasked to minimize foreign exchange risk through the natural hedges arising from its export business and through external currency hedges. Presently, trade importations are immediately paid or converted into Peso obligations as soon as these are negotiated with suppliers. The Group has not done any external currency hedges in 2012 and 2011. There is no other impact on the Group’s equity other than those affecting the statement of income.
Equity price risk
Equity price risk is such risk where the fair values of investments in quoted equity securities could decrease as a
result of changes in the levels of equity indices and the value of individual stock. Management strictly monitors
the movement of the share prices pertaining to its investments. The Group is exposed to equity securities price
risk because of quoted common and golf club shares, which are classified as AFS financial assets.
There is no other impact on the Group’s equity other than those affecting the statement of income.
53. Financial Assets and Financial Liabilities
Fair Value of Financial Instruments
The following methods and assumptions were used to estimate the fair value of each class of financial instrument for which it is practicable to estimate such value.
Due to the short-term nature of the transactions, the carrying amounts of cash and cash equivalents, accounts receivable, bank loans, accounts payable and accrued liabilities, and customers’ deposits approximate their fair values.
The fair value of quoted AFS financial assets and trust receipts payable has been determined by reference to quoted market prices at the close of business on December 31, 2012 and 2011. Investments in unquoted equity securities are carried at historical cost, net of impairment, as their fair value cannot be reliably measured.
The fair value of advances to/from related parties, receivable from Meralco and long-term debts and obligations are based on the discounted value of future cash flows using the applicable rates for similar types of instruments.
Fair Value Hierarchy
The Group uses the following hierarchy for disclosing the fair values of financial instruments by valuation source of input:
• quoted prices in active markets for identical assets or liabilities (Level 1);
• those involving inputs other than quoted prices included in Level 1 that are observable for the asset or liability, either directly (as prices) or indirectly (derived from prices) (Level 2); and
• those with inputs for the asset or liability that are not based on observable market date (unobservable inputs) (Level 3).
There had been no transfers between Level 1, Level 2, and Level 3 of the fair value hierarchy in 2012 and 2011.

- 111 -
Derivative Instruments The related fair values of the Group’s outstanding derivative liability arising from the interest rate swap amounted to nil as of March 31, 2013 and December 31, 2012.
Derivatives Accounted for Under Cash Flow Hedge Accounting
On August 27, 2009, the Parent Company entered into an interest rate swap transaction with Hongkong and Shanghai Banking Corporation (HSBC) to hedge the cash flow variability on the BDO loan due to movements in interest rates. Details of the interest rate swap follow:
Trade Date Maturity Date Notional Amount* Receive Floating Pay Fixed
August 27, 2009 October 3, 2012 P=380.00 million PDST-F + 250 basis points 7.92% per annum *Amortizing based on a given schedule Under the interest rate swap, the Parent Company will receive quarterly interest at a rate of 3-months PDST-F plus 2.50% per annum spread on the outstanding peso balance starting October 5, 2009 until October 3, 2012, and pay quarterly interest at fixed rate of 7.92% per annum on the outstanding peso balance starting October 5, 2009 until October 3, 2012. The outstanding notional amount of the swap amounted to nil as of December 31, 2012 and 2011. On October 2010, the Parent Company terminated its local bank loan, which is the underlying of the interest rate swap agreement. In line with the termination of the loan, the interest rate swap is accounted for as freestanding derivative from the day the loan was terminated. Hence, unrealized loss in equity amounting to P=0.84 million was recognized in full in the 2010 Parent Company statement of income. As of December 31, 2012 and 2011, the fair value of the derivative liabilityamounted to nil and P=1.73 million, respectively. The Parent Company recognized in the statements of income mark-to-market gain amounting to P=4.94 million in 2011 and mark-to-market loss of P=5.48 million in 2010. The interest rate swap agreement ended in October 2012.
Fair Value Changes on Derivatives
The net changes in the fair values of all derivative instruments for the year ended December 31, 2012 follow: Balance at December 31, 2011 P=1,732 Fair value changes of derivative taken to profit or loss (1,732)
Derivative liability at December 31, 2012 P=-
Forward Contracts
For the period ended March 31, 2013 and December 31, 2012, URICI, through the Central Treasury Department, entered into forward foreign exchange contracts as a hedge against foreign currency denominated liabilities and commitments. These forward foreign exchange contracts are expected to be settled within one month from the balance sheet date. As at and for the period ended March 31, 2013 and December 31, 2012, the difference between the fair market values and aggregate notional amount of the forward contract, at net settled amount, is not considered significant. The fair value of forward foreign exchange contracts is determined using forward exchange market rates at balance sheet date and any difference between the fair market values and aggregate notional amounts of these forward foreign exchange contracts is recognized immediately in the consolidated statement of income.
54. Other Income (Charges)
For the Period Ended March 31
2013 (Unaudited)
- 112 -
(amounts in millions) Interest expense (P=17) (P=29) Interest income 1 5 Other income, net 4 11 (P=12) (P=13)
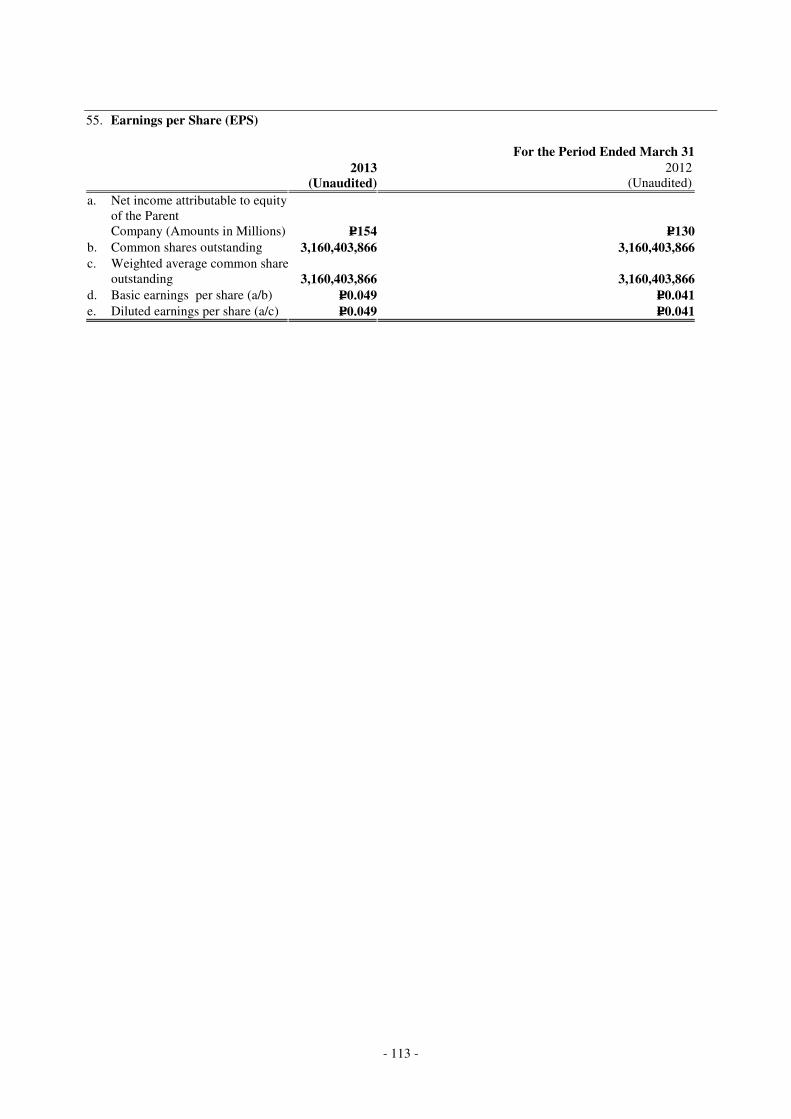
- 113 -
55. Earnings per Share (EPS)
For the Period Ended March 31
2013
(Unaudited) 2012
(Unaudited)
a. Net income attributable to equity holders of the Parent Company (Amounts in Millions) P=154 P=130
b. Common shares outstanding 3,160,403,866 3,160,403,866 c. Weighted average common shares
outstanding 3,160,403,866 3,160,403,866
d. Basic earnings per share (a/b) P=0.049 P=0.041
e. Diluted earnings per share (a/c) P=0.049 P=0.041
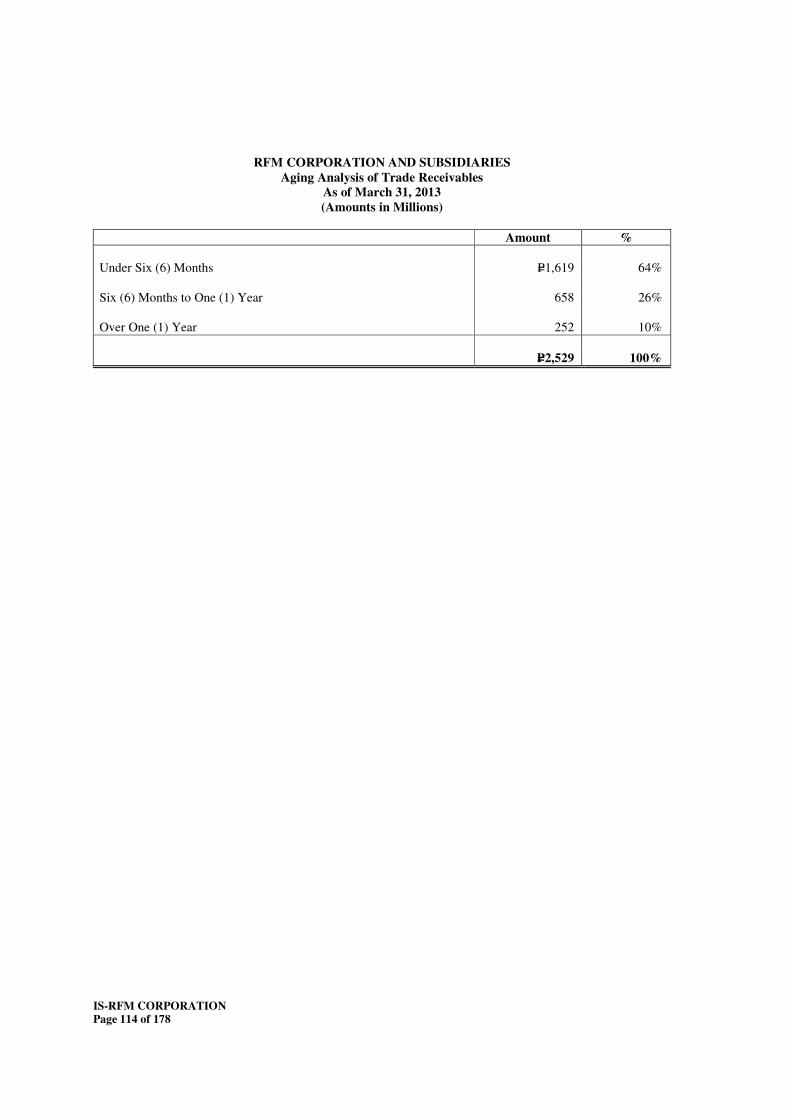
IS-RFM CORPORATION Page 114 of 178
RFM CORPORATION AND SUBSIDIARIES
Aging Analysis of Trade Receivables As of March 31, 2013 (Amounts in Millions)
Amount % Under Six (6) Months P=1,619 64% Six (6) Months to One (1) Year 658 26% Over One (1) Year 252 10%
P=2,529 100%