SEBI - Securities and Exchange Board of India has no objection to the material published herein...
107
SEBI BULLETIN JULY 2015 VOL. 13 NUMBER 7 ^maVr¶ à{V^y{V Am¡a {d{Z‘¶ ~moS>© Securities and Exchange Board of India
Transcript of SEBI - Securities and Exchange Board of India has no objection to the material published herein...

SEBIBULLETIN
JULY 2015 VOL. 13 NUMBER 7
^maVr¶ à{V^y{V Am¡a {d{Z‘¶ ~moS>©Securities and Exchange Board of India

EDITORIAL COMMITTEE
• Mr. Ananta Barua
• Mr. J. Ranganayakulu
• Mr. S. V. Murali Dhar Rao
• Dr. Anil Kumar Sharma
The Securities and Exchange Board of India Bulletin is issued by the Department of Economic and Policy Analysis, Securities and Exchange Board of India under the direction of an Editorial Committee. SEBI is not responsible for accuracy of data/information/interpretations and opinions expressed in the case of signed articles/speeches as authors are responsible for their personal views. SEBI has no objection to the material published herein being reproduced, provided an acknowledgement of the same is made. The soft copy of SEBI Bulletin is available free of cost to the subscribers/readers, who register at [email protected] along with their complete address. A readable version of SEBI Bulletin is available at http://www.sebi.gov.in. Any comments and suggestions on any of the features/sections may be sent to [email protected]
SECURITIES AND EXCHANGE BOARD OF INDIA

Contents
Page
CAPITAL MARKET REVIEW 609
GLOBAL MARKET REVIEW 619
PRESS RELEASES 639
1. SEBI signs Memorandum of Understanding on bilateral cooperation with the 639Ministry of Finance, Republic of Belarus
2. Contribution towards Prime Minister’s National Relief Fund 639
3. SEBI Board Meeting 639
POLICY DEVELOPMENTS 644
A. Circulars 644
1. Database for Distinctive Number (DN) of Shares 644
2. Clarifi cation on grant of registration as a Foreign Portfolio Investor (FPI) to 646Registered Foreign Venture Capital Investors (FVCI)
3. Exchange Traded Cash Settled Interest Rate Futures (IRF) on 6 year, 10 year 646and 13 year Government of India (GoI) Security
4. Requirements specifi ed under the SEBI (Share Based Employee Benefi ts) 647Regulations, 2014
5. Review of Offer for Sale (OFS) of Shares through Stock Exchange Mechanism 647
REGULATORY ACTIONS TAKEN BY SEBI 648
HIGHLIGHTS OF DEVELOPMENTS IN INTERNATIONAL SECURITIES MARKET 672
TABLES 673
PUBLICATIONS 711


609
JULY SEBI BULLETIN 2015
1. Trends in Primary Market
A. Public and Rights Issues
During June 2015, nine companies accessed the primary market and mobilised `439 crore compared to `493 crore mobilised through two issues in May 2015, showing a decrease of 10.9 percent from the previous month. Of the nine IPOs in June 2015, eight were listed in the SME segment which raised `39.2 crore and the single main board IPO raised `400 crore.
CAPITAL MARKET REVIEW
During 2015-16 so far, 18 companies accessed the capital market and raised `10,532 crore compared to `2,315 crore raised through 18 issues during the corresponding period of 2014-15 (Exhibit 1). There were 16 public issues which raised `3,034 crore and two rights issues which raised `7,498 crore during Apr-Jun 2015. Among the public issues, there were 14 IPOs and two public debt issues.
Exhibit 1: Primary Market Trends (Public & Rights Issues)
Category
Jun-15 May-15 2015-16$ 2014-15$
No.of
Issues
Amount
(` crore)
No.of
Issues
Amount
(` crore)
No.of
Issues
Amount
(` crore)
No.of
Issues
Amount
(` crore)
1 2 3 4 5 6 7 8 9
a. Public Issues 9 439 2 493 16 3,034 13 1,585
(i) Debt 0 0 0 0 2 710 6 1,341
(ii) Equity, of which
IPOs 9 439 2 493 14 2,324 7 244
FPOs 0 0 0 0 0 0 0 0b. Rights Issues 0 0 0 0 2 7,498 5 730
Total Equity Issues a(ii)+b 9 439 2 493 16 9,822 12 974
Grand Total (a+b) 9 439 2 493 18 10,532 18 2,315
Notes: 1. IPOs - Initial Public Offers, FPOs - Follow on Public Offers 2. Amount raised through debt issues for the last two months are provisional. 3. $ indicates as of last day on June of the respective year.Source: SEBI
In June 2015, two QIP issues garnered resources amounting to `1,507 crore as compared to three QIP issues raising ̀ 726 crore in May 2015. The cumulative amount mobilised through QIP allotments route during 2015-16, so far, stood at `3,265 crore(Details in Table 10).
B. Private Placement
I. QIPs Listed at BSE and NSE
QIP is an alternative mode of resource raising available for listed companies to raise funds from domestic market. In a QIP, a listed issuer issues equity shares or non-convertible debt instruments along with warrants and convertible securities other than warrants to Qualified Institutions Buyers only.
II. Preferential Allotments Listed at BSE and NSE
Preferential allotment also serves as an alternative mechanism of resource mobilization wherein a listed issuer issues shares or convertible securities, to a select group of persons. There were 38 preferential allotments (`1,506 crore) listed at BSE and NSE during
June 2015 as compared to 30 preferential allotments (`5,407 crore) in May 2015. The cumulative amount mobilised through preferential allotments route during 2015-16, so far, stood at ̀ 17,398 crore through 105 issues(Details in Table 11).

610
JULY SEBI BULLETIN 2015
III. Private Placement of Corporate Debt
Issuances in the corporate bond markets have increased significantly over the years. Private placement mechanism dominates the resource mobilization through corporate bonds. In June 2015, `36,125 crore was raised through private placement route in the corporate bond market. The cumulative amount mobilised through private placement of corporate debt during 2015-16, so far, stood at
`1,41,624 crore(Details in Table 12).During June 2015, the total amount mobilised through public issue and private placement of debt and equity combined stood at `39,577 crore as against `27,318 crore in May 2015. In 2015-16 (Apr-Jun),`1,72,818 crore was raised through primary market via public issues and private placement of debt and equity(Exhibit 1A).
Exhibit 1A: Total Resources Mobilised by Corporate Sector (Amount in `crore)
Month
Equity Issues Debt Issues Total
Resource
Mobilisation
(4+7)
Public &
Rights
Private
Placements
TotalPublic
Private
Placements
Total
(2+3) (5+6)
1 2 3 4 5 6 7 8
2014-15 9,789 57,362 67,151 9,413 4,04,136 4,13,492 4,80,643
2015-16$ 9,822 20,663 30,484 710 1,41,624 1,42,334 1,72,818
Apr-15 8,890 11,517 20,406 710 84,807 85,517 1,05,923
May-15 493 6,133 6,626 0 20,692 20,692 27,318
Jun-15 439 3,013 3,452 0 36,125 36,125 39,577Notes: 1. Private placement of Equity includes, amount raised through preferential allotments, QIP and IPP mechanism, 2. Public Equity Issues includes IPO, FPO & Rights issues of common equity shares. Source: SEBI
IV. Resource Mobilisation by Mutual Funds
In June 2015, there was net outflow from mutual funds amounting to `25,086 crore. While net outflow from private sector mutual funds was `14,688 crore, that from public sector mutual funds was `10,398 crore. During April-June 2015, the total amount raised by all mutual funds was `85,726 crore, of which, the share of private sector mutual funds was 76.7 per cent and public sector mutual funds was 23.3 percent. Of the total amount mobilized in 2015-16 so
far, debt funds accounted for 55 percent, followed by growth/equity funds 38.7 percent and the remaining by balanced schemes. The ETF and FoF schemes have registered net outflows in 2015-16 so far (April-June). The cumulative assets under management by all mutual funds declined by 2.5. percent to `11,73,293 crore as on June 30, 2015 from `12,03,547 crore as on May 29,2015(Details in Table 64).
II. Trends in the Secondary Market
Indian benchmark indices closed the month on a subdued note weighed by persistent FII selling, weak rupee, rising crude oil prices and discouraging global cues stemming from the deadlock on Greece crisis. The RBI cut the key repo rate by 25 bps to 7.25% in its June 2nd meeting stating that the move is appropriate given low capacity utilization, mixed indicators of recovery, and subdued investment and
credit growth. During June 2015, the benchmark indices, BSE Sensex and CNX Nifty declined by 0.17 and 0.77 percent to close at 27780.8 and 8368.5 respectively on June 30,2015 (Figure 1). Sensex and Nifty touched their respective intraday highs of 27959.4 and 8467.15 on June 01, 2015 and intraday lows of 26307.1 and 7940.30 on June 12, 2015.

611
JULY SEBI BULLETIN 2015
Figure 1: Movement of Sensex and Nifty
Reflecting the downward slide of indices, the market capitalisation of BSE and NSE declined by 1.8 percent and 1.7 percent to `1,01,43,511 crore and `98,49,076 crore, respectively, at the end of June 2015 from `1,03,26,686 crore and `1,00,20,665 crore recorded at
the end of May 2015 . The P/E ratios of BSE Sensex and S&P CNX Nifty were 20.7 and 23.1, respectively at the end of June 2015 compared to 19.9 and 22.1 a month ago (Exhibit 2).
Exhibit 2: The Basic Indicators in Cash Segment
Particulars 2014-15 2015-16$ May-15 Jun-15Percentage change
over previous month
1 2 3 4 5 6
A. Indices
S & P BSE Sensex 27957.5 27780.8 27828.4 27780.8 -0.2 CNX Nifty 8606.6 8368.5 8433.7 8368.5 -0.8B. Market Capitalisation (`crore)
BSE 1,01,49,290 1,01,43,511 1,03,26,686 1,01,43,511 -1.8 NSE 99,30,122 98,49,076 1,00,20,665 98,49,076 -1.7C. Gross Turnover (` crore)
BSE 8,54,845 1,88,396 60,605 60,370 -0.4 NSE 32,06,392 10,74,573 3,61,935 3,33,289 -7.9D. P/E Ratio
S & P BSE Sensex 18.7 20.7 19.9 20.7 4.3 CNX Nifty 22.7 23.1 22.1 23.1 4.7E. No. of Listed Companies
BSE 5,624 5,688 5,672 5,688 0.3 NSE 1,733 1,750 1,749 1,750 0.1
$ indicates as on last day of June of the respective year.Source: BSE, NSE
The monthly turnover of BSE (cash segment) decreased by 0.4 percent from `60,605 crore in May 2015 to `60,370 crore in June 2015. The monthly
turnover of NSE (cash segment) decreased by 7.9 percent from `3,61,935 crore in May 2015 to `3,33,289 crore in June 2015 (Figures 2 and 3).

612
JULY SEBI BULLETIN 2015
Figure 2: Trends in Average Daily value of Sensex and BSE Turnover
Figure 3: Trends in Average Daily Values of Nifty and NSE Turnover
In consonance with the broad market indices, there was a general downward movement in sectoral and other indices also. At the end of June 2015, while 12 of 15 BSE indices recorded negative return, three of the indices closed positive. Among BSE indices, BSE Capital Goods index rose highest by 4.3 percent followed by BSE Oil & Gas index (2.2 percent), BSE Consumer Durables (0.7 percent).At NSE, three indices under consideration closed negative in June 2015. Among NSE indices, in June 2015, CNX Media
index rose highest by 6.2 percent followed by CNX Infrastructure (1.0 percent) and CNX MNC index (0.8 percent).During June 2015, the daily volatility of BSE Consumer Durables index was highest at 1.4 percent followed by BSE Bankex and BSE FMCG index at 1.3 percent. At NSE, among all the indices, daily volatility of CNX Finance and CNX Pharma was the highest at 1.4 percent during June 2015 (Exhibit 3).

613
JULY SEBI BULLETIN 2015
Exhibit 3: Performance of Indices at BSE and NSE during June 2015 (Percent)
BSE NSE
Index Change over
Previous monthVolatility Index
Change over Previous month
Volatility
1 2 3 4 5 6BSE Sensex -0.2 1.0 CNX Nifty -0.8 1.0BSE 100 -1.0 1.0 CNX Nifty Junior -0.3 1.0BSE 200 -0.9 1.0 CNX 500 -0.9 1.0BSE 500 -1.1 1.0 CNX Mid-cap -1.3 1.1BSE Small Cap -1.8 1.1 CNX 100 -0.7 1.0BSE FMCG -0.7 1.3 CNX Defty -0.8 1.1BSE Consumer Durables 0.7 1.4 CNX IT -4.6 1.1BSE Capital Goods 4.3 1.2 CNX Bank -2.3 1.3BSE Bankex -2.5 1.3 Nifty Mid-cap 50 -4.7 1.3BSE Teck -3.2 0.8 CNX Infrastructure 1.0 1.0BSE Oil & Gas 2.2 1.1 CNX PSE -1.1 0.8BSE Metal -4.0 1.2 CNX Finance -0.4 1.4BSE Auto -1.9 1.1 CNX Pharma -2.5 1.4BSE PSU -2.3 1.0 CNX Media 6.2 1.3BSE Healthcare -2.0 1.2 CNX MNC 0.8 1.0
Source: BSE and NSE
III. Trends in Depository Accounts
The total number of investor accounts was 139.0 lakh at NSDL and 98.4 lakh at CDSL at the end of June 2015. In June 2015, the number of investor accounts at NSDL and CDSL increased by 0.5 percent and 0.8 percent, respectively, over the previous month.
A comparison with June 2014 showed there was an increase in the number of investor accounts to the extent of 5.4 percent at NSDL and 10.7 percent at CDSL (Details in Table 70).
IV. Trends in Derivatives Segment
A. Equity Derivatives
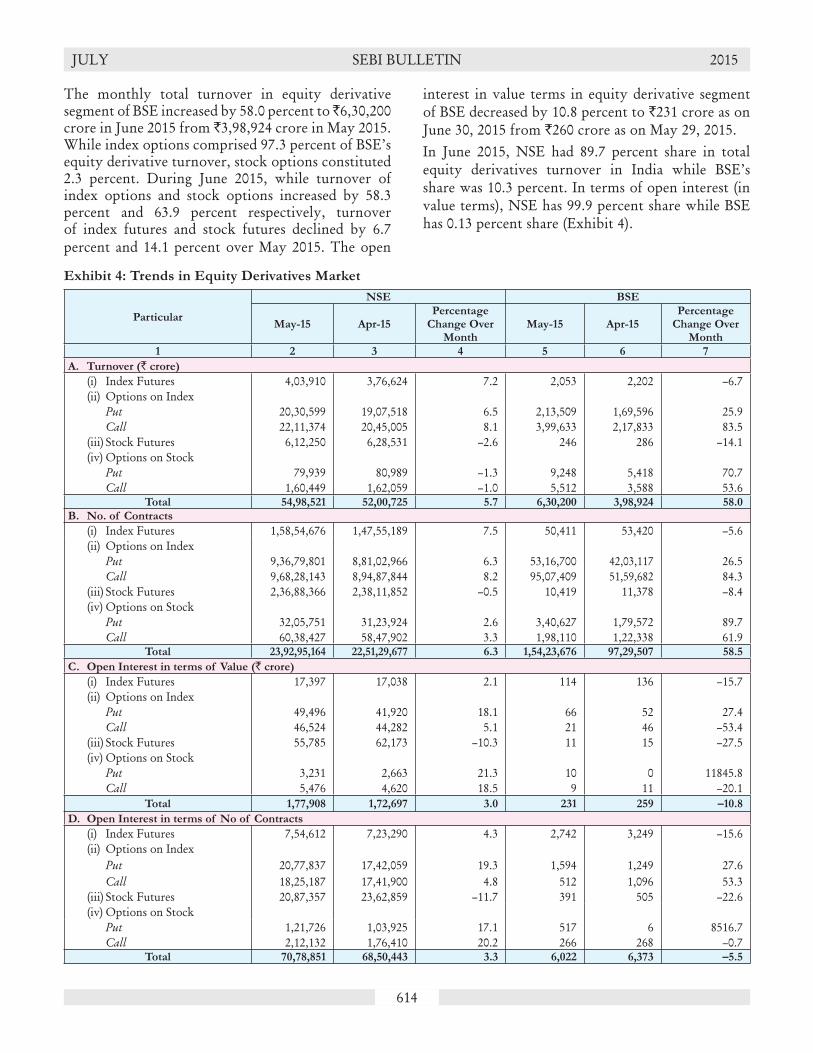
India is one of the vibrant market for exchange traded equity derivatives in the world. This is reiterated in the huge trading volumes and turnover recorded at the end of every month. The trading volumes in the equity derivative market surpassed that of the cash segment turnover by 15.6 times in June 2015. The monthly total turnover in equity derivative market at NSE increased by 5.7 percent to `54,98,521 crore in June 2015 from `52,00,725 crore in May 2015 (Figure 4). The index options segment has been the clear leader in the product-wise turnover of the
futures and options segment in the NSE. In June 2015, the turnover in the index options category was 77.2 percent of the total turnover in the F&O segment of the NSE. During June 2015, while turnover of index future and index options increased by 7.2 percent and 7.3 percent respectively, turnover of stock futures and stock options declined by 2.6 and 1.1 percent over May 2015. The open interest in value terms in equity derivative segment of NSE increased by 3.0 percent to `1,77,908 crore as on June 30, 2015 from `1,72,697 crore as on May 29, 2015.
Figure 4: Trends of Equity Derivatives Segment at NSE (`crore)
614
JULY SEBI BULLETIN 2015
The monthly total turnover in equity derivative segment of BSE increased by 58.0 percent to ̀ 6,30,200 crore in June 2015 from `3,98,924 crore in May 2015. While index options comprised 97.3 percent of BSE’s equity derivative turnover, stock options constituted 2.3 percent. During June 2015, while turnover of index options and stock options increased by 58.3 percent and 63.9 percent respectively, turnover of index futures and stock futures declined by 6.7 percent and 14.1 percent over May 2015. The open
interest in value terms in equity derivative segment of BSE decreased by 10.8 percent to `231 crore as on June 30, 2015 from `260 crore as on May 29, 2015.In June 2015, NSE had 89.7 percent share in total equity derivatives turnover in India while BSE’s share was 10.3 percent. In terms of open interest (in value terms), NSE has 99.9 percent share while BSE has 0.13 percent share (Exhibit 4).
Exhibit 4: Trends in Equity Derivatives Market
Particular
NSE BSE
May-15 Apr-15Percentage
Change Over Month
May-15 Apr-15Percentage
Change Over Month
1 2 3 4 5 6 7
A. Turnover (` crore)
(i) Index Futures 4,03,910 3,76,624 7.2 2,053 2,202 –6.7 (ii) Options on Index Put 20,30,599 19,07,518 6.5 2,13,509 1,69,596 25.9 Call 22,11,374 20,45,005 8.1 3,99,633 2,17,833 83.5 (iii) Stock Futures 6,12,250 6,28,531 –2.6 246 286 –14.1 (iv) Options on Stock Put 79,939 80,989 –1.3 9,248 5,418 70.7 Call 1,60,449 1,62,059 –1.0 5,512 3,588 53.6
Total 54,98,521 52,00,725 5.7 6,30,200 3,98,924 58.0
B. No. of Contracts
(i) Index Futures 1,58,54,676 1,47,55,189 7.5 50,411 53,420 –5.6 (ii) Options on Index Put 9,36,79,801 8,81,02,966 6.3 53,16,700 42,03,117 26.5 Call 9,68,28,143 8,94,87,844 8.2 95,07,409 51,59,682 84.3 (iii) Stock Futures 2,36,88,366 2,38,11,852 –0.5 10,419 11,378 –8.4 (iv) Options on Stock Put 32,05,751 31,23,924 2.6 3,40,627 1,79,572 89.7 Call 60,38,427 58,47,902 3.3 1,98,110 1,22,338 61.9
Total 23,92,95,164 22,51,29,677 6.3 1,54,23,676 97,29,507 58.5
C. Open Interest in terms of Value (` crore)
(i) Index Futures 17,397 17,038 2.1 114 136 –15.7 (ii) Options on Index Put 49,496 41,920 18.1 66 52 27.4 Call 46,524 44,282 5.1 21 46 –53.4 (iii) Stock Futures 55,785 62,173 –10.3 11 15 –27.5 (iv) Options on Stock Put 3,231 2,663 21.3 10 0 11845.8 Call 5,476 4,620 18.5 9 11 –20.1
Total 1,77,908 1,72,697 3.0 231 259 –10.8
D. Open Interest in terms of No of Contracts
(i) Index Futures 7,54,612 7,23,290 4.3 2,742 3,249 –15.6 (ii) Options on Index Put 20,77,837 17,42,059 19.3 1,594 1,249 27.6 Call 18,25,187 17,41,900 4.8 512 1,096 53.3 (iii) Stock Futures 20,87,357 23,62,859 –11.7 391 505 –22.6 (iv) Options on Stock Put 1,21,726 1,03,925 17.1 517 6 8516.7 Call 2,12,132 1,76,410 20.2 266 268 –0.7
Total 70,78,851 68,50,443 3.3 6,022 6,373 –5.5
615
JULY SEBI BULLETIN 2015
B. VIX Futures at NSE
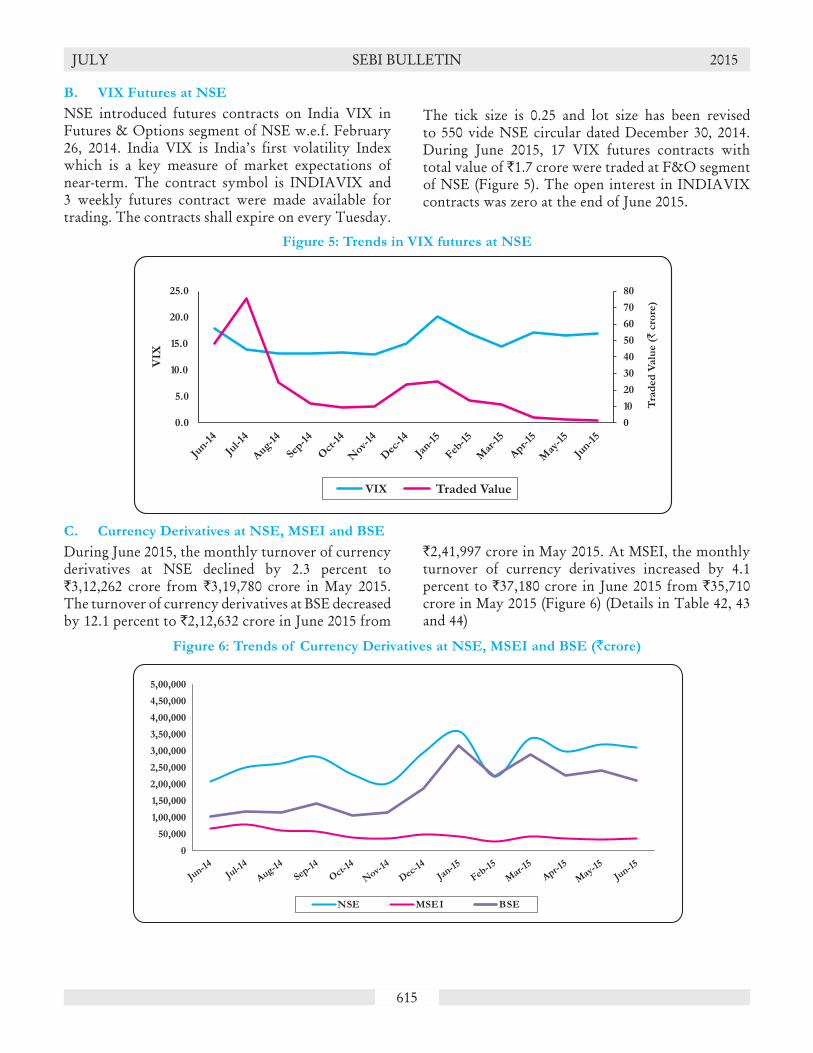
NSE introduced futures contracts on India VIX in Futures & Options segment of NSE w.e.f. February 26, 2014. India VIX is India’s first volatility Index which is a key measure of market expectations of near-term. The contract symbol is INDIAVIX and 3 weekly futures contract were made available for trading. The contracts shall expire on every Tuesday.
The tick size is 0.25 and lot size has been revised to 550 vide NSE circular dated December 30, 2014. During June 2015, 17 VIX futures contracts with total value of `1.7 crore were traded at F&O segment of NSE (Figure 5). The open interest in INDIAVIX contracts was zero at the end of June 2015.
Figure 5: Trends in VIX futures at NSE
C. Currency Derivatives at NSE, MSEI and BSE
During June 2015, the monthly turnover of currency derivatives at NSE declined by 2.3 percent to `3,12,262 crore from `3,19,780 crore in May 2015. The turnover of currency derivatives at BSE decreased by 12.1 percent to `2,12,632 crore in June 2015 from
`2,41,997 crore in May 2015. At MSEI, the monthly turnover of currency derivatives increased by 4.1 percent to `37,180 crore in June 2015 from `35,710 crore in May 2015 (Figure 6) (Details in Table 42, 43 and 44)
Figure 6: Trends of Currency Derivatives at NSE, MSEI and BSE (`crore)

616
JULY SEBI BULLETIN 2015
D. Interest Rate Derivatives at NSE, BSE and MSEI
Interest Rate Futures (IRFs) at NSE recorded a trading value of `62,055 crore in June 2015, an increase of 20.1 percent from `51,663 crore recorded in May 2015. IRFs at BSE recorded a trading value of `3,665 crore in June 2015, a decrease of 51.5 percent from
`3,031 crore in May 2015. IRFs at MSEI recorded a rise of 38.9 percent to `2,969 crore in June 2015 compared to `2,137 crore in May 2015 (Figure 7) (Details in Table 55)
Figure 7: Trends of Interest Rate Derivatives at NSE, BSE and MSEI (` crore)
V. Trading in Corporate Debt Market
During June 2015, 1,552 trades with a traded value of `18,102 crore was reported on BSE compared to 1,453 trades with a value of `18,934 crore reported in May 2015. At NSE, 4,613 trades were reported
in June 2015 with a traded value of `65,002 crore compared to 4,519 trades with value of `61,135 crore in May 2015 (Figure 8) (Details in Table 13).
Figure 8: Trends in Reported Turnover of Corporate Bonds (` crore)
617
JULY SEBI BULLETIN 2015
VI. Trends in Institutional Investment
There was a mixed trend in investment by the institutional investors in June 2015. While mutual
fund investment in the stock markets were positive, FIIs net investment was negative.
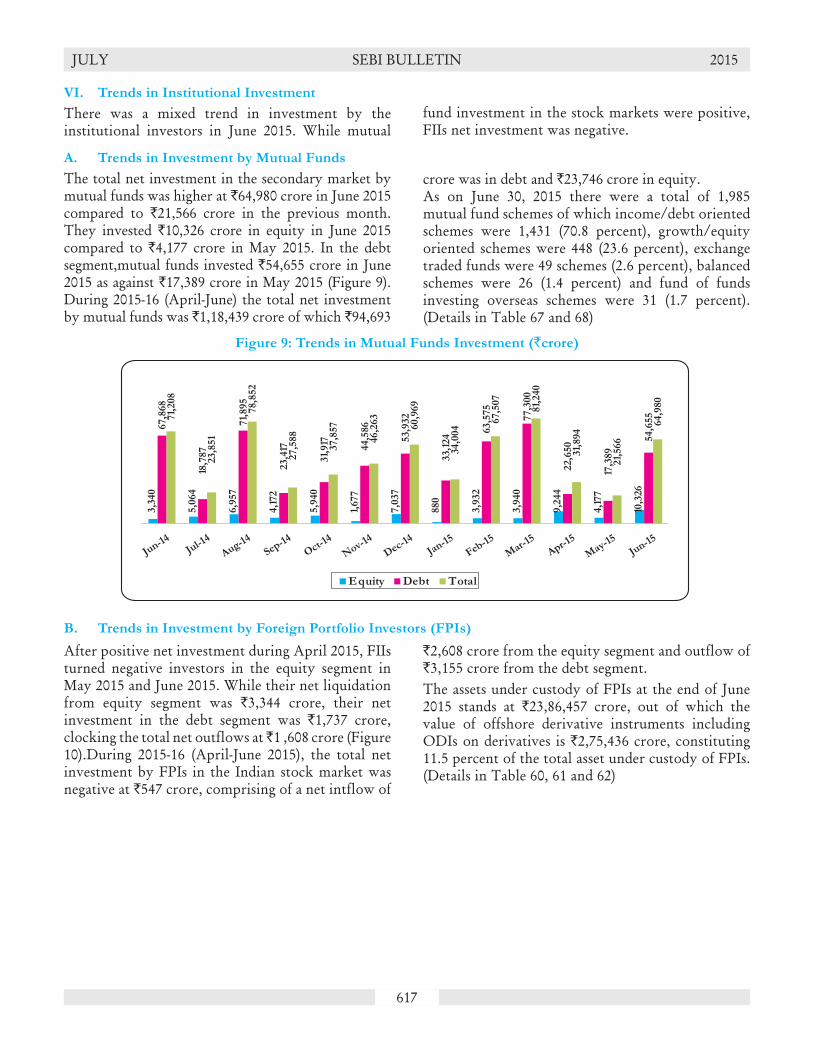
A. Trends in Investment by Mutual Funds
The total net investment in the secondary market by mutual funds was higher at `64,980 crore in June 2015 compared to `21,566 crore in the previous month. They invested `10,326 crore in equity in June 2015 compared to `4,177 crore in May 2015. In the debt segment,mutual funds invested `54,655 crore in June 2015 as against `17,389 crore in May 2015 (Figure 9). During 2015-16 (April-June) the total net investment by mutual funds was `1,18,439 crore of which `94,693
crore was in debt and `23,746 crore in equity.As on June 30, 2015 there were a total of 1,985 mutual fund schemes of which income/debt oriented schemes were 1,431 (70.8 percent), growth/equity oriented schemes were 448 (23.6 percent), exchange traded funds were 49 schemes (2.6 percent), balanced schemes were 26 (1.4 percent) and fund of funds investing overseas schemes were 31 (1.7 percent). (Details in Table 67 and 68)
Figure 9: Trends in Mutual Funds Investment (`crore)
After positive net investment during April 2015, FIIs turned negative investors in the equity segment in May 2015 and June 2015. While their net liquidation from equity segment was `3,344 crore, their net investment in the debt segment was `1,737 crore, clocking the total net outflows at ̀ 1 ,608 crore (Figure 10).During 2015-16 (April-June 2015), the total net investment by FPIs in the Indian stock market was negative at `547 crore, comprising of a net intflow of
B. Trends in Investment by Foreign Portfolio Investors (FPIs)
`2,608 crore from the equity segment and outflow of `3,155 crore from the debt segment.The assets under custody of FPIs at the end of June 2015 stands at `23,86,457 crore, out of which the value of offshore derivative instruments including ODIs on derivatives is `2,75,436 crore, constituting 11.5 percent of the total asset under custody of FPIs. (Details in Table 60, 61 and 62)

618
JULY SEBI BULLETIN 2015
Total assets under management (AUM) of portfolio management services (PMS) industry has increased by 1.2 percent to `9,57,309 crore in June 2015 from `9,46,198 crore in May 2015. As on June 30, 2015, AUM of discretionary PMS constitute 75.7 percent of the total AUM followed by advisory PMS (19.1 percent) and non-discretionary PMS (5.2 percent).
In terms of number of clients, discretionary services category leads with total of 43,217 clients, out of 50,036 clients in PMS industry, followed by advisory services category with 3,492 clients and non-discretionary category with 3,327 clients. (Details in
Table 69)
VII. Trends in Portfolio Management Services
VIII. Trends in Substantial Acquisition of Shares and Takeovers
In June 2015, 10 open offers with offer value of `253 crore were made to the public as against five open
offers with offer value of `18 crore in May 2015.
Figure 10: Trends in FPIs Investment (`crore)

619
JULY SEBI BULLETIN 2015
Global Markets Review
Introduction:
1.1. As per revised estimates of real GDP, the magnitude of economic contraction in United States reduced significantly in first quarter of 2015. Decline in exports, fixed investments and government spending amid adverse domestic conditions such as poor weather and port shut down lead weak economic activity in United States in Q1 2015. The third estimates of real GDP in United Kingdom showed an upward growth for first quarter of 2015, mainly due to adoption of new methods for measuring output. Japanese economy recorded modest growth during the quarter. As regards Euro Area, Greece remained the cause of concern as it defaulted on an IMF loan repayment due at the end of June 2015. Breakdown of the talks between Greece and its creditors led the high volatility in financial markets. Stock markets across the globe plummeted following the resurfaced Greece crisis. During June 2015, equity markets across the world witnessed downward trend. Stock market in major economies viz., United States, United Kingdom, Germany, France, Japan Australia, China, Russia etc., recorded steep fall during the month; while, stock market in India witnessed marginal fall during the month.
2. The World Economy:
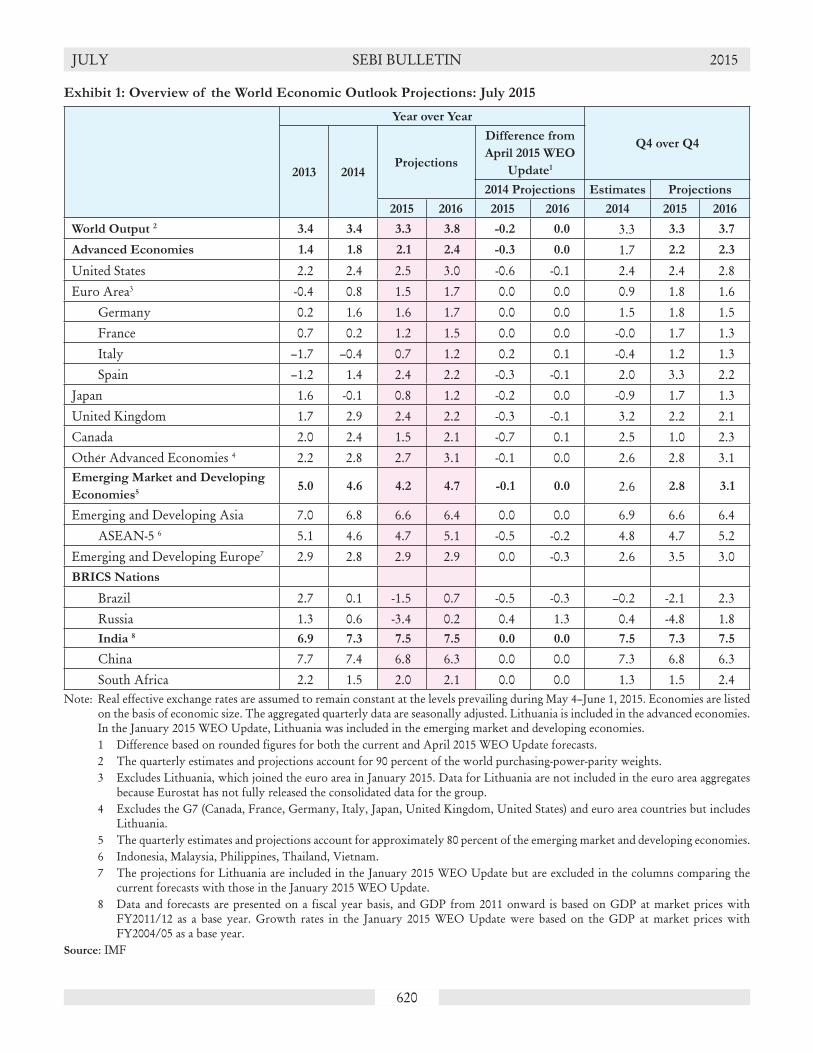
2.1. Global economy is estimated to grow at a marginally lower rate in 2015, as compared to 2014. IMF, in its World Economic Outlook (WEO) update - July 2015, has reduced the world economic growth projections for year 2015 by 0.2 percentage points to 3.3 per cent, as compared to a growth of 3.4 per cent in 2014. The downward revision in the global growth projection for 2015 was mainly due to slowdown in US economy during the first quarter of 2015.
2.2. The October 2014 WEO update by IMF projects the growth in advanced economies at 2.1 per cent in 2015 and 2.4 per cent in 2016. While, the growth rate projections for emerging markets and developing economies for 2015 and 2016 stood at 4.2 per cent and 4.7 per cent, respectively. The projection for real GDP growth in India is 7.5 per cent in both 2015 and 2016. (Exhibit 1)
United States:
• According to the “third” estimate by BEA, quarterly real GDP contracted by 0.04% (Q-o-Q) in Q1 of 2015.
• Annual CPI inflation grew to 0.1% in June 2015 from 0.0 per cent in previous month.
• In June 2015, the unemployment rate stood at 5.3%.
United Kingdom
• According to “third” estimate by ONS, UK GDP growth rate was 0.4% (Q-o-Q) during Q1, 2015.
• Annual CPI inflation stood at 0.0% in June 2015.• The unemployment rate stood at 5.6% for March 2015 to
May 2015’ period.
Japan:
• According to “second” preliminary estimate by Cabinet Office of Japan, GDP expanded by 1.0 % (Q-o-Q) in Q1, 2015. In annualize terms it grew by 3.9% in Q1, 2015.
• CPI inflation slowed down to 0.5% in May 2015 from 0.6% in previous month.
• Unemployment rate was unchanged at 3.3% in May 2015.
Euro Zone:
• According to the “second” estimate by the Eurostat, real GDP (Q-o-Q) grew at 0.4% in both Euro Area (EA18) and EU28 during Q1, 2015.
• During June 2015, annual inflation in Euro Area and EU28 fell to 0.2 per cent and 0.1 per cent respectively.
• During May 2014, unemployment rate in the EA18 and EU28 were 11.1% and 9.6%, respectively.
BRIC Nations:
• Real GDP of Brazil fell by 0.1% (Q-o-Q) in Q1 of 2015. Annual CPI inflation grew to 8.9% in June 2015. Unemployment increased to 6.7% in May 2015.
• Russia’s real GDP growth was -2.3% (Y-o-Y) during Q1 of 2015. Annual CPI inflation decreased to 15.3% in June 2015. Unemployment rate in Russia decreased to 5.8% in April 2015 from 5.9% in previous month.
• India’s real GDP grew by 7.5% (Y-o-Y) in Q4 of 2014-15 (new series). IIP grew by 2.7% (Y-o-Y) in May 2015. The headline WPI inflation stood at -2.4% in June 2015.
• During Q2 2015, real GDP of China grew by 7.0% (Y-o-Y). In June 2015, the annual CPI inflation grew to 1.4% from 1.2% in previous month.
Snapshots
620
JULY SEBI BULLETIN 2015
Exhibit 1: Overview of the World Economic Outlook Projections: July 2015
Year over Year
Q4 over Q4
2013 2014Projections
Difference from
April 2015 WEO
Update1
2014 Projections Estimates Projections
2015 2016 2015 2016 2014 2015 2016
World Output 2 3.4 3.4 3.3 3.8 -0.2 0.0 3.3 3.3 3.7
Advanced Economies 1.4 1.8 2.1 2.4 -0.3 0.0 1.7 2.2 2.3
United States 2.2 2.4 2.5 3.0 -0.6 -0.1 2.4 2.4 2.8Euro Area3 -0.4 0.8 1.5 1.7 0.0 0.0 0.9 1.8 1.6 Germany 0.2 1.6 1.6 1.7 0.0 0.0 1.5 1.8 1.5 France 0.7 0.2 1.2 1.5 0.0 0.0 -0.0 1.7 1.3 Italy –1.7 –0.4 0.7 1.2 0.2 0.1 -0.4 1.2 1.3 Spain –1.2 1.4 2.4 2.2 -0.3 -0.1 2.0 3.3 2.2Japan 1.6 -0.1 0.8 1.2 -0.2 0.0 -0.9 1.7 1.3United Kingdom 1.7 2.9 2.4 2.2 -0.3 -0.1 3.2 2.2 2.1Canada 2.0 2.4 1.5 2.1 -0.7 0.1 2.5 1.0 2.3Other Advanced Economies 4 2.2 2.8 2.7 3.1 -0.1 0.0 2.6 2.8 3.1Emerging Market and Developing
Economies55.0 4.6 4.2 4.7 -0.1 0.0 2.6 2.8 3.1
Emerging and Developing Asia 7.0 6.8 6.6 6.4 0.0 0.0 6.9 6.6 6.4 ASEAN-5 6 5.1 4.6 4.7 5.1 -0.5 -0.2 4.8 4.7 5.2Emerging and Developing Europe7 2.9 2.8 2.9 2.9 0.0 -0.3 2.6 3.5 3.0BRICS Nations
Brazil 2.7 0.1 -1.5 0.7 -0.5 -0.3 –0.2 -2.1 2.3 Russia 1.3 0.6 -3.4 0.2 0.4 1.3 0.4 -4.8 1.8 India 8 6.9 7.3 7.5 7.5 0.0 0.0 7.5 7.3 7.5
China 7.7 7.4 6.8 6.3 0.0 0.0 7.3 6.8 6.3 South Africa 2.2 1.5 2.0 2.1 0.0 0.0 1.3 1.5 2.4
Note: Real effective exchange rates are assumed to remain constant at the levels prevailing during May 4–June 1, 2015. Economies are listed on the basis of economic size. The aggregated quarterly data are seasonally adjusted. Lithuania is included in the advanced economies. In the January 2015 WEO Update, Lithuania was included in the emerging market and developing economies.
1 Difference based on rounded figures for both the current and April 2015 WEO Update forecasts. 2 The quarterly estimates and projections account for 90 percent of the world purchasing-power-parity weights. 3 Excludes Lithuania, which joined the euro area in January 2015. Data for Lithuania are not included in the euro area aggregates
because Eurostat has not fully released the consolidated data for the group. 4 Excludes the G7 (Canada, France, Germany, Italy, Japan, United Kingdom, United States) and euro area countries but includes
Lithuania. 5 The quarterly estimates and projections account for approximately 80 percent of the emerging market and developing economies. 6 Indonesia, Malaysia, Philippines, Thailand, Vietnam. 7 The projections for Lithuania are included in the January 2015 WEO Update but are excluded in the columns comparing the
current forecasts with those in the January 2015 WEO Update. 8 Data and forecasts are presented on a fiscal year basis, and GDP from 2011 onward is based on GDP at market prices with
FY2011/12 as a base year. Growth rates in the January 2015 WEO Update were based on the GDP at market prices with FY2004/05 as a base year.
Source: IMF

621
JULY SEBI BULLETIN 2015
Exhibit 2: Major Macroeconomic Indicators
Country / Region
Quarterly Growth Rate of Real
GDP Annual CPI
Inflation Rate
Unemployment
Rate
Benchmark
Interest RateQ-o-Q Y-o-Y
Deve
lop
ed
Eco
no
mie
s
OECD 0.30 (Q1) 1.90 (Q1) 0.56 (May) 6.9 (May) NAUSA -0.04 (Q1) 2.88 (Q1) 0.10 (June) 5.30 (June) 0.25UK 0.37 (Q1) 2.86 (Q1) 0.00 (June) 5.60 (Mar-May) 0.50Japan 0.97 (Q1) -0.98 (Q1) 0.50 (May) 3.30 (May) 0.00Euro Area (EA18) 0.37 (Q1) 1.01 (Q1) 0.20 (June) 11.10 (May) 0.05European Union (EU28) 0.44 (Q1) 1.45 (Q1) 0.10 (June) 9.60 (May) NA
BR
IC
Brazil -0.10 (Q1) -1.60 (Q1) 8.89 (June) 6.70 (May) 13.75Russia NA -2.29 (Q1) 15.30 (June) 5.80 (Apr) 11.50India* NA 7.50 (Q1) -2.40 (June) NA 7.25China 1.70 (Q2) 7.00 (Q2) 1.40 (June) NA 4.85
Oth
er
EM
Es Korea 0.83 (Q1) 2.41 (Q1) 0.68 (Jun) 3.90 (May) 1.50
Indonesia 1.12 (Q1) 4.77 (Q1) 7.26 (Jun) NA 7.50Turkey 1.30 (Q1) 2.47 (Q1) 7.20 (Jun) 10.10 (Feb) 7.50
Note: Months mentioned in bracket are for the Year-2015.
(Q1), (Q2) represent first and second quarter of 2015, respectively.
* Wholesale Price Index (WPI) inflation data is considered for measuring inflation in India. NA – Not Available
Source: Official Database & Central Banks of respective countries, OECD
Organisation for Economic Co-operation and Development (OECD):
2.3. As per the provisional estimates released by OECD, quarterly real GDP in the OECD countries grew by 0.3 per cent Quarter-on-Quarter (Q-o-Q) in Q1 2015, down from 0.5 per cent in Q4 2014. Compared with first quarter of 2014, the real GDP grew by 1.9 per cent Year-on-Year (Y-o-Y) during the first quarter of 2015 (as compared to 1.8 per cent in previous quarter). Among major economies of OECD Area, real GDP growth (Q-o-Q) for Q1 2015, slowed down in United States to -0.04 per cent (from 0.6 per cent in Q4, 2014), United Kingdom to 0.4 per cent (from 0.6 per cent in Q4, 2014) and Germany to 0.3 per cent (from 0.7 per cent in Q4, 2014). On the other hand, during Q1, 2015, the growth (Q-o-Q) picked up strongly in France (to 0.6 per cent from 0.0 per cent in Q4, 2014), Japan (to 1.0 per cent from 0.3 per cent in Q4, 2014) and Italy (to 0.3 per cent from 0.0 per cent in Q4, 2014). In European Union, GDP growth (Q-o-Q) was stable at 0.4 per cent in the first quarter of 2015, while in Euro Area it continued to show marginal improvements and grew to 0.4 per cent in Q1, 2015 from 0.3 per cent in previous quarter.
2.4. Annual inflation in OECD countries grew to 0.6 per cent in May 2015 from 0.4 per cent in previous month. During the month, energy prices fell by 10.0 per cent in the year to May 2015, while the Food price inflation slowed down to 1.6 per cent. Excluding food and energy, the annual inflation in these countries was stable at 1.6 per cent in May 2015. Among major OECD countries, annual inflation during May 2015, increased in France (to 0.3 per cent from 0.1 per cent), Germany (to 0.7 per cent from 0.5 per cent), Italy (to 0.1 per cent from -0.1 per cent), United Kingdom (to 0.1 per cent from -0.1 per cent) and United States (to 0.0 per cent from -0.2 per cent). On the other hand, annual inflation slowed down in Japan to 0.5 per cent in May 2015 from 0.6 per cent in previous month. Latest data for the month of June 2015 shows that the inflation rate in United States grew to 0.1 per cent.
2.5. As regards employment situation, during May 2015, the OECD unemployment rate remained stable at 6.9 per cent for the third consecutive month (Exhibit 2). In May 2015, the unemployment rate was stable in Canada

622
JULY SEBI BULLETIN 2015
( at 6.8 per cent) and Japan ( at 3.3 per cent), while it grew in the United States (by 0.1 percentage point, to 5.5 per cent) and Mexico (by 0.1 percentage point, to 4.5 per cent). Latest data referring to the month of June 2015 shows that the unemployment rate in United States decreased to 5.3 per cent.
2.6. OECD Composite Leading Indicators (CLIs), designed to anticipate turning points in economic
activity relative to trend, continue to point to firming growth in the Euro area and stable growth momentum in Germany, Japan and India. On the other hand, the CLIs point to easing growth in the United States, Canada, China as well as the United Kingdom. The CLI for Russia shows tentative signs of a positive change in growth momentum while in Brazil the CLI continues to point to a loss in growth momentum.
Chart 1: Quarter-on-Quarter seasonally adjusted real GDP growth rate of developed nations and regions (per cent)
Source: OECD
Chart 2: Year-on-Year Consumer Price Inflation* (per cent)
Note: * Wholesale Price Index (WPI) inflation is considered for measuring inflation in India
Source: OECD, Office of Economic Advisor to Government of India

623
JULY SEBI BULLETIN 2015
United States:
2.7. According to the “third” estimate released by the Bureau of Economic Analysis (BEA), real gross domestic product of the United States contracted at an annual rate of 0.2 per cent in the first quarter of 2015, against a growth of 2.2 per cent in fourth quarter of 2014. Real GDP fell by 0.04 per cent (Q-o-Q) during the quarter ending March 2015, as compared with a growth of 0.6 per cent in previous quarter. On comparing with the first quarter of 2014, the real GDP grew by 2.9 per cent in the Q1 of 2015, against a growth of 2.4 per cent (Y-o-Y) in Q4 of 2014. During first quarter of 2015, the decrease in the annual GDP reflected negative contributions from exports, non-residential fixed investment, and state and local government spending that were partly offset by positive contributions from personal consumption expenditures (PCE), private inventory investment, and residential fixed investment.
2.8. During June 2015, U.S. manufacturing sector business activities continued to grow but at a slower pace compared to previous month. Markit U.S. Manufacturing PMI stood at 53.6 in June 2015 as compared to 54.0 in previous month (PMI above 50 mark indicates an expansion in business activity). On the other hand, Markit U.S. Services PMI grew to 58.5 from 56.5 in May 2015.
2.9. As per data released by the Bureau of Labor Statistics, the annual consumer price inflation grew to 0.1 per cent in June 2015 as compared to 0.0 per cent in previous month. Compared with previous month, consumer price index increased by 0.3 per cent (M-o-M) in June 2015. The annual core inflation, i.e. prices of all items excluding food and energy, grew by 1.8 per cent during June 2015, as compared to 1.7 per cent in previous month. The food price index grew by 1.8 per cent, while the energy price index fell by 15.0 per cent over last 12 months ending June 2015. The unemployment rate fell to 5.3 per cent in June 2015 from 5.5 per cent in previous month
2.10. The Federal Open Market Committee (FOMC) during its meeting in June 2015 reaffirmed its view that the federal funds rate in the target range of 0 to 0.25 per cent remains appropriate
for a considerable time. The Committee will assess progress toward its objectives of maximum employment and 2 percent target inflation. The Committee is maintaining its existing policy of reinvesting principal payments from its holdings of agency debt and agency mortgage backed securities in agency mortgage backed securities and of rolling over maturing Treasury securities at auction. This policy, of keeping the Committee’s holdings of longer term securities at sizable levels, is intended to maintain accommodative financial conditions.
2.11. Observations: Adverse domestic conditions such as poor weather and port shut down lead weak economic activity in United States during the first quarter of 2015. Manufacturing and services sector business activities were affected due to fall in export orders and lower investment spending. However, GDP growth in second quarter of 2015 is expected to revive due to surge in consumer spending.
United Kingdom:
2.12. As per the “third” estimate of real GDP, released by the Office for National Statistics, U.K., the real GDP during first quarter of 2015, increased by 0.4 per cent (Q-o-Q) against 0.8 per cent in previous quarter. Compared to first quarter of 2014, the real GDP grew by 2.9 per cent (Y-o-Y) during Q1 2015. During the first quarter of 2015, output increased by 0.4 per cent in services sector and by 0.2 per cent in production sector. While the output declined by 0.2 per cent in construction, and by 2.3 per cent in agriculture sector. In 2014, the annual real GDP growth was recorded at 3.0 per cent. During June 2015, expansion in manufacturing sector business slowed down in U.K. and the Markit UK Manufacturing PMI decreased to 51.4 from 51.9 in previous month. On the contrary, growth in service sector picked up during the month. The UK Services PMI grew to 58.5 in June 2015 from 56.5 in previous month.
2.13. As regards the price situation, annual CPI inflation stood at 0.0 per cent in June 2015 from 0.1 per cent in previous month. The fall in CPI inflation was contributed to decline in price

624
JULY SEBI BULLETIN 2015
of clothing and food prices. Bank of England’s Monetary Policy Committee at its meeting on July 09, 2015, maintained the official Bank Rate paid on commercial bank reserves unchanged at 0.5 per cent and decided to continue the stock of asset purchases, financed by the issuance of central bank reserves at £375 billion. The unemployment rate of the economically active population grew to 5.6 per cent for period from March 2015 to May 2015.
2.14. Observations: The third estimate of real GDP showed significant upward revision for the first quarter of 2015. The improvement in GDP growth data was due to adoption of new methods for measuring construction output. Strong household spending however remained the engine of growth in Q1 2015. Besides, with pick up in services sector business activities, economic growth is expected to accelerate in quarter ending June 2015.
Japan:
2.15. According to the “second” preliminary estimate of GDP, released by the Cabinet Office of Japan, the real GDP of Japan grew by 3.9 per cent in annualised terms during the first quarter of 2015, compared to growth of 1.1 per cent in fourth quarter of 2014. The world’s third largest economy expanded by 1.0 per cent (Q-o-Q) during Q1 2015, against a growth of 0.3 per cent in previous quarter. Compared to the first quarter of 2014, real GDP decreased by 1.0 per cent (Y-o-Y) in Q1 2015, against a decline of 0.9 per cent in Q4 2014.
2.16. During June 2015, growth in manufacturing sector slowed down. Seasonally adjusted Markit Japan Manufacturing PMI declined to 50.1 in June 2015 from 50.9 in previous month, indicating slower expansion in business activity (PMI above 50 mark indicates an expansion in business activity). On the other hand, service sector business activity expanded during June 2015. Markit Japanese Services PMI grew to 51.8 in June 2015 from 51.5 in previous month.
2.17. According to the estimates by Statistics Bureau and the Director-General for Policy Planning of Japan, the annual CPI inflation slowed down to 0.5 per cent in May 2015 from 0.6 per cent in previous month. The consumer price index for Japan grew by 0.3 per cent (M-o-M) during May
2015. During the month, annual food inflation grew by 3.1 per cent.
2.18. In its Monetary Policy meeting held on July 15, 2015, Bank of Japan decided to conduct money market operations so that the monetary base will increase at an annual pace of around 80 trillion yen. The Bank will purchase Japanese government bonds (JGBs), ETF and J-REITs so that their amount outstanding will increase at an annual pace of about 80 trillion yen, 3 trillion yen and about 90 billion yen respectively. As for CP and corporate bonds, the Bank will maintain their amounts outstanding at about 2.2 trillion yen and about 3.2 trillion yen respectively. The unemployment rate in Japan remained unchanged at 3.3 per cent in May 2015.
2.19. Observations: Economic growth during the first quarter of 2015 was stronger than expectations mainly due to increased capital investments. However, household spending and industrial output remained sluggish. IMF in its latest World Economic Outlook report has cut down the GDP growth projections for 2015 by 0.2 per cent to 0.8 per cent, while kept the growth projections for 2016 unchanged at 1.2 per cent.
Euro Area:
2.20. As per the “second” estimate by the Eurostat, the statistical office of the European Union, the real GDP grew by 0.4 per cent in both Euro Area (EA18) and European Union (EU28) during the first quarter of 2015. During the fourth quarter of 2014 also, the real GDP (Q-o-Q) grew by 0.4 per cent in both Euro Area (EA18) and EU28. Compared with the same quarter of the previous year, seasonally adjusted real GDP grew by 1.0 per cent (Y-o-Y) in the Euro Area and increased by 1.5 per cent (Y-o-Y) in EU28 in the first quarter of 2015. The (Year-on-Year) GDP growth in Q4 2014, for Euro area and EU28 were 0.9 per cent and 1.4 per cent, respectively. During the first quarter of 2015, real GDP (Q-o-Q) grew by 0.3 per cent in Germany, 0.6 per cent in France, 0.3 per cent in Italy, 0.9 per cent in Spain and 0.4 per cent in Netherlands.
2.21. During June 2015, Euro Area manufacturing sector continued to expand. Markit Euro Area
625
JULY SEBI BULLETIN 2015
Manufacturing PMI grew to 52.5 in June 2015, from 52.2 in previous month. Among major Euro Area economies, Netherland, Ireland, Spain, Italy, Germany, Austria and France recorded growth in manufacturing business, while Greece recorded contraction during the month.
2.22. As per the estimate released by Eurostat, annual inflation in Euro Area and EU28 fell to 0.2 per cent and 0.1 per cent respectively in June 2015 from 0.3 per cent (both) in previous month. During the month, low annual inflation rates were recorded in Cyprus (-2.1 per cent), Greece (-1.1 per cent), Romania and Slovenia (both -0.9 per cent). In June 2015, annual inflation fell in thirteen member countries, remained stable in seven and increased in eight EU28 member countries.
2.23. During May 2015, unemployment was stable at 11.1 per cent in Euro Area, and at 9.6 per cent EU28. The highest unemployment rate was recorded in Greece (25.6 per cent in March 2015) and Spain (22.5 per cent in May 2015). The European Central Bank (ECB) in its meeting on July 16, 2015, decided that the interest rate on the main refinancing operations, the interest rates on the marginal lending facility and the deposit facility will remain unchanged at 0.05 per cent, 0.30 per cent and -0.20 per cent respectively.
2.24. Observations: Economic recovery in Euro Area remained on track during the first quarter of 2015 amid robust domestic demand and increased government spending. Manufacturing sector business activities showed some improvement during the second quarter of 2015, however, overall pace of expansion remains weak. Suffering from prolonged recession, high unemployment and deflation, Greece defaulted on an IMF loan repayment at the end of June 2015, adding to the uncertainty regarding economic growth in Euro Area.
Brazil:
2.25. Seasonally adjusted real GDP of Brazil reported a decline of 0.1 per cent (Q-o-Q) in the first quarter of 2015, as per the estimates by Instituto Brasileiro de Geografia e Estatística (IBGE). In comparison with Q1 of 2014, the GDP shrank
by 1.6 per cent in Q1 of 2015. Agriculture sector’s growth increased to 4.0 per cent in Q1of 2015 (Y-o-Y). Industrial sector contracted by 3.0 per cent in Q1 of 2015 (Y-o-Y). Manufacturing sector contracted by 7.0 per cent during Q1 of 2015. Services sector growth eased further to 6.0 per cent during review period. IMF has estimated that Brazil’s GDP would contract by 1.5 per cent in 2015 and grow 0.7 per cent in 2016.
2.26. Brazil’s annual inflation rate (IPCA) increased from 8.47 per cent in May 2015 to 8.89 per cent in June 2015. However, on monthly basis, the benchmark index decreased from 0.99 per cent in May 2015 to 0.77 per cent in June 2015. Brazil’s inflation is way above the official target of 4.5 per cent. Evaluating the macroeconomic outlook and perspectives for inflation, Brazil’s Central Bank has increased the benchmark Selic rate by 0.5 per cent to 13.75 per cent in June 2015. Brazil’s unemployment rate jumped to 6.7 per cent in May 2015 from 6.2 per cent in April 2015.
China:
2.27. Chinese economy grew by 7 per cent in Q2 of 2015 same as that of Q1 of 2015,according to China’s National Bureau of Statistics. The Quarter on Quarter (Q-o-Q) growth for Q2 of 2015 increased to 1.7 per cent as compared to 1.4 per cent in Q1 of 2015. In a recently released China Economic Update by the World Bank, “As structural adjustments and policy efforts to address financial vulnerabilities continue, World Bank estimates that growth in China is expected to decelerate to 7.1 percent in 2015 and to 6.9 percent by 2017.” The International Monetary Fund (IMF) has kept the growth forecast for China unchanged at 6.8 percent in 2015 and 6.3 per cent in 2016.
2.28. The HSBC China manufacturing Purchasing Manager Index (PMI) inched up to 49.2 in May 2015 from 48.9 in April 2015, signalling deterioration in health of the manufacturing sector. HSBC China Composite Output index decreased fractionally to 51.2 in May 2015 from 51.3 in April 2015.
2.29. As regards price situation, the annual Consumer Price Inflation in China marginally increased to

626
JULY SEBI BULLETIN 2015
1.4 per cent in June 2015 in comparison 1.2 per cent in May 2015.The food prices went up by 1.9 per cent, while the non-food prices increased by 1.2 per cent. The month-on-month change in consumer prices during June 2015 was nil.
Russia:
2.30. According to estimates by the Russian State Statistics Service (Rosstat), quarterly real GDP of Russia declined by 2.29 per cent (Y-o-Y) during first quarter of 2015. GDP grew by 0.4 per cent (Y-o-Y) during fourth quarter of 2014.In 2014, the Russian economy grew at 0.6 per cent. According to World Bank estimates, Russian GDP will fall to 2.7 per cent in 2015, before reaching 0.7 per cent in 2016, and 2.5 per cent in 2017.
2.31. As regards price situation, the annual CPI inflation rate fell from 15.8 per cent in May 2015 to 15.3 per cent in June 2015. Month-on-Month CPI inflation rate was recorded at 0.2 per cent in June 2015. The Bank of Russia has set a target of reducing the inflation to less than 8 per cent by April 2016 and 4 per cent in 2017. The Central Bank of Russia has decreased the benchmark ‘Key rate in June 2015. The rate has been reduced from 12.5 per cent to 11.5 per cent. The unemployment rate in Russia decreased marginally to 5.8 per cent in April 2015 from 5.9 per cent in March 2015.
3. Review of Global Financial Markets:
3.1. Global stocks posted negative returns during June 2015. Emerging markets outperformed in comparison to the developed market, but the overall trend was lower. As the Greek funding difficulties remained in focus, the European assets became sensitive and as a result stock markets remained volatile during the month. The Greek debt crisis weighed heavy on the Europe’s economy.
Stock Market:
3.2. During June 2015, US equities underperformed because of the fears of an interest rate rise by the Federal Reserve. The worries over Greece’s debt default and its future in the Eurozone - as the country announced the banking and stock market shutdown, led to unexpected fall in the equities market. Chinese stock markets were extremely volatile and slid the most, threatening the nation’s financial system. Stocks of Indonesia, Chile, South Africa sank during the month. Turkish stock markets declined due to the greater political uncertainty.
3.3. MSCI World Index, which is a leading indicator for tracking the overall performance of stock markets in developed markets witnessed a fall of 2.46 per cent in June 2015. Further, the MSCI Emerging Market Index also declined by 3.18 per cent during June 2015. (Chart 3).
Chart 3: Movement in MSCI World and Emerging Market Index
Source: Bloomberg

627
JULY SEBI BULLETIN 2015
Bond Market:
3.4. During June 2015, long-term Treasury bond prices of major economies such as Germany, Spain, United States etc., declined as concerns of Greek default on IMF loans and subsequent exit from Euro Area escalated. At the end of June 2015, the 10 year Treasury bond yield of Germany closed at 0.8 per cent, compared to 0.5 per cent at the end of the previous month. The long term Treasury bond yields of world major economies too gained momentum on the expectations of benchmark rate hikes by Federal Reserve of USA later this year. 10 year government bond yields of US and UK closed
at 2.3 per cent and 2 per cent respectively at the end of June 2015. The yield on 10 year government bonds of Spain also settled at modest 2.3 percent in line with the other European countries as against 7 per cent during the same month 3 years ago.
3.5. Among emerging market economies, bond yield of 10 year government bond of China and India rose by 0.6 per cent and 2.8 per cent, respectively. On the contrary, the bond yield of 10 year government bond of Brazil decreased by 3.2 per cent during June 2015.
Chart 4: Movement in 10 year bond yield of major countries
Source: Bloomberg
Currency Market:
3.6. During June 2015, major currencies across the world appreciated against US dollar. Japanese Yen, Euro and GBP recorded appreciation of 1.3 per cent, 1.5 per cent and 2.8 per cent respectively against the US dollar during the month under review.
3.7. Among emerging markets, Brazilian Real and
Chinese Renminbi depreciated by 5.3 per cent and 0.1 per cent, respectively against US dollar while Brazilian Real and Indian Rupees appreciated by 2.3 percent and 0.1 percent, respectively against US dollar during June 2015. (Exchange rate represents the closing price of the interbank foreign currency trade).

628
JULY SEBI BULLETIN 2015
Chart 5: Movement of major currencies against US Dollar ($)
Source: Bloomberg
Note: Exchange rate represents the closing price of the interbank foreign currency trade.
Trend in Market Indices:
3.8. Major stock indices all over the world exhibited negative trends during June 2015. Major developed markets, showed a downward trend during the period under review. Nikkei 225 of Japan declined by 1.59 per cent, followed by Nasdaq Composite of USA (1.64 per cent) and Straits Times of Singapore (2.20 per cent). Other developed markets which shrank were Germany, France, Australia amongst others.
3.9. As regards the emerging market indices, the growth was witnessed by Karachi 30 of Pakistan (2.84 per cent), followed by IGBC General of Colombia (0.91 per cent) and Bolsa of Mexico (0.78 per cent) during June 2015. On the other hand, Shanghai SE Composite IX of China declined by 7.25 per cent followed by Jakatra Composite of Indonesia (5.86 cent) and Hermes of Egypt (5.31 per cent).
Chart 6: Trend in Major Developed Market Indices
Source: Bloomberg

629
JULY SEBI BULLETIN 2015
Market Capitalisation:
3.10. Market capitalisation of major stock exchanges in the world, at the end of June 2015, is given in table A6 and is illustrated in Chart 8. The market capitalisation of most of the major stocks listed in developed as well as developing markets exhibited negative trend during the month. During June 2015, among major developed markets, the market capitalisation of Australian stock Exchange (ASX) fell by 4.6 per cent. The market capitalisation of NYSE Euronext (US) and London Stock Exchange
(UK) dropped by 1.4 per cent and 2.8 per cent respectively during the month under review.
3.11. As regards the major emerging markets, market capitalisation of Shanghai Stock Exchange plummeted by 8.7 per cent during June 2015 after touching 7 years high, followed by Chile (-6.3 percent) and Indonesia (-5.9 per cent). Market capitalisation of National Stock Exchange of India fell by 1.7 per cent whereas that of Brazil gained 3.7 per cent during the month under review.
Chart 8: Trend in Market Capitalisation of Major Exchanges (US$ Million)
Source: World Federation of Exchanges
Chart 7: Trend in Market Indices of BRIC Nations
Source: Bloomberg

630
JULY SEBI BULLETIN 2015
Derivative Market:
3.12. Among the major stock exchanges covered in the review (Table A4 & A5), during June 2015, the monthly notional turnover of index futures in China Financial Futures Exchange was USD 14,517.2 billion, followed CME Group (USD 5,383.9 Billion). As regards trading in stock futures, NSE recorded notional turnover of USD 96.6 Billion, followed by Eurex (USD 57.6 Billion). The monthly turnover in stock options for Eurex recorded notional turnover of USD 85.3 billion, followed by NSE (USD 37.9 billion). In the case of Stock Index Options, Korea Stock Exchange registered turnover of USD 5,684.3 billion, followed by Eurex (USD 1,831.4 billion) and CME Group (USD 1,649.9 billion).
4. Review of Indian Economy
4.1. The Ministry of Statistics and Programme Implementation released the provisional estimates of Annual National Income 2014-15 and quarterly estimates of GDP for Q4 of 2014-15. As per the provisional estimates of National Income, 2014-15, the Growth in GDP at constant prices (2011-12) during 2014-15 is estimated at 7.3 per cent as compared to the growth rate of 6.9 per cent in 2013-14. Agriculture sector’s growth has been estimated at 0.2 per cent in 2014-15 as against 3.7 per cent in 2013-14. Manufacturing and Services sector are estimated to grow at 6.6 per cent and 9.4 per cent, respectively in 2014-15.
4.2. As per quarterly estimates of GDP for Q4 of 2014-15 as per the new series, GVA growth was registered at 6.1 per cent as compared to 6.8 per cent in the previous quarter and 5.3 per cent during the corresponding period of 2013-14.
Exhibit 3: Quarterly Estimates of GVA (Y-o-Y) (at 2011-12 prices)
Items2013-14
(NS)2014-15
(PE)2013-14 2014-15
Q1 Q2 Q3 Q4 Q1 Q2 Q3 Q4
1. Agriculture & allied activities 3.7 0.2 2.7 3.6 3.8 4.4 2.6 2.1 -1.1 -1.4
2. Industry
Mining & Quarrying 5.4 2.4 0.8 4.5 4.2 11.5 4.3 1.4 1.5 2.3
Manufacturing 5.3 7.1 7.2 3.8 5.9 4.4 8.4 7.9 3.6 8.4
Electricity, Gas, Water Supply& Other Utility Services
4.8 7.9 2.8 6.5 3.9 5.9 10.1 8.7 8.7 4.2
3. Services
Construction 2.5 4.8 1.5 3.5 3.8 1.2 6.5 8.7 3.1 1.4
Trade, Hotel, Transport, Communication and services related to broadcasting
11.1 10.7 10.3 11.9 12.4 9.9 12.1 8.9 7.4 14.1
Financial, Real Estate & Professional Services 7.9 11.5 7.7 11.9 5.7 5.5 9.3 13.5 13.3 10.2
Public Administration, Defence and Other services
7.9 7.2 14.4 6.9 9.1 2.4 2.8 7.1 19.7 0.1
Gross Value Added at Basic Price 6.6 7.2 7.2 7.5 6.6 5.3 7.4 8.4 6.8 6.1
GDP 6.9 7.3
Source: CSONS- New Series Estimates; PE- Provisional Estimates
4.3. The Nikkei Purchasing Managers’ Index (PMI) fell from 52.6 in May 2015 to 51.3 in June 2015. It pointed towards continued improvement in the health of manufacturing sector during the month, however at marginally lower pace. On the Other hand, Nikkei India Composite
Output Index fell below the 50 mark to 49.2 in June 2015 from 51.2 in May 2015.
4.4. India’s fiscal deficit during April-May touched 2,086.24 billion rupees ($32.8 billion), or 37.5 percent of the target for the 2015-16. The deficit was 45.3 percent during the same period

631
JULY SEBI BULLETIN 2015
a year ago. In the Union Budget 2014-15, the government kept a fiscal deficit target of 4.1 per cent of GDP. The central government has managed to contain the deficit at 3.99 per cent of the GDP or Rs. 5, 01,880 crore in 2014-15 (98 per cent of the projected figure in revised estimate). The Union budget 2015-16 has set India’s fiscal deficit target for the 2015-16 at 3.9 percent of GDP (Rs. 5,55,649 lakh crore) which would gradually come down to 3 percent by 2017-18, one year later than previously expected.
Index of Industrial Production
4.5. India’s General Index of Industrial Production (IIP) growth slowed down to 2.7 per cent in May 2015 compared to a downwardly revised growth in April and 5.6 per cent expansion during the corresponding month in 2014. Growth of manufacturing sector, which constitutes 75 per cent of IIP, stood at 2.2 percent in May 2015
as compared to 5.1 per cent in April, while the mining sector output grew only 2.8 per cent in May 2015 against 0.6 per cent the previous month. The cumulative growth for the period April-May 2015 is recorded at 3 per cent.
Inflation
4.6. India’s Consumer Price Index (CPI) Inflation rose in the month of June 2015 to 5.40 per cent from 5.01 per cent in May 2015. Food inflation for June rose substantially to 5.48 per cent versus 4.8 per cent in May. Wholesale Price Inflation (WPI) fell for the eighth consecutive month in June to -2.4 per cent compared to previous month’s contraction of 2.36 per cent and an increase of 5.7 per cent in the corresponding month of the previous year. The Reserve Bank of India has cut interest rates for the third time in 2015, and reduced the key repo rate by 25 basis points to 7.25 percent in June 2015.
Chart 9: Inflation as measured by WPI and CPI (in per cent)
Source: CSO, RBI, Office of Economic Advisor
Trade – Exports and Imports
4.7. India’s exports dipped by 15.82 per cent to USD 22.29 billion in June 2015, compared with USD 26.48 billion in the corresponding month of 2014. The slump in exports is mainly expected due to global slowdown. In 2014-15, total exports have been recorded at USD 310.5 billion (fall of 1.23 per cent compared with previous fiscal). Imports too contracted
by 13.40 per cent to USD 33.12 billion in June 2015. Trade deficit, for April-June 2015-16 has been estimated at USD 32.23 billion, which was lower than the deficit of USD 33.08 billion during April-June 2014-15. Oil imports dipped 35 per cent during June to USD 8.67 billion. Non-oil imports declined by 1.85 per cent to USD 24.44 billion.

632
JULY SEBI BULLETIN 2015
Foreign Exchange Reserves
4.8. During the month of June 2015, Rupee appreciated against US Dollar (USD). Since April 2014, Forex reserves have increased
considerably by about USD 43 billion. The reserves were recorded at USD 355.2 billion as on June 26, 2015 (Exhibit 4).
Exhibit 4: Foreign Exchange Reserves (USD billion)
June 26, 2015 May 29, 2015 May 1, 2015 April 3, 2015 Feb 27, 2015 Jan 30, 2015
Total Reserves 355.2 352.4 351.9 343.1 338.1 327.9Foreign Currency Assets 330.5 327.8 327.2 318.6 312.2 303.3Gold 19.3 19.3 19.3 19.0 20.2 19.4SDRs 4.1 4.0 4.1 4.0 4.1 4.1Reserve Position in the IMF 1.3 1.3 1.3 1.3 1.6 1.1
Source: RBI
Commodities Market
4.9. Turnover of the commodity exchanges increased by 15.84 per cent to `16.85 lakh crore during April-June 2015. The turnover at the commodity exchanges stood at `14.55 lakh crore during the same period in 2014. Much of the trade volume came from energy, followed by agricultural commodities and metals. The turnover from crude oil rose over 51 per cent to
`4.81 lakh crore in the June quarter from a year ago period. But the turnover from bullion fell by 7.24 per cent to `4.85 lakh crore in the first quarter compared with `5.23 lakh crore in the year-ago period. Forwards Market Commission (FMC) has reduced the trading time of the evening session in agri-commodities by two hours, w.e.f. July 13, 2015.
Exhibit 5: Commodity market trading during April-June 2015
Name of the Commodity Volume (lakh tonnes) Value (in ` crore)
Agricultural Commodities
Food Items 475.78 2,46,792.08
Non-food Items 212.96 1,10,866.48
Bullion
Gold 0.01 2,55,557.99
Silver 0.61 2,29,628.10
Metals 184.65 3,61,421.65
Energy 1,542.57 4,81,534.32
Total 2,416.58 16,85,800.61Source: FMC

633
JULY SEBI BULLETIN 2015
5. Annex Tables:
Table A1: Trend in major International Indices
Country Index
As on
March*,
2014
As on
March *,
2015
As on
May*,
2015
As on
June*,
2015
1 2 3 4 5 6
Australia All Ordinaries 5402.99 5861.92 5774.95 5451.20
France CAC 40 4391.50 5033.64 5007.89 4790.20
Germany Dax 9555.91 11966.17 11413.82 10944.97
Hong Kong HSI Hang Seng 22151.06 24900.89 27424.19 26250.03
Japan NIKKEI Nikkei 225 14827.83 19206.99 20563.15 20235.73
Singapore STI Straits Times 3188.62 3447.01 3392.11 3317.33
UK FTSE 100 6598.37 6773.04 6984.43 6520.98
USA DOW JONES Dow Jones Industrial Average 16457.66 17776.12 18010.68 17619.51
USA NASDAQ Composite Nasdaq Composite 4198.99 4900.89 5070.03 4986.87
India (BSE) S&P BSE Sensex 22386.27 27957.49 27828.44 27780.83
India (NSE) CNX Nifty 6704.20 8491.00 8433.65 8368.50
Brazil Bovespa 50414.92 51150.16 52760.48 53080.88
Chile Stock Market Select 3772.76 3916.92 4045.62 3897.10
China Shanghai SE Composite IX 2033.31 3747.90 4611.74 4277.22
Colombia IGBC General 13827.01 9998.85 10205.17 10297.87
Egypt Hermes 785.68 828.83 784.13 742.51
Hungary Budapest Stock Exchange 17529.99 19689.16 22378.74 21903.13
Indonesia Jakatra Composite 4768.28 5518.68 5216.38 4910.66
Malaysia FTSE Bursa Malaysia KLCI 1849.21 1830.78 1747.52 1706.64
Mexico Bolsa 40461.60 43724.78 44703.62 45053.70
Pakistan Karachi 30 19170.92 19232.27 20978.58 21573.42
Russia Russian Traded 1723.97 1222.80 1342.80 1303.82
South Africa FTSE/JSE Africa All Share 47770.92 52181.95 52270.86 51806.95
Taiwan Taiwan Taiex 8849.28 9586.44 9701.07 9323.02
Thailand Stock Exchange of Thai 1376.26 1505.94 1496.05 1504.55
Turkey ISE National 100 69736.34 80846.03 82981.15 82249.53
*Indices are as on last trading day of the monthSource: Bloomberg

634
JULY SEBI BULLETIN 2015
Table A2: Volatility and P/E Ratio of Major International Indices
Country IndexVolatility (per cent) P/E Ratio
May-15 Jun-15 May-15 Jun-15
1 2 3 4 5 6
Developed Markets
Australia All Ordinaries 0.84 1.01 28.47 26.85
France CAC 40 1.27 1.50 25.83 24.76
Germany Dax 1.47 1.51 18.35 17.67
Hong Kong HSI Hang Seng 2.12 1.10 10.62 10.86
Japan NIKKEI Nikkei 225 0.58 1.04 36.38 22.86
Singapore STI Straits Times 0.45 0.76 15.30 14.92
UK FTSE 100 0.83 0.84 21.93 20.51
USA DOW JONES Dow Jones Industrial Average 0.64 0.73 15.56 15.18
USA NASDAQ Composite Nasdaq Composite 0.82 0.81 30.01 29.78
Emerging Markets
India (BSE) S&P Sensex 1.22 0.95 20.12 22.21
India (NSE) CNX Nifty 1.23 0.96 23.12 21.85
Argentina Indice Bolsa General 1.32 1.83 25.41 26.55
Brazil Bovespa 1.16 1.16 32.45 32.40
Chile Stock Market Select 0.54 0.68 17.62 17.13
China Shanghai SE Composite IX 2.60 3.35 22.91 21.42
Colombia IGBC General 0.79 0.72 14.16 14.29
Egypt Hermes 1.89 0.71 28.19 24.91
Hungary Budapest Stock Exchange 0.66 1.02 NA NA
Indonesia Jakatra Composite 0.60 0.98 23.18 23.21
Malaysia FTSE Bursa Malaysia KLCI 0.49 0.50 17.23 16.82
Mexico Bolsa 0.57 0.58 30.58 31.66
Pakistan Karachi 30 0.99 0.70 8.93 9.20
Russia Russian Traded 1.81 1.56 8.43 8.07
South Korea Kospi Index 0.75 0.62 26.43 17.78
South Africa FTSE/JSE Africa All Share 0.72 0.75 19.53 19.12
Taiwan Taiwan Taiex 0.59 1.00 15.82 14.04
Thailand Stock Exchange of Thai 0.72 0.71 19.89 19.99
Turkey ISE National 100 1.04 1.81 10.80 10.64Note: PE ratio for S&P BSE Sensex and CNX Nifty have been obtained from BSE, NSE respectively NA.: Not AvailableSource: Bloomberg, BSE, NSE

635
JULY SEBI BULLETIN 2015
Table A3: Investment Flows- New Capital raised by Shares and Bonds in the Major Exchanges
(US$ million)
Stock ExchangeMay-15 Jun-15
Equities Bonds Total Equities Bonds Total
1 2 3 4 5 6 7
Australian Stock Exchange 4,329 NA 4,329 3,910 NA 3,910
BM&FBOVESPA 314 17 331 NA 246 246
BME Spanish Exchanges 6,453 NA 6,453 681 NA 681
Bursa Malaysia 1,071 NA 1,071 222 NA 222
Egyptian Exchange 5 2,949 2,954 131 2,608 2,739
Hong Kong Exchanges 26,097 15,210 41,307 37,316 8,043 45,359
Indonesia Stock Exchange 176 NA 176 NA NA NA
Irish Stock Exchange NA 1,365 1,365 NA 833 833
Japan Exchange Group - Tokyo 296 2,130 2,426 NA NA NA
Johannesburg Stock Exchange 696 2,517 3,212 1,562 3,382 4,944
Korea Exchange 57 47,201 47,258 NA 66,332 66,332
Luxembourg Stock Exchange NA 66,106 66,106 NA 79,255 79,255
Moscow Exchange NA 4,753 4,753 NA 3,785 3,785
NASDAQ OMX 946 NA 946 NA NA NA
NASDAQ OMX Nordic Exchange NA 12,957 12,957 NA 3,849 3,849
New Zealand Exchange 38 NA 38 196 423 619
NYSE 15,229 NA 15,229 11,572 NA 11,572
Oslo Børs 121 3,404 3,526 NA 7,372 7,372
Philippine Stock Exchange 249 NA 249 321 NA 321
Shanghai Stock Exchange 7,120 NA 7,120 NA NA NA
Shenzhen Stock Exchange 7,437 981 8,418 6,314 164 6,478
Singapore Exchange 2 10,790 10,792 NA 9,082 9,082
SIX Swiss Exchange NA 6,763 6,763 NA 6,783 6,783
Taipei Exchange 28 6,581 6,609 9 7,476 7,486
Taiwan Stock Exchange Corp. 108 980 1,087 NA 972 972
Tel Aviv Stock Exchange 42 1,748 1,790 1 3,258 3,259
The Stock Exchange of Thailand 639 101 740 282 NA 282
TMX Group 4,552 201 4,754 6,013 115 6,127NA: Not AvailableSource: World Federation of Exchanges

636
JULY SEBI BULLETIN 2015
Table A4: Monthly Turnover in Derivatives (Stock options and Stock futures) in major Stock Exchanges
(US$ million)
Exchange
Jun-15
Stock options Stock futures
Number of
contracts traded
Notional
turnover
Number of
contracts traded
Notional
turnover
Americas
BM&FBOVESPA 49,150,359 25,871 0 0
Chicago Board Options Exchange 30,577,299 NA NA NA
Colombia SE NA NA 29,020 30
International Securities Exchange 27,747,499 NA NA NA
MexDer 29,260 5 0 0
NYSE Liffe (US) 31,156,933 6,215 NA NA
Asia - Pacific
ASX Derivatives Trading 7,691,987 15,242 948,523 697
BSE India 538,737 2,328 10,419 39
Hong Kong Exchanges 7,943,516 21,993 46,048 196
Korea Exchange 23,206 NA 17,454,513 9,830
National Stock Exchange India 9,244,178 37,910 23,688,366 96,555
New Zealand 0 0 NA NA
Osaka SE 128,355 NA NA NA
TAIFEX 11,442 31 1,362,447 5,487
Thailand Futures Exchange NA NA 1,435,331 NA
Europe - Africa - Middle East
Athens Derivatives Exchange 2,354 1 2,061,078 197
BME Spanish Exchanges 2,159,392 2,264 1,719,805 1,831
Borsa Istanbul 39 12 2,625 42
Budapest SE 0 0 21,583 73
EUREX 16,595,621 85,338 12,112,411 57,583
Euronext 5,313,468 15,603 24,992 82
Johannesburg SE 920,587 30 2,467,369 2,336
Moscow Exchange 349,344 61 23,961,012 4,104
OMX Nordic Exchange 1,992,757 3,581 561,085 606
Oslo Børs 182,831 116 282,239 179
Tel Aviv SE 176,546 734 NA NANA: Not AvailableSource: World Federation of Exchanges

637
JULY SEBI BULLETIN 2015
Table A5: Monthly Turnover in Derivatives (Index options and Index futures) in major Stock Exchanges
(US$ million)
Exchange
Jun-15
Stock index options Stock index futures
Number of
contracts traded
Notional
turnover
Number of
contracts traded
Notional
turnover
Americas
BM&FBOVESPA 122,953 28,378 7,596,626 45,337CBOE Future Exchange NA NA 4,641,754 NAChicago Board Options Exchange 35,732,894 NA NA NACME Group 11,913,507 1,649,910 51,023,005 5,383,910Colombia SE NA NA 120 2ICE Futures US 2,754 349 5,368,193 498,516MexDer 13,606 379 176,397 4,209
Asia - Pacific
ASX Derivatives Trading 924,256 39,000 671 29ASX SFE Derivatives Trading 18,082 1,911 1,376,824 139,273BSE India 14,824,109 96,695 50,411 324Bursa Malaysia Derivatives 533 NA 247,239 5,480China Financial Futures Exchange NA NA 60,884,551 14,517,200Hong Kong Exchanges 2,125,496 233,137 6,684,177 601,455Korea Exchange 50,310,403 5,684,340 4,197,074 474,440National Stock Exchange India 190,507,944 668,980 15,854,676 63,699New Zealand NA NA 0 0Osaka SE 3,448,092 NA 29,295,466 1,235,910Singapore Exchange 438,758 NA 20,203,470 NATAIFEX 16,241,918 245,607 4,425,773 191,130Thailand Futures Exchange 30,050 NA 2,637,842 NA
Europe - Africa - Middle East
Athens Derivatives Exchange 7,526 9 253,218 317BME Spanish Exchanges 656,675 8,130 1,096,392 93,152Borsa Istanbul 1,112 127 704,164 15,506Budapest SE 0 0 14,761 11EUREX 41,915,488 1,831,450 50,966,814 2,780,910Euronext 1,476,600 79,284 4,816,989 316,379Johannesburg SE 361,896 157 2,798,538 76,943Moscow Exchange 1,518,058 2,805 13,582,441 25,368OMX Nordic Exchange 719,010 13,620 3,278,907 62,538Oslo Børs 61,180 39 257,562 163Tel Aviv SE 4,488,502 NA 2,292 NA
NA: Not AvailableSource: World Federation of Exchanges

638
JULY SEBI BULLETIN 2015
Sources:
1. OECD database2. Bureau of Economic Analysis (US)3. Bureau of Labor Statistics (US)4. The Conference Board (US)5. The Federal Reserve System (US) 6. Institute for Supply Management (US)7. Office for National Statistics (UK)8. Bank of England (UK)9. The Cabinet Office (Japan)10. Statistics Bureau, Director-General for Policy Planning
(Statistical Standards) (Japan)11. Bank of Japan12. Eurostat (EA18 and EU27)13. European Central Bank (EA18)14. Instituto Brasileiro de Geografia e Estatística (Brazilian
Institute of Geography and Statistics)15. Banco Central do Brasil (Central Bank of Brazil)
16. Federal State Statistics Service (Russian Federation)17. The Central Bank of the Russian Federation18. The Central Statistical Office (India)19. Office of the Economic Adviser to the Government of India20. The Reserve Bank of India21. National Bureau of Statistics of China 22. Peoples Bank of China23. Markit Financial Information Services24. World Federation of Exchanges25. Bloomberg26. The Bombay Stock Exchange 27. The National Stock Exchange28. The Bank of Korea29. Bank Indonesia30. Central Bank of The Republic of Turkey31. IMF
Table A6: Market Capitalisation of major Stock Exchanges
(US$ Million)
Stock Exchange Apr-15 May-15 Jun-15 M-o-M change(%)
1 2 3 4 5Developed Market
Australia 1,231,172 1,225,885 1,169,663 (4.6)France 2,014,318 2,079,292 2,023,801 (2.7)Germany 1,964,510 1,913,550 1,875,061 (2.0)Hong Kong 4,526,483 5,134,256 4,907,418 (4.4)Japan 4,852,326 5,069,567 5,023,314 (0.9)Singapore 566,432 568,994 551,351 (3.1)UK 3,626,328 3,851,306 3,743,647 (2.8)USA 24,614,866 24,878,954 24,528,958 (1.4)
Emerging Markets
India 1,628,771 1,607,120 1,580,066 (1.7)Argentina 70,546 62,918 63,446 0.8Brazil 670,273 696,170 722,254 3.7Chile 232,904 236,619 221,604 (6.3)China 6,486,554 8,831,841 8,067,166 (8.7)Colombia 122,976 124,703 120,591 (3.3)Egypt 71,709 70,478 68,371 (3.0)Hungary 15,458 17,353 16,904 (2.6)Indonesia 425,078 398,124 374,642 (5.9)Malaysia 450,790 443,416 423,147 (4.6)Mexico 438,251 434,826 429,214 (1.3)Pakistan 68,009 72,592 75,052 3.4Russia 432,731 477,619 462,478 (3.2)South Korea 1,267,330 1,320,080 1,302,329 (1.3)South Africa 514,851 507,906 516,013 1.6Taiwan 1,011,646 1,037,845 996,871 (3.9)Thailand 428,678 411,389 412,364 0.2Turkey 221,896 226,304 219,302 (3.1)
M-o-M: Month on Month.Source: Bloomberg

639
JULY SEBI BULLETIN 2015
1. SEBI signs Memorandum of Understanding
on bilateral cooperation with the Ministry of
Finance, Republic of Belarus
Securities and Exchange Board of India (SEBI) and the Ministry of Finance of the Republic of Belarus signed a Memorandum of Understanding (MoU) on bilateral cooperation.The Memorandum of Understanding was signed in Belarus, Minsk on June 03, 2015 by Mr. Rajeev Kumar Agarwal, Whole Time Member, SEBI and Mr. Vladimir Amarin, Minister of Finance, Belarus, in the presence of Hon’ble President of India, Mr. Pranab Mukherjee and President of Belarus, H.E. Mr. Alexander V Lukashenko.The MoU, inter alia, seeks to promote further development of economic links and cooperation between the two signatories, and aims at enhancing investor protection and creating conditions for an effective development of securities markets in the two countries.In the past, SEBI has signed bilateral MoUs with a number of countries. India is a signatory to multilateral MoU of International Organization of Securities Commissions (IOSCO). In order to encourage the exchange of information and assistance, SEBI has been signing MoUs with the jurisdictions who are yet to become a signatory to the multilateral MoU of IOSCO.Ref: PR No. 149/2015 dated June 04, 2015
2. Contribution towards Prime Minister’s
National Relief Fund
The recent earthquake has severally affected the life and livelihood of lakhs of people in the affected areas. The aftermath situation is very severe, which requires enormous relief work.As a way of contribution to the relief effort for the victims of earthquake affected areas, staff members of SEBI have made a contribution of `5,40,480/- towards Prime Minister’s National Relief Fund.Ref: PR No. 165/2015 dated June 22, 2015
3. SEBI Board Meeting
The SEBI Board met at Mumbai on June 23, 2015. The details of some of the decisions taken are as follows:
PRESS RELEASES
1. Streamlining the Process of Public Issues -
Obviating the need to issue cheques
In order to reduce the post-issue timeline for listing from existing T+12 days to T+6 days, increase the reach of retail investors and reduce the costs involved in public issue of equity shares and convertibles, Board took the following decisions:
i. Presently more than 99.5 % applications are received from centres where ASBA facility is available. Based on an analysis of a few public issues, in terms of amount, ASBA applications account for 99.90% of the total bid amount received from all investors. Considering the reach and advantages of ASBA, it shall now be mandatory for all investors to make ASBA applications. Amongst many other significant advantages, ASBA enables investors to give the mandate for payment of application money in the application form itself without suffering loss of interest for the intervening period. It also obviates the hassle of refund of money by the issuer as per the difference in application amount and the amount for which shares are finally allotted.
ii. In order to substantially enhance the points for submission of applications, Registrar and Share Transfer Agents (RTAs) and Depository Participants (DPs) shall also be allowed to accept application forms (both physical as well as online) and make bids on the stock exchange platform. This will be over and above the stock brokers and banks where such facilities are presently available.
iii. To help intermediaries and banks to modify their existing systems and train their staff and also enable the investors to adapt to the new system, there will be a phase-in period of 6 months. Accordingly, a public issue which opens on or after January 01, 2016 will have to follow the new system.

640
JULY SEBI BULLETIN 2015
2. Sim plified Framework for Capital Raising by
technological start ups and other companies
on Institutional Trading Platform.
The Board undertook a review of the extant regulatory framework in the primary market and noted the suggestions of market participants on making the existing avenues for capital raising amenable for accommodating a larger number of start-up companies. Based on the same, the Board approved the following proposals to amend the regulations concerning the ITP Platform:
i. The platform shall now be called as Institutional Trading Platform (ITP) and shall facilitate capital raising as well.
ii. The said platform will be made accessible to:
a. companies which are intensive in their use of technology, information technology, intellectual property, data analytics, bio-technology, nano-technology to provide products, services or business platforms with substantial value addition and with at least 25% of the pre-issue capital being held by QIBs (as defined in SEBI (Issue of Capital and Disclosure Requirements) Regulations, 2009), or
b. any other company in which at least 50% of the pre-issue capital is held by QIBs.
iii. No person (individually or collectively with persons acting in concert) in such a company shall hold 25% or more of the post-issue share capital.
iv. Considering the nature of business of companies which may list on the said platform, disclosure may contain only broad objects of the issue and there shall be no cap on amount raised for General Corporate Purposes. Further, the lock in of the entire pre-issue capital shall be for a period of 6 months from the date of allotment uniformly for all shareholders.
v. As the standard valuation parameters such as P/E, EPS, etc. may not be relevant in case of many of such companies, the basis of issue price may include other
disclosures, except projections, as deemed fit by the issuers.
vi. Companies intending to list on the proposed ITP, shall be required to file draft offer document with SEBI for observations, as provided in SEBI (ICDR) Regulations, 2009.
vii. Only two categories of investors, i.e. (i) Institutional Investors (QIB as defined in SEBI (ICDR) Regulations, 2009 along with family trusts, systematically important NBFCs registered with RBI and the intermediaries registered with SEBI, all with net-worth of more than `500 crore) and (ii) Non-Institutional Investors (NIIs) other than retail individual investors can access the proposed ITP.
viii. In case of public offer, allotment to institutional investors may be on a discretionary basis whereas to NIIs it shall be on proportionate basis. Allocation between the said two categories shall be in the ratio of 75% and 25%, respectively.
ix. In case of discretionary allotment to institutional investors, no institutional investor shall be allotted more than 10% of the issue size. All shares allotted on discretionary basis shall be locked-in in line with requirements for lock-in by Anchor Investors i.e. 30 days at present.
x. The minimum application size in case of such issues shall be `10 lakhs and the minimum trading lot shall be of `10 lakhs.
xi. The number of allottees in case of a public offer shall be 200 or more.
xii. The company will have the option to migrate to main board after 3 years subject to compliance with eligibility requirements of the stock exchanges.
xiii. For Category I and II AIFs, which are required under the SEBI (Alternative Investment Funds) Regulations, 2012 to invest a certain minimum amount in unlisted securities, investment in shares of companies listed on this platform may be treated as investment in ‘unlisted securities’ for the purpose of calculation of the investment limits.

641
JULY SEBI BULLETIN 2015
Grandfathering of existing companies listed
on SME-ITP:
xiv. The existing companies listed on SME-ITP may continue to be guided by the existing regulatory framework for them including applicable relaxations from compliance with corporate governance requirements.
Rationalisation of disclosures for proposed
ITP as well as main board:
xv. Further, in order to rationalize the disclosures requirements for all issuers whether intending to list on the main board or the proposed ITP, it has been decided that the disclosures in offer document with respect to group companies, litigations and creditors shall be in accordance with policy on materiality as defined by the issuer. However, all relevant disclosures shall be available on the website of the issuer. Also, the product advertisements of an issuer will not be required to give details of public/rights issue.
3. Fast Track Issuances - Follow on Public
Offerings and Rights Issues
In order to enable more number of listed companies to raise further capital using fast-track route, Board approved the proposal to reduce the minimum public holding requirement from `3000 crore to `1000 crore in case of FPO and to `250 crore in case of rights issue, subject to compliance with following additional conditions:
i. In case of rights issue, promoters shall not renounce their rights, except to the extent of renunciations within the promoter group, or for the purposes of complying with minimum public shareholding norms;
ii. Annualized delivery based trading turnover requirement of 10% of the total paid up capital;
iii. No conflict of interest between the lead manager and the issuer or its group or associate company in accordance with applicable SEBI Regulations;
iv. Shares of the company should not have been suspended from trading as a disciplinary measure in past 3 years;
v. &Issuer, promoter group and directors of the issuer should not have settled any alleged violation of securities laws through the consent mechanism with the Board in last 3 years. This is in addition to the existing condition that no show-cause notices should have been issued or prosecution proceedings initiated by SEBI or pending against the issuer or its promoters or whole time directors.
4. Review of Offer for Sale (OFS) of Shares
through stock exchange mechanism
A discussion paper was floated on the review of Offer for Sale of Shares (OFS) through Stock Exchange mechanism. The Board considered the comments/suggestions received on the discussion paper and approved the following changes to the present OFS framework:
i. To ensure increased retail participation in the OFS process, OFS notice shall be continued as per present practice i.e. latest by T-2 days, however, T-2 day shall be reckoned from banking day instead of trading day.
ii. To simplify the bidding process for retail investors, it would be mandatory for the seller to provide the option to retail investors to place their bids at cut off price (default option) in addition to placing price bids.
5. Re-classification of Promoters as Public
In order to put in place a policy framework with respect to re-classification of promoters in listed companies as public shareholders under various circumstances, the Board has approved the proposal for putting in place a regulatory framework for the purpose.
Existing promoter of a listed entity may cease to be a promoter and/or re-classify itself as public in the following circumstances, on compliance with conditions stated thereunder:
Pursuant to change in promoter
i. When a new promoter replaces the previous promoter subsequent to an open offer or in any other manner, re-classification shall be permitted subject

642
JULY SEBI BULLETIN 2015
to approval of shareholders in the general meeting.
ii. Shareholders need to specifically approve whether the outgoing promoter can hold any Key Management Personnel (KMP) position in the company. In any case, the outgoing promoter may not act as KMP for a period of more than 3 years from the date of shareholders’ approval.
iii. The outgoing promoter can’t hold more than 10% shares of the company.
Inheritance
In case of transmission/succession/inheritance, the inheritor shall be classified as promoter.
Company not having any identifiable promoter
Existing promoters may be re-classified as public in case the company becomes professionally managed and does not have any identifiable promoter. A company will be considered as professionally managed for this purpose, if:
i. No person or group along with Persons Acting in Concert (PACs) taken together holds more than 1% shares of the company (including any convertibles/outstanding warrants/ADR/GDR Holding).
ii. Mutual Funds/Banks/Insurance Companies/Financial Institutions/FPIs can each hold up to 10% shares of the company (including any convertibles/outstanding warrants/ADR/GDR Holding).
iii. Erstwhile promoters and their relatives may hold KMP position in the company only subject to shareholders’ approval and for a period not exceeding 3 years from the date of shareholders’ approval.
The following conditions shall also be applicable:
i. The outgoing promoter shall not have any special rights through any formal or informal arrangements.
ii. The outgoing promoter shall not, directly or indirectly, exercise control over the affairs of the company.
iii. Increase in public shareholding pursuant to re-classification of promoters may not
be counted towards achieving compliance with minimum public shareholding (MPS) requirement under clause 40A of equity listing agreement read with rule 19A of the Securities Contracts (Regulations) Rules, 1957 (SCRR).
iv. If any public shareholder seeks to re-classify itself as promoter, it shall be required to make an open offer to the shareholders and would not be eligible for exemption from the said obligation.
v. The event of re-classification may be disclosed as a material event in accordance with the listing agreement/regulations.
In order to remove difficulties in specific cases the Board authorized the Chairman, SEBI to take required measures on a case to case basis.
6. SEBI Annual Report: 2014-15
The Board considered and approved the SEBI Annual Report: 2014-15. In compliance with Section 18(2) of SEBI Act, 1992, the same Annual Report would be submitted to the Central Government.
7. FMC- SEBI merger
The Board also discussed operational issues relating to the merger of Forward Markets Commission (FMC) with SEBI.
8. Recommendations of the Depository System
Review Committee (DSRC)
An expert committee was constituted by SEBI to inter-alia review and assess the depository system on the basis of CPSS-IOSCO principles so as to benchmark with global best practices. In its meeting held on November 19, 2014 the Board broadly accepted the recommendations of the committee.
The Board today reviewed the status of the implementation of recommendations and noted that the Depositories have been advised to implement the following:
i. Develop a mechanism to maintain complete reconciled record of total issued and listed capital, including both physical
643
JULY SEBI BULLETIN 2015
and dematerialized shares. ii. Risk Management Policy at the
Depositories and Information Technology (IT) infrastructure of the Depository Participants.
iii. Popularization of e-KYC among Depository Participants.
iv. Put in place systems to facilitate generation and dispatch of single Consolidated Account Statements (CAS) for investors having investments in securities and Mutual Funds, which has been implemented with effect from March 01, 2015.
9. Interim Use of Funds by the Issuers
In order to prevent misuse of funds during the interim period pending utilization by the issuer, for funds raised through public / rights issue in accordance with SEBI (ICDR) Regulations, 2009, the Board decided that net Issue proceeds pending utilization (for the stated objects) shall be deposited only in the Scheduled Commercial Banks included in the Second Schedule of Reserve Bank of India Act, 1934. In case of public / rights issue of Indian Depository Receipts, the issuer shall keep the funds in a bank having a credit rating of ‘A’ or above by an international credit rating agency.
Ref: PR No. 167/2015 dated June 23, 2015

644
JULY SEBI BULLETIN 2015
A. Circulars
I. Database for Distinctive Number (DN) of
Shares
1. Share capital reconciliation of the entire issued capital of the company by the issuer or its agent is a mandatory requirement under Regulation 55 of the SEBI (Depositories & Participants) Regulations, 1996.
2. The Depository System Review Committee (DSRC) constituted by SEBI while emphasising on the issuer’s responsibility for reconciling records of total issued capital, listed capital and capital held by depositories in dematerialized form, recommended that the depositories may maintain complete reconciled record of total issued and listed capital, including both physical and dematerialized shares.
3. In order to ensure centralised record of all securities, including both physical and dematerialised shares, issued by the company and its reconciliation thereof, it has been decided that the Depositories shall create and maintain a database of distinctive numbers (DN) of equity shares of listed companies with details of DN in respect of all physical shares and overall DN range for dematerialised shares.
4. The DN database shall make available, information in respect of issued capital, such as DN Range, number of equity shares issued, name of stock exchange where the shares are listed, date of in-principle listing / final trading approval / dealing permission, shares held in physical or demat form, date of allotment, shares dematerialized under temporary (frozen) ISIN (International Securities Identification Number) or Permanent (active) ISIN etc., at one place.
5. Based on consultations with the Depositories and Stock Exchanges, the following guidelines are given for the operationalisation of the DN database -
5.1. Instructions to the Depositories 5.1.1. The depositories shall create and maintain
a database to capture DN in respect of all physical equity shares and overall DN range for dematerialised equity shares issued by listed companies.
POLICY DEVELOPMENTS
5.1.2. The depositories shall provide an interface to the Stock Exchange, Issuers/RTAs for online updation and to the DPs for online enquiry. The same shall be released for live updates latest by September 30, 2015.
5.1.3. The database shall include the following information -
i. Distinctive Numbers (From)
vii. Trading start date
ii. Distinctive Numbers (To)
viii. Physical/demat
iii. Number of Equity shares
ix. Date of allotment and date of issue (date of credit to BO account)
iv. Name of stock exchange
x. ISIN along with name of company
v. Date of in-principle listing approval
xi. Nature of ISIN [Temporary (Frozen) or Permanent (Active)]
vi. Date of final trading approval / dealing permission
5.1.4. The depositories shall ensure that the database maintained by them is continuously updated and synchronised. The initial synchronisation may be in batch mode and shall thereafter shift to online mode.
5.1.5. The Depositories, in co-ordination with the Stock Exchanges, having nationwide trading terminals and the Issuers/RTAs, shall facilitate the process of populating the database with details of equity share capital and the corresponding DN information as on September 30, 2015.
5.2. Instructions to the Stock Exchanges
5.2.1. The Stock Exchanges shall provide the following information of all companies listed on the concerned Stock Exchange as on September 30, 2015 -
i. Total number of equity shares (A) for which final trading approval / dealing permission has been granted.
ii. Total number of equity shares (B) for which in-principle listing approval has been granted but final trading approval / dealing permission is pending.

645
JULY SEBI BULLETIN 2015
iii. Total number of equity shares comprising the paid-up capital i.e. (A+B).
5.2.2. The Stock Exchanges shall use the interface provided by the Depositories for the following-
i. In respect of companies where the final trading approval / dealing permission was awaited as on September 30, 2015, consequent to update of DN information by Issuers/RTAs, the stock exchange shall validate the DN information updated by the Issuer/RTA and update the date of ‘in-principle’ listing approval, date of final trading approval / dealing permission and trading start date [as per point nos. (v), (vi) and (vii) of 5.1.3], immediately upon granting of such permissions.
ii. In respect of further issue of shares by listed companies, consequent to update of DN information by Issuers/RTAs, the stock exchange shall validate the DN information updated by the Issuer/RTA and update the date of ‘in-principle’ listing approval, date of final trading approval / dealing permission and trading start date [as per point nos. (v), (vi) and (vii) of 5.1.3], immediately upon granting of such permissions.
iii. In respect of companies coming out with initial public offer or new listings on stock exchanges, the stock exchange shall update the DN database with the total number of equity shares for which final trading approval / dealing permission has been granted.
iv. In respect of companies whose capital is changed/altered for any reason other than further issuance of shares such as buyback of shares, forfeiture of shares, capital reduction, etc., the stock exchange shall confirm such change/alteration in the capital as updated by the Issuer/RTA in the DN database.
5.2.3. In case the DN data on listed shares as per the records of Issuers/RTAs does not match with records of the Stock Exchanges, the Stock Exchanges shall coordinate with the Issuer/RTA to reconcile such differences.
5.3. Instructions to the Issuers/RTAs
5.3.1. Issuers/RTAs shall use the interface provided by the Depositories for the following-
i. To update DN information in respect of all physical share capital and overall DN range for dematerialised share capital for all listed companies.
ii. Updating the fields (i)-(iv), (viii) and (ix) given in para 5.1.3, on a continuous basis for subsequent changes including changes in case of further issue, fresh issuance / new listing and other change / alteration in capital (such as buy-back of shares, forfeiture of shares, capital reduction, etc.).
iii. Capturing/updating the DN information on a continuous basis while processing, dematerialisation/rematerialisation requests confirmation, executing corporate action, etc.
5.3.2. Issuers/RTAs shall take all necessary steps to update the DN database. If there is mismatch in the DN information with the data provided / updated by the Stock Exchanges in the DN database, the Issuer/RTA shall take steps to match the records and update the same latest by December 31, 2015.
5.3.3. Failure by the Issuers/RTAs to ensure reconciliation of the records as required in terms of para above shall attract appropriate actions under the extant laws.
5.4. Instructions to the DPs
5.4.1. The DPs shall use the interface provided by the Depositories to check the DNs of certificates of equity shares submitted for dematerialisation and ensure that appropriate ISIN is filled in Dematerialisation Request Form, as applicable, while processing request for dematerialisation.

646
JULY SEBI BULLETIN 2015
6. Exchanges and Depositories are advised to a. make necessary amendments to the
relevant bye-laws, rules and regulations for the implementation of the above decision.
b. bring the provisions of this Circular to the notice of the listed companies of the Exchange and DPs and RTAs/Issuers and also to disseminate the same on the website.
c. communicate the status of the implementation of this Circular in the Monthly Development Report to SEBI.
Ref: CIR/MRD/DP/10/2015 dated June 05, 2015
II. Clarification on grant of registration as a
Foreign Portfolio Investor (FPI) to Registered
Foreign Venture Capital Investors (FVCI).
1. SEBI had received a query from a Designated Depository participant (DDP) seeking clarification with regard to any restrictions/conditions on applicants, holding registration as a FVCI, from obtaining registration as a FPI.
2. The SEBI (Foreign Portfolio Investors) Regulations, 2014 (“FPI Regulations”) as well as the SEBI (Foreign Venture Capital Investors) Regulations, 2000 (“FVCI Regulations”) do not expressly prohibit FVCI from holding registration as a FPI.
3. The investment conditions and restrictions for an entity registered as FVCI under FVCI Regulations are different as compared to the investment conditions and restrictions as prescribed for an entity registered as FPI under the FPI Regulations. Thus, such an entity would be required to have a clear segregation of funds/ securities which are proposed to be invested / held under the respective registrations.
4. Accordingly, it is clarified that a DDP may consider an applicant, holding FVCI registration, for grant of registration as an FPI subject to the following:
a. The applicant complies with the eligibility criteria as prescribed under the FPI Regulations.
b. The funds raised, allocated and invested must be clearly segregated for both the registrations.
c. Separate accounts must be maintained with the custodian for execution of trades. However, such an applicant shall have same custodian for its activities as FPI and FVCI.
d. The securities held under FVCI and FPI registrations should be clearly segregated.
e. Reporting of transactions must be done separately according to the conditions applicable under the specific registration.
f. All the conditions applicable to the entity under the respective registrations must be complied with at the level of the segregated funds and activities with respect to the specific registrations.
g. The investment restrictions as applicable to FPI, in terms of Regulation 21 of FPI Regulations and SEBI Circular No. CIR/IMD/FIIC/20/2014 dated November 24, 2014 shall be applicable.
h. The applicant does not have opaque structure(s), as defined under Explanation 1 of Regulation 32(1) (f) of FPI Regulations.
5. The applicant shall be required to comply with the provisions of FPI Regulations, FVCI Regulations and the circulars etc., issued there under from time to time.
Ref: CIR/IMD/FIIC/05/2015 dated June 12, 2015
III. Exchange Traded Cash Settled Interest Rate
Futures (IRF) on 6 year, 10 year and 13 year
Government of India (GoI) Security
1. SEBI vide circular CIR/MRD/DRMNP/35/2013 dated December 05, 2013 permitted Stock Exchanges to launch cash settled Interest Rate Futures on 10- Year Government of India (GoI) Security.
2. In consultation with RBI, after taking into account feedback from market participants and Stock Exchanges, it has been decided to permit stock exchanges to introduce cash settled Interest Rate Futures on 6-Year and 13 year GoI Security.
3. The product specifications, position limits and risk management framework for both IRF products has been prescribed.
4. Before the launch of the product/s, the Stock Exchange/Clearing Corporation shall

647
JULY SEBI BULLETIN 2015
submit proposal to SEBI for approval giving the details of contract specifications, risk management framework, the safeguards and the risk protection mechanisms, the surveillance systems etc.
5. 10-Year Cash Settled IRF: SEBI vide circular CIR/MRD/DRMNP/35/2013 dated December 05, 2013 while stipulating norms for cash settled 10-year IRF, inter alia, prescribed underlying bonds’ maturity criteria, position limits and maximum tenure for cash settled 10-year IRF. The residual maturity of the underlying bonds as prescribed in the said circular stands modified to ‘between 8 years and 11 years’ for both option A and B. The position limits as prescribed in the said circular also stand modified. In the said circular, for cash settled 10-year IRF, maximum three serial monthly contracts were permitted. In this regard, Stock Exchanges are now permitted to introduce three quarterly contracts of March/ June/ September/ December cycle in addition to three serial monthly contracts.
6. SEBI vide circular CIR/MRD/DRMNP/2/2014 dated January 20, 2014 prescribed monitoring mechanism for IRF positions of Foreign Portfolio Investors (FPIs). The mechanism specified in the said circular shall also be applicable on cash settled Interest Rate Futures on 6-Year and 13 year GoI Security.
Ref: CIR/MRD/DRMNP/11/2015 dated June 12, 2015
IV. Requirements specified under the SEBI
(Share Based Employee Benefits) Regulations,
2014 1. This has reference to the SEBI (Share Based
Employee Benefits) Regulations, 2014 (“the Regulations”) notified on October 28, 2014. The Regulations provide for certain processes / disclosure requirements to be specified by SEBI. Accordingly, necessary guidelines are being issued (available on SEBI website).
2. The stock exchanges are advised to bring the contents of this circular to the notice of the companies listed on them and ensure its compliance.
Ref: CIR/CFD/POLICY CELL/2/2015 dated June 16, 2015
V. Review of Offer for Sale (OFS) of Shares
through Stock Exchange Mechanism
1. Comprehensive guidelines on sale of shares through Offer for Sale mechanism were issued vide circular no CIR/MRD/DP/18/2012 dated July 18, 2012. The OFS framework has been modified subsequently from time to time on the basis of representation/suggestion received from market participants.
2. SEBI has been taking steps to encourage retail investors to participate in the OFS. In order to enhance more retail participation in the OFS process and to simplify the bidding process for retail investors, it has been decided that:
2.1. OFS notice shall continue to be given latest by 5 pm on T-2 days. However T-2 days shall be reckoned from banking day instead of trading day.
2.2. It would be mandatory for sellers to provide the option to retail investors to place their bids at cut off price in addition to placing price bids.
3. Accordingly, para 3.9 of OFS circular dated August 08, 2014 and para 2 of OFS circular dated December 01, 2014 stands modified as above. All other conditions for sale of shares through OFS framework contained in the circulars CIR/MRD/DP/18/2012 dated July 18, 2012, CIR/MRD/DP/04/2013 dated January 25, 2013, CIR/MRD/DP/17/2013 dated May 30, 2013, CIR/MRD/DP/24 /2014 August 08, 2014 and CIR/MRD/DP/32 /2014 December 01, 2014 remain unchanged.
4. Stock Exchanges are advised to: 4.1. take necessary steps and put in place
necessary systems for implementation of above immediately.
4.2. make necessary amendments to the relevant bye-laws, rules and regulations for the implementation of the above decision.
4.3. bring the provisions of this circular to the notice of the member brokers of the stock exchange to also to disseminate the same on their website.
Ref: CIR/MRD/DP/12/2015 dated June 26, 2015

648
JULY SEBI BULLETIN 2015
• SEBI, vide order dated June 4, 2015, imposed a total penalty of `2,00,00,000/- (Rupees Two Crores Only) on M/s New Delhi Television Limited {`25,00,000/-(Rupees Twenty Five Lacs only) for violation of Section 23 A and `1,75,00,000/-(Rupees One Crore Seventy Five Lacs only) for the violation of Section 23 E of the Securities Contracts (Regulation) Act, 1956 and for failing to comply with Clause 36 of the Listing Agreement.
• SEBI, vide an interim order dated June 03, 2015 in exercise of the powers conferred by virtue of sections 11(1), 11B and 11(4) of the SEBI Act read with Regulation 65 of SEBI (Collective Investment Schemes) Regulations, 1999 issued the following directions on M/s Citrus Check Inns Limited and its Directors viz., Mr. Omprakash Basantlal Goenka, Mr. Prakash Ganpat Utekar, Mr. Venkatraman Natarajan and Mr. Narayan Shivram Kotnis for running a Ponzi Scheme and mis- selling its schemes to the public:
a. not to collect any fresh money from customers/investors under its existing scheme;
b. not to launch any new schemes or plans in this company,
c. not to raise any fresh moneys from any other existing company within the group;
d. not to float any new companies to raise fresh moneys under such schemes,
e. to immediately submit the full inventory of the assets obtained through money raised by the company;
f. not to dispose of or alienate any of the properties/assets obtained directly or indirectly through money raised by the company;
g. not to divert any funds raised from public at large, kept in bank account(s) and/or in the custody of the company or group companies or promoters or LLPs or Proprietary concerns or any person directly or indirectly controlled through shareholding or management by the company ;
h. to furnish all the information/details sought by SEBI including the following:
REGULATORY ACTIONS TAKEN BY SEBI i. Full list of customers/ investors with
complete particulars such as PAN, address, telephone numbers etc,
ii. Details of rooms available for occupancy/accommodation provided/projected to be provided,
iii. Year-wise number of customers/investors (1) who have actually availed the holiday accommodation under the plan(s)/ subscribed to the plan(s) (2) who have encashed their points into cash.
iv. Details of assets held by the company and its group companies,
v. Full details of Mirah Group (as stated in the Clause 29 of the “Offer Document”) including full inventory of its assets,
vi. Details of charges created on its assets by the company,
vii. Details of amounts mobilized as on March 31, 2014 and March 31, 2015 under its various Holiday plans/schemes,
viii. Details of commission paid on amounts mobilized above,
ix. Details of agents along with their addresses, etc.,
x. Audited Accounts for the financial years i.e. FY 2012-13, 2013-14, and 2014- 15;
xi. Income Tax returns for FY 2012-13, 2013-14, and 2014-15;
xii. Details of fund transfers within group companies and associates and its directors for the year 2012-2013, 2013-2014 and 2014-2015.
• SEBI, vide order dated June 03, 2015 in exercise of the powers conferred by virtue of section 19 read with sections 11(1), 11(4), 11(A) and 11B of the SEBI Act, 1992 issued the following directions on M/s Sun-Plant Business Limited (SBL) for engaging in fund mobilizing activity from the public, through the offer and issue of Redeemable Preference Shares (RPS) without complying with sections 56, 60 read with section 2(36) and 73 of the Companies Act, 1956 and the SEBI (Disclosure and Investor Protection) Guidelines, 2000 read with the SEBI (Issue of Capital and Disclosure Requirements) Regulations, 2009:

649
JULY SEBI BULLETIN 2015
a. The Company, M/s Sun-Plant Business Limited, its promoters and directors including Mr. Basant Kumar Sasmal, Mr. Amit Kumar Chowdhury and Mr. Mahesh Chandra Prasad, jointly and severally, shall forthwith refund the money collected by the Company through the issuance of Redeemable Preference Shares (which have been found to be issued in contravention of the public issue norms stipulated under the Companies Act, 1956 and the SEBI (Issue and Listing of Debt Securities) Regulations, 2008), to the investors including the money collected from investors, till date, pending allotment of securities, if any, with an interest of 15% per annum compounded at half yearly intervals, from the date when the repayments became due (in terms of Section 73(2) of the Companies Act, 1956) to the investors till the date of actual payment.
b. As noted above, the Company has claimed to have repaid a sum of `2,28,24,400/- to its investors. If the Company has actually made any repayments to its investors of the amounts collected from them along with promised returns, the above directions shall be applicable for the amounts due to be returned to remaining investors. However, such repayments as claimed to have been already made by the Company, shall be certified by Chartered Accountants, as directed in sub-paragraph (f) below.
c. The repayments to investors shall be effected only in cash through Bank Demand Draft or Pay Order.
d. SBL /its present management are permitted to sell the assets of the Company only for the sole purpose of making the refunds as directed above and deposit the proceeds in an Escrow Account opened with a nationalised Bank.
e. SBL and its promoters and directors shall issue public notice, in all editions of two National Dailies (one English and one Hindi) and in one local daily (in Bengali) with wide circulation, detailing the modalities for refund, including details of contact persons including names, addresses and contact details, within fifteen days of this Order coming into effect.
f. After completing the aforesaid repayments, the Company shall file a certificate of such completion with SEBI from two independent peer reviewed Chartered Accountants who are in the panel of any public authority or public institution. For the purpose of this Order, a peer reviewed Chartered Accountant shall mean a Chartered Accountant, who has been categorized so by the Institute of Chartered Accountants of India.
g. SBL is directed not to, directly or indirectly, access the capital market by issuing prospectus, offer document or advertisement soliciting money from the public and are further restrained and prohibited from buying, selling or otherwise dealing in the securities market, directly or indirectly in whatsoever manner, from the date of this Order till the expiry of 4 years from the date of completion of refunds to investors as directed above.
h. The directors Mr. Basant Kumar Sasmal, Mr. Amit Kumar Chowdhury and Mr. Mahesh Chandra Prasad are restrained from accessing the securities market and further prohibited from buying, selling or otherwise dealing in the securities market, directly or indirectly in whatsoever manner, with immediate effect. They are also restrained from associating themselves with any listed public company and any public company which intends to raise money from the public, or any intermediary registered with SEBI.
• SEBI, vide order dated June 03, 2015 in exercise of the powers conferred by virtue of sections 11, 11(4), 11(A) and 11B of the SEBI Act, 1992 issued the following directions on M/s Neesa Technologies Limited (NTL) alleging non–payment of amounts arising from subscription of Non–Convertible Debentures (NCDs):
a. NTL shall forthwith cease to mobilize funds from investors through the Offer of NCDs or through the issuance of equity shares or any other securities, to the public and/or invite subscription, in any manner whatsoever, either directly or indirectly till further directions;

650
JULY SEBI BULLETIN 2015
b. NTL and its present Directors, viz. Shri Arvind Gupta, Shri Yogesh Ghisumal Gemawat, Shri Girishchandra Mukundram Baluni, Shri Sanjay Gupta, Shri Kamlendra Joshi, Shri Manoj Singhal and Shri Suresh Kumar, are prohibited from issuing prospectus or any offer document or issue advertisement for soliciting money from the public for the issue of securities, in any manner whatsoever, either directly or indirectly, till further orders;
c. The past Director of NTL, viz. Shri Nimain Charan Biswal, is prohibited from issuing prospectus or any offer document or issue advertisement for soliciting money from the public for the issue of securities, in any manner whatsoever, either directly or indirectly, till further orders;
d. NTL and its abovementioned past and present Directors, are restrained from accessing the securities market and further prohibited from buying, selling or otherwise dealing in the securities market, either directly or indirectly, till further directions;
e. NTL shall provide a full inventory of all its assets and properties;
f. NTL’s abovementioned past and present Directors shall provide a full inventory of all their assets and properties;
g. NTL and its abovementioned present Directors shall not dispose of any of the properties or alienate or encumber any of the assets owned/acquired by that company through the Offer of NCDs, without prior permission from SEBI;
h. NTL and its abovementioned present Directors shall not divert any funds raised from public at large through the Offer of NCDs, which are kept in bank account(s) and/or in the custody of NTL;
• SEBI, vide an interim order dated June 04, 2015 in exercise of the powers conferred by virtue of sections 11, 11(4), 11(A) and 11B of the SEBI Act, 1992 issued the following directions on M/s ASSR Agro India Limited (AAIL) alleging non–payment of amounts arising from subscription of Non–Convertible Debentures (NCDs):
a. AAIL shall forthwith cease to mobilize funds from investors through the Offer of NCDs or through the issuance of equity shares or any other securities, to the public and/or invite subscription, in any manner whatsoever, either directly or indirectly till further directions;
b. AAIL and its present Directors, viz. Shri Shyamal Mondal, Shri Subir Chakravarty, Smt. Shalini Chakraborty, are prohibited from issuing prospectus or any offer document or issue advertisement for soliciting money from the public for the issue of securities, in any manner whatsoever, either directly or indirectly, till further orders;
c. The past Directors of AAIL, viz. Shri Subhankar Mondal, Shri Partha Sarathi Naskar, Shri Raghu Nath Patra, Shri Amit Bandhu Ghosh, are prohibited from issuing prospectus or any offer document or issue advertisement for soliciting money from the public for the issue of securities, in any manner whatsoever, either directly or indirectly, till further orders;
d. AAIL and its abovementioned past and present Directors, are restrained from accessing the securities market and further prohibited from buying, selling or otherwise dealing in the securities market, either directly or indirectly, till further directions;
e. AAIL shall provide a full inventory of all its assets and properties; vi. AAIL’s abovementioned past and present Directors shall provide a full inventory of all their assets and properties;
f. AAIL and its present Directors shall not dispose of any of the properties or alienate or encumber any of the assets owned/acquired by that company through the Offer of NCDs, without prior permission from SEBI;
g. AAIL and its abovementioned present Directors shall not divert any funds raised from public at large through the Offer of NCDs, which are kept in bank account(s) and/or in the custody of AAIL;

651
JULY SEBI BULLETIN 2015
h. The Debenture Trustees, viz. Shri Ram Bhattacharya and Smt. Pratima Roy, are prohibited from continuing with their assignment as debenture trustees in respect of the Offer of NCDs of AAIL and also from taking up any new assignment or involvement in any new issue of debentures, etc. in a similar capacity, from the date of this order till further directions.
• SEBI, vide order dated June 04, 2015 in exercise of the powers conferred by virtue of section 19 read with sections 11(1), 11(4), 11B and 11D of the SEBI Act, 1992 read with the SEBI (Investment Advisers) Regulations, 2013 issued the following directions on Mr. Ravi Chouksey, Proprietor, M/s Gravita Research Company had acted as an “Investment Adviser” without obtaining registration from SEBI:
a. Mr. Ravi Chouksey and his proprietorship concern i.e, M/s Gravita Research Company are prohibited from buying, selling or otherwise dealing in the securities market, either directly or indirectly, in any manner whatsoever, for a period of 4 years.
b. Mr. Ravi Chouksey and Gravita Research Company shall not undertake, either directly or indirectly, any activity in the securities market without obtaining registration from SEBI as required under the securities laws.
c. Mr. Ravi Chouksey and Gravita Research Company shall expeditiously return the monies received from its clients, if any, in respect of its unregistered investment advisory activities as found in this Order and submit a certificate from a peer reviewed chartered accountant, within a period of 3 months from the date of this Order. For the purpose of this Order, a peer reviewed Chartered Accountant shall mean a Chartered Accountant, who has been categorized so by the Institute of Chartered Accountants of India.
• SEBI, vide an interim order dated June 05, 2015 in exercise of the powers conferred by virtue of sections 11, 11(4), 11(A) and 11B of the SEBI Act, 1992 read with the SEBI (Issue and Listing of Debt Securities), Regulations, 2008 and the Companies Act, 1956 on M/s STPL Infrastructures Limited
(SIL) for illegal mobilisation of funds through Non–Convertible Debentures (NCDs):
a. SIL shall forthwith cease to mobilize any fresh funds from investors through the Offer of NCDs or through the issuance of equity shares or any other securities, to the public and/or invite subscription, in any manner whatsoever, either directly or indirectly till further directions;
b. SIL and its Directors, viz. Shri Arindam Sarkar, Shri Swapan Nandi, Shri Dulal Chatterjee are prohibited from issuing prospectus or any offer document or issue advertisement for soliciting money from the public for the issue of securities, in any manner whatsoever, either directly or indirectly, till further orders;
c. SIL and its abovementioned Directors, are restrained from accessing the securities market and further prohibited from buying, selling or otherwise dealing in the securities market, either directly or indirectly, till further directions;
d. SIL shall provide a full inventory of all its assets and properties;
e. SIL’s abovementioned Directors shall provide a full inventory of all their assets and properties;
f. SIL and its abovementioned Directors shall not dispose of any of the properties or alienate or encumber any of the assets owned/acquired by that company through the Offer of NCDs, without prior permission from SEBI;
g. SIL and its abovementioned Directors shall not divert any funds raised from public at large through the Offer of NCDs, which are kept in bank account(s) and/or in the custody of SIL;
h. SIL shall provide to SEBI all information regarding repayments made to the holders of Non-Convertible Redeemable Secured Debentures including name of the debenture holder, address, amount mobilized, number of Non-Convertible Redeemable Secured Debentures issued, promised maturity amount with date of maturity, amount refunded and date thereof;

652
JULY SEBI BULLETIN 2015
i. The Debenture Trustee, viz. STPL Debenture Trust (represented by its Trustee, viz. Shri Amit Biswas), is prohibited from continuing with its present assignment as a debenture trustee in respect of the Offer of NCDs of SIL and also from taking up any new assignment or involvement in any new issue of debentures, etc. in a similar capacity, from the date of this Order till further directions.
• SEBI, vide an interim order dated June 05, 2015 in exercise of the powers conferred by virtue of sections 11, 11(4), 11(A) and 11B of the SEBI Act, 1992 on M/s AVM Real Estate & Allied Limited (AVM) for illegal mobilisation of funds through Non–Convertible Debentures (NCDs):
a. AVM shall forthwith cease to mobilize any fresh funds from investors through the Offer of Redeemable Preference Shares or through any other securities, to the public and/or invite subscription, in any manner whatsoever, either directly or indirectly, till further directions;
b. AVM and its directors, viz. Shri Rajeshwar Prasad Dwivedi, Shri Anil Kumar Sahu, Shri Mahendra Kumar Sahu and Shri Ashutosh Dwivedi are prohibited from issuing prospectus or any offer document or issue advertisement for soliciting money from the public for the issue of securities, in any manner whatsoever, either directly or indirectly, till further orders;
c. AVM and its abovementioned Directors, are restrained from accessing the securities market and further prohibited from buying, selling or otherwise dealing in the securities market, either directly or indirectly, till further directions.
d. AVM shall provide a full inventory of all its assets and properties;
e. The Directors of AVM shall provide a full inventory of all their assets and properties;
f. AVM and its abovementioned Directors shall not dispose of any of the properties or alienate or encumber any of the assets owned/acquired by that company through the Offer of Redeemable Preference Shares, without prior permission from SEBI;
g. AVM and its abovementioned Directors shall not divert any funds raised from public at large through the Offer of Redeemable Preference Shares, which are kept in bank account(s) and/or in the custody of AVM;
h. AVM shall furnish information with regard to list of all the persons who had applied for Redeemable Preference Shares along with their contact details, addresses and details of investment amounts. AVM shall also provide full details of refunds, including dates of such refunds;
• SEBI, vide order dated June 09, 2015 in exercise of the powers conferred by virtue of section 19 read with provisions of section 11(1), section 11(2) (j) of the SEBI Act, 1992 and sections 4, 5 and 12A of the Securities Contracts (Regulation) Act, 1956 allowed the exit of M/s. Uttar Pradesh Stock Exchange Limited as a stock exchange and directed to:-
a. Comply with its tax obligations under Income Tax Act, 1961;
b. Comply with the undertakings given by it to SEBI;
c. Comply with other consequential conditions of Exit Circular, 2012; and
d. Change its name and not to use the expression “Stock Exchange” or any variant of this expression in its name and to avoid any representation of present or past affiliation with the stock exchange, in all media.
• SEBI, vide order dated June 09, 2015 in exercise of the powers conferred by virtue of section 19 read with provisions of section 11(1), section 11(2) (j) of the SEBI Act, 1992 and sections 4, 5 and 12A of the Securities Contracts (Regulation) Act, 1956 allowed the exit of M/s. Madhya Pradesh Stock Exchange Limited as a stock exchange and directed to:-
a. Comply with its tax obligations under Income Tax Act, 1961;
b. Comply with the undertakings given by it to SEBI;
c. Comply with other consequential conditions of Exit Circular, 2012; and
d. Change its name and not to use the expression “Stock Exchange” or any

653
JULY SEBI BULLETIN 2015
variant of this expression in its name and to avoid any representation of present or past affiliation with the stock exchange, in all media.
e. provide required information to the Ministry of Corporate Affairs on identifying vanishing companies which were listed on Madhya Pradesh Stock Exchange Limited for inclusion in the list of vanishing companies maintained by the Ministry of Corporate Affairs.
• SEBI, vide order dated June 11, 2015 in exercise of the powers conferred by virtue of section 19 read with provisions of section 11(4), section 11B of the SEBI Act, 1992 read with Regulation 11(1) of the SEBI (Prohibition of Fraudulent and Unfair Trade Practices relating to Securities Market) Regulations, 2003 directed that Mr. Ashlesh Shah is prohibited from buying, selling or dealing in the securities market, in any manner whatsoever for a period of five years in the matter of trading activity in the scrip of M/s. Rotam Commercials Limited (presently known as M/s. Sword Edge Commercials Limited).
• SEBI, vide order dated June 11, 2015 in exercise of the powers conferred by virtue of section 19 read with provisions of section 11(4), section 11B of the SEBI Act, 1992 read with Regulation 11(1) of the SEBI (Prohibition of Fraudulent and Unfair Trade Practices relating to Securities Market) Regulations, 2003 directed that Mr Dhirenkumar Dharamdas Agarwal is prohibited from buying, selling or dealing in the securities market, in any manner whatsoever for a period of five years in the matter of trading activity in the scrip of M/s. Rotam Commercials Limited (presently known as M/s. Sword Edge Commercials Limited).
• SEBI, vide order dated June 15, 2015 in exercise of the powers conferred by virtue of section 19 read with provisions of section 11(1), 11(B) and 11(D) of the SEBI Act, 1992 directed M/s. HBJ Capital Services Pvt. Ltd. and its Directors viz. Mr. Kumar Harendra, Ms. Amrita Singh, Mr. Abhishek Kumar Singh, Mr. Jitendra Kumar, Ms. Arunmozhi Gopalan and Mr. Ponnuraj Gokulraj and M/s HBJ Capital Ventures LLP and its designated partners viz. Mr. Kumar Harendra and Ms. Amrita Singh to:-
i. cease and desist from acting as an Investment Adviser and Alternative Investment
Fund and cease to solicit or undertake such activities or any other unregistered activities in the securities market directly or indirectly, any manner whatsoever;
ii. immediately withdraw and remove all advertisements, representations, Literatures, brochures, materials, publications, documents, websites, etc. in relation to those schemes/activities (investment adviser and Alternative Investment Fund) or any unregistered activity in the securities market,
iii. not to divert any funds raised from investors, kept in bank account(s) and/or in the custody of M/s HBJ Capital or its directors and M/s HBJ Capital LLP and its designated partners;
iv. furnish all the information sought by SEBI, vide letter dated August 6, 2014 including,
a. the details of various services offered by the company/LLP,
b. present Asset Under Management (AUM) of each of the services offered by M/s HBJ Capital LLP from the date of initiation,
c. break up of AUM under various asset classes,
d. details of clients availing various schemes offered by them, such as names, joining date, name of scheme, end date, KYC particulars etc.,
e. client-wise details of fund mobilized, f. demat accounts statements of M/s
HBJ Capital and M/s HBJ Capital LLP.
• SEBI, vide order dated June 15, 2015 in exercise of the powers under section 11(1), 11(4), 11A and 11B of the SEBI Act, 1992 read with SEBI (Issue and Listing of Debt Securities), Regulations, 2008 and SEBI (Debenture Trustees) Regulations, 1993 issued the following directions against M/s Polaris Realtors India Limited (PRIL):-
i. PRIL shall forthwith cease to mobilize any fresh funds from investors through the Offer of NCDs or through the issuance of equity shares or any other securities, to the public and/or invite subscription, in any manner whatsoever, either directly or indirectly till further directions;

654
JULY SEBI BULLETIN 2015
ii. PRIL and its Directors, viz. Shri Jafar Ali Molla, Shri Kartick Chandar Das and Shri Gopal Nayek are prohibited from issuing prospectus or any offer document or issue advertisement for soliciting money from the public for the issue of securities, in any manner whatsoever, either directly or indirectly, till further orders;
iii. PRIL and its abovementioned Directors, are restrained from accessing the securities market and further prohibited from buying, selling or otherwise dealing in the securities market, either directly or indirectly, till further directions;
iv. PRIL shall provide a full inventory of all its assets and properties;
v. PRIL’s abovementioned Directors shall provide a full inventory of all their assets and properties;
vi. PRIL and its abovementioned Directors shall not dispose of any of the properties or alienate or encumber any of the assets owned/acquired by that company through the Offer of NCDs, without prior permission from SEBI;
vii. PRIL and its abovementioned Directors shall not divert any funds raised from public at large through the Offer of NCDs, which are kept in bank account(s) and/or in the custody of PRIL;
viii. PRIL shall provide to SEBI all information regarding repayments made to the holders of Non-Convertible Redeemable Secured Debentures including name of the debenture holder, address, amount mobilized, number of Non-Convertible Redeemable
ix. Secured Debentures issued, promised maturity amount with date of maturity, amount refunded and date thereof
• SEBI, vide order dated June 16, 2015 in exercise of the powers conferred under Section 19 of the SEBI Act, 1992 read with section 11(1), 11(4) and 11B thereof and Regulation 65 of the SEBI (Collective Investment Scheme) Regulation, 1999, issued the following directions on M/s Capacious Farming Pvt. Limited for offering schemes without obtaining registration from SEBI in contravention of the provisions of
Section 12(1B) of the SEBI Act,1992 and Regulation 3 of the SEBI (Collective Investment Scheme) Regulation, 1999:
i. M/s Capacious Farming Pvt. Limited and its directors viz., Mr. Gaurav Yadav, Mr. Gurbakhsh Singh and Ms. Narmin Kaur Yadav shall abstain from collecting any money from the investors or launch or carry out any Collective Investment Schemes including the schemes which have been identified as a Collective Investment Scheme in this Order.
ii. M/s Capacious Farming Pvt. Limited and its directors viz., Mr. Gaurav Yadav, Mr. Gurbakhsh Singh and Ms. Narmin Kaur Yadav are restrained from accessing the securities market and are prohibited from buying, selling or otherwise dealing in securities market for a period of four years.
iii. M/s Capacious Farming Pvt. Limited and its directors viz., Mr. Gaurav Yadav, Mr. Gurbakhsh Singh and Ms. Narmin Kaur Yadav shall wind up the existing Collective Investment Schemes and refund the money collected by the said company under the schemes with returns which are due to its investors as per the terms of offer within a period of three months from the date of this Order and thereafter within a period of fifteen days, submit a winding up and repayment report to SEBI in accordance with the SEBI (Collective Investment Schemes) Regulations, 1999, including the trail of funds claimed to be refunded, bank account statements indicating refund to the investors and receipt from the investors acknowledging such refunds.
iv. M/s Capacious Farming Pvt. Limited and its directors viz., Mr. Gaurav Yadav, Mr. Gurbakhsh Singh and Ms. Narmin Kaur Yadav shall not alienate or dispose off or sell any of the assets of Capacious Farming Pvt. Limited except for the purpose of making refunds to its investors as directed above.
v. M/s Capacious Farming Pvt. Limited and its directors viz., Mr. Gaurav Yadav, Mr. Gurbakhsh Singh and Ms. Narmin Kaur Yadav are also directed to provide a full inventory of all their assets and properties
655
JULY SEBI BULLETIN 2015
and details of all their bank accounts, demat accounts and holdings of shares/securities, if held in physical form.
vi. In the event of failure by M/s Capacious Farming Pvt. Limited and its directors viz., Mr. Gaurav Yadav, Mr. Gurbakhsh Singh and Ms. Narmin Kaur Yadav to comply with the above directions, the following actions shall follow: -
a. M/s Capacious Farming Pvt. Limited and its directors viz., Mr. Gaurav Yadav, Mr. Gurbakhsh Singh and Ms. Narmin Kaur Yadav shall remain restrained from accessing the securities market and would further be prohibited from buying, selling or otherwise dealing in securities, even after the period of four years of restraint imposed in paragraph 12(b) above, till all the Collective Investment Schemes of Capacious Farming Pvt. Limited are wound up and all the monies mobilized through such schemes are refunded to its investors with returns which are due to them.
b. SEBI would make a reference to the State Government/ Local Police to register a civil/ criminal case against Capacious Farming Pvt. Limited, its promoters, directors and its managers/ persons in-charge of the business and its schemes, for offences of fraud, cheating, criminal breach of trust and misappropriation of public funds; and
c. SEBI would make a reference to the Ministry of Corporate Affairs, to initiate the process of winding up of the company, Capacious Farming Pvt. Limited.
d. SEBI shall initiate attachment and recovery proceedings under the SEBI Act and rules and regulations framed thereunder.
• SEBI, vide an interim order dated June 17, 2015 in exercise of the powers under section 11(1), 11(4), 11A and 11B of the SEBI Act, 1992 read with SEBI (Issue and Listing of Debt Securities),
Regulations, 2008 and SEBI (Debenture Trustees) Regulations, 1993 issued the following directions against M/s Bhabiswajyoti Infrastructure India Limited (BIIL) for non-repayment of investor’s money in Secured Non-Convertible Redeemable Debentures (NCRDs):-
i. BIIL shall forthwith cease to mobilize any fresh funds from investors through the Offer of NCRDs or through the issuance of equity shares or any other securities, to the public and/or invite subscription, in any manner whatsoever, either directly or indirectly till further directions;
ii. BIIL and its present/past Directors, viz. Mr. Pradipta Chakraborty, Mr. Srikumar Chakraborty, Mr. Gopal Sharma, Mr. Prashant Sharma, Ms. Soma Sharma, Mr. Arindam Mukherjee, Mr. Mahindra Nath Chowdhury and Mr. Mahesh Shaw are prohibited from issuing prospectus or any offer document or issue advertisement for soliciting money from the public for the issue of securities, in any manner whatsoever, either directly or indirectly, till further orders;
iii. BIIL and its abovementioned Directors, are restrained from accessing the securities market and further prohibited from buying, selling or otherwise dealing in the securities market, either directly or indirectly, till further directions;
iv. BIIL shall provide a full inventory of all its assets and properties;
v. BIIL’s abovementioned Directors shall provide a full inventory of all their assets and properties;
vi. BIIL and its abovementioned Directors shall not dispose of any of the properties or alienate or encumber any of the assets owned/acquired by that company through the Offer of NCRDs, without prior permission from SEBI;
vii. BIIL and its abovementioned present Directors shall not divert any funds raised from public at large through the Offer of NCRDs, which are kept in bank account(s) and/or in the custody of BIIL;
viii. BIIL shall furnish complete information sought by SEBI vide letters dated March

656
JULY SEBI BULLETIN 2015
14, 2014, July 18, 2014 and August 19, 2014 including the balance sheets of the company for FY 2012-13 to 2014-15.
ix. The Debenture Trustee, viz. Bhabiswajyoti Debenture Trust and its trustee, viz. Mr. Sanjoy Chaudhuri are prohibited from continuing with its present assignment as a debenture trustee in respect of the Offer of NCRDs of BIIL and also from taking up any new assignment or involvement in any new issue of debentures, etc. in a similar capacity, from the date of this order till further directions.
• SEBI, vide an interim order dated June 17, 2015 in exercise of the powers under section 11(1), 11(4), 11A and 11B of the SEBI Act, 1992 read with SEBI (Issue and Listing of Debt Securities), Regulations, 2008 and Companies Act, 1956 issued the following directions against M/s Gitanjali Udyog Limited (GUL) for illegal mobilization of funds under the Offer of Non–Convertible Secured Redeemable Debentures (NCDs).
i. GUL shall forthwith cease to mobilize funds from investors through the Offer of NCDs or through the issuance of equity shares or any other securities, to the public and/or invite subscription, in any manner whatsoever, either directly or indirectly till further directions;
ii. GUL and its present Directors, viz. Shri Paramasish Bhadury, Shri Anil Kumar Mishra, Shri Prabir Middey are prohibited from issuing prospectus or any offer document or issue advertisement for soliciting money from the public for the issue of securities, in any manner whatsoever, either directly or indirectly, till further orders;
iii. The past Directors of GUL, viz. Shri Surajeet Ray, Shri Sutanu Sarcar, Shri Sanjay Bahadur, Shri Nonigopal Mondal are prohibited from issuing prospectus or any offer document or issue advertisement for soliciting money from the public for the issue of securities, in any manner whatsoever, either directly or indirectly, till further orders;
iv. GUL and its abovementioned past and present Directors, are restrained from accessing the securities market and further prohibited from buying, selling or otherwise dealing in the securities market, either directly or indirectly, till further directions;
v. GUL shall provide a full inventory of all its assets and properties;
vi. GUL’s abovementioned past and present Directors shall provide a full inventory of all their assets and properties;
vii. GUL and its present Directors shall not dispose of any of the properties or alienate or encumber any of the assets owned/acquired by that company through the Offer of NCDs, without prior permission from SEBI;
viii. GUL and its abovementioned present Directors shall not divert any funds raised from public at large through the Offer of NCDs, which are kept in bank account(s) and/or in the custody of GUL;
ix. GUL and its abovementioned past and present Directors shall furnish complete and relevant information (as sought by SEBI letter dated April 17, 2013 and February 12, 2014) including full details of amount mobilized under the Offer of NCDs till date, list of debenture holders, names and addresses of such debenture holders, date(s) on which debentures were allotted under the Offer of NCDs, etc.;
x. The Debenture Trustees, viz. Shri Amit Samanta and Shri Jagdish Chandra Nag, are prohibited from continuing with their assignment as debenture trustees in respect of the Offer of NCDs of GUL and also from taking up any new assignment or involvement in any new issue of debentures, etc. in a similar capacity, from the date of this order till further directions.
• SEBI, vide an interim order dated June 17, 2015 in exercise of the powers under section 11(1), 11(4), 11A and 11B of the SEBI Act, 1992 read with SEBI (Issue and Listing of Debt Securities), Regulations, 2008 and Companies Act, 1956 issued the following directions against M/s Cell Realcon Corporation Limited (CRCL) for illegal

657
JULY SEBI BULLETIN 2015
mobilization of funds under the Offer of Non–Convertible Secured Redeemable Debentures (NCDs).
i. CRCL shall forthwith cease to mobilize funds from investors through the Offer of NCDs or through the issuance of equity shares or any other securities, to the public and/or invite subscription, in any manner whatsoever, either directly or indirectly till further directions;
ii. CRCL and its present Directors, viz. Shri Kumar Kanti Bhattacharya, Shri Debi Prasad Mookherji, Shri Sourav Bardhan are prohibited from issuing prospectus or any offer document or issue advertisement for soliciting money from the public for the issue of securities, in any manner whatsoever, either directly or indirectly, till further orders;
iii. The past Directors of CRCL, viz. Shri Sekh Rezaul Karim are prohibited from issuing prospectus or any offer document or issue advertisement for soliciting money from the public for the issue of securities, in any manner whatsoever, either directly or indirectly, till further orders;
iv. CRCL and its abovementioned past and present Directors, are restrained from accessing the securities market and further prohibited from buying, selling or otherwise dealing in the securities market, either directly or indirectly, till further directions;
v. CRCL shall provide a full inventory of all its assets and properties;
vi. CRCL’s abovementioned past and present Directors shall provide a full inventory of all their assets and properties;
vii. CRCL and its present Directors shall not dispose of any of the properties or alienate or encumber any of the assets owned/acquired by that company through the Offer of NCDs, without prior permission from SEBI;
viii. CRCL and its abovementioned present Directors shall not divert any funds raised from public at large through the Offer of NCDs, which are kept in bank account(s) and/or in the custody of CRCL;
ix. CRCL and its abovementioned past and present Directors shall furnish complete and relevant information (as sought by SEBI letter dated April 17, 2013 and February 12, 2014) including full details of amount mobilized under the Offer of NCDs till date, list of debenture holders, names and addresses of such debenture holders, date(s) on which debentures were allotted under the Offer of NCDs, etc.;
x. The Debenture Trustees, viz. Shri Amit Samanta and Shri Jagdish Chandra Nag, are prohibited from continuing with their assignment as debenture trustees in respect of the Offer of NCDs of CRCL and also from taking up any new assignment or involvement in any new issue of debentures, etc. in a similar capacity, from the date of this order till further directions.
• SEBI, vide an interim order dated June 17, 2015 in exercise of the powers under section 11(1), 11(4), 11B and 11D read with Section 19 of the SEBI Act, 1992 issued the following directions on M/s VPS Advisory Services for engaging in providing portfolio management services to investors without necessary registration for the same as mandated by Section 12(1) of SEBI Act, 1992 read with Regulation 3 of SEBI (Portfolio Managers) Regulations, 1993:
i. to cease and desist from acting as portfolio manager and not to solicit or undertake such activity or any other activities in the securities market, directly or indirectly, in any manner whatsoever;
ii. Immediately withdraw and remove all advertisements, representations, literatures, brochures, materials, publications, documents, website etc. in relation to their portfolio management activities in the securities market;
iii. Not to raise any funds from investors and not to divert any funds already raised from investors.
• SEBI, vide an interim order dated June 18, 2015 in exercise of the powers under section 11(1), 11(4), 11A and 11B of the SEBI Act, 1992 read with SEBI (Issue and Listing of Debt Securities), Regulations, 2008 and Companies Act, 1956 issued the following directions against M/s
658
JULY SEBI BULLETIN 2015
Eris Energy Limited (EEL) for non–repayment of amounts arising from subscription of Offer of Non–Convertible Secured Redeemable Debentures (NCDs).
i. EEL shall forthwith cease to mobilize funds from investors through the Offer of NCDs or through the issuance of equity shares or any other securities, to the public and/or invite subscription, in any manner whatsoever, either directly or indirectly till further directions;
ii. EEL and its present Directors, viz. Shri Devid Haslaf, Shri Kedar Chandra Bera, Shri. Miarul Sekh, are prohibited from issuing prospectus or any offer document or issue advertisement for soliciting money from the public for the issue of securities, in any manner whatsoever, either directly or indirectly, till further orders;
iii. The past Directors of EEL, viz. Shri Subhrajit Banik, Smt. Uma Shankar Shaw, Shri Debdulal Banik Chowdhury, Shri Avjit Chowdhury, Shri Roy Sougata, Shri Arjun, Subrata Das, Smt. Sumita Das, Shri Sekhar Chandra Koley, Shri. Himdari Bag are prohibited from issuing prospectus or any offer document or issue advertisement for soliciting money from the public for the issue of securities, in any manner whatsoever, either directly or indirectly, till further orders;
iv. EEL and its abovementioned past and present Directors, are restrained from accessing the securities market and further prohibited from buying, selling or otherwise dealing in the securities market, either directly or indirectly, till further directions;
v. EEL shall provide a full inventory of all its assets and properties;
vi. EEL’s abovementioned past and present Directors shall provide a full inventory of all their assets and properties;
vii. EEL and its present Directors shall not dispose of any of the properties or alienate or encumber any of the assets owned/acquired by that company through the Offer of NCDs, without prior permission from SEBI;
viii. EEL and its abovementioned present Directors shall not divert any funds raised from public at large through the Offer of NCDs, which are kept in bank account(s) and/or in the custody of EEL;
ix. EEL and its abovementioned past and present Directors shall furnish complete and relevant information (as sought by SEBI letters dated August 29, 2013) including full details of amount mobilized under the Offer of NCDs till date, list of debenture holders, names and addresses of such debenture holders, date(s) on which debentures were allotted under the Offer of NCDs, etc.;
x. The Debenture Trustees, viz. Shri Bijay Sarkar, Shri Rabin Kundu and Shri Pallab Pandit, are prohibited from involvement in any new issue of debentures, etc. in a capacity similar to their assignment as debenture trustees in respect of the Offer of NCDs of EEL, from the date of this order till further directions.
• SEBI, vide an interim order dated June 18, 2015 in exercise of the powers under section 11(1), 11(4), 11A and 11B of the SEBI Act, 1992 read with SEBI (Issue and Listing of Debt Securities), Regulations, 2008 and Companies Act, 1956 issued the following directions against M/s Greenbang Agro Limited (GAL) for illegal mobilization of funds through the issue of Secured Non–Convertible Redeemable Debentures (NCDs).
i. GAL shall forthwith cease to mobilize funds from investors through the Offer of NCDs or through the issuance of equity shares or any other securities, to the public and/or invite subscription, in any manner whatsoever, either directly or indirectly till further directions;
ii. GAL and its present Directors, viz. Shri Paritosh Panda, Shri Dhiman Roy, Shri Nitish Barman are prohibited from issuing prospectus or any offer document or issue advertisement for soliciting money from the public for the issue of securities, in any manner whatsoever, either directly or indirectly, till further orders;

659
JULY SEBI BULLETIN 2015
iii. The past Directors of GAL, viz. Shri Satyendra Nath Mondal, Shri Subhra Jyoti Sardar, Shri Sreemon Ghosh, Shri Taslim Arif Khan, Smt. Nilima Ponda, Smt. Lipika Bhaduri and Shri Baidyanath Mandal are prohibited from issuing prospectus or any offer document or issue advertisement for soliciting money from the public for the issue of securities, in any manner whatsoever, either directly or indirectly, till further orders;
iv. GAL and its abovementioned past and present Directors, are restrained from accessing the securities market and further prohibited from buying, selling or otherwise dealing in the securities market, either directly or indirectly, till further directions;
v. GAL shall provide a full inventory of all its assets and properties;
vi. GAL’s abovementioned past and present Directors shall provide a full inventory of all their assets and properties;
vii. GAL and its present Directors shall not dispose of any of the properties or alienate or encumber any of the assets owned/acquired by that company through the Offer of NCDs, without prior permission from SEBI;
viii. GAL and its abovementioned present Directors shall not divert any funds raised from public at large through the Offer of NCDs, which are kept in bank account(s) and/or in the custody of EEL;
ix. GAL and its abovementioned past and present Directors shall furnish complete and relevant information (as sought by SEBI letters dated August 29, 2013) including full details of amount mobilized under the Offer of NCDs till date, list of debenture holders, names and addresses of such debenture holders, date(s) on which debentures were allotted under the Offer of NCDs, etc.;
x. The Debenture Trustees, viz. Rural Economic Welfare Trust (represented by Smt. Durga Ghosh and Shri Ramendra Nath Mistry), is prohibited from continuing with its assignment as debenture trustee in
respect of the Offer of NCDs of GAL and also from taking up any new assignment or involvement in any new issue of debentures, etc. in a similar capacity, from the date of this order till further directions.
• SEBI, vide an interim order dated June 19, 2015 in exercise of the powers under section 11(1), 11(4), 11A and 11B of the SEBI Act, 1992 read with SEBI (Issue and Listing of Debt Securities), Regulations, 2008 and Companies Act, 1956 issued the following directions against M/s Goldmine Agro Limited (GAL) for illegal mobilization of funds through the issue of Secured Non–Convertible Redeemable Debentures (NCDs).
i. GAL shall forthwith cease to mobilize funds from investors through the Offer of NCDs or through the issuance of equity shares or any other securities, to the public and/or invite subscription, in any manner whatsoever, either directly or indirectly till further directions;
ii. GAL and its present Directors, viz. Shri Tushar Sur, Shri Bablu Saha, Shri Joydip Mukhopadhyay are prohibited from issuing prospectus or any offer document or issue advertisement for soliciting money from the public for the issue of securities, in any manner whatsoever, either directly or indirectly, till further orders;
iii. The past Director of GAL, Shri Samir Kumar Mukherjee are prohibited from issuing prospectus or any offer document or issue advertisement for soliciting money from the public for the issue of securities, in any manner whatsoever, either directly or indirectly, till further orders;
iv. GAL and its abovementioned past and present Directors, are restrained from accessing the securities market and further prohibited from buying, selling or otherwise dealing in the securities market, either directly or indirectly, till further directions;
v. GAL shall provide a full inventory of all its assets and properties;
vi. GAL’s abovementioned past and present Directors shall provide a full inventory of all their assets and properties;

660
JULY SEBI BULLETIN 2015
vii. GAL and its present Directors shall not dispose of any of the properties or alienate or encumber any of the assets owned/acquired by that company through the Offer of NCDs, without prior permission from SEBI;
viii. GAL and its abovementioned present Directors shall not divert any funds raised from public at large through the Offer of NCDs, which are kept in bank account(s) and/or in the custody of EEL;
ix. GAL and its abovementioned past and present Directors shall furnish complete and relevant information (as sought by SEBI letters dated November 5, 2012 and May 13, 2014).
x. The Debenture Trustees, viz. Goldmine Debenture Trust (represented by Smt. Sujata Saha) is prohibited from continuing with its assignment as debenture trustee in respect of the Offer of NCDs of GAL and also from taking up any new assignment or involvement in any new issue of debentures, etc. in a similar capacity, from the date of this order till further directions.
• SEBI, vide interim order dated June 22, 2015 in exercise of the powers conferred by virtue of sections 11(1), 11(4), 11A and 11B of the SEBI Act, 1992 read with the SEBI (Issue and Listing of Debt Securities) Regulations, 2008, the Companies Act, 1956 issued the following directions against M/s. Omisha Agri Industries (India) Ltd (OAIL)and its past/present Directors regarding illegal mobilization of funds :-
a. OAIIL shall forthwith cease to mobilize any fresh funds from investors through the Offer of NCRSDs or through the issuance of equity shares or any other securities, to the public and/or invite subscription, in any manner whatsoever, either directly or indirectly till further directions;
b. OAIIL and its past/present Directors are prohibited from issuing prospectus or any offer document or issue advertisement for soliciting money from the public for the issue of securities, in any manner whatsoever, either directly or indirectly, till further orders;
c. OAIIL and its Directors, are restrained from accessing the securities market and further prohibited from buying, selling or otherwise dealing in the securities market, either directly or indirectly, till further directions;
d. OAIIL shall provide a full inventory of all its assets and properties;
e. OAIIL’s Directors shall provide a full inventory of all their assets and properties;
f. OAIIL and its abovementioned Directors shall not dispose of any of the properties or alienate or encumber any of the assets owned/acquired by that company through the Offer of Non-Convertible Secured Redeemable Debentures (NCRSDs), without prior permission from SEBI;
g. OAIIL and its present Directors shall not divert any funds raised from public at large through the Offer of NCRSDs, which are kept in bank account(s) and/or in the custody of OAIIL;
h. OAIIL shall furnish complete information as sought by SEBI vide letters dated March 28, 2013, August 06, 2013, November 06, 2013 and August 12, 2014 including balance sheets of the company for FY 2012-13 to 2014-15 within 21 days from the date of receipt of this Order.
i. The Debenture Trustee, viz. M/s. Omisha Debenture Trust (represented by trustee Ms. Sumana Garai), is prohibited from continuing the present assignment as a debenture trustee in respect of the Offer of NCRSDs of OAIIL and also from taking up any new assignment or involvement in any new issue of debentures, etc. in a similar capacity, from the date of this order till further directions.
• SEBI, vide interim order dated June 22, 2015 in exercise of the powers conferred by virtue of sections 11(1), 11(4), 11A and 11B of the SEBI Act, 1992 read with the SEBI (Issue and Listing of Debt Securities) Regulations, 2008, the Companies Act, 1956 issued the following directions in relation to fund mobilization through issuance of Non–Convertible Secured Redeemable Debentures (NCDs) by M/s Goldmine Industries Limited (GIL):
661
JULY SEBI BULLETIN 2015
a. GIL shall forthwith cease to mobilize funds from investors through the Offer of NCDs or through the issuance of equity shares or any other securities, to the public and/or invite subscription, in any manner whatsoever, either directly or indirectly till further directions;
b. GIL and its Directors, viz. Shri Tushar Sur, Shri Dinobandhu Mondal, Shri Bablu Saha, Shri Joydip Mukhopadhyay, are prohibited from issuing prospectus or any offer document or issue advertisement for soliciting money from the public for the issue of securities, in any manner whatsoever, either directly or indirectly, till further orders;
c. GIL and its abovementioned Directors, are restrained from accessing the securities market and further prohibited from buying, selling or otherwise dealing in the securities market, either directly or indirectly, till further directions;
d. GIL shall provide a full inventory of all its assets and properties;
e. GIL’s abovementioned Directors shall provide a full inventory of all their assets and properties;
f. GIL and its abovementioned Directors shall not dispose of any of the properties or alienate or encumber any of the assets owned/acquired by that company through the Offer of NCDs, without prior permission from SEBI;
g. GIL and its abovementioned Directors shall not divert any funds raised from public at large through the Offer of NCDs, which are kept in bank account(s) and/or in the custody of GIL;
h. GIL and its abovementioned Directors shall furnish complete and relevant information (as sought by SEBI letter dated December 6, 2013), within 14 days from the date of receipt of this Order;
i. The Debenture Trustee, viz. M/s. Goldmine Debenture Trust (represented by Smt. Sujata Saha), is prohibited from continuing with its assignment as debenture trustee in respect of the Offer of NCDs of GIL and also from taking up
any new assignment or involvement in any new issue of debentures, etc. in a similar capacity, from the date of this order till further directions.
• SEBI, vide interim order dated June 22, 2015 in exercise of the powers conferred by virtue of sections 11(4) and 11B of the SEBI Act, 1992 read with SEBI (Collective Investment Schemes) Regulations, 1999 issued following directions in the matter of illegal mobilization of funds by M/s IPN Developers & Allied Limited:
a. not to collect any fresh moneys from investors from its existing scheme;
b. not to launch any new scheme/plan or float any new companies/firm to raise fresh moneys;
c. not to dispose of any of the properties or alienate the assets of the existing scheme;
d. not to divert any funds raised from public at large, kept in bank account(s) and/or in the custody of the company;
e. to immediately submit the full inventory of the assets owned by IPN Developers out of the amounts collected from the “purchasers”/investors under its existing schemes;
f. to furnish all the information sought by SEBI, including,
i. Copies of all the documents pertaining to the scheme, issued to the investors including the document/agreement executed with the investors,
ii. scheme -wise list of investors as on date and their contact numbers and addresses,
iii. the details of amount mobilized till date,
iv. the details of amount refunded till date along with the details of mode of payment, duly certified by a CA,
v. Copies of the registration documents/sale deed in respect of all the land/properties purchased by IPN Developers including the one located at Barkhedakalan,
vi. all documents/information and clarifications sought by SEBI, vide letters dated May 05, 2014, and July 22, 2014 and not yet submitted.

662
JULY SEBI BULLETIN 2015
• SEBI, vide interim order dated June 23, 2015 in exercise of the powers conferred by virtue of sections 11(1), 11(4), 11A and 11B of the SEBI Act, 1992 read with the SEBI (Issue and Listing of Debt Securities) Regulations, 2008, the Companies Act, 1956 issued the following directions in relation to fund mobilization through issuance of Non–Convertible Secured Redeemable Debentures (NCDs) by M/s. Waris Finance and Investment Limited:
a. WFIL shall forthwith cease to mobilize funds from investors through the Offer of NCDs or through the issuance of equity shares or any other securities, to the public and/or invite subscription, in any manner whatsoever, either directly or indirectly till further directions;
b. WFIL and its present Directors, viz. Shri Aziz Ahmed, Shri Imtiaz Khan Warsi and Shri Mohammad Shadab Ali are prohibited from issuing prospectus or any offer document or issue advertisement for soliciting money from the public for the issue of securities, in any manner whatsoever, either directly or indirectly, till further orders;
c. The past Directors of WFIL, viz. Shri Shane Ahmed Warsi, Shri Iftekhar Ahmed, Quraisha Khatoon and Ruhi Ghazala Warsi are prohibited from issuing prospectus or any offer document or issue advertisement for soliciting money from the public for the issue of securities, in any manner whatsoever, either directly or indirectly, till further orders;
d. WFIL and its abovementioned past and present Directors, are restrained from accessing the securities market and further prohibited from buying, selling or otherwise dealing in the securities market, either directly or indirectly, till further directions;
e. WFIL shall provide a full inventory of all its assets and properties; vi. WFIL’s abovementioned past and present Directors shall provide a full inventory of all their assets and properties;
f. WFIL and its abovementioned present Directors shall not dispose of any of the
properties or alienate or encumber any of the assets owned/acquired by that company through the Offer of NCDs, without prior permission from SEBI;
g. WFIL and its abovementioned present Directors shall not divert any funds raised from public at large through the Offer of NCDs, which are kept in bank account(s) and/or in the custody of WFIL;
h. WFIL and its abovementioned present Directors shall furnish complete and relevant information (as sought by SEBI letters dated March 17, 2014 and March 28, 2014), within 14 days from the date of receipt of this Order;
i. The Debenture Trustee, viz. Shri Kallol Saha, is prohibited from continuing with its assignment as debenture trustee in respect of the Offer of NCDs of WFIL and also from taking up any new assignment or involvement in any new issue of debentures, etc. in a similar capacity, from the date of this order till further directions.
• SEBI, vide interim order dated June 23, 2015 in exercise of the powers conferred by virtue of sections 11(1), 11(4), 11A and 11B of the SEBI Act, 1992 read with the SEBI (Issue and Listing of Debt Securities) Regulations, 2008, the Companies Act, 1956 issued the following directions in relation to fund mobilization through issuance of Non–Convertible Secured Redeemable Debentures (NCDs) by M/s. Jugantor Realty Limited (JRL):
a. JRL shall forthwith cease to mobilize funds from investors through the Offer of NCDs or through the issuance of equity shares or any other securities, to the public and/or invite subscription, in any manner whatsoever, either directly or indirectly till further directions;
b. JRL and its present Directors, viz. Shri Sanjit Chakraborty, Shri Ajoy Chakraborty and Shri Sujay Chakraborty are prohibited from issuing prospectus or any offer document or issue advertisement for soliciting money from the public for the issue of securities, in any manner whatsoever, either directly or indirectly, till further orders;

663
JULY SEBI BULLETIN 2015
c. JRL and its abovementioned Directors, are restrained from accessing the securities market and further prohibited from buying, selling or otherwise dealing in the securities market, either directly or indirectly, till further directions;
d. JRL shall provide a full inventory of all its assets and properties;
e. JRL’s abovementioned Directors shall provide a full inventory of all their assets and properties;
f. JRL and its abovementioned Directors shall not dispose of any of the properties or alienate or encumber any of the assets owned/acquired by that company through the Offer of NCDs, without prior permission from SEBI;
g. JRL and its abovementioned Directors shall not divert any funds raised from public at large through the Offer of NCDs, which are kept in bank account(s) and/or in the custody of JRL;
h. JRL and its abovementioned Directors shall furnish complete and relevant information (as sought by SEBI letters dated February 3, 2014 and March 24, 2014), within 14 days from the date of receipt of this Order;
i. The Debenture Trustee, viz. M/s Jugantor Welfare and Development Trust, are prohibited from continuing with its assignment as debenture trustee in respect of the Offer of NCDs of JRL. Shri Mridul Bandopadhyay, Shri Ashok Kumar Banerjee, Jugantor Welfare and Development Trust are also prohibited from taking up any new assignment or involvement in any new issue of debentures, etc. in a similar capacity, from the date of this order till further directions.
• SEBI, vide interim order dated June 23, 2015 in exercise of the powers conferred by virtue of sections 11(1), 11(4), 11A and 11B of the SEBI Act, 1992 read with the SEBI (Issue and Listing of Debt Securities) Regulations, 2008, the Companies Act, 1956 issued the following directions in relation to fund mobilization through issuance of Non–Convertible Secured Redeemable Debentures (NCDs) by M/s Matribhumi Projects (I) Limited (MPL):
a. MPL shall forthwith cease to mobilize funds from investors through the Offer of NCDs or through the issuance of equity shares or any other securities, to the public and/or invite subscription, in any manner whatsoever, either directly or indirectly till further directions;
b. MPL and its present Directors, viz. Shri Rajkrishna Palta and Shri Netai Palta are prohibited from issuing prospectus or any offer document or issue advertisement for soliciting money from the public for the issue of securities, in any manner whatsoever, either directly or indirectly, till further orders;
c. The past Directors of MPL, viz. Shri Debapriya Acharya, Shri Susanta Kumar Chatterjee and Smt. Piyali Sarkar are prohibited from issuing prospectus or any offer document or issue advertisement for soliciting money from the public for the issue of securities, in any manner whatsoever, either directly or indirectly, till further orders;
d. MPL and its abovementioned past and present Directors, are restrained from accessing the securities market and further prohibited from buying, selling or otherwise dealing in the securities market, either directly or indirectly, till further directions;
e. MPL shall provide a full inventory of all its assets and properties;
f. MPL’s abovementioned past and present Directors shall provide a full inventory of all their assets and properties;
g. MPL and its abovementioned present Directors shall not dispose of any of the properties or alienate or encumber any of the assets owned/acquired by that company through the Offer of NCDs, without prior permission from SEBI;
h. MPL and its abovementioned present Directors shall not divert any funds raised from public at large through the Offer of NCDs, which are kept in bank account(s) and/or in the custody of MPL;
i. MPL and its abovementioned present Directors shall furnish complete and
664
JULY SEBI BULLETIN 2015
relevant information (as sought by SEBI letters dated August 25, 2014), within 14 days from the date of receipt of this Order;
j. The Debenture Trustee, viz. Matribhumi Debenture Trust (represented by Shri Amitava Ghosh and Shri Prem Kumar Singh), is prohibited from continuing with its assignment as debenture trustee in respect of the Offer of NCDs of MPL and also from taking up any new assignment or involvement in any new issue of debentures, etc. in a similar capacity, from the date of this order till further directions.
• SEBI, vide interim order dated June 23, 2015 in exercise of the powers conferred by virtue of sections 11(4) and 11B of the SEBI Act, 1992 read with SEBI (Collective Investment Schemes) Regulations, 1999 issued following directions in the matter of illegal mobilization of funds M/s V3 Infrastructure & Estates Private Ltd and its Directors, viz. Mr.Virupapur Santosh Kumar, Mr.Virupapurram Madhusudhan and Ms. Hindupuram Sireesha:
a. not to collect any fresh money from investors from its existing scheme;
b. not to launch any new scheme/plan or float any new companies to raise fresh moneys;
c. not to dispose of any of the properties or alienate the assets of the existing scheme;
d. not to divert any funds raised from public at large, kept in bank account(s) and/or in the custody of the company;
e. to immediately submit the full inventory of the assets owned by M/s V3 Infrastructure & Estates Private Ltd out of the amounts collected from the “customers”/investors under its existing schemes;
f. to furnish all the information sought by SEBI, vide letters dated February 13, 2014 and March 06, 2014 including,
i. Copies of all the documents pertaining to the scheme, issued to the investors including the document/agreement executed with the investors,
ii. Scheme -wise list of investors as on date and their contact numbers and addresses,
iii. Details of amount mobilized till date,
iv. Details of amount refunded till date along with the details of mode of payment, duly certified by a CA,
v. Details of assets held by M/s V3 Infrastructure & Estates Private Ltd and its group companies,
vi. Full details of the Group/Associate Companies of M/s V3 Infrastructure & Estates Private Ltd including full inventory of their assets,
vii. Copies of the registration documents/sale deed in respect of all the land/properties owned/purchased by M/s V3 Infrastructure & Estates Private Ltd,
viii. Financial statements for the last three years duly certified by the statutory auditor,
ix. Income Tax returns for FY 2012-13, 2013-14, and 2014-15;
x. Details of fund transfers within group companies and associates and its directors for the year 2012-2013, 2013-2014 and 2014-2015,
xi. PAN of the company and its directors.
• SEBI, vide interim order dated June 24, 2015 in exercise of the powers conferred by virtue of sections 11(1), 11(4), 11A and 11B of the SEBI Act, 1992 read with the SEBI (Issue and Listing of Debt Securities) Regulations, 2008, the Companies Act, 1956 issued the following directions in relation to illegal fund mobilization from the public through the issue of Redeemable Preference Shares (RPS) by M/s Annex Infrastructure India Limited (AIIL):
a. AIIL shall not mobilize any fresh funds from investors through the Offer of Preference Shares or through the issuance of equity shares or any other securities, to the public and/or invite subscription, in any manner whatsoever, either directly or indirectly till further directions;
b. AIIL and its present Directors, viz. Shri Prasenjit Mazumder, Shri Asim Das and Shri Nirmal Kr. Jha, are prohibited from issuing prospectus or any offer document or issue advertisement for soliciting money

665
JULY SEBI BULLETIN 2015
from the public for the issue of securities, in any manner whatsoever, either directly or indirectly, till further orders;
c. The past Directors of AIIL, viz. Shri Asit Kumar Majumder, Shri Subrat Kr. Mazumder, Shri Shantonu Roy and Shri Rabin Kumar Mal are prohibited from issuing prospectus or any offer document or issue advertisement for soliciting money from the public for the issue of securities, in any manner whatsoever, either directly or indirectly, till further orders;
d. AIIL and its abovementioned past and present Directors, are restrained from accessing the securities market and further prohibited from buying, selling or otherwise dealing in the securities market, either directly or indirectly, till further directions;
e. AIIL shall provide a full inventory of all its assets and properties;
f. The abovementioned past and present Directors of AIIL shall provide a full inventory of all their assets and properties;
g. AIIL and its abovementioned present Directors shall not dispose of any of the properties or alienate or encumber any of the assets owned/acquired by that company through the Offer of Preference Shares, without prior permission from SEBI;
h. AIIL and its abovementioned present Directors shall not divert any funds raised from public at large through the Offer of Preference Shares, which are kept in bank account(s) and/or in the custody of AIIL;
i. AIIL and its abovementioned present Directors shall furnish complete and relevant information in respect of the Offer of preference shares (as sought by SEBI letter dated November 9, 2012 and August 1, 2014) including details of all its shareholders such as name, number of shares held, etc.
• SEBI, vide interim order dated June 25, 2015 in exercise of the powers conferred by virtue of sections 11(1), 11(4), 11A and 11B of the SEBI Act, 1992 read with the SEBI (Issue and
Listing of Debt Securities) Regulations, 2008, the Companies Act, 1956 issued the following directions in relation to fund mobilization through issuance of Non–Convertible Secured Redeemable Debentures (NCDs) by M/s Active Rural Development India Limited (ARDIL):
a. ARDIL shall forthwith cease to mobilize any fresh funds from investors through the Offer of NCDs or through the issuance of equity shares or any other securities, to the public and/or invite subscription, in any manner whatsoever, either directly or indirectly till further directions;
b. ARDIL and its Directors, Shri Dilip Kumar Diwakar, Shri Polaki Umashankar Rao, Shri Ganesh Kumar Singh and Ms Vandana Saha are prohibited from issuing prospectus or any offer document or issue advertisement for soliciting money from the public for the issue of securities, in any manner whatsoever, either directly or indirectly, till further orders;
c. ARDIL and its abovementioned Directors, are restrained from accessing the securities market and further prohibited from buying, selling or otherwise dealing in the securities market, either directly or indirectly, till further directions;
d. ARDIL shall provide a full inventory of all its assets and properties;
e. ARDIL’s abovementioned Directors shall provide a full inventory of all their assets and properties;
f. ARDIL and its abovementioned Directors shall not dispose of any of the properties or alienate or encumber any of the assets owned/acquired by that company through the Offer of NCDs, without prior permission from SEBI;
g. ARDIL and its abovementioned Directors shall not divert any funds raised from public at large through the Offer of NCDs, which are kept in bank account(s) and/or in the custody of ARDIL;
h. ARDIL shall provide to SEBI the full list of investors of Non-Convertible Redeemable Secured Debentures, their addresses, telephone numbers, amount collected from each investor, etc;

666
JULY SEBI BULLETIN 2015
i. ARDIL shall provide to SEBI all information regarding repayments made to the holders of Non-Convertible Redeemable Secured Debentures including name of the debenture holder, address, amount mobilized, number of Non-Convertible Redeemable Secured Debentures issued, promised maturity amount with date of maturity, amount refunded and date thereof;
j. The Debenture Trustees, viz. Active Debenture Trust (represented by its Trustees, viz. Shri Abhinash Kumar Jha and Shri Jagdish Kumar Singh) are prohibited from continuing with their present assignment as debenture trustees in respect of the Offer of NCDs of ARDIL and also from taking up any new assignment or involvement in any new issue of debentures, etc. in a similar capacity, from the date of this Order till further directions.
• SEBI, vide interim order dated June 25, 2015 in exercise of the powers conferred by virtue of sections 11(1), 11(4), 11A and 11B of the SEBI Act, 1992 read with the SEBI (Issue and Listing of Debt Securities) Regulations, 2008, the Companies Act, 1956 issued the following directions in relation to fund mobilization through issuance of Non–Convertible Secured Redeemable Debentures (NCDs) and Redeemable Preference Shares (RPS) by M/s United Medicine and Surgical Industries Limited (UMSIL):
a. UMSIL shall not mobilize any fresh funds from investors through the Offer of Redeemable Preference Shares and Offer of NCDs or through the issuance of equity shares or any other securities, to the public and/or invite subscription, in any manner whatsoever, either directly or indirectly till further directions;
b. UMSIL and its present Directors, viz. Shri Santosh Kumar Hati, Shri Suvendu Ganguly, Shri Biplab Sarkar and Shri Satyanarayan Karmakar, are prohibited from issuing prospectus or any offer document or issue advertisement for soliciting money from the public for the issue of securities, in any manner
whatsoever, either directly or indirectly, till further orders;
c. The past Directors of UMSIL, viz. Shri Sumit Guria, Shri Biplab Banerjee, Shri Rajib Bhattacharya, Shri Md. Saifuddin Halder, Shri Tozemmul Islam and Shri Harendra Nath Sinha are prohibited from issuing prospectus or any offer document or issue advertisement for soliciting money from the public for the issue of securities, in any manner whatsoever, either directly or indirectly, till further orders;
d. UMSIL and its abovementioned past and present Directors, are restrained from accessing the securities market and further prohibited from buying, selling or otherwise dealing in the securities market, either directly or indirectly, till further directions;
e. UMSIL shall provide a full inventory of all its assets and properties;
f. UMSIL’s abovementioned past and present Directors shall provide a full inventory of all their assets and properties;
g. UMSIL and its abovementioned present Directors shall not dispose of any of the properties or alienate or encumber any of the assets owned/acquired by that company through the Offer of Redeemable Preference Shares and Offer of NCDs, without prior permission from SEBI;
h. UMSIL and its abovementioned present Directors shall not divert any funds raised from public at large through the Offer of Redeemable Preference Shares and Offer of NCDs, which are kept in bank account(s) and/or in the custody of UMSIL;
i. The Debenture Trustee, viz. United Debenture Trust (represented by Shri Abbas Ali Molla), is prohibited from continuing with its assignment as debenture trustee in respect of the Offer of NCDs of UMSIL and also from taking up any new assignment or involvement in any new issue of debentures, etc. in a similar capacity, from the date of this order till further directions.
• SEBI, vide interim order dated June 26, 2015 in exercise of the powers conferred by virtue

667
JULY SEBI BULLETIN 2015
of sections 11(1), 11(4) and 11B of the SEBI Act, 1992 read with the SEBI (Collective Investment Schemes) Regulations, 1999 and SEBI (Prohibition of Fraudulent and Unfair Trade Practices relating to Securities Market), 2003 issued the following directions in the matter of illegal fund mobilization by M/s Emerging India Infra Limited (EIIL):
a. not to collect any fresh money from investors under the existing schemes;
b. not to launch any new schemes or plans; c. not to float any new companies/firm to
raise fresh moneys; d. to immediately submit the full inventory of
the assets including land acquired through money raised by EIIL;
e. not to dispose of or alienate any of the properties/assets acquired directly or indirectly through money raised by EIIL;
f. not to divert any funds raised from public at large which are kept in bank account(s) and/or in the custody of EIIL;
g. to furnish all the information/details sought by SEBI vide including,
i. Details of amounts mobilized, ii. Details of amounts repaid till date, iii. Scheme wise list of investors and
their contact numbers and addresses including, the list of investors to whom land has been allotted and got registered and list of investors who have been repaid.
h. Details of commission paid on amounts mobilised above,
i. Details of agents along with their addresses, etc.,
j. Audited Accounts for the last financial years i.e. FY 2012-13, 2013-14, and 2014-15;
PAN of the Directors• SEBI, vide an interim order dated June 29, 2015
in exercise of the powers conferred by virtue of sections 11(1), 11(4), 11A and 11B of the SEBI Act, 1992 read with the SEBI (Issue and Listing of Debt Securities) Regulations, 2008 and SEBI (Debenture Trustees) Regulations, 1993 issued the following directions against M/s Life Care Infrastructures India Limited (LCIIL)and its past/present Directors regarding illegal mobilization of funds:-
a. LCIIL shall forthwith cease to mobilize any fresh funds from investors through the Offer of NCRSDs or through the issuance of equity shares or any other securities, to the public and/or invite subscription, in any manner whatsoever, either directly or indirectly till further directions;
b. LCIIL and its past/present Directors, viz. Mr. Pralay Kumar Saw, Mr. Sanjoy Kumar Maiti, Mr. Sujit Mitra, Mr. Partha Pratim Ghosh and Mr. Ramprasad Sarkar are prohibited from issuing prospectus or any offer document or issue advertisement for soliciting money from the public for the issue of securities, in any manner whatsoever, either directly or indirectly, till further orders;
c. LCIIL and its abovementioned Directors, are restrained from accessing the securities market and further prohibited from buying, selling or otherwise dealing in the securities market, either directly or indirectly, till further directions;
d. LCIIL shall provide a full inventory of all its assets and properties;
e. LCIIL’s abovementioned Directors shall provide a full inventory of all their assets and properties;
f. LCIIL and its abovementioned Directors shall not dispose of any of the properties or alienate or encumber any of the assets owned/acquired by that company through the Offer of NCRSDs, without prior permission from SEBI;
g. LCIIL and its abovementioned present Directors shall not divert any funds raised from public at large through the Offer of NCRSDs, which are kept in bank account(s) and/or in the custody of LCIIL;
h. LCIIL shall furnish within 21 days from the date of receipt of this Order complete information as sought by SEBI vide letters dated December 06, 2013, February 21, 2014, September 18, 2014 and December 09, 2014 including balance sheets of the company for FY 2011-12 to 2014-15 and reconcile the debenture allotment data provided to RoC vide their letter dated December 28, 2012 and that filed along with Form 20B on MCA 21 portal.

668
JULY SEBI BULLETIN 2015
i. The Debenture Trustee, viz. Life Care Debenture Trust (represented by trustee Ms. Paromita Mondal), is prohibited from continuing with their present assignment as a debenture trustee in respect of the Offer of NCRSDs of LCIIL and also from taking up any new assignment or involvement in any new issue of debentures, etc. in a similar capacity, from the date of this order till further directions.
• SEBI, vide an interim order dated June 29, 2015 in exercise of the powers conferred by virtue of sections 11(1), 11(4), 11A and 11B of the SEBI Act, 1992 read with the SEBI (Issue and Listing of Debt Securities) Regulations, 2008 and SEBI (Debenture Trustees) Regulations, 1993 issued the following directions against M/s Angel Allied India Ltd. (LCIIL)and its past/present Directors regarding illegal mobilization of funds:-
a. AAIL shall forthwith cease to mobilize any fresh funds from investors through the Offer of NCDs or through the issuance of equity shares or any other securities, to the public and/or invite subscription, in any manner whatsoever, either directly or indirectly till further directions;
b. AAIL and its past/present Directors, viz. Shri Sekh Nazibulla, Shri Santosh Kumar Mishra, Shri Devid Haslaf and Shri Sandip Pal, are prohibited from issuing prospectus or any offer document or issue advertisement for soliciting money from the public for the issue of securities, in any manner whatsoever, either directly or indirectly, till further orders;
c. AAIL and its abovementioned Directors, are restrained from accessing the securities market and further prohibited from buying, selling or otherwise dealing in the securities market, either directly or indirectly, till further directions;
d. AAIL shall provide a full inventory of all its assets and properties;
e. AAIL’s abovementioned Directors shall provide a full inventory of all their assets and properties;
f. AAIL and its abovementioned Directors shall not dispose of any of the properties or alienate or encumber any of the
assets owned/acquired by that company through the Offer of NCDs, without prior permission from SEBI;
g. AAIL and its abovementioned present Directors shall not divert any funds raised from public at large through the Offer of NCDs, which are kept in bank account(s) and/or in the custody of AAIL;
h. AAIL shall furnish within 21 days from the date of receipt of this Order complete information as sought by SEBI vide letter dated February 21, 2014 including balance sheets of the company for FY 2011-12 to 2014-15.
i. The Debenture Trustee, viz. Angel Economic Debenture Trust (represented by trustee Shri. Succhhanda Ghosh), is prohibited from continuing the present assignment as a debenture trustee in respect of the Offer of NCDs of AAIL and also from taking up any new assignment or involvement in any new issue of debentures, etc. in a similar capacity, from the date of this order till further directions.
• SEBI, vide order dated June 29, 2015 in exercise of the powers conferred by virtue of sections 11 (1), 11(4) and 11B of the SEBI Act, 1992 read with SEBI (Collective Investment Schemes) Regulations, 1999 issued following directions in the matter of illegal mobilization of funds by M/s Bhoomi Devcon & Agritech Ltd. and its Directors viz. Mr. Lal Chand Vishwakarma, Ms. Radha Bai Vishwakarma, Mr. Ghasi Ram Vishwakarma and Mr. Sanjay Kumar Agrawal:
a. not to collect any fresh money from investors from its existing scheme;
b. not to launch any new scheme/plan or float any new companies to raise fresh moneys;
c. not to dispose of any of the properties or alienate the assets of the existing scheme;
d. not to divert any funds raised from public at large, kept in bank account(s) and/or in the custody of the company;
e. to immediately submit the full inventory of the assets owned by the company out of the amounts collected from the “customers”/investors under its existing schemes,

669
JULY SEBI BULLETIN 2015
f. to furnish the details of scheme wise list of investors and their contact numbers and addresses, including,
i. the list of investors to which land has been allotted and got registered, and
ii. list of investors who have been refunded.
g. to furnish all the information sought by SEBI, vide letters dated April 2, 2014 and not yet submitted including, the copies of agreement letter/contract entered into with “customers”/ investors.
• SEBI, vide order dated June 29, 2015 in exercise of the powers conferred by virtue of Section 19 of the SEBI Act, 1992 read with Regulation 28(2) of the SEBI (Intermediaries) Regulations, 2008, cancelled the certificate of registration granted to M/s Knack Corporate Services Limited, as a Registrar to an Issue (RTI) and Share Transfer Agent (STA) on account of defaults, non-compliances, contraventions and violations committed by the noticee.
• SEBI, vide an interim order dated June 29, 2015 in exercise of the powers conferred by virtue of section 19 read with sections 11(1), 11(4), 11A and 11B of the SEBI Act, 1992, restrained 239 persons/entities from accessing the securities market and buying, selling or dealing in securities, either directly or indirectly, in any manner and issued the following directions in the matter of dealing in the shares of four companies viz. M/s Eco Friendly Food Processing Park Limited, M/s Esteem Bio Organic Food Processing Limited, M/s Channel Nine Entertainment Limited, M/s HPC Biosciences Limited, listed in the SME segment of Bombay Stock Exchange.
• SEBI, vide an order dated June 29, 2015 in exercise of the powers conferred by virtue of section 19 read with sections 11and 11B of the SEBI Act, 1992 and regulation 11 of the SEBI(Prohibition of Fraudulent and Unfair Trade Practices Relating to Securities Market) Regulations, 2003 restrained seven entities from accessing the securities market and further prohibit them from buying, selling or otherwise dealing in securities, directly or indirectly, or being associated with the securities market in any manner, whatsoever, for a period of six years in the matter of dealings in the shares of M/s LGS Global Limited.
• SEBI, vide an interim order dated June 30, 2015 in exercise of the powers conferred by virtue of section 19 read with sections 11(1), 11(4), 11A and 11B of the SEBI Act, 1992, read with the SEBI (Issue and Listing of Debt Securities) Regulations, 2008 and SEBI (Debenture Trustees) Regulations, 1993 issued the following directions against M/s Vishwamitra International Infra Limited (VIIL) and M/s Vishwamitra India Tour & Hotels Limited (VITHL) regarding illegal mobilization of funds:
a. VIIL and VITHL shall forthwith cease to mobilize any fresh funds from investors through the Offer of NCDs or through the issuance of equity shares or any other securities, to the public and/or invite subscription, in any manner whatsoever, either directly or indirectly till further directions;
b. VIIL, VITHL and their Directors, viz. Shri Manoj Kumar Chand, Smt Bandana Chand, Shri Manish Kumar Chand, Shri Pankaj Kumar Chand and Shri Hari Govind Singh, are prohibited from issuing prospectus or any offer document or issue advertisement for soliciting money from the public for the issue of securities, in any manner whatsoever, either directly or indirectly, till further orders;
c. VIIL, VITHL and their abovementioned Directors, are restrained from accessing the securities market and further prohibited from buying, selling or otherwise dealing in the securities market, either directly or indirectly, till further directions;
d. VIIL and VITHL shall provide a full inventory of all their assets and properties;
e. VIIL and VITHL’s abovementioned Directors shall provide a full inventory of all their assets and properties;
f. VIIL, VITHL and their abovementioned Directors shall not dispose of any of the properties or alienate or encumber any of the assets owned/acquired by that company through the Offer of NCDs, without prior permission from SEBI;
g. VIIL, VITHL and their abovementioned Directors shall not divert any funds raised

670
JULY SEBI BULLETIN 2015
from public at large through the Offer of NCDs, which are kept in bank account(s) and/or in the custody of VIIL;
h. VIIL and VITHL shall provide to SEBI all information as on March 31, 2013, March 31, 2014 and March 31, 2015 regarding the date of issuance of Non-Convertible Redeemable Secured Debentures to VITHL, dates on which subsequent transfers were done, including number of debenture holders, name of the debenture holder, address, amount mobilized, number of debentures issued;
i. VIIL and VITHL shall provide to SEBI all information as on March 31, 2013, March 31, 2014, March 31, 2015 and till date regarding repayments made to the holders of Non-Convertible Redeemable Secured Debentures including name of the debenture holder, address, amount mobilized, number of Non-Convertible Redeemable Secured Debentures issued, promised maturity amount with date of maturity, amount refunded and date thereof;
j. VIIL and VITHL shall provide to SEBI all particulars of commission paid, expenses incurred including debenture issue expenses, promotional expenses, amount written off towards issuance of debentures, etc. as of March 31, 2013, March 31, 2014 and March 31, 2015.
k. VIIL and VITHL shall provide to SEBI their financial statements for the years 2012-13, 2013-14 and 2014-15 audited from two independent peer reviewed Chartered Accountants who are in the panel of any public authority or public institution.
l. VIIL and VITHL shall furnish complete and relevant information.
m. The Debenture Trustee, viz. Vishwamitra Debenture Trust (represented by its Trustee, viz. Shri Sanjay Kumar Pandit), is prohibited from continuing with its present assignment as a debenture trustee in respect of the Offer of NCDs of VIIL and also from taking up any new assignment or involvement in any new issue of debentures, etc. in a similar capacity.
• SEBI, vide an order dated June 30, 2015 in exercise of the powers conferred by virtue of section 19 read with sections 11(1), 11(4), 11A and 11B of the SEBI Act, 1992, restrained and prohibited M/s Rishab Concast Limited from accessing the securities market and from buying, selling or dealing in securities, directly or indirectly, in whatsoever manner, till it obtains SCORES authentication in terms of the SEBI circular dated August 13, 2012 and resolves all the investor grievances pending against it.
• SEBI, vide an order dated June 30, 2015 in exercise of the powers conferred by virtue of section 19 read with sections 11(1), 11(4), 11A and 11B of the SEBI Act, 1992, restrained and prohibited M/s Shanti Packaging Limited from accessing the securities market and from buying, selling or dealing in securities, directly or indirectly, in whatsoever manner, till it obtains SCORES authentication in terms of the SEBI circular dated August 13, 2012 and resolves all the investor grievances pending against it.
• SEBI, vide an order dated June 30, 2015 in exercise of the powers conferred by virtue of section 19 read with sections 11(1), 11(4), 11A and 11B of the SEBI Act, 1992, restrained and prohibited M/s Sun Infoways Limited from accessing the securities market and from buying, selling or dealing in securities, directly or indirectly, in whatsoever manner, till it obtains SCORES authentication in terms of the SEBI circular dated August 13, 2012 and resolves all the investor grievances pending against it.
• SEBI, vide an order dated June 30, 2015 in exercise of the powers conferred by virtue of section 19 read with sections 11(1), 11(4), 11A and 11B of the SEBI Act, 1992, restrained and prohibited M/s Systel Infotech Limited from accessing the securities market and from buying, selling or dealing in securities, directly or indirectly, in whatsoever manner, till it obtains SCORES authentication in terms of the SEBI circular dated August 13, 2012 and resolves all the investor grievances pending against it.
• SEBI, vide an order dated June 30, 2015 in exercise of the powers conferred by virtue of section 19 read with sections 11(1), 11(4), 11A and 11B of the SEBI Act, 1992, restrained and prohibited M/s Subhlaxmi Export Limited from

671
JULY SEBI BULLETIN 2015
accessing the securities market and from buying, selling or dealing in securities, directly or indirectly, in whatsoever manner, till it obtains SCORES authentication in terms of the SEBI circular dated August 13, 2012 and resolves all the investor grievances pending against it.
• SEBI, vide an order dated June 30, 2015 in exercise of the powers conferred by virtue of section 19 read with sections 11(1), 11(4), 11A and 11B of the SEBI Act, 1992, restrained and prohibited M/s Sanvan Software Limited from accessing the securities market and from buying, selling or dealing in securities, directly or indirectly, in whatsoever manner, till it obtains SCORES authentication in terms of the SEBI circular dated August 13, 2012 and resolves all the investor grievances pending against it.
• SEBI, vide an order dated June 30, 2015 in exercise of the powers conferred by virtue of section 19 read with sections 11(1), 11(4), 11A and 11B of the SEBI Act, 1992, restrained and prohibited M/s Supreme Telecoms & Network
India Limited from accessing the securities market and from buying, selling or dealing in securities, directly or indirectly, in whatsoever manner, till it obtains SCORES authentication in terms of the SEBI circular dated August 13, 2012 and resolves all the investor grievances pending against it.
• SEBI, vide an order dated June 30, 2015 in exercise of the powers conferred by virtue of section 19 read with sections 11(1), 11(4), 11A and 11B of the SEBI Act, 1992, restrained and prohibited M/s Sarda Information Technology Limited from accessing the securities market and from buying, selling or dealing in securities, directly or indirectly, in whatsoever manner, till it obtains SCORES authentication in terms of the SEBI circular dated August 13, 2012 and resolves all the investor grievances pending against it.
Note: Above information are indicative only. For details,
please log on to http://www.sebi.gov.in/sebiweb/home/
list/2/9/0/1/Orders

672
JULY SEBI BULLETIN 2015
1. IOSCO Consults on International Standards on
Fees and Expenses of Investment Funds
The International Organization of Securities Commissions published a consultation report on Elements of International Regulatory Standards on Fees and Expenses of Investment Funds, which proposes an updated set of common international standards of best practice for the operators of Collective Investment Schemes (CIS) and regulators to consider. This consultation report builds on the recommendations made in the 2004 paper on International Regulatory Standards on Fees and Expenses of Investment Funds. It seeks to determine whether these standards are still valid or might be updated or supplemented in light of market and regulatory changes. The report examines and consults on issues identified as being key across jurisdictions. Such issues concern, inter alia: - types of permitted fees and expenses - performance-related fees - disclosure of fees and expenses - transaction costs - hard and soft commissions on transactions.Source: ht tp : //www. io s co .o rg/ l ib r a ry/pubdoc s/pd f/
IOSCOPD491.pdf
2. IOSCO publishes report on SME financing
through capital markets
The Board of the International Organization of Securities Commissions (IOSCO) published the report on SME Financing through Capital Markets, which provides recommendations for regulators to facilitate capital raising by small and medium sized enterprises (SMEs) in emerging markets. The report identifies the challenges facing SMEs in accessing market-based financing, and examines some of the successful measures implemented by regulators and other policymakers to assist SMEs in tapping
HIGHLIGHTS OF DEVELOPMENTS IN
INTERNATIONAL SECURITIES MARKET
capital markets. The findings are based on survey responses and best practice by member jurisdictions. The Financial Services Board of South Africa was the penholder for the report. SMEs are a major contributor to long-term economic growth and employment. However, they often struggle to find financing due, in part, to the relatively high investment risk they represent. The SME financing challenge has increased in the aftermath of the global financial crisis as banks face tougher liquidity requirements and leverage constraints. Capital markets therefore have a role in bridging this financing gap for SMEs by providing alternative funding sources. Source: ht tp : //www. io s co .o rg/ l ib r a ry/pubdoc s/pd f/
IOSCOPD493.pdf
3. IOSCO publishes report on credible deterrence
approaches in securities market regulation
The International Organization of Securities Commissions has published the report Credible Deterrence, which identifies key enforcement factors that may deter misconduct in international securities and investment markets. The report draws on the collective experience and expertise of IOSCO members and was produced by IOSCO’s Committee 4 on Enforcement and the Exchange of Information, which is chaired by the UK Financial Conduct Authority (FCA). It identifies key elements in the prevention of misconduct and financial crime from a range of international regulatory authorities and encourages regulators operating in both emerging and developed markets to consider how they might integrate credible deterrence into new or existing enforcement strategiesSource: http://www.iosco.org/library/pubdocs/pdf/
IOSCOPD490.pdf

673
JULY SEBI BULLETIN 2015
Tables
Table 1: SEBI Registered Market Intermediaries/Institutions
Table 2: Company-Wise Capital Raised through Public and Rights Issues (Equity) during June 2015
Table 3: Open Offers under SEBI Takeover Code closed during June 2015
Table 4: Substantial Acquisition of Shares and Takeovers
Table 5: Capital Raised from the Primary Market through though Public and Rights Issues
Table 6: Issues Listed on SME Platform
Table 7: Industry-wise Classification of Capital Raised through Public and Rights Issues
Table 8: Sector-wise and Region-wise Distribution of Capital Mobilised through Public and Rights Issues
Table 9: Size-wise Classification of Capital Raised through Public and Rights Issues
Table 10: Capital Raised by Listed Companies from the Primary Market through QIPs
Table 11: Preferential Allotments Listed at BSE and NSE
Table 12: Private Placement of Corporate Debt Reported to BSE and NSE
Table 13: Trading in the Corporate Debt Market
Table 14: Ratings Assigned for Long-term Corporate Debt Securities (Maturity ≥ 1 year)
Table 15: Review of Accepted Ratings of Corporate Debt Securities (Maturity ≥ 1 year)
Table 16: Distribution of Turnover on Cash Segments of Exchanges (` crore)
Table 17: Trends in Cash Segment of BSE
Table 18: Trends in Cash Segment of NSE
Table 19: Trends in Cash Segment of BSE during June 2015
Table 20: Trends in Cash Segment of NSE during June 2015
Table 21: Turnover and Market Capitalisation at BSE and NSE during June 2015 (` crore)
Table 22: City-wise Distribution of Turnover on Cash Segments of BSE and NSE
Table 23: Category-wise Share of Turnover in Cash Segment of BSE
Table 24: Category-wise Share of Turnover in Cash Segment of NSE
Table 25: Component Stocks: S&P BSE Sensex during June 2015
Table 26: Component Stocks: CNX Nifty index during June 2015
Table 27: Advances/Declines in Cash Segment of BSE and NSE
Table 28: Trading Frequency in Cash Segment of BSE and NSE
Table 29: Volatility of Major Indices (percent)
Table 30: Percentage Share of Top ‘N’ Securities/Members in Turnover of Cash Segment (percent)
Table 31: Settlement Statistics for Cash Segment of BSE
Table 32: Settlement Statistics for Cash Segment of NSE
Table 33: Trends in Equity Derivatives Segment at BSE (Turnover in Notional Value)
Table 34: Trends in Equity Derivatives Segment at NSE
Table 35: Equity Derivatives Trading at BSE during June 2015
Table 36: Equity Derivatives Trading at NSE during June 2015
Table 37: Settlement Statistics in Equity Derivatives Segment at BSE and NSE (` crore)
Table 38: Category-wise Share of Turnover & Open Interest in Equity Derivative Segment of BSE

674
JULY SEBI BULLETIN 2015
Table 39: Category-wise Share of Turnover & Open Interest in Equity Derivative Segment of NSE
Table 40: Instrument-wise Turnover in Index Derivatives at BSE
Table 41: Instrument-wise Turnover in Index Derivatives at NSE
Table 42: Trends in Currency Derivatives Segment at NSE
Table 43: Trends in Currency Derivatives Segment at MSEI
Table 44: Trends in Currency Derivatives Segment at BSE
Table 45: Daily Trends of Currency Derivatives Trading at NSE during June 2015
Table 46: Daily Trends of Currency Derivatives Trading at MSEI during June 2015
Table 47: Daily Trends of Currency Derivatives trading at BSE during June 2015
Table 48: Settlement Statistics of Currency Derivatives Segment (` crore)
Table 49: Instrument-wise Turnover in Currency Derivatives of NSE
Table 50: Instrument-wise Turnover in Currency Derivative Segment of MSEI
Table 51: Instrument-wise Turnover in Currency Derivative Segment of BSE
Table 52: Maturity-wise Turnover in Currency Derivative Segment of NSE (` crore)
Table 53: Maturity-wise Turnover in Currency Derivative Segment of MSEI (` crore)
Table 54: Maturity-wise Turnover in Currency Derivative Segment of BSE (` crore)
Table 55: Trading Statistics of Interest Rate Futures at BSE, NSE and MSEI
Table 56: Daily Trends of Interest Rate Futures trading at BSE during June 2015
Table 57: Daily Trends of Interest Rate Futures trading at NSE during June 2015
Table 58: Daily Trends of Interest Rate Futures trading at MSEI during June 2015
Table 59: Settlement Statistics in Interest Rate Futures at BSE, NSE AND MSEI (` crore)
Table 60: Trends in Foreign Portfolio Investment
Table 61: Daily Trends in Foreign Portfolio Investment during June 2015
Table 62: Notional Value of Offshore Derivative Instruments (ODIs) Vs Assets Under Custody (AUC) of FPIs/Deemed FPIs (` crore)
Table 63: Assets under the Custody of Custodians
Table 64: Trends in Resource Mobilization by Mutual Funds (` crore)
Table 65:Type-wise Resource Mobilisation by Mutual Funds: Open-ended and Close-ended (` crore)
Table 66: Scheme-wise Resource Mobilisation and Assets under Management by Mutual Funds (` crore)
Table 67: Number of Schemes and Folios by Investment Objective
Table 68: Trends in Transactions on Stock Exchanges by Mutual Funds (` crore)
Table 69: Asset Under Management by Portfolio Manager
Table 70: Progress Report of NSDL & CDSl as on End of June 2015 (Listed Companies)
Table 71: Progress of Dematerialisation at NSDL and CDSL (Listed and Unlisted Companies)
Table 72: Depository Statistics for June 2015
Table 73: Macro Economic Indicators
N.B.:
1. Na = Not Applicable
2. NA: Not Available
3. 1 crore = 10 million = 100 lakh.
4. The total provided in the Annexure and Statistical Tables June not always match with the sum total of the break-ups due to decimal
differences.
5. The data for the current month is provisional.

675
JULY SEBI BULLETIN 2015
Table 1: SEBI Registered Market Intermediaries/Institutions
Market Intermediaries 2014-15 2015-16$
Stock Exchanges (Cash Market) 15 9Stock Exchanges (Equity Derivatives Market) 3 3Stock Exchanges (Currency Derivatives Market) 3 3Brokers (Cash Segment)* 6,147 3,191Corporate Brokers (Cash Segment)* 3,757 2,776Brokers (Equity Derivatives Market) 2,990 2,802Brokers (Currency Derivatives Market) 2,406 1,985Brokers (Debt Segment) 6 6Sub-brokers (Cash Segment) * 42,351 39,456Foreign Portfolio Investors (FPIs) 1,444 2,074Deemed FPIs 6,772 6,325Custodians 19 19Depositories 2 2Depository Participants of NSDL & CDSL 854 851Qualified Depository Participants of NSDL & CDSL 62 62Merchant Bankers 197 195Bankers to an Issue 60 61Underwriters 2 2Debenture Trustees 32 32Credit Rating Agencies 6 7KYC Registration Agency (KRA) 5 5Venture Capital Funds 201 200Foreign Venture Capital Investors 204 205Alternative Investment Funds 135 148Registrars to an Issue & Share Transfer Agents 72 71Portfolio Managers 188 188Mutual Funds 47 47Investment Advisors 271 285Reasearch Analysts 26 55Collective Investment Management Company 1 1Approved Intermediaries (Stock Lending Schemes) 2 2STP (Centralised Hub) 1 1STP Service Providers 2 2
Notes:
1. With the commencement of FPI Regime from June 1, 2014, the erstwhile FIIs, Sub Accounts and QFIs are merged into a new investor
class termed as “Foreign Portfolio Investors (FPIs)”.
2. With the commencement of FPI regime, all existing FIIs and SAs are deemed to be FPIs till the expiry of their registration. Figures
for FPIs and Deemed FPIs are provided by NSDL.
3. The Hyderabad Securities and Enterprises Ltd (erstwhile Hyderabad Stock Exchange), Coimbatore Stock Exchange Ltd, Saurashtra
Kutch Stock Exchange Ltd ,Mangalore Stock Exchange, Inter-Connected Stock Exchange of India Ltd, Cochin Stock Exchange
Ltd, Bangalore Stock Exchange Ltd , Ludhiana Stock exchange Ltd, Gauhati Stock Exchange Ltd, Bhubaneswar Stock Exchange
Ltd, Jaipur Stock Exchange Ltd, OTC Exchange of India, Pune Stock Exchange Ltd and Madras Stock Exchange Ltd. have been
granted exit by SEBI vide orders dated January 25, 2013, April 3, 2013, April 5, 2013, March 3, 2014, December 08, 2014, December 23,
2014, December 26, 2014, December 30, 2014, January 27, 2015, February 09, 2015, March 23, 2015, March 31, 2015 and April 13, 2015
respectively.
4. SEBI vide order dated September 3, 2007 refused to renew the recognition granted to Magadh Stock Exchange Ltd.
5. Stock brokers and Sub-brokers of Inter connected Stock exchange, Cochin Stock Exchange, Bangalore Stock Exchange, and
Ludhiana Stock Exchange, which were granted exit, are excluded.
6. United Stock Exchange of India Ltd. has stopped providing trading facilities to its members from 30th of December 2014 vide
circular number: USE/CMPL/628/2014.
7. SEBI withdraw the recognition granted to Delhi Stock Exchange Limited dated November 19 2014.
8. *Stock brokers/sub-brokers pertaining to active stock exchanges
$ indicates as on June 30, 2015.
Na: Not Applicable
Source: SEBI, NSDL.

676
JULY SEBI BULLETIN 2015
Table 2: Company-Wise Capital Raised through Public and Rights Issues (Equity) during June 2015
S.No.Name of the Issuer/
Company
Date of
Opening
Type of
Issue
Type of
Instrument
No. of
Shares
Issued
Face
Value
(`)
Premium
Value
(`)
Issue
Price
(`)
Size of
Issue
(`crore)
1 Ambition Mica Ltd 23-Jun-15 IPO (SME) Equity 10,74,000 10 30 40 42 Manpasand Beverages Ltd 24-Jun-15 IPO Equity 1,25,00,000 10 310 320 4003 Junction Fabrics and Apparels Ltd 25-Jun-15 IPO (SME) Equity 10,00,000 10 6 16 24 Mishka Exim Ltd 26-Jun-15 IPO (SME) Equity 54,50,000 10 0 10 55 VMV Holidays Ltd 29-Jun-15 IPO (SME) Equity 15,60,000 10 0 10 26 Jiya Eco-Products Ltd 29-Jun-15 IPO (SME) Equity 24,12,000 10 9 19 57 M.D. Inducto Cast Ltd 30-Jun-15 IPO (SME) Equity 63,84,000 10 17 27 17
8 Majestic Research Services & Solutions Ltd 30-Jun-15 IPO (SME) Equity 11,20,000 10 3 13 1
9 Gala Print City Ltd 30-Jun-15 IPO (SME) Equity 12,66,000 10 14 24 3
Note: 1. All the issues are compiled from the Prospectus’ of Issuer Companies filed with SEBI.
Source: SEBI.
Table 3: Open Offers under SEBI Takeover Code closed during June 2015
S.No. Target Company Acquirer
Offer
Opening
Date
Offer
Closing
Date
Offer Size Offer
Price
(`) per
share
No. of
Shares
Percent of
Equity
Capital
1 Splash Media & Infra Ltd Mr Anil Agarwal 05/20/15 06/02/15 24367200 26 1.3
2 Raasi Refactories Ltd Mr Konda Laxmaiah And Ramlaxman Parboiled Rice Pvt Ltd 05/25/15 06/05/15 1225416 26 4.8
3 Nice Papers Ltd Mr Bhimjibhai Patel And Others 06/05/15 06/18/15 390858 26 11.74 Lykis Ltd Kedia Securities Pvt Ltd 06/08/15 06/19/15 4785861 26 40.0
5 International Pumps And Projects Ltd Mr Ankit Agarwal 06/09/15 06/22/15 2058030 29 15.4
6 Wheel And Axle Textiles Ltd Mr Vasudev Fatandas Sawlani 06/09/15 06/22/15 125500 25 193.1
7 Virgo Global Media Ltd Mrs Namburru Vasundhra Mani 06/16/15 06/29/15 2731118 26 1.0
8 Disa India Ltd Naciron A/S 06/17/15 06/30/15 377552 25 3513.0
Source: SEBI.
Table 4: Substantial Acquisition of Shares and Takeovers
Year/Month
Open Offers
Objectives Total
Change in Control
of Management
Consolidation of
Holdings
Substantial
Acquisition No. of
issues
Amount
(` crore)No. of
issues
Amount
(` crore)
No. of
issues
Amount
(` crore)
No. of
issues
Amount
(` crore)
2014-15 51 5,442 1 11,449 8 350 60 17,241
2015-16$ 15 341 0 0 2 417 17 759
Apr-15 1 90 0 0 1 398 2 489May-15 5 18 0 0 0 0 5 18Jun-15 9 233 0 0 1 19 10 253
$ indicates as on June 30, 2015.
Source: SEBI.

677
JULY SEBI BULLETIN 2015T
ab
le 5
: C
ap
ital
Rais
ed
fro
m t
he P
rim
ary
Mark
et
thro
ug
h t
ho
ug
h P
ub
lic a
nd
Rig
hts
Iss
ues
Year/
Mo
nth
To
tal
Cate
go
ry-w
ise
Issu
e-t
yp
eIn
stru
men
t-w
ise
Pu
bli
cR
igh
ts L
iste
dIP
Os
Eq
uit
ies
CC
PS
/F
CD
s*D
ebt
At
Par
At
Pre
miu
m
No
. o
f
issu
es
Am
ou
nt
(` c
rore
)
No
. o
f
issu
es
Am
ou
nt
(` c
rore
)
No
. o
f
issu
es
Am
ou
nt
(`
cro
re)
No
. o
f
issu
es
Am
ou
nt
(` c
rore
)
No
. o
f
issu
es
Am
ou
nt
(` c
rore
)
No
. o
f
issu
es
Am
ou
nt
(` c
rore
)
No
. o
f
issu
es
Am
ou
nt
(` c
rore
)
No
. o
f
issu
es
Am
ou
nt
(` c
rore
)
No
. o
f
issu
es
Am
ou
nt
(` c
rore
)
2014
-15
88
19,2
02
70
12,4
53
186,7
50
42
15,8
92
46
3,3
118
49
55
8,7
40
11,
000
24
9,41
32015
-16$
1810
,532
163,0
34
27,4
98
48,2
08
142,3
24
27
149,8
150
02
710
Apr
-15
79,
600
52,
102
27,
498
48,
208
31,
392
00
58,
890
00
271
0M
ay-1
52
493
249
30
00
02
493
00
249
30
00
0Ju
n-15
943
99
439
00
00
943
92
77
432
00
00
No
te:
1.
T
he t
ota
l p
rovid
es
cate
go
ry-w
ise t
ota
l o
f a
ny o
f t
he t
hre
e s
ub
-cate
go
ries
viz
. p
ub
lic p
lus
rig
hts
or
issu
er-
typ
e(l
iste
d p
lus
IPO
s) o
r in
stru
men
t-w
ise(e
qu
itie
s p
lus
CC
PS
/F
CD
s p
lus
deb
t).
2.
A
mo
un
t fo
r p
ub
lic d
ebt
issu
e f
or
last
tw
o m
on
ths
is p
rovis
ion
al.
3.
A
ll t
he I
ssu
es
are
co
mp
iled
fro
m t
he P
rosp
ectu
s’ o
f I
ssu
er
Co
mp
an
ies
file
d w
ith
SE
BI.
4.
* C
CP
S:
Co
mp
uls
ory
Co
nve
rtib
le P
refe
ren
ce S
hare
s, F
CD
s: F
ull
y C
on
vert
ible
Deb
en
ture
s.
5.
E
qu
ity p
ub
lic i
ssu
es
als
o i
nclu
des
issu
es
list
ed
on
SM
E p
latf
orm
.
$ i
nd
icate
s as
on
Ju
ne 3
0,
2015
.
So
urc
e:
SE
BI.

678
JULY SEBI BULLETIN 2015
Table 6: Issues Listed on SME Platform
Year/ MonthTotal
No. of issue Amount (` crore)
2014-15 39 278
2015-16$ 9 44
Apr-15 0 0
May-15 1 5
Jun-15 8 39
$ indicates as on June 30, 2015.
Source: SEBI
Table 7: Industry-wise Classification of Capital Raised through Public and Rights Issues
Industry
2014-15 2015-16$ Jun-15
No. of issueAmount
(`crore)No. of issue
Amount
(`crore)
No. of
issue
Amount
(`crore)
Banking/FIs 5 901 0 0 0 0
Cement & Construction 7 2,035 1 488 0 0
Chemical 1 8 0 0 0 0
Electronics 1 33 0 0 0 0
Engineering 1 525 0 0 0 0
Entertainment 6 884 0 0 0 0
Finance 30 9,728 2 710 0 0
Food Processing 2 25 1 400 1 400
Health Care 0 0 0 0 0 0
Information Technology 3 137 1 5 0 0
Paper & Pulp 0 0 0 0 0 0
Plastic 2 8 0 0 0 0
Power 0 0 0 0 0 0
Printing 0 0 1 3 1 3
Telecommunication 1 175 0 0 0 0
Textile 3 388 1 2 1 2
Others 26 4,357 11 8,924 6 35
Total 88 19,202 18 10,532 9 439
$ indicates as on June 30, 2015.
Source: SEBI.
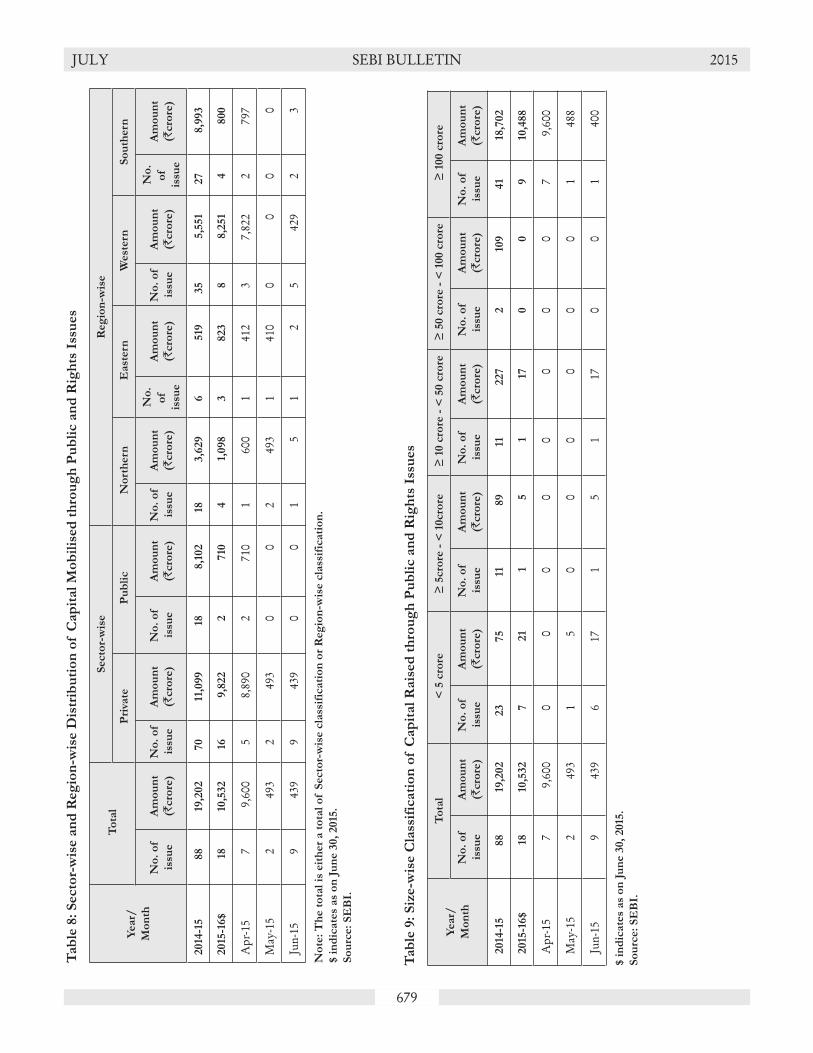
679
JULY SEBI BULLETIN 2015T
ab
le 8
: S
ecto
r-w
ise a
nd
Reg
ion
-wis
e D
istr
ibu
tio
n o
f C
ap
ital
Mo
bil
ised
th
rou
gh
Pu
bli
c a
nd
Rig
hts
Iss
ues
Year/
Mo
nth
To
tal
Secto
r-w
ise
Reg
ion
-wis
e
Pri
vate
Pu
bli
c N
ort
hern
East
ern
West
ern
So
uth
ern
No
. o
f
issu
e
Am
ou
nt
(`cro
re)
No
. o
f
issu
e
Am
ou
nt
(`cro
re)
No
. o
f
issu
e
Am
ou
nt
(`cro
re)
No
. o
f
issu
e
Am
ou
nt
(`cro
re)
No
.
of
issu
e
Am
ou
nt
(`cro
re)
No
. o
f
issu
e
Am
ou
nt
(`cro
re)
No
.
of
issu
e
Am
ou
nt
(`cro
re)
2014
-15
88
19,2
02
70
11,0
99
188,1
02
183,6
29
6519
35
5,5
51
27
8,9
93
2015
-16$
1810
,532
169,8
22
2710
41,
098
3823
88,2
51
4800
Apr
-15
79,
600
58,
890
271
01
600
141
23
7,82
22
797
May
-15
249
32
493
00
249
31
410
00
00
Jun-
159
439
943
90
01
51
25
429
23
No
te:
Th
e t
ota
l is
eit
her
a t
ota
l o
f S
ecto
r-w
ise c
lass
ific
ati
on
or
Reg
ion
-wis
e c
lass
ific
ati
on
.
$ i
nd
icate
s as
on
Ju
ne 3
0,
2015
.
So
urc
e:
SE
BI.
Tab
le 9
: S
ize-w
ise C
lass
ific
ati
on
of C
ap
ital
Rais
ed
th
rou
gh
Pu
bli
c a
nd
Rig
hts
Iss
ues
Year/
Mo
nth
To
tal
< 5
cro
re≥
5cro
re -
< 1
0cro
re ≥
10 c
rore
- <
50 c
rore
≥ 5
0 c
rore
- <
100 c
rore
≥ 1
00 c
rore
No
. o
f
issu
e
Am
ou
nt
(`cro
re)
No
. o
f
issu
e
Am
ou
nt
(`cro
re)
No
. o
f
issu
e
Am
ou
nt
(`cro
re)
No
. o
f
issu
e
Am
ou
nt
(`cro
re)
No
. o
f
issu
e
Am
ou
nt
(`cro
re)
No
. o
f
issu
e
Am
ou
nt
(`cro
re)
2014
-15
88
19,2
02
23
75
1189
11227
210
941
18,7
02
2015
-16$
1810
,532
721
15
117
00
910
,488
Apr
-15
79,
600
00
00
00
00
79,
600
May
-15
249
31
50
00
00
01
488
Jun-
159
439
617
15
117
00
140
0
$ i
nd
icate
s as
on
Ju
ne 3
0,
2015
.
So
urc
e:
SE
BI.

680
JULY SEBI BULLETIN 2015
Table 10: Capital Raised by Listed Companies from the Primary Market through QIPs
Year/ Month
NSE BSE Common Total
No. of
issues
Amount
(`crore)
No. of
issues
Amount
(`crore)
No. of
issues
Amount
(`crore)
No. of
issues
Amount
(`crore)
2014-15 2 725 8 2,326 38 1 26,051 51 1 29,102
2015-16$ 4 1,032 6 1,432 7 2,864 9 3,265
Apr-15 4 1,032 4 1,032 4 1,032 4 1,032
May-15 0 0 2 401 1 325 3 726
Jun-15 0 0 0 0 2 1,507 2 1,507
Notes: 1. The above data includes both “no. of issues” and “Amount” raised on conversion of convertible securities issued on QIP
basis.
2. 1 Includes one issue of Institutional Placement Programme (Issue Size of `418.3 crore).
$ indicates as on June 30, 2015.
Source: BSE and NSE.
Table 11: Preferential Allotments Listed at BSE and NSE
Year/
Month
NSE BSE Common Total
No.of
issues
Amount
(`crore)
No.of
issues
Amount
(`crore)
No.of
issues
Amount
(`crore)
No.of
issues
Amount
(`crore)
2014-15 206 4,407 75 5,984 186 19,569 419 28,260
2015-16$ 39 237 5 93 61 17,068 105 17,398
Apr-15 12 49 2 54 23 10,382 37 10,485May-15 7 78 1 24 22 5,305 30 5,407Jun-15 20 110 2 15 16 1,381 38 1,506
$ indicates as on June 30, 2015.
Source: BSE and NSE.
Table 12: Private Placement of Corporate Debt Reported to BSE and NSE
Year/
Month
NSE BSE Common Total
No. of
IssuesAmount (`crore)
No. of
IssuesAmount (`crore)
No. of
IssuesAmount (`crore)
No. of
IssuesAmount (`crore)
2014-15 1,094 1,69,726 1,386 1,17,949 131 1,16,461 2,611 4,04,137
2015-16$ 479 67,501 408 51,167 25 22,956 912 1,41,624
Apr-15 175 37,968 186 31,282 17 15,556 378 84,807May-15 134 9,349 113 8,193 4 3,150 251 20,692Jun-15 170 20,184 109 11,692 4 4,250 283 36,125
$ indicates as on June 30, 2015.
Source: SEBI
Table 13: Trading in the Corporate Debt Market
Year/
Month
BSE NSE MSEI
No. of TradesTraded Value
(` crore)No. of Trades
Traded Value
(` crore)No. of Trades
Traded Value
(` crore)
2014-15 17,710 2,04,506 58,073 8,86,788 8 1
2015-16$ 4,523 56,396 14,183 2,00,836 0 0
Apr-15 1,518 19,360 5,051 74,699 0 0May-15 1,453 18,934 4,519 61,135 0 0Jun-15 1,552 18,102 4,613 65,002 0 0
$ indicates as on June 30, 2015.
Source: SEBI
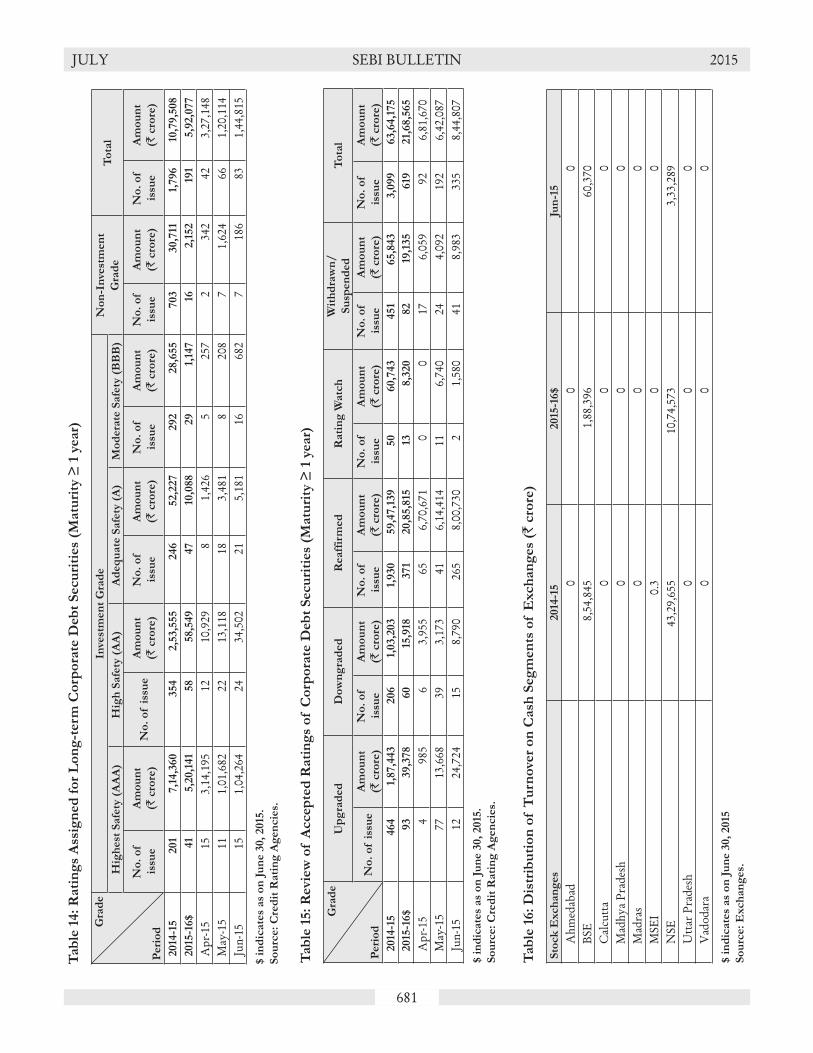
681
JULY SEBI BULLETIN 2015T
ab
le 1
4:
Rati
ng
s A
ssig
ned
fo
r L
on
g-t
erm
Co
rpo
rate
Deb
t S
ecu
riti
es
(Matu
rity
≥ 1
year)
Gra
de
Peri
od
Inve
stm
en
t G
rad
eN
on
-In
vest
men
t
Gra
de
To
tal
Hig
hest
Safe
ty (
AA
A)
Hig
h S
afe
ty (
AA
)A
deq
uate
Safe
ty (
A)
Mo
dera
te S
afe
ty (
BB
B)
No
. o
f
issu
e
Am
ou
nt
(` c
rore
)N
o.
of i
ssu
eA
mo
un
t
(` c
rore
)
No
. o
f
issu
e
Am
ou
nt
(` c
rore
)
No
. o
f
issu
e
Am
ou
nt
(` c
rore
)
No
. o
f
issu
e
Am
ou
nt
(` c
rore
)
No
. o
f
issu
e
Am
ou
nt
(` c
rore
)
2014
-15
201
7,1
4,3
60
354
2,5
3,5
55
246
52,2
27
292
28,6
55
703
30,7
111,
796
10,7
9,5
08
2015
-16$
41
5,2
0,1
41
58
58,5
49
47
10,0
88
29
1,14
716
2,1
52
191
5,9
2,0
77
Apr
-15
153,
14,1
9512
10,9
298
1,42
65
257
234
242
3,27
,148
May
-15
111,
01,6
8222
13,1
1818
3,48
18
208
71,
624
661,
20,1
14Ju
n-15
151,
04,2
6424
34,5
0221
5,18
116
682
718
683
1,44
,815
$ i
nd
icate
s as
on
Ju
ne 3
0,
2015
.
So
urc
e:
Cre
dit
Rati
ng
Ag
en
cie
s.
Tab
le 1
5:
Revie
w o
f A
ccep
ted
Rati
ng
s o
f C
orp
ora
te D
ebt
Secu
riti
es
(Matu
rity
≥ 1
year)
Gra
de
Peri
od
Up
gra
ded
Do
wn
gra
ded
Reaff
irm
ed
Rati
ng
Watc
hW
ith
dra
wn
/
Su
spen
ded
To
tal
No
. o
f i
ssu
eA
mo
un
t
(` c
rore
)
No
. o
f
issu
e
Am
ou
nt
(` c
rore
)
No
. o
f
issu
e
Am
ou
nt
(` c
rore
)
No
. o
f
issu
e
Am
ou
nt
(` c
rore
)
No
. o
f
issu
e
Am
ou
nt
(` c
rore
)
No
. o
f
issu
e
Am
ou
nt
(` c
rore
)
2014
-15
464
1,87,4
43
206
1,03,2
03
1,930
59,4
7,1
39
50
60,7
43
451
65,8
43
3,0
99
63,6
4,1
75
2015
-16$
93
39,3
78
60
15,9
18371
20,8
5,8
1513
8,3
20
82
19,1
35
619
21,
68,5
65
Apr
-15
498
56
3,95
565
6,70
,671
00
176,
059
926,
81,6
70M
ay-1
577
13,6
6839
3,17
341
6,14
,414
116,
740
244,
092
192
6,42
,087
Jun-
1512
24,7
2415
8,79
026
58,
00,7
302
1,58
041
8,98
333
58,
44,8
07
$ i
nd
icate
s as
on
Ju
ne 3
0,
2015
.
So
urc
e:
Cre
dit
Rati
ng
Ag
en
cie
s.
Tab
le 1
6:
Dis
trib
uti
on
of T
urn
ove
r o
n C
ash
Seg
men
ts o
f E
xch
an
ges
(` c
rore
)
Sto
ck
Exch
an
ges
2014
-15
2015
-16$
Jun
-15
Ahm
edab
ad0
00
BSE
8,54
,845
1,88
,396
60,3
70C
alcu
tta
00
0M
adhy
a Pr
ades
h0
00
Mad
ras
00
0M
SEI
0.3
00
NSE
43,2
9,65
510
,74,
573
3,33
,289
Utt
ar P
rade
sh0
00
Vad
odar
a0
00
$ i
nd
icate
s as
on
Ju
ne 3
0,
2015
So
urc
e:
Exch
an
ges.

682
JULY SEBI BULLETIN 2015T
ab
le 1
7:
Tre
nd
s in
Cash
Seg
men
t o
f B
SE
Year/
Mo
nth
No
. o
f
Co
m-
pan
ies
Lis
ted
No
. o
f
Co
mp
a-
nie
s P
er-
mit
ted
*
No
. o
f
co
m-
pan
ies
trad
ed
No
. o
f
Tra
din
g
Days
No
. o
f
Tra
des
(Lak
h)
Tra
ded
Qu
an
tity
(Lak
h)
Tu
rno
ver
(` c
rore
)
Ave
rag
e
Dail
y
Tu
rno
ver
(` c
rore
)
Ave
rag
e
Tra
de
Siz
e (`)
Dem
at
Secu
riti
es
Tra
ded
(Lak
h)
Dem
at
Tu
rno
ver
(` c
rore
)
Mark
et
Cap
itali
sa-
tio
n
(` c
rore
)
S&
P B
SE
Sen
sex
Hig
hL
ow
Clo
se
2014
-15
5,6
24
93
2,8
18243
7,1
118,5
6,7
55
8,5
4,8
45
3,5
1812
,021
8,5
6,7
55
8,5
4,8
42
1,01,
49,2
90
30,0
25
22,1
98
27,9
57
2015
-16$
5,6
88
93
2,8
01
61
1,15
61,
69,2
55
1,88,3
96
3,0
88
16,2
91
1,69,2
55
1,88,3
96
1,01,
43,5
1129,0
95
26,3
07
27,7
81
Apr
-15
5,65
093
2808
1953
965
,250
67,4
213,
548
12,5
1665
,250
67,4
2199
,68,
015
29,0
9526
,898
27,0
11M
ay-1
55,
672
9327
8520
326
48,3
2760
,605
3,03
018
,586
48,3
2760
,605
1,03
,26,
686
28,0
7126
,424
27,8
28Ju
n-15
5,68
893
2801
2229
255
,677
60,3
702,
744
20,6
9555
,677
60,3
701,
01,4
3,51
127
,969
26,3
0727
,781
No
te:
* E
xclu
din
g M
utu
al
Fu
nd
Sch
em
es
fro
m F
eb 2
013
.
$ i
nd
icate
s as
on
Ju
ne 3
0,
2015
.
So
urc
e:
BS
E .
Tab
le 1
8:
Tre
nd
s in
Cash
Seg
men
t o
f N
SE
Year/
Mo
nth
No
. o
f
Co
m-
pan
ies
Lis
ted
No
. o
f
Co
mp
a-
nie
s P
er-
mit
ted
No
. o
f
Co
m-
pan
ies
Tra
ded
No
. o
f
Tra
d-
ing
Days
No
. o
f
Tra
des
(Lak
h)
Tra
ded
Qu
an
tity
(Lak
h)
Tu
rno
ver
(`cro
re)
Ave
rag
e
Dail
y
Tu
rno
ver
(` c
rore
)
Ave
rag
e
Tra
de
Siz
e (`)
Dem
at
Secu
riti
es
Tra
ded
(Lak
h)
Dem
at
Tu
rno
ver
(` c
rore
)
Mark
et
Cap
itali
sa-
tio
n
(` c
rore
)
CN
X N
ifty
In
dex
Hig
hL
ow
Clo
se
2014
-15
1,733
41,
514
243
18,3
28
23,6
1,779
43,2
9,6
55
17,8
1823,6
23
23,6
1,779
43,2
9,6
55
99,3
0,1
22
9,1
196,6
39
8,4
91
2015
-16$
1,750
41,
517
61
4,4
84
4,9
3,3
72
10,7
4,5
73
17,6
1623,9
66
4,9
3,3
72
10,7
4,5
73
98,4
9,0
76
8,8
45
7,9
40
8,3
69
Apr
-15
1,74
04
1,51
819
1,50
61,
62,6
633,
79,3
4919
,966
25,1
901,
62,6
6337
9,34
996
,86,
324
8,84
58,
145
8,18
2
May
-15
1,74
94
1,51
920
1,45
31,
52,9
363,
61,9
3518
,097
24,9
1815
2,93
636
1,93
51,
00,2
0,66
58,
490
7,99
78,
434
Jun-
151,
750
41,
517
221,
525
1,77
,774
3,33
,289
15,1
5021
,851
177,
774
333,
289
98,4
9,07
68,
467
7,94
08,
369
No
te:
Dem
at
turn
ove
r in
clu
des
turn
ove
r o
f a
ll s
ecu
riti
es
wh
ich
are
ava
ilab
le f
or
trad
ing
in
Dem
at
mo
de
$ i
nd
icate
s as
on
Ju
ne 3
0,
2015
.
So
urc
e:
NS
E

683
JULY SEBI BULLETIN 2015T
ab
le 1
9:
Tre
nd
s in
Cash
Seg
men
t o
f B
SE
du
rin
g J
un
e 2
015
Date
No
. o
f
Co
mp
an
ies
Tra
ded
No
. o
f
Tra
des
(Lak
h)
Tra
ded
Qu
an
tity
(Lak
h)
Tu
rno
ver
(` c
rore
)
Ave
rag
e
Tra
de S
ize
(`)
Dem
at
Secu
riti
es
Tra
ded
(Lak
h)
Dem
at
Tu
rno
ver
(` c
rore
)
Mark
et
Cap
i-
tali
sati
on
(` c
rore
)
S&
P B
SE
Sen
sex
S&
P B
SE
100
Hig
hL
ow
Clo
seH
igh
Lo
wC
lose
1-Ju
n-15
2,8
36 1
3.1
2,2
03.5
2,6
99.3
206
.2 2
,203
.5 2
,699
.31,
02,9
8,93
727
959
2773
827
849
8574
8524
8536
2-Ju
n-15
2,7
65 1
4.2
2,2
05.9
3,0
86.7
217
.4 2
,205
.9 3
,086
.71,
01,0
0,37
627
903
2714
727
188
8556
8336
8345
3-Ju
n-15
2,7
91 1
7.9
4,1
50.2
3,5
01.3
195
.7 4
,150
.2 3
,501
.398
,83,
222
2727
626
698
2683
783
6981
7582
31
4-Ju
n-15
2,7
57 1
3.9
2,8
82.8
4,6
81.3
335
.8 2
,882
.8 4
,681
.398
,81,
786
2694
926
552
2681
382
6081
5282
30
5-Ju
n-15
2,7
72 1
3.5
2,4
17.5
2,6
74.9
198
.4 2
,417
.5 2
,674
.999
,00,
790
2701
426
718
2676
882
8682
0182
15
8-Ju
n-15
2,7
49 1
1.6
1,7
19.1
1,8
73.6
161
.4 1
,719
.1 1
,873
.697
,86,
104
2682
726
473
2652
382
3281
1681
31
9-Ju
n-15
2,7
35 1
1.9
1,9
07.2
2,2
25.9
187
.8 1
,907
.2 2
,225
.997
,60,
367
2660
526
438
2648
181
5180
9581
15
10-Ju
n-15
2,7
37 1
2.4
2,0
52.5
2,0
75.6
166
.9 2
,052
.5 2
,075
.698
,72,
585
2693
526
493
2684
182
4381
2382
16
11-Ju
n-15
2,7
33 1
3.2
2,1
71.4
2,5
08.3
190
.5 2
,171
.4 2
,508
.397
,08,
518
2700
026
349
2637
182
6480
5280
59
12-Ju
n-15
2,7
27 1
2.2
2,1
97.7
2,2
04.8
180
.9 2
,197
.7 2
,204
.897
,02,
242
2649
026
307
2642
580
8680
3080
74
15-Ju
n-15
2,7
70 1
1.3
2,0
68.9
2,3
53.1
208
.4 2
,068
.9 2
,353
.197
,36,
134
2672
926
308
2658
781
4880
4581
05
16-Ju
n-15
2,7
34 1
1.5
2,0
41.5
2,5
05.2
218
.8 2
,041
.5 2
,505
.297
,65,
297
2673
126
380
2668
781
4880
4081
35
17-Ju
n-15
2,7
63 1
3.7
2,4
36.5
3,1
19.6
227
.9 2
,436
.5 3
,119
.698
,46,
493
2698
326
729
2683
382
3181
4481
86
18-Ju
n-15
2,8
32 1
3.5
3,1
13.2
3,0
01.1
223
.0 3
,113
.2 3
,001
.199
,44,
128
2717
526
910
2711
682
8282
0782
68
19-Ju
n-15
2,8
00 1
2.3
2,5
43.2
3,5
42.9
287
.1 2
,543
.2 3
,542
.91,
00,0
4,41
227
405
2720
227
316
8351
8293
8328
22-Ju
n-15
2,7
97 1
3.2
2,7
20.8
2,3
25.0
176
.8 2
,720
.8 2
,325
.01,
01,2
9,69
827
782
2741
727
730
8466
8357
8453
23-Ju
n-15
2,8
02 1
3.4
2,7
36.5
2,4
85.3
185
.2 2
,736
.5 2
,485
.31,
01,7
4,38
827
883
2766
727
804
8506
8438
8482
24-Ju
n-15
2,8
32 1
3.9
3,0
32.7
2,6
29.3
188
.6 3
,032
.7 2
,629
.31,
01,3
1,03
627
948
2764
727
730
8516
8428
8451
25-Ju
n-15
2,7
65 1
3.2
2,6
51.1
2,5
55.9
193
.5 2
,651
.1 2
,555
.91,
01,6
0,97
427
969
2763
627
896
8514
8424
8497
26-Ju
n-15
2,7
75 1
4.3
3,6
25.6
3,0
55.9
213
.5 3
,625
.6 3
,055
.91,
01,5
4,23
827
922
2767
527
812
8503
8433
8478
29-Ju
n-15
2,7
74 1
3.7
2,2
15.7
2,5
45.6
186
.4 2
,215
.7 2
,545
.61,
00,5
9,36
027
695
2720
927
645
8418
8289
8409
30-Ju
n-15
2,8
01 1
3.9
2,5
83.7
2,7
19.9
195
.1 2
,583
.7 2
,719
.91,
01,4
3,51
127
815
2757
127
781
8473
8393
8464
So
urc
e:
BS
E.

684
JULY SEBI BULLETIN 2015T
ab
le 2
0:
Tre
nd
s in
Cash
Seg
men
t o
f N
SE
du
rin
g J
un
e 2
015
Date
No
. o
f
Co
m-
pan
ies
Tra
ded
No
. o
f
Tra
des
(Lak
h)
Tra
ded
Qu
an
tity
(Lak
h)
Tu
rno
ver
(` c
rore
)
Ave
rag
e
Tra
de
Siz
e (`)
Dem
at
Secu
riti
es
Tra
ded
(Lak
h)
Dem
at
Tu
rno
ver
(` c
rore
)
Mark
et
Cap
i-
tali
sati
on
(` c
rore
)
CN
X N
ifty
In
dex
CN
X N
ifty
Ju
nio
r In
dex
Hig
hL
ow
Clo
seH
igh
Lo
wC
lose
1-Ju
n-15
1,4
72 6
5.0
6,3
29.1
15,
609.
6 2
4,00
7.4
6,3
29.1
15,
609.
699
,98,
091
8467
8405
8433
1986
719
730
1981
32-
Jun-
15 1
,438
72.
2 7
,408
.4 1
6,98
3.5
23,
536.
0 7
,408
.4 1
6,98
3.5
97,9
7,73
484
4582
2682
3619
876
1938
919
407
3-Ju
n-15
1,4
53 8
5.8
17,
234.
8 1
8,91
2.9
22,
046.
4 1
7,23
4.8
18,
912.
995
,84,
576
8237
8094
8135
1942
018
819
1915
54-
Jun-
15 1
,437
74.
7 9
,841
.6 1
5,66
0.9
20,
974.
8 9
,841
.6 1
5,66
0.9
95,8
2,40
881
6080
5781
3119
236
1897
819
193
5-Ju
n-15
1,4
51 6
8.7
7,6
37.3
15,
088.
5 2
1,97
2.9
7,6
37.3
15,
088.
595
,98,
700
8191
8100
8115
1933
419
082
1924
48-
Jun-
15 1
,439
65.
2 6
,492
.7 1
2,89
4.3
19,
780.
7 6
,492
.7 1
2,89
4.3
94,9
6,27
381
3180
3180
4419
297
1892
518
984
9-Ju
n-15
1,4
31 6
7.4
6,8
80.1
13,
570.
0 2
0,13
2.3
6,8
80.1
13,
570.
094
,69,
420
8057
8005
8022
1903
318
820
1894
210
-Jun-
15 1
,443
65.
2 7
,182
.2 1
3,50
9.9
20,
711.
2 7
,182
.2 1
3,50
9.9
95,7
6,92
381
5280
2481
2419
174
1897
119
130
11-Ju
n-15
1,4
48 6
9.0
8,1
98.0
15,
405.
7 2
2,34
0.0
8,1
98.0
15,
405.
794
,13,
420
8163
7958
7965
1928
918
817
1884
112
-Jun-
15 1
,439
61.
5 6
,815
.1 1
2,62
2.8
20,
512.
4 6
,815
.1 1
2,62
2.8
94,0
8,95
979
9679
4079
8318
900
1874
218
880
15-Ju
n-15
1,4
50 5
8.6
6,3
35.8
11,
653.
6 1
9,90
2.6
6,3
35.8
11,
653.
694
,39,
751
8058
7945
8014
1903
418
864
1890
916
-Jun-
15 1
,446
58.
6 6
,263
.1 1
2,42
7.2
21,
188.
9 6
,263
.1 1
2,42
7.2
94,7
1,06
680
6279
5280
4719
065
1882
419
027
17-Ju
n-15
1,4
55 7
2.9
7,3
25.6
16,
104.
6 2
2,09
9.3
7,3
25.6
16,
104.
695
,53,
832
8137
8049
8092
1942
119
104
1933
118
-Jun-
15 1
,443
71.
1 7
,091
.0 1
5,26
2.5
21,
466.
8 7
,091
.0 1
5,26
2.5
96,5
0,64
381
8781
0281
7519
440
1933
419
416
19-Ju
n-15
1,4
65 7
1.6
7,1
80.3
16,
554.
1 2
3,12
2.9
7,1
80.3
16,
554.
197
,05,
161
8251
8196
8225
1961
019
473
1952
522
-Jun-
15 1
,461
71.
9 8
,373
.1 1
4,21
7.7
19,
782.
9 8
,373
.1 1
4,21
7.7
98,3
4,79
683
6982
5783
5319
839
1953
019
820
23-Ju
n-15
1,4
55 7
0.4
7,8
27.5
14,
332.
8 2
0,37
1.7
7,8
27.5
14,
332.
898
,77,
190
8398
8335
8382
1996
019
777
1984
524
-Jun-
15 1
,455
75.
3 8
,090
.1 1
6,04
8.5
21,
300.
4 8
,090
.1 1
6,04
8.5
98,3
7,48
084
2183
3983
6119
923
1968
419
736
25-Ju
n-15
1,4
55 7
2.6
10,
551.
1 2
0,79
8.3
28,
657.
9 1
0,55
1.1
20,
798.
398
,59,
595
8423
8330
8398
1986
319
675
1984
226
-Jun-
15 1
,454
67.
9 8
,745
.8 1
4,48
5.1
21,
338.
5 8
,745
.8 1
4,48
5.1
98,5
8,98
884
0983
4083
8119
855
1967
319
814
29-Ju
n-15
1,4
47 6
6.3
7,7
70.3
13,
879.
3 2
0,93
7.3
7,7
70.3
13,
879.
397
,62,
895
8329
8196
8318
1960
919
304
1958
830
-Jun-
15 1
,464
73.
6 8
,201
.0 1
7,26
7.5
23,
470.
5 8
,201
.0 1
7,26
7.5
98,4
9,07
683
7882
9983
6919
832
1960
719
825
So
urc
e:
NS
E.

685
JULY SEBI BULLETIN 2015T
ab
le 2
1: T
urn
ove
r an
d M
ark
et
Cap
itali
sati
on
at
BS
E a
nd
NS
E d
uri
ng
Ju
ne 2
015
(`
cro
re)
Dat
e
Tu
rno
ver
Mar
ket
Cap
ital
isat
ion
BS
E N
SE
BS
E N
SE
S&
P
BS
E
Sen
sex
S&
P
BS
E
100
To
tal
A#
B#
CN
X
Nif
ty
CN
X
Nif
ty
Jun
ior
To
tal
C#
D#
S&
P B
SE
Sen
sex
S&
P
BS
E 1
00T
ota
lE
#F
#C
NX
Nif
ty
CN
X
Nif
ty
Jun
ior
To
tal
G#
H#
1-Ju
n-15
577
1,07
92,
699
21.
4 4
0.0
7,25
42,
644
15,6
10 4
6.5
6.9
24,1
4,35
434
,26,
882
1,02
,98,
937
23.
4 3
3.3
29,8
2,63
15,
36,1
8199
,98,
091
29.
8 5
.4
2-Ju
n-15
754
1,47
23,
087
24.
4 4
7.7
8,08
32,
805
16,9
83 4
7.6
16.
523
,57,
083
33,5
0,25
61,
01,0
0,37
6 2
3.3
33.
229
,12,
964
5,25
,213
97,9
7,73
4 2
9.7
5.4
3-Ju
n-15
629
1,53
93,
501
18.
0 4
4.0
7,92
03,
442
18,9
13 4
1.9
18.
223
,26,
637
33,0
5,04
798
,83,
222
23.
5 3
3.4
28,7
7,13
45,
18,3
9195
,84,
576
30.
0 5
.4
4-Ju
n-15
519
3,38
74,
681
11.
1 7
2.4
7,56
02,
906
15,6
61 4
8.3
18.
623
,24,
576
33,0
4,42
698
,81,
786
23.
5 3
3.4
28,7
5,56
25,
19,4
1595
,82,
408
30.
0 5
.4
5-Ju
n-15
561
1,12
92,
675
21.
0 4
2.2
7,58
82,
230
15,0
88 5
0.3
14.
823
,20,
681
32,9
8,72
299
,00,
790
23.
4 3
3.3
28,6
9,91
45,
20,7
8895
,98,
700
29.
9 5
.4
8-Ju
n-15
367
760
1,87
4 1
9.6
40.
66,
231
1,90
212
,894
48.
3 1
4.8
22,9
9,40
632
,65,
062
97,8
6,10
4 2
3.5
33.
428
,45,
504
5,14
,287
94,9
6,27
3 3
0.0
5.4
9-Ju
n-15
466
906
2,22
6 2
0.9
40.
76,
442
2,38
213
,570
47.
5 1
7.6
22,9
5,77
932
,58,
591
97,6
0,36
7 2
3.5
33.
428
,37,
801
5,13
,136
94,6
9,42
0 3
0.0
5.4
10-Ju
n-15
425
832
2,07
6 2
0.5
40.
16,
790
1,94
213
,510
50.
3 1
4.4
23,2
6,92
432
,98,
943
98,7
2,58
5 2
3.6
33.
428
,73,
907
5,18
,256
95,7
6,92
3 3
0.0
5.4
11-Ju
n-15
541
1,04
82,
508
21.
6 4
1.8
7,86
82,
310
15,4
06 5
1.1
15.
022
,86,
219
32,3
5,89
997
,08,
518
23.
5 3
3.3
28,1
7,62
35,
10,4
0394
,13,
420
29.
9 5
.4
12-Ju
n-15
480
907
2,20
5 2
1.8
41.
16,
737
1,72
512
,623
53.
4 1
3.7
22,9
0,92
832
,41,
940
97,0
2,24
2 2
3.6
33.
428
,23,
833
5,11
,476
94,0
8,95
9 3
0.0
5.4
15-Ju
n-15
449
916
2,35
3 1
9.1
38.
96,
129
1,68
111
,654
52.
6 1
4.4
23,0
4,90
832
,54,
243
97,3
6,13
4 2
3.7
33.
428
,34,
797
5,12
,243
94,3
9,75
1 3
0.0
5.4
16-Ju
n-15
579
1,02
32,
505
23.
1 4
0.8
5,92
42,
092
12,4
27 4
7.7
16.
823
,13,
573
32,6
6,53
297
,65,
297
23.
7 3
3.5
28,4
6,61
65,
15,4
5494
,71,
066
30.
1 5
.4
17-Ju
n-15
887
1,38
63,
120
28.
4 4
4.4
7,87
92,
807
16,1
05 4
8.9
17.
423
,26,
244
32,8
6,75
498
,46,
493
23.
6 3
3.4
28,6
2,27
55,
23,6
9295
,53,
832
30.
0 5
.5
18-Ju
n-15
607
1,12
63,
001
20.
2 3
7.5
7,76
82,
352
15,2
62 5
0.9
15.
423
,50,
793
33,1
9,87
699
,44,
128
23.
6 3
3.4
28,9
1,65
15,
25,9
8596
,50,
643
30.
0 5
.5
19-Ju
n-15
423
850
3,54
3 1
1.9
24.
07,
722
3,33
716
,554
46.
6 2
0.2
23,6
8,16
133
,44,
040
1,00
,04,
412
23.
7 3
3.4
29,0
9,45
75,
28,9
3397
,05,
161
30.
0 5
.5
22-Ju
n-15
433
945
2,32
5 1
8.6
40.
76,
163
2,44
014
,218
43.
3 1
7.2
24,3
7,51
434
,30,
151
1,01
,29,
698
24.
1 3
3.9
29,5
4,78
95,
36,9
3198
,34,
796
30.
0 5
.5
23-Ju
n-15
461
932
2,48
5 1
8.6
37.
56,
437
2,27
914
,333
44.
9 1
5.9
24,4
4,03
334
,41,
876
1,01
,74,
388
24.
0 3
3.8
29,6
4,86
15,
37,6
2298
,77,
190
30.
0 5
.4
24-Ju
n-15
515
944
2,62
9 1
9.6
35.
97,
175
2,69
816
,049
44.
7 1
6.8
24,3
7,46
634
,29,
005
1,01
,31,
036
24.
1 3
3.8
29,5
7,53
25,
34,6
6898
,37,
480
30.
1 5
.4
25-Ju
n-15
592
1,03
52,
556
23.
2 4
0.5
9,91
14,
087
20,7
98 4
7.7
19.
624
,52,
084
34,4
7,87
41,
01,6
0,97
4 2
4.1
33.
929
,70,
679
5,37
,537
98,5
9,59
5 3
0.1
5.5
26-Ju
n-15
510
1,39
13,
056
16.
7 4
5.5
5,84
92,
466
14,4
85 4
0.4
17.
024
,44,
689
34,4
0,08
21,
01,5
4,23
8 2
4.1
33.
929
,64,
689
5,36
,776
98,5
8,98
8 3
0.1
5.4
29-Ju
n-15
528
1,08
62,
546
20.
8 4
2.7
6,60
42,
225
13,8
79 4
7.6
16.
024
,30,
036
34,1
1,97
31,
00,5
9,36
0 2
4.2
33.
929
,42,
516
5,30
,656
97,6
2,89
5 3
0.1
5.4
30-Ju
n-15
479
989
2,72
0 1
7.6
36.
48,
426
2,87
517
,267
48.
8 1
6.7
24,4
1,96
334
,34,
512
1,01
,43,
511
24.
1 3
3.9
29,6
0,24
35,
37,0
8398
,49,
076
30.
1 5
.5
No
tes:
1.
S&
P B
SE
Sen
sex,
S&
P B
SE
100
, C
NX
Nif
ty &
CN
X N
ifty
Ju
nio
r h
ave
free
flo
at m
ark
et c
apit
lisa
tio
n.
A#
= p
erce
nta
ge
shar
e o
f S
ense
x se
curi
ties
in
to
tal
BS
E t
urn
ove
r .
E#
= p
erce
nta
ge
shar
e o
f S
ense
x se
curi
riti
es i
n t
ota
l B
SE
Mar
ket
Cap
ital
isat
ion
.
B#
= p
erce
nta
ge
shar
e o
f B
SE
-100
In
dex
sec
uri
ties
in
to
tal
BS
E t
urn
ove
r.
F#
= p
erce
nta
ge
shar
e o
f B
SE
-100
In
dex
sec
uri
ties
in
to
tal
BS
E M
ark
et C
apit
alis
atio
n.
C#
= p
erce
nta
ge
shar
e o
f C
NX
Nif
ty s
ecu
riti
es i
n t
ota
l N
SE
tu
rno
ver.
G
# =
per
cen
tag
e sh
are
of
CN
X N
ifty
sec
uri
ties
in
to
tal
NS
E M
ark
et C
apit
alis
atio
n.
D#
= p
erce
nta
ge
shar
e o
f C
NX
Nif
ty J
un
ior
secu
riti
es i
n t
ota
l N
SE
tu
rno
ver
. H
# =
per
cen
tag
e sh
are
of
CN
X N
ifty
Ju
nio
r se
curi
ties
in
to
tal
NS
E M
ark
et C
apit
alis
atio
n.
So
urc
e: B
SE
an
d N
SE
.

686
JULY SEBI BULLETIN 2015
Table 22: City-wise Distribution of Turnover on Cash Segments of BSE and NSE
(Percentage share in Turnover)
S.No.City BSE NSE
Stock Exchange/City 2014-15 Jun-15 2014-15 Jun-15
1 Ahmedabad 5.5 3.8 3.5 2.4 2 Bangalore 0.3 0.2 1.7 4.4 3 Baroda 0.7 1.1 0.4 0.3 4 Bhubaneshwar 0.0 0.0 0.0 0.0 5 Chennai 0.6 0.6 1.4 1.3 6 Cochin 0.2 0.2 1.4 1.2 7 Coimbatore 0.0 0.0 0.2 0.1 8 Delhi 4.4 3.4 9.4 9.3 9 Guwahati 0.1 0.1 0.0 0.0 10 Hyderabad 0.3 0.3 4.5 4.1 11 Indore 0.5 0.3 0.5 0.4 12 Jaipur 0.9 0.7 0.5 0.6 13 Kanpur 0.7 0.5 0.1 0.1 14 Kolkata 6.8 6.2 6.6 5.4 15 Ludhiana 0.1 0.1 0.1 0.1 16 Mangalore 0.0 0.0 0.0 0.0 17 Mumbai 56.9 56.1 59.2 58.1 18 Patna 0.1 0.1 0.0 0.0 19 Pune 0.5 0.3 0.2 0.1 20 Rajkot 3.3 2.7 1.0 1.1 21 Others 18.1 23.3 9.2 10.9
Total 100.0 100.0 100.0 100.0
Note: 1. The city-wise distribution of turnover is based on the cities uploaded in the UCC database of the Exchange for clientele
trades and member’s registered office city for proprietary trades.
Source: BSE and NSE.
Table 23: Category-wise Share of Turnover in Cash Segment of BSE
MonthPercentage Share in Turnover
Proprietary FII Mutual Funds Banks Others
Jun-14 21.9 16.8 2.3 0.1 58.8Jul-14 20.3 17.8 2.8 0.1 59.0Aug-14 20.1 15.5 2.9 0.1 61.4Sep-14 19.8 19.6 2.2 0.1 58.4Oct-14 20.5 20.7 2.5 0.6 55.8Nov-14 18.3 23.8 2.4 0.2 55.3Dec-14 19.9 16.8 2.6 0.0 60.7Jan-15 19.3 22.0 2.6 0.1 56.1Feb-15 20.7 19.6 2.5 0.1 57.2Mar-15 17.9 21.5 2.9 0.3 57.4Apr-15 17.8 23.8 2.9 0.1 55.4May-15 17.2 26.2 3.0 0.0 53.6Jun-15 17.6 21.8 3.3 0.0 57.3
Source: BSE.
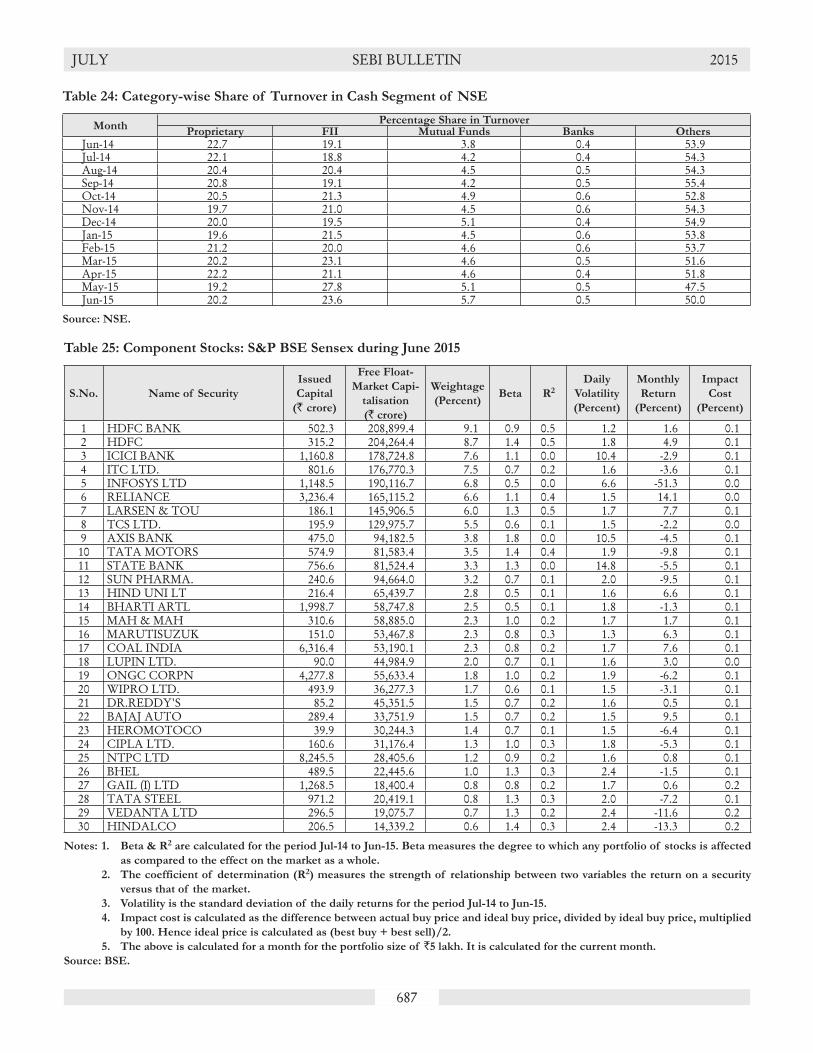
687
JULY SEBI BULLETIN 2015
Table 24: Category-wise Share of Turnover in Cash Segment of NSE
MonthPercentage Share in Turnover
Proprietary FII Mutual Funds Banks OthersJun-14 22.7 19.1 3.8 0.4 53.9Jul-14 22.1 18.8 4.2 0.4 54.3Aug-14 20.4 20.4 4.5 0.5 54.3Sep-14 20.8 19.1 4.2 0.5 55.4Oct-14 20.5 21.3 4.9 0.6 52.8Nov-14 19.7 21.0 4.5 0.6 54.3Dec-14 20.0 19.5 5.1 0.4 54.9Jan-15 19.6 21.5 4.5 0.6 53.8Feb-15 21.2 20.0 4.6 0.6 53.7Mar-15 20.2 23.1 4.6 0.5 51.6Apr-15 22.2 21.1 4.6 0.4 51.8May-15 19.2 27.8 5.1 0.5 47.5Jun-15 20.2 23.6 5.7 0.5 50.0
Source: NSE.
Table 25: Component Stocks: S&P BSE Sensex during June 2015
S.No. Name of Security
Issued
Capital
(` crore)
Free Float-
Market Capi-
talisation
(` crore)
Weightage
(Percent)Beta R2
Daily
Volatility
(Percent)
Monthly
Return
(Percent)
Impact
Cost
(Percent)
1 HDFC BANK 502.3 208,899.4 9.1 0.9 0.5 1.2 1.6 0.12 HDFC 315.2 204,264.4 8.7 1.4 0.5 1.8 4.9 0.13 ICICI BANK 1,160.8 178,724.8 7.6 1.1 0.0 10.4 -2.9 0.14 ITC LTD. 801.6 176,770.3 7.5 0.7 0.2 1.6 -3.6 0.15 INFOSYS LTD 1,148.5 190,116.7 6.8 0.5 0.0 6.6 -51.3 0.06 RELIANCE 3,236.4 165,115.2 6.6 1.1 0.4 1.5 14.1 0.07 LARSEN & TOU 186.1 145,906.5 6.0 1.3 0.5 1.7 7.7 0.18 TCS LTD. 195.9 129,975.7 5.5 0.6 0.1 1.5 -2.2 0.09 AXIS BANK 475.0 94,182.5 3.8 1.8 0.0 10.5 -4.5 0.110 TATA MOTORS 574.9 81,583.4 3.5 1.4 0.4 1.9 -9.8 0.111 STATE BANK 756.6 81,524.4 3.3 1.3 0.0 14.8 -5.5 0.112 SUN PHARMA. 240.6 94,664.0 3.2 0.7 0.1 2.0 -9.5 0.113 HIND UNI LT 216.4 65,439.7 2.8 0.5 0.1 1.6 6.6 0.114 BHARTI ARTL 1,998.7 58,747.8 2.5 0.5 0.1 1.8 -1.3 0.115 MAH & MAH 310.6 58,885.0 2.3 1.0 0.2 1.7 1.7 0.116 MARUTISUZUK 151.0 53,467.8 2.3 0.8 0.3 1.3 6.3 0.117 COAL INDIA 6,316.4 53,190.1 2.3 0.8 0.2 1.7 7.6 0.118 LUPIN LTD. 90.0 44,984.9 2.0 0.7 0.1 1.6 3.0 0.019 ONGC CORPN 4,277.8 55,633.4 1.8 1.0 0.2 1.9 -6.2 0.120 WIPRO LTD. 493.9 36,277.3 1.7 0.6 0.1 1.5 -3.1 0.121 DR.REDDY'S 85.2 45,351.5 1.5 0.7 0.2 1.6 0.5 0.122 BAJAJ AUTO 289.4 33,751.9 1.5 0.7 0.2 1.5 9.5 0.123 HEROMOTOCO 39.9 30,244.3 1.4 0.7 0.1 1.5 -6.4 0.124 CIPLA LTD. 160.6 31,176.4 1.3 1.0 0.3 1.8 -5.3 0.125 NTPC LTD 8,245.5 28,405.6 1.2 0.9 0.2 1.6 0.8 0.126 BHEL 489.5 22,445.6 1.0 1.3 0.3 2.4 -1.5 0.127 GAIL (I) LTD 1,268.5 18,400.4 0.8 0.8 0.2 1.7 0.6 0.228 TATA STEEL 971.2 20,419.1 0.8 1.3 0.3 2.0 -7.2 0.129 VEDANTA LTD 296.5 19,075.7 0.7 1.3 0.2 2.4 -11.6 0.230 HINDALCO 206.5 14,339.2 0.6 1.4 0.3 2.4 -13.3 0.2
Notes: 1. Beta & R2 are calculated for the period Jul-14 to Jun-15. Beta measures the degree to which any portfolio of stocks is affected
as compared to the effect on the market as a whole.
2. The coefficient of determination (R2) measures the strength of relationship between two variables the return on a security
versus that of the market.
3. Volatility is the standard deviation of the daily returns for the period Jul-14 to Jun-15.
4. Impact cost is calculated as the difference between actual buy price and ideal buy price, divided by ideal buy price, multiplied
by 100. Hence ideal price is calculated as (best buy + best sell)/2.
5. The above is calculated for a month for the portfolio size of `5 lakh. It is calculated for the current month.
Source: BSE.
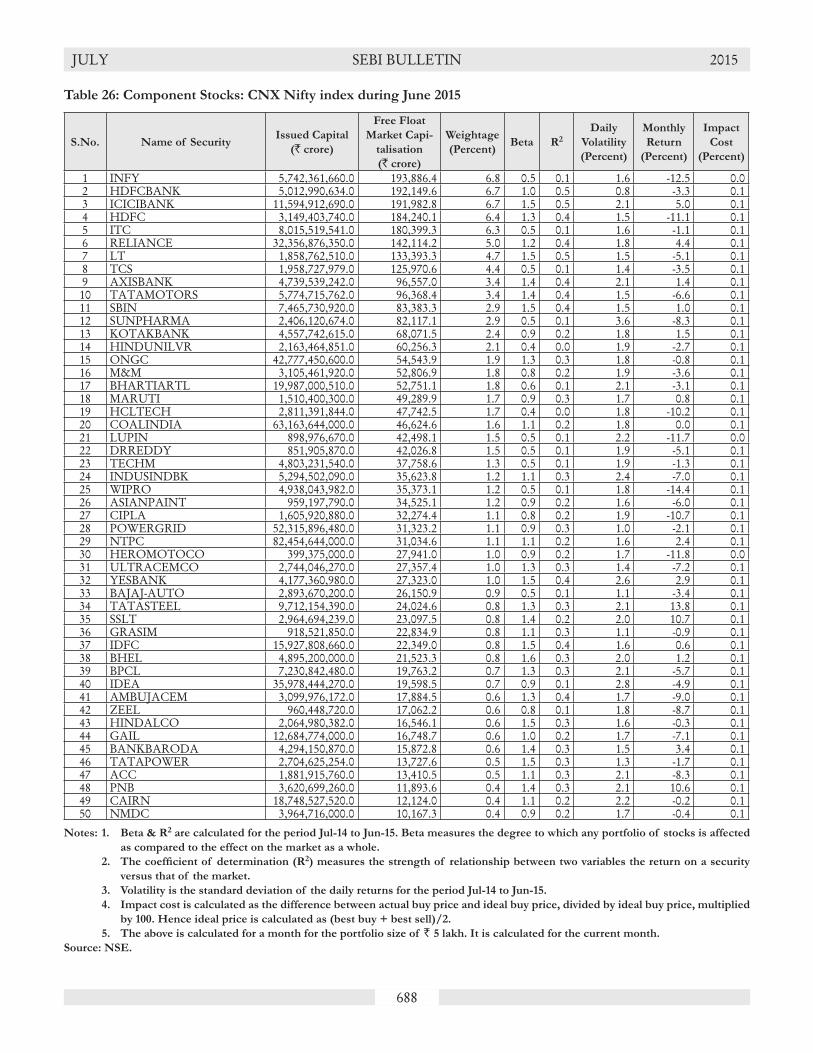
688
JULY SEBI BULLETIN 2015
Table 26: Component Stocks: CNX Nifty index during June 2015
S.No. Name of SecurityIssued Capital
(` crore)
Free Float
Market Capi-
talisation
(` crore)
Weightage
(Percent)Beta R2
Daily
Volatility
(Percent)
Monthly
Return
(Percent)
Impact
Cost
(Percent)
1 INFY 5,742,361,660.0 193,886.4 6.8 0.5 0.1 1.6 -12.5 0.02 HDFCBANK 5,012,990,634.0 192,149.6 6.7 1.0 0.5 0.8 -3.3 0.13 ICICIBANK 11,594,912,690.0 191,982.8 6.7 1.5 0.5 2.1 5.0 0.14 HDFC 3,149,403,740.0 184,240.1 6.4 1.3 0.4 1.5 -11.1 0.15 ITC 8,015,519,541.0 180,399.3 6.3 0.5 0.1 1.6 -1.1 0.16 RELIANCE 32,356,876,350.0 142,114.2 5.0 1.2 0.4 1.8 4.4 0.17 LT 1,858,762,510.0 133,393.3 4.7 1.5 0.5 1.5 -5.1 0.18 TCS 1,958,727,979.0 125,970.6 4.4 0.5 0.1 1.4 -3.5 0.19 AXISBANK 4,739,539,242.0 96,557.0 3.4 1.4 0.4 2.1 1.4 0.110 TATAMOTORS 5,774,715,762.0 96,368.4 3.4 1.4 0.4 1.5 -6.6 0.111 SBIN 7,465,730,920.0 83,383.3 2.9 1.5 0.4 1.5 1.0 0.112 SUNPHARMA 2,406,120,674.0 82,117.1 2.9 0.5 0.1 3.6 -8.3 0.113 KOTAKBANK 4,557,742,615.0 68,071.5 2.4 0.9 0.2 1.8 1.5 0.114 HINDUNILVR 2,163,464,851.0 60,256.3 2.1 0.4 0.0 1.9 -2.7 0.115 ONGC 42,777,450,600.0 54,543.9 1.9 1.3 0.3 1.8 -0.8 0.116 M&M 3,105,461,920.0 52,806.9 1.8 0.8 0.2 1.9 -3.6 0.117 BHARTIARTL 19,987,000,510.0 52,751.1 1.8 0.6 0.1 2.1 -3.1 0.118 MARUTI 1,510,400,300.0 49,289.9 1.7 0.9 0.3 1.7 0.8 0.119 HCLTECH 2,811,391,844.0 47,742.5 1.7 0.4 0.0 1.8 -10.2 0.120 COALINDIA 63,163,644,000.0 46,624.6 1.6 1.1 0.2 1.8 0.0 0.121 LUPIN 898,976,670.0 42,498.1 1.5 0.5 0.1 2.2 -11.7 0.022 DRREDDY 851,905,870.0 42,026.8 1.5 0.5 0.1 1.9 -5.1 0.123 TECHM 4,803,231,540.0 37,758.6 1.3 0.5 0.1 1.9 -1.3 0.124 INDUSINDBK 5,294,502,090.0 35,623.8 1.2 1.1 0.3 2.4 -7.0 0.125 WIPRO 4,938,043,982.0 35,373.1 1.2 0.5 0.1 1.8 -14.4 0.126 ASIANPAINT 959,197,790.0 34,525.1 1.2 0.9 0.2 1.6 -6.0 0.127 CIPLA 1,605,920,880.0 32,274.4 1.1 0.8 0.2 1.9 -10.7 0.128 POWERGRID 52,315,896,480.0 31,323.2 1.1 0.9 0.3 1.0 -2.1 0.129 NTPC 82,454,644,000.0 31,034.6 1.1 1.1 0.2 1.6 2.4 0.130 HEROMOTOCO 399,375,000.0 27,941.0 1.0 0.9 0.2 1.7 -11.8 0.031 ULTRACEMCO 2,744,046,270.0 27,357.4 1.0 1.3 0.3 1.4 -7.2 0.132 YESBANK 4,177,360,980.0 27,323.0 1.0 1.5 0.4 2.6 2.9 0.133 BAJAJ-AUTO 2,893,670,200.0 26,150.9 0.9 0.5 0.1 1.1 -3.4 0.134 TATASTEEL 9,712,154,390.0 24,024.6 0.8 1.3 0.3 2.1 13.8 0.135 SSLT 2,964,694,239.0 23,097.5 0.8 1.4 0.2 2.0 10.7 0.136 GRASIM 918,521,850.0 22,834.9 0.8 1.1 0.3 1.1 -0.9 0.137 IDFC 15,927,808,660.0 22,349.0 0.8 1.5 0.4 1.6 0.6 0.138 BHEL 4,895,200,000.0 21,523.3 0.8 1.6 0.3 2.0 1.2 0.139 BPCL 7,230,842,480.0 19,763.2 0.7 1.3 0.3 2.1 -5.7 0.140 IDEA 35,978,444,270.0 19,598.5 0.7 0.9 0.1 2.8 -4.9 0.141 AMBUJACEM 3,099,976,172.0 17,884.5 0.6 1.3 0.4 1.7 -9.0 0.142 ZEEL 960,448,720.0 17,062.2 0.6 0.8 0.1 1.8 -8.7 0.143 HINDALCO 2,064,980,382.0 16,546.1 0.6 1.5 0.3 1.6 -0.3 0.144 GAIL 12,684,774,000.0 16,748.7 0.6 1.0 0.2 1.7 -7.1 0.145 BANKBARODA 4,294,150,870.0 15,872.8 0.6 1.4 0.3 1.5 3.4 0.146 TATAPOWER 2,704,625,254.0 13,727.6 0.5 1.5 0.3 1.3 -1.7 0.147 ACC 1,881,915,760.0 13,410.5 0.5 1.1 0.3 2.1 -8.3 0.148 PNB 3,620,699,260.0 11,893.6 0.4 1.4 0.3 2.1 10.6 0.149 CAIRN 18,748,527,520.0 12,124.0 0.4 1.1 0.2 2.2 -0.2 0.150 NMDC 3,964,716,000.0 10,167.3 0.4 0.9 0.2 1.7 -0.4 0.1
Notes: 1. Beta & R2 are calculated for the period Jul-14 to Jun-15. Beta measures the degree to which any portfolio of stocks is affected
as compared to the effect on the market as a whole.
2. The coeffi cient of determination (R2) measures the strength of relationship between two variables the return on a security
versus that of the market.
3. Volatility is the standard deviation of the daily returns for the period Jul-14 to Jun-15.
4. Impact cost is calculated as the difference between actual buy price and ideal buy price, divided by ideal buy price, multiplied
by 100. Hence ideal price is calculated as (best buy + best sell)/2.
5. The above is calculated for a month for the portfolio size of ` 5 lakh. It is calculated for the current month.
Source: NSE.

689
JULY SEBI BULLETIN 2015
Table 27: Advances/Declines in Cash Segment of BSE and NSE
Month
BSE NSE
Advances DeclinesAdvance / Decline
RatioAdvances Declines
Advance /
Decline Ratio
Jun-14 3,013 559 5.4 1,432 118 12.1
Jul-14 2,082 1,506 1.4 894 654 1.4
Aug-14 1,546 2,026 0.8 639 953 0.7
Sep-14 2,351 1,249 1.9 1,121 468 2.4
Oct-14 1,431 2,177 0.7 516 1,071 0.5
Nov-14 1,944 1,143 1.7 1,012 548 1.8
Dec-14 1,332 1,762 0.8 552 1,007 0.5
Jan-15 1,733 1,728 1.0 977 576 1.7
Feb-15 1,433 2,159 0.7 593 913 0.6
Mar-15 1,112 2,487 0.5 593 1,042 0.6
Apr-15 1,926 1,600 1.2 898 625 1.4
May-15 1,226 2,267 0.5 402 1,114 0.4
Jun-15 1,102 2,387 0.5 404 1,113 0.4
Note: Advance/Decline is calculated based on the average price methodology.
Source: BSE and NSE
Table 28: Trading Frequency in Cash Segment of BSE and NSE
Month
BSE NSE
No. of Companies
Listed
No. of companies
Traded
Percent of Traded
to Listed
No. of
Companies Listed
No. of companies
Traded
Percent of Traded
to Listed
Jun-14 5,406 3,135 58.0 1,695 1,553 91.6
Jul-14 5,433 3,022 55.6 1,696 1,555 91.7
Aug-14 5,458 3,032 55.6 1,696 1,554 91.6
Sep-14 5,476 2,984 54.5 1,699 1,555 91.5
Oct-14 5,498 3,023 55.0 1,706 1,555 91.1
Nov-14 5,518 3,106 56.3 1,707 1,558 91.3
Dec-14 5,541 2,977 53.7 1,708 1,551 90.8
Jan-15 5,575 2,960 53.1 1,718 1,549 90.2
Feb-15 5,596 2,854 51.0 1,719 1,503 87.4
Mar-15 5,624 2,818 50.1 1,733 1,514 87.4
Apr-15 5,650 2,808 49.7 1,740 1,518 87.2
May-15 5,672 2,785 49.1 1,749 1,519 86.8
Jun-15 5,688 2,801 49.2 1,750 1,517 86.7
Note: At NSE, number of companies traded also includes the number of companies not available for trading but permitted to trade only
in the first week of every month.
Source: BSE and NSE

690
JULY SEBI BULLETIN 2015
Table 29: Daily Volatility of Major Indices (percent)
(Percent)
Year/ Month S&P BSE SensexS&P BSE 100
IndexS&P BSE 500 CNX Nifty
CNX Nifty
JuniorCNX 500
2014-15 0.9 0.9 0.9 0.9 1.1 0.9
2015-16$ 1.0 1.0 1.0 1.0 1.2 1.0
Apr-15 0.9 0.9 0.9 0.8 1.0 0.8
May-15 1.1 1.1 1.1 1.1 1.5 1.1
Jun-15 1.0 1.0 1.0 0.9 1.0 0.9
Note: Volatility is calculated as the standard deviation of the natural log of daily returns in indices for the respective period.
$ indicates as on June 30, 2015.
Source: BSE and NSE.
Table 30: Percentage Share of Top ‘N’ Securities/Members in Turnover of Cash Segment (percent)
Year/Month BSE NSE
Top 5 10 25 50 100 5 10 25 50 100
Securities
2014-15 13.4 18.6 30.3 42.3 57.5 12.5 21.9 40.6 59.3 77.4
2015-16$ 14.6 21.8 35.9 49.0 64.3 13.2 23.0 39.9 56.4 75.5
Apr-15 16.7 23.0 36.6 50.0 64.4 18.5 27.7 44.2 58.6 75.1
May-15 16.4 23.2 37.4 51.5 66.9 12.5 21.9 41.5 58.6 77.5
Jun-15 14.7 22.8 37.9 51.5 67.6 13.2 23.0 39.9 56.4 75.5
Members
2014-15 17.7 28.4 47.4 64.1 77.9 14.7 25.4 45.4 63.5 79.4
2015-16$ 21.5 32.5 53.2 68.4 80.5 17.8 29.2 52.0 68.7 81.8
Apr-15 19.5 32.0 52.2 67.7 80.4 20.6 32.3 53.7 69.4 82.5
May-15 22.1 34.2 55.0 69.7 81.3 18.7 31.2 54.6 70.7 83.4
Jun-15 26.4 36.2 55.0 68.6 80.5 17.8 29.2 52.0 68.7 81.8
Notes: 1. Cash segment of MSEI commenced its operations from Feb 11, 2013.
2. Data for Top N scrips has been compiled for all markets except Auction market & Retail Debt Market and includes series EQ,
BE,BT, BL and IL.
$ indicates as on June 30, 2015.
Source: BSE and NSE

691
JULY SEBI BULLETIN 2015T
ab
le 3
1: S
ett
lem
en
t S
tati
stic
s fo
r C
ash
Seg
men
t o
f B
SE
Yea
r/
Mo
nth
No
. o
f
Tra
des
(Lak
h)
Qu
anti
ty
Set
tled
(Lak
h)
Del
iv-
ered
Qu
anti
ty
(Lak
h)
Per
cen
t o
f
Del
iver
ed
Qu
anti
ty
to T
rad
ed
Qu
anti
ty
Val
ue
Set
tled
(` c
rore
)
Del
iver
ed
Val
ue
(` c
rore
)
Per
cen
t
of
De-
live
red
Val
ue
to T
ota
l
Tu
rn-
ove
r
Del
iver
ed
Qu
anti
ty
in D
emat
Mo
de
(Lak
h)
Per
cen
t
of
Dem
at
Del
iver
ed
Qu
anti
ty
to T
ota
l
Del
iver
ed
Qu
anti
ty
Del
iv-
ered
Val
ue
in
Dem
at
Mo
de
(` c
rore
)
Per
cen
t
of
Dem
at
Del
iver
ed
Val
ue
to T
ota
l
Del
iver
ed
Val
ue
Sh
ort
Del
iver
y
(Au
c-
tio
ned
qu
anti
ty)
(Lak
h)
Per
cen
t
of
Sh
ort
Del
iver
y to
Del
iver
y
Qu
anti
ty
Fu
nd
s
Pay
-in
(` c
rore
)
Sec
uri
-
ties
Pay
-
in
(` c
rore
)
Set
tle-
men
t-
Gu
aran
-
tee
Fu
nd
(`cr
ore
)
2014
-15
7,14
68,
60,6
954,
32,1
1250
.28,
58,8
952,
99,8
3534
.94,
32,0
1710
0.0
2,99
,818
100.
087
80.
21,
11,5
282,
99,8
353,
264
2015
-16$
1,15
61,
69,2
6185
,777
50.7
1,88
,396
67,4
6335
.885
,722
99.9
67,4
3410
0.0
170
0.6
29,3
5867
,463
105
Apr
-15
539
65,2
5236
,552
56.0
67,4
2123
,903
35.5
36,4
9799
.923
,874
99.9
620.
29,
458
23,9
0310
4
May
-15
326
48,3
3023
,548
48.7
60,6
0521
,877
36.1
23,5
4810
0.0
21,8
7710
0.0
560.
29,
587
21,8
7710
5
Jun-
1529
255
,679
25,6
7846
.160
,370
21,6
8335
.925
,677
100.
021
,683
100.
053
0.2
10,3
1321
,683
105
No
te:
Fro
m D
ecem
ber
2014
on
ward
s, c
ore
SG
F f
igu
res
have
been
rep
ort
ed
.
$ i
nd
icate
s as
on
Ju
ne 3
0,
2015
.
So
urc
e:
BS
E.
Tab
le 3
2:
Sett
lem
en
t S
tati
stic
s fo
r C
ash
Seg
men
t o
f N
SE
Yea
r/
Mo
nth
No
. o
f
Tra
des
(Lak
h)
Qu
an-
tity
Set
tled
(Lak
h)
Del
iver
ed
Qu
anti
ty
(Lak
h)
Per
cen
t o
f
Del
iver
ed
Qu
anti
ty
to T
rad
ed
Qu
anti
ty
Val
ue
Set
-
tled
(` c
rore
)
Del
iver
ed
Val
ue
(` c
rore
)
Per
cen
t o
f
Del
iver
ed
Val
ue
to
To
tal T
urn
-
ove
r
Del
iver
ed
Qu
anti
ty
in D
emat
Mo
de
(Lak
h)
Per
cen
t
of
Dem
at
Del
iver
ed
Qu
anti
ty t
o
To
tal
Del
iv-
ered
Qu
an-
tity
Del
iver
ed
Val
ue
in
Dem
at
Mo
de
(` c
rore
)
Per
cen
t
of
Dem
at
Del
iver
ed
Val
ue
to
To
tal
Del
iv-
ered
Val
ue
Sh
ort
Del
iver
y
(Au
ctio
ned
qu
anti
ty)
(Lak
h)
Per
cen
t
of
Sh
ort
Del
iv-
ery
to
Del
iver
y
Qu
anti
ty
Fu
nd
s
Pay
-in
(` c
rore
)
Sec
uri
ties
Pay
-in
(` c
rore
)
Set
tle-
men
t
Gu
ar-
ante
e
Fu
nd
(` c
rore
)
2014
-15
34,9
6144
,44,
676
12,1
9,59
427
.482
,14,
629
24,2
2,73
729
.512
,18,
107
100
24,1
7,16
199
.81,
678
0.1
6,94
,577
24,2
2,73
712
5
2015
-16$
4,48
94,
89,9
0814
7,97
830
.210
,68,
680
3,41
,242
31.9
147,
553
99.7
3,40
,962
99.9
423
0.9
117,
999
3,41
,242
149
Apr
-15
1,48
91,
60,3
1249
,683
31.0
3,67
,382
1,23
,383
33.6
49,5
7410
01,
23,3
1210
011
00.
247
,298
1,23
,383
125
May
-15
1,43
01,
47,9
6945
,494
30.7
3,33
,999
1,02
,359
30.6
45,2
6810
01,
02,2
5710
0.0
226
0.5
35,1
901,
02,3
5912
9
Jun-
151,
570
1,81
,627
52,8
0029
.13,
67,2
991,
15,5
0131
.452
,712
100
1,15
,394
100.
087
0.2
35,5
101,
15,5
0114
9
No
te:
Fro
m D
ecem
ber
201
4 o
nw
ard
s, c
ore
SG
F f
igu
res
hav
e b
een
rep
ort
ed.
$ in
dic
ates
as
on
Ju
ne
30,
2015
.
So
urc
e: N
SE
.
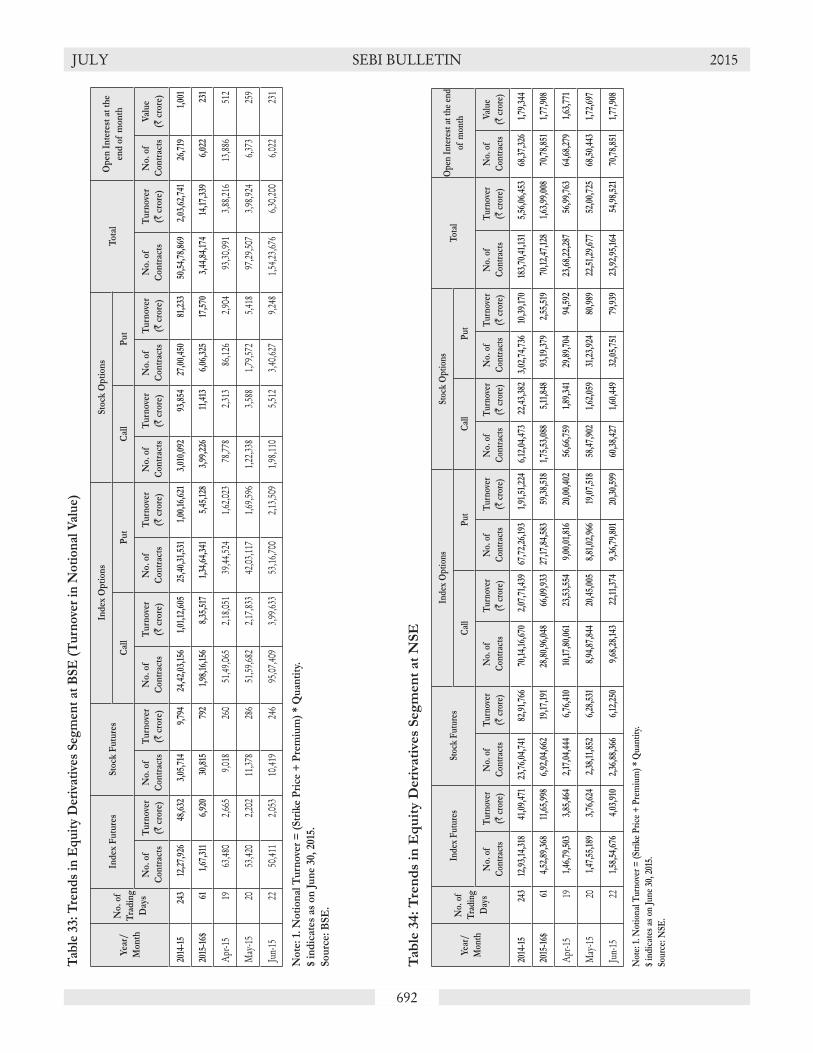
692
JULY SEBI BULLETIN 2015T
able
33:
Tre
nd
s in
Eq
uit
y D
eriv
ativ
es S
egm
ent
at B
SE
(T
urn
ove
r in
No
tio
nal
Val
ue)
Yea
r/
Mon
th
No.
of
Tra
din
g
Day
s
Ind
ex F
utu
res
Stoc
k F
utu
res
Ind
ex O
pti
ons
Stoc
k O
pti
ons
Tot
alO
pen
In
tere
st a
t th
e
end
of
mon
thC
all
Pu
tC
all
Pu
t
No.
of
Con
trac
ts
Tu
rnov
er
(` c
rore
)
No.
of
Con
trac
ts
Tu
rnov
er
(` c
rore
)
No.
of
Con
trac
ts
Tu
rnov
er
(` c
rore
)
No.
of
Con
trac
ts
Tu
rnov
er
(` c
rore
)
No.
of
Con
trac
ts
Tu
rnov
er
(` c
rore
)
No.
of
Con
trac
ts
Tu
rnov
er
(` c
rore
)
No.
of
Con
trac
ts
Tu
rnov
er
(` c
rore
)
No.
of
Con
trac
ts
Val
ue
(` c
rore
)
2014
-15
243
12,2
7,92
648
,632
3,05
,714
9,79
424
,42,
03,1
561,
01,1
2,60
525
,40,
31,5
311,
00,1
6,62
13,
010,
092
93,8
5427
,00,
450
81,2
3350
,54,
78,8
692,
03,6
2,74
126
,719
1,00
1
2015
-16$
611,
67,3
116,
920
30,8
1579
21,
98,1
6,15
68,
35,5
171,
34,6
4,34
15,
45,1
283,
99,2
2611
,413
6,06
,325
17,5
703,
44,8
4,17
414
,17,
339
6,02
223
1
Apr-1
519
63,48
02,6
659,0
1826
051
,49,06
52,1
8,051
39,44
,524
1,62,0
2378
,778
2,313
86,12
62,9
0493
,30,99
13,8
8,216
13,88
651
2
May
-1520
53,42
02,2
0211
,378
286
51,59
,682
2,17,8
3342
,03,11
71,6
9,596
1,22,3
383,5
881,7
9,572
5,418
97,29
,507
3,98,9
246,3
7325
9
Jun-
1522
50,41
12,0
5310
,419
246
95,07
,409
3,99,6
3353
,16,70
02,1
3,509
1,98,1
105,5
123,4
0,627
9,248
1,54,2
3,676
6,30,2
006,0
2223
1
No
te:
1. N
oti
on
al T
urn
ove
r =
(S
trik
e P
rice
+ P
rem
ium
) *
Qu
anti
ty.
$ in
dic
ates
as
on
Ju
ne
30,
2015
.
So
urc
e: B
SE
.
Tab
le 3
4:
Tre
nd
s in
Eq
uit
y D
eri
vati
ves
Seg
men
t at
NS
E
Yea
r/
Mon
th
No.
of
Tra
ding
Day
s
Inde
x F
utur
esSt
ock
Fut
ures
Inde
x O
ptio
nsSt
ock
Opt
ions
Tot
alO
pen
Inte
rest
at t
he e
nd
of m
onth
Cal
lP
utC
all
Put
No.
of
Con
trac
ts
Tur
nove
r
(` c
rore
)
No.
of
Con
trac
ts
Tur
nove
r
(` c
rore
)
No.
of
Con
trac
ts
Tur
nove
r
(` c
rore
)
No.
of
Con
trac
ts
Tur
nove
r
(` c
rore
)
No.
of
Con
trac
ts
Tur
nove
r
(` c
rore
)
No.
of
Con
trac
ts
Tur
nove
r
(` c
rore
)
No.
of
Con
trac
ts
Tur
nove
r
(` c
rore
)
No.
of
Con
trac
ts
Val
ue
(` c
rore
)
2014
-15
243
12,9
3,14
,318
41,0
9,47
123
,76,
04,7
4182
,91,
766
70,1
4,16
,670
2,07
,71,
439
67,7
2,26
,193
1,91
,51,
224
6,12
,04,
473
22,4
3,38
23,
02,7
4,73
610
,39,
170
183,
70,4
1,13
15,
56,0
6,45
368
,37,
326
1,79
,344
2015
-16$
614,
52,8
9,36
811
,65,
998
6,92
,04,
662
19,1
7,19
128
,80,
96,0
4866
,09,
933
27,1
7,84
,583
59,3
8,51
81,
75,5
3,08
85,
11,8
4893
,19,
379
2,55
,519
70,1
2,47
,128
1,63
,99,
008
70,7
8,85
11,
77,9
08
Apr-1
519
1,46
,79,
503
3,85
,464
2,17
,04,
444
6,76
,410
10,1
7,80
,061
23,5
3,55
49,
00,0
1,81
620
,00,
402
56,6
6,75
91,
89,3
4129
,89,
704
94,5
9223
,68,
22,2
8756
,99,
763
64,6
8,27
91,
63,7
71
May
-1520
1,47
,55,
189
3,76
,624
2,38
,11,
852
6,28
,531
8,94
,87,
844
20,4
5,00
58,
81,0
2,96
619
,07,
518
58,4
7,90
21,
62,0
5931
,23,
924
80,9
8922
,51,
29,6
7752
,00,
725
68,5
0,44
31,
72,6
97
Jun-
1522
1,58
,54,
676
4,03
,910
2,36
,88,
366
6,12
,250
9,68
,28,
143
22,1
1,37
49,
36,7
9,80
120
,30,
599
60,3
8,42
71,
60,4
4932
,05,
751
79,9
3923
,92,
95,1
6454
,98,
521
70,7
8,85
11,
77,9
08
Not
e: 1
. Not
iona
l Tur
nove
r =
(St
rike
Pri
ce +
Pre
miu
m)
* Q
uant
ity.
$ in
dica
tes
as o
n Ju
ne 3
0, 2
015.
Sour
ce: N
SE.
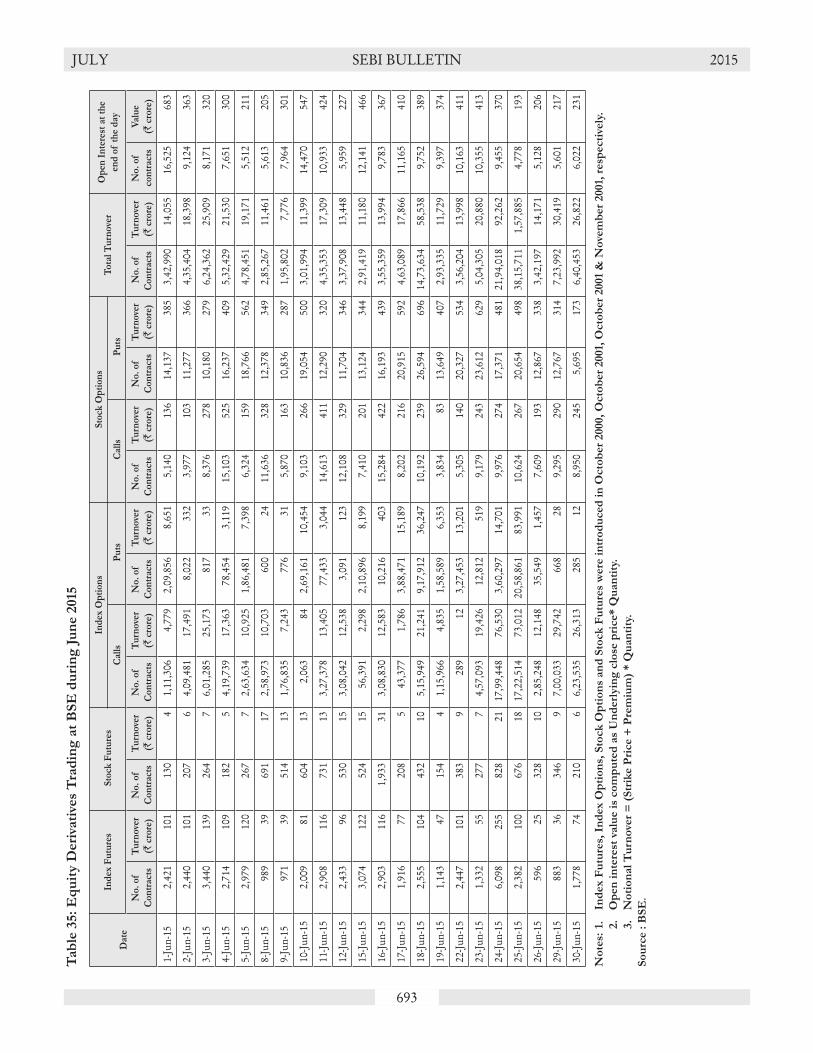
693
JULY SEBI BULLETIN 2015T
ab
le 3
5:
Eq
uit
y D
eri
vati
ves
Tra
din
g a
t B
SE
du
rin
g J
un
e 2
015
Dat
e
Ind
ex F
utu
res
Sto
ck F
utu
res
Ind
ex O
pti
on
sS
tock
Op
tio
ns
To
tal
Tu
rno
ver
Op
en I
nte
rest
at
the
end
of
the
day
Cal
ls P
uts
Cal
ls P
uts
No
. o
f
Co
ntr
acts
Tu
rno
ver
(` c
rore
)
No
. o
f
Co
ntr
acts
Tu
rno
ver
(` c
rore
)
No
. o
f
Co
ntr
acts
Tu
rno
ver
(` c
rore
)
No
. o
f
Co
ntr
acts
Tu
rno
ver
(` c
rore
)
No
. o
f
Co
ntr
acts
Tu
rno
ver
(` c
rore
)
No
. o
f
Co
ntr
acts
Tu
rno
ver
(` c
rore
)
No
. o
f
Co
ntr
acts
Tu
rno
ver
(` c
rore
)
No
. o
f
con
trac
ts
Val
ue
(` c
rore
)
1-Ju
n-15
2,42
110
113
04
1,11
,306
4,77
92,
09,8
568,
651
5,14
013
614
,137
385
3,42
,990
14,0
5516
,525
683
2-Ju
n-15
2,44
010
120
76
4,09
,481
17,4
918,
022
332
3,97
710
311
,277
366
4,35
,404
18,3
989,
124
363
3-Ju
n-15
3,44
013
926
47
6,01
,285
25,1
7381
733
8,37
627
810
,180
279
6,24
,362
25,9
098,
171
320
4-Ju
n-15
2,71
410
918
25
4,19
,739
17,3
6378
,454
3,11
915
,103
525
16,2
3740
95,
32,4
2921
,530
7,65
130
0
5-Ju
n-15
2,97
912
026
77
2,63
,634
10,9
251,
86,4
817,
398
6,32
415
918
,766
562
4,78
,451
19,1
715,
512
211
8-Ju
n-15
989
3969
117
2,58
,973
10,7
0360
024
11,6
3632
812
,378
349
2,85
,267
11,4
615,
613
205
9-Ju
n-15
971
3951
413
1,76
,835
7,24
377
631
5,87
016
310
,836
287
1,95
,802
7,77
67,
964
301
10-Ju
n-15
2,00
981
604
132,
063
842,
69,1
6110
,454
9,10
326
619
,054
500
3,01
,994
11,3
9914
,470
547
11-Ju
n-15
2,90
811
673
113
3,27
,378
13,4
0577
,433
3,04
414
,613
411
12,2
9032
04,
35,3
5317
,309
10,9
3342
4
12-Ju
n-15
2,43
396
530
153,
08,0
4212
,538
3,09
112
312
,108
329
11,7
0434
63,
37,9
0813
,448
5,95
922
7
15-Ju
n-15
3,07
412
252
415
56,3
912,
298
2,10
,896
8,19
97,
410
201
13,1
2434
42,
91,4
1911
,180
12,1
4146
6
16-Ju
n-15
2,90
311
61,
933
313,
08,8
3012
,583
10,2
1640
315
,284
422
16,1
9343
93,
55,3
5913
,994
9,78
336
7
17-Ju
n-15
1,91
677
208
543
,377
1,78
63,
88,4
7115
,189
8,20
221
620
,915
592
4,63
,089
17,8
6611
,165
410
18-Ju
n-15
2,55
510
443
210
5,15
,949
21,2
419,
17,9
1236
,247
10,1
9223
926
,594
696
14,7
3,63
458
,538
9,75
238
9
19-Ju
n-15
1,14
347
154
41,
15,9
664,
835
1,58
,589
6,35
33,
834
8313
,649
407
2,93
,335
11,7
299,
397
374
22-Ju
n-15
2,44
710
138
39
289
123,
27,4
5313
,201
5,30
514
020
,327
534
3,56
,204
13,9
9810
,163
411
23-Ju
n-15
1,33
255
277
74,
57,0
9319
,426
12,8
1251
99,
179
243
23,6
1262
95,
04,3
0520
,880
10,3
5541
3
24-Ju
n-15
6,09
825
582
821
17,9
9,44
876
,530
3,60
,297
14,7
019,
976
274
17,3
7148
121
,94,
018
92,2
629,
455
370
25-Ju
n-15
2,38
210
067
618
17,2
2,51
473
,012
20,5
8,86
183
,991
10,6
2426
720
,654
498
38,1
5,71
11,
57,8
854,
778
193
26-Ju
n-15
596
2532
810
2,85
,248
12,1
4835
,549
1,45
77,
609
193
12,8
6733
83,
42,1
9714
,171
5,12
820
6
29-Ju
n-15
883
3634
69
7,00
,033
29,7
4266
828
9,29
529
012
,767
314
7,23
,992
30,4
195,
601
217
30-Ju
n-15
1,77
874
210
66,
23,5
3526
,313
285
128,
950
245
5,69
517
36,
40,4
5326
,822
6,02
223
1
No
tes:
1.
In
dex F
utu
res,
In
dex O
pti
on
s, S
tock
Op
tio
ns
an
d S
tock
Fu
ture
s w
ere
in
tro
du
ced
in
Octo
ber
2000,
Octo
ber
2001,
Octo
ber
2001
& N
ove
mb
er
2001,
resp
ecti
vely
.
2.
O
pen
in
tere
st v
alu
e i
s co
mp
ute
d a
s U
nd
erl
yin
g c
lose
pri
ce* Q
uan
tity
.
3.
N
oti
on
al
Tu
rno
ver
= (
Str
ike P
rice +
Pre
miu
m)
* Q
uan
tity
.
So
urc
e :
BS
E.

694
JULY SEBI BULLETIN 2015T
ab
le 3
6:
Eq
uit
y D
eri
vati
ves
Tra
din
g a
t N
SE
du
rin
g J
un
e 2
015
Dat
e
Ind
ex F
utu
res
Sto
ck F
utu
res
Ind
ex O
pti
on
sS
tock
Op
tio
ns
To
tal
Tu
rno
ver
Op
en I
nte
rest
at
the
end
of
the
day
Cal
ls P
uts
Cal
ls P
uts
No
. o
f
Co
ntr
acts
Tu
rno
ver
(` c
rore
)
No
. o
f
Co
ntr
acts
Tu
rno
ver
(` c
rore
)
No
. o
f
Co
ntr
acts
Tu
rno
ver
(`
cro
re)
No
. o
f
Co
ntr
acts
Tu
rno
ver
(`
cro
re)
No
. o
f
Co
ntr
acts
Tu
rno
ver
(` c
rore
)
No
. o
f
Co
ntr
acts
Tu
rno
ver
(`
cro
re)
No
. o
f
Co
ntr
acts
Tu
rno
ver
(`
cro
re)
No
. o
f
con
trac
ts
Val
ue
(` c
rore
)
1-Ju
n-15
4,11
,226
11,1
238,
32,3
4822
,968
19,4
6,06
246
,112
16,2
9,43
135
,662
2,52
,063
7,24
21,
27,9
473,
383
51,9
9,07
71,
26,4
8871
,28,
138
1,79
,380
2-Ju
n-15
10,7
4,48
927
,827
10,0
7,35
427
,361
52,9
5,89
01,
24,4
7444
,37,
502
97,2
263,
90,1
8511
,620
1,88
,695
5,15
11,
23,9
4,11
52,
93,6
6076
,07,
377
1,85
,688
3-Ju
n-15
7,15
,807
18,4
8811
,12,
219
25,6
9941
,03,
458
93,9
7935
,04,
412
75,5
143,
27,2
507,
976
2,02
,800
4,57
799
,65,
946
2,26
,233
78,6
0,48
31,
89,0
864-
Jun-
156,
53,0
6617
,074
8,63
,519
21,8
2434
,64,
911
79,3
2329
,74,
433
63,6
822,
43,9
916,
108
1,32
,950
3,08
283
,32,
870
1,91
,093
80,6
1,15
11,
93,7
705-
Jun-
156,
88,2
0017
,130
7,80
,819
19,7
7335
,07,
870
79,4
0930
,71,
625
65,0
012,
29,0
285,
924
1,22
,902
2,90
784
,00,
444
1,90
,144
82,2
1,91
21,
97,1
958-
Jun-
155,
08,4
8212
,839
6,95
,204
16,6
0131
,94,
462
72,5
8425
,24,
382
53,6
362,
21,9
465,
389
1,22
,893
2,68
772
,67,
369
1,63
,736
84,2
5,27
31,
99,7
369-
Jun-
155,
11,3
1512
,848
7,48
,514
18,6
4534
,54,
590
77,1
6425
,23,
697
53,1
672,
18,1
775,
575
1,20
,925
2,83
975
,77,
218
1,70
,238
86,6
4,12
72,
04,4
2110
-Jun-
156,
58,4
8316
,277
7,34
,186
18,7
7033
,64,
472
75,5
1333
,52,
775
70,0
112,
17,0
865,
653
1,12
,945
2,68
484
,39,
947
1,88
,907
86,6
2,48
92,
06,7
7611
-Jun-
159,
05,5
8922
,336
9,08
,902
23,2
1457
,81,
086
1,28
,169
45,1
2,12
495
,084
2,83
,692
7,43
41,
58,8
573,
812
1,25
,50,
250
2,80
,050
90,1
8,84
12,
10,1
2912
-Jun-
155,
86,5
2615
,375
7,38
,715
18,5
7840
,10,
520
89,8
4529
,34,
147
62,4
942,
47,5
626,
319
1,56
,092
3,65
886
,73,
562
1,96
,271
91,9
4,09
92,
14,8
7515
-Jun-
156,
48,8
4115
,953
7,39
,773
18,4
7743
,32,
241
95,1
0635
,56,
619
73,9
792,
36,0
735,
951
1,29
,263
3,09
196
,42,
810
2,12
,556
91,9
4,69
52,
15,9
8716
-Jun-
155,
96,2
5814
,887
7,42
,452
18,8
4242
,45,
147
93,7
5535
,06,
463
73,7
192,
27,1
696,
022
1,24
,540
3,14
594
,42,
029
2,10
,369
92,3
2,05
82,
18,3
8417
-Jun-
157,
03,4
1216
,929
9,60
,814
24,8
9447
,63,
335
1,05
,245
45,8
0,12
195
,365
3,13
,107
8,17
11,
60,8
913,
995
1,14
,81,
680
2,54
,598
93,9
1,75
22,
23,1
1118
-Jun-
157,
69,0
1118
,666
10,0
7,55
025
,843
46,5
8,16
71,
03,7
6554
,54,
174
1,15
,299
3,47
,082
9,12
41,
77,0
464,
529
1,24
,13,
030
2,77
,226
95,9
4,27
82,
29,8
3819
-Jun-
156,
23,9
4215
,583
11,0
2,07
829
,263
42,5
4,63
195
,455
53,5
3,10
01,
14,7
183,
20,5
678,
716
1,77
,325
4,70
41,
18,3
1,64
32,
68,4
3997
,41,
387
2,34
,631
22-Ju
n-15
9,11
,602
23,7
1018
,14,
682
47,0
0262
,62,
723
1,46
,266
69,1
1,15
91,
54,1
543,
66,7
259,
674
1,80
,007
4,60
81,
64,4
6,89
83,
85,4
1499
,63,
142
2,44
,637
23-Ju
n-15
7,91
,657
20,9
2020
,24,
375
53,7
3867
,15,
035
1,55
,590
69,7
6,64
71,
55,6
443,
37,6
479,
020
1,54
,761
4,03
11,
70,0
0,12
23,
98,9
441,
01,7
9,89
92,
50,6
7424
-Jun-
158,
99,4
5223
,070
20,8
5,84
954
,388
65,1
7,29
41,
51,4
8779
,27,
066
1,78
,493
3,11
,923
8,39
51,
60,1
634,
158
1,79
,01,
747
4,19
,991
1,02
,14,
636
2,50
,501
25-Ju
n-15
11,3
1,91
929
,003
23,7
7,51
961
,630
87,6
9,95
02,
08,8
1298
,37,
028
2,24
,007
3,34
,004
9,02
91,
95,7
805,
140
2,26
,46,
200
5,37
,621
59,3
7,09
71,
52,2
8426
-Jun-
156,
05,6
0916
,158
8,15
,203
21,6
5722
,26,
200
52,1
9421
,59,
570
46,7
312,
07,7
615,
744
98,0
182,
521
61,1
2,36
11,
45,0
0563
,49,
243
1,61
,500
29-Ju
n-15
8,70
,590
22,0
538,
41,1
6522
,414
35,3
2,08
780
,745
36,6
7,47
977
,972
2,15
,586
5,96
71,
17,6
603,
024
92,4
4,56
72,
12,1
7467
,60,
311
1,69
,239
30-Ju
n-15
5,89
,200
15,6
617,
55,1
2620
,671
24,2
8,01
256
,382
22,8
5,84
749
,040
1,89
,803
5,39
683
,291
2,21
263
,31,
279
1,49
,362
70,7
8,85
11,
77,9
08
No
tes:
1.
In
dex
Fu
ture
s, I
nd
ex O
pti
on
s, S
tock
Op
tio
ns
and
Sto
ck F
utu
res
wer
e in
tro
du
ced
in
Sep
tem
ber
200
0, S
epte
mb
er 2
001,
Sep
tem
ber
200
1 an
d N
ove
mb
er 2
001,
res
pec
tive
ly.
2.
O
pen
in
tere
st v
alu
e is
co
mp
ute
d a
s U
nd
erly
ing
clo
se p
rice
*Qu
anti
ty.
3.
N
oti
on
al V
alu
e o
f O
uts
tan
din
g C
on
trac
ts f
or
OP
TS
TK
- O
pen
In
tere
st *
Clo
se p
rice
of
Un
der
lyin
g s
ecu
rity
.
4.
N
oti
on
al V
alu
e o
f O
uts
tan
din
g C
on
trac
ts f
or
OP
TID
X -
Op
en I
nte
rest
* C
lose
pri
ce C
NX
Nif
ty.
5. N
oti
on
al T
urn
ove
r =
(S
trik
e P
rice
+ P
rem
ium
) *
Qu
anti
ty.
So
urc
e :
NS
E.
Tab
le 3
7:
Sett
lem
en
t S
tati
stic
s in
Eq
uit
y D
eri
vati
ves
Seg
men
t at
BS
E a
nd
NS
E (`
cro
re)
Year/
Mo
nth
BS
EN
SE
Ind
ex/
Sto
ck
Fu
ture
sIn
dex
/S
tock
Op
tio
ns
To
tal
Sett
lem
en
t
Gu
ran
tee
Fu
nd
Ind
ex/
Sto
ck
Fu
ture
sIn
dex/
Sto
ck
Op
tio
ns
To
tal
Sett
lem
en
t
Gu
ran
tee
Fu
nd
MT
M
Sett
lem
en
t
Fin
al
Sett
lem
en
t
Pre
miu
m
Sett
lem
en
t
Exerc
ise
Sett
lem
en
t
MT
M
Sett
lem
en
t
Fin
al
Sett
lem
en
t
Pre
miu
m
Sett
lem
en
t
Exerc
ise
Sett
lem
en
t
2014
-15
897
21
36,3
01
49
37,2
68
365
75,7
66
1,754
15,2
99
2,8
35
95,6
54
489
2015
-16$
213
53,8
73
34,0
94
1521,
240
307
3,5
84
778
25,9
08
542
Apr
-15
842
959
11,
046
146,
451
146
1,08
916
17,
847
514
May
-15
902
1,47
00
1,56
214
7,85
393
1,07
199
9,11
651
7Ju
n-15
391
1,44
42
1,48
515
6,93
568
1,42
451
88,
945
542
No
te:
Fro
m D
ecem
ber
2014
on
ward
s, c
ore
SG
F f
igu
res
have
been
rep
ort
ed
.
$ i
nd
icate
s as
on
Ju
ne 3
0,
2015
.
So
urc
e:
BS
E a
nd
NS
E
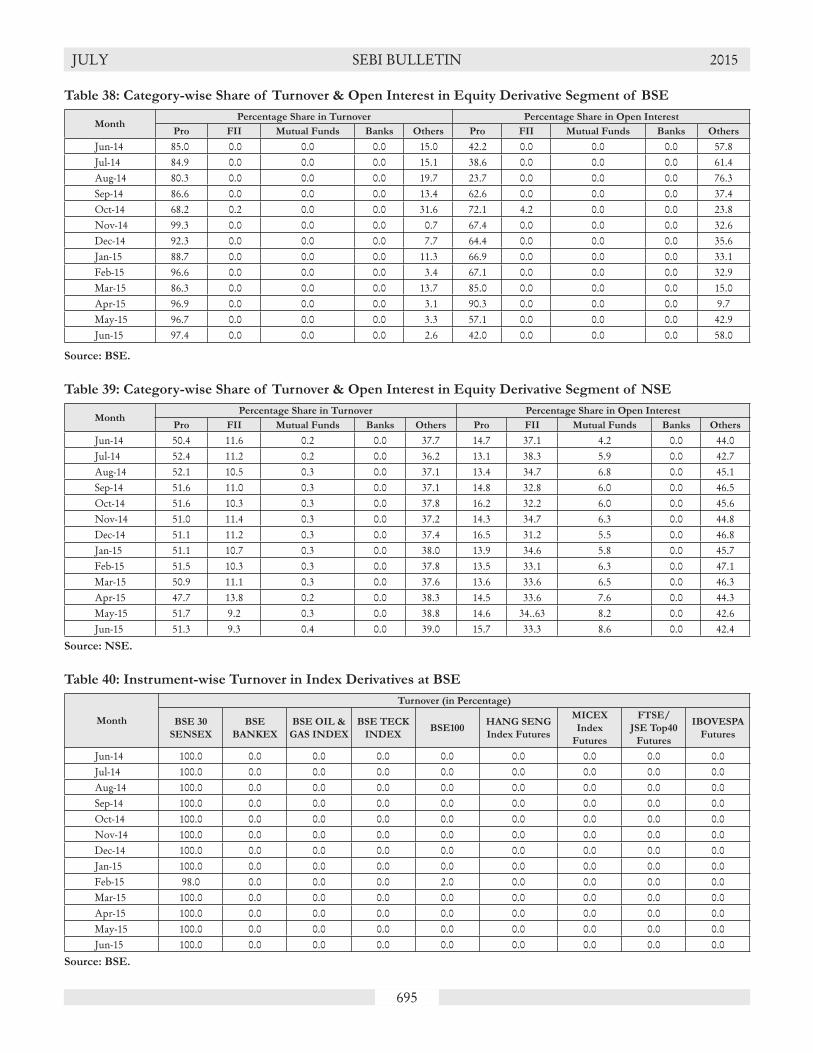
695
JULY SEBI BULLETIN 2015
Table 38: Category-wise Share of Turnover & Open Interest in Equity Derivative Segment of BSE
MonthPercentage Share in Turnover Percentage Share in Open Interest
Pro FII Mutual Funds Banks Others Pro FII Mutual Funds Banks Others
Jun-14 85.0 0.0 0.0 0.0 15.0 42.2 0.0 0.0 0.0 57.8Jul-14 84.9 0.0 0.0 0.0 15.1 38.6 0.0 0.0 0.0 61.4Aug-14 80.3 0.0 0.0 0.0 19.7 23.7 0.0 0.0 0.0 76.3Sep-14 86.6 0.0 0.0 0.0 13.4 62.6 0.0 0.0 0.0 37.4Oct-14 68.2 0.2 0.0 0.0 31.6 72.1 4.2 0.0 0.0 23.8Nov-14 99.3 0.0 0.0 0.0 0.7 67.4 0.0 0.0 0.0 32.6Dec-14 92.3 0.0 0.0 0.0 7.7 64.4 0.0 0.0 0.0 35.6Jan-15 88.7 0.0 0.0 0.0 11.3 66.9 0.0 0.0 0.0 33.1Feb-15 96.6 0.0 0.0 0.0 3.4 67.1 0.0 0.0 0.0 32.9Mar-15 86.3 0.0 0.0 0.0 13.7 85.0 0.0 0.0 0.0 15.0Apr-15 96.9 0.0 0.0 0.0 3.1 90.3 0.0 0.0 0.0 9.7May-15 96.7 0.0 0.0 0.0 3.3 57.1 0.0 0.0 0.0 42.9Jun-15 97.4 0.0 0.0 0.0 2.6 42.0 0.0 0.0 0.0 58.0
Source: BSE.
Table 39: Category-wise Share of Turnover & Open Interest in Equity Derivative Segment of NSE
MonthPercentage Share in Turnover Percentage Share in Open Interest
Pro FII Mutual Funds Banks Others Pro FII Mutual Funds Banks Others
Jun-14 50.4 11.6 0.2 0.0 37.7 14.7 37.1 4.2 0.0 44.0Jul-14 52.4 11.2 0.2 0.0 36.2 13.1 38.3 5.9 0.0 42.7Aug-14 52.1 10.5 0.3 0.0 37.1 13.4 34.7 6.8 0.0 45.1Sep-14 51.6 11.0 0.3 0.0 37.1 14.8 32.8 6.0 0.0 46.5Oct-14 51.6 10.3 0.3 0.0 37.8 16.2 32.2 6.0 0.0 45.6Nov-14 51.0 11.4 0.3 0.0 37.2 14.3 34.7 6.3 0.0 44.8Dec-14 51.1 11.2 0.3 0.0 37.4 16.5 31.2 5.5 0.0 46.8Jan-15 51.1 10.7 0.3 0.0 38.0 13.9 34.6 5.8 0.0 45.7Feb-15 51.5 10.3 0.3 0.0 37.8 13.5 33.1 6.3 0.0 47.1Mar-15 50.9 11.1 0.3 0.0 37.6 13.6 33.6 6.5 0.0 46.3Apr-15 47.7 13.8 0.2 0.0 38.3 14.5 33.6 7.6 0.0 44.3May-15 51.7 9.2 0.3 0.0 38.8 14.6 34..63 8.2 0.0 42.6Jun-15 51.3 9.3 0.4 0.0 39.0 15.7 33.3 8.6 0.0 42.4
Source: NSE.
Table 40: Instrument-wise Turnover in Index Derivatives at BSE
Month
Turnover (in Percentage)
BSE 30
SENSEX
BSE
BANKEX
BSE OIL &
GAS INDEX
BSE TECK
INDEXBSE100
HANG SENG
Index Futures
MICEX
Index
Futures
FTSE/
JSE Top40
Futures
IBOVESPA
Futures
Jun-14 100.0 0.0 0.0 0.0 0.0 0.0 0.0 0.0 0.0Jul-14 100.0 0.0 0.0 0.0 0.0 0.0 0.0 0.0 0.0Aug-14 100.0 0.0 0.0 0.0 0.0 0.0 0.0 0.0 0.0Sep-14 100.0 0.0 0.0 0.0 0.0 0.0 0.0 0.0 0.0Oct-14 100.0 0.0 0.0 0.0 0.0 0.0 0.0 0.0 0.0Nov-14 100.0 0.0 0.0 0.0 0.0 0.0 0.0 0.0 0.0Dec-14 100.0 0.0 0.0 0.0 0.0 0.0 0.0 0.0 0.0Jan-15 100.0 0.0 0.0 0.0 0.0 0.0 0.0 0.0 0.0Feb-15 98.0 0.0 0.0 0.0 2.0 0.0 0.0 0.0 0.0Mar-15 100.0 0.0 0.0 0.0 0.0 0.0 0.0 0.0 0.0Apr-15 100.0 0.0 0.0 0.0 0.0 0.0 0.0 0.0 0.0May-15 100.0 0.0 0.0 0.0 0.0 0.0 0.0 0.0 0.0Jun-15 100.0 0.0 0.0 0.0 0.0 0.0 0.0 0.0 0.0
Source: BSE.

696
JULY SEBI BULLETIN 2015T
ab
le 4
1: I
nst
rum
en
twis
e T
urn
ove
r in
In
dex D
eri
vati
ves
at
NS
E
Mo
nth
Tu
rno
ver
(in
Perc
en
tag
e)
NIF
TY
CN
XIT
BA
NK
NIF
TY
NF
TY
MC
AP
50
CN
XP
SE
CN
XIN
FR
AF
TS
E10
0S
&P
500
DJI
AIn
dia
VIX
Jun-
1491
.00.
08.
90.
00.
00.
00.
00.
00.
00.
0Ju
l-14
90.5
0.0
9.4
0.0
0.0
0.0
0.0
0.0
0.0
0.0
Aug
-14
88.6
0.0
11.4
0.0
0.0
0.0
0.0
0.0
0.0
0.0
Sep-
1489
.10.
010
.90.
00.
00.
00.
00.
00.
00.
0O
ct-1
486
.30.
013
.60.
00.
00.
00.
00.
00.
00.
0N
ov-1
484
.80.
015
.20.
00.
00.
00.
00.
00.
00.
0D
ec-1
485
.20.
014
.70.
00.
00.
00.
00.
00.
00.
0Ja
n-15
86.6
0.0
13.4
0.0
0.0
0.0
0.0
0.0
0.0
0.0
Feb-
1584
.20.
015
.80.
00.
00.
00.
00.
00.
00.
0M
ar-1
583
.90.
016
.10.
00.
00.
00.
00.
00.
00.
0A
pr-1
586
.80.
013
.10.
00.
00.
00.
00.
00.
00.
0M
ay-1
586
.70.
013
.30.
00.
00.
00.
00.
00.
00.
0Ju
n-15
85.2
0.0
14.8
0.0
0.0
0.0
0.0
0.0
0.0
0.0
So
urc
e:
NS
E.
Tab
le 4
2:
Tre
nd
s in
Cu
rren
cy D
eri
vati
ves
Seg
men
t at
NS
E
Year/
Mo
nth
No
. o
f
Tra
din
g D
ays
Cu
rren
cy F
utu
res
Cu
rren
cy O
pti
on
sT
ota
l
No
. o
f
Co
ntr
acts
Tu
rno
ver
(` c
rore
)
Call
Pu
tN
o.
of
Co
ntr
acts
Tu
rno
ver
(` c
rore
)
Op
en
In
tere
st a
t th
e e
nd
of
No
. o
f
Co
ntr
acts
Tu
rno
ver
(` c
rore
)
No
. o
f
Co
ntr
acts
Tu
rno
ver
(` c
rore
)
No
. o
f
Co
ntr
acts
Valu
e
(` c
rore
)
2014
-15
238
35,5
5,8
8,9
63
22,4
7,9
92
7,1
8,5
6,4
44
4,4
8,3
03
5,3
2,1
9,2
87
3,2
7,6
1248,0
6,6
4,6
94
30,2
3,9
08
32,8
6,5
90
20,7
93
2015
-16$
59
9,6
8,1
3,1
60
6,3
0,7
33
2,8
7,0
3,3
57
1,84,8
87
1,80,8
3,6
78
1,15
,040
14,3
6,0
0,1
95
9,3
0,6
59
31,
03,4
1920,1
27
Apr
-15
183,
10,5
5,90
62,
00,1
8789
,39,
607
56,9
5665
,81,
903
41,4
764,
65,7
7,41
62,
98,6
1833
,77,
620
21,7
88M
ay-1
519
3,33
,32,
687
2,18
,201
93,8
3,50
660
,655
64,0
7,40
540
,924
4,91
,23,
598
3,19
,780
30,1
7,93
219
,525
Jun-
1522
3,24
,24,
567
2,12
,345
1,03
,80,
244
67,2
7650
,94,
370
32,6
404,
78,9
9,18
13,
12,2
6231
,03,
419
20,1
27N
ote
s: 1
. C
urr
en
cy O
pti
on
s w
ere
in
tro
du
cd
ed
at
NS
E w
.e.f
Octo
ber
29,
2010
.
2.
Tra
din
g V
alu
e :
- F
or
Fu
ture
s, V
alu
e o
f c
on
tract
= T
rad
ed
Qty
*T
rad
ed
Pri
ce.
3.
Fo
r O
pti
on
s, V
alu
e o
f c
on
tract
= T
rad
ed
Qty
*(S
trik
e P
rice+
Tra
ded
Pre
miu
m)
4.
Na:
No
t A
pp
licab
le$ i
nd
icate
s as
on
Ju
ne 3
0,
2015
.S
ou
rce:
NS
E.
Tab
le 4
3:
Tre
nd
s in
Cu
rren
cy D
eri
vati
ves
Seg
men
t at
MS
EI
Year/
Mo
nth
No
. o
f
Tra
din
g D
ays
Cu
rren
cy F
utu
res
Cu
rren
cy O
pti
on
sT
ota
lO
pen
In
tere
st a
t th
e e
nd
of
Call
Pu
t
No
. o
f
Co
ntr
acts
Tu
rno
ver
(` c
rore
)
No
. o
f
Co
ntr
acts
Tu
rno
ver
(` c
rore
)
No
. o
f
Co
ntr
acts
Tu
rno
ver
(` c
rore
)
No
. o
f
Co
ntr
acts
Tu
rno
ver
(` c
rore
)
No
. o
f
Co
ntr
acts
Valu
e
(` c
rore
)
2014
-15
238
10,0
1,05,4
146,3
1,641
16,3
8,7
39
10,1
46
13,2
4,1
90
8,1
39
10,3
0,6
8,3
43
6,4
9,9
25
3,6
1,16
02,2
92
2015
-16$
59
1,60,8
8,1
93
1,04,2
06
5,7
0,0
89
3,6
65
4,6
7,5
66
2,9
47
1,71,
25,8
48
1,10
,818
5,8
2,3
72
3,7
58
Apr
-15
1854
,73,
546
35,1
442,
77,1
701,
765
1,64
,321
1,01
959
,15,
037
37,9
284,
32,5
432,
783
May
-15
1951
,58,
356
33,5
801,
73,1
191,
123
1,58
,860
1,00
854
,90,
335
35,7
103,
59,0
682,
327
Jun-
1522
54,5
6,29
135
,483
1,19
,800
777
1,44
,385
920
57,2
0,47
637
,180
5,82
,372
3,75
8$ i
nd
icate
s as
on
Ju
ne 3
0,
2015
.
So
urc
e:
MS
EI
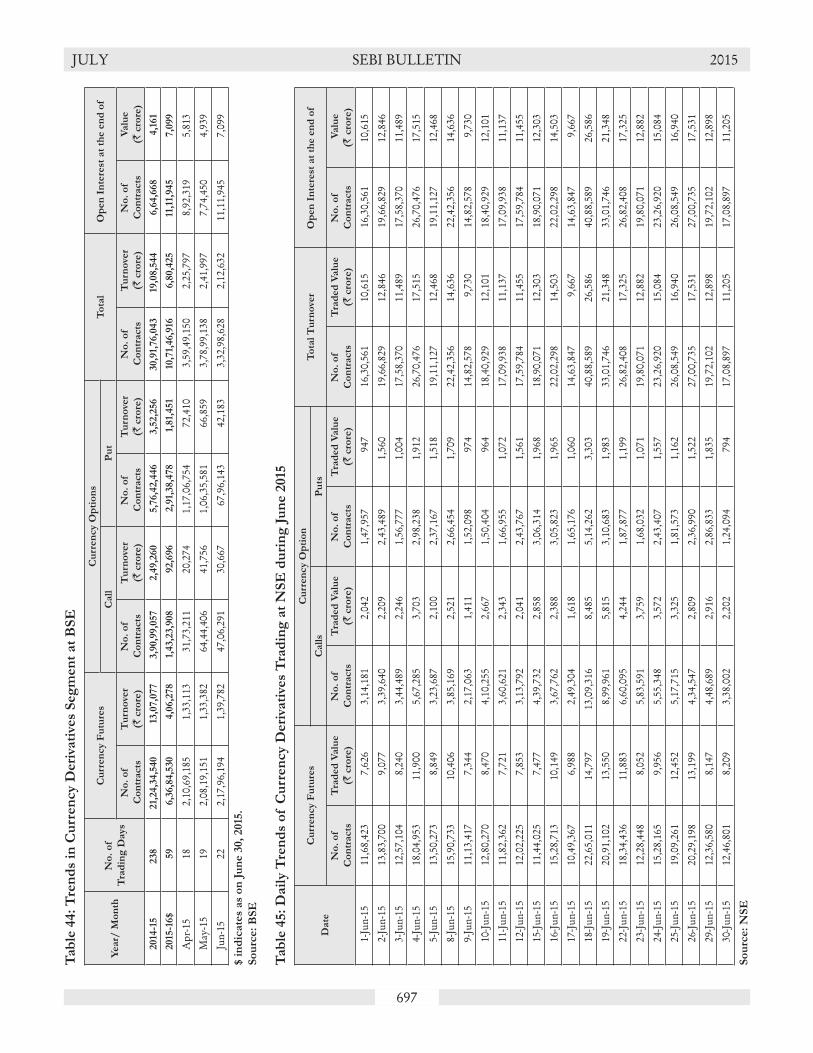
697
JULY SEBI BULLETIN 2015T
ab
le 4
4:
Tre
nd
s in
Cu
rren
cy D
eri
vati
ves
Seg
men
t at
BS
E
Year/
Mo
nth
No
. o
f
Tra
din
g D
ays
Cu
rren
cy F
utu
res
Cu
rren
cy O
pti
on
sT
ota
lO
pen
In
tere
st a
t th
e e
nd
of
Call
Pu
t
No
. o
f
Co
ntr
acts
Tu
rno
ver
(` c
rore
)
No
. o
f
Co
ntr
acts
Tu
rno
ver
(` c
rore
)
No
. o
f
Co
ntr
acts
Tu
rno
ver
(` c
rore
)
No
. o
f
Co
ntr
acts
Tu
rno
ver
(` c
rore
)
No
. o
f
Co
ntr
acts
Valu
e
(` c
rore
)
2014
-15
238
21,
24,3
4,5
40
13,0
7,0
77
3,9
0,9
9,0
57
2,4
9,2
60
5,7
6,4
2,4
46
3,5
2,2
56
30,9
1,76,0
43
19,0
8,5
44
6,6
4,6
68
4,1
61
2015
-16$
59
6,3
6,8
4,5
30
4,0
6,2
78
1,43,2
3,9
08
92,6
96
2,9
1,38,4
78
1,81,
451
10,7
1,46,9
166,8
0,4
25
11,1
1,945
7,0
99
Apr
-15
182,
10,6
9,18
51,
33,1
1331
,73,
211
20,2
741,
17,0
6,75
472
,410
3,59
,49,
150
2,25
,797
8,92
,319
5,81
3
May
-15
192,
08,1
9,15
11,
33,3
8264
,44,
406
41,7
561,
06,3
5,58
166
,859
3,78
,99,
138
2,41
,997
7,74
,450
4,93
9
Jun-
1522
2,17
,96,
194
1,39
,782
47,0
6,29
130
,667
67,9
6,14
342
,183
3,32
,98,
628
2,12
,632
11,1
1,94
57,
099
$ i
nd
icate
s as
on
Ju
ne 3
0,
2015
.
So
urc
e:
BS
E
Tab
le 4
5:
Dail
y T
ren
ds
of C
urr
en
cy D
eri
vati
ves
Tra
din
g a
t N
SE
du
rin
g J
un
e 2
015
Date
Cu
rren
cy F
utu
res
Cu
rren
cy O
pti
on
To
tal
Tu
rno
ver
Op
en
In
tere
st a
t th
e e
nd
of
Call
sP
uts
No
. o
f
Co
ntr
acts
Tra
ded
Valu
e
(` c
rore
)
No
. o
f
Co
ntr
acts
Tra
ded
Valu
e
(` c
rore
)
No
. o
f
Co
ntr
acts
Tra
ded
Valu
e
(` c
rore
)
No
. o
f
Co
ntr
acts
Tra
ded
Valu
e
(` c
rore
)
No
. o
f
Co
ntr
acts
Valu
e
(` c
rore
)
1-Ju
n-15
11,6
8,42
37,
626
3,14
,181
2,04
21,
47,9
5794
716
,30,
561
10,6
1516
,30,
561
10,6
15
2-Ju
n-15
13,8
3,70
09,
077
3,39
,640
2,20
92,
43,4
891,
560
19,6
6,82
912
,846
19,6
6,82
912
,846
3-Ju
n-15
12,5
7,10
48,
240
3,44
,489
2,24
61,
56,7
771,
004
17,5
8,37
011
,489
17,5
8,37
011
,489
4-Ju
n-15
18,0
4,95
311
,900
5,67
,285
3,70
32,
98,2
381,
912
26,7
0,47
617
,515
26,7
0,47
617
,515
5-Ju
n-15
13,5
0,27
38,
849
3,23
,687
2,10
02,
37,1
671,
518
19,1
1,12
712
,468
19,1
1,12
712
,468
8-Ju
n-15
15,9
0,73
310
,406
3,85
,169
2,52
12,
66,4
541,
709
22,4
2,35
614
,636
22,4
2,35
614
,636
9-Ju
n-15
11,1
3,41
77,
344
2,17
,063
1,41
11,
52,0
9897
414
,82,
578
9,73
014
,82,
578
9,73
0
10-Ju
n-15
12,8
0,27
08,
470
4,10
,255
2,66
71,
50,4
0496
418
,40,
929
12,1
0118
,40,
929
12,1
01
11-Ju
n-15
11,8
2,36
27,
721
3,60
,621
2,34
31,
66,9
551,
072
17,0
9,93
811
,137
17,0
9,93
811
,137
12-Ju
n-15
12,0
2,22
57,
853
3,13
,792
2,04
12,
43,7
671,
561
17,5
9,78
411
,455
17,5
9,78
411
,455
15-Ju
n-15
11,4
4,02
57,
477
4,39
,732
2,85
83,
06,3
141,
968
18,9
0,07
112
,303
18,9
0,07
112
,303
16-Ju
n-15
15,2
8,71
310
,149
3,67
,762
2,38
83,
05,8
231,
965
22,0
2,29
814
,503
22,0
2,29
814
,503
17-Ju
n-15
10,4
9,36
76,
988
2,49
,304
1,61
81,
65,1
761,
060
14,6
3,84
79,
667
14,6
3,84
79,
667
18-Ju
n-15
22,6
5,01
114
,797
13,0
9,31
68,
485
5,14
,262
3,30
340
,88,
589
26,5
8640
,88,
589
26,5
86
19-Ju
n-15
20,9
1,10
213
,550
8,99
,961
5,81
53,
10,6
831,
983
33,0
1,74
621
,348
33,0
1,74
621
,348
22-Ju
n-15
18,3
4,43
611
,883
6,60
,095
4,24
41,
87,8
771,
199
26,8
2,40
817
,325
26,8
2,40
817
,325
23-Ju
n-15
12,2
8,44
88,
052
5,83
,591
3,75
91,
68,0
321,
071
19,8
0,07
112
,882
19,8
0,07
112
,882
24-Ju
n-15
15,2
8,16
59,
956
5,55
,348
3,57
22,
43,4
071,
557
23,2
6,92
015
,084
23,2
6,92
015
,084
25-Ju
n-15
19,0
9,26
112
,452
5,17
,715
3,32
51,
81,5
731,
162
26,0
8,54
916
,940
26,0
8,54
916
,940
26-Ju
n-15
20,2
9,19
813
,199
4,34
,547
2,80
92,
36,9
901,
522
27,0
0,73
517
,531
27,0
0,73
517
,531
29-Ju
n-15
12,3
6,58
08,
147
4,48
,689
2,91
62,
86,8
331,
835
19,7
2,10
212
,898
19,7
2,10
212
,898
30-Ju
n-15
12,4
6,80
18,
209
3,38
,002
2,20
21,
24,0
9479
417
,08,
897
11,2
0517
,08,
897
11,2
05
So
urc
e:
NS
E

698
JULY SEBI BULLETIN 2015
Table 46: Daily Trends of Currency Derivatives Trading at MSEI during June 2015
Date
Currency FuturesCurrency Options
Total TurnoverOpen Interest at the end
of the dayCall Put
No. of
Contracts
Turnover
(` crore)
No. of
Contracts
Turnover
(` crore)
No. of
Contracts
Turnover
(` crore)
No. of
Contracts
Turnover
(` crore)
No. of
contracts
Value
(` crore)
1-Jun-15 2,03,423 1,313 2,839 18 15,951 99 2,22,213 1,431 3,92,851 2,5392-Jun-15 2,31,693 1,499 9,271 60 11,416 74 2,52,380 1,632 4,21,965 2,7303-Jun-15 2,59,776 1,690 14,911 97 11,996 78 2,86,683 1,865 4,82,216 3,1224-Jun-15 2,52,190 1,646 9,231 60 6,555 42 2,67,976 1,748 4,64,607 3,0135-Jun-15 2,61,398 1,696 4,451 29 4,521 29 2,70,370 1,754 4,84,593 3,1348-Jun-15 2,60,836 1,695 4,523 29 4,368 28 2,69,727 1,753 4,31,176 2,7989-Jun-15 1,51,529 998 5,216 34 15,253 96 1,71,998 1,128 4,44,098 2,87710-Jun-15 1,96,567 1,285 10,664 71 9,775 62 2,17,006 1,419 4,42,973 2,86511-Jun-15 1,60,402 1,041 1,803 12 1,668 11 1,63,873 1,064 4,49,550 2,91212-Jun-15 2,65,843 1,723 3,476 22 6,711 43 2,76,030 1,788 4,45,965 2,89415-Jun-15 1,51,254 991 2,823 18 7,857 50 1,61,934 1,059 4,44,393 2,88516-Jun-15 2,22,618 1,462 8,413 55 2,493 16 2,33,524 1,533 4,33,998 2,82617-Jun-15 1,61,114 1,061 5,692 37 2,928 19 1,69,734 1,117 4,21,775 2,74518-Jun-15 3,77,057 2,444 5,900 38 3,848 25 3,86,805 2,507 5,23,232 3,38419-Jun-15 2,82,938 1,830 3,364 22 1,878 12 2,88,180 1,863 5,61,344 3,61522-Jun-15 2,39,293 1,555 4,112 26 4,526 29 2,47,931 1,610 6,09,199 3,91723-Jun-15 2,57,969 1,672 1,884 12 1,853 12 2,61,706 1,696 6,15,243 3,95824-Jun-15 2,19,755 1,433 5,086 33 2,822 18 2,27,663 1,483 6,07,440 3,90825-Jun-15 4,62,958 2,988 1,156 7 2,365 15 4,66,479 3,011 6,26,645 4,03326-Jun-15 4,53,235 2,932 5,931 38 3,950 26 4,63,116 2,996 7,64,854 4,92529-Jun-15 2,11,522 1,395 3,291 21 13,755 86 2,28,568 1,503 5,65,826 3,66230-Jun-15 1,72,921 1,133 5,763 37 7,896 51 1,86,580 1,221 5,82,372 3,758
Source: MSEI
Table 47: Daily Trends of Currency Derivatives trading at BSE during June 2015
Date
Currency FuturesCurrency Option
Total TurnoverOpen Interest at the
end ofCalls Puts
No. of
Contracts
Traded Value
(` crore)
No. of
Contracts
Traded Value
(` crore)
No. of
Contracts
Traded Value
(` crore)
No. of
Contracts
Traded Value
(` crore)
No. of
Contracts
Value
(` crore)
1-Jun-15 8,09,737 5,187 1,54,187 1,014 3,09,365 1,896 12,73,289 8,097 9,03,077 5,7452-Jun-15 9,97,464 6,405 2,05,122 1,349 3,67,049 2,272 15,69,635 10,026 9,74,451 6,2223-Jun-15 9,81,434 6,309 1,85,211 1,214 3,36,446 2,087 15,03,091 9,610 9,55,270 6,1014-Jun-15 13,32,611 8,592 1,76,129 1,151 3,14,265 1,948 18,23,005 11,691 8,45,522 5,4295-Jun-15 9,59,710 6,161 1,64,088 1,073 2,54,092 1,584 13,77,890 8,818 8,38,336 5,3608-Jun-15 10,57,804 6,814 1,41,074 923 3,60,062 2,232 15,58,940 9,969 7,67,013 4,9219-Jun-15 7,63,159 4,904 2,32,841 1,522 3,54,463 2,200 13,50,463 8,626 8,40,696 5,379
10-Jun-15 9,70,152 6,228 2,18,469 1,427 1,97,615 1,224 13,86,236 8,879 8,87,145 5,67211-Jun-15 8,66,788 5,558 1,89,961 1,241 2,98,356 1,850 13,55,105 8,649 9,51,052 6,08212-Jun-15 8,99,402 5,780 2,49,122 1,627 4,08,572 2,532 15,57,096 9,939 9,02,632 5,78515-Jun-15 7,31,552 4,706 2,26,526 1,480 3,54,836 2,184 13,12,914 8,370 9,20,533 5,90616-Jun-15 10,19,139 6,567 2,43,529 1,590 2,69,479 1,670 15,32,147 9,826 8,94,455 5,74417-Jun-15 6,64,684 4,278 2,06,084 1,346 4,11,890 2,516 12,82,658 8,140 8,92,340 5,72918-Jun-15 13,47,667 8,639 3,97,037 2,580 4,28,394 2,614 21,73,098 13,833 10,82,681 6,93019-Jun-15 11,89,084 7,596 1,97,148 1,277 3,06,595 1,918 16,92,827 10,791 12,11,554 7,75022-Jun-15 11,51,441 7,337 2,72,993 1,764 2,84,009 1,777 17,08,443 10,878 12,80,500 8,14923-Jun-15 8,19,470 5,227 2,06,942 1,335 3,25,145 2,007 13,51,557 8,569 12,70,100 8,09824-Jun-15 11,73,093 7,491 2,09,419 1,351 2,59,686 1,632 16,42,198 10,474 13,59,939 8,67125-Jun-15 10,98,148 7,008 1,09,671 708 1,74,399 1,102 13,82,218 8,818 13,93,340 8,87626-Jun-15 11,99,307 7,662 2,78,745 1,815 2,08,140 1,303 16,86,192 10,780 10,05,147 6,40329-Jun-15 9,39,303 6,040 2,08,793 1,364 2,78,351 1,755 14,26,447 9,160 10,89,068 6,97030-Jun-15 8,25,045 5,292 2,33,200 1,518 2,94,934 1,878 13,53,179 8,689 11,11,945 7,099
Source: BSE.

699
JULY SEBI BULLETIN 2015T
ab
le 4
8:
Sett
lem
en
t S
tati
stic
s o
f C
urr
en
cy D
eri
vati
ves
Seg
men
t
(` c
rore
)
Year/
Mo
nth
NS
E
To
tal
MS
EI
To
tal
BS
E
To
tal
Cu
rren
cy F
utu
res
Cu
rren
cy O
pti
on
sC
urr
en
cy F
utu
res
Cu
rren
cy o
pti
on
sC
urr
en
cy F
utu
res
Cu
rren
cy O
pti
on
s
MT
M
Sett
lem
en
t
Fin
al
Sett
lem
en
t
Pre
miu
m
Sett
lem
en
t
Exerc
ise
Sett
lem
en
t
MT
M
Sett
lem
en
t
Fin
al
Sett
lem
en
t
Pre
miu
m
Sett
lem
en
t
Exerc
ise
Sett
lem
en
t
MT
M
Sett
lem
en
t
Fin
al
Sett
lem
en
t
Pre
miu
m
Sett
lem
en
t
Exerc
ise
Sett
lem
en
t
2014
-15
4,8
02
44
591
152
5,5
89
1,548
1336
81,
605
1,940
22
5,0
52
167,0
30
2015
-16$
1,439
1916
549
1,673
274
46
2286
746
10830
91,
593
Apr
-15
477
1655
1856
599
32
010
425
17
285
254
5
May
-15
479
358
1555
699
12
010
226
22
355
162
1
Jun-
1548
41
5216
552
760
32
8123
20
190
542
7
No
tes:
1.
U
nit
ed
Sto
ck
Exch
an
ge o
f I
nd
ia L
td. h
as
sto
pp
ed
pro
vid
ing
tra
din
g f
acil
itie
s to
its
mem
bers
fro
m D
ecem
ber
30, 2014
vid
e c
ircu
lar
nu
mb
er:
US
E/
CM
PL
/628/
2014
.
$ i
nd
icate
s as
on
Ju
ne 3
0,
2015
.
So
urc
e:
Resp
ecti
ve s
tock
exch
an
ges
Tab
le 4
9:
Inst
rum
en
t-w
ise T
urn
ove
r in
Cu
rren
cy D
eri
vati
ves
of N
SE
Mo
nth
Tu
rno
ver
(in
`cro
re)
Op
en
In
tere
st a
s o
n l
ast
day o
f t
he m
on
th
(in
lo
ts)
US
DIN
RE
UR
INR
GB
PIN
RJP
YIN
RU
SD
INR
EU
RIN
RG
BP
INR
JPY
INR
Jun-
141,
84,5
3710
,721
11,0
822,
036
20,3
8,39
466
,061
52,0
588,
486
Jul-1
42,
28,1
748,
760
10,8
461,
852
28,6
3,16
859
,067
50,9
679,
973
Aug
-14
2,46
,156
5,73
38,
381
1,36
727
,94,
614
45,6
3839
,799
8,99
2
Sep-
142,
66,0
297,
010
10,3
411,
857
27,2
2,16
241
,520
43,2
038,
669
Oct
-14
2,12
,568
7,31
97,
347
2,00
131
,13,
927
51,5
5536
,574
18,4
55
Nov
-14
7,38
88,
016
3,09
71,
84,4
6639
,70,
954
62,2
2739
,832
17,8
28
Dec
-14
8,78
89,
960
3,47
12,
72,6
0130
,87,
315
44,5
5428
,602
13,6
57
Jan-
1511
,231
11,1
124,
222
3,33
,691
27,7
4,94
245
,317
24,1
2414
,383
Feb-
152,
05,6
937,
215
9,23
82,
913
31,9
4,34
043
,054
45,5
3512
,761
Mar
-15
3,11
,327
11,2
2411
,498
2,97
831
,90,
546
51,0
5335
,036
9,95
5
Apr
-15
2,75
,011
10,8
2710
,753
2,02
632
,48,
478
67,7
7351
,969
9,40
0
May
-15
2,95
,486
10,6
9411
,408
2,19
129
,03,
043
58,5
3341
,948
14,4
08
Jun-
152,
85,5
1813
,147
10,6
472,
950
41,7
1,60
265
,630
49,5
1110
,554
So
urc
e:
NS
E.

700
JULY SEBI BULLETIN 2015
Table 50: Instrument-wise Turnover in Currency Derivative Segment of MSEI
Month
Turnover
(`crore)
Open Interest as on last day of the month
(in lots)
USDINR EURINR GBPINR JPYINR USDINR EURINR GBPINR JPYINR
Jun-14 59,619 3,300 4,476 893 7,12,273 16,515 19,747 3,780Jul-14 70,992 2,944 3,927 828 8,57,427 20,570 18,194 2,539Aug-14 57,302 1,853 3,244 595 7,04,369 11,403 11,106 1,699Sep-14 51,395 1,865 3,636 695 5,44,083 7,269 12,394 1,474Oct-14 37,262 1,485 2,342 572 6,71,762 9,315 8,457 3,298Nov-14 32,553 1,449 2,143 745 7,58,087 9,987 8,884 4,484Dec-14 44,437 1,297 2,486 703 4,19,211 3,627 3,941 1,607Jan-15 38,532 1,794 2,409 754 4,73,673 6,169 4,948 1,716Feb-15 26,657 986 1,829 454 5,11,791 3,400 3,635 2,185Mar-15 37,744 1,635 2,309 493 3,50,505 5,791 4,499 365Apr-15 34,776 1,368 1,551 232 4,22,103 6,010 4,104 326May-15 33,039 1,227 1,272 173 3,45,548 8,604 2,576 2,340Jun-15 34,437 1,487 1,076 180 5,65,778 12,136 4,059 399
Source: MSEI
Table 51: Instrument-wise Turnover in Currency Derivative Segment of BSE
Month
Turnover
(`crore)
Open Interest as on last day of the month
(in lots)
USDINR EURINR GBPINR JPYINR USDINR EURINR GBPINR JPYINR
Jun-14 1,03,184 215 237 114 2,29,497 5,500 5,144 3Jul-14 1,16,768 144 149 465 3,07,277 5,500 5,005 20Aug-14 1,14,792 47 69 219 4,35,719 618 104 34Sep-14 1,40,401 27 71 671 4,36,219 84 109 40Oct-14 1,06,477 281 318 364 6,83,842 104 959 1,126Nov-14 1,16,125 56 136 424 8,21,433 28 296 4Dec-14 1,86,324 60 188 543 5,04,351 20 22 26Jan-15 3,16,702 120 458 412 7,19,869 1,184 1,137 58Feb-15 2,24,891 59 170 247 8,78,018 242 583 607Mar-15 2,90,014 1,475 64 16 6,62,371 897 486 914Apr-15 2,24,902 571 262 61 8,56,186 634 220 541May-15 2,41,194 594 175 34 7,72,830 650 419 551Jun-15 2,11,769 477 297 89 11,07,151 1,569 2,505 720
Source: BSE
Table 52: Maturity-wise Turnover in Currency Derivative Segment of NSE
(` crore)
MonthCurrency Futures Currency Options
1 Month 2 Month 3 Month > 3 months 1 Month 2 Month 3 Month > 3 months
Jun-14 1,39,915 24,653 2,949 2,196 33,998 4,658 4 3Jul-14 1,63,083 29,804 6,040 2,717 43,208 4,769 11 0Aug-14 1,49,938 32,988 11,020 2,807 57,826 7,056 3 0Sep-14 1,67,425 34,904 3,935 3,107 63,691 12,162 12 0Oct-14 1,31,054 27,800 5,580 2,861 55,510 5,914 516 0Nov-14 1,16,240 33,105 3,079 1,707 38,534 10,178 104 18Dec-14 1,68,344 30,917 2,990 2,876 72,994 16,159 173 368Jan-15 2,02,095 32,426 3,452 2,546 1,11,060 8,542 125 11Feb-15 1,35,641 28,380 4,851 2,162 48,087 5,808 129 0Mar-15 1,84,677 39,452 6,209 2,652 91,503 12,519 7 8Apr-15 1,58,643 36,396 3,611 1,536 84,202 14,101 128 0May-15 1,84,537 28,875 2,744 2,045 89,744 11,415 420 0Jun-15 1,72,441 34,997 3,216 1,692 83,795 15,797 325 0
Source: NSE.

701
JULY SEBI BULLETIN 2015
Table 53: Maturity-wise Turnover in Currency Derivative Segment of MSEI
(` crore)
MonthCurrency Futures Currency Options
1 Month 2 Month 3 Month > 3 months 1 Month 2 Month 3 Month > 3 months
Jun-14 54,539 10,969 749 225 1,714 91 0 0Jul-14 61,630 12,496 2,917 184 1,292 173 0 0Aug-14 51,983 8,625 727 87 1,381 187 0 6Sep-14 45,395 9,320 1,089 152 1,490 145 0 0Oct-14 32,067 6,612 1,927 151 812 93 0 0Nov-14 27,735 7,205 883 103 808 154 0 0Dec-14 38,909 6,269 621 346 2,624 0 154 0Jan-15 35,320 6,200 1,259 463 81 59 107 -Feb-15 22,574 4,602 1,536 323 865 28 0 0Mar-15 31,613 6,544 493 589 2,825 118 0 0Apr-15 28,251 6,212 565 116 2,675 109 0 0May-15 26,943 5,810 526 300 1,810 273 0 47Jun-15 28,091 5,267 1,064 1,061 1,512 94 0 92
Source: MSEI
Table 54: Maturity-wise Turnover in Currency Derivative Segment of BSE
(` crore)
MonthCurrency Futures Currency Options
1 Month 2 Month 3 Month > 3 months 1 Month 2 Month 3 Month > 3 months
Jun-14 83,529 5,843 365 1 10,147 3,122 310 433Jul-14 83,148 6,289 694 2 21,774 3,336 938 1,345Aug-14 97,651 9,134 1,204 68 1,546 3,661 832 1,031Sep-14 1,12,239 14,177 750 40 4,345 6,679 1,338 1,601Oct-14 85,740 10,736 1,457 28 1,235 5,152 1,348 1,743Nov-14 77,338 12,016 854 1 7,847 5,672 9,179 3,834Dec-14 1,09,169 10,316 562 10 36,351 5,556 15,886 9,265Jan-15 1,41,370 14,706 1,009 52 1,02,618 11,625 22,212 24,098Feb-15 91,043 11,890 2,075 799 27,868 30,078 18,228 43,385Mar-15 1,20,315 15,950 934 139 29,933 15,370 30,279 78,648Apr-15 1,15,841 16,467 801 2 57,171 3,528 20,034 11,949May-15 1,19,851 12,894 618 18 81,032 2,724 11,996 12,862Jun-15 1,22,642 15,927 1,172 39 45,006 5,011 10,388 12,444
Source: BSE
Table 55: Trading Statistics of Interest Rate Futures at BSE, NSE and MSEI
Year/
Month
No. of
Trading
Days
BSE NSE MSEI
Interest Rate
Futures
Open Interest at the
end of
Interest Rate
Futures
Open Interest at the
end of
Interest Rate
Futures
Open Interest at the
end of
No. of
Contracts
Traded
Value
(` crore)
No. of
Contracts
Value
(` crore)
No. of
Contracts
Traded
Value
(` crore)
No. of
Contracts
Value
(` crore)
No. of
Contracts
Traded
Value
(` crore)
No. of
Contracts
Value
(` crore)
2014-15 238 20,33,275 41,912 80,078 1,671 2,05,87,036 4,21,558 3,38,372 7,071 4,95,869 10,312 56,017 1,170
2015-16$ 59 6,28,474 12,947 1,08,191 1,887 76,73,881 1,57,618 6,01,509 12,315 4,58,815 9,457 21,563 434
Apr-15 18 3,00,430 6,251 34,738 719 21,10,059 43,899 1,99,805 4,136 2,09,107 4,351 62,690 1,298
May-15 19 1,47,142 3,031 40,899 840 25,04,801 51,663 2,12,416 4,381 1,03,438 2,137 26,641 551
Jun-15 22 1,80,902 3,665 32,554 328 30,59,021 62,055 1,89,288 3,798 1,46,270 2,969 21,563 434
$ indicates as on June 30, 2015.
Source: BSE, NSE and MSEI

702
JULY SEBI BULLETIN 2015
Table 56: Daily Trends of Interest Rate Futures trading at BSE during June 2015
Date No. of Contracts tradedTurnover
(` crore)
Open Interest
No. of contracts Value (` crore)
01-Jun-15 6,434 130 43,608 44702-Jun-15 9,810 202 46,362 47303-Jun-15 5,946 121 48,329 49204-Jun-15 1,355 28 47,766 48505-Jun-15 1,302 26 48,516 49308-Jun-15 1,887 39 47,304 48009-Jun-15 2,955 60 48,239 49010-Jun-15 5,467 110 45,102 45711-Jun-15 6,391 129 45,168 45612-Jun-15 5,404 109 44,926 45315-Jun-15 4,937 100 44,025 44416-Jun-15 4,941 98 46,354 46717-Jun-15 4,696 94 47,662 48118-Jun-15 3,785 76 49,401 50119-Jun-15 3,412 70 49,279 50222-Jun-15 5,868 121 47,267 48123-Jun-15 31,198 627 47,446 48124-Jun-15 17,202 345 49,421 49925-Jun-15 41,348 846 30,707 30926-Jun-15 4,008 81 32,042 32329-Jun-15 5,623 114 33,719 33830-Jun-15 6,933 138 32,554 328
Source: BSE
Table 57: Daily Trends of Interest Rate Futures trading at NSE during June 2015
Date No. of Contracts traded Turnover (` crore)Open Interest
No. of contracts Value (` crore)
01-Jun-15 2,23,406 4,599 2,23,406 4,59902-Jun-15 2,17,516 4,444 2,17,516 4,44403-Jun-15 2,24,009 4,566 2,24,009 4,56604-Jun-15 2,27,982 4,629 2,27,982 4,62905-Jun-15 2,34,202 4,758 2,34,202 4,75808-Jun-15 2,30,064 4,667 2,30,064 4,66709-Jun-15 2,31,124 4,690 2,31,124 4,69010-Jun-15 2,37,637 4,806 2,37,637 4,80611-Jun-15 2,28,284 4,600 2,28,284 4,60012-Jun-15 2,26,345 4,552 2,26,345 4,55215-Jun-15 2,22,045 4,473 2,22,045 4,47316-Jun-15 2,23,309 4,492 2,23,309 4,49217-Jun-15 2,32,062 4,676 2,32,062 4,67618-Jun-15 2,19,786 4,456 2,19,786 4,45619-Jun-15 2,15,645 4,390 2,15,645 4,39022-Jun-15 2,12,143 4,311 2,12,143 4,31123-Jun-15 2,22,321 4,510 2,22,321 4,51024-Jun-15 2,28,872 4,624 2,28,872 4,62425-Jun-15 1,80,261 3,632 1,80,261 3,63226-Jun-15 1,87,279 3,776 1,87,279 3,77629-Jun-15 1,91,292 3,832 1,91,292 3,83230-Jun-15 1,89,288 3,798 1,89,288 3,798
Source: NSE
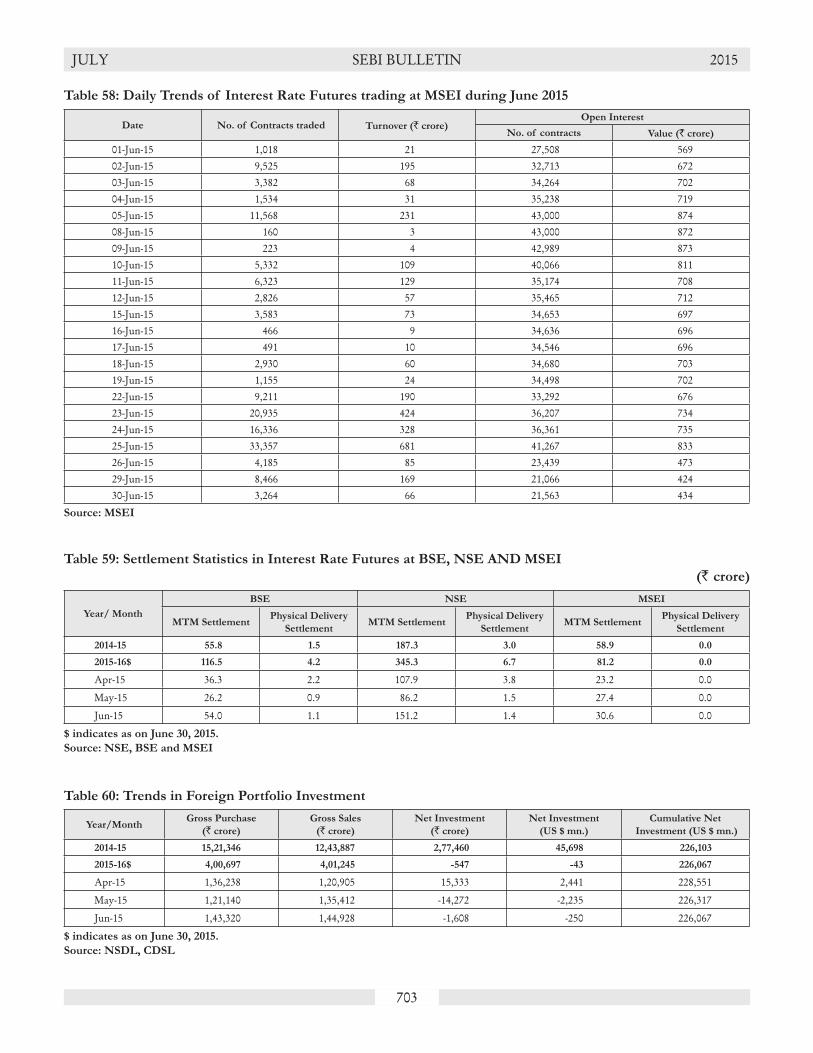
703
JULY SEBI BULLETIN 2015
Table 58: Daily Trends of Interest Rate Futures trading at MSEI during June 2015
Date No. of Contracts traded Turnover (` crore)Open Interest
No. of contracts Value (` crore)
01-Jun-15 1,018 21 27,508 56902-Jun-15 9,525 195 32,713 67203-Jun-15 3,382 68 34,264 70204-Jun-15 1,534 31 35,238 71905-Jun-15 11,568 231 43,000 87408-Jun-15 160 3 43,000 87209-Jun-15 223 4 42,989 87310-Jun-15 5,332 109 40,066 81111-Jun-15 6,323 129 35,174 70812-Jun-15 2,826 57 35,465 71215-Jun-15 3,583 73 34,653 69716-Jun-15 466 9 34,636 69617-Jun-15 491 10 34,546 69618-Jun-15 2,930 60 34,680 70319-Jun-15 1,155 24 34,498 70222-Jun-15 9,211 190 33,292 67623-Jun-15 20,935 424 36,207 73424-Jun-15 16,336 328 36,361 73525-Jun-15 33,357 681 41,267 83326-Jun-15 4,185 85 23,439 47329-Jun-15 8,466 169 21,066 42430-Jun-15 3,264 66 21,563 434
Source: MSEI
Table 59: Settlement Statistics in Interest Rate Futures at BSE, NSE AND MSEI
(` crore)
Year/ Month
BSE NSE MSEI
MTM SettlementPhysical Delivery
SettlementMTM Settlement
Physical Delivery
SettlementMTM Settlement
Physical Delivery
Settlement
2014-15 55.8 1.5 187.3 3.0 58.9 0.0
2015-16$ 116.5 4.2 345.3 6.7 81.2 0.0
Apr-15 36.3 2.2 107.9 3.8 23.2 0.0
May-15 26.2 0.9 86.2 1.5 27.4 0.0
Jun-15 54.0 1.1 151.2 1.4 30.6 0.0
$ indicates as on June 30, 2015.
Source: NSE, BSE and MSEI
Table 60: Trends in Foreign Portfolio Investment
Year/MonthGross Purchase
(` crore)
Gross Sales
(` crore)
Net Investment
(` crore)
Net Investment
(US $ mn.)
Cumulative Net
Investment (US $ mn.)
2014-15 15,21,346 12,43,887 2,77,460 45,698 226,103
2015-16$ 4,00,697 4,01,245 -547 -43 226,067
Apr-15 1,36,238 1,20,905 15,333 2,441 228,551
May-15 1,21,140 1,35,412 -14,272 -2,235 226,317
Jun-15 1,43,320 1,44,928 -1,608 -250 226,067
$ indicates as on June 30, 2015.
Source: NSDL, CDSL
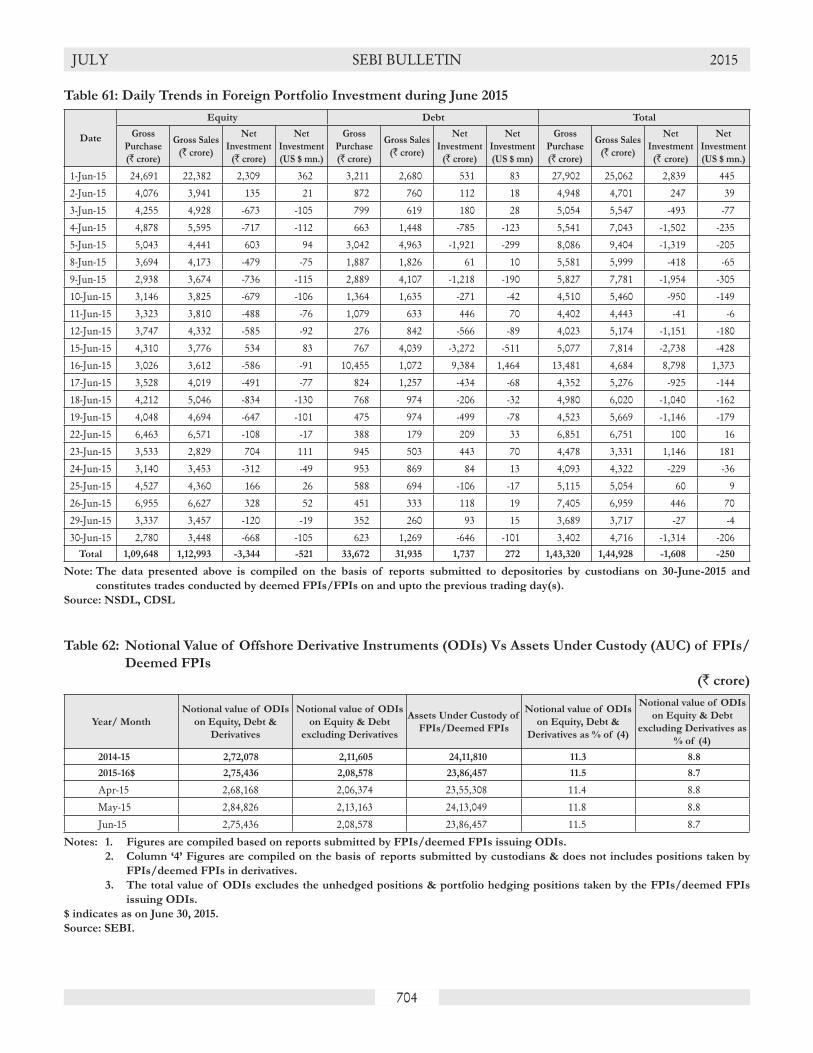
704
JULY SEBI BULLETIN 2015
Table 61: Daily Trends in Foreign Portfolio Investment during June 2015
Date
Equity Debt Total
Gross
Purchase
(` crore)
Gross Sales
(` crore)
Net
Investment
(` crore)
Net
Investment
(US $ mn.)
Gross
Purchase
(` crore)
Gross Sales
(` crore)
Net
Investment
(` crore)
Net
Investment
(US $ mn)
Gross
Purchase
(` crore)
Gross Sales
(` crore)
Net
Investment
(` crore)
Net
Investment
(US $ mn.)
1-Jun-15 24,691 22,382 2,309 362 3,211 2,680 531 83 27,902 25,062 2,839 445
2-Jun-15 4,076 3,941 135 21 872 760 112 18 4,948 4,701 247 39
3-Jun-15 4,255 4,928 -673 -105 799 619 180 28 5,054 5,547 -493 -77
4-Jun-15 4,878 5,595 -717 -112 663 1,448 -785 -123 5,541 7,043 -1,502 -235
5-Jun-15 5,043 4,441 603 94 3,042 4,963 -1,921 -299 8,086 9,404 -1,319 -205
8-Jun-15 3,694 4,173 -479 -75 1,887 1,826 61 10 5,581 5,999 -418 -65
9-Jun-15 2,938 3,674 -736 -115 2,889 4,107 -1,218 -190 5,827 7,781 -1,954 -305
10-Jun-15 3,146 3,825 -679 -106 1,364 1,635 -271 -42 4,510 5,460 -950 -149
11-Jun-15 3,323 3,810 -488 -76 1,079 633 446 70 4,402 4,443 -41 -6
12-Jun-15 3,747 4,332 -585 -92 276 842 -566 -89 4,023 5,174 -1,151 -180
15-Jun-15 4,310 3,776 534 83 767 4,039 -3,272 -511 5,077 7,814 -2,738 -428
16-Jun-15 3,026 3,612 -586 -91 10,455 1,072 9,384 1,464 13,481 4,684 8,798 1,373
17-Jun-15 3,528 4,019 -491 -77 824 1,257 -434 -68 4,352 5,276 -925 -144
18-Jun-15 4,212 5,046 -834 -130 768 974 -206 -32 4,980 6,020 -1,040 -162
19-Jun-15 4,048 4,694 -647 -101 475 974 -499 -78 4,523 5,669 -1,146 -179
22-Jun-15 6,463 6,571 -108 -17 388 179 209 33 6,851 6,751 100 16
23-Jun-15 3,533 2,829 704 111 945 503 443 70 4,478 3,331 1,146 181
24-Jun-15 3,140 3,453 -312 -49 953 869 84 13 4,093 4,322 -229 -36
25-Jun-15 4,527 4,360 166 26 588 694 -106 -17 5,115 5,054 60 9
26-Jun-15 6,955 6,627 328 52 451 333 118 19 7,405 6,959 446 70
29-Jun-15 3,337 3,457 -120 -19 352 260 93 15 3,689 3,717 -27 -4
30-Jun-15 2,780 3,448 -668 -105 623 1,269 -646 -101 3,402 4,716 -1,314 -206Total 1,09,648 1,12,993 -3,344 -521 33,672 31,935 1,737 272 1,43,320 1,44,928 -1,608 -250
Note: The data presented above is compiled on the basis of reports submitted to depositories by custodians on 30-June-2015 and
constitutes trades conducted by deemed FPIs/FPIs on and upto the previous trading day(s).
Source: NSDL, CDSL
Table 62: Notional Value of Offshore Derivative Instruments (ODIs) Vs Assets Under Custody (AUC) of FPIs/
Deemed FPIs
(` crore)
Year/ Month
Notional value of ODIs
on Equity, Debt &
Derivatives
Notional value of ODIs
on Equity & Debt
excluding Derivatives
Assets Under Custody of
FPIs/Deemed FPIs
Notional value of ODIs
on Equity, Debt &
Derivatives as % of (4)
Notional value of ODIs
on Equity & Debt
excluding Derivatives as
% of (4)
2014-15 2,72,078 2,11,605 24,11,810 11.3 8.8
2015-16$ 2,75,436 2,08,578 23,86,457 11.5 8.7
Apr-15 2,68,168 2,06,374 23,55,308 11.4 8.8
May-15 2,84,826 2,13,163 24,13,049 11.8 8.8
Jun-15 2,75,436 2,08,578 23,86,457 11.5 8.7
Notes: 1. Figures are compiled based on reports submitted by FPIs/deemed FPIs issuing ODIs.
2. Column ‘4’ Figures are compiled on the basis of reports submitted by custodians & does not includes positions taken by
FPIs/deemed FPIs in derivatives.
3. The total value of ODIs excludes the unhedged positions & portfolio hedging positions taken by the FPIs/deemed FPIs
issuing ODIs.
$ indicates as on June 30, 2015.
Source: SEBI.
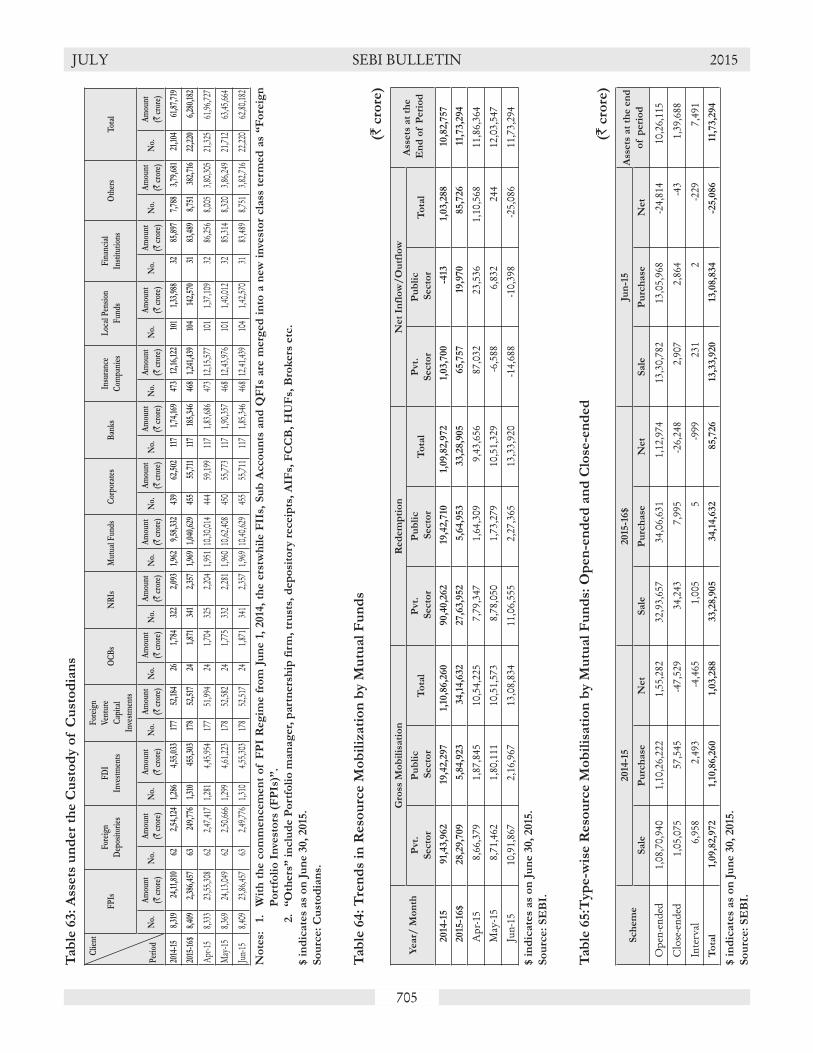
705
JULY SEBI BULLETIN 2015T
ab
le 6
3:
Ass
ets
un
der
the C
ust
od
y o
f C
ust
od
ian
s
C
lient
Peri
od
FP
IsFo
reig
n
Dep
osito
ries
FD
I
Inve
stm
ents
Fore
ign
Vent
ure
Cap
ital
Inve
stm
ents
OC
Bs
NR
IsM
utua
l Fun
dsC
orpo
rate
sB
anks
Insu
ranc
e
Com
pani
es
Loc
al P
ensi
on
Fun
ds
Fin
anci
al
Inst
itutio
nsO
ther
sTo
tal
No.
Am
ount
(` c
rore
)N
o.A
mou
nt
(` c
rore
)N
o.A
mou
nt
(` c
rore
)N
o.A
mou
nt
(` c
rore
)N
o.A
mou
nt
(` c
rore
)N
o.A
mou
nt
(` c
rore
)N
o.A
mou
nt
(` c
rore
)N
o.A
mou
nt
(` c
rore
)N
o.A
mou
nt
(` c
rore
)N
o.A
mou
nt
(` c
rore
)N
o.A
mou
nt
(` c
rore
)N
o.A
mou
nt
(` c
rore
)N
o.A
mou
nt
(` c
rore
)N
o.A
mou
nt
(` c
rore
)
2014
-15
8,31
924
,11,
810
622,
54,1
241,
286
4,55
,033
177
52,1
8426
1,78
432
22,
093
1,96
29,
58,3
3243
962
,502
117
1,74
,169
473
12,1
6,12
210
11,
33,9
8832
85,8
977,
788
3,79
,681
21,1
0461
,87,
719
2015
-16$
8,40
92,
386,
457
6324
9,77
61,
310
455,
303
178
52,5
1724
1,87
134
12,
357
1,96
91,
040,
629
455
55,7
1111
718
5,34
646
81,
241,
439
104
142,
570
3183
,489
8,75
138
2,71
622
,220
6,28
0,18
2
Apr-1
58,3
3323
,55,30
862
2,47,4
171,2
814,4
5,954
177
51,99
424
1,704
325
2,204
1,951
10,30
,014
444
59,19
911
71,8
3,686
473
12,15
,577
101
1,37,1
0932
86,25
68,0
053,8
0,305
21,32
561
,96,72
7
May
-158,3
6924
,13,04
962
2,50,6
661,2
994,6
1,223
178
52,58
224
1,775
332
2,281
1,960
10,62
,408
450
55,77
311
71,9
0,357
468
12,43
,976
101
1,40,0
1232
85,31
48,3
203,8
6,249
21,71
263
,45,66
4
Jun-1
58,4
0923
,86,45
763
2,49,7
761,3
104,5
5,303
178
52,51
724
1,871
341
2,357
1,969
10,40
,629
455
55,71
111
71,8
5,346
468
12,41
,439
104
1,42,5
7031
83,48
98,7
513,8
2,716
22,22
062
,80,18
2
No
tes:
1.
W
ith
th
e c
om
men
cem
en
t o
f F
PI
Reg
ime f
rom
Ju
ne 1
, 2014
, th
e e
rstw
hil
e F
IIs,
Su
b A
cco
un
ts a
nd
QF
Is a
re m
erg
ed
in
to a
new
in
vest
or
cla
ss t
erm
ed
as
“F
ore
ign
Po
rtfo
lio
In
vest
ors
(F
PIs
)”.
2.
“O
thers
” i
nclu
de P
ort
foli
o m
an
ag
er,
part
ners
hip
fir
m,
tru
sts,
dep
osi
tory
receip
ts,
AIF
s, F
CC
B,
HU
Fs,
Bro
kers
etc
.
$ i
nd
icate
s as
on
Ju
ne 3
0,
2015
.
So
urc
e:
Cu
sto
dia
ns.
Tab
le 6
4:
Tre
nd
s in
Reso
urc
e M
ob
iliz
ati
on
by M
utu
al
Fu
nd
s
(` c
rore
)
Year/
Mo
nth
Gro
ss M
ob
ilis
ati
on
Red
em
pti
on
Net
Infl
ow
/O
utf
low
Ass
ets
at
the
En
d o
f P
eri
od
Pvt.
Secto
r
Pu
bli
c
Secto
rT
ota
lP
vt.
Secto
r
Pu
bli
c
Secto
rT
ota
lP
vt.
Secto
r
Pu
bli
c
Secto
rT
ota
l
2014
-15
91,
43,9
62
19,4
2,2
97
1,10
,86,2
60
90,4
0,2
62
19,4
2,7
101,
09,8
2,9
72
1,03,7
00
-413
1,03,2
88
10,8
2,7
57
2015
-16$
28,2
9,7
09
5,8
4,9
23
34,1
4,6
32
27,6
3,9
52
5,6
4,9
53
33,2
8,9
05
65,7
57
19,9
70
85,7
26
11,7
3,2
94
Apr
-15
8,66
,379
1,87
,845
10,5
4,22
57,
79,3
471,
64,3
099,
43,6
5687
,032
23,5
361,
10,5
6811
,86,
364
May
-15
8,71
,462
1,80
,111
10,5
1,57
38,
78,0
501,
73,2
7910
,51,
329
-6,5
886,
832
244
12,0
3,54
7
Jun-
1510
,91,
867
2,16
,967
13,0
8,83
411
,06,
555
2,27
,365
13,3
3,92
0-1
4,68
8-1
0,39
8-2
5,08
611
,73,
294
$ i
nd
icate
s as
on
Ju
ne 3
0,
2015
.
So
urc
e:
SE
BI.
Tab
le 6
5:T
yp
e-w
ise R
eso
urc
e M
ob
ilis
ati
on
by M
utu
al
Fu
nd
s: O
pen
-en
ded
an
d C
lose
-en
ded
(` c
rore
)
Sch
em
e2014
-15
2015
-16$
Jun
-15
Ass
ets
at
the e
nd
of p
eri
od
Sale
Pu
rch
ase
Net
Sale
Pu
rch
ase
Net
Sale
Pu
rch
ase
Net
Ope
n-en
ded
1,08
,70,
940
1,10
,26,
222
1,55
,282
32,9
3,65
734
,06,
631
1,12
,974
13,3
0,78
213
,05,
968
-24,
814
10,2
6,11
5
Clo
se-e
nded
1,05
,075
57,5
45-4
7,52
934
,243
7,99
5-2
6,24
82,
907
2,86
4-4
31,
39,6
88
Inte
rval
6,95
82,
493
-4,4
651,
005
5-9
9923
12
-229
7,49
1T
ota
l1,
09,8
2,9
72
1,10
,86,2
60
1,03,2
88
33,2
8,9
05
34,1
4,6
32
85,7
26
13,3
3,9
20
13,0
8,8
34
-25,0
86
11,7
3,2
94
$ i
nd
icate
s as
on
Ju
ne 3
0,
2015
.
So
urc
e:
SE
BI.

706
JULY SEBI BULLETIN 2015T
ab
le 6
6:
Sch
em
e-w
ise R
eso
urc
e M
ob
ilis
ati
on
an
d A
ssets
un
der
Man
ag
em
en
t b
y M
utu
al
Fu
nd
s
(` c
rore
)
Typ
e
2014
-15
2015
-16$
Jun
-15
Sale
Pu
rch
ase
Net
Ass
ets
at
the e
nd
of
Peri
od
Sale
Pu
rch
ase
Net
Ass
ets
at
the e
nd
of
Peri
od
Sale
Pu
rch
ase
Net
A.
In
co
me/
Deb
t O
rien
ted
Sch
em
es
(i
+ii
+ii
i+iv
)1,
08,8
9,5
32
1,09,1
2,0
88
22,5
56
6,9
4,1
28
33,0
9,9
36
33,5
7,0
86
47,1
50
7,5
2,5
1313
,27,1
37
12,8
5,3
88
-41,
749
i.
Liq
uid/
Mon
ey M
arke
t1,
03,9
5,48
41,
04,0
5,26
59,
781
1,62
,562
31,9
0,79
532
,29,
400
38,6
052,
06,9
7912
,90,
751
12,4
3,42
1-4
7,33
0
ii. G
ilt5,
421
13,1
337,
711
14,6
141,
415
2,17
576
015
,193
502
223
-279
iii
. Deb
t (ot
her
than
ass
ured
ret
urn)
4,88
,627
4,93
,502
4,87
65,
15,7
721,
17,7
261,
25,2
817,
555
5,28
,900
35,8
8441
,744
5,86
0
iv.
Deb
t (as
sure
d re
turn
)0
00
00
00
00
00
v.
Inf
rast
ruct
ure
Dev
elop
men
t0
188
188
1,17
90
230
230
1,44
20
00
B.
G
row
th/
Eq
uit
y O
rien
ted
S
ch
em
es
(i+
ii)
77,1
42
1,48,1
71
71,
030
3,4
5,1
39
14,4
41
47,3
73
32,9
32
3,7
2,3
135,6
56
17,9
28
12,2
72
i.
ELS
S5,
434
8,34
32,
908
39,4
7095
91,
637
678
39,4
2926
453
827
4
ii. O
ther
s71
,708
1,39
,829
68,1
213,
05,6
6913
,482
45,7
3632
,254
3,32
,884
5,39
217
,390
11,9
98C
.
Bala
nced
Sch
em
es
5,5
91
15,4
179,8
26
26,3
68
1,081
7,8
85
6,8
04
32,2
59
288
4,7
08
4,4
19
D.
E
xch
an
ge T
rad
ed
Fu
nd
(i+
ii)
9,1
98
9,9
74
776
14,7
153,2
79
2,2
08
-1,0
70
13,8
39
782
780
-3
i.
Gol
d ET
F1,
593
118
-1,4
756,
655
241
10-2
316,
516
761
-76
ii.
Oth
er E
TFs
7,60
59,
856
2,25
18,
060
3,03
82,
198
-840
7,32
270
677
973
E.
F
un
d o
f F
un
ds
Inve
stin
g O
vers
eas
1,509
609
-900
2,4
08
169
79
-90
2,3
69
57
31
-26
T
ota
l (A
+B
+C
+D
+E
)1,
09,8
2,9
72
1,10
,86,2
60
1,03,2
88
10,8
2,7
57
33,2
8,9
05
34,1
4,6
32
85,7
26
11,7
3,2
94
13,3
3,9
20
13,0
8,8
34
-25,0
86
$ i
nd
icate
s as
on
Ju
ne 3
0,
2015
.
So
urc
e:
SE
BI.
Tab
le 6
7:
Nu
mb
er
of S
ch
em
es
an
d F
oli
os
by I
nve
stm
en
t O
bje
cti
ve
Typ
e
2014
-15
2015
-16$
No
. o
f S
ch
em
es
No
. o
f F
oli
os
No
. o
f S
ch
em
es
No
. o
f F
oli
os
Op
en
Clo
sed
Inte
rval
To
tal
Op
en
Clo
sed
Inte
rval
To
tal
Op
en
Clo
sed
Inte
rval
To
tal
Op
en
Clo
sed
Inte
rval
To
tal
A.
In
co
me/
Deb
t O
rien
ted
Sch
em
es
(i
+ii
+ii
i+iv
)36
491
072
1,34
662
,17,
146
9,80
,059
14,9
8272
,12,
187
375
984
721,
431
63,0
6,34
29,
39,1
4013
,972
72,5
9,45
4
i.
Liq
uid/
Mon
ey M
arke
t52
00
523,
11,6
440
03,
11,6
4453
00
533,
28,7
090
03,
28,7
09
ii. G
ilt45
00
4565
,225
00
65,2
2546
00
4665
,120
00
65,1
20
iii. D
ebt (
othe
r th
an a
ssur
ed r
etur
n)26
790
672
1,24
558
,40,
277
9,80
,030
14,9
8268
,35,
289
276
977
721,
325
59,1
2,51
39,
39,0
9213
,972
68,6
5,57
7
iv. D
ebt (
assu
red
retu
rn)
00
00
00
00
00
00
00
00
v.
Inf
rast
ruct
ure
Dev
elop
men
t0
40
40
290
290
70
70
480
48B
. G
row
th/
Eq
uit
y O
rien
ted
Sch
em
es
(i+
ii)
342
920
434
3,02
,33,
444
14,5
8,17
50
3,16
,91,
619
347
101
044
83,
10,8
0,44
815
,00,
060
03,
25,8
0,50
8
i.
ELS
S39
160
5558
,54,
422
6,37
,858
064
,92,
280
3916
055
59,6
3,71
56,
26,6
140
65,9
0,32
9
ii. O
ther
s30
376
037
92,
43,7
9,02
28,
20,3
170
2,51
,99,
339
308
850
393
2,51
,16,
733
8,73
,446
02,
59,9
0,17
9C
. B
ala
nced
Sch
em
es
250
025
19,9
0,51
60
019
,90,
516
260
026
20,9
2,91
50
020
,92,
915
D.
Exch
an
ge T
rad
ed
Fu
nd
(i+
ii)
480
048
6,99
,729
00
6,99
,729
490
049
7,03
,882
00
7,03
,882
i.
Gol
d ET
F14
00
144,
65,7
650
04,
65,7
6513
00
134,
61,2
980
04,
61,2
98
ii. O
ther
ET
Fs34
00
342,
33,9
640
02,
33,9
6436
00
362,
42,5
840
02,
42,5
84E
. F
un
d o
f F
un
ds
Inve
stin
g O
vers
eas
310
031
1,46
,155
00
1,46
,155
310
031
1,41
,243
00
1,41
,243
To
tal
(A+
B+
C+
D+
E)
810
1,00
272
1,88
43,
92,8
6,99
024
,38,
234
14,9
824,
17,4
0,20
682
81,
085
721,
985
4,03
,24,
830
24,3
9,20
013
,972
4,27
,78,
002
No
te:
Data
fo
r N
o.
of S
ch
em
es
als
o i
nclu
des
seri
al
pla
ns.
$ i
nd
icate
s as
on
Ju
ne 3
0,
2015
.
So
urc
e:
SE
BI.

707
JULY SEBI BULLETIN 2015T
ab
le 6
8:
Tre
nd
s in
Tra
nsa
cti
on
s o
n S
tock
Exch
an
ges
by M
utu
al
Fu
nd
s
(` c
rore
)
Year/
Mo
nth
Eq
uit
yD
ebt
To
tal
Gro
ss P
urc
hase
Gro
ss
Sale
s
Net
Pu
rch
ase
/S
ale
s
Gro
ss
Pu
rch
ase
Gro
ss
Sale
s
Net
Pu
rch
ase
/
Sale
s
Gro
ss
Pu
rch
ase
Gro
ss
Sale
s
Net
Pu
rch
ase
/
Sale
s
2014
-15
2,3
1,409
1,90,6
87
40,7
22
17,1
7,1
55
11,3
0,1
38
5,8
7,0
1819
,48,5
65
13,2
0,8
25
6,2
7,7
41
2015
-16$
71,
676
47,9
30
23,7
46
393,5
93
298,9
01
94,6
93
4,6
5,2
69
3,4
6,8
30
1,18
,439
Apr
-15
24,3
6715
,123
9,24
41,
41,7
871,
19,1
3722
,650
1,66
,154
1,34
,261
31,8
94
May
-15
21,7
0117
,524
4,17
71,
04,9
7487
,586
17,3
891,
26,6
751,
05,1
1021
,566
Jun-
1525
,608
15,2
8310
,326
1,46
,832
92,1
7754
,655
1,72
,440
1,07
,460
64,9
80
$ i
nd
icate
s as
on
Ju
ne 3
0,
2015
.
So
urc
e:
SE
BI
Tab
le 6
9:
Ass
et
Un
der
Man
ag
em
en
t b
y P
ort
foli
o M
an
ag
er
Year/
Mo
nth
2014
-15
May-1
5Ju
n-1
5
Part
icu
lars
Dis
cre
tio
nary
No
n-
Dis
cre
tio
nary
Ad
vis
ory
Dis
cre
tio
nary
No
n-
Dis
cre
tio
nary
Ad
vis
ory
Dis
cre
tio
nary
No
n-
Dis
cre
tio
nary
Ad
vis
ory
No
. o
f C
lien
ts40
,558
3,29
72,
851
41,8
503,
316
3,48
843
,217
3,32
73,
492
AU
M (`
in c
rore
)
List
ed E
quity
40,8
298,
651
1,8
0,12
4
41,2
728,
925
1,8
1,91
7*
41,4
938,
850
183
215.
27*
Unl
isted
Equ
ity1,
129
421,
504
511,
583
48
Plai
n D
ebt
6,27
,716
33,7
306,
40,8
2935
,124
6,52
,669
35,6
15
Stru
ctur
ed D
ebt
137
500
110
502
114
500
Equi
ty
Der
ivat
ive
153
-416
4-3
176
3
Mut
ual F
und
5,86
64,
901
5,64
84,
679
5,71
04,
616
Oth
ers
23,4
7313
625
,177
301
22,5
0421
1
To
tal
6,9
9,3
04
47,9
57
7,1
4,7
02
49,5
78
724249.5
#49,8
44
No
tes:
1.
*V
alu
e o
f A
ssets
fo
r w
hic
h A
dvis
ory
Serv
ices
are
bein
g g
iven
.
2.
#O
f t
he a
bo
ve A
UM
`6,5
5,0
02 c
rore
is
co
ntr
ibu
ted
by f
un
ds
fro
m E
PF
O/
PF
s.
3.
T
he a
bo
ve d
ata
is
base
d o
n t
he m
on
thly
rep
ort
s re
ceiv
ed
fro
m p
ort
foli
o m
an
ag
ers
$ i
nd
icate
s as
on
Ju
ne 3
0,
2015
So
urc
e:
SE
BI.
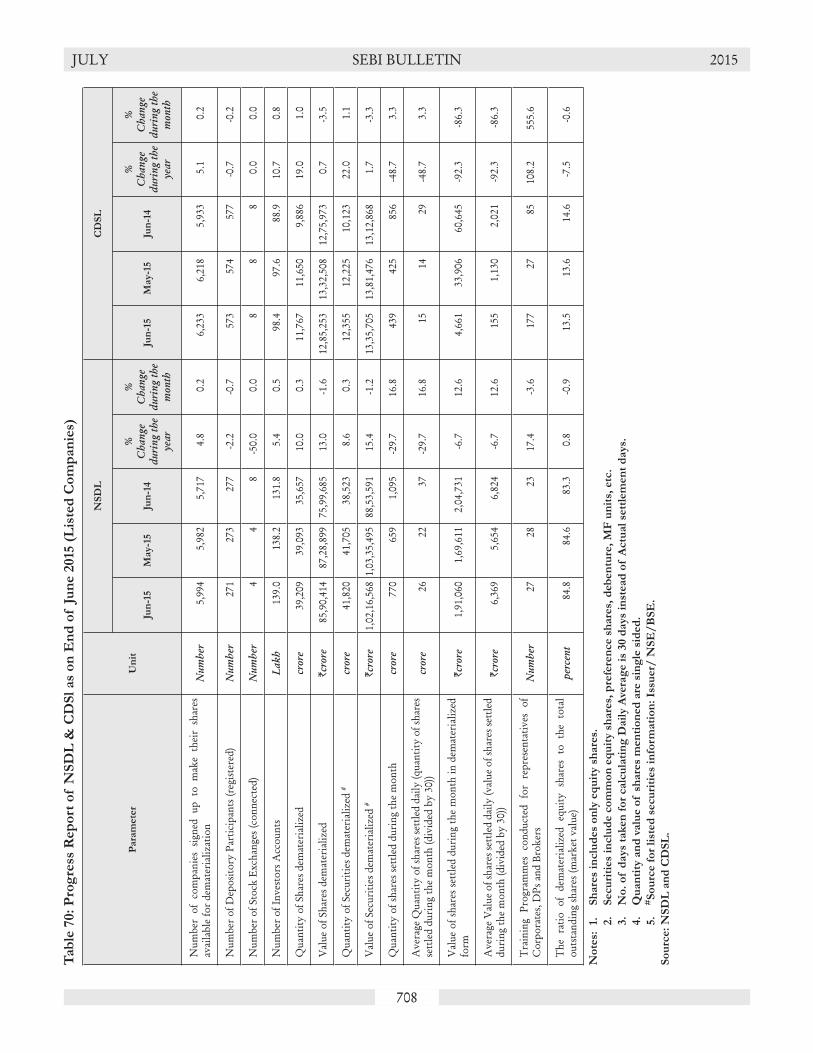
708
JULY SEBI BULLETIN 2015T
ab
le 7
0:
Pro
gre
ss R
ep
ort
of N
SD
L &
CD
Sl
as
on
En
d o
f J
un
e 2
015
(L
iste
d C
om
pan
ies)
Para
mete
rU
nit
NS
DL
CD
SL
Jun
-15
May-1
5Ju
n-1
4
%C
hang
e du
ring
the
year
%C
hang
e du
ring
the
mon
th
Jun
-15
May-1
5Ju
n-1
4
%C
hang
e du
ring
the
year
%C
hang
e du
ring
the
mon
th
Num
ber
of c
ompa
nies
sig
ned
up t
o m
ake
thei
r sh
ares
av
aila
ble
for
dem
ater
ializ
atio
nN
umbe
r5,
994
5,98
25,
717
4.8
0.2
6,23
36,
218
5,93
35.
10.
2
Num
ber
of D
epos
itory
Par
ticip
ants
(reg
ister
ed)
Num
ber
271
273
277
-2.2
-0.7
573
574
577
-0.7
-0.2
Num
ber
of S
tock
Exc
hang
es (c
onne
cted
)N
umbe
r4
48
-50.
00.
08
88
0.0
0.0
Num
ber
of In
vest
ors A
ccou
nts
Lakh
139.
013
8.2
131.
85.
40.
598
.497
.688
.910
.70.
8
Qua
ntity
of S
hare
s dem
ater
ializ
edcr
ore
39,2
0939
,093
35,6
5710
.00.
311
,767
11,6
509,
886
19.0
1.0
Val
ue o
f Sha
res d
emat
eria
lized
`cro
re85
,90,
414
87,2
8,89
975
,99,
685
13.0
-1.6
12,8
5,25
313
,32,
508
12,7
5,97
30.
7-3
.5
Qua
ntity
of S
ecur
ities
dem
ater
ializ
ed #
cror
e41
,820
41,7
0538
,523
8.6
0.3
12,3
5512
,225
10,1
2322
.01.
1
Val
ue o
f Sec
uriti
es d
emat
eria
lized
#`c
rore
1,02
,16,
568
1,03
,35,
495
88,5
3,59
115
.4-1
.213
,35,
705
13,8
1,47
613
,12,
868
1.7
-3.3
Qua
ntity
of s
hare
s set
tled
duri
ng th
e m
onth
cror
e77
065
91,
095
-29.
716
.843
942
585
6-4
8.7
3.3
Ave
rage
Qua
ntity
of s
hare
s set
tled
daily
(qua
ntity
of s
hare
s se
ttle
d du
ring
the
mon
th (d
ivid
ed b
y 30
))cr
ore
2622
37-2
9.7
16.8
1514
29-4
8.7
3.3
Val
ue o
f sha
res s
ettle
d du
ring
the
mon
th in
dem
ater
ializ
ed
form
`cro
re1,
91,0
601,
69,6
112,
04,7
31-6
.712
.64,
661
33,9
0660
,645
-92.
3-8
6.3
Ave
rage
Val
ue o
f sha
res s
ettle
d da
ily (v
alue
of s
hare
s set
tled
duri
ng th
e m
onth
(div
ided
by
30))
`cro
re6,
369
5,65
46,
824
-6.7
12.6
155
1,13
02,
021
-92.
3-8
6.3
Tra
inin
g Pr
ogra
mm
es c
ondu
cted
for
rep
rese
ntat
ives
of
Cor
pora
tes,
DPs
and
Bro
kers
Num
ber
2728
2317
.4-3
.617
727
8510
8.2
555.
6
The
rat
io o
f de
mat
eria
lized
equ
ity s
hare
s to
the
tot
al
outs
tand
ing
shar
es (m
arke
t val
ue)
perc
ent
84.8
84.6
83.3
0.8
-0.9
13.5
13.6
14.6
-7.5
-0.6
No
tes:
1.
S
hare
s in
clu
des
on
ly e
qu
ity s
hare
s.
2.
S
ecu
riti
es
inclu
de c
om
mo
n e
qu
ity s
hare
s, p
refe
ren
ce s
hare
s, d
eben
ture
, M
F u
nit
s, e
tc.
3.
N
o.
of d
ays
tak
en
fo
r calc
ula
tin
g D
ail
y A
vera
ge i
s 30 d
ays
inst
ead
of A
ctu
al
sett
lem
en
t d
ays.
4.
Q
uan
tity
an
d v
alu
e o
f s
hare
s m
en
tio
ned
are
sin
gle
sid
ed
.
5.
#S
ou
rce f
or
list
ed
secu
riti
es
info
rmati
on
: Is
suer/
NS
E/
BS
E.
So
urc
e:
NS
DL
an
d C
DS
L.

709
JULY SEBI BULLETIN 2015T
ab
le 7
1: P
rog
ress
of D
em
ate
riali
sati
on
at
NS
DL
an
d C
DS
L (
Lis
ted
an
d U
nli
sted
Co
mp
an
ies)
Year/
Mo
nth
NS
DL
CD
SL
Co
mp
an
ies
Liv
eD
Ps
Liv
eD
Ps
Lo
cati
on
s
Dem
at
Qu
an
tity
(mil
lio
n s
ecu
riti
es)
Dem
at
Valu
e
(` c
rore
)C
om
pan
ies
Liv
eD
Ps
Liv
eD
Ps
Lo
cati
on
s
Dem
at
Qu
an
tity
(mil
lio
n s
ecu
riti
es)
Dem
at
Valu
e
(` c
rore
)
2014
-15
13,9
92
273
15,9
60
9,2
7,3
57
1,17
,48,3
159,3
99
574
11,8
77
2,0
6,0
1213
,94,2
64
2015
-16$
14,4
49
271
17,1
37
9,6
3,0
76
1,17
,04,1
62
9,5
49
573
12,1
83
2,1
1,17
814
,21,
673
Apr
-15
14,2
0027
316
,849
9,37
,777
1,15
,19,
700
9,45
257
411
,944
2,08
,782
13,9
4,83
3
May
-15
14,3
1927
316
,900
9,53
,758
1,18
,12,
484
9,50
357
412
,050
2,09
,355
14,6
1,12
4
Jun-
1514
,449
271
17,1
379,
63,0
761,
17,0
4,16
29,
549
573
12,1
832,
11,1
7814
,21,
673
No
tes
: 1
. F
or
CD
SL
, th
e c
urr
en
t an
d h
isto
rical
data
of C
om
pan
ies
Liv
e h
as
been
revis
ed
to
exclu
de M
F s
ch
em
es
co
un
t.
2.
Th
e C
om
pan
ies
Liv
e f
igu
re i
nclu
des
on
ly t
he n
um
ber
of m
utu
al
fun
d c
om
pan
ies
an
d n
ot
the m
utu
al
fun
d s
ch
em
es.
3.
DP
s L
ocati
on
s’ r
ep
rese
nts
th
e t
ota
l li
ve (
main
DP
s an
d b
ran
ch
DP
s as
well
as
no
n-l
ive (
back
off
ice c
on
necte
d c
oll
ecti
on
cen
tres)
.
$ i
nd
icate
s as
on
Ju
ne 3
0,
2015
.
So
urc
e:
NS
DL
an
d C
DS
L.
Tab
le 7
2:
Dep
osi
tory
Sta
tist
ics
for
Jun
e 2
015
Part
icu
lars
Un
itD
ebt
Eq
uit
yO
thers
To
tal
Lis
ted
Un
list
ed
Lis
ted
Un
list
ed
Lis
ted
Un
list
ed
Lis
ted
Un
list
ed
NS
DL
Issu
ers
(deb
t)/
Co
mp
an
ies(
eq
uit
y),
wh
o h
ave
iss
ued
th
e a
cti
ve
inst
um
en
tN
umbe
r64
071
45,
994
6,50
753
2,58
46,
687
9,80
5
Acti
ve I
nst
rum
en
tsN
umbe
r9,
529
3,71
412
,016
6,94
15,
808
23,2
0427
,353
33,8
59
Dem
ate
riali
sed
Qu
an
tity
Lakh
15,0
012,
17,6
3439
,20,
942
44,5
9,84
02,
46,0
117,
71,3
3541
,81,
954
54,4
8,80
9
Dem
ate
riali
sed
Valu
e`c
rore
15,9
4,19
52,
03,9
0785
,90,
414
4,23
,022
31,9
598,
60,6
651,
02,1
6,56
814
,87,
594
Qu
an
tity
sett
led
du
rin
g t
he m
on
thLa
kh1,
561
4,15
276
,990
33,
511
359
82,0
624,
514
Valu
e S
ett
led
du
rin
g t
he m
on
th`c
rore
2,07
,590
11,7
121,
91,0
602
1,03
286
3,99
,682
11,8
00
CD
SL
Issu
ers
(deb
t)/
Co
mp
an
ies(
eq
uit
y),
wh
o h
ave
iss
ued
th
e a
cti
ve
inst
um
en
tN
umbe
r49
420
56,
233
1,99
92,
608
333
9,33
52,
537
Acti
ve I
nst
rum
en
tsN
umbe
r18
,725
4,03
08,
449
2,41
434
,920
5,20
562
,094
11,6
49
Dem
ate
riali
sed
Qu
an
tity
Lakh
1,73
48,
851
11,7
6,74
67,
47,9
6756
,996
1,19
,488
12,3
5,47
68,
76,3
06
Dem
ate
riali
sed
Valu
e`c
rore
37,2
3316
,345
12,8
5,25
357
,419
13,2
1812
,204
13,3
5,70
585
,968
Qu
an
tity
sett
led
du
rin
g t
he m
on
thLa
kh1
043
90
330
473
0
Valu
e S
ett
led
du
rin
g t
he m
on
th`c
rore
120
4,66
10
330
4,70
60
No
te:
Th
e c
ate
go
ries
inclu
ded
in
Oth
ers
are
Pre
fere
nce S
hare
s, M
utu
al
Fu
nd
Un
its,
Warr
an
ts,
PT
Cs,
Tre
asu
ry B
ills
, C
Ps,
CD
s an
d G
ove
rnm
en
t S
ecu
riti
es.
So
urc
e:
NS
DL
an
d C
DS
L.

710
JULY SEBI BULLETIN 2015
Table 73: Macro Economic Indicators
I. GDP at constant prices (2011-12 prices) for 2014-15 (`crore)* 1,06,56,925
II. Gross Saving as a percent of Gross national Disposable Income at current market prices in 2013-14 30.0
III. Gross Capital Formation as a percent of GDP at current market prices in 2013-14 32.3
IV. Monetary and Banking IndicatorsFebruary March April May June
2015 2015 2015 2015 2015
Cash Reserve Ratio (percent) 4.0 4.0 4.0 4.0 4.0
Repo Rate (percent) 7.8 7.5 7.5 7.5 7.25
Money Supply (M3) (` crore) 1,04,38,240 1,08,80,100 1,07,53,090 1,08,39,380 1,08,51,990
Aggregate Deposit (` crore) 84,74,820 85,85,640 85,85,640 87,89,270 87,98,540
Bank Credit (` crore) 69,22,060 65,64,680 66,03,920 66,33,420 66,59,330
V. Interest Rate
Call Money Rate (Weighted Average) 7.7 9.2 8.5 7.5 7.1
91-Day-Treasury Bill (Primary Yield) 8.4 7.9 8.9 7.9 7.7
Base rate (percent) 10-10.26 10-10.25 10-10.25 9.8-10.0 9.7-10.0
Term Deposit Rate > 1 year (Maximum) 8.8 8.8 8.8 8.5 8.5
VI. Capital Market Indicators (`crore)
Turnover (BSE+NSE) 4,71,128 4,77,491 4,77,491 4,22,540 3,93,660
Market Cap-BSE 1,04,66,661 1,01,49,290 1,01,49,290 1,03,26,686 1,01,43,511
Market Cap-NSE 1,02,12,614 99,30,122 99,30,122 1,00,20,665 98,49,076
Net FPI Investment in Equity 11,476 12,078 12,078 -5,768 -3,344
VII. Exchange Rate and Reserves
Forex Reserves (USD million) 338,079 343,005 344,606 352,714 355,222
Re/ Dollar 61.8 62.6 62.6 63.8 63.6
Re/Euro 69.3 67.5 67.5 69.9 71.2
Forward Premia of USD 6-month 8.0 7.7 7.7 7.1 7.2
VIII. Public Borrowing and Inflation
Govt. Market Borrowing-Gross (` crore) 2015-16 5,92,000 5,92,000 5,20,000 1,28,000 1,74,000
Wholesale Price Index (2004-05=100) 175.8 176.1 176.0 177.7 178.6
Consumer Price Index (2012 =100) 119.7 120.2 120.7 121.6 123.0
IX. Index of Industrial Production (y-o-y) percent
(Base year 2004-05 = 100)
General 181.1 197.3 178.5 180.0 NA
Mining 129.9 148.5 122.8 128.8 NA
Manufacturing 192.8 209.3 189.1 187.5 NA
Electricity 166.0 176.4 177.2 195.0 NA
X. External Sector Indicators (USD million)
Exports 21,545 23,884 22,055 22,347 22,289
Imports 28,392 35,392 33,047 32,753 33,117
Trade Balance -6,847 -11,509 -10,992 -10,406 -10,827
Notes: 1. * Advance estimates; Data as per the new series released by MOSPI
2. CPI Data ia being released on Base 2012=100 from January 2015 by MOSPI (Data for december revised)
3. NA: Not Avaliable.
Source : RBI, MOSPI, Ministry of Commerce & Industry.

711
JULY SEBI BULLETIN 2015
PUBLICATIONS
1. Annual Report : 2013-14
2. Handbook of Statistics on Indian Securities Market, 2014
The above publications are available on SEBI website http://www.sebi.gov.in/sebiweb/home/section/4/
News-and-Publications.
Those interested in printed copies of the above may contact Publication Division, Department of Economic and
Policy Analysis of SEBI to obtain a copy of Annual Report/Handbook of Statistics at the following address:
Publication Division
Department of Economic and Policy Analysis
Securities and Exchange Board of India
Plot No. C4-A, ‘G’ Block,
Bandra Kurla Complex,
Bandra (E), Mumbai-400051
Tel no. +91-2226449000
Fax no. +91-2226449021