SEB Investor Lunch Presentation Nov 2008
15
Lunch presentation November 27 2008 Annika Falkengren CEO
-
Upload
sebgroup -
Category
Economy & Finance
-
view
5.030 -
download
4
Transcript of SEB Investor Lunch Presentation Nov 2008

Lunch presentation
November 272008
Annika FalkengrenCEO

2
Highlights Q3 2008Resilient underlying business; collective provisions in the BalticsNegative financial effects due to financial crisisAccelerated cost management due to economic downturn
Financial crisis impacts profit…
* Excluding sales of Baltic properties in Q4 2007 of SEK 785mand reclassification of portfolios
0
1,000
2,000
3,000
4,000
5,000
Q12007
Q2 Q3 Q4 Q12008
Q2 Q3
Lehman Brothers-related lossesPortfolio lossesReported operating profit*
…but underlying income generation is stable
** Net financial income, Net insurance income and Other income
0
2,000
4,000
6,000
8,000
10,000
Q12007
Q2 Q3 Q4 Q12008
Q2 Q3
Other income**Net fee and commission incomeNet interest income
*
3
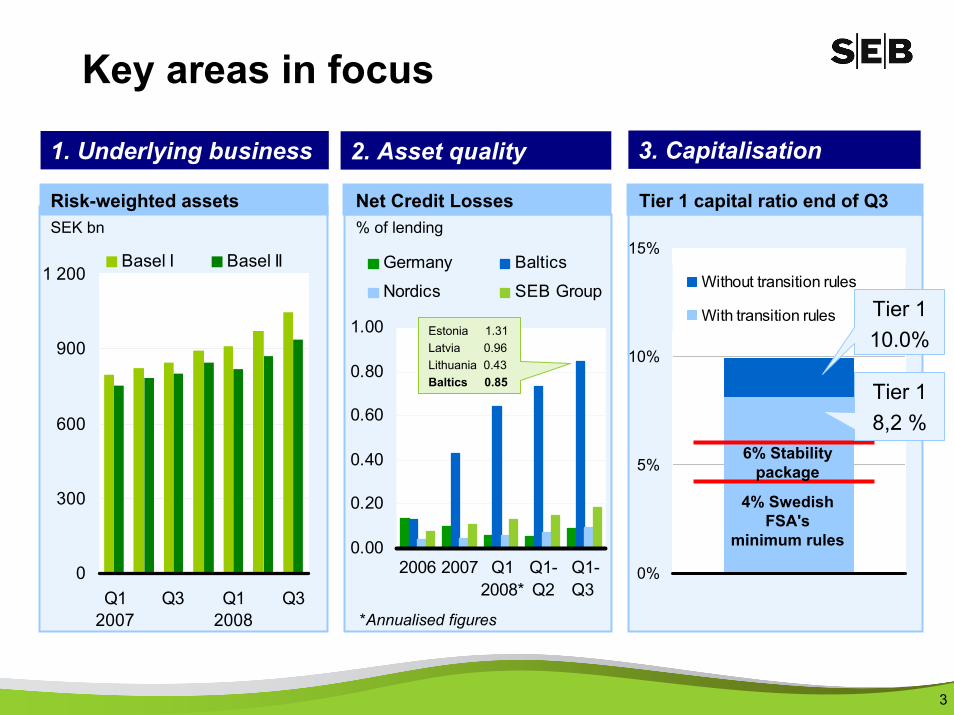
Key areas in focus
0.00
0.20
0.40
0.60
0.80
1.00
2006 2007 Q12008*
Q1-Q2
Q1-Q3
Germany Baltics
Nordics SEB Group
Net Credit Losses % of lending
Estonia 1.31Latvia 0.96Lithuania 0.43Baltics 0.85
*Annualised figures
Tier 1 capital ratio end of Q3Risk-weighted assetsSEK bn
0
300
600
900
1 200
Q12007
Q3 Q12008
Q3
Basel I Basel II
1. Underlying business 2. Asset quality 3. Capitalisation
0%
5%
10%
15%
Without transition rules
With transition rules
4% SwedishFSA's
minimum rules
6% Stabilitypackage
Tier 1 10.0%
Tier 1 8,2 %

4
… maybe 4 - Guarantee pricing in the Swedish stability package
Unsecured <1 year: 50bpsUnsecured >1 year: 50bps+28bps (CDS) = 78bps (+25bps)Covered bonds: 25bps+ ~10bps (AAA-CDS) = ~35bps
Maximum scope: for each bank: its outstanding debt maturing until April 30th, 2009; for the system: SEK 1,500bn
Participating banks to pay a risk-based fee for the guarantee; Fee level: somewhere between today's funding costs in the market and the notional funding costs under normal market circumstances
Allowed instruments: senior term debt with maturities between 3 months and 5 years, including covered bonds!

5
Resilient underlying business
0
50
100
150
200
250
300
350
400
450
500
"Nord
ic" La
rger C
lients
German
Large
r Clie
ntsBalt
ic Clie
nts
Swedish
Reta
il Clie
nts
Other
Corporate credit exposureSEK m , Q4-06, Q2-07, Q4-07, Q2-Q3-08
12.010.7 9.7
12.0 13.3 11.9 10.7
Q1-07 Q2 Q3 Q4 Q1-08 Q2 Q3
Swedish mutual funds – Net inflowsJan-Sep, SEK bn
-7.3-11.6
-1.1
-17.0
5.9
Robur SHB Nordea SEB Others
Life – Total salesSEK bn

6
Asset quality
Nordics66%
Group credit exposureTotal exposure = SEK 1,805bn
Germany24%
Baltics - Provisioning to build up reservesSEK m
Impaired Loans Volumes % of Credit Portfolio
0%
1%
2%
3%
Mar'06
Jun'06
Sep'06
Dec'06
Mar'07
Jun'07
Sep'07
Dec'07
Mar'08
Jun'08
Sep'08
SEB Group GermanyNordic Baltic
1.5%1.4%
0.6%0.2%
Lithuania5% Latvia
2%
Estonia3%
-50
50
150
250
350
Q4-07 Q1-08 Q2-08 Q3-08
Specific Collective

7
Baltic countries – Estonia Credit exposureSEK bn
Lending market shares % of lending
SEB facts
17 22 22
88 8
1419 20
Dec '06 Dec '07 Sep '08
BanksPublic AdministrationHouseholdsProperty ManagementCorporate
2006 2007 2008 YTD+38% +17% +1%
Growth rate i LCY
4150 52
SEBSwedbankSampo (no longer published)
0%
10%
20%
30%
40%
50%
Q105
Q3 Q106
Q3 Q107
Q3 Q108
Q3
723,000 private customers70,000 corporate customers~1,550 FTEs (present)60 branches
0
500
1,000
1,500
2005 2006 2007 9m2008
Pre-provision profit Operating profit
SEB performance, SEK m

8
Baltic countries – Latvia Credit exposureSEK bn
Lending market shares % of lending
SEB facts
18 21 224 5 610
14 14
Dec '06 Dec '07 Sep '08
BanksPublic AdministrationHouseholdsProperty ManagementCorporate
2006 2007 2008 YTD+40% +18% +4%
Growth rate i LCY
3441 44
0%
10%
20%
30%
40%
50%
Q105
Q3 Q106
Q3 Q107
Q3 Q108
Q3
SEBSwedbankDnB NordParex BankaSampo/DanskeNordea
929,000 private customers65,000 corporate customers~1,750 FTEs (present)65 branches
0
500
1,000
1,500
2005 2006 2007 9m2008
Pre-provision profit Operating profit
SEB performance, SEK m

9
Baltic countries – Lithuania Credit exposureSEK bn
Lending market shares % of lending
SEB facts
34 39 458
13 151322
26
Dec '06 Dec '07 Sep '08
BanksPublic AdministrationHouseholdsProperty ManagementCorporate
2006 2007 2008 YTD+47% +30% +13%
Growth rate i LCY
56
7689
0%
10%
20%
30%
40%
50%
Q105
Q3 Q106
Q3 Q107
Q3 Q108
Q3
SEBSwedbankDnB NordSampo/DanskeNordea
992,000 private customers61,000 corporate customers~2,200 FTEs (present)76 branches
0
500
1,000
1,500
2005 2006 2007 9m2008
Pre-provision profit Operating profit
SEB performance, SEK m

10
Notes:1 Swedbank: Including SEK 12.5bn capital rasing announced 27 October 20082 Danske: only reports tier 1 ratio under full Basel II3 DnB NOR: RWA adjusted for life insurance impact (life insurance assets risk weighted under statutory disclosure) to allow comparison
10.5 10.1 10.0 10.09.4
7.9
6.7
8.28.27.3 7.0
Swedbank Danske Bank SEB SHB DnB NOR Nordea
Tier 1 ratio - Full Basel II Tier 1 ratio - Basel II transition rules
Nordic capital ratiosTier 1 capital ratio reported Q3 2008 (%)

11
Financial effects in Q3 2008
Net financial income SEK +516m Operating profit SEK +516mNet profit SEK +372mTotal equity SEK +1,797mRWA– Basel I: SEK +5.3bn– Basel II: SEK -1.1bnCore capital ratio and Total capital ratio marginally affected
Reclassification of fixed income portfolios in Q3 2008
Q3 08
8 11
50
39
36
1
14
ABS Financialinstitutions
Coveredbonds etc.
After reclassification
Held for trading (MTM over income)
Available for sale (MTM over equity)
Loans & Receivables (No MTM, impairment tests)

12
Business update
Corporate lending growth continues – core clients, better structures and higher margins
Household mortgage lending decelerates
Stable long-term savings
SEB Equities continues to gain market shares and FX trading still strong
Transaction numbers still on very high level
Private individuals remain cautious and seek advise – creates opportunities
Investment portfolio remains healthy – reclassification limits volatility impact

13
Nordic Outlook
•Global recession - worst situation in 60 years•Sweden and the Nordic region import international recession •Baltic economies in for hard landing – but different degrees of recession •Central banks enter zero-rate territory•Global - partly synchronised, partly competing - stimuli from politicians
-6-30369
12
Sweden Nordics Estonia Latvia Lithuania
2007 2008 (f) 2009 (f) 2010 (f)
Annual GDP growthPer cent
Key themes

14
Going forward
● Holistic balance sheet management
● Robust capital and good liquidity
● Resilient customer business
● Cost management

1515