Seattle’s Fixed Camera School Zone Speed...
14
June 13, 2013 1 Seattle’s Fixed Camera School Zone Speed Enforcement Pilot: Preliminary Data Review June 13, 2013 Executive Summary In December 2012, the City of Seattle began using fixed cameras to enforce the school zone speed limit at four elementary schools. This report summarizes the pilot program and provides a snapshot of the first four months of data. More data, collected over a period of time, will be needed to draw conclusions about the long-term effectiveness of the program. This report also describes the importance of addressing speeding, reviews the status of the mobile camera enforcement van (speed van), provides revenue information, and identifies potential next steps for the camera program and for other school road safety efforts (pending funding). The camera technology and citation process are explained in Appendix A. Speed van statistics are found in Appendix B. In the four months for which data is available: A total of 24,336 citations were issued by the school zone cameras between December 10 and April 27. This compares to 20,135 moving violations issued by the Seattle Police Department (SPD) in 2012. There is a slight downward trend in the number of citations issued per week, which may indicate that fewer drivers are speeding, but more data will be needed to draw any conclusions about long-term results. 1. Why Speeding Matters Speed is a persistent traffic safety issue. Speeding contributes to one out of every three collisions in Seattle and was a factor in 42 percent of fatal collisions between 2006 and 2010. Speeding increases the severity of collisions and is especially lethal for pedestrians and people on bicycles. A pedestrian hit by a vehicle going 30 miles per hour has a 45 percent chance of dying, while 95 percent of pedestrians hit at 20 miles per hour are likely to survive. The school zone speed limit of 20 miles per hour allows drivers more time to recognize students, who can be more difficult to see and can behave unpredictably, and reduces the time and distance it takes a driver to bring his or her vehicle to a stop. At 30 miles per hour, emergency stopping distance is just over 130 feet; at 20 miles per hour, it is about 60 feet.
Transcript of Seattle’s Fixed Camera School Zone Speed...
June 13, 2013 1
Seattle’s Fixed Camera School Zone Speed Enforcement Pilot: Preliminary Data Review
June 13, 2013
Executive Summary In December 2012, the City of Seattle began using fixed cameras to enforce the school zone speed limit at four elementary schools. This report summarizes the pilot program and provides a snapshot of the first four months of data. More data, collected over a period of time, will be needed to draw conclusions about the long-term effectiveness of the program. This report also describes the importance of addressing speeding, reviews the status of the mobile camera enforcement van (speed van), provides revenue information, and identifies potential next steps for the camera program and for other school road safety efforts (pending funding). The camera technology and citation process are explained in Appendix A. Speed van statistics are found in Appendix B. In the four months for which data is available:
A total of 24,336 citations were issued by the school zone cameras between December 10 and April 27. This compares to 20,135 moving violations issued by the Seattle Police Department (SPD) in 2012.
There is a slight downward trend in the number of citations issued per week, which may indicate that fewer drivers are speeding, but more data will be needed to draw any conclusions about long-term results.
1. Why Speeding Matters
Speed is a persistent traffic safety issue. Speeding contributes to one out of every three collisions in Seattle and was a factor in 42 percent of fatal collisions between 2006 and 2010. Speeding increases the severity of collisions and is especially lethal for pedestrians and people on bicycles. A pedestrian hit by a vehicle going 30 miles per hour has a 45 percent chance of dying, while 95 percent of pedestrians hit at 20 miles per hour are likely to survive. The school zone speed limit of 20 miles per hour allows drivers more time to recognize students, who can be more difficult to see and can behave unpredictably, and reduces the time and distance it takes a driver to bring his or her vehicle to a stop. At 30 miles per hour, emergency stopping distance is just over 130 feet; at 20 miles per hour, it is about 60 feet.
June 13, 2013 2
2. Fixed Camera Enforcement Effectiveness
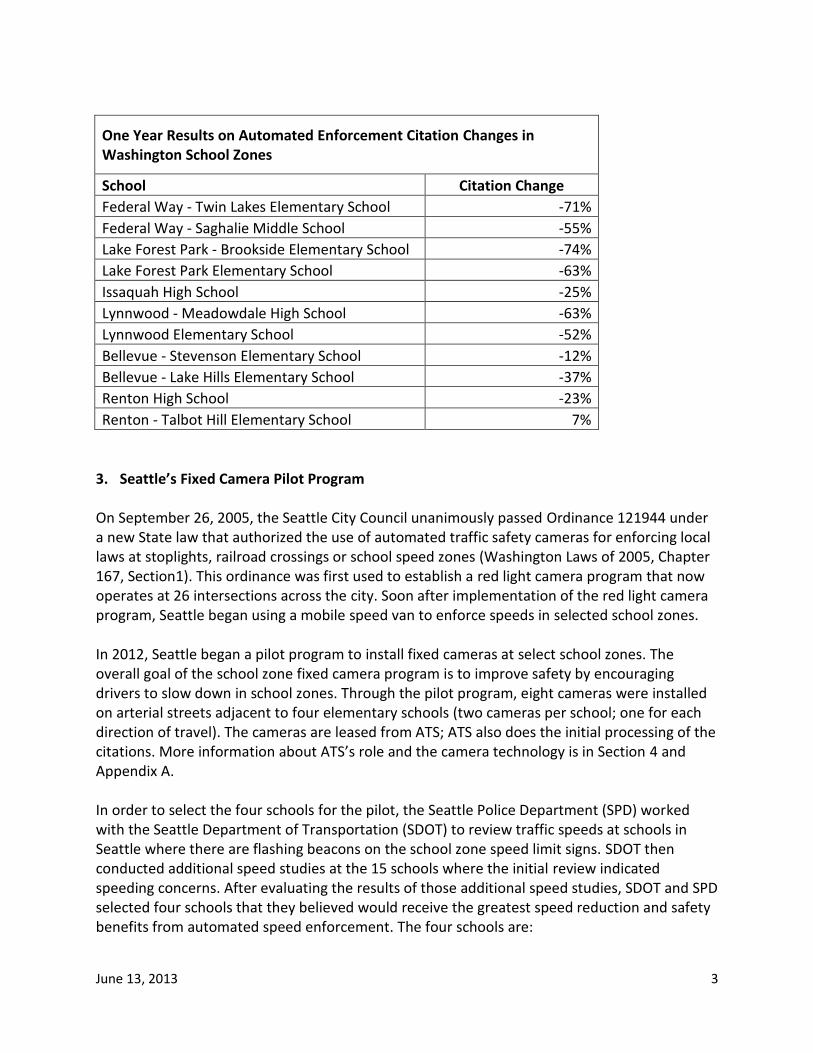
Numerous studies have found that properly deployed speed cameras reduce speeding.1 Existing research also indicates that automated enforcement systems can result in measurable safety improvements at high crash locations. In 2007, The National Highway Traffic Safety Administration (NHTSA) reviewed thirteen studies of automated speed enforcement, all of which reported decreases in estimated injury crashes, all crashes or speed related crashes at camera sites or system wide following implementation of automated speed enforcement using cameras.2 About half of the studies also documented reduction in speeds, suggesting relationship between the treatment and the observed safety effect. However, because of confounding factors and differences in study methodologies, no single number is thought to best represent the safety effect of automated speed enforcement. Outside the United States, countries with longer histories of using speed safety cameras as part of their enforcement programs have reported reductions in speed-related fatalities of 15 to 20 percent.3 In the State of Washington, several jurisdictions have implemented fixed cameras at school zones including the cities of Longview, Lynnwood, Federal Way, Bellevue, Issaquah, Renton and Lake Forest Park. Longview and Renton have recently completed evaluations of their fixed speed school zone camera efforts. Most cases found significant reductions in the number of citations that were issued to drivers over the course of the programs. The City of Renton’s study concludes that “In each location where photo enforcement cameras are positioned it has reduced the risk of fatal, serious injury, injury and property damage to our citizens.” The table below was created using data from Automated Traffic Solutions (ATS), the camera vendor used by all of the cities in Washington that have school zone speed cameras. It averages the first two months of implementation, and compares with the same two months one year later. When the reduction is not as dramatic, it appears to be due to the fact that the cameras began operating at the beginning of the school year. One year later, there tends to be another increase in citations when cameras come back into use after being inoperative over the summer. In any case, given the dramatic reductions in other locations after one year, it appears that it takes drivers some time to learn of the cameras and adjust their behavior. This may explain why the majority of Seattle’s cameras have not yet seen significant reductions such as the 52 to 74 percent reduction in citations seen in Lynnwood, Federal Way, and Lake Forest Park over the period of a year.
1 See Speed Cameras: An Effectiveness and a Policy Review, Center for Transportation Study, Texas Transportation
Institute, May 2006 2 See NHTSA Automated Enforcement: A Compendium of Worldwide Evaluation of Results, 2007.
3 See The National Academies. “Achieving Traffic Safety Goals in the United States. Lessons from Other Nations.”
2010.
June 13, 2013 3
One Year Results on Automated Enforcement Citation Changes in Washington School Zones
School Citation Change
Federal Way - Twin Lakes Elementary School -71%
Federal Way - Saghalie Middle School -55%
Lake Forest Park - Brookside Elementary School -74%
Lake Forest Park Elementary School -63%
Issaquah High School -25%
Lynnwood - Meadowdale High School -63%
Lynnwood Elementary School -52%
Bellevue - Stevenson Elementary School -12%
Bellevue - Lake Hills Elementary School -37%
Renton High School -23%
Renton - Talbot Hill Elementary School 7%
3. Seattle’s Fixed Camera Pilot Program On September 26, 2005, the Seattle City Council unanimously passed Ordinance 121944 under a new State law that authorized the use of automated traffic safety cameras for enforcing local laws at stoplights, railroad crossings or school speed zones (Washington Laws of 2005, Chapter 167, Section1). This ordinance was first used to establish a red light camera program that now operates at 26 intersections across the city. Soon after implementation of the red light camera program, Seattle began using a mobile speed van to enforce speeds in selected school zones. In 2012, Seattle began a pilot program to install fixed cameras at select school zones. The overall goal of the school zone fixed camera program is to improve safety by encouraging drivers to slow down in school zones. Through the pilot program, eight cameras were installed on arterial streets adjacent to four elementary schools (two cameras per school; one for each direction of travel). The cameras are leased from ATS; ATS also does the initial processing of the citations. More information about ATS’s role and the camera technology is in Section 4 and Appendix A. In order to select the four schools for the pilot, the Seattle Police Department (SPD) worked with the Seattle Department of Transportation (SDOT) to review traffic speeds at schools in Seattle where there are flashing beacons on the school zone speed limit signs. SDOT then conducted additional speed studies at the 15 schools where the initial review indicated speeding concerns. After evaluating the results of those additional speed studies, SDOT and SPD selected four schools that they believed would receive the greatest speed reduction and safety benefits from automated speed enforcement. The four schools are:
June 13, 2013 4
Broadview-Thomson K-8 School on Greenwood Avenue N and N 132nd Street
Gatewood Elementary on Fauntleroy Way SW and SW Myrtle Street
Olympic View Elementary on 5th Avenue NE and NE 95th Street
Thurgood Marshall Elementary on Martin Luther King Way and S Judkins Street On November 1, 2012, the cameras began issuing advisory warnings (without monetary penalty) to drivers who exceeded the 20 mph speed limit in the school zone when the warning beacons were flashing. This was part of the City’s educational outreach to motorists and the general public. The City also distributed more than 2,000 flyers at the affected schools, translated into seven languages, to raise awareness about the photo enforcement system. The cameras began issuing citations on December 10, 2012, at which time drivers exceeding the speed limit received $189 speeding citations under RCW 46.63.170. Drivers are not cited at 21 mph, but rather at a violation trigger speed (VTS) that allows some cushion to accommodate slight variations in speedometer readings or other potential technical issues. The $189 citation cost is the same cost as a speeding citation issued on-site by a SPD officer. Also during this time, an Interdepartmental Team (IDT) was formed to provide oversight to this program, including developing this report. The IDT consists of members from the City Budget Office, Department of Finance and Administrative Services, Police Department and Seattle Department of Transportation. 4. Role of American Traffic Solutions and City Departments in the Pilot
American Traffic Solutions (ATS) is a turn-key vender that provides all camera services, including installation costs, citation services and data, and legal support for a lease fee of $4,750 per camera per month. At this time, it does not charge a per-ticket fee or levy any other costs. ATS works with SDOT and Seattle City Light to prepare camera designs and acquire permits to install the cameras and loops and connect them to the beacons and power. ATS is responsible for mailing out all citations that are deemed valid by SPD officers (see Appendix A for a description of this process and of the camera system). It maintains all back-end hardware and software systems to facilitate this process as well as to supply data about citations. ATS also provides legal and legislative support to help cities prosecute tickets or keep current with the requirements of the Revised Code of Washington. ATS provides the cameras and the services described above, and SPD, SDOT and the Municipal Court are responsible for other elements of installing and maintaining the system and processing citations, including:
SPD funds two police officers for citation review at SPD for the automated enforcement program as a whole, as well as approximately 2,076 overtime hours for speed van operation and other activities. No less than one officer is needed to review the citations
June 13, 2013 5
for the fixed cameras. SPD also funds part of one strategic advisor for program management.
SDOT is responsible for installing or upgrading the flashing beacons that are required as part of the camera enforcement system, assisting with determination of camera locations, camera design and permitting, installing required signage, and repairing pavement if needed. SDOT also works with SPD on outreach and education related to the program, and is responsible for ongoing beacon maintenance.
The Seattle Municipal Court processes citations, appeals, and revenue collection. 5. Seattle’s Mobile Automated Enforcement Program (Speed Van)
Since the beginning of 2013, SPD has used its speed van, which is a mobile version of the fixed cameras, to issue 1,440 citations in school zones. Due to legal issues related to the radar certification and ongoing equipment problems with the strobe flash, the speed van was not deployed for approximately four weeks between mid-February and mid-March. The data that is collected and regularly reported to Council is reflected in Appendix B of this report. As Seattle develops an ongoing school zone camera enforcement program, defining the role of the speed van will be part of the scope. Some factors to consider include:
availability of curbside parking for the speed van;
time needed to install permanent, fixed cameras and whether a more immediate approach is warranted;
time needed to change driver behavior;
reliability of the equipment; and
operational costs of an officer staffing a van versus reviewing on-line fixed camera citations.
In most cases, the fixed cameras will best address these issues. However, in some specific situations the speed van may be the more appropriate technology. Seattle will continue to use the speed van as one strategy to address speeding in school zones. Most recently, SDOT and SPD have identified the following schools as good candidates for mobile speed enforcement, because of their adjacency to arterials, the existence of known speeding issues, and, in some cases, leveraging of Safe Routes to School programs:
Dearborn Park Elementary
Our Lady of Guadalupe Catholic School
B.F. Day Elementary
Highland Park Elementary
Sanislo Elementary
June 13, 2013 6
The van is already enforcing at Sanislo Elementary, and will begin making rotations among all the listed schools. 6. Other Road Safety Tools In addition to enforcement, the following road safety tools are also used near schools in Seattle:
School Zone Signage – SDOT has installed school zone speed limit signs and advanced warning signs at all Seattle schools, both public and private. Signs are placed in accordance with national standards.
Flashing Beacons – SDOT operates 60 sets of flashing beacons around the city to highlight the school zone speed limit. The beacons are programmed to flash during hours when most children are walking to and from school. SDOT is putting together a report to the Washington State Traffic Safety Commission on the general effectiveness of flashing beacons. Preliminary data indicates flashing beacons with photo enforced cameras are more effective than flashing beacons by themselves. Final results will be available in the summer of 2013.
Traffic Calming – SDOT has installed traffic calming devices such as speed cushions and raised crosswalks to reduce speeds. These are still considered pilot projects adjacent to schools and SDOT is studying the effects of these devices on the corridor and at the school crosswalk.
Radar Speed Signs - By displaying the speed of oncoming vehicles, these signs provide direct feedback to drivers and remind them to observe the speed limit. SDOT has found that radar speed signs generally decrease speed by approximately five miles per hour. SDOT is currently evaluating the effectiveness of radar speed signs paired with flashing school zone beacons.
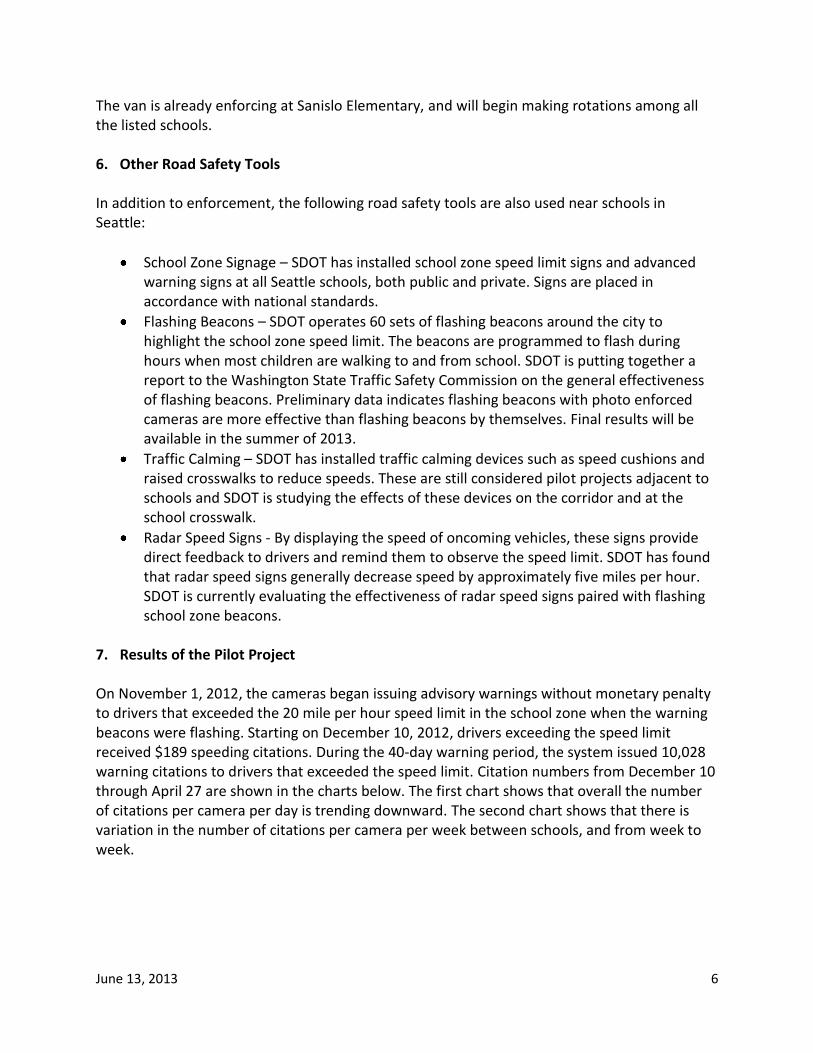
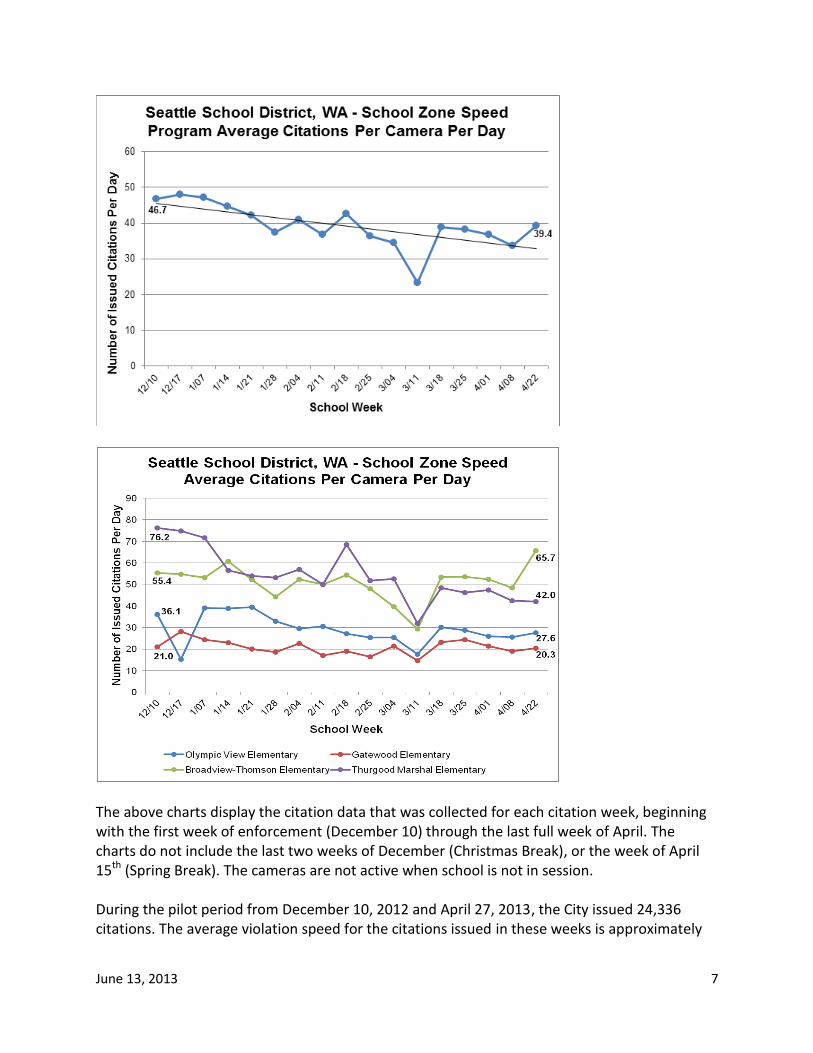
7. Results of the Pilot Project On November 1, 2012, the cameras began issuing advisory warnings without monetary penalty to drivers that exceeded the 20 mile per hour speed limit in the school zone when the warning beacons were flashing. Starting on December 10, 2012, drivers exceeding the speed limit received $189 speeding citations. During the 40-day warning period, the system issued 10,028 warning citations to drivers that exceeded the speed limit. Citation numbers from December 10 through April 27 are shown in the charts below. The first chart shows that overall the number of citations per camera per day is trending downward. The second chart shows that there is variation in the number of citations per camera per week between schools, and from week to week.
June 13, 2013 7
The above charts display the citation data that was collected for each citation week, beginning with the first week of enforcement (December 10) through the last full week of April. The charts do not include the last two weeks of December (Christmas Break), or the week of April 15th (Spring Break). The cameras are not active when school is not in session. During the pilot period from December 10, 2012 and April 27, 2013, the City issued 24,336 citations. The average violation speed for the citations issued in these weeks is approximately
June 13, 2013 8
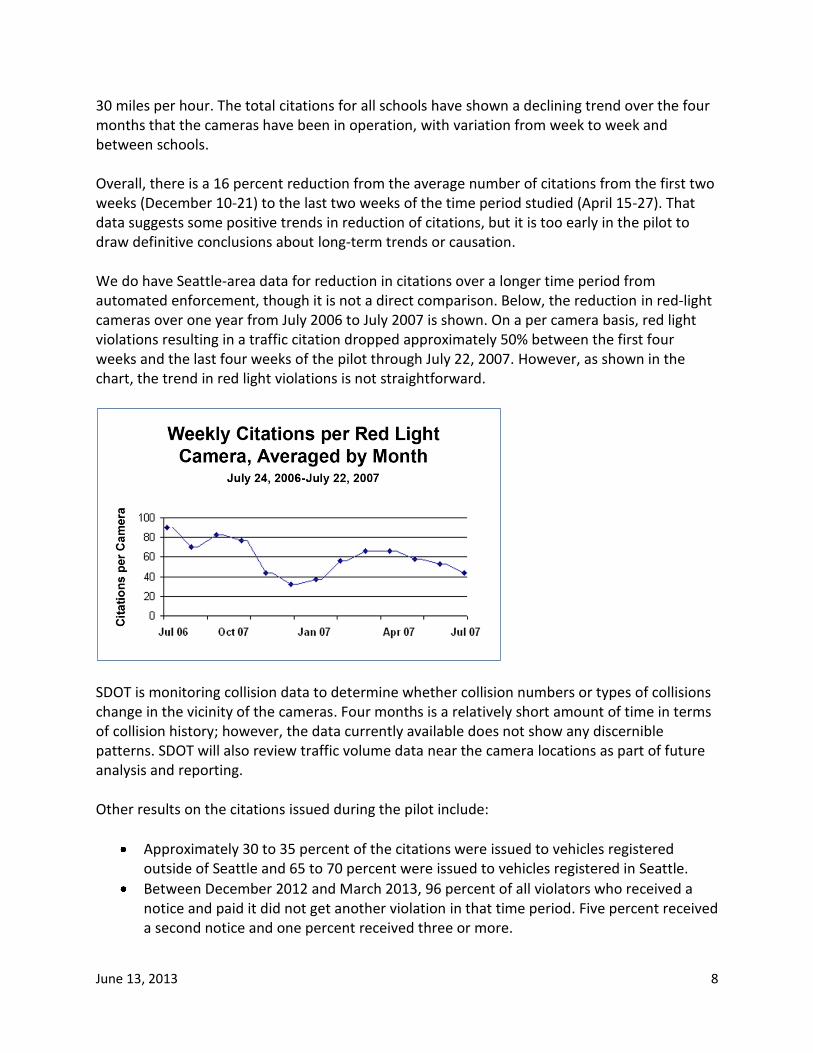
30 miles per hour. The total citations for all schools have shown a declining trend over the four months that the cameras have been in operation, with variation from week to week and between schools. Overall, there is a 16 percent reduction from the average number of citations from the first two weeks (December 10-21) to the last two weeks of the time period studied (April 15-27). That data suggests some positive trends in reduction of citations, but it is too early in the pilot to draw definitive conclusions about long-term trends or causation. We do have Seattle-area data for reduction in citations over a longer time period from automated enforcement, though it is not a direct comparison. Below, the reduction in red-light cameras over one year from July 2006 to July 2007 is shown. On a per camera basis, red light violations resulting in a traffic citation dropped approximately 50% between the first four weeks and the last four weeks of the pilot through July 22, 2007. However, as shown in the chart, the trend in red light violations is not straightforward.
SDOT is monitoring collision data to determine whether collision numbers or types of collisions change in the vicinity of the cameras. Four months is a relatively short amount of time in terms of collision history; however, the data currently available does not show any discernible patterns. SDOT will also review traffic volume data near the camera locations as part of future analysis and reporting. Other results on the citations issued during the pilot include:
Approximately 30 to 35 percent of the citations were issued to vehicles registered outside of Seattle and 65 to 70 percent were issued to vehicles registered in Seattle.
Between December 2012 and March 2013, 96 percent of all violators who received a notice and paid it did not get another violation in that time period. Five percent received a second notice and one percent received three or more.
June 13, 2013 9
8. Revenue
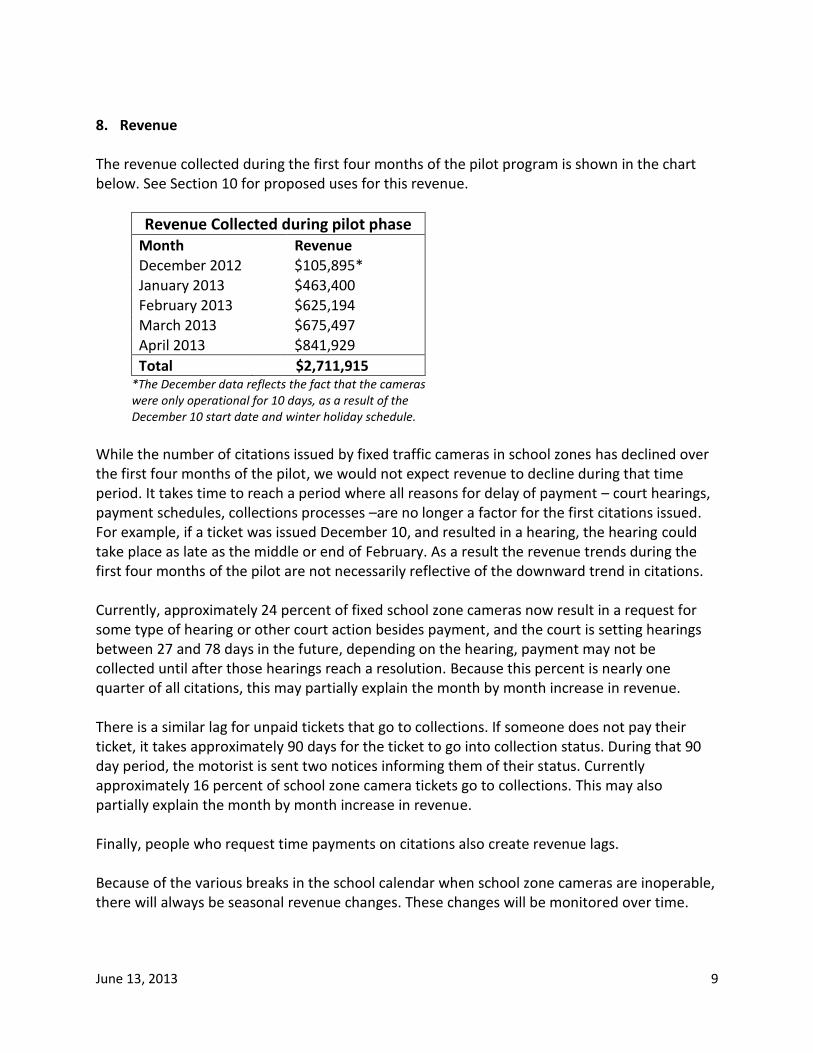
The revenue collected during the first four months of the pilot program is shown in the chart below. See Section 10 for proposed uses for this revenue.
Revenue Collected during pilot phase Month Revenue December 2012 $105,895* January 2013 $463,400 February 2013 $625,194 March 2013 $675,497
April 2013 $841,929
Total $2,711,915 *The December data reflects the fact that the cameras were only operational for 10 days, as a result of the December 10 start date and winter holiday schedule.
While the number of citations issued by fixed traffic cameras in school zones has declined over the first four months of the pilot, we would not expect revenue to decline during that time period. It takes time to reach a period where all reasons for delay of payment – court hearings, payment schedules, collections processes –are no longer a factor for the first citations issued. For example, if a ticket was issued December 10, and resulted in a hearing, the hearing could take place as late as the middle or end of February. As a result the revenue trends during the first four months of the pilot are not necessarily reflective of the downward trend in citations. Currently, approximately 24 percent of fixed school zone cameras now result in a request for some type of hearing or other court action besides payment, and the court is setting hearings between 27 and 78 days in the future, depending on the hearing, payment may not be collected until after those hearings reach a resolution. Because this percent is nearly one quarter of all citations, this may partially explain the month by month increase in revenue. There is a similar lag for unpaid tickets that go to collections. If someone does not pay their ticket, it takes approximately 90 days for the ticket to go into collection status. During that 90 day period, the motorist is sent two notices informing them of their status. Currently approximately 16 percent of school zone camera tickets go to collections. This may also partially explain the month by month increase in revenue. Finally, people who request time payments on citations also create revenue lags. Because of the various breaks in the school calendar when school zone cameras are inoperable, there will always be seasonal revenue changes. These changes will be monitored over time.
June 13, 2013 10
9. Public Response SPD and SDOT discussed the pilot project and locations with the Seattle School District, as well as the principals of the selected schools. Prior to issuing any citations, the City distributed more than 2,000 flyers at the affected schools, translated into seven languages, to raise awareness about the photo enforcement system. Feedback from the public, as indicated by calls and letters received by SDOT and SPD and by an informal review of blog comments, has been divided between those who supported the efforts to reduce speeding and increase safety, and those who were angry that they had been cited for exceeding the speed limit. Some people who received a ticket were adamant that the City was purposefully out to generate revenue. They cited the cost of the ticket ($189.00), the fact that there are few collisions with children in school zones, and that there was not enough warning. Others thought the 20 mph limit when children are present is too slow and that 30 mph is a reasonable speed. Feedback from the principals at the four schools equipped with the photo enforcement system has been mostly positive. Principals have observed more vehicles complying with the 20 mile per hour school zone speed limit than prior to the installation of the photo enforcement system. Despite the fact that citations are issued by the City, clearly documented on the citation, one school has reported that some people who have received citations in the school zone have come to the school administration looking for answers. The City is working with the schools to address this issue. 10. School Road Safety Initiative - Next Steps The primary purpose of the school zone cameras is to improve safety by reducing speeds. These school zone cameras are one strategy that is part of a larger initiative to increase road safety around schools: the School Road Safety Initiative. First announced in the Mayor’s State of the City address in February 2013, the School Road Safety Initiative has convened stakeholders (via a School Road Safety Task Force) and agency representatives to advise the City in its efforts. In April of 2013, the executive proposed legislation to alter the adopted budget in several ways impacting school road safety efforts. The proposal of funding increases is made possible due to revenue from the current school zone speed cameras. These proposals include:
The addition of $300,000 for a School Road Safety Plan
$320,000 for additional school zone speed cameras in 4-5 locations
$126,199 for automated traffic enforcement support around school zones
June 13, 2013 11
$450,000 for capital improvements such as curb bulbs, medians, and radar feedback signs adjacent to the four schools that currently have school zone speed cameras
The School Road Safety Plan can be a guide for the City, School District, and school communities to help increase safety near schools. The current conception for the plan is to include a traffic safety analysis of streets near schools, and a prioritization framework for future improvements, some of which may be made possible by the revenue generated by school zone traffic cameras. The plan will also include creation of a safety education toolbox that can be used at all schools, building on the "Be Super Safe" road safety outreach campaign, and a review of existing legislation and policies related to school traffic safety. The development of a longer-term plan for expanding the school zone speed camera program to more schools, and other potential enforcement programs will also be included in the School Road Safety Plan. In the interim time period before the plan is created, the expansion of school zone speed cameras to 4-5 additional locations is also proposed. Because of the evidence base behind automated enforcement and school zone cameras nationally, the strong support of agencies like NHTSA, the reduction in citations seen in other regional jurisdictions, the 16 percent reduction seen in Seattle school zone camera locations during the first four months, and because the school zone cameras require several months of lead time before they be operational, it is proposed to move forward now in installing cameras at these locations:
Bailey Gatzert Elementary on East Yesler Way (Westbound only) Dearborn Park Elementary on South Orcas St Nathan Eckstein Middle School on Northeast 75th Street Roxhill Elementary on Southwest Roxbury Holy Family Parish School on Southwest Roxbury
The locations for these additional cameras were selected using the process described for the selecting the first four locations (see Section 3) and are expected to be on-line in early 2014 (assuming funding is approved in June or July of 2013). Pending approval of funding by the Seattle City Council, SDOT, SPD and Seattle Public Schools will begin working on the School Road Safety Plan and the other elements of the initiative, including expanding the school zone enforcement camera pilot to other schools in Seattle. The physical improvements for schools with school zone cameras will also proceed at Broadview-Thomson K-8, Thurgood Marshall Elementary, Olympic View Elementary, and Gatewood Elementary.
June 13, 2013 12
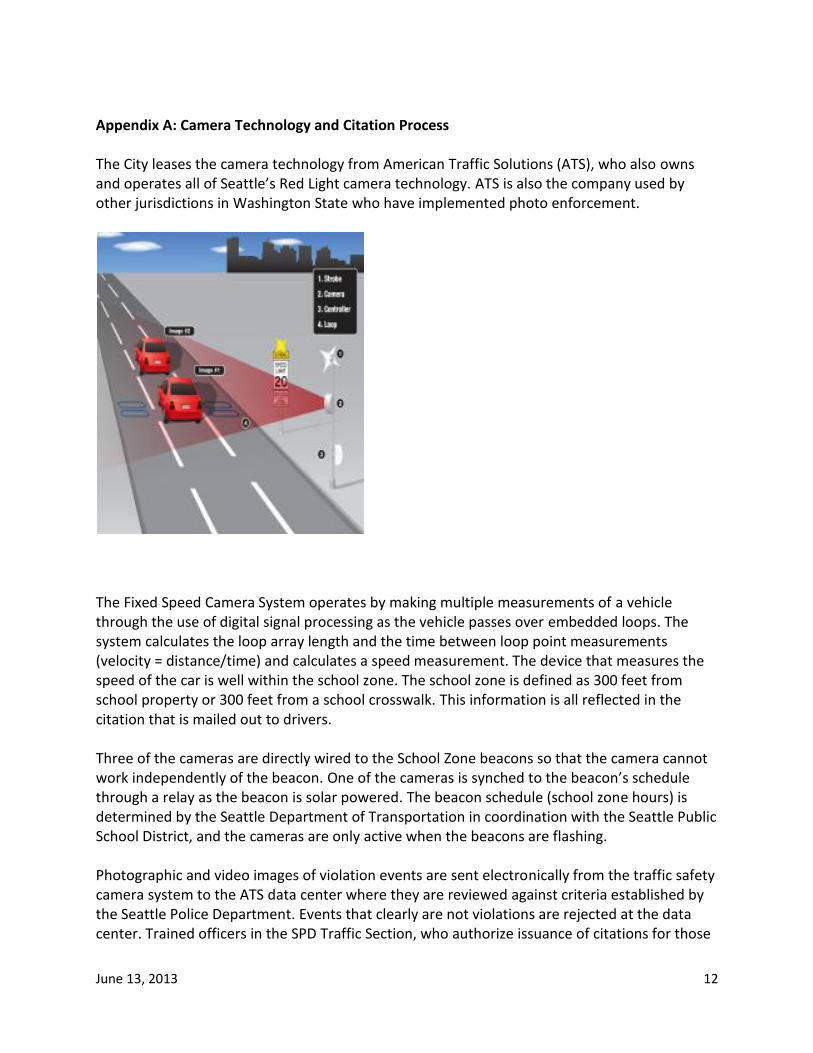
Appendix A: Camera Technology and Citation Process The City leases the camera technology from American Traffic Solutions (ATS), who also owns and operates all of Seattle’s Red Light camera technology. ATS is also the company used by other jurisdictions in Washington State who have implemented photo enforcement.
The Fixed Speed Camera System operates by making multiple measurements of a vehicle through the use of digital signal processing as the vehicle passes over embedded loops. The system calculates the loop array length and the time between loop point measurements (velocity = distance/time) and calculates a speed measurement. The device that measures the speed of the car is well within the school zone. The school zone is defined as 300 feet from school property or 300 feet from a school crosswalk. This information is all reflected in the citation that is mailed out to drivers. Three of the cameras are directly wired to the School Zone beacons so that the camera cannot work independently of the beacon. One of the cameras is synched to the beacon’s schedule through a relay as the beacon is solar powered. The beacon schedule (school zone hours) is determined by the Seattle Department of Transportation in coordination with the Seattle Public School District, and the cameras are only active when the beacons are flashing. Photographic and video images of violation events are sent electronically from the traffic safety camera system to the ATS data center where they are reviewed against criteria established by the Seattle Police Department. Events that clearly are not violations are rejected at the data center. Trained officers in the SPD Traffic Section, who authorize issuance of citations for those
June 13, 2013 13
deemed in violation, review events that appear to meet SPD criteria. Pursuant to statute, this review and mailing of the NOI to the registered owner of the vehicle must all occur within 14 days of the violation event. Drivers have the opportunity to review the same film footage as the officer on a website that is maintained by ATS.4 The website address, as well as a still picture, is available on every notice of infraction. The registered owner has 18 days from issuance of the NOI to either pay the monetary penalty specified in the ordinance, contest the citation by requesting a Municipal Court hearing, or sign a declaration (affidavit) stating that he or she was not driving the vehicle at the time of the infraction (thereby canceling the NOI). It is important to note that, by Washington law, the automated Speed Zone violation is treated as a parking infraction and is not part of the registered owner’s driving record under RCW 46.52.101 and RCW 46.52.120.
4 Violationinfo.com
June 13, 2013 14
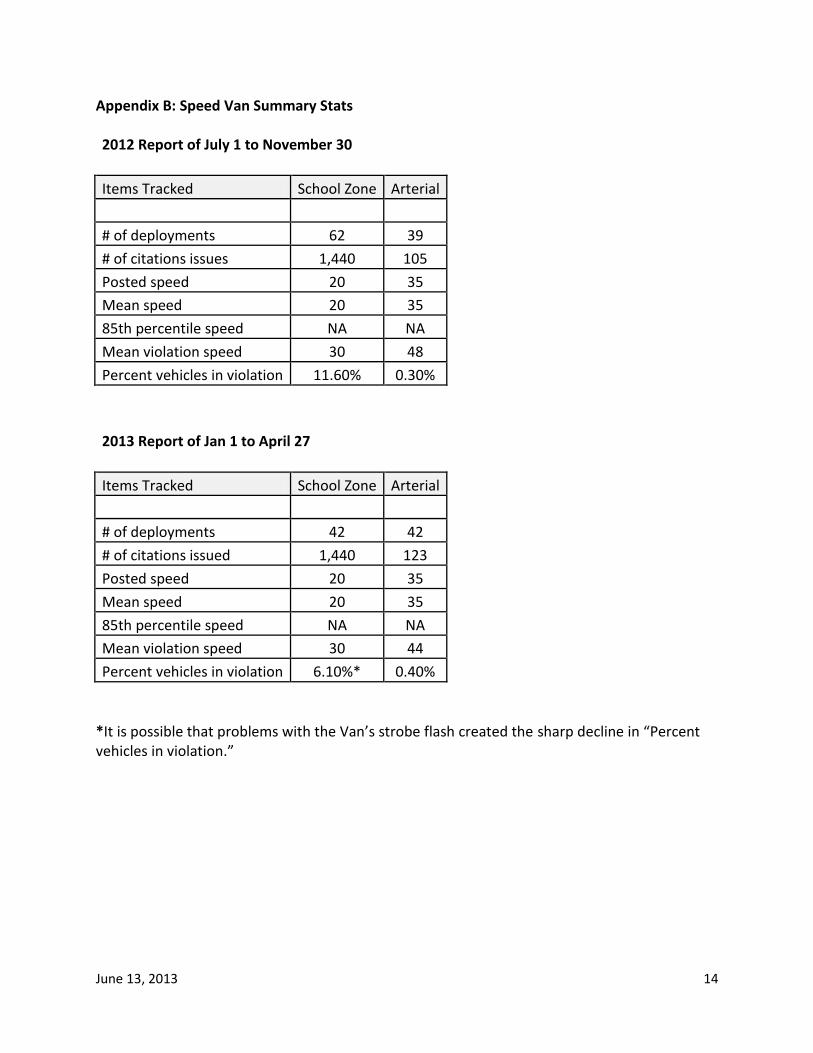
Appendix B: Speed Van Summary Stats 2012 Report of July 1 to November 30
Items Tracked School Zone Arterial
# of deployments 62 39
# of citations issues 1,440 105
Posted speed 20 35
Mean speed 20 35
85th percentile speed NA NA
Mean violation speed 30 48
Percent vehicles in violation 11.60% 0.30%
2013 Report of Jan 1 to April 27
Items Tracked School Zone Arterial
# of deployments 42 42
# of citations issued 1,440 123
Posted speed 20 35
Mean speed 20 35
85th percentile speed NA NA
Mean violation speed 30 44
Percent vehicles in violation 6.10%* 0.40%
*It is possible that problems with the Van’s strobe flash created the sharp decline in “Percent vehicles in violation.”