Seattle Office of Arts and Cultural Affairs CVI™ Report 2011 · sales, per capita music store...
36
Seattle Office of Arts and Cultural Affairs CVI™ Report 2011 1743 Wazee St. Suite 300 Denver, CO 80202 1-303-629-1166 www.westaf.org
Transcript of Seattle Office of Arts and Cultural Affairs CVI™ Report 2011 · sales, per capita music store...

Seattle Office of Arts and Cultural Affairs CVI™ Report 2011
1743 Wazee St. Suite 300Denver, CO 80202
1-303-629-1166www.westaf.org
Table of Contents
Introduction ....................................................................................................................................... 1Data Preview & Summary ................................................................................................................ 2Detailed Report ................................................................................................................................. 3Seattle Metro Area CVI™ 2010-2011 ................................................................................................. 5Comparative CVI™ of Six Areas 2010-2011 ..................................................................................... 6Seattle Metro Area CVI™ vs. the United States 2011 ...................................................................... 7Seattle Metro Area CVI™ vs. Western States 2011 ........................................................................ 9Seattle Metro Area CVI™ vs. the Pacific Northwest 2011 ............................................................. 10Seattle Metro Area CVI™ vs. Washington 2011 ............................................................................. 12Seattle Metro Area CVI™ vs. the Portland MSA 2011 .................................................................... 13Seattle Metro Area CVI™ vs. the Seattle MSA 2011 ....................................................................... 15Seattle Metro Area Non-Profit Arts and Arts-Active Organizations by Type 2011 ................... 23Seattle Metro Area Non-Profit Arts Organizations by Income 2011 .......................................... 25Seattle Metro Area Non-Profit Arts Organizations by Index 2011 .............................................. 26Seattle Metro Area Non-Profit Arts-Active Organizations by Income 2011 .............................. 26Seattle Metro Area Non-Profit Arts-Active Organizations by Index 2011 .................................. 27Seattle Metro Area Photography Store Sales 2011 ..................................................................... 27Seattle Metro Area Music Store Sales 2011 ................................................................................. 28Seattle Metro Area Book and Record Store Sales 2011 .............................................................. 28Seattle Metro Area Art Dealer Revenues 2011 ............................................................................. 29Seattle Metro Area Independent Artist Revenues 2011 .............................................................. 30Seattle Metro Area Performing Arts Participation Revenues 2011 ............................................ 30Technical Report ............................................................................................................................ 30

IntroductionThis report details the findings of research on the overall health of a region's arts-relatedcreative economy. The strongest indicator of this health is a region’s Creative Vitality™ Index(CVI™) value. The CVI™ is a robust and inclusive measure of the economic vitality of the artsand arts activities in a specified geographic or political region of the United States.Rigorously constructed and updated annually, a region’s CVI™ report is a credible and cleardata source for arts research and advocacy purposes. What is an Index?An index is generally an efficient means of summarizing quantities of interrelated informationand describing complex relationships. An index can be, as in the case of the CVI™, a singleindicator of multiple variables and interactions between these variables. Changes in an indexwill reflect changes in the data used to generate the index. Standardization and unification ofdata mean that indexes are ideally suited for comparative analysis.The comparative nature ofthe CVI™ has added analytical and policy value. What is the Creative Vitality™ Index?The Creative Vitality™ Index (CVI™) measures annual changes in the economic health of anarea by integrating economic data streams from both the for-profit and non-profit sectors.Using per capita measurements of revenue data from both for-profit and non-profit entities aswell as job data from a selection of highly creative occupations, the research aggregates thedata streams into a single index value that reflects the relative economic health of ageography's creative economy. The CVI™ provides an easily comprehensible measure ofeconomic health to help communicate information from a broad arts coalition to policymakers and stakeholders. This longitudinal data allows for compelling year-to-yearcomparisons as well as cross-city, county, and state comparisons. The CVI™ researchsystem also provides users with a series of reports on the rise and fall of key data factorsmeasured by the index. The CVI™ goes beyond an annual tally of what is ofteninflation-driven growth in the non-profit art sector. Instead, it is a more inclusive reportingmechanism that is rooted in robust data streams that reflect the entire arts-based creativeeconomy. The Creative Vitality™ Index is a resource for informing public policy and supporting the workof advocates for creative economies. CVI™ reports have been used as a way to define theparameters of an area’s creative economy and as a means of educating communities aboutthe components and dynamics of a creative economy. The CVI™ is frequently used as asource of information for arts advocacy messaging and to call attention to significant changesin regional creative economies. This research has also been used to underscore theeconomic relationships between the for- and non-profit sectors and as a mechanism fordiagnosing a region’s creative strengths and weaknesses. What does the Creative Vitality™ Index Measure?The CVI™ measures a carefully selected set of economic inputs related to the arts andcreativity in a given geographic area, with measurements of both for-profit and non-profitarts-related activities. The index has two major components including measurements ofcommunity participation based on per capita revenues of arts-related goods and services,and measurements of per capita occupational employment in the arts. The weightedindicators within the community participation portion of the index are the following: non-profitarts organization income, non-profit humanities organizational income, per capita book storesales, per capita music store sales, per capita photography store sales, per capita performingarts revenues, and per capita art gallery and individual artist sales. These indicators accountfor sixty percent of the overall index values. A forty percent weighting has been assigned tooccupational employment in the arts that captures the incidence of jobs associated with
Page 1/34

measurably high levels of creative output. The rationale for this approach is the cause-and-effect relationship between participationlevels and jobs. The underlying theory is that public participation in the arts or public demandfor arts experiences and events ultimately drives budgets and organizational funding levels,which in turn support artists and art-related jobs within the economy. Where does Creative Vitality™ Index Data Come From?Index data streams are analyzed by WESTAF and taken from two major data partners: theUrban Institute's National Center for Charitable Statistics, and Economic ModelingSpecialists, International (EMSI). The Urban Institute's National Center for Charitable Statisticsaggregates information from the Internal Revenue Service's 990 forms. The forms arerequired to be submitted by non-profit 501(c) organizations with annual gross receipts of$25,000 or more; however, organizations with smaller revenues also occasionally report.EMSI uses a proprietary economic modeling technique to capture industry and occupationalemployment data. A brief synopsis of the data sources employed in this model are outlinedas follows: Industry DataIn order to capture a complete picture of industry employment, EMSI combines coveredemployment data from Quarterly Census of Employment and Wages (QCEW), produced bythe Department of Labor, with total employment data in Regional Economic InformationSystem (REIS), published by the Bureau of Economic Analysis (BEA) and augmented withCounty Business Patterns (CBP) and Nonemployer Statistics (NES), published by the U.S.Census Bureau. Occupation DataOrganizing regional employment information by occupation provides a workforce-orientedview of the regional economy. EMSI's occupation data are based on EMSI's industry dataand regional staffing patterns taken from the Occupational Employment Statistics program(U.S. Bureau of Labor Statistics). Wage information is partially derived from the AmericanCommunity Survey. The occupation-to-program (SOC-to-CIP) crosswalk is based on onefrom the U.S. Department of Education, with customizations by EMSI. Communicating CVI™ DataDifferent state, local, and regional organizations have undertaken multiple communicationstrategies for publicizing the results of their CVI™ reports. WESTAF has found that the beststrategy for communicating CVI™ information often relies on the specifics of organizationalneeds. WESTAF is willing to consult individual agencies free of charge regarding communicationstrategies after CVI™ data have been finalized. Potential strategies include: creating low-costcommunication pieces and press releases “in-house”; creating more formalizedcommunication; using a professional designer; including a number of stories related to thelocal creative economies; forming working groups to discuss the creative economy andlong-term messaging strategies based on CVI™ data; commissioning in-depth research toinvestigate certain aspects of CVI™ data apparent in the overall CVI™ results; and using CVI™data as an internal policy formulation document, while communicating data to specific keystakeholders, such as legislators and executives.
Page 2/34

than the nation as a whole by 30%. A CVI™ value as compared to a specific region—a county,state, or combined area—can also be generated. The unique geographic sensitivity of thismeasure means that arts advocates and policy makers have a clear and conciseunderstanding of their particular region. Important to note is that this report includes select City of Seattle ZIP codes and other ZIPcodes located within the Seattle Metro Area. These ZIP codes were included by WESTAF atthe request of the City of Seattle. This set of ZIP codes, while defining an area larger thanthe City itself, provides a comprehensive understanding of the creative economy health ofthe Seattle Metro Area. Keep in mind that the Seattle Metro Area Region, which is defined bya set of ZIP codes, is different than the Seattle Metropolitan Statistical Area, which includesKing, Snohomish, and Pierce Counties. Seattle Metro Area Data Highlights:In 2011, the Seattle Metro Area outperformed the United States, the State of Washington,the Pacific Northwest Region, and the Western States Region in all eight categories measuredby the CVI™. This area also surpassed the Portland Metropolitan Statistical Area (MSA) andthe Seattle MSA in seven CVI™ categories. The Seattle Metro Area’s performing arts participationrevenues and non-profit arts organization revenues fared well when compared to theabove-mentioned geographies. The Seattle Metro Area generated over 2,000 creative jobs,with graphic designers experiencing the area’s greatest increase in jobs between 2010 and2011. There were more than 320 non-profit arts and arts-active organizations within theSeattle Metro Area, and these organizations generated more than $371 million in revenues in2011. Additional Data PointsCVI™ data streams are analyzed by WESTAF and taken from two major data partners: theUrban Institute's National Center for Charitable Statistics and Economic ModelingSpecialists, International (EMSI). The totality of data from these streams is presented in thefollowing section. The following are select data points in this region for 2011: •In comparison to the United States, the overall CVI™ for the Seattle Metro Area increasedslightly from 2.92 in 2010 to 2.93 in 2011. •Non-profit arts organizations generated $226 million in revenues, and non-profit arts-activeorganizations generated $145.3 in income. •The Seattle Metro Area had 329 non-profit arts and arts-active organizations. •Independent artist revenues had $233.1 million in revenues. •When compared to the nation, the Seattle Metro Area had an index value of 4.55 inperforming arts participation revenues.
Creative Vitality Report DetailsIt is important to recall that the CVI™ value of this region is always compared to a value of1.00. While a region might not be at the 1.00 level, this does not indicate an absence ofactivity. Here, it can be useful to look at the relative strength of the categorical index valuesbeing examined. Additionally, looking at refined state and regional contexts can give valuableinsight to how a “low performing” region might actually be contributing positively to a stateand regional economy.
Page 3/34
Data Preview and SummaryA region’s Creative Vitality™ Index value is compared to a national baseline value of 1.00.For example, a region with a CVI™ value of 1.30 has a stronger creative vitality index value
A few key terms used in the CVI™
Index: summarizes multiple sources of data into a single indicator, using one number todescribe a complex set of variables, activities, and events. A few of the best-known indexesare the Dow Jones Industrial Average, the Body Mass Index (BMI) and the Consumer PriceIndex (CPI).
Per Capita: most simply put, per capita means the average per person. In the context of theCVI™, per capita is referring to the ratio of the CVI™ input--such as industry revenues,non-profit revenues, and jobs--to the number of people within the study area.
CVI™ : a comparative indicator of a region’s creative vitality, including non-profit and for-profitarts activities; it reflects the relative economic health of a region’s creative economy.
Arts Organizations: organizations that have primary missions related to serving orpresenting the arts. These organizations include traditionally subsidized arts organizationssuch as art museums, symphonies, operas, and ballets.
Arts-Active Organizations: organizations that do not have primary missions related toserving or presenting the arts, but do conduct a number of activities that can be considered"arts-based." For example, within any history museum, there is a significant amount of artsactivities associated with exhibit design; the concept reflects a widely accepted trend in artsresearch to consider how certain creative activities and occupations that do not directlyproduce art, but are creative and artistic in nature, deserve recognition as vital parts of acreative economy.
Location Quotient (LQ): an index value for each occupation, measuring whether or notthere is a per capita concentration of an occupation within the area being measured; LQs aregiven for both the state and the nation, showing the relative concentration of employment foran area when compared with the state and with the nation. The location quotient approach istypically used in community analysis and planning to assess basic industries, or thoseexporting goods.
Page 4/34

Seattle Metro Area Creative Vitality Index by YearTable #1 and Chart #1 represent the total CVI™ values for the aggregated zip codes within the Seattle Metro Areafor the years 2010 and 2011. The 2010 overall CVI™ value of 2.92 for the area increased slightly to 2.93 in 2011.Changes in index values should be considered alongside general local, regional, and national trends. The nature ofthe index accounts for both the influence of national trends and inflation by recalculating national comparison datain each year. This comparative mechanism also allows for an accurate description of local and regional trendswhile accounting for the influence of national changes. Sources for the variations of index values in each yearexperienced within the individual data streams are detailed further within this report.
Table #1Seattle Metro Area CVI™ 2010-2011
Region Index 2010 Index 2011Seattle Me... 2.92 2.93
Totals 2.92 2.93Source: WESTAF
Chart #1Seattle Metro Area CVI™ 2010-2011
Source: WESTAF
Comparative CVI™ for 2010 and 2011Table #2 and Chart #2 represent the total CVI™ values for the Seattle Metro Area, Los Angeles County, SanFrancisco County, King County, Multnomah County, and Denver County for the years 2010 and 2011. SanFrancisco County had the top overall index value of 5.25 in 2011, while the Seattle Metro Area had the secondhighest CVI™ value of 2.93. To view the CVI™ values for all geographies included in this comparison, see Table#2. A note on CVI™ values: population density and regional sensitivity are important here. The CVI™ measures theconcentration of creative economic activities within a geographic area. While concentration rates, and thus indexvalues, can be affected by changes in the size of the region being studied, CVI™ values are not necessarily tied topopulation and population density. For example, some states with low population numbers, such as Alaska,Hawai'i, and Nevada, have high CVI™ values when compared to states with much higher populations and urbanconcentrations. Conversely, areas with high populations or population densities do not consistently have high CVI™values. Certainly, the complexities of urban, suburban, and rural geographies and demographics play a role in thecreativity and vibrancy of a region. The adjustable sensitivity of the CVI™ to precise regions is a considerablestrength of this measure.
Page 5/34
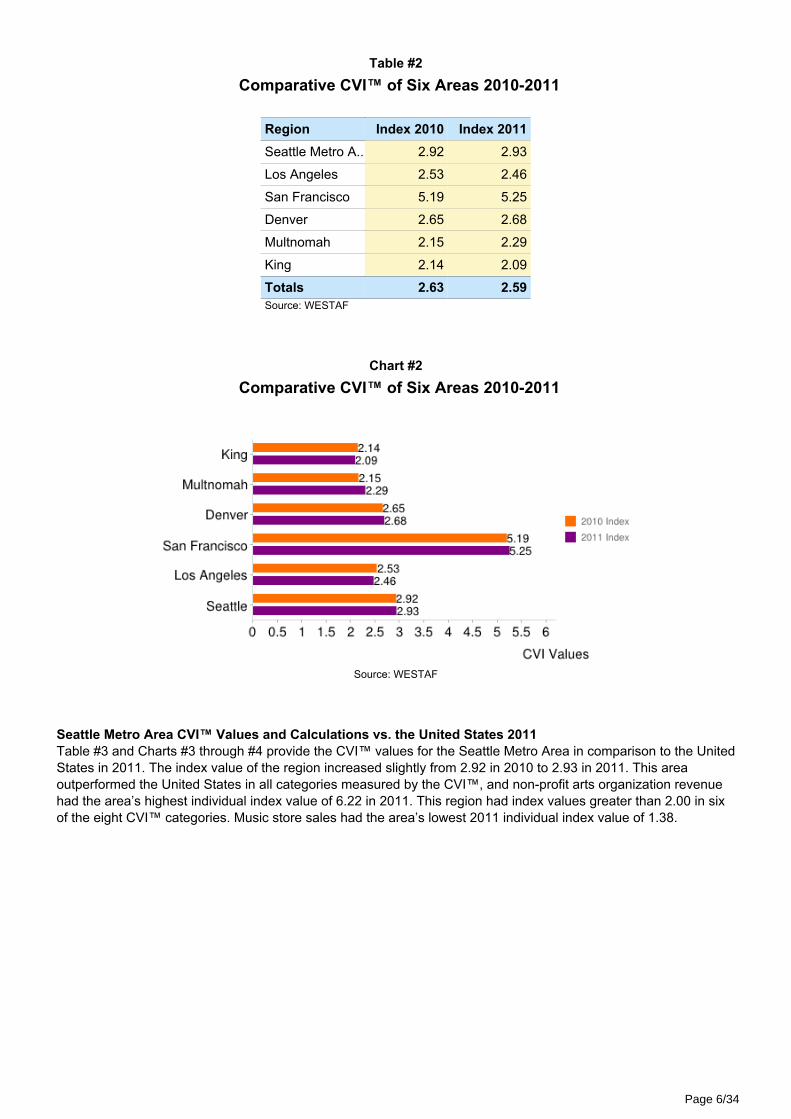
Table #2Comparative CVI™ of Six Areas 2010-2011
Region Index 2010 Index 2011Seattle Metro A... 2.92 2.93
Los Angeles 2.53 2.46
San Francisco 5.19 5.25
Denver 2.65 2.68
Multnomah 2.15 2.29
King 2.14 2.09
Totals 2.63 2.59Source: WESTAF
Chart #2Comparative CVI™ of Six Areas 2010-2011
Source: WESTAF
Seattle Metro Area CVI™ Values and Calculations vs. the United States 2011Table #3 and Charts #3 through #4 provide the CVI™ values for the Seattle Metro Area in comparison to the UnitedStates in 2011. The index value of the region increased slightly from 2.92 in 2010 to 2.93 in 2011. This areaoutperformed the United States in all categories measured by the CVI™, and non-profit arts organization revenuehad the area’s highest individual index value of 6.22 in 2011. This region had index values greater than 2.00 in sixof the eight CVI™ categories. Music store sales had the area’s lowest 2011 individual index value of 1.38.
Page 6/34

Table #3Seattle Metro Area CVI™ vs. the United States 2011
Region A: Seattle Metro Area
Region B: United States
Description Region A Region B Categorical Index
Year - 2011
Population 831,998 311,922,182
Industry Data
Photography Store Sales $7,363,000 $1,159,137,000 2.381
Music Store Sales $10,916,000 $2,961,284,000 1.382
Book and Record Store Sales $37,009,000 $7,945,591,000 1.746
Art Gallery and Individual Artist Sales $251,209,000 $37,873,582,000 2.487
Performing Arts Participation $187,512,000 $15,444,381,000 4.552
Non Profit Data
Arts Organization Revenue $226,222,082 $13,641,202,227 6.217
Arts-Active Organization Revenue $145,280,658 $16,522,955,199 3.296
Occupation Data
Total Jobs 30,998 4,770,016 2.436
Total CVI : 2.93Source: WESTAF
Chart #3CVI™ Values by Category 2011
Source: WESTAF
Page 7/34

Chart #4Contributions to the CVI™ after Weighting Inputs 2011
Source: WESTAF
Seattle Metro Area CVI™ Values and Calculations vs. Western States 2011Please see Table #5 and Charts #7 and #8 to view summarized CVI™ data for the Seattle Metro Area incomparison to the Western States Region. The Western States Region includes Alaska, Arizona, California,Colorado, Hawaii, Idaho, Montana, Nevada, New Mexico, Oregon, Utah, Washington, and Wyoming. In 2011, theSeattle Metro Area surpassed the Western States Region in all eight categories measured by the CVI™, whichcontributed to a strong overall index value of 2.64. Photography store sales, performing arts participation revenues,non-profit arts organization revenues, non-profit arts-active organization revenues, and jobs linked to the creativeeconomy all had individual index values above 2.00.
Page 8/34

Table #4Seattle Metro Area CVI™ vs. Western States 2011
Region A: Seattle Metro Area
Region B: Alaska, Arizona, California, Colorado, Hawaii, Idaho, Montana, Nevada, NewMexico, Oregon, Utah, Washington, Wyoming
Description Region A Region B Categorical Index
Year - 2011
Population 831,998 73,062,405
Industry Data
Photography Store Sales $7,363,000 $264,046,000 2.449
Music Store Sales $10,916,000 $770,352,000 1.244
Book and Record Store Sales $37,009,000 $2,212,121,000 1.469
Art Gallery and Individual Artist Sales $251,209,000 $16,132,551,000 1.367
Performing Arts Participation $187,512,000 $4,789,633,000 3.438
Non Profit Data
Arts Organization Revenue $226,222,082 $3,254,226,880 6.105
Arts-Active Organization Revenue $145,280,658 $3,259,679,026 3.914
Occupation Data
Total Jobs 30,998 1,299,013 2.096
Total CVI : 2.638Source: WESTAF
Chart #5CVI™ Values by Category 2011
Source: WESTAF
Page 9/34

Chart #6Contributions to the CVI™ after Weighting Inputs 2011
Source: WESTAF
Seattle Metro Area CVI™ Values and Calculations vs. Pacific Northwest 2011A comparison of the Seattle Metro Area and the Pacific Northwest Region, which includes Oregon and WashingtonState, is shown in Table #4 and Charts #5 and #6. The Seattle Metro Area outperformed the Pacific NorthwestRegion in every CVI™ category in 2011, which resulted in the above-average overall index value of 2.98 for theregion. Non-profit arts organization revenues had the region’s highest individual index value of 5.91, followed byperforming arts participation revenues, and non-profit arts-active organization revenues.
Table #5Seattle Metro Area CVI™ vs. the Pacific Northwest 2011
Region A: Seattle Metro Area
Region B: Oregon, Washington
Description Region A Region B Categorical Index
Year - 2011
Population 831,998 10,698,692
Industry Data
Photography Store Sales $7,363,000 $34,536,000 2.742
Music Store Sales $10,916,000 $112,360,000 1.249
Book and Record Store Sales $37,009,000 $328,819,000 1.447
Art Gallery and Individual Artist Sales $251,209,000 $941,859,000 3.430
Performing Arts Participation $187,512,000 $455,997,000 5.288
Non Profit Data
Arts Organization Revenue $226,222,082 $492,021,091 5.912
Arts-Active Organization Revenue $145,280,658 $455,015,199 4.106
Occupation Data
Total Jobs 30,998 188,863 2.111
Total CVI : 2.978Source: WESTAF
Page 10/34
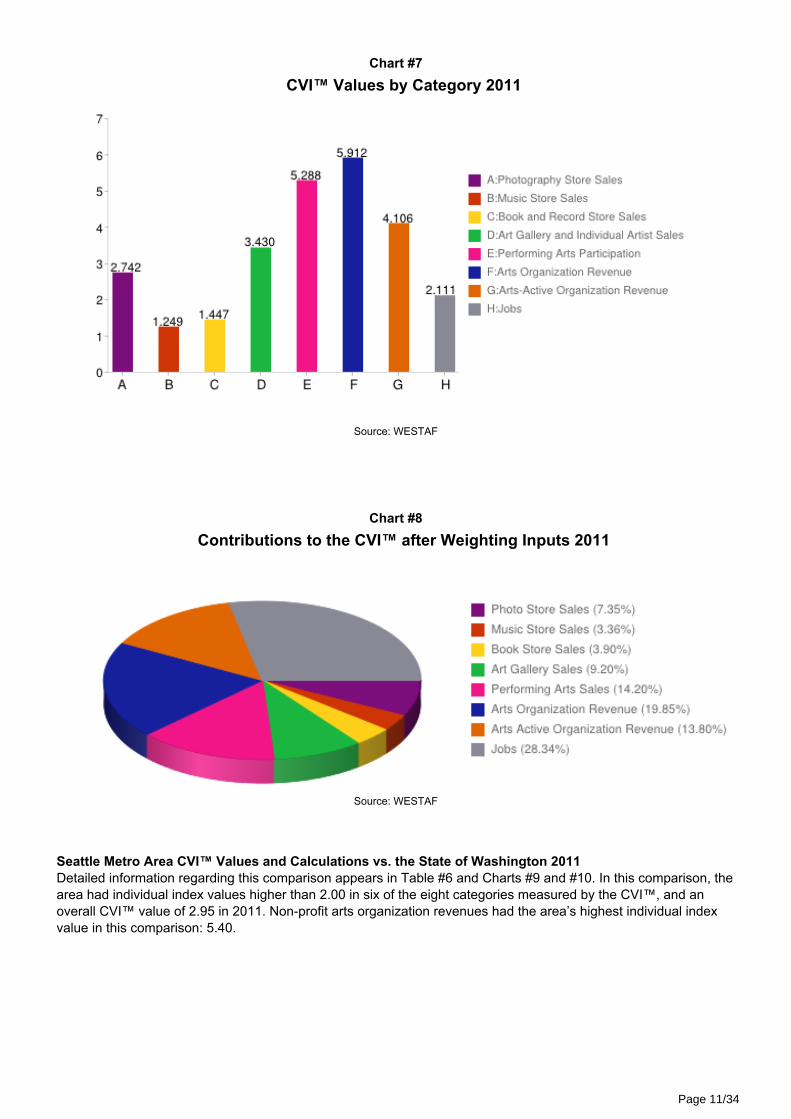
Chart #7CVI™ Values by Category 2011
Source: WESTAF
Chart #8Contributions to the CVI™ after Weighting Inputs 2011
Source: WESTAF
Seattle Metro Area CVI™ Values and Calculations vs. the State of Washington 2011Detailed information regarding this comparison appears in Table #6 and Charts #9 and #10. In this comparison, thearea had individual index values higher than 2.00 in six of the eight categories measured by the CVI™, and anoverall CVI™ value of 2.95 in 2011. Non-profit arts organization revenues had the area’s highest individual indexvalue in this comparison: 5.40.
Page 11/34

Table #6Seattle Metro Area CVI™ vs. Washington 2011
Region A: Seattle Metro Area
Region B: Washington
Description Region A Region B Categorical Index
Year - 2011
Population 831,998 6,818,053
Industry Data
Photography Store Sales $7,363,000 $19,911,000 3.030
Music Store Sales $10,916,000 $70,657,000 1.266
Book and Record Store Sales $37,009,000 $195,589,000 1.551
Art Gallery and Individual Artist Sales $251,209,000 $622,030,000 3.309
Performing Arts Participation $187,512,000 $300,355,000 5.116
Non Profit Data
Arts Organization Revenue $226,222,082 $343,518,429 5.397
Arts-Active Organization Revenue $145,280,658 $293,096,353 4.062
Occupation Data
Total Jobs 30,998 117,816 2.156
Total CVI : 2.949Source: WESTAF
Chart #9CVI™ Values by Category 2011
Source: WESTAF
Page 12/34

Chart #10Contributions to the CVI™ after Weighting Inputs 2011
Source: WESTAF
Seattle Metro Area CVI™ Values and Calculations vs. the Portland MSA 2011CVI™ data for this region in comparison to the Portland MSA is provided in Table #7 and Charts #11 and #12. TheSeattle Metro Area surpassed the Portland MSA in seven of the eight categories measured by the CVI™. Thearea’s music store sales had an index value only slightly below the national average: 0.99. Performing artsparticipation revenues and non-profit arts organization revenues had the region’s two highest individual 2011 CVI™values in this comparison.
Table #7Seattle Metro Area CVI™ vs. the Portland MSA 2011
Region A: Seattle Metro Area
Region B: Clackamas, Columbia, Multnomah, Washington, Yamhill, Clark, Skamania
Description Region A Region B Categorical Index
Year - 2011
Population 831,998 2,261,823
Industry Data
Photography Store Sales $7,363,000 $9,738,000 2.056
Music Store Sales $10,916,000 $29,903,000 0.992
Book and Record Store Sales $37,009,000 $83,928,000 1.199
Art Gallery and Individual Artist Sales $251,209,000 $223,883,000 3.050
Performing Arts Participation $187,512,000 $97,907,000 5.207
Non Profit Data
Arts Organization Revenue $226,222,082 $87,948,533 6.993
Arts-Active Organization Revenue $145,280,658 $112,216,289 3.520
Occupation Data
Total Jobs 30,998 47,387 1.778
Total CVI : 2.762Source: WESTAF
Page 13/34

Chart #11CVI™ Values by Category 2011
Source: WESTAF
Chart #12Contributions to the CVI™ after Weighting Inputs 2011
Source: WESTAF
Seattle Metro Area CVI™ Values and Calculations vs. the Seattle MSA 2011Table #8 and Charts #13 through #14 provide CVI™ data for the Seattle Metro Area in comparison to the SeattleMSA. The Seattle MSA is comprised of King, Pierce, and Snohomish counties. In 2011, the area’s overall indexvalue was 2.04 in this comparison, and it outperformed the Seattle MSA in seven of the eight CVI™ categories. Theonly category with a value below the national average in 2011 was music store sales at 0.99.
Page 14/34

Table #8Seattle Metro Area CVI™ vs. the Seattle MSA 2011
Region A: Seattle Metro Area
Region B: King, Pierce, Snohomish
Description Region A Region B Categorical Index
Year - 2011
Population 831,998 3,486,869
Industry Data
Photography Store Sales $7,363,000 $17,556,000 1.758
Music Store Sales $10,916,000 $46,030,000 0.994
Book and Record Store Sales $37,009,000 $128,258,000 1.209
Art Gallery and Individual Artist Sales $251,209,000 $455,099,000 2.313
Performing Arts Participation $187,512,000 $260,287,000 3.019
Non Profit Data
Arts Organization Revenue $226,222,082 $280,290,929 3.383
Arts-Active Organization Revenue $145,280,658 $210,322,325 2.895
Occupation Data
Total Jobs 30,998 78,205 1.661
Total CVI : 2.037Source: WESTAF
Chart #13CVI™ Values by Category 2011
Source: WESTAF
Page 15/34
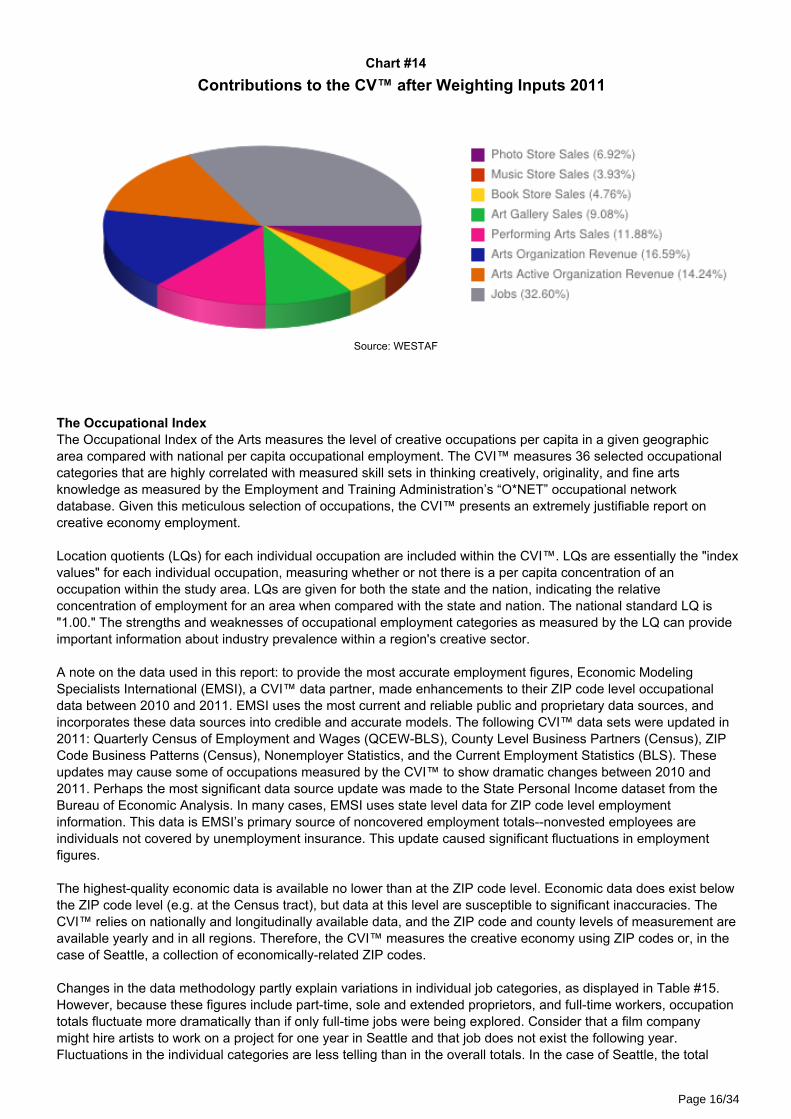
Chart #14Contributions to the CV™ after Weighting Inputs 2011
Source: WESTAF
The Occupational IndexThe Occupational Index of the Arts measures the level of creative occupations per capita in a given geographicarea compared with national per capita occupational employment. The CVI™ measures 36 selected occupationalcategories that are highly correlated with measured skill sets in thinking creatively, originality, and fine artsknowledge as measured by the Employment and Training Administration’s “O*NET” occupational networkdatabase. Given this meticulous selection of occupations, the CVI™ presents an extremely justifiable report oncreative economy employment. Location quotients (LQs) for each individual occupation are included within the CVI™. LQs are essentially the "indexvalues" for each individual occupation, measuring whether or not there is a per capita concentration of anoccupation within the study area. LQs are given for both the state and the nation, indicating the relativeconcentration of employment for an area when compared with the state and nation. The national standard LQ is"1.00." The strengths and weaknesses of occupational employment categories as measured by the LQ can provideimportant information about industry prevalence within a region's creative sector. A note on the data used in this report: to provide the most accurate employment figures, Economic ModelingSpecialists International (EMSI), a CVI™ data partner, made enhancements to their ZIP code level occupationaldata between 2010 and 2011. EMSI uses the most current and reliable public and proprietary data sources, andincorporates these data sources into credible and accurate models. The following CVI™ data sets were updated in2011: Quarterly Census of Employment and Wages (QCEW-BLS), County Level Business Partners (Census), ZIPCode Business Patterns (Census), Nonemployer Statistics, and the Current Employment Statistics (BLS). Theseupdates may cause some of occupations measured by the CVI™ to show dramatic changes between 2010 and2011. Perhaps the most significant data source update was made to the State Personal Income dataset from theBureau of Economic Analysis. In many cases, EMSI uses state level data for ZIP code level employmentinformation. This data is EMSI’s primary source of noncovered employment totals--nonvested employees areindividuals not covered by unemployment insurance. This update caused significant fluctuations in employmentfigures. The highest-quality economic data is available no lower than at the ZIP code level. Economic data does exist belowthe ZIP code level (e.g. at the Census tract), but data at this level are susceptible to significant inaccuracies. TheCVI™ relies on nationally and longitudinally available data, and the ZIP code and county levels of measurement areavailable yearly and in all regions. Therefore, the CVI™ measures the creative economy using ZIP codes or, in thecase of Seattle, a collection of economically-related ZIP codes. Changes in the data methodology partly explain variations in individual job categories, as displayed in Table #15.However, because these figures include part-time, sole and extended proprietors, and full-time workers, occupationtotals fluctuate more dramatically than if only full-time jobs were being explored. Consider that a film companymight hire artists to work on a project for one year in Seattle and that job does not exist the following year.Fluctuations in the individual categories are less telling than in the overall totals. In the case of Seattle, the total
Page 16/34
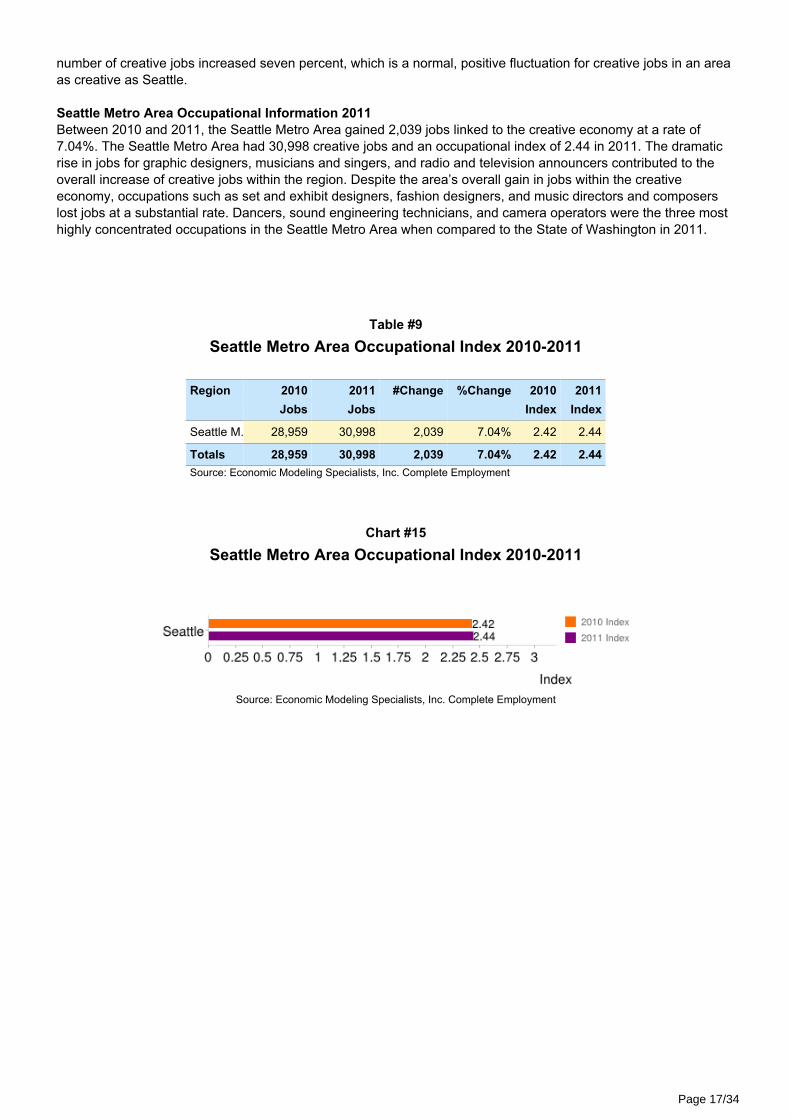
number of creative jobs increased seven percent, which is a normal, positive fluctuation for creative jobs in an areaas creative as Seattle. Seattle Metro Area Occupational Information 2011Between 2010 and 2011, the Seattle Metro Area gained 2,039 jobs linked to the creative economy at a rate of7.04%. The Seattle Metro Area had 30,998 creative jobs and an occupational index of 2.44 in 2011. The dramaticrise in jobs for graphic designers, musicians and singers, and radio and television announcers contributed to theoverall increase of creative jobs within the region. Despite the area’s overall gain in jobs within the creativeeconomy, occupations such as set and exhibit designers, fashion designers, and music directors and composerslost jobs at a substantial rate. Dancers, sound engineering technicians, and camera operators were the three mosthighly concentrated occupations in the Seattle Metro Area when compared to the State of Washington in 2011.
Table #9Seattle Metro Area Occupational Index 2010-2011
Region 2010 2011 #Change %Change 2010 2011Jobs Jobs Index Index
Seattle M.. 28,959 30,998 2,039 7.04% 2.42 2.44
Totals 28,959 30,998 2,039 7.04% 2.42 2.44Source: Economic Modeling Specialists, Inc. Complete Employment
Chart #15Seattle Metro Area Occupational Index 2010-2011
Source: Economic Modeling Specialists, Inc. Complete Employment
Page 17/34

Table #10Seattle Metro Area Creative Jobs by Occupation 2010-2011
Regio Seattle Metro Area
Occupation Type 2010 2011 %ChangeJobs Jobs
Actors 768 575 -25.13Advertising and Promotions Managers 267 319 19.48Agents and Business Managers of Artists,Performers, and Athletes 252 268 6.35Architects, Except Landscape and Naval 1,361 1,602 17.71Art Directors 972 1,420 46.09Audio and Video Equipment Technicians 298 347 16.44Broadcast Technicians 249 277 11.24Camera Operators, Television, Video, and Motion Picture 260 262 0.77Choreographers 122 99 -18.85Commercial and Industrial Designers 610 435 -28.69Dancers 176 148 -15.91Directors, Religious Activities 263 219 -16.73Editors 805 828 2.86Fashion Designers 532 240 -54.89Film and Video Editors 198 165 -16.67Fine Artists including Painters, Sculptors, and Illustrators 817 416 -49.08Floral Designers 582 292 -49.83Graphic Designers 1,530 2,901 89.61Interior Designers 706 727 2.97Landscape Architects 507 368 -27.42Librarians 681 670 -1.62Media and Communication Equipment Workers, All Other 197 169 -14.21Media and Communication Workers, All Other 1,056 733 -30.59Multi-Media Artists and Animators 1,147 1,453 26.68Music Directors and Composers 1,305 602 -53.87Musical Instrument Repairers and Tuners 40 30 -25.00Musicians and Singers 1,655 3,073 85.68Photographers 4,258 5,400 26.82Producers and Directors 1,015 785 -22.66Public Relations Managers 482 500 3.73Public Relations Specialists 1,617 1,750 8.23Radio and Television Announcers 307 553 80.13Set and Exhibit Designers 476 128 -73.11Sound Engineering Technicians 193 160 -17.10Technical Writers 359 303 -15.60Writers and Authors 2,896 2,781 -3.97Total 28,959 30,998 7.04Source: Economic Modeling Specialists, Inc. Complete Employment
Page 18/34

Chart #16Top 3 Negative % Change by Occupation 2010-2011
Source: Economic Modeling Specialists, Inc. Complete Employment
Chart #17Top 3 Positive % Change by Occupation 2010-2011
Source: Economic Modeling Specialists, Inc. Complete Employment
Page 19/34

Table #11Seattle Metro Area Creative Jobs by Location Quotient 2010-2011
Region: Seattle Metro Area
2010 2011 2010 2011Occupation Type State State National National
LQ LQ LQ LQActors 3.15 3.04 2.95 2.65Advertising and Promotions Managers 2.09 2.15 2.02 2.12Agents and Business Managers of Artists,Performers, and Athletes 2.23 1.87 1.90 1.60Architects, Except Landscape and Naval 2.76 2.64 3.76 3.63Art Directors 2.48 2.34 2.77 2.72Audio and Video Equipment Technicians 2.73 2.51 2.05 1.99Broadcast Technicians 3.42 3.28 2.68 2.66Camera Operators, Television, Video, and Motion Picture 3.80 3.28 3.68 3.23Choreographers 1.86 1.64 1.86 1.64Commercial and Industrial Designers 2.29 2.26 2.99 2.98Dancers 3.39 3.54 3.33 3.24Directors, Religious Activities 0.88 0.83 0.76 0.72Editors 2.05 2.11 1.93 2.05Fashion Designers 2.63 3.07 3.13 3.00Film and Video Editors 3.27 2.83 2.77 2.31Fine Artists including Painters, Sculptors, and Illustrators 2.46 2.33 2.83 2.57Floral Designers 1.78 1.14 2.24 1.21Graphic Designers 2.17 2.37 2.27 2.82Interior Designers 2.54 2.83 2.82 3.28Landscape Architects 2.10 2.38 3.36 4.66Librarians 1.46 1.48 1.60 1.63Media and Communication Equipment Workers, All Other 2.74 2.49 3.31 3.02Media and Communication Workers, All Other 1.87 2.33 2.86 4.16Multi-Media Artists and Animators 2.35 2.17 3.35 3.00Music Directors and Composers 2.19 1.74 2.21 1.66Musical Instrument Repairers and Tuners 1.26 1.32 1.12 1.14Musicians and Singers 2.33 2.31 2.36 2.40Photographers 1.62 1.84 2.00 2.27Producers and Directors 3.31 3.09 2.87 2.54Public Relations Managers 1.97 2.01 3.01 2.89Public Relations Specialists 1.98 2.02 2.11 2.14Radio and Television Announcers 2.96 2.74 2.28 2.43Set and Exhibit Designers 2.52 2.83 3.18 2.77Sound Engineering Technicians 3.83 3.36 3.53 2.96Technical Writers 1.46 1.35 2.31 2.21Writers and Authors 2.55 2.33 2.83 2.58Source: Economic Modeling Specialists, Inc. Complete Employment
Page 20/34

Chart #18Top 5 Location Quotients by Occupation vs. Statewide Occupations 2010
Source: Economic Modeling Specialists, Inc. Complete Employment
Chart #19Top 5 Location Quotients by Occupation vs. Statewide Occupations 2011
Source: Economic Modeling Specialists, Inc. Complete Employment
Page 21/34

Chart #20Top 5 Location Quotients by Occupation vs. Nationwide Occupations 2010
Source: Economic Modeling Specialists, Inc. Complete Employment
Chart #21Top 5 Location Quotients by Occupation vs. Nationwide Occupations 2011
Source: Economic Modeling Specialists, Inc. Complete Employment
Seattle Metro Area Non-Profit Arts and Arts-Active Organization Counts 2011To view detailed information regarding the number of non-profit arts and arts-active organizations located inSeattle, see Table #9 and Charts #15 and #16. In 2011, there were 329 non-profit arts and arts-activeorganizations in the Seattle Metro Area. Theater organizations had the largest proportional share of artsorganizations, followed by music and dance organizations. Cultural and ethnic awareness organizations made upthe largest proportional share of the area’s arts-active organizations in 2011.
Page 22/34

Table #12Seattle Metro Area Non-Profit Arts and Arts-Active Organizations by Type 2011
Region: Seattle Metro Area
Arts Organizations 2011 Number Share Arts-Active Organizations 2011 Number ShareArt Museums 2 1.10% Other Arts & Culture Organizations 8 5.41%
Arts & Culture 10 5.52% Fund Raising & Fund Distribution 4 2.70%
Arts & Humanities Councils & Agencies 5 2.76% Management & Technical Assistance 0 0.00%
Arts Education 11 6.08% Professional Societies & Associations 3 2.03%
Arts Services 1 0.55% Single Organization Support 23 15.54%
Alliances & Advocacy 3 1.66% Other Arts & Culture Support Organzations 3 2.03%
Ballet 1 0.55% Children's Museums 1 0.68%
Bands & Ensembles 6 3.31% Commemorative Events 1 0.68%
Dance 17 9.39% Community Celebrations 0 0.00%
Film & Video 10 5.52% Cultural/Ethnic Awareness 28 18.92%
Folk Arts 3 1.66% Fairs 3 2.03%
Music 24 13.26% Folk Arts Museums 0 0.00%
Opera 3 1.66% Historical Organizations 10 6.76%
Performing Arts 11 6.08% Historical Societies & Historic Preservation 11 7.43%
Performing Arts Centers 6 3.31% History Museums 5 3.38%
Singing & Choral Groups 15 8.29% Humanities 11 7.43%
Symphony Orchestras 11 6.08% Media & Communications 6 4.05%
Theater 33 18.23% Museums 3 2.03%
Visual Arts 9 4.97% Natural History & Natural Science Museums 0 0.00%
Performing Arts School 8 5.41%
Printing & Publishing 11 7.43%
Radio 5 3.38%
Research Institutes & Public Policy Analysis 0 0.00%
Science & Technology Museums 2 1.35%
Television 2 1.35%
Totals 181 100% Totals 148 100%Source: National Center for Charitable Statistics, Core PC Database for Arts, Culture and Humanities Organizations
Page 23/34

Chart #22Arts Organizations % Share 2011
Source: National Center for Charitable Statistics, Core PC Database for Arts, Culture and Humanities Organizations
Chart #23Arts-Active Organizations % Share 2011
Source: National Center for Charitable Statistics, Core PC Database for Arts, Culture and Humanities Organizations
Seattle Metro Area Non-Profit Arts Organization Revenue 2011Arts organizations are generally qualified within the CVI™ as organizations with a primary mission in presenting orserving media that are traditionally categorized as the arts. These types of organizations include the traditionallysubsidized arts, such as visual arts museums, the symphony, the opera, the ballet and the theater. In 2011, $226.2million in revenues were generated by non-profit arts organizations within the metro area. The greatest proportionof these revenues came from program revenues, gifts, and contributions. The organization revenues measuredwithin this study can be affected by the number of organizations reporting from year to year, categorization, andgeneral reporting errors as submitted by individual agencies, disbursements of federal grants, and individualorganizations’ fundraising efforts, such as capital campaigns. Generally, these fluctuations occur throughout
Page 24/34
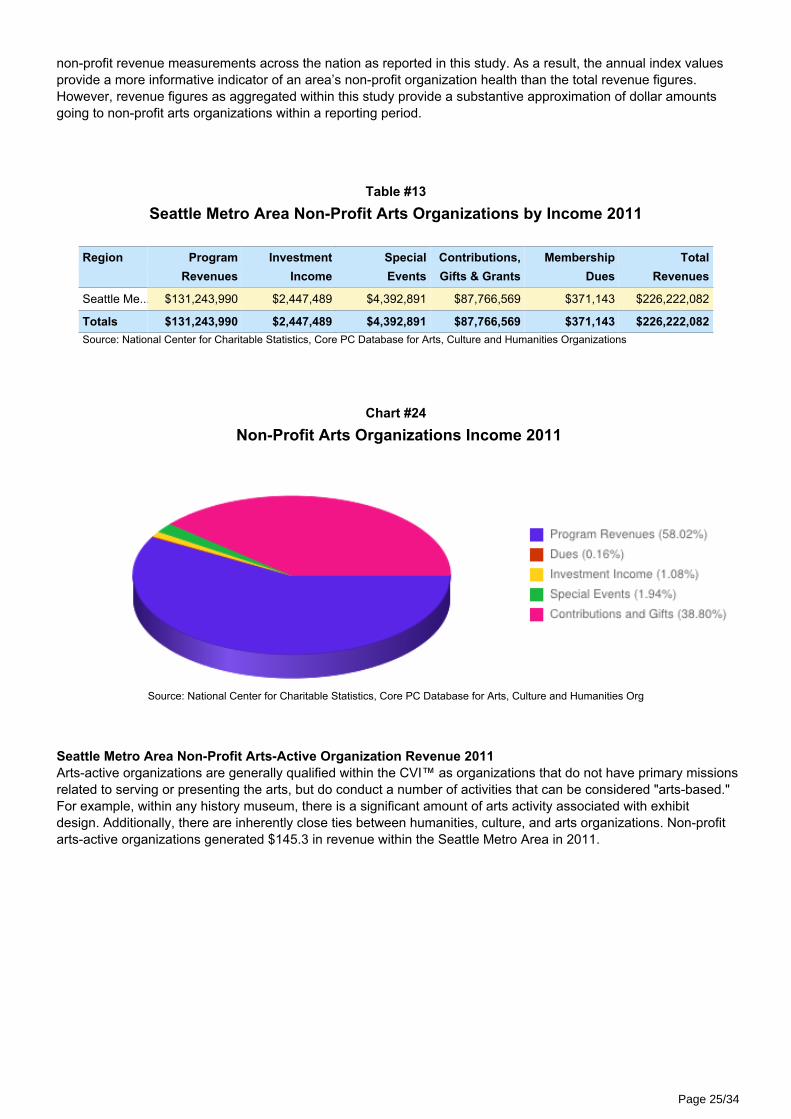
non-profit revenue measurements across the nation as reported in this study. As a result, the annual index valuesprovide a more informative indicator of an area’s non-profit organization health than the total revenue figures.However, revenue figures as aggregated within this study provide a substantive approximation of dollar amountsgoing to non-profit arts organizations within a reporting period.
Table #13Seattle Metro Area Non-Profit Arts Organizations by Income 2011
Region Program Investment Special Contributions, Membership Total Revenues Income Events Gifts & Grants Dues Revenues
Seattle Me... $131,243,990 $2,447,489 $4,392,891 $87,766,569 $371,143 $226,222,082
Totals $131,243,990 $2,447,489 $4,392,891 $87,766,569 $371,143 $226,222,082Source: National Center for Charitable Statistics, Core PC Database for Arts, Culture and Humanities Organizations
Chart #24Non-Profit Arts Organizations Income 2011
Source: National Center for Charitable Statistics, Core PC Database for Arts, Culture and Humanities Org
Seattle Metro Area Non-Profit Arts-Active Organization Revenue 2011Arts-active organizations are generally qualified within the CVI™ as organizations that do not have primary missionsrelated to serving or presenting the arts, but do conduct a number of activities that can be considered "arts-based."For example, within any history museum, there is a significant amount of arts activity associated with exhibitdesign. Additionally, there are inherently close ties between humanities, culture, and arts organizations. Non-profitarts-active organizations generated $145.3 in revenue within the Seattle Metro Area in 2011.
Page 25/34
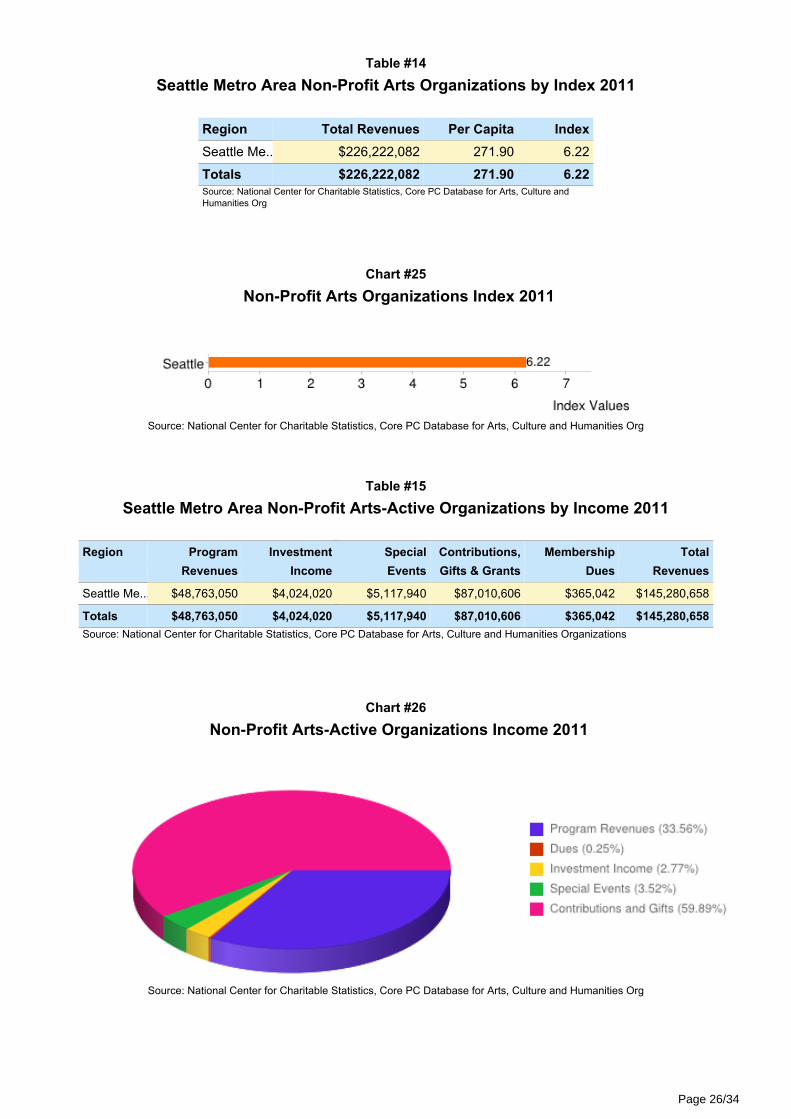
Table #14Seattle Metro Area Non-Profit Arts Organizations by Index 2011
Region Total Revenues Per Capita IndexSeattle Me... $226,222,082 271.90 6.22
Totals $226,222,082 271.90 6.22Source: National Center for Charitable Statistics, Core PC Database for Arts, Culture andHumanities Org
Chart #25Non-Profit Arts Organizations Index 2011
Source: National Center for Charitable Statistics, Core PC Database for Arts, Culture and Humanities Org
Table #15Seattle Metro Area Non-Profit Arts-Active Organizations by Income 2011
Region Program Investment Special Contributions, Membership Total Revenues Income Events Gifts & Grants Dues Revenues
Seattle Me... $48,763,050 $4,024,020 $5,117,940 $87,010,606 $365,042 $145,280,658
Totals $48,763,050 $4,024,020 $5,117,940 $87,010,606 $365,042 $145,280,658Source: National Center for Charitable Statistics, Core PC Database for Arts, Culture and Humanities Organizations
Chart #26Non-Profit Arts-Active Organizations Income 2011
Source: National Center for Charitable Statistics, Core PC Database for Arts, Culture and Humanities Org
Page 26/34
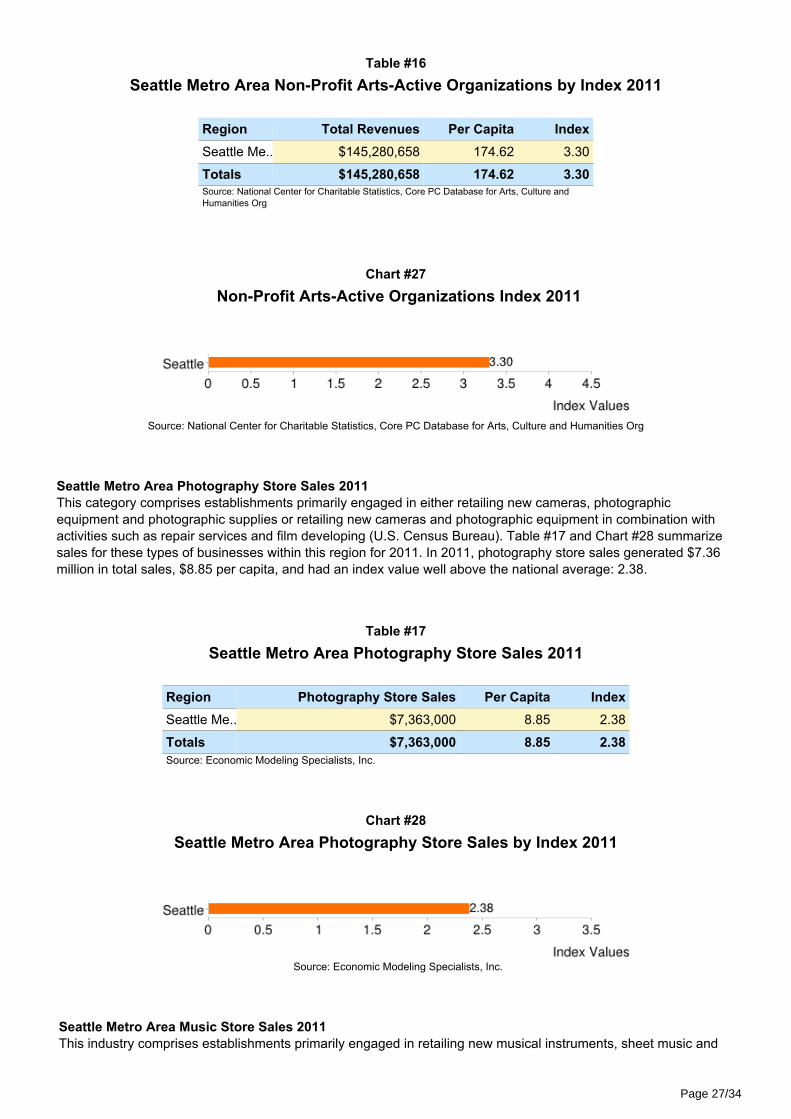
Table #16Seattle Metro Area Non-Profit Arts-Active Organizations by Index 2011
Region Total Revenues Per Capita IndexSeattle Me... $145,280,658 174.62 3.30
Totals $145,280,658 174.62 3.30Source: National Center for Charitable Statistics, Core PC Database for Arts, Culture andHumanities Org
Chart #27Non-Profit Arts-Active Organizations Index 2011
Source: National Center for Charitable Statistics, Core PC Database for Arts, Culture and Humanities Org
Seattle Metro Area Photography Store Sales 2011This category comprises establishments primarily engaged in either retailing new cameras, photographicequipment and photographic supplies or retailing new cameras and photographic equipment in combination withactivities such as repair services and film developing (U.S. Census Bureau). Table #17 and Chart #28 summarizesales for these types of businesses within this region for 2011. In 2011, photography store sales generated $7.36million in total sales, $8.85 per capita, and had an index value well above the national average: 2.38.
Table #17Seattle Metro Area Photography Store Sales 2011
Region Photography Store Sales Per Capita IndexSeattle Me.. $7,363,000 8.85 2.38
Totals $7,363,000 8.85 2.38Source: Economic Modeling Specialists, Inc.
Chart #28Seattle Metro Area Photography Store Sales by Index 2011
Source: Economic Modeling Specialists, Inc.
Seattle Metro Area Music Store Sales 2011This industry comprises establishments primarily engaged in retailing new musical instruments, sheet music and
Page 27/34

related supplies, or retailing new products in combination with musical instrument repair, rental, or music instruction(U.S. Census Bureau). Table #18 and Chart #29 summarize sales within these types of businesses in SeattleMetro Area, which generated $10.9 million in total sales, $13.12 per capita, and had an individual CVI™ value of1.38 in 2011.
Table #18Seattle Metro Area Music Store Sales 2011
Region Music Store Sales Per Capita IndexSeattle Me... $10,916,000 13.12 1.38
Totals $10,916,000 13.12 1.38Source: Economic Modeling Specialists, Inc.
Chart #29Seattle Metro Area Music Store Sales by Index 2011
Source: Economic Modeling Specialists, Inc.
Seattle Metro Area Book and Record Store Sales 2011This CVI™ category comprises establishments primarily engaged in retailing new books as well as establishmentsprimarily engaged in retailing new prerecorded audio and video tapes, CDs, and records (U.S. Census Bureau).Table #19 and Chart #30 summarize sales within these types of businesses within the Seattle Metro Area. In2011, book and record stores in the region generated $37 million in total sales, $44.48 per capita, and had anindividual index value of 1.75.
Table #19Seattle Metro Area Book and Record Store Sales 2011
Region Bookstore and Record Per Capita IndexStore Sales
Seattle Me... $37,009,000 44.48 1.75
Totals $37,009,000 44.48 1.75Source: Economic Modeling Specialists, Inc.
Page 28/34

Chart #30Seattle Metro Area Book and Record Store Sales by Index 2011
Source: Economic Modeling Specialists, Inc.
Seattle Metro Area Art Dealer Revenues 2011This category includes establishments primarily engaged in retailing original and limited edition artworks (U.S.Census Bureau). Table #20 and Chart #31 summarize sales within these types of businesses in the metro region.Art dealers in the region generated revenues of $18.1 million, $21.71 per capita, and had an individual CVI™ valueof 1.58 in 2011.
Table #20Seattle Metro Area Art Dealer Revenues 2011
Region Art dealers Per Capita IndexSeattle Me... $18,065,000 21.71 1.58
Totals $18,065,000 21.71 1.58Source: Economic Modeling Specialists, Inc.
Chart #31Seattle Metro Area Art Dealer Revenues by Index 2011
Source: Economic Modeling Specialists, Inc.
Seattle Metro Area Independent Artist Revenues 2011This category includes independent (i.e. freelance) individuals primarily engaged in performing in artisticproductions, creating artistic and cultural works or productions, or providing the technical expertise necessary forthese productions (U.S. Census Bureau). Table #21 and Chart #32 summarize sales within these types ofbusinesses within the region. Independent artists generated total revenues of $233.1 million, $280.22 per capita,and had a 2011 index value that was well above the national average: 2.60.
Page 29/34

Table #21Seattle Metro Area Independent Artist Revenues 2011
Region Independent artists, writers, Per Capita Indexand performers
Seattle Me... $233,144,000 280.22 2.60
Totals $233,144,000 280.22 2.60Source: Economic Modeling Specialists, Inc.
Chart #32Seattle Metro Area Independent Artist Revenues by Index 2011
Source: Economic Modeling Specialists, Inc.
Seattle Metro Area Performing Arts Participation Revenues 2011This category includes theater companies and dinner theaters, musical groups and artists, and other performingarts companies primarily engaged in producing live theatrical productions (U.S. Census Bureau). Table #22 andChart #33 summarize sales within these types of businesses in this region. Performing arts participation generatedtotal revenues of $187.5 million, $225.38 per capita, and had the highest 2011 individual CVI™ category value of4.55.
Table #22Seattle Metro Area Performing Arts Participation Revenues 2011
Region Performing Arts Participation Per Capita IndexSeattle Me... $187,512,000 225.38 4.55
Totals $187,512,000 225.38 4.55Source: Economic Modeling Specialists, Inc.
Chart #33Seattle Metro Area Performing Arts Participation Revenues by Index 2011
Source: Economic Modeling Specialists, Inc.
Technical Report and Understanding the CVI™While the informational value of this report is immense, the potential benefit to arts advocacy,planning, and policy-making is equally great. In order to realize the practical value of this
Page 30/34

research, it is important to review and consider the history of the CVI™ and its differentiationfrom economic impact studies. Some suggestions for making use of the research are alsopresented here to encourage immediate application of the research. Finally, the sources ofCVI™ data are itemized to provide transparency of the research process. Developing the Creative Vitality™ IndexThe CVI™ was developed in the context of innovations in cultural policy and economicdevelopment. The CVI™ was initially conceived to help public sector arts agencies clearlycommunicate that their work encompasses a much larger segment of creative economicactivity than had previously been the case. This was necessary because, beginning in themid 1960s, when state arts agencies were established and city arts agencies were eitherfounded or expanded, the primary focus of these entities was on the growth of the supplyand quality of primarily non-profit-based arts activities. These entities made great progress in this area. Once the supply and quality of non-profitarts activities was greatly bolstered, however, the public sector funders of the non-profit artsfield began to consider how their goals and the work of the non-profit arts were part of amuch larger creative system. They also became aware that the non-profit arts and public artspolicy depended on the health of that larger system to survive in the present and thrive in thefuture. Simultaneous with these developments, practitioners from fields representing for-profitcreative activities and occupations began to discuss the creative economy in broad, highlyinclusionary terms. The arts field and public sector arts funders embraced this broaderconcept as reflective of how they envisioned their work—as a stimulative part of an overallcreative system and not simply as suppliers of funding to maintain a supply ofnon-profit-sourced arts opportunities. The CVI™ reflects this broader systems-orientedthinking and reinforces the fact that the non-profit arts and public arts agencies are part of aninterdependent whole called “the creative sector.” The CVI™ grew out of a conversation about whether to undertake an economic impact studyof the arts. The staff leadership of the Washington State Arts Commission and the SeattleOffice of Arts & Cultural Affairs, in collaboration with others, explored ways to expand andenrich the economic argument for support of the arts and especially public funding of thearts. In doing so, the group was influenced by two national conversations concerningeconomic development: the defining of a creative economy and the outlining of the conceptof economic development clusters. Those conversations did something the non-profit artscommunity was very late in doing—they included the related for-profit creative sector in auniverse normally reserved for non-profits. The public value work articulated by Mark Moore also played a role in the development of theCVI™. That work helped the public sector component of the non-profit arts funding communitymove away from a perspective oriented toward saving the arts to considering ways to beresponsive to what citizens wanted in the arts. The approach also worked to shape agencydeliverables to reflect their actual value to the public rather than the value arts aficionadosconsidered them to have for the public. One result of this influence was that the CVI™ wasdeveloped in a context of thinking in which individuals are assumed to have choices and that,to remain viable, public sector arts funders need to offer choices the public will value andthus select. In this concept of selection is the understanding that choice in the arts rangesoutside the non-profit arts and that the public sector arts agency needs to ensure that suchchoice is available. The Relationship of the CVI™ to Economic Impact StudiesAlthough it evolved from a discussion of whether to commission an economic impactstudy, the CVI™ is not an economic impact study of the arts. Economic impact studies are
Page 31/34

enumerations of the total economic value and impact of a specific basket of arts activities onthe community, taking into account estimates of the ripple effect on jobs and revenues inother non-related industries. The majority of such studies focus on the non-profit art sectorand either measure its impact exclusively or introduce measures of the impact of selectedfor-profit activities in a supplementary manner. The CVI™ utilizes some of the data typicallyincluded in arts economic impact studies; however, it draws on many more data streams,and its goal is quite different in that it seeks to provide an indicator of the relative health ofthe economic elements of the creative economy. Economic impact studies are rooted in advocacy and generally have as a core purpose thedefinition of the non-profit arts sector as a meaningful component of the larger economicsystem. The results of such studies are commonly used to argue for the allocation of scarcebudget dollars to the arts because a dollar invested in the arts multiplies many times overand helps nurture a more robust overall economy. These studies have also been used tohelp the arts compete with other discretionary forms of government spending--and oftenthese other interests have their own economic impact studies. The studies have been usedmost effectively to counteract the misguided notion that funds invested in the non-profit artsare removed from the economy and thus play no role in building or sustaining it. Economic impact studies have also been commissioned to call attention to the size andscope of arts and culture as a component of the overall economic activity of an area. Oftencommunity leaders and the public are only familiar with one segment of the arts through theirpersonal acquaintance with a single institution or discipline. The economic impact studyaggregates information in ways that call attention to the size and scope of a cluster ofendeavors that are often considered to be of minor importance in economic terms. As aresult, the prestige of the arts and culture community in an area is enhanced, and the abilityof the sector to be heard is often increased. Although the CVI™ can partially address each of the uses to which economic impact studiesare employed, it has a different purpose. The CVI™ is about exploring a complex set ofrelationships and changes in the dynamics of those relationships over time. It is not areplacement for economic impact studies, but can be a complement to them. Making Use of the Creative Vitality™ IndexThe Creative Vitality™ Index is designed to serve as a tool to inform public policy decisionmaking and to support the work of advocates for the development of the creative economy.Here are some of the major uses of the CVI™: as a definitional tool, the index can be used tocall attention to and educate the community at-large concerning the components anddynamics of the creative economy. Of particular significance is the promotion of the conceptthat the creative economy includes both the for-profit and the non-profit arts-related activitiesof an area. Many economic impact studies centered on the arts have focused almost entirelyon the non-profit sector, and the inclusion of for-profit activities is, for many, a newconceptualization of the role of the arts in an economy. This approach locates all arts andarts-related creative activities in a continuum of creative activities. The index can serve as a source of information for advocacy messaging. Individualsengaged in advocacy on behalf of the creative economy as a whole or elements of it can usethe index to do some of the following: Call the attention of the public to significant changes in the creative economy ecosystem. Forexample, if contributions from private foundations drop substantially in a year and threemajor architectural firms leave the area, advocates for a healthy creative economy can callattention to those factors as negative elements that will affect an overall ecosystem.Similarly, if non-profit arts groups at the same time experience increases in income fromindividuals and there are substantial increases in employment within other major creative
Page 32/34

occupations such as graphic design and advertising, the negative impact of the events notedabove may be cushioned or alleviated altogether. Underscore the economic relationships between the for-profit sector and the non-profit sectorand make the point that a healthy non-profit arts sector is important to the development of ahealthy for-profit sector. Advocate for improvements to the allocation of resources or the creation of policies that willincrease the index values through the expansion of the role of a creative economy in aregion. Serve as a framework upon which to define and build a creative coalition. With thecomponents of the index setting forth a vision for a creative community rather than anon-profit arts community, those who wish to build coalitions to influence change for thebenefit of the development of the creative economy have a broader and deeper platform fromwhich to begin the conversation. Benchmark an area of endeavor and lay the groundwork for the improvement of one or moreaspects of the creative economy. The index can serve as an initial diagnostic tool to create abaseline and then can be used to measure progress in that area. Elected officials and civicleaders can use the index as a starting point for discussing ways in which an area's localeconomy can be enriched through the development of the creative-economy segment of thatcommunity. More on the CVI™ Data SourcesIndex data streams are analyzed by WESTAF and taken from two major data partners: theUrban Institute's National Center for Charitable Statistics and Economic ModelingSpecialists, International (EMSI). The Urban Institute’s National Center for Charitable Statistics aggregates information fromthe Internal Revenue Service’s 990 forms. The forms are required to be submitted bynon-profit 501(c) organizations with annual gross receipts of $25,000 or more. Organizationswith more than $25,000 but less than $250,000 in annual gross receipts can file a 990 EZform that collects less information. The CVI™ uses the information contained in the 990 formsto identify changes in charitable giving in an area. These numbers are the best available butare not absolute. Some numbers may not be reported because of errors made in thecompletion of the form. These include nested fund transfers within larger fund allocations thatinclude the arts in a significant way but are not broken out and/or the failure to capture databecause an organization is either not required to file a 990 or does not file the full 990 form,thus limiting the level of data available. Economic Modeling Specialists, International's (EMSI) expertise is centered on regional economics,data analysis, programming, and design so that it can provide the best available productsand services for regional decision makers. In an effort to present the most complete possiblepicture of local economies, EMSI estimates jobs and earnings for all workers using Bureau ofLabor Statistics data, data from the U.S. Bureau of Economic Analysis, and information fromthe U.S. Census Bureau. Because the number of non-covered workers in a given area canbe large, job figures from EMSI will often be much larger than those in state LMI data. Inorder to estimate occupation employment numbers for a region, EMSI first calculatesindustry employment, then uses regionalized staffing patterns for every industry and appliesthe staffing patterns to the jobs by industry employment data in order to convert industries tooccupations. EMSI bases occupation data on industry data because it is generally morereliable and is always published at the county level, whereas occupation data is onlypublished by Occupational Employment Statistics (OES) region (usually 4-6 economicallysimilar counties). Occupation employment data includes proprietors and self-employed
Page 33/34

workers. EMSI uses nearly 90 federal, state and private sources including the U.S.Department of Commerce, the U.S. Department of Labor, The U.S. Department ofEducation, the U.S. Department of Housing and Urban Development, The U.S. Departmentof Health and Human Services, the U.S. Postal Service, and the Internal Revenue Service.(Partially Reprinted from www.economicmodeling.com) Getting More Out of the CVI™WESTAF’s research and development team is committed to delivering the highest qualityresearch in broadly accessible formats. Please visit cvi.westaf.org to learn more about theCVI™ and how it can be additionally useful.
Page 34/34