seasonal variations and biodiversity indices of phytoplankton in ...
16
19 Bioinfo Publications BIOINFO Aquatic Ecosystem BIOINFO Aquatic Ecosystem Volume 1, Issue 1, 2011, PP-19-34 Available online at http://www.bioinfo.in/contents.php?id=257 STUDY OF PHYTOPLANKTONS BIODIVERSITY AND CORRELATION COEFFICIENT IN HARSOOL-SAVANGI DAM, DISTRICT AURANGABAD, INDIA. SHINDE S.E. 1 , PATHAN T.S. 2 , SONAWANE D.L. 1 1 Department of Zoology, Dr. Babasaheb Ambedkar Marathwada University, Aurangabad, (M.S.) India. 2 Department of Zoology Kalikadevi Arts, Commerce And Science College, Shirur (K.A.) Shirur, Dist. Beed (M.S.) India. *Corresponding Author: Email- [email protected] Mob- 09021515358 Received: October 06, 2011; Accepted: November 30, 2011 Abstract-The present study concerns seasonal variations, correlation coefficient and biodiversity indices of phytoplankton during January to December 2009 in the Harsool-Savangi dam, Aurangabad [M.S] India. A total of 35 taxa were recorded of which 15 were Chlorophyceae, 7 Bacillariophyceae, 7 Cyanophyceae and 6 Euglenophyceae. We present correlation coefficient, percentage wise compositions, biodiversity indices and population density of these phytoplanktons taxa. Maxima were recorded at the north site in summer and minima at the south site during the monsoon. Correlation coefficient indicates show high significant positive and negative relationship (p < 0.01 level) and also show significant positive and negative relationship (p < 0.05 level). Key Words- Phytoplanktons, Seasonal variations, biodiversity indices, Percentagewise compositions, correlation coefficient, Harsool-Savangi dam. Introduction Aquatic plants are important as they supply food, shade and shelter for many aquatic organisms. Among the aquatic biota, the pelagic and benthic forms are extensively studied for faunistic density and productivity. The aquatic Phytal realm attracted the attention of the systematises and ecologists as they afford a variety of bio-spaces for a multitude of animal life and sub serve as breeding and feeding grounds. Algal species like spirulina are used for production of cheap proteins; while species like spirogyra are employed for biological treatment of polluted water due to its capacity to absorb and eliminate the pollutants from the sample. In an environmental impact study, phytoplanktons are important as they are sensitive to changes in the environment. Thus, phytoplanktons help to indicate changes and fluctuations (Hynes, 1970). While reviewing the work on plankton algae of streams and Rivers stated that the plankton development was more important insides submerged vegetation near the bank of moderately fast flowing water. Phytoplanktons constitute the basic of nutritional cycle of an ecosystem (Kaushik et al., 2002). In limnology greater stress is usually laid on correlation studies, as the structure and function of an aquatic ecosystem depends on interdependent factors (Ganapati, 1960; Dimmick and Lemly, 1982 and Kenneth, 1990). A simple correlation study is found to be the primary aspect to show interdependent relationship which can be confirmed by multiple correlation studies or cluster analysis. The multiple correlation between more than two variables helps in better understanding of biotic and abiotic factors and also in the assessment of quality of water (Tiwari et al., 1986). Much work has been carried out in India on the phytoplanktons of fresh water habitats (Jawale and Kumawat, 2000; Sahat et al., 2001; Das et al., 2002, More and Nandan, 2003; Sirsat et al., 2004; Pawar and Pulle, 2005; Pawar et al., 2006; Khapekar and Nandkar, 2007; Magar, 2008; Laskar and Gupta, 2009 and Hosmani, 2010). To maintenance healthy aquatic ecosystem are dependents on the abiotic properties of water and the biological diversity of the ecosystem (Harikrishnan et al., 1999). Diversity, distribution, abundance and variation in the biotic factors provide information of energy turnover in the aquatic systems (Forsberg, 1982). Hence for any scientific utilization of water resources plankton study is of primary interest. It has been recognized that seasonal changes, composition and production of benthic algae are affected by water chemistry and sediment structure. Algae, mostly autotrophic organisms, receive most of their nutrition from dissolved chemicals in water. Thus, many authors believe that they should be good indicators of the conditions prevailing in the aquatic environment and algae are widely used as bioindicators to monitor eutrophication, pollution and water quality (Round, 1984). Keeping this view in mind present study has been undertaken to assess seasonal mean values, seasonal standard deviation, orderwise total percentage, species richness, species diversity, species evenness and
Transcript of seasonal variations and biodiversity indices of phytoplankton in ...

19 Bioinfo Publications
BIOINFO Aquatic Ecosystem
BIOINFO Aquatic Ecosystem Volume 1, Issue 1, 2011, PP-19-34 Available online at http://www.bioinfo.in/contents.php?id=257
STUDY OF PHYTOPLANKTONS BIODIVERSITY AND CORRELATION COEFFICIENT IN HARSOOL-SAVANGI DAM, DISTRICT AURANGABAD, INDIA. SHINDE S.E. 1, PATHAN T.S.2, SONAWANE D.L.1 1Department of Zoology, Dr. Babasaheb Ambedkar Marathwada University, Aurangabad, (M.S.) India. 2Department of Zoology Kalikadevi Arts, Commerce And Science College, Shirur (K.A.) Shirur, Dist. Beed (M.S.) India. *Corresponding Author: Email- [email protected] Mob- 09021515358
Received: October 06, 2011; Accepted: November 30, 2011
Abstract-The present study concerns seasonal variations, correlation coefficient and biodiversity indices of phytoplankton during January to December 2009 in the Harsool-Savangi dam, Aurangabad [M.S] India. A total of 35 taxa were recorded of which 15 were Chlorophyceae, 7 Bacillariophyceae, 7 Cyanophyceae and 6 Euglenophyceae. We present correlation coefficient, percentage wise compositions, biodiversity indices and population density of these phytoplanktons taxa. Maxima were recorded at the north site in summer and minima at the south site during the monsoon. Correlation coefficient indicates show high significant positive and negative relationship (p < 0.01 level) and also show significant positive and negative relationship (p < 0.05 level). Key Words- Phytoplanktons, Seasonal variations, biodiversity indices, Percentagewise compositions, correlation coefficient, Harsool-Savangi dam. Introduction Aquatic plants are important as they supply food, shade and shelter for many aquatic organisms. Among the aquatic biota, the pelagic and benthic forms are extensively studied for faunistic density and productivity. The aquatic Phytal realm attracted the attention of the systematises and ecologists as they afford a variety of bio-spaces for a multitude of animal life and sub serve as breeding and feeding grounds. Algal species like spirulina are used for production of cheap proteins; while species like spirogyra are employed for biological treatment of polluted water due to its capacity to absorb and eliminate the pollutants from the sample. In an environmental impact study, phytoplanktons are important as they are sensitive to changes in the environment. Thus, phytoplanktons help to indicate changes and fluctuations (Hynes, 1970). While reviewing the work on plankton algae of streams and Rivers stated that the plankton development was more important insides submerged vegetation near the bank of moderately fast flowing water. Phytoplanktons constitute the basic of nutritional cycle of an ecosystem (Kaushik et al., 2002). In limnology greater stress is usually laid on correlation studies, as the structure and function of an aquatic ecosystem depends on interdependent factors (Ganapati, 1960; Dimmick and Lemly, 1982 and Kenneth, 1990). A simple correlation study is found to be the primary aspect to show interdependent relationship which can be confirmed by multiple correlation studies or cluster analysis. The multiple correlation between more
than two variables helps in better understanding of biotic and abiotic factors and also in the assessment of quality of water (Tiwari et al., 1986). Much work has been carried out in India on the phytoplanktons of fresh water habitats (Jawale and Kumawat, 2000; Sahat et al., 2001; Das et al., 2002, More and Nandan, 2003; Sirsat et al., 2004; Pawar and Pulle, 2005; Pawar et al., 2006; Khapekar and Nandkar, 2007; Magar, 2008; Laskar and Gupta, 2009 and Hosmani, 2010). To maintenance healthy aquatic ecosystem are dependents on the abiotic properties of water and the biological diversity of the ecosystem (Harikrishnan et al., 1999). Diversity, distribution, abundance and variation in the biotic factors provide information of energy turnover in the aquatic systems (Forsberg, 1982). Hence for any scientific utilization of water resources plankton study is of primary interest. It has been recognized that seasonal changes, composition and production of benthic algae are affected by water chemistry and sediment structure. Algae, mostly autotrophic organisms, receive most of their nutrition from dissolved chemicals in water. Thus, many authors believe that they should be good indicators of the conditions prevailing in the aquatic environment and algae are widely used as bioindicators to monitor eutrophication, pollution and water quality (Round, 1984). Keeping this view in mind present study has been undertaken to assess seasonal mean values, seasonal standard deviation, orderwise total percentage, species richness, species diversity, species evenness and
Study of phytoplanktons biodiversity and correlation coefficient in Harsool-Savangi dam, District Aurangabad, India
20 BIOINFO Aquatic Ecosystem
Volume 1, Issue 1, 2011
correlation coefficient in Harsool-Savangi dam Aurangabad (M.S), India. Materials and Methods In the present study plankton sampling was taken for one years from January to December 2009, at four different sites (south, north, east and west) as shown in fig. 1 during summer (February, March, April and May), Monsoon (June, July, August and September) and winter (October, November, December and January). The geographical coordination 190 56’ 14.32” N and 750 21’ 30.56” E at Harsool-Savangi Dam Aurangabad, India. Plankton Analysis Plankton net [mesh size 25 µm] was swept on surface water [Secchi’s disc transparency zone] and plankton collected through the net was easily transferred in to separate plastic bottle/container. 100 liters of surface water was sieved through plankton net to obtain planktons. These were fixed and preserved in 4% formalin. The formalin fixed plankton samples were centrifuged at 1500-2000 rpm for 10-12 min. The phytoplanktons were settled at bottom, diluted to a desirable concentration in such a way that they could be easily counted individually, under compound binocular microscope and phytoplanktons were measured and multiplied with the dilution factors, using Sedgwick Rafter cell Welch (1948); Smith (1950), Dhanpati (2000), Trivedi and Goel (1986); Kodarkar et al., (1991) and APHA (2005). Species diversity, species richness and species evenness were calculated as for Ludwick and Reynold (1988). Community structure analysis: Three indices were used to obtain estimation of species diversity, species richness and species evenness.
1. Shannon and Weaver (1949) and Simpson (1949) diversity index values were obtained by using the following equation:
S H’ = - ∑ (Pi In Pi) (Shannon’s index) i = I S
= - ∑ ni(ni-1) / n(n-1) (Simpson index) i = I Where, Pi = Proportion of the first species. The proportions are given Pi=ni/N 2. Species richness (R1 and R2) obtained using the following equation. R1 = (S - 1) / In (n) (Margalef, 1958) R2 = S / √n (Menhinick, 1964) Where, R = Index of species richness S = Total number of species N = Total number of individuals
3. Species equitability or evenness was determined by using the following expression.
1) Evenness index 1 (E1): (Pielou, 1977) E1 = In (N1)/ In (N0)
2) Evenness index 2 (E2): (Sheldon, 1969) E2 = N1 /N0
3) Evenness index 3 (E3): (Heip, 1974) E3 = N1 - 1 /N0 - 1
4) Evenness index 4 (E4): (Hill, 1973) E2 = N2 /N1
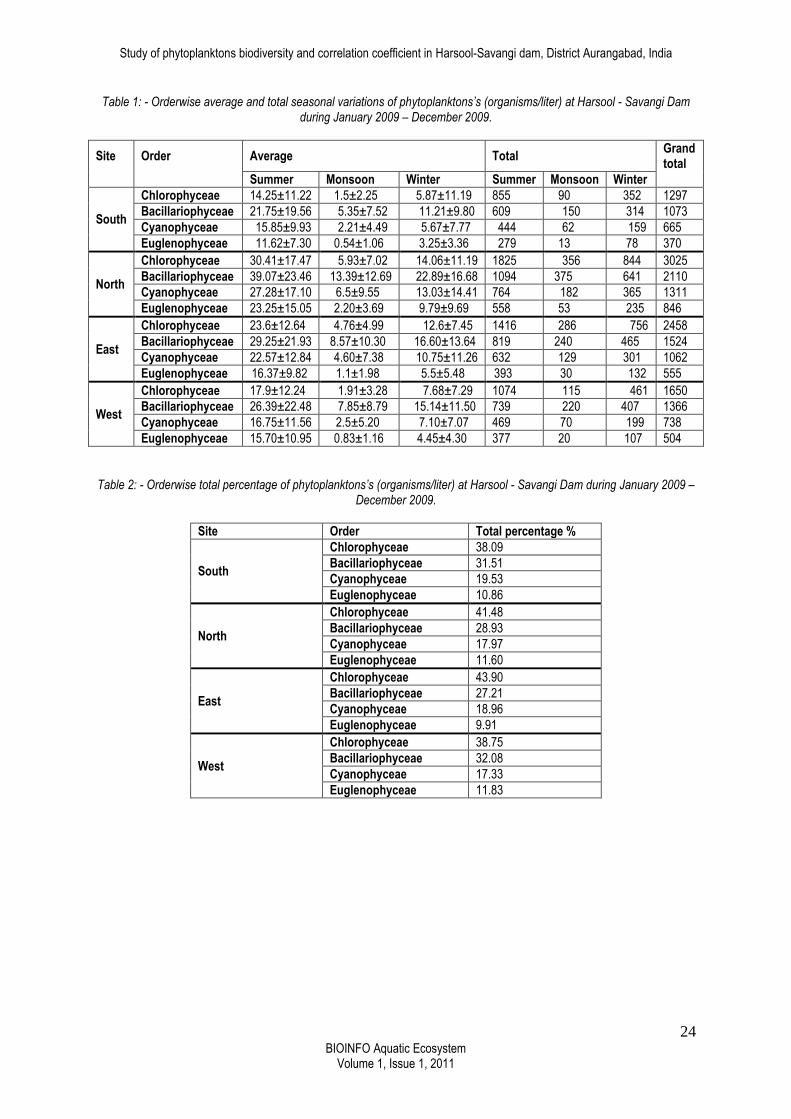
5) Evenness index 5 (E5): (Alatalo, 1981) E2 = N2 - 1 /N1 - 1 Where, N0 = Number of species on the sample N1 = Number of abundant species in the sample Results and Discussion Diversity of Phytoplanktons Detailed microscopic examination of phytoplanktons under compound microscope revealed that there were 4 groups consisting of 35 genera of phytoplankton in order Chlorophyceae (15 genera), Bacillariophyceae (7 genera), Cyanophyceae (7 genera) and Euglenophyceae (6 genera). The species observed were of Chlorella sp., Hydrodicton sp., Chlamydomonos sp. Chara sp., Cladophora sp., Closterium sp., Cosmarium sp., Oedogonium patulum, Oedogonium sp., Pediastrum duplex, Pediastrum simplex, Pediastrum sp., Spirogyra sp., Ulothrix zonata and Volvox sp. (Chlorophyceae); Diatom sp., Navicula subtilis, Navicula accomda, Navicula sp., Nitzschia denticulate, Nitzschia sp., and Pinnularia sp. (Bacillariophyceae); Anabaena sp., Anabaena beckii, Microcystic sp., Nostoc sp., Oscillatoria chlorina, Oscillatoria cortiam and Spiralina sp. (Cyanophyceae); Euglena acus, Euglena granulate, Euglena sp., Euglena elongate, Phacus sp. and Trachelomons sp. (Euglenophyceae). Average and total seasonal values, seasonal standard deviation, orderwise total percentage, species richness, species diversity and species evenness of phytoplanktons data has been presented in table No. 1 to 3 and graphs with standard deviation values represented in fig. 1 to 8. Orderwise average seasonal variation and seasonal total population density of phytoplanktons in that maximum Chlorophyceae recorded were 30.41 ± 17.47 (organisms/liter) and 1825 (organisms/liter) in summer at north site, minimum Chlorophyceae recorded were 1.5 ± 2.25 (organisms/liter) and 90 (organisms/liter) in monsoon at south site. Maximum Bacillariophyceae recorded were 39.07 ± 23.46 (organisms/liter) and 1094 (organisms/liter) in summer at north site, minimum Bacillariophyceae recorded were 5.35 ± 7.52 (organisms/liter) and 150 (organisms/liter) in monsoon at south site. Maximum Cyanophyceae recorded were 27.28 ± 17.10 (organisms/liter) and 764 (organisms/liter) in summer at north site, minimum Cyanophyceae recorded were 2.21 ± 4.49 (organisms/liter) and 62 (organisms/liter) in monsoon at south site. Maximum

Shinde SE, Pathan TS, Sonawane DI
21 Bioinfo Publications
Euglenophyceae recorded were 23.25 ± 15.05 (organisms/liter) and 558 (organisms/liter) in summer at north site, minimum Euglenophyceae recorded were 0.54 ± 1.06 (organisms/liter) and 13 (organisms/liter) in monsoon at south site (Table No. 1 Fig. 1 to 4). Maximum percentage of Chlorophyceae was recorded 43.90 % at east site; minimum percentage of Chlorophyceae was recorded 38.09 % at south site. Maximum percentage of Bacillariophyceae was recorded 32.08 % at west site; minimum percentage of Bacillariophyceae was recorded 27.21 % at east site. Maximum percentage of Cyanophyceae was recorded 19.53 % at south site; minimum percentage of Cyanophyceae was recorded 17.33 % at west site. Maximum percentage of Euglenophyceae was recorded 11.83 % at west site; minimum percentage of Euglenophyceae was recorded 9.91 % at east site (Table No. 2 and Fig. 5 to 8). Seasonally, phytoplanktons showed dominance during summer season followed by winter and monsoon season. During summer, increasing temperature enhances the rate of decomposition due to which the water became nutrient rich similarly due to concentration followed by evaporation in summer season the nutrient concentration increases and abundant food present in form of photosynthesis. The high phytoplanktons population density during the summer season could be related to stable hydrological factors and low water level; while low density during the monsoon season attributed to heavy flood and fresh water inflow. They were resumed again in monsoon due to dilution and high water level. Similar results have been reported by Hassan et al., (2010) they reported the minimum density of phytoplanktons during monsoon and maximum during summer in Euphrates River, Kifil city region of Iraq. Laskar and Gupta (2009) reported the minimum density of phytoplanktons during monsoon and maximum during summer in Chatla Lake, Assam. Begum and Narayana (2006) reported the minimum density of phytoplanktons during monsoon and maximum during summer in Lentic water bodies, Karnataka. Banakar (2005) reported the peak of phytoplanktons during April while lowest peak in July and August in village pond at Imalia (Vidisha) India. In study period i.e. January - December 2009 phytoplankton showed high significant positive relationship with transparency and pH, it showed high significant negative relationship with turbidity, electric conductivity, total solid, total dissolved solids, total suspended solids, dissolved oxygen, chemical oxygen demand, alkalinity, sulphate and phosphate, it showed significant positive relationship with water temperature (Table no. 3). Maximum Species richness was recorded 4.18 Margalef’s index (R1) and 0.59 Menhinick index (R2) at south site, minimum Species richness was recorded 3.82 Margalef’s index (R1) and 0.40 Menhinick index (R2) at north site. Maximum species diversity was recorded
0.31 Simpson’s index () at east site and 1.26 Shannon – Weiner index (H’) at south and west sites; minimum
species diversity was recorded 0.29 Simpson’s index ()
south and west sites; and 1.22 Shannon – Weiner index (H’) at east site. Maximum species evenness was recorded at south and west sites; minimum species evenness was recorded at north and east sites (Table No. 4). Phytoplanktons Species Diversity Index (PSDI),
Simpson’s index () which varied from 0 to 1, gives the probability that two individuals drawn at random from a population belong to the same species. Simply stated, if the probability was high that both individuals belong to the same species, then the diversity of the community sample was low. Shannon’s index (H'), combines species richness and spices evenness components as overall index of diversity. PSDI values of phytoplanktons were higher at south site. The higher values of Shannon’s Index (H'), indicated the greater species diversity. The greater species diversity means large food chain and more of inter-specific interactions and greater possibilities for negative feedback control which reduced oscillations and hence increases the stability of the community. According to May (1975) the Shannon-Weaver diversity index was related to both the total number of species and their relative abundances, and can be designated as a positive function of total number of species. These diversity indices indicated that the pond under study have a well balanced phytoplanktons community that enjoyed an even representation of several species indicating the dynamic nature of aquatic ecosystem. However, remedial measures should be undertaken to minimize the impact of pollution load as revealed by the ecological indicators. Equitability (evenness) was relatively high during the raining season indicating a reduction in the plankton diversity at this period (Adesalu and Nwankwo, 2008). Peet (1974) has reported that species diversity implies both richness and evenness in the number of species and equitability for the distribution of individual among the species. Evenness indices indicate whether all species in a sample are equally abundant. This means that species evenness decreased with increasing size of the plankton population. The indices E1, E2 and E3 are also sensitive to species richness while E4 and E5 are relatively unaffected by species richness. A number of previous reviews focused on phytoplanktons diversity (Harris, 1986). When using a diversity index such as Shannon-Weaver, phytoplanktons diversity with a strong seasonal component (Margalef, 1958). However, little is known concerning the diversity of epipelic algae in lakes and dam reservoirs in Turkey (Sahin, 2004; Akar and Sahin, 2006). In the Balikli Dam Reservoir, it was observed that the seasonal changes in diversity showed an inverse pattern with species number. This means that species evenness decreased with increasing size of the algal population. Quantitative counts showed clear seasonal variation in phytoplanktons cell numbers with maximum during early summer and autumn. Seasonal variations in abundance and composition of dam phytoplanktons are usually affected by the discharge, morphometry, hydrology, trophic status, and light availability (Kumari et al., 2006;

Study of phytoplanktons biodiversity and correlation coefficient in Harsool-Savangi dam, District Aurangabad, India
22 BIOINFO Aquatic Ecosystem
Volume 1, Issue 1, 2011
Reynolds, 2003; Reynolds, 2006; Leveque, 2006; Indra and Sivaji, 2006; Shiddamallayya and Pratima, 2008; Kolayli and Sahin, 2009). In present study the phytoplanktons population density was recorded maximum at north site might be due to River water entry in the dam with agricultural, domestic and waste due to human activities. Conclusion The present study shows detail seasonal variations and biodiversity indices of phytoplanktons in Harsool-Savangi dam, Aurangabad (M.S) India. 1) High value of species richness at south site i.e.
show longer food chain compare to other sites. 2) Simpson index higher values at north site i.e. show
the stable habitat (stability) compare to other sites. 3) According to Shannon index values 0 > 1 at north
site i.e. show the habitat is under stress polluted; 1 < 3 at south, east and west sites i.e. show not highly polluted.
4) In present study revealed that factors that governed the growth of phytoplankton are water temperature, transparency and pH.
5) The work will provide future strategies for development and biodiversity conservation in Harsool-savangi Dam.
Acknowledgments The authors are thankful to Head, Dept of Zoology, Dr. Babasaheb Ambedkar Marathwada University, Aurangabad-431004 (M.S) India for providing laboratory and library Facilities. We are grateful to UGC for providing financial assistance under SRF during the course of study. References
[1] Adesalu T.A. and Nwankwo D.I. (2008) Pakistan J. Biol. Sci., 11, 836-844.
[2] Akar B. and Sahin B. (2006) Fresenius Environ. Bulletin, 15, 48–54.
[3] Alatalo R. V. (1981) Oikos. 37: 199-204. [4] APHA (2005) Standard methods for the
examination of water and waste waters, 21st
Edn., Washington, DC. USA. [5] Banakar A.B., Manjappa S., Kiran B.R.,
Pullaiah E.T. and Ravikumar M. (2005) J.Aqua. Biol., 20: 25-30.
[6] Das A.C., Baruah B.K., Baruah D. and Sengupta S. (2002) Poll. Res, 21: 511-513.
[7] Dhanapathi M.V.S.S.S. (2000) Taxonomic notes on The Rotifers from India (1889 – 2000): Indian Association of Aquatic Biologists (IAAB), Hyderabad. Publ. 10: pp: 178.
[8] Dimmick J. F. and Lemly D. (1982) Hydrobiologia, 88: 299 – 307.
[9] Forsberg C. (1982) Hydrobio. 86: 143-146. [10] Ganapati S. V. (1960) Proc. Int. Assoc. Thepr.
Appl. Limnol., 11: 111 –112.
[11] Harikrishnan K., Sabu T., Sanil G., Paul M., Satish M. and Das M.R. (1999) Poll. Res, 18: 261-269.
[12] Harris G.P. (1986) Phytoplanktons Ecology, Structure, Function and Fluctuation, Chapman and Hall, London.
[13] Hassan Fikrat M., William Taylor, Mayson M.S., Al-Taee and Hassan Al-Fatlawi (2010) Journal of Environmental Biology, 31: 343-350.
[14] Heip C. (1974) Journal of Marine Biological Association. 54: 555-557.
[15] Hill M.O. (1973) Ecology. 54: 427-432. [16] Hynes H. B. N. (1970) The ecology of running
water. Liser port University, England. Torento press Canada, 216.
[17] IAAB (1998) Methodology for Water Analysis. [18] Indra V. and Sivaji S. (2006) J. Environ. Biol.,
Vol. 27: 723-725. [19] Jawale A.K. and D.A. (2000) Geobios, 29: 283-
285. [20] Kaushik A., Kumar K., Kanchan Taruna and
Sharma H. R. (2002) J. Environ. B. Niol. Vol. 23(3): 325-333.
[21] Kenneth M. M. (1990) Hydrobiologia, 208: 131 – 140.
[22] Khapekar R.R. and Nandkar P.B. (2007) Poll Res, 26(1): 155-160.
[23] Kodarkar M.S., Muley E.V. and Vasant Rao (1991) Kukatpally-Hussainsagar, Ecological studies on industrially polluted stream and its impact on freshwater Lake in Hyderabad, (IAAB) publication 1: 150.
[24] Kolayli S. and Sahin B. (2009) J. Environ. Biol., 30: 939-944.
[25] Kumar K. (1990) Management and development of Gobind sagar reservoir. A case study, Proc. Nat. Workshop Reservoir Fish: 13-20.
[26] Kumari S., Binu A., Kirubavathy K. and Thirumalnesan R. (2006) J. Environ. Biol., 27: 709-712.
[27] Laskar Hafsa Sultana and Susmita Gupta (2009) Journal of Environmental Biology, 30: 1007-1012.
[28] Leveque C. (2006) River and stream ecosystem of north western Africa. In: River and stream ecosystems of the world (Eds.: C.E. Cushing, K.W. Cummins and G.W. Minshall), University of California Press. pp. 519-536.
[29] Ludwik J.A. and Reynolds J.F. (1998) Statistical ecology a primer on methods and computing A Wiley-Interscience publication. New York. Pp 1-337.
[30] Magar U.R. (2008) Biodiversity of algal flora and limnological studies of Girna dam of Nashik district. Ph.D. Thesis, North Maharashtra University, Jalgaon.
[31] Margalef R. (1958) General Systematic, 3: 36-71.

Shinde SE, Pathan TS, Sonawane DI
23 Bioinfo Publications
[32] May R.M. (1975) Patterns of species abundance and diversity in Ecology and evolution of communities (Eds.: M.L. Cody and J.M. Diamond), The Belknap Pres of Harvard Univers ity Pres, Cambr idge, Massachusetts. pp. 81-120.
[33] Menhinick E.P. (1964) Ecol., 45: 859-881. [34] More Y.S. and Nandan S.N. (2003) Eco. Env.
& Cons. 9(3): 367-369. [35] Narayana J., Puttaiah E.T. and Basavaraja D.
(2008) J. Aqua. Biol., 23(1): 59 – 63. [36] Pawar S.K. and Pulle J.S. (2005) J. Aqua.
Biol., 20 (2): 123-128. [37] Peet R.K. (1974) Ann. Rev. Ecol. Systematic,
5: 285-307. [38] Pielou E.C. (1977) Mathematical Ecology,
Wiley, New York. [39] Reynolds C.S. (2003) Ecol. Model, 160: 191-
203. [40] Reynolds C.S. (2006) The ecology of
phytoplanktons. Cambridge Univ. Press, Cambridge, UK.
[41] Round F.E. (1984) The Ecology of Algae. Cambridge University Press, Cambridge.
[42] Sahat T., Manna N.K., Som Mujumdar and Bhattacharya I.N. (2001) Poll. Res. 20: 47-52.
[43] Sahin B. (2004) Turk. J. Biol., 28: 103-109. [44] Shannon C.E. and Weaver W. (1949) The
Mathematical Theory of Communication. University of Illinois Pres, Urbana.
[45] Sheldon A.L. (1969) Ecology. 50: 466-467. [46] Shiddamallayya N. and Pratima M. (2008) J.
Environ. Biol, 29: 303-308. [47] Simpson E.H. (1949) Nature, 163: 688. [48] Sirsat D.B., Ambore N.E. and Pulle J.S. (2004)
J. Aqua Biol. 19 (2): 7-10. [49] Smith G.M. (1950) The fresh-Water algae of
the United States, IInd Edition, McGraw-Hill book com. Inc. New York.
[50] Tiwari T.N., Das S.C. and Bose P.K. (1986) Acta. Ciencia Indica, 12 (P): 111 – 113.
[51] Trivedi R.K. and Goel P.K. (1986) Chemical and biological methods for water pollution studies, Environmental Publications, Karad (India).
[52] Welch P.S. (1948) Limnology methods, McGraw Hill Book Co. Inc. New York.
Study of phytoplanktons biodiversity and correlation coefficient in Harsool-Savangi dam, District Aurangabad, India
24 BIOINFO Aquatic Ecosystem
Volume 1, Issue 1, 2011
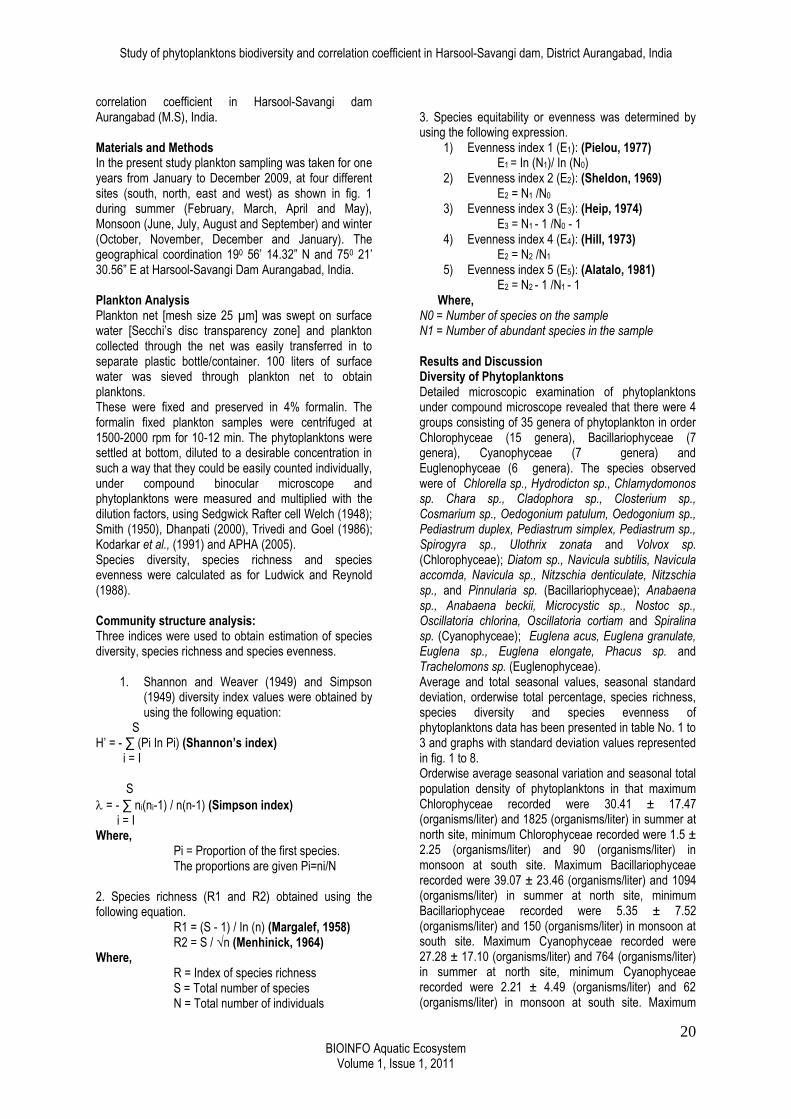
Table 1: - Orderwise average and total seasonal variations of phytoplanktons’s (organisms/liter) at Harsool - Savangi Dam during January 2009 – December 2009.
Site Order Average Total Grand total
Summer Monsoon Winter Summer Monsoon Winter
South
Chlorophyceae 14.25±11.22 1.5±2.25 5.87±11.19 855 90 352 1297
Bacillariophyceae 21.75±19.56 5.35±7.52 11.21±9.80 609 150 314 1073
Cyanophyceae 15.85±9.93 2.21±4.49 5.67±7.77 444 62 159 665
Euglenophyceae 11.62±7.30 0.54±1.06 3.25±3.36 279 13 78 370
North
Chlorophyceae 30.41±17.47 5.93±7.02 14.06±11.19 1825 356 844 3025
Bacillariophyceae 39.07±23.46 13.39±12.69 22.89±16.68 1094 375 641 2110
Cyanophyceae 27.28±17.10 6.5±9.55 13.03±14.41 764 182 365 1311
Euglenophyceae 23.25±15.05 2.20±3.69 9.79±9.69 558 53 235 846
East
Chlorophyceae 23.6±12.64 4.76±4.99 12.6±7.45 1416 286 756 2458
Bacillariophyceae 29.25±21.93 8.57±10.30 16.60±13.64 819 240 465 1524
Cyanophyceae 22.57±12.84 4.60±7.38 10.75±11.26 632 129 301 1062
Euglenophyceae 16.37±9.82 1.1±1.98 5.5±5.48 393 30 132 555
West
Chlorophyceae 17.9±12.24 1.91±3.28 7.68±7.29 1074 115 461 1650
Bacillariophyceae 26.39±22.48 7.85±8.79 15.14±11.50 739 220 407 1366
Cyanophyceae 16.75±11.56 2.5±5.20 7.10±7.07 469 70 199 738
Euglenophyceae 15.70±10.95 0.83±1.16 4.45±4.30 377 20 107 504
Table 2: - Orderwise total percentage of phytoplanktons’s (organisms/liter) at Harsool - Savangi Dam during January 2009 – December 2009.
Site Order Total percentage %
South
Chlorophyceae 38.09
Bacillariophyceae 31.51
Cyanophyceae 19.53
Euglenophyceae 10.86
North
Chlorophyceae 41.48
Bacillariophyceae 28.93
Cyanophyceae 17.97
Euglenophyceae 11.60
East
Chlorophyceae 43.90
Bacillariophyceae 27.21
Cyanophyceae 18.96
Euglenophyceae 9.91
West
Chlorophyceae 38.75
Bacillariophyceae 32.08
Cyanophyceae 17.33
Euglenophyceae 11.83

Shinde SE, Pathan TS, Sonawane DI
25 Bioinfo Publications
Table 3: Correlation matrix among the physico-chemical properties and phytoplanktons of Harsool-Savangi dam from January to December 2009.
Parameter Phytoplankton
W.T (0ºC) 0.66*
Turbidity (NTU) -0.94**
Tra. (cm) 0.99**
pH 0.77**
E.C (µmhos /cm) -0.99**
TS (mg/l) -0.99**
TDS (mg/l) -0.97**
TSS (mg/l) -0.97**
DO (mg/l) -0.99**
BOD (mg/l) -0.53
COD (mg/l) -0.99**
Alkalinity (mg/l) -0.99**
T.H (mg/l) 0.47
Sulphate (mg/l) -0.92**
Chloride (mg/l) 0.50
Nitrate (mg/l) 0.58
Phosphate (mg/l) -0.91**
Phytoplankton 1
** = Correlation is high significant at p < 0.01 level, ‘-’ indicate negative correlation, * = Correlation is significant at p < 0.05 level, W.T = Water temperature, Tra. = Transparency, E.C = Electrical conductivity, T.S = Total solids, T.D.S = Total Dissolved Solids, T.S.S. = Total Suspended Solids, DO= Dissolved Oxygen, BOD= Biochemical Oxygen Demand, COD= Chemical Oxygen Demand and T.H = Total Hardness.
Table 4: - Annual variations of phytoplanktons’s, biodiversity indices at Harsool – Savangi Dam during January 2009 – December 2009.
Indices Index South site North site East site West site
Species Richness
(N0) 35 35 35 35
(R1) 4.18 3.82 3.93 4.06
(R2) 0.59 0.40 0.46 0.53
Species Diversity
() 0.29 0.30 0.31 0.29
(H’) 1.26 1.24 1.22 1.26
(N1) 3.52 3.45 3.38 3.52
(N2) 3.44 3.33 3.22 3.44
Species Evenness
(E1) 0.36 0.34 0.34 0.35
(E2) 0.10 0.09 0.09 0.10
(E3) 0.07 0.07 0.07 0.07
(E4) 0.97 0.96 0.95 0.97
(E5) 0.96 0.95 0.93 0.96
(R1): Margalef’s index (R2): Menhinick index
(): Simpson’s index (H’): Shannon – Weiner index (N0): No. of all species (N1): No. of abundant species (N2): No. of very abundant species (E1): Evenness index (E2): Evenness index (E3): Evenness index (E4): Evenness index (E5): Evenness index

Study of phytoplanktons biodiversity and correlation coefficient in Harsool-Savangi dam, District Aurangabad, India
26 BIOINFO Aquatic Ecosystem
Volume 1, Issue 1, 2011
Chlorophyceae 2009
-10
0
10
20
30
40
50
60
South site North site East site West side
Sites
Avera
ge p
hyto
pla
nkto
n
org
an
ism
s/l
iter
Summer
Monsoon
Winter
Fig.1- Seasonal population variations in Chlorophyceae (organisms/liter) of different sites at Harsool-Savangi dam from January 2009 – December 2009.
Bacillariophyceae 2009
-10
0
10
20
30
40
50
60
70
South site North site East site West side
Sites
Avera
ge p
hyto
pla
nkto
n
org
an
ism
s/l
iter
Summer
Monsoon
Winter
Fig.2- Seasonal population variations in Bacillariophyceae (organisms/liter) of different sites at Harsool-Savangi dam from January 2009 – December 2009.
Cyanophyceae 2009
-10
0
10
20
30
40
50
South site North site East site West side
Sites
Avera
ge p
hyto
pla
nkto
n
org
an
ism
s/l
iter
Summer
Monsoon
Winter
Fig.3- Seasonal population variations in Cyanophyceae (organisms/liter) of different sites at Harsool-Savangi dam from January 2009 – December 2009.

Shinde SE, Pathan TS, Sonawane DI
27 Bioinfo Publications
Euglenophyceae 2009
-5
0
5
10
15
20
25
30
35
40
45
South site North site East site West side
Sites
Avera
ge p
hyto
pla
nkto
n
org
an
ism
s/l
iter
Summer
Monsoon
Winter
Fig.4- Seasonal population variations in Euglenophyceae (organisms/liter) of different sites at Harsool-Savangi dam from January 2009 – December 2009.
South site total percentage % (2009)
Chlorophyceae
37%
Bacillariophyceae
32%
Cyanophyceae
20%
Euglenophyceae
11%
Chlorophyceae Bacillariophyceae Cyanophyceae Euglenophyceae
Fig.5- Annual orderwise percentage population density in phytoplanktons of Harsool - Savangi Dam at south site during January 2009 – December 2009.
North site total percentage % (2009)
Chlorophyceae
41%
Bacillariophyceae
29%
Cyanophyceae
18%
Euglenophyceae
12%
Chlorophyceae Bacillariophyceae Cyanophyceae Euglenophyceae
Fig.6- Annual orderwise percentage population density in phytoplanktons of Harsool - Savangi Dam at north site during January 2009 – December 2009.

Study of phytoplanktons biodiversity and correlation coefficient in Harsool-Savangi dam, District Aurangabad, India
28 BIOINFO Aquatic Ecosystem
Volume 1, Issue 1, 2011
East site total percentage % (2009)
Chlorophyceae
44%
Bacillariophyceae
27%
Cyanophyceae
19%
Euglenophyceae
10%
Chlorophyceae Bacillariophyceae Cyanophyceae Euglenophyceae
Fig.7 - Annual orderwise percentage population density in phytoplanktons of Harsool - Savangi Dam at east site during January 2009 – December 2009.
West site total percentage % (2009)
Chlorophyceae, 38.75
Bacillariophyceae,
32.08
Cyanophyceae, 17.33
Euglenophyceae, 11.83
Chlorophyceae Bacillariophyceae Cyanophyceae Euglenophyceae
Fig.8- Annual orderwise percentage population density in phytoplanktons of Harsool - Savangi Dam at west site during January 2009 – December 2009.

Shinde SE, Pathan TS, Sonawane DI
29 Bioinfo Publications

Study of phytoplanktons biodiversity and correlation coefficient in Harsool-Savangi dam, District Aurangabad, India
30 BIOINFO Aquatic Ecosystem
Volume 1, Issue 1, 2011

Shinde SE, Pathan TS, Sonawane DI
31 Bioinfo Publications

Study of phytoplanktons biodiversity and correlation coefficient in Harsool-Savangi dam, District Aurangabad, India
32 BIOINFO Aquatic Ecosystem
Volume 1, Issue 1, 2011
Shinde SE, Pathan TS, Sonawane DI
33 Bioinfo Publications

Study of phytoplanktons biodiversity and correlation coefficient in Harsool-Savangi dam, District Aurangabad, India
34 BIOINFO Aquatic Ecosystem
Volume 1, Issue 1, 2011