Seasonal influenza vaccination in Europe: Vaccination ... · PDF fileVesna Visekruna Vucina,...
40
TECHNICAL REPORT Seasonal influenza vaccination in Europe Vaccination recommendations and coverage rates in the EU Member States for eight influenza seasons 2007–2008 to 2014–2015 www.ecdc.europa.eu
Transcript of Seasonal influenza vaccination in Europe: Vaccination ... · PDF fileVesna Visekruna Vucina,...

TECHNICAL REPORT
TECHNICAL REPORT
Seasonal influenza vaccination in Europe
Vaccination recommendations and coverage rates in the EU Member States for eight
influenza seasons
2007–2008 to 2014–2015
www.ecdc.europa.eu

ECDC TECHNICAL REPORT
Seasonal influenza vaccination in Europe
Vaccination recommendations and coverage rates in the EU Member States for eight influenza seasons
2007–2008 to 2014–2015

ii
This report was commissioned by the European Centre for Disease Prevention and Control (ECDC), coordinated by
Suzanne Cotter (Health Protection Surveillance Centre, Ireland), Svetla Tsolova and Kari Johansen (both ECDC); and produced by Jolita Mereckiene
Author Jolita Mereckiene, Health Protection Surveillance Centre, Ireland
This report is based on data obtained from annual or bi-annual surveys on seasonal influenza vaccination in EU/EEA countries for eight influenza seasons (from 2007–2008 to 2014–2015). The surveys were conducted by the Vaccine European New Integrated Collaboration Effort III (VENICE), in collaboration with the European Centre for Disease Prevention and Control (ECDC).
Acknowledgements VENICE national gatekeepers and contact points: Austria: Elisabeth Kanitz, Maria Paulke-Korinek, Daniela Schmid; Belgium: Pierre Van Damme, Martine Sabbe, Tine Grammens, Nathalie Bossuyt; Bulgaria: Mira Kojouharova, Radosveta Filipova; Czech Republic: Jan Kyncl, Martina Havlickova, Jana Kostalova; Cyprus: Maria Koliou; Croatia: Vesna Visekruna Vucina, Bernard Kaić; Denmark: Palle Valentiner-Branth, Tyra Grove Krause; Estonia:Natalia Kerbo, Irina Filippova; Finland: Hanna Nohynek, Ulrike Baum; France: Daniel Levy-Bruhl, Isabelle Bonmarin, Emmanuel Belchior, Jean Paul Guthman, Eliane Vanhecke; Germany: Ole Wichmann; Greece: Theano Georgakopoulou, Theodora Stavrou; Hungary: Zsuzsanna Molnàr; Iceland: Thorolfur Gudnason; Ireland: Suzanne Cotter; Italy: Fortunato D’Ancona, Cristina Giambi, Caterina Rizzo, Maria Cristina Rota; Latvia: Larisa Savrasova, Jurijs Perevoscikovs; Lithuania: Asta Kriaučiūnaitė, Daiva Razmuvienė; Liechtenstein: Marina Jamnicki Abegg; Luxembourg: Serge Krippler; Malta: Tanya Melillo, Vicky Farrugia Santangelo; The Netherlands: Joost Timmermans, Marit de Lange; Norway: Marianne A R Bergsaker, Kjersti Rydland; Poland: Iwona Paradowska-Stankiewicz; Portugal: Paula Valente; Romania: Rodica Popescu, Aurora Stanescu; Slovakia: Helena Hudecova, Elena Ticha; Slovenia: Marta Grgic Vitek; Spain: Aurora Limia, Mar Andreu; Sweden: Ingrid Uhnoo, AnnaSara Carnahan, Mia Brytting; United Kingdom- England: Richard Pebody, Camille Tsang; United Kingdom–Northern Ireland: Naomh Gallagher; United Kingdom– Scotland: Jim McMenamin, Alison Potts, Arlene Reynolds, Naoma William; United Kingdom–Wales: Simon Cottrell
Suggested citation: European Centre for Disease Prevention and Control. Seasonal influenza vaccination in Europe. Vaccination recommendations and coverage rates in the EU Member States for eight influenza seasons: 2007–2008 to 2014–2015. Stockholm: ECDC; 2017.
Stockholm, July 2017
ISBN 978-92-9498-076-2 doi: 10.2900/153616 TQ-02-17-810-EN-N
Cover picture: AJC1 via Flickr, image licensed under a Creative Commons attribution 2.0 generic license
© European Centre for Disease Prevention and Control, 2017
Reproduction is authorised, provided the source is acknowledged. For any use or reproduction of photos or other material that is not under the EU copyright, permission must be sought directly from the copyright holders.

TECHNICAL REPORT Seasonal influenza vaccination in Europe
iii
Contents
Abbreviations ................................................................................................................................................ vSummary ...................................................................................................................................................... 1
Introduction .................................................................................................................................................. 3Aim and objectives .................................................................................................................................... 3Specific objectives of surveys conducted between 2008 and 2015 ................................................................. 3Methodology ............................................................................................................................................ 4
Study design ........................................................................................................................................ 4Data collection ..................................................................................................................................... 4Data analysis ........................................................................................................................................ 4
Results .......................................................................................................................................................... 5Response rate .......................................................................................................................................... 5Seasonal influenza vaccination recommendations ........................................................................................ 5
Age groups recommended for influenza vaccination ................................................................................. 5Chronic medical conditions .................................................................................................................... 7Vaccination and pregnancy .................................................................................................................... 9
Occupational groups ............................................................................................................................... 10Healthcare workers ............................................................................................................................. 10Other occupations .............................................................................................................................. 10
Population groups in closed communities .................................................................................................. 11Household contacts or caretakers ............................................................................................................. 11Vaccination coverage rates ...................................................................................................................... 12
Children and adolescents ..................................................................................................................... 12Older age groups ................................................................................................................................ 14
Individuals with chronic medical conditions ........................................................................................... 15Pregnant women ................................................................................................................................ 15Healthcare workers ............................................................................................................................. 16Residents of long-term care facilities .................................................................................................... 17Median seasonal vaccination rates ........................................................................................................ 18
Payment mechanisms for vaccines and vaccine administration .................................................................... 20Adults (older population) ..................................................................................................................... 20Children and adolescents ..................................................................................................................... 20Chronic medical conditions .................................................................................................................. 20Pregnant women ................................................................................................................................ 20Healthcare workers ............................................................................................................................. 20
Number of doses of seasonal influenza vaccine ......................................................................................... 21
Limitations .................................................................................................................................................. 23
Conclusions ................................................................................................................................................. 23Recommendations for seasonal influenza vaccination ................................................................................. 23Vaccination coverage rates during in 2007–08 and 2014–15 influenza seasons ............................................. 24Number of doses of seasonal influenza vaccine ......................................................................................... 25Payment mechanisms.............................................................................................................................. 25The way forward .................................................................................................................................... 25
References .................................................................................................................................................. 26
Annex 1. Recommendations for children, adolescents and adults...................................................................... 27Annex 2. Recommendations for specific groups .............................................................................................. 29Annex 3. Vaccination coverage rates and method of monitoring by countries .................................................... 30Annex 4. Number of doses of seasonal influenza vaccine ................................................................................. 33

Seasonal influenza vaccination in Europe TECHNICAL REPORT
iv
Figures
Map 1. Member States recommending seasonal influenza vaccine for children and adolescents, 2014–15 and 2007–08 influenza seasons, 2014–15 (left) and 2007–08 (right) ................................................................................. 6Map 2. Member States recommending seasonal influenza vaccine for older age groups, 2014–15 and 2007–08 influenza seasons, 2014–15 (left) and 2007–08 (right) ...................................................................................... 7Figure 1. Proportion of Member States recommending seasonal influenza vaccine by chronic medical condition, 2007–08 to 2014–15 influenza seasons ............................................................................................................ 8Figure 2. Proportion of Member States recommending seasonal influenza vaccine for pregnant women, 2007–08 to 2014–15 influenza seasons ............................................................................................................................. 9Figure 3. Proportion of Member States recommending seasonal influenza vaccine for occupational groups, 2007–08 to 2014–15 influenza seasons ....................................................................................................................... 11Figure 4. Proportion of Member States recommending seasonal influenza vaccine for household contacts/caretakers
of those at risk for influenza, 2007–08 to 2014–15 influenza seasons ............................................................... 12Figure 5. Seasonal influenza vaccination coverage rates among children and/or adolescents in seven EU/EEA Member States, 2008–09 to 2014–15 influenza seasons .................................................................................. 13Figure 6. Seasonal influenza vaccination coverage rates in older age groups, 26 EU/EEA Member States, 2007–08 to 2014–15 influenza seasons ....................................................................................................................... 14Figure 7. Seasonal influenza vaccination coverage rates among individuals with chronic medical conditions, nine EU/EEA Member States, influenza seasons 2007–08 to 2014–15 ...................................................................... 15Figure 8. Seasonal influenza vaccination coverage rates in pregnant women, seven EU/EEA Member States, influenza seasons 2010–11 to 2014–15 .......................................................................................................... 16Figure 9. Seasonal influenza vaccination coverage rates among healthcare workers, 17 EU/EEA Member States, influenza seasons 2007–08 to 2014–15 .......................................................................................................... 17Figure 10. Seasonal influenza vaccination coverage rates among residents and/or staff of long-term stay care facilities in five EU/EEA Member States, influenza seasons 2008–09 to 2014–15 ................................................ 18Figure 11. Median seasonal influenza vaccination coverage rates in vaccine-targeted population groups (older age groups, those with clinical risk, pregnant women, and HCWs), 26 EU/EEA Member States, influenza seasons 2007–08 to 2014–15 ............................................................................................................................................. 19Figure 12. Payment mechanisms for vaccine in population groups recommended for seasonal influenza vaccination, 2014–15 influenza season ............................................................................................................................. 21Figure 13. Payment mechanisms for vaccine administration for population groups recommended for seasonal influenza vaccine, 2014–15 influenza season .................................................................................................. 21Figure 14. Number of purchased seasonal influenza vaccine doses expressed as vaccine doses potentially available per 10 000 people aged 65 years and over in 24 EU/EEA Member States, influenza seasons 2007–08 to 2014–15 22
Tables
Table 1. Influenza surveys conducted in EU/EEA countries by VENICE, 2008–2015 .............................................. 3Table A-1. Member States recommending seasonal influenza vaccination for children, adolescents and adults,
influenza seasons 2014–15 and 2007–08 ....................................................................................................... 27Table A-2. Population groups recommended for seasonal influenza vaccination in EU/EEA countries during six influenza seasons ......................................................................................................................................... 29Table A-3. Seasonal influenza vaccination coverage rates among children and adolescents, EU/EEA Member States, from 2008–09 to 2014–15 influenza seasons .................................................................................................. 30Table A-4. Seasonal influenza vaccination coverage rates for targeted population groups by method of monitoring, EU/EEA Member States, from influenza seasons 2007–08 to 2014–15 ............................................................... 31Table A-5. Number of doses of seasonal influenza vaccine, EU/EEA Member States, influenza seasons 2007–08 to 2014–15 ..................................................................................................................................................... 33

TECHNICAL REPORT Seasonal influenza vaccination in Europe
v
Abbreviations
CINECA Consortium at the University of Bologna, Italy
GP General practitioner
HCWs Healthcare workers
ILI Influenza-like illness
NITAG National Immunization Technical Advisory Group
SAGE Strategic Advisory Group of Experts on Immunisation
VCR Vaccination coverage rates
VENICE Vaccine European New Integrated Collaboration Effort
WHO World Health Organization

TECHNICAL REPORT Seasonal influenza vaccination in Europe
1
Summary
In Europe, influenza occurs in regular annual epidemics in the winter season. Annual influenza epidemics are associated with high morbidity and mortality. Severe illness and complications are more common in certain risk groups, which include those with chronic medical conditions (e.g. cardiovascular, respiratory, renal and hepatic diseases; diabetes mellitus; immunosuppression due to disease or treatment; obesity; children and teenagers on long-term aspirin therapy) and individuals 65 years of age and above. The main public health intervention to prevent influenza is vaccination. To protect vulnerable individuals and reduce transmission, vaccination is also recommended for healthcare workers.
The aim of this report was to summarise the information on seasonal influenza immunisation recommendations and vaccination coverage rates in the European Union (EU) and the European Economic Area (EEA) between 2007–08 and 2014–15, a total of eight influenza seasons.
A standardised questionnaire was developed for the first survey and made available online in January 2008. For each subsequent survey the questionnaire was amended reflecting changes in European Commission/WHO recommendations for seasonal influenza. Questionnaires were completed by experts in the EU/EEA Member States. Overall, six surveys were conducted, with eight influenza seasons covered. The participation rate was high for each survey, with only one or two countries not responding to any given survey. The United Kingdom has provided data separately for England, Northern Ireland, Scotland and Wales since 2012 (influenza season 2011–12).
All Member States recommended seasonal influenza vaccination to older age groups, with the age ranging from ≥50 to ≥65 years of age, depending on the country. Over time, a growing number of countries lowered the recommended age for adult influenza vaccination. All in all, 30 countries have lowered the recommended vaccination age at some point in time during the eight seasons covered in this report.
Six countries (Hungary, Germany, Greece, Iceland, the Netherlands and Portugal) recommended that people aged 60 years or older get vaccinated (2014–15), while for the 2007–08 season, only three (Iceland, Greece and Germany) of 27 countries made such a recommendation. Recommendations to vaccinate those 65 years or older
were made by 18 countries in 2014–15, and by 19 countries in 2007–08. Two countries (Poland and Malta) recommended adult influenza vaccination for those aged 55 years and above in 2007–08 and 2014–15; Slovakia recommended vaccination for people 59 years of age or above for the 2014–15 and the 2007–08 seasons. In 2014–15, Austria, Belgium and Ireland recommended vaccination for those 50 years or older. In 2007–08, Austria and Ireland also recommended that this age group should be vaccinated.
An increase in the number of countries recommending vaccination for children was noted. Nine countries (Austria, Estonia, Finland, Malta, Latvia, Slovenia, Slovakia, Poland and United Kingdom) recommended vaccination of different age groups of children and adolescents under 18 years of age in the 2014–15 influenza season; for the 2007–08 season, only six countries did so.
Similarly, an increase in the number of countries recommending influenza vaccine for healthcare workers (HCWs) was observed. Of 30 responding Member States, 29 recommended influenza vaccinations for HCWs in 2014–15; 24 of these had recommendations in place to vaccinate all HCWs; four recommended vaccination only for certain HCWs. In Northern Ireland and Scotland, vaccine was offered to all HCWs, while England and Wales recommended
that only HCWs in direct contact with patients should be vaccinated. Of the 27 responding countries, 22 recommended that HCWs should be vaccinated for the 2007–08 influenza season.
All Member States recommended seasonal influenza vaccine for people with immunosuppression due to disease or treatment, metabolic disorders, chronic pulmonary diseases, cardiovascular diseases and renal diseases for six of the eight influenza seasons covered in this report. The number of countries that recommended influenza vaccination for people with morbid obesity increased (nine Member States in 2010–11, 19 in 2014–15). Also on the increase are vaccination recommendations for hepatic diseases (15 Member States in 2007–08, 27 in 2014–15). Twenty-six Member States recommended vaccination for people with neurological diseases in 2014–15 (2010–11: 19 Member States). Ten Member States recommended the vaccination of pregnant women in 2010–11; in 2014–15, 27 Member States recommended influenza vaccination for pregnant women.
A decrease in the number of Member States recommending influenza vaccination for children under 18 years of age on long-term aspirin treatment was noted: the number dropped from 18 countries in 2007–08 to 15 countries in 2014–15.
Between 2007–08 and 2014–15, 26 Member States reported vaccination coverage rates for older populations for at least one season; coverage rates for this demographic ranged from 1.0% to 76.3% (median 47.6%). Seventeen Member States provided coverage data (reported for at least one influenza season) for HCWs: coverage ranged from 5.7% to 54.4% (median 26.9%). Coverage for those with chronic medical conditions was provided by nine Member States and ranged from 28.7% to 78.7% (median 44.4%). Seven Member States submitted coverage data for pregnant women: coverage ranged between 0.3% an 58.2% (median 22.6%). Four Member States were able

Seasonal influenza vaccination in Europe TECHNICAL REPORT
2
to report vaccination coverage rates for residents of long-term care facilities: coverage was 68.7% in Belgium
(2008–09), 72.2% in Ireland (2014–15), 96.6% in Slovakia (2014–15), and 77% in Portugal (2014–15).
The predominant payment mechanism for influenza vaccinationsi, as reported by Member States, was through national health services (or equivalent) for those population groups for whom seasonal influenza vaccine was recommended (children, adolescents, adults, those with chronic medical conditions, pregnant women, HCWs and members of closed communities).
In conclusion, the results of the VENICE surveys indicate that most of the Member States have clear recommendations as to which population groups should receive seasonal influenza vaccine, i.e. those with chronic medical conditions, pregnant women, older age groups, and HCWs. There has been an increase in the proportion of Member States which now recommend vaccine for high risk groups as identified by WHO and ECDC. However, there was a notable discrepancy between issuing recommendations and the ability to monitor and report vaccination coverage among those with chronic medical conditions and pregnant women: less than a quarter of EU/EEA Member States have the capability to do so.
Just under half of the Member States were able to report on vaccination coverage for HCWs. It is notable that more Members States were able to report on coverage in this and other risk groups. Another noticeable trend is the lowering of the recommended age for the influenza vaccine in older populations; there were no major changes in recommendations for children.
Although there has been a widespread consensus for many years that the older age groups should be vaccinated, the EU target of 75% vaccination coverage was reached in only two Member States (the Netherlands and the United Kingdom (only Northern Ireland and Scotland) in some of the influenza seasons covered in this overview. As the ability to monitor vaccination coverage is a key component of any vaccination programme, all Member States may need to reconsider their approach in order to collect more comprehensive and accurate information on vaccination coverage for all targeted population groups. Member States that do not monitor vaccination coverage among older age groups are encouraged to implement monitoring systems that are age-group-specific, in accordance with national recommendations, to enable them to track their progress or identify obstacles that keep them from achieving national and EU targets.
i By ‘vaccination’ we refer to both cost factors: the vaccine itself and the administration of the vaccine.
TECHNICAL REPORT Seasonal influenza vaccination in Europe
3
Introduction
Vaccination remains the most effective public health intervention to mitigate and prevent seasonal influenza [1]. The policies of the EU/EEA Member States for influenza vaccination are based on the principle of protection of people at higher risk of severe illness and complications, either directly through vaccination, or indirectly by vaccinating subgroups (e.g. healthcare workers) that are likely to infect those at higher risk for influenza.
The primary indicators of successful vaccination programmes are high vaccination coverage rates, i.e. the proportion of targeted populations who were vaccinated. In December 2009, the European Council unanimously recommended that influenza vaccination coverage in all at-risk groups should reach 75% in all EU countries for the 2014–15 influenza season [2]. Risk groups were defined in accordance with guidance from ECDC and the World Health Organization: ‘older’ individuals (often defined as aged ≥65 years) and people of all ages ≥6 months of age with chronic medical conditions [3,4]. In November 2012, the WHO Strategic Advisory Group of Experts on Immunisation (SAGE) recommended the prioritisation of influenza vaccination for pregnant women (who have an increased risk of severe disease and death from influenza). SAGE also said that the expansion of programmes for children under five years of age should be considered, particularly for children under two years of age, who have a high burden of influenza [5].
The European Council Recommendation [2] encouraged Member States to adopt and implement national, regional or local action plans or policies to improve seasonal influenza vaccination coverage (including among HCWs) and to measure coverage in all risk groups. Countries were also encouraged to report on a voluntary basis to the European Commission on the implementation of the recommendation. ECDC-supported VENICE surveys have been identified as being an effective way of doing this. These surveys offer an established mechanism to monitor implementation, with several surveys conducted before and immediately following the Council Recommendation [6]. A total of eight surveys was conducted by VENICE between 2008 and 2015: one pandemic influenza survey and seven seasonal influenza surveys (Table 1).
Table 1. Influenza surveys conducted in EU/EEA countries by VENICE, 2008–2015
Survey conducted Jan
2008
Jul
2009
Aug-
2010§
Apr
2011
Nov
2011
Nov
2012
Mar
2014
Dec
2015
Influenza season covered to obtain vaccination coverage rates
2006–07† 2007–08 2009–10 2008–09, 2009–10
2010–11 2011–12 2012–13 2013–14, 2014–15
Influenza season covered to collect recommendations
2006–07 2007–08 2009–10 2009–10 2010–11 2011–12 2012–13 2014–15
§ Survey conducted to collect data for A(H1N1)pdm; the remaining surveys covered seasonal influenza. † Some countries provided data for seasons 2003–04 and 2005–06; most counties provided data for influenza season 2006–07.
Aim and objectives The aim of the first survey conducted by VENICE in January 2008 was to collect baseline information on country-specific vaccination recommendations for seasonal influenza for risk groups and other target groups in order to obtain vaccination coverage rates for all EU/EEA Member States.
The aim of the subsequent surveys was to update the data on seasonal influenza immunisation recommendations and to obtain EU/EEA vaccination coverage rates for the latest influenza season in order to see whether the EU target of 75% was met in all at-risk groups and other target groups.
Specific objectives of surveys conducted between 2008 and 2015 Identify recommendations for every influenza season with regard to seasonal influenza vaccination for
different target groups. Target groups can be based on age, medical risk, and profession. Obtain influenza vaccination coverage rates for the above groups for every influenza season. Obtain information for every influenza season on national payment mechanisms for seasonal influenza
vaccinations.
The objective of this report is to summarise information which was collected by the VENICE survey project in EU/EEA countries between July 2009 and the end of the influenza season in 2015. Vaccination coverage data are available for eight influenza seasons, and data on vaccination recommendations were collected during six influenza seasons.

Seasonal influenza vaccination in Europe TECHNICAL REPORT
4
Methodology
Study design
All surveys were carried out through a web-based platform with protected access restricted to appointed experts from all EU/EEA Member States. These surveys were collaborative studies between ECDC, the Vaccine European New Integrated Collaboration Effort (VENICE) Project and the EU/EEA Member States. In December 2015, 28 EU and three EEA Member States (Iceland, Norway, and Liechtenstein) participated in VENICE.
Data collection
A standardised questionnaire, using predominantly close-ended questions, was developed for the first survey in January 2008. For each subsequent survey, the questionnaire was amended in accordance with the changes in EC/WHO recommendations for seasonal influenza. However, the core questionnaire contained the same set of questions for all surveys, which ensured that information gathered in previous surveys was comparable between influenza seasons and countries. The questionnaire was grouped into thematic sections to facilitate completion. Each section could be completed separately. Information was sought on population groups recommended for influenza vaccination (based on age, occupation, chronic medical conditions or social situation, in accordance with national guidelines), methods used to monitor vaccination coverage, vaccination coverage rates in specific population groups, and payment mechanisms relating to vaccination (both procurement and administration of vaccine).
Data analysis
A descriptive analysis was carried out, summarising data by calculating frequencies or proportions of responses by Member States and population groups targeted for seasonal influenza vaccination. Vaccination coverage rates were calculated as proportions – the number of vaccinated individuals (numerator) divided by the number of population groups targeted for vaccination (denominator) – for each participating Member State. The results of these calculations were provided to VENICE as proportions.
This report summarises and presents data collected from the six most recent seasonal influenza surveys, which were conducted between July 2009 and December 2015. Vaccination coverage rates for the different targeted population groups were calculated for a maximum of eight influenza seasons (2007–08, 2008–09, 2009–10, 2010–11, 2011–12, 2012–13, 2013–14 and 2014–15). For older people, for example, data for all eight seasons covered in this report are available. For some of the target groups, vaccination coverage rates are only available for five seasons because data collection did not start until the 2010–11 influenza season (e.g. vaccination coverage rates for pregnant women, which were first collected after the A(H1N1)pdm09 pandemic).
Data from first survey are not included in this report because vaccination coverage rates were not always provided for the same seasons, e.g. for seasons 2003–04 to 2006–07 (Table 1).
The April 2011 survey collected vaccination coverage rates data for two influenza seasons (2008–09 and 2009–10), while the December 2015 surveys collected data for the 2013–14/2014–15 influenza seasons. For both surveys, data on recommendations were collected for the most recent influenza season (2009–10 and 2014–15,
respectively), which means that data on recommendations cover only six influenza seasons. In order to better illustrate the changes after the A(H1N1)pdm09 pandemic, this report focusses on the recommendations from the July 2009 survey, which is based on the 2007–08 season (Table 1). Data provided in this report may differ from previous publications covering the same time period because Member States could retroactively update reported numbers.
The vaccination coverage rates for the 2007–08 and 2014–15 influenza seasons were compared. The median vaccination coverage rates were calculated by country and for the entire EU/EEA region according to the data provided by the participating countries, e.g. if a Member State provided data for only one season, the median vaccination coverage rate was identical with the reported vaccination coverage rate; if a Member State provided data for five seasons, the median was calculated across those five seasons.
The analysis of Member State information relating to payment mechanisms for different targeted population groups was difficult because the majority of countries reported multiple options (vaccine or administration payment mechanisms varied substantially, even within countries). The data presented in this report reflect this diversity of
payment options.
In order to compare data between Member States, the estimated number of seasonal influenza vaccine doses purchased by public procurement in each country was expressed as a rate (per 10 000 of those aged ≥65 and over) as a very crude indicator to assess supply against need. The number of purchased, distributed and used vaccines was provided by the Member States. For the data analysis, the number of purchased doses was chosen because this information was collected in all surveys. The collection of distributed or used doses was introduced later; these data are not available for all eight seasons. The denominator (number of those aged 65 or older) for

TECHNICAL REPORT Seasonal influenza vaccination in Europe
5
this calculation was taken from the Eurostat website [7]. The cut-off for age was ≥65; no adjustment was made to
the countries’ recommendations as age recommendations varied between influenza seasons. At the time of writing, the latest data available were for the year 2011. Population data were not available for more recent years, which is why the same denominator was used to calculate the coverage rates for all influenza seasons.
Data for the United Kingdom were provided separately for England, Northern Ireland, Scotland and Wales. The UK was considered as one Member State when responses were the same for a given question (e.g. on policies or mechanisms across the UK, such as recommendations and payment mechanisms); if responses were different on a given question, a footnote indicates and explains the differences. Data on vaccination coverage rates are presented and interpreted separately for each country in the UK.
Results
Response rate Of the 29 EU/EEA countries participating in the VENICE project, 27 provided data for the 2007–08 influenza season (Bulgaria and Luxembourg did not respond to the survey); 28 countries reported data for the 2008–09 and 2009–10 seasons (the UK did not respond to the survey, but provided vaccination coverage data at a later date; data were included in this report); data for the 2010–11 influenza season were reported by 28 countries (Finland did not respond to the survey). For the survey on the 2011–12 season, 28 countries responded (Austria did not respond). Croatia joined the EU in 2013, which resulted in a total of 31 EU/EEA countries invited to participate in the survey for the 2012–13 season; of these, 29 responded; 30 countries responded to the survey for the influenza seasons 2013–14 and 2014–15 (Luxembourg did not provide data for either season).
Seasonal influenza vaccination recommendations
Age groups recommended for influenza vaccination
In the 2014–15 influenza season, nine of the 30 responding countries (Austria, Estonia, Finland, Latvia, Malta, Poland, Slovakia, Slovenia and the United Kingdom) reported recommending seasonal influenza vaccination for various age groups of healthy children and adolescents aged <18 years. In Latvia and Slovenia, vaccination was recommended for children aged ≥6 months to 2 years; in Finland, vaccination was recommended for children aged ≥6 months to 3 years; in Malta, vaccination was recommended for children aged ≥6 months to 4 years; in Slovakia, vaccination was recommended for children aged <12 years. Austria, Estonia and Poland recommended vaccination for children aged ≥6 months to <18 years. For the 2013–14 influenza season, the UK introduced influenza vaccination for various age groups of children between ≥2 and 11 years of age. By comparison, in the 2007–08 season, six of the 27 countries gave a recommendation for the vaccination of children and adolescents (Austria, Estonia, Finland, Latvia, Slovakia, Slovenia) (Map 1; Annex 1: Table 2).
All 30 countries recommended seasonal influenza vaccination for the older age groups in 2014–15, but the specified age differed between countries. Eighteen countries recommended vaccination for individuals ≥65 years of age. In six countries (Germany, Greece, Hungary, Iceland, the Netherlands and Portugal), vaccination was
recommended for those aged ≥60 years. Two countries (Malta and Poland) recommended vaccination for individuals aged ≥55 years. Slovakia recommended vaccination for individuals aged ≥59 years. The remaining three countries (Austria, Belgium and Ireland) recommended vaccination for those ≥50 years. In Ireland, however, only people aged ≥65 years are being offered the seasonal influenza vaccination free of charge, and only for this age group the vaccination coverage is monitored.
For the influenza season 2007–08, 18 of the 27 survey responding countries recommended vaccination for individuals aged ≥65 years. Three countries (Germany, Greece and Iceland) recommended vaccination for those aged ≥60 years; two countries (Malta and Poland) recommended vaccination for people aged ≥55 years. Slovakia recommended the vaccination of all people aged ≥59 years. Three countries (Austria, Belgium and Ireland) recommended vaccination for those ≥50 years (Map 2; Annex 1: Table 2).

Seasonal influenza vaccination in Europe TECHNICAL REPORT
6
Map 1. Member States recommending seasonal influenza vaccine for children and adolescents, 2014–
15 and 2007–08 influenza seasons, 2007–08 (left) and 2014–15 (right)
Source: National seasonal influenza vaccination survey, December 2015, July 2009
No recommendations
≥6 months – 2 years
≥6 months – 3 years
≥6 months – 5 years
≥6 months – 12 years
≥6 months – 18 years
Various age groups between ≥2 – 11 years
In Malta, vaccination was recommended for children six months or older and below 5 years of age in 2014–15. Liechtenstein did not have a recommendation to vaccinate healthy children or adolescents in 2014–15. UK recommendations for vaccination age: England ≥2–4 years; Northern Ireland and Scotland 2–11 years; Wales 2–4 and 7–11 years (2014–15 season).
TECHNICAL REPORT Seasonal influenza vaccination in Europe
7
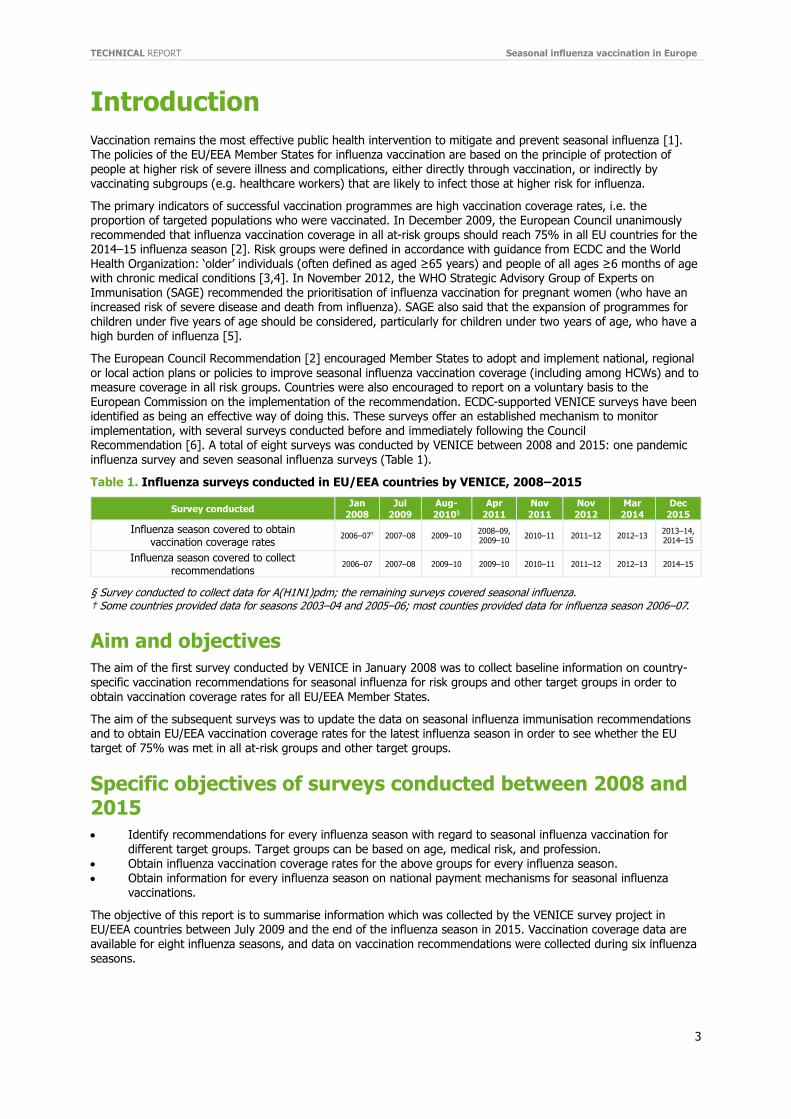
Map 2. Member States recommending seasonal influenza vaccine for older age groups, 2014–15 and
2007–08 influenza seasons, 2007–08 (left) and 2014–15 (right)
Source: National seasonal influenza vaccination survey, December 2015 and July 2009
≥50 years
≥55 years
≥59 years
≥60 years
≥65 years
In Ireland, the National Immunization Technical Advisory Group (NITAG) recommends vaccine for people ≥50 years of age but the programme focuses only on people ≥65 years. In Belgium, during the influenza season 2007–2008, vaccination was recommended for people 50–64 years of age. In 2014–2015, vaccination was still advised for this age group but this group was no longer considered high priority.
In Portugal, vaccination was recommended for people ≥60 years of age in 2014–15; the vaccine is only free of charge for people ≥ 65 years.
The recommendation in Spain is for people ≥65 years of age; however, 10 out of 19 regions recommend vaccination for those ≥60 years of age. In Austria, Estonia and Poland, vaccination against seasonal influenza is recommended for all population groups six months or older in 2014–15. In Austria and Estonia vaccination against seasonal influenza is recommended for all population groups six months or older in 2007–08. In Liechtenstein, vaccination is recommended for people ≥65 years in 2014–15. In Malta, vaccination was recommended for people ≥55 years in 2014–15 and 2007–08.
Chronic medical conditions
In comparison with earlier VENICE surveys, and notably since the Council Recommendation, a number of countries made changes to their seasonal influenza vaccination recommendations and policies, usually with regard to certain risk groups. Between 2007–08 and 2014–15, all Member States participating in the surveys recommended seasonal influenza vaccination for patients with treatment-induced immunosuppression, disease-induced immunosuppression, and metabolic disorders. In addition, influenza vaccine was recommended to those with chronic pulmonary, cardiovascular and renal diseases. The number of Member States that recommended seasonal influenza vaccine for individuals with hepatic disease increased each year (15 in 2007–08, 27 in 2014–15); 28 Member States recommended vaccination for people living with HIV/AIDS in 20014–15 vs. 24 in 2007–08. In
addition, more countries recommended vaccine for those with morbid obesity in 2014–15 than in 2010–11 (19 Member States vs. 9, respectively) (Figure 1; Annex 2: Table 3).

Seasonal influenza vaccination in Europe TECHNICAL REPORT
8
Figure 1. Proportion of Member States recommending seasonal influenza vaccine by chronic medical
condition, 2007–08 to 2014–15 influenza seasons
Source: National seasonal influenza vaccination surveys, July 2009–December 2015 * Respiratory (pulmonary) diseases, e.g. chronic obstructive pulmonary disease, cystic fibrosis, asthma
** Cardiovascular diseases, e.g. congenital heart disease, congestive heart failure and coronary artery disease, except hypertension *** Chronic neurological diseases or neuromuscular conditions, e.g. disorders of the brain, the spinal cord, the peripheral nerves and muscles such as cerebral palsy, epilepsy (seizure disorders), stroke, intellectual disability (mental retardation), moderate to severe developmental delay, muscular dystrophy, or spinal cord injury. **** Morbid obesity is defined as having a body mass index of ≥40kg/m². This information was not collected before/during A(H1N1)pdm09
***** Data refer to seasonal influenza vaccine recommendations during the 2009–10 pandemic influenza season
0 20 40 60 80 100
Morbid obesity ****
Children on long-term aspirin therapy
Hepatic diseases
Chronic neurological diseases***
HIV/AIDS
Immunosuppression due to disease or treatment
Haematologic/metabolic disorders
Renal diseases
Cardiovascular diseases**
Respiratory (pulmonary) diseases*
% Member States recommending vaccine
2014-15 2012-13 2011-12 2010-11 2009-10***** 2007-08

TECHNICAL REPORT Seasonal influenza vaccination in Europe
9
Vaccination and pregnancy
The number of Member States that recommended vaccination for pregnant women increased over time, from 10 Member States (Austria, Belgium, Cyprus, Denmark, Estonia, Ireland, Italy, Slovakia, Spain and Portugal) in 2007–08 to 27 Member States in 2014–15. Of the 27 countries that participated in the survey in 2014–15, 25 recommended vaccination for all pregnant women while two recommended vaccination for pregnant women with an additional clinical risk condition (Croatia and the Netherlands) (Figure 2; Annex 2: Table 3). Three Member States (Bulgaria, Malta and Slovakia) did not issue any recommendations for the vaccination of pregnant women. Malta does not officially recommend the vaccination of pregnant women but pregnant women who are interested in taking the vaccine are encouraged to do so; the vaccine, however, is not provided free of charge. Slovakia recommends the vaccine only to experts working in the field of immunisation but has no official written recommendation backed by legislation.
Compared with 2010–11, more Member States introduced recommendations to vaccinate pregnant women in any trimester of pregnancy (21 Member States in 2014–15 vs. 9 in 2010–11). Twenty-one Member States
recommended vaccination at any stage of pregnancy (the Czech Republic, Croatia, Denmark, Estonia, Finland, France, Greece, Hungary, Iceland, Ireland, Latvia, Liechtenstein, Lithuania, Malta, the Netherlands, Poland, Romania, Slovenia, Spain, Portugal, the United Kingdom) and seven Member States (Austria, Belgium, Cyprus, Germany, Italy, Norway, Sweden) recommended vaccination only for the second and third trimesters in 2014–15. In Denmark, healthy pregnant women were recommended influenza vaccination in the second and third trimesters in 2014–15 (Figure 2; Annex 2: Table 3).
In Germany and Norway (2014–15 season), vaccination was recommended to women with a chronic medical condition in all trimesters; healthy pregnant women were recommended the vaccine in the second and third pregnancy trimesters.
Three countries did not have any recommendations to vaccinate pregnant women (Bulgaria, Malta and Slovakia) in 2014–15. Although Malta does not officially recommend influenza vaccination for pregnant women, it encourages pregnant women to get vaccinated, but without offering to cover the costs. Slovakia has no official written recommendation backed by legislation, but advice to get vaccinated is unofficially given by immunisation experts.
Overall, 17 of 27 countries did not have recommendations to vaccinate pregnant women in 2007–08 (the Czech Republic, Germany, Finland, France, Greece, Hungary, Iceland, Latvia, Lithuania, Malta, Netherlands, Norway, Poland, Romania, Slovenia, Sweden, and the United Kingdom).
Figure 2. Proportion of Member States recommending seasonal influenza vaccine for pregnant women, 2007–08 to 2014–15 influenza seasons
Source: National seasonal influenza vaccination surveys, July 2009–December 2015 * Percentage calculated from those countries which recommend vaccine for pregnant women; in 2007–08 and 2009–10, no data were collected on pregnancy trimester recommended for vaccination
0 10 20 30 40 50 60 70 80 90 100
Any preganacy trimester*
Pregnant women
% Member States recommending vaccine
2014-15 2012-13 2011-12 2010-11 2009-10 2007-08
Seasonal influenza vaccination in Europe TECHNICAL REPORT
10
Occupational groups
Healthcare workers
There were no substantial changes in 2014–15 concerning the vaccination of certain occupational groups, except for healthcare workers (HCWs). More Member States recommended vaccinating HCWs in 2014–15 compared with 2007–08: 29 Member States recommended the vaccine in 2014–15, 22 Member States did so in 2007–08) (Figure 3; Annex 2: Table 3). Of the 30 responding countries, 24 recommended vaccination for all HCWs, and four recommended vaccination for some HCW categories, e.g. staff with close contact with patients, staff with no patient contact but contact with potentially contaminated material, or social care staff directly involved in frontline patient care. In the UK–Northern Ireland and UK–Scotland, vaccination was recommended for all HCWs. In UK–England and UK–Wales, vaccination was recommended only for frontline HCWs or those HCWs with direct patient contact. Although there is no national recommendation to vaccinate HCWs in Denmark, most regions and municipalities offer HCWs free vaccinations to them. In Sweden, vaccination was only recommended for staff caring for severely immunocompromised persons. In Slovakia, vaccination was recommended for HCWs in close contact with patients or foci of infection.
In all responding Member States, the vaccination of HCWs is voluntary, which, for the purposes of this report, is defined as individual free will (choice) when deciding on seasonal influenza vaccination; there is also no penalty for not getting the vaccine.
Other occupations
Between 2007–08 and 2014–15, 27 of the responding Member States recommended seasonal influenza vaccination for at least one other occupational group. Vaccination was not recommended for any occupational groups (except HCWs) in seven Member States (the Czech Republic, Denmark, Latvia, Lithuania, Romania, Portugal, and Sweden).
Around one third of the Member States recommended vaccination for those working in essential services, in the military, and in the poultry industry. Influenza vaccination was also recommended for families that raise poultry, waterfowl or pigs. Influenza vaccination was recommended for military service personnel (12 Member States in
2014–15 vs. six in 2007–08), poultry industry workers (12 Member States in 2014–15 vs. 13 in 2007–08); and police and firefighters (10 Member States in 2014–15 vs. five in 2007–08). Four Member States recommended the vaccination of teachers and other educational staff in 2014–15 (five in 2010–11) (Figure 3; Annex 2: Table 3).

TECHNICAL REPORT Seasonal influenza vaccination in Europe
11
Figure 3. Proportion of Member States recommending seasonal influenza vaccine for occupational
groups, 2007–08 to 2014–15 influenza seasons
Source: National seasonal influenza vaccination surveys, July 2009–December 2015 * Data refer to seasonal influenza vaccine recommendations during the 2009–10 pandemic influenza season
Population groups in closed communities
In the 2014–15 influenza season, 27 of 30 participating Member States (all but Denmark, Latvia and Sweden) recommended vaccination for residents of long-term care facilities; in 2007–08, only 22 of 27 Member States issued such a recommendation. More Member States introduced recommendations to vaccinate household contacts or carers of individuals belonging to risk groups (18 Member States in 2014–15 vs. 10 Member States in 2010–11). Also, household contacts or carers of immunosuppressed individuals were given the recommendation to get vaccinated (22 Member States in 2014–15 vs. 9 Member States in 2007–08) (Figure 4; Annex 2: Table 3).
Household contacts or caretakers
Data were collected on vaccination recommendations for household contacts of at-risk individuals since 2009–10. Between 2009–10 and 2014–15, an increasing number of countries recommended that household contacts of people in clinical risk groups, older individuals or children less than six months of age should be vaccinated. For example, household contacts of individuals belonging to clinical risk groups were given a vaccination recommendation in 18 countries in 2014–15 as opposed to 10 countries in 2009–10. Similarly, 22 countries in 2014–15 recommended the vaccine for household contacts of immunosuppressed individuals – in 2009–10, only nine countries recommended the vaccine for this group). There was some year-to-year variation in the number of countries that recommended the vaccine for household contacts: some Member States which in 2010–11 issued
0 20 40 60 80 100
Border control/Immigration/custom staff
Veterinary services
Energy sector
Public transport
Educational
Families that raise poultry, pigs or waterfowl
Poultry industry
Military
Essential services (police & firemen)
HCWs
% Member States recommending vaccine
2014-15 2012-13 2011-12 2010-11 2009-10* 2007-08

Seasonal influenza vaccination in Europe TECHNICAL REPORT
12
recommendations for the household contacts of elderly people and very young children no longer did so in 2012–
11 (Figure 4; Annex 2: Table 3).
Figure 4. Proportion of Member States recommending seasonal influenza vaccine for household contacts/caretakers of those at risk for influenza, 2007–08 to 2014–15 influenza seasons
Source: National seasonal influenza vaccination surveys, July 2009-December 2015 * Data refer to seasonal influenza vaccine recommendations during the 2009–10 pandemic influenza season
Vaccination coverage rates
Children and adolescents
Seven of nine Member States recommending seasonal influenza vaccine for children and/or adolescents in 2014–15 reported vaccination coverage rates for various age groups calculated by administrative methods; in the UK, vaccine for children was introduced in 2013–14; soon thereafter the country began providing coverage data. (Figure 5; Annex 3: Table 4). Two of the Member States that recommended influenza vaccination for children did not provide vaccination coverage data (Austria and Malta).
0 20 40 60 80 100
Children <6 months of age
Older population (e.g.>65 years)
Individuals belonging to the risk groups
Imunosupressed individuals
Household contacts of:
Residents of long-term care facilities
2014-15 2012-13 2011-12 2010-11 2009-10* 2007-08

TECHNICAL REPORT Seasonal influenza vaccination in Europe
13
Figure 5. Seasonal influenza vaccination coverage rates among children and/or adolescents in seven
EU/EEA Member States, 2008–09 to 2014–15 influenza seasons
Source: National seasonal influenza vaccination surveys, July 2009-December 2015
0
5
10
15
20
25
30
35
40
45
Latvia Finland Estonia Poland Slovenia Estonia Poland Slovenia Slovakia
≥6 months–<2 years
≥6 months–<3 years
≥6 months–<5 years 5–14 years 5–18 years ≥6 months–15 years
Va
ccin
ati
on
co
ve
rag
e (
%)
2008-09 2009-10 2010-11 2011-12 2012-13 2013-14 2014-15
0
20
40
60
80
100
UK-N
ort
hern
Ire
land
UK-E
ngla
nd
UK-S
cotland
UK-W
ale
s
UK-N
ort
hern
Ire
land
UK-S
cotland
UK-W
ale
s
UK-N
ort
hern
Ire
land
UK-S
cotland
UK-W
ale
s
UK-N
ort
hern
Ire
land
UK-W
ale
s
2-3 year olds 2-4 year olds 5-11 year olds 9-10 yearolds
11 yearolds
Va
ccin
ati
on
co
ve
rag
e (
%)
2013-14 2014-15

Seasonal influenza vaccination in Europe TECHNICAL REPORT
14
Older age groups
Influenza vaccination coverage rates among ‘older age groups’ (as defined in accordance with Member State recommendations, e.g. ≥55, ≥59, ≥60 or ≥65 years of age) from 2007–08 to 2014–15 influenza seasons were reported by 26 Member States (Figure 6, Annex 3: Table 5). Vaccination coverage rates varied from 1.1% to 76.3% in 2014–15; the median vaccination coverage rate for the same season was 41.8%. The median vaccination coverage rate for the latest survey was nearly 10% lower than when reporting first began. For the 2007–08 season, vaccination coverage rates ranged from 1% to 82.5%, with a median vaccination coverage rate of 51.0%. In the most recent survey, the highest vaccination coverage rates were reported by the United Kingdom, which achieved (United Kingdom–Scotland) or almost achieved (United Kingdom–England, United Kingdom–Northern Ireland) the EU target of 75%. Although vaccination is recommended for older age groups in all surveyed Member States, five Member States were not able to provide vaccination coverage rates for older age groups (Austria, Bulgaria, Cyprus, Greece, and Liechtenstein).
Figure 6. Seasonal influenza vaccination coverage rates in older age groups, 29 EU/EEA Member
States, 2007–08 to 2014–15 influenza seasons
Source: National seasonal influenza vaccination surveys, July 2009–December 2015 * Age groups of over 65 years of age and clinical risk groups combined † Sweden: For the 2009–10 influenza season, reports were received for around 60% of the population.
0 10 20 30 40 50 60 70 80 90
The Netherlands
UK-Northern Ireland
UK-Scotland
UK-England
UK-Wales
Ireland
Italy
Spain
Belgium
France
Sweden†
Portugal
Germany
Malta
Denmark
Luxembourg
Finland
Norway
Romania
Iceland
Hungary
Slovakia
Croatia
Czech Republic*
Slovenia
Lithuania
Poland
Latvia
Estonia
Vaccination coverage (%)
2014-15 2013-14 2012-13 2011-12 2010-11 2009-10 2008-09 2007-08
EU
targ
et 7
5%

TECHNICAL REPORT Seasonal influenza vaccination in Europe
15
Individuals with chronic medical conditions
Influenza vaccination coverage rates among individuals with chronic medical conditions from 2007–08 to 2014–15 were reported by nine Member States and ranged from 24.9% to 71.8% (2014–15); the median vaccination coverage rate for the same season was 50.3% (Figure 7, Annex 3: Table 5). In 2007–08, the vaccination coverage rates ranged from 45.3% to 71.7%, with a median vaccination coverage rate of 50%. Some Member States reported an increase in vaccination coverage rates in this population, while other Member States reported a decrease.
The highest vaccination coverage rates for people with chronic medical conditions were reported by the United Kingdom–Northern Ireland. Northern Ireland reached the EU target of 75% in the seasons 2009–10 to 2013–14, but missed it, by a low margin, in 2014–15. The remaining 23 Member States were not able to report vaccination coverage rates for individuals with chronic medical conditions.
Figure 7. Seasonal influenza vaccination coverage rates among individuals with chronic medical conditions, nine EU/EEA Member States, influenza seasons 2007–08 to 2014–15
Source: National seasonal influenza vaccination surveys, July 2009–December 2015 * Norway: Age groups of over 65 years of age and clinical risk groups combined between 2007–08 and 2012–13, measured by administrative method; Czech Republic: Age groups of over 65 years of age and clinical risk groups combined
Pregnant women
Influenza vaccination coverage rates for pregnant women were reported by seven Member States (Figure 8, Annex 3: Table 4). Two of these Member States could only provide data for one season (Germany and Ireland). The vaccination coverage rates in pregnant women ranged from 0.3% to 56.1% in 2014–15; the median vaccination coverage rate was 23.6%. The remaining 20 of the 27 Member States where vaccine was recommended to pregnant women reported that vaccination coverage in this group was not monitored. The highest vaccination coverage rates were in the United Kingdom and varied from 44.1% in England to 56.1% in Northern Ireland in 2014–15. The vaccination coverage rates ranged from 2.4% to 65.6% in the 2010–11 influenza season, with a median vaccination coverage of 38.0%.
0
10
20
30
40
50
60
70
80
90
Va
ccin
ati
on
co
ve
rag
e (
%)
2007-08 2008-09 2009-10 2010-11 2011-12
2012-13 2013-14 2014-15 EU target 75%
EU target 75%

Seasonal influenza vaccination in Europe TECHNICAL REPORT
16
Figure 8. Seasonal influenza vaccination coverage rates in pregnant women, seven EU/EEA Member
States, influenza seasons 2010–11 to 2014–15
Source: National seasonal influenza vaccination surveys, July 2009–December 2015
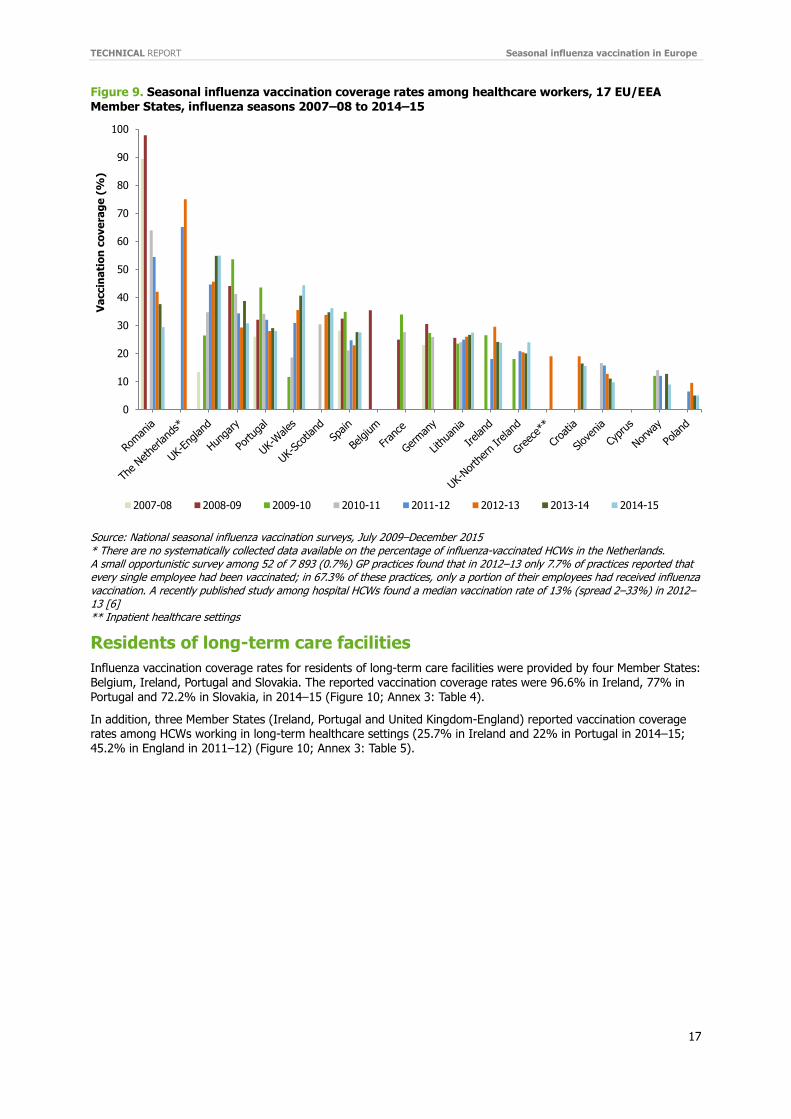
Healthcare workers
Influenza vaccination coverage rates for the 2007–08 and 2014–15 seasons were provided by 17 Member States. Rates ranged from 5% to 54.9% in 2014–15. The median vaccination coverage rate in 2014–15 was 25.7%. The highest vaccination coverage rates were reported by the United Kingdom (except Northern Ireland), Hungary and
Romania. In the 2007–08, the vaccination coverage rates ranged from 13.4% to 89.4%; the median vaccination coverage rate in 2007–08 was 26.0%. Median vaccination coverage rates between 2007–08 and 2014–15 were relatively steady, but vaccination coverage rates varied widely at the Member State level. Some Member States reported a substantial increase in vaccination coverage rates in HCWs during this time period while others reported marked declines (Figure 9, Annex 3: Table 4).
0
10
20
30
40
50
60
70
Va
ccin
ati
on
co
ve
rag
e (
%)
2010-11 2011-12 2012-13 2013-14 2014-15
TECHNICAL REPORT Seasonal influenza vaccination in Europe
17
Figure 9. Seasonal influenza vaccination coverage rates among healthcare workers, 17 EU/EEA
Member States, influenza seasons 2007–08 to 2014–15
Source: National seasonal influenza vaccination surveys, July 2009–December 2015 * There are no systematically collected data available on the percentage of influenza-vaccinated HCWs in the Netherlands. A small opportunistic survey among 52 of 7 893 (0.7%) GP practices found that in 2012–13 only 7.7% of practices reported that every single employee had been vaccinated; in 67.3% of these practices, only a portion of their employees had received influenza vaccination. A recently published study among hospital HCWs found a median vaccination rate of 13% (spread 2–33%) in 2012–13 [6] ** Inpatient healthcare settings
Residents of long-term care facilities
Influenza vaccination coverage rates for residents of long-term care facilities were provided by four Member States: Belgium, Ireland, Portugal and Slovakia. The reported vaccination coverage rates were 96.6% in Ireland, 77% in Portugal and 72.2% in Slovakia, in 2014–15 (Figure 10; Annex 3: Table 4).
In addition, three Member States (Ireland, Portugal and United Kingdom-England) reported vaccination coverage rates among HCWs working in long-term healthcare settings (25.7% in Ireland and 22% in Portugal in 2014–15; 45.2% in England in 2011–12) (Figure 10; Annex 3: Table 5).
0
10
20
30
40
50
60
70
80
90
100
Va
ccin
ati
on
co
ve
rag
e (
%)
2007-08 2008-09 2009-10 2010-11 2011-12 2012-13 2013-14 2014-15

Seasonal influenza vaccination in Europe TECHNICAL REPORT
18
Figure 10. Seasonal influenza vaccination coverage rates among residents and/or staff of long-term
stay care facilities in five EU/EEA Member States, influenza seasons 2008–09 to 2014–15
Source: National seasonal influenza vaccination surveys, July 2009–December 2015 * Data were not reported from one region in 2008-09
Median seasonal vaccination rates The summarised median values (the median value of a range of values) of the seasonal influenza vaccination coverage rates in vaccine-targeted population groups are presented in the Figure 11. The median vaccination coverage rates for older population groups varied from 1.0% to 76.3%; the median vaccination coverage rates for all Member States that provided data for at least one influenza season was 47.6%. The median vaccination coverage rates for those in clinical risk categories varied from 28.7% to 78.7%; the median for all Member States was 44.4%. The median vaccination coverage rates for pregnant women ranged between 0.3% and 58.2%; the median vaccination coverage rates for all Member States was 22.6%. The vaccination coverage rates for HCWs ranged between 5.7% and 54.4%; the median vaccination coverage rates for all countries was 26.9% (Figure 11; Annex 3: Table 5).
0
10
20
30
40
50
60
70
80
90
100
Residents Staff Residents Residents Staff Staff Residents
Portugal* Slovakia Ireland England Belgium
Va
ccin
ati
on
co
ve
rag
e (
%)
2008-09 2009-10 2010-11 2011-12 2012-13 2013-14 2014-15

TECHNICAL REPORT Seasonal influenza vaccination in Europe
19
Figure 11. Median seasonal influenza vaccination coverage rates in vaccine-targeted population
groups (older age groups, those with clinical risk, pregnant women, and HCWs), 28 EU/EEA Member States, influenza seasons 2007–08 to 2014–15
Source: National seasonal influenza vaccination surveys, July 2009–December 2015 * ≥65 years of age, with chronic medical conditions
0 10 20 30 40 50 60 70 80 90
Belgium
Croatia
Cyprus
Czech Republic*
Denmark
Estonia
Finland
France
Germany
Greece
Hungary
Iceland
Ireland
Italy
Latvia
Lithuania
Luxembourg
Malta
Netherlands
Norway
Poland
Portugal
Romania
Slovakia
Slovenia
Spain
Sweden
UK-England
UK-Northern Ireland
UK-Scotland
UK-Wales
Vaccination coverage (%)
Older population
HCWs
Pregnant women
Clinical risk
75
% t
arge
t 2
01
4–1
5 in
flu
en
za s
eas
on

Seasonal influenza vaccination in Europe TECHNICAL REPORT
20
Payment mechanisms for vaccines and vaccine administration Member States reported that the predominant payment mechanism for influenza vaccination was through the national health services for those population groups for whom seasonal influenza vaccine was recommended (children and adolescents, adults, those with chronic medical conditions, pregnant women, HCWs, and members of closed communities). Approximately 10% of the Member States have national insurance schemes which fund vaccination programmes for targeted population groups. In addition, 20% of the Member States reported that vaccinations had to be paid out-of-pocket. For all occupational groups, including HCWs, the predominant payment mechanism for vaccination was through the employer. In two Member States, vaccination was provided by regional health services (Figures 12 and 13).
Adults (older population)
In 16 of the 30 Member States that recommend seasonal influenza vaccination for older people (aged >50, >55, >59, ≥60 or ≥65 years, depending on national recommendations), vaccine costs were covered by the national health services; in seven Member States, the national insurance schemes covered the costs. Vaccine administration was covered by the national health services (12 Member States) or the national insurance schemes (eight Member States). In 10 Member States, vaccine costs paid by the vaccinee were not reimbursed, and 11 Member States reported that vaccinees also needed to pay out-of-pocket for vaccine administration. Vaccine and administration was reimbursed by private insurance in five and six countries, respectively (Figures 12 and 13).
Children and adolescents
Of nine Member States that recommended vaccination to children and adolescents, four paid for the vaccine and vaccine administration through the national health services. In one country, vaccine costs were covered by the national insurance scheme. In two countries, vaccine administration was covered by the national insurance scheme. Four Member States reported that the parents (or caregivers) of children receiving vaccination had to pay for the vaccine; in three countries, parents also paid for vaccine administration (Figures 12 and 13).
Chronic medical conditions
Vaccine for chronic medical conditions was funded by the national health services (17 Member States) and the national insurance (seven Member States); in eight Member States vaccinees had to pay for the vaccine. Vaccine administration was funded by the national health services (12 Member States) and the national insurance schemes (seven Member States); 11 Member States reported that vaccinees had to pay for vaccine administration (Figures 12 and 13).
Pregnant women
The national health services paid for vaccines for pregnant women in 15 Member States. Administration of the vaccine for this target group was covered by the national health services in 11 Member States. In nine Member States, vaccinees had to pay for the vaccine themselves. In 12 Member States, the vaccinee was required to also
pay for vaccine administration (Figures 12 and 13).
Healthcare workers
With regard to HCWs, the national health services paid for the vaccine in 13 countries. Nine countries paid for the administration. Employers paid for the vaccine and for its administration in 18 Member States (Figures 12 and 13).
Although vaccination for HCWs is not nationally recommended in Denmark, vaccination is available free of charge for all HCWs and paid for by the employer.

TECHNICAL REPORT Seasonal influenza vaccination in Europe
21
Figure 12. Payment mechanisms for vaccine in population groups recommended for seasonal
influenza vaccination, 2014–15 influenza season
Figure 13. Payment mechanisms for vaccine administration for population groups recommended for seasonal influenza vaccine, 2014–15 influenza season
Source: National seasonal influenza vaccination survey, December 2015. Notes for Figures 12 and 13: More than one answer was possible As a country can issue recommendations for several target groups, the total number of countries recommending vaccination (given in brackets) can be lower. National health insurance: a scheme in which a premium is paid into an insurance fund, which entitles payers to a range of health services. If no premiums are received, services may be reduced or cancelled. National health service: a publicly funded healthcare system Out-of-pocket: costs paid by the vaccinee, not reimbursable Other payment mechanism: paid for if administered in pharmacies or other authorised venues.
Number of doses of seasonal influenza vaccine The number of purchased seasonal influenza vaccine doses was expressed as ‘available per 10 000 people aged ≥65 years’ and varied widely between countries and different seasons. The number of purchased doses ranged from 2 220 to 16 131 doses per 10 000 people aged ≥65 years in 2007–08, and from 1 540 to 14 895 in 2014–15 (Figures 14–15; Annex 4: Table 6).
In some countries (e.g. Cyprus, Slovakia, Slovenia, Romania) number of doses of purchased vaccine decreased if compared with 2007-08 and 2014-15.
0
2
4
6
8
10
12
14
16
18
20
Children (n=9) Adults (n=30) Clinical risk groups(n=30)
Pregnant women(n=27)
HCWs (n=30) Other occupations(n=23)
Nu
mb
er
of
co
un
trie
s
National health service National insurance scheme Out of pocket
Private insurance Regional health service Employer
0
2
4
6
8
10
12
14
16
18
20
Children (n=9) Adults (n=30) Clinical risk groups(n=30)
Pregnant women(n=27)
HCWs (n=30) Other occupations(n=23)
Nu
mb
er
of
co
un
trie
s
National health service National insurance scheme Out of pocket
Private insurance Regional health service Employer

Seasonal influenza vaccination in Europe TECHNICAL REPORT
22
Figure 14. Number of purchased* seasonal influenza vaccine doses expressed as vaccine doses
available per 10 000 people aged 65 years and over in 24 EU/EEA Member States, influenza seasons 2007–08 to 2014–15
* Purchased doses = number of purchased doses through national public procurement
0 2000 4000 6000 8000 10000 12000 14000 16000 18000
Netherlands
Ireland
Iceland
Malta
Belgium
UK
Finland
Cyprus
Germany
Luxembourg
Slovakia
Italy
Romania
Portugal
Denmark
Nnorway
Hungary
Slovenia
Bulgaria
Croatia
Poland
Lithuania
Estonia
Latvia
No. of doses per 10 000 people aged ≥65 years
2014-15
2013-14
2012-13
2011-12
2010-11
2009-10
2008-09
2007-08
TECHNICAL REPORT Seasonal influenza vaccination in Europe
23
Limitations
There are some limitations to these surveys.
Comparisons of vaccination coverage data are difficult because European Member States use different methods to estimate coverage. Most countries use administrative methods of data collection, whereas other countries use population-based surveys or vaccination registries; some countries combined several methods. Even within a given Member State, comparisons between years may be difficult if methods or response rates differ from year to year.
How Member States enumerate the denominator data (numbers of those eligible for vaccination) is often not clear, especially when it comes to less specific groups, such as people with chronic medical conditions or HCWs.
Most EU/EEA Member States report difficulties in estimating denominator data relating to the numbers of individuals with chronic medical conditions. This reflects a lack of information systems (disease registers) or other standardised methodologies for collecting these data in most Member States.
Verifying the number of vaccinated people (numerator data) is difficult because countries may use data from administrative records, immunisation registries or surveys, which all have their own limitations.
Vaccination coverage rates were collected as proportions (the number of vaccinated individuals (numerator) divided by the number of individuals in each population group targeted for vaccination (denominator)), calculated for each participating Member State. Due to the fact that actual numerator and denominator data (numbers) were not recorded it is not possible to use statistical tests to compare different seasons between participating countries.
Some countries reported using population surveys to estimate the number of individuals at risk. Again, comparing the number of individuals at risk between countries is difficult because of the wide range of methodologies, e.g. household surveys, mail, face-to-face interviews, and telephone interviews.
Comparing median values to calculate vaccination coverage rates has its limitations as medians were calculated based on the data provided by each country. The reason for comparing median values was to not lose data. If we
had restricted data analysis to the few seasons for which all participating countries provided data, we would have excluded data from those countries that only reported data for one or two seasons; however, comparing such data subsets would have been more accurate.
In this report, we estimated the number of influenza vaccine doses used in each country, expressed as a rate per 10 000 of those aged 65 years or above, as a very crude indicator to assess supply against need. As vaccine procurement must take into account the expected uptake by risk group (usually identified by demand reported in the most recent season) most countries will order quantities to match expected demand in order to minimise vaccine wastage and inefficient use of public funds.
The use of the same denominator (Eurostat data 2011) and its application to all influenza seasons is also a limitation. Changes in the population size would influence the size of population at risk, therefore annual population data would be a preferred; however, no such data were available for this report.
The reasons for low or high vaccination coverage in EU/EEA countries were beyond the scope of these surveys.
Conclusions
The VENICE network surveys are supported by ECDC and participating Member States. The standardised data collected through these surveys ensures the ongoing monitoring of progress towards the implementation of internationally accepted recommendations and goals with regard to seasonal influenza vaccination in the EU/EEA Member States.
Recommendations for seasonal influenza vaccination
Recommendations for seasonal influenza vaccination for targeted or at-risk groups are standard in most countries. Targeted or at-risk groups typically include the older population, pregnant women, healthcare workers, people with chronic medical conditions, and residents of long-term care facilities. One third of the countries are also targeting children. Recommendations in most countries broadly comply with the Council Recommendation and WHO recommendations.
There were no major changes in the number of Member States that recommended certain older age groups for influenza vaccine in the 2007–08 and 2014–15 influenza seasons. However, several countries lowered the recommended age for vaccination: more countries in 2014–15 recommended that those aged 60 years or older should be vaccinated (six in 2014–15 vs. three in 2007–08).

Seasonal influenza vaccination in Europe TECHNICAL REPORT
24
There were few changes in recommendations for children and/or adolescents between 2007–08 and 2014–15. Three countries (Malta, Poland and the United Kingdom) introduced recommendations to vaccinate thisspecific age group.
Changes in recommendations were seen for people with chronic medical conditions and pregnant women.Compared with the average for six influenza seasons, more countries recommend to vaccinate those withmorbid obesity, people with hepatic and neurological diseases and pregnant women (more countries nowrecommend vaccination at any pregnancy trimester as opposed to earlier recommendations for only the 2ndand 3rd trimesters). A similar trend was observed in relation to recommendations for HCWs.
With the exception of HCWs, the vaccination of occupational groups is not common in EU/EEA MemberStates: only around one third of the responding countries recommend influenza vaccine for occupationalgroups.
Vaccination coverage rates during in 2007–08 and 2014–15 influenza seasons Vaccination coverage rates in EU/EEA Member States vary widely across groups recommended for
vaccination.
Members States reported different methodologies for collecting vaccination coverage rates, e.g.administrative data, survey data.
Although all surveyed countries recommend vaccination for older people (26 Member States reportedvaccination coverage for this group for at least one influenza season), most countries did not meet thetargeted coverage of 75%. Only the United Kingdom–Northern Ireland and the United Kingdom–Scotlandmanaged to do so. The 75% target was achieved by the Netherlands for a few influenza seasons, and theUnited Kingdom–England and the United Kingdom–Wales almost achieved this target. However, thevaccination coverage rate in the Netherlands has declined since 2007–08. In almost all countries,vaccination coverage rates are declining since the baseline season of 2007–08. Vaccination coverage rates
are well below the EC target and did not increase in eight influenza seasons. Five Member States were notable to provide vaccination coverage rates for older population groups in any of the six VENICE surveys.
Although seasonal influenza vaccine is recommended in all EU/EEA Member States for those with chronicmedical conditions (e.g. pulmonary diseases, cardiovascular diseases, renal diseases, metabolic disordersand immunosuppression due to disease or treatment), vaccination coverage rates for this population groupwere only available for at least one influenza season in approximately one-third of the Member States.Vaccination coverage rates in this group were considerably lower than among the older population groupsin most Member States. Vaccination coverage rates did not meet the EU target, except for the UnitedKingdom–Northern Ireland, where coverage among the elderly was high. High vaccination coverage rateswere also reported in Netherlands; however, similar to the vaccination coverage rates among the olderpopulation, the vaccination coverage rate is also declining in this population group. Vaccination coveragerates are well below the EC target and did not increase over the eight influenza seasons covered in thisreport, and there is no any indication that vaccination coverage rates are rising compared with the baselineseason 2007–08.
Vaccination coverage rates among HCWs were only available from 17 of the 29 Member States thatrecommend vaccine for this population group. In 2014–15, vaccination coverage rates for HCWs variedgreatly, e.g. from 54.9% in the United Kingdom–England and 36.2% in the United Kingdom–Scotland to 5%in Poland. The vaccination coverage rates in the United Kingdom increased since the baseline season 2007–08. In the remaining Member States, vaccination coverage rates were low – and even lower for HCWs thanfor other targeted population groups. Overall, vaccination coverage rates in all countries, except the UnitedKingdom, did not increase during eight influenza seasons. In most of these countries, vaccination coveragerates declined slightly from season to season. Vaccination coverage data for staff working in long-term carefacilities were available from three Member States (Ireland, Portugal, England) and were equally low asamong other HCWs.
The four Member States that provided vaccination coverage rates for residents of long-term care facilitiesalso reported high coverage rates.
Although vaccination was recommended for pregnant women in 27 of the participating Member States in2014–15, only seven of these Member States reported vaccination coverage for this group for more thanfour influenza seasons; vaccination coverage rates varied widely between these Member States.
The results of these surveys show that achieving high vaccination coverage rates for those at risk ofdeveloping severe complications due to influenza infection remains a serious public health challenge.

TECHNICAL REPORT Seasonal influenza vaccination in Europe
25
Vaccination coverage rates did not increase in the eight influenza seasons covered in this report in any
vaccine-targeted population group.
Number of doses of seasonal influenza vaccine A crude analysis of the number of purchased seasonal influenza vaccine doses potentially available per 10 000 people 65 years or older indicates that there is a lack of vaccine for this segment of the population in one third of Member States, in particular in those countries that most recently joined EU. In addition, these data also indicate that there is not enough vaccine, not only for older population in these countries, but also for other targeted population groups (e.g. those in risk groups) for which recommendations exists. Some countries purchased less vaccine in 2014–15 than in 2007–08. Although the number of purchased doses is likely to reflect the uptake in previous years, the lack of vaccine in some countries might be a barrier to achieve better vaccination coverage rates.
Payment mechanisms The predominant payment mechanism for influenza vaccinations, as reported by Member States, was through national health services (or equivalent): health services usually cover the costs for those population groups for whom seasonal influenza vaccine is recommended (e.g. children, adolescents, adults, those with chronic medical conditions, pregnant women, HCWs and members of closed communities). However, around one third of the Member States indicated that vaccines in this groups have to pay for vaccine and/or administration out-of pocket. This is likely to be one of the barriers to achieve better vaccination coverage rates in those countries.
The way forward
Annual EU/EEA surveys on seasonal influenza vaccination policies and coverage are useful to monitor trendsin vaccination policies across the region, provided that these surveys use consistent methods, e.g. the samequestions, to ensure comparability. Additionally, conducting a survey also serves as an incentive for the
Member States to evaluate and improve their vaccination programmes.
In order to assess the performance of national influenza vaccination programmes, countries should considerexpanding their influenza vaccination coverage monitoring systems to those target groups for whomvaccination is most commonly recommended (older people, people with chronic medical conditions,pregnant women, and HCWs). Data on coverage, collected on an annual basis at the end of each influenzaseason, could be used to identify gaps and challenges in national vaccination programmes.
The data from summarised VENICE surveys demonstrate that vaccination coverage rates need to beimproved in all target groups: older people, people with chronic medical conditions, pregnant women, andhealthcare workers.
Public health authorities should consider encouraging healthcare workers to recommend seasonal influenzavaccination to people in the target groups. Communication campaigns on influenza and influenza vaccines,directed specifically at these population groups, could increase coverage.
Adequate and sustainable funding for influenza immunisation programs is an important factor to achievehigher vaccination coverage rates.
More work is needed to explore how recommendations (at all levels) can be effectively translated intohigher vaccination coverage rates. Research should try to identify the reasons why some countries achievea 75% vaccination coverage rate and others do not.
Comparison of vaccination coverage rates at the European level could be obtained by annual population-based surveys, which use identical or very similar methods.

Seasonal influenza vaccination in Europe TECHNICAL REPORT
26
References
1. Nicoll A, Sprenger M. Low effectiveness undermines promotion of seasonal influenza vaccine. Lancet Infect Dis 2013 Jan;13(1):7-9.
2. European Commission. Proposal for a Council recommendation on seasonal influenza vaccination. European Commission: Brussels; 22 December 2009. Available from: http://ec.europa.eu/health/ph_threats/com/Influenza/docs/seasonflu_rec2009_en.pdf.
3. Nicoll A, Ciancio B, Tsolova S, Blank P, Yilmaz C. The scientific basis for offering seasonal influenza immunisation to risk groups in Europe. Euro Surveill 2008 Oct 23;13(43).
4. World Health Organization. Resolution of the 56th World Health Assembly, 10th plenary meeting, resolution no. 56.19. Prevention and control of influenza pandemics and annual epidemics. Geneva: WHO; 2003. Available from: http://apps.who.int/gb/archive/pdf_files/WHA56/ea56r19.pdf.
5. World Health Organization. Vaccines against influenza WHO position paper – November 2012. Wkly Epidemiol Rec. 2012 Nov 23;87(47):461-76. Available from: http://www.who.int/wer/2012/wer8747.pdf
6. van Gageldonk-Lafeber AB, Dijkstra F, van 't Veen H, Orchudesch M, van der Hoek W. Low influenza vaccination coverage rate among hospital employees. Ned Tijdschr Geneeskd. 2014;158:A7650
7. Eurostat. European Statistical System. Population of those ≥65 years of age in 2011 (accessed 28 Feb 2017). Available from: https://ec.europa.eu/CensusHub2/query.do?step=selectHyperCube&countrycode=en&clearSession=true.

TECHNICAL REPORT Seasonal influenza vaccination in Europe
27
Annex 1. Recommendations for children, adolescents and adults
Table A-1. Member States recommending seasonal influenza vaccination for children, adolescents and adults, influenza seasons 2014–15 and 2007–08
Country Influenza
season
Age groups: children Age groups: adults (years)
≥6 –24§ months
≥6 – 36 months
≥6 – 59 months
≥2–4 years ≥2–11 years 11 years ≥6 months–
12 years ≥6 months– <18 years
≥18–64
≥50 ≥55 ≥59 ≥60 ≥65
Austriaa,c 2014-15 R R R R
2007-08 R R R R
Belgiumb 2014-15 R R
2007-08 R R
Bulgaria 2014-15 R
2007-08 - - - - - - - - - - - - - -
Croatia 2014-15 R
2007-08 - - - - - - - - - - - - - -
Cyprus 2014-15 R
2007-08 R
Czech Republic
2014-15 R
2007-08 R
Denmark 2014-15 R
2007-08 R
Estoniac 2014-15 R R R
2007-08 R R R
Finland 2014-15 R R
2007-08 R R
France 2014-15 R
2007-08 R
Germany 2014-15 R
2007-08 R
Greece 2014-15 R
2007-08 R
Hungary 2014-15 R
2007-08 R
Iceland 2014-15 R
2007-08 R
Irelandd 2014-15 R R
2007-08 R R
Italy 2014-15 R
2007-08 R
Latvia 2014-15 R R
2007-08 R R
Liechtenstein 2014-15 R
2007-08 - - - - - - - - - - - - - -
Lithuania 2014-15 R
2007-08 R
Malta 2014-15 R R
2007-08 R
Netherlands 2014-15 R
2007-08 R
Norway 2014-15 R
2007-08 R
Polandc 2014-15 R R R
2007-08 R
Portugale 2014-15 R R
2007-08 R
Romania 2014-15 R
2007-08 R
Slovakia 2014-15 R R
2007-08 R R
Slovenia 2014-15 R R
2007-08 R R

Seasonal influenza vaccination in Europe TECHNICAL REPORT
28
Country Influenza
season
Age groups: children Age groups: adults (years)
≥6 –24§ months
≥6 – 36 months
≥6 – 59 months
≥2–4 years ≥2–11 years 11 years ≥6 months–
12 years ≥6 months– <18 years
≥18–64
≥50 ≥55 ≥59 ≥60 ≥65
Spainf 2014-15 R
2007-08 R
Sweden 2014-15 R
2007-08 R
United Kingdom–
Englandg
2014-15 R R
2007-08 R
United
Kingdom– Northern
Irelandh
2014-15 R R
2007-08 R
United
Kingdom– Scotlandi
2014-15 R R
2007-08 R
United Kingdom– Walesj
2014-15 R R R
2007-08 R
Source: National seasonal influenza vaccination surveys, July 2009, December 2015
R = recommended. ‘Recommended’ is defined as the existence of a written recommendation in an official policy document stating that a particular population group should receive seasonal influenza vaccine. – = A dash means that these countries did not respond or participate during the survey period.
§ Up to and including children aged 24 monthsa Vaccination is recommended for people ≥50 years of age, particularly for people ≥65 years of age.b During the influenza season 2007–2008, vaccination was recommended for people 50–64 years of age. In 2014–2015, vaccination was still advised for this age group but this group was no longer considered high priority.c In Austria, Estonia and Poland, vaccination against seasonal influenza is recommended for all population groups six months or older.d The National Immunization Technical Advisory Group (NITAG) recommends vaccination for all people ≥50 years of age, but the national influenza programme specifies ≥65 years.e Vaccine recommended for those ≥60 years of age; vaccine is free of charge for those 65 years or above.f The recommendation at the national level is for those ≥65 years of age; however, 10 out of 19 regions recommend vaccination for all people 60 years and older. g In 2013–14, vaccination was recommended for all two- and three-year-old children; in 2014–15, four-year-olds were added to this group.h In 2013–14, vaccination was recommended for all two- and three-year-old children and all children in grade 6 (10 years of age); in 2014–15, vaccination was recommended for all children aged 2 to 11 years.i Recommended for all children aged 2 to 11 years. j Since the 2014–15 influenza season, vaccination has been recommended for all children aged two to four years. Vaccination is also recommended for all children in grade 7 (11 years of age).

TECHNICAL REPORT Seasonal influenza vaccination in Europe
29
Annex 2. Recommendations for specific groups
Table A-2. Population groups recommended for seasonal influenza vaccination in EU/EEA countries during six influenza seasons
Recommendation for targeted population groups
Number of countries where vaccination was
recommended by influenza season†
2007–08
(n=27)
2009–10§
(n=28)
2010–11
(n=28)
2011–12
(n=28)
2012–13
(n=30)
2014–15
(n=30)
Clinical risk groups, disorders
Chronic pulmonary diseasesa 27 28 28 28 30 30
Cardiovascular diseasesb 27 28 28 28 30 30
Renal diseases 25 28 28 28 30 30
Haematologic/metabolic disorders 26 28 28 28 27 30
Immunosuppression due to disease or treatment 25 28 28 28 29 30
HIV/AIDS 24 24 25 25 25 28
Hepatic diseases 15 17 19 21 27 27
Children on long-term aspirin therapy 18 17 16 15 17 15
Morbid obesity (Body mass index ≥40kg/m2)c - - 9 10 15 19
Chronic neurological diseases or neuromuscular conditionsd - - 19 21 25 26
Any conditions that can compromise respiratory functione 13 18 19 23 22 23
Pregnancy-related recommendations
Recommended 10 16 22 23 27 27d
Any trimester - - 9 13 18 21
Either 2nd or 3rd trimester - - 13 10 9 7
Occupational setting
HCWs 22 23 25 26 29 29
Essential services (police and firemen) 5 8 8 7 7 10
Military 6 9 10 11 11 12
Poultry industry 13 11 12 9 11 12
Families that raise poultry, pigs or waterfowl 4 9 9 7 5 5
Educational - - 5 3 3 4
Public transport - - 6 4 4 5
Energy sector - - 3 1 2 3
Veterinary services - - - - 7 8
Border control/immigration/customs staff - - 4 3 5 5
Other settings/groups
Residents of long-term care facilities 22 24 25 25 28 27
Household contacts of:
Individuals belonging to the risk groups - 10 14 15 19 18
Children <6 months of age - 6 11 9 7 7
Imunosupressed individuals - 9 16 17 20 22
Older population (e.g. ≥65 years) - 4 10 10 10 11
Source: National seasonal influenza vaccination surveys, July 2009–December 2015
§ Data refer to seasonal influenza vaccine recommendations in the 2009–10 pandemic influenza season. † No data collected for influenza seasons 2008–09 and 2013–14. a Respiratory (pulmonary) diseases, e.g. chronic obstructive pulmonary disease, cystic fibrosis, asthma. b Cardiovascular diseases, e.g. congenital heart disease, congestive heart failure and coronary artery disease, except hypertension.c Morbid obesity is defined as having a body mass index of ≥40kg/m². d Chronic neurological diseases or neuromuscular conditions, e.g. disorders of the brain, the spinal cord, the peripheral nerves and muscles such as cerebral palsy, epilepsy (seizure disorders), stroke, intellectual disability (mental retardation), moderate to severe developmental delay, muscular dystrophy, or spinal cord injury. e Any condition that can compromise respiratory function, e.g. cognitive dysfunction, spinal cord injury, seizure disorder, or other neuromuscular disorders. f Recommended for all pregnant women in 25 countries in 2014–15; recommended for those with additional clinical risk in two countries.
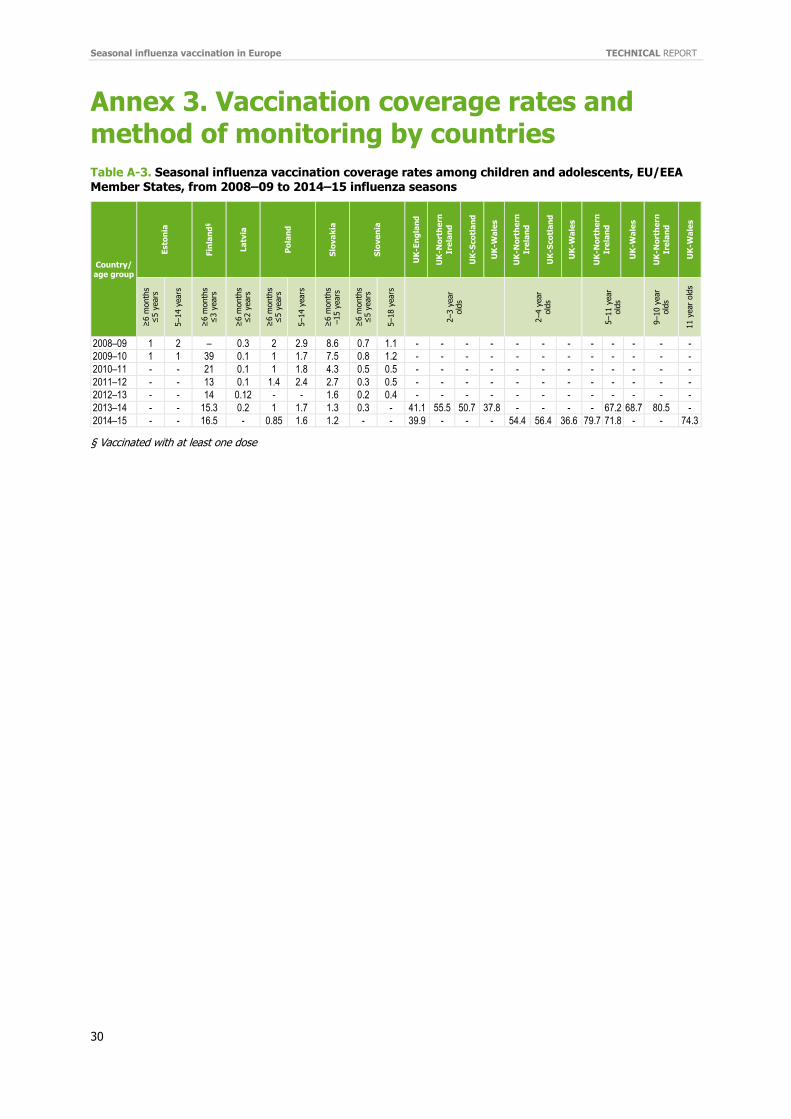
Seasonal influenza vaccination in Europe TECHNICAL REPORT
30
Annex 3. Vaccination coverage rates and method of monitoring by countries
Table A-3. Seasonal influenza vaccination coverage rates among children and adolescents, EU/EEA Member States, from 2008–09 to 2014–15 influenza seasons
Country/ age group
Esto
nia
Fin
lan
d§
La
tvia
Po
lan
d
Slo
va
kia
Slo
ve
nia
UK
-En
gla
nd
UK
-No
rth
ern
Ire
lan
d
UK
-Sco
tla
nd
UK
-Wa
les
UK
-No
rth
ern
Ire
lan
d
UK
-Sco
tla
nd
UK
-Wa
les
UK
-No
rth
ern
Ire
lan
d
UK
-Wa
les
UK
-No
rth
ern
Ire
lan
d
UK
-Wa
les
≥6 m
onth
s ≤
5 y
ears
5–14 y
ears
≥6 m
onth
s ≤
3 y
ears
≥6 m
onth
s ≤
2 y
ears
≥6 m
onth
s ≤
5 y
ears
5–14 y
ears
≥6 m
onth
s –15 y
ears
≥6 m
onth
s ≤
5 y
ears
5–18 y
ears
2–3 y
ear
old
s
2–4 y
ear
old
s
5–11 y
ear
old
s
9–10 y
ear
old
s
11 y
ear
old
s
2008–09 1 2 – 0.3 2 2.9 8.6 0.7 1.1 - - - - - - - - - - - -
2009–10 1 1 39 0.1 1 1.7 7.5 0.8 1.2 - - - - - - - - - - - -
2010–11 - - 21 0.1 1 1.8 4.3 0.5 0.5 - - - - - - - - - - - -
2011–12 - - 13 0.1 1.4 2.4 2.7 0.3 0.5 - - - - - - - - - - - -
2012–13 - - 14 0.12 - - 1.6 0.2 0.4 - - - - - - - - - - - -
2013–14 - - 15.3 0.2 1 1.7 1.3 0.3 - 41.1 55.5 50.7 37.8 - - - - 67.2 68.7 80.5 -
2014–15 - - 16.5 - 0.85 1.6 1.2 - - 39.9 - - - 54.4 56.4 36.6 79.7 71.8 - - 74.3
§ Vaccinated with at least one dose

TECHNICAL REPORT Seasonal influenza vaccination in Europe
31
Table A-4. Seasonal influenza vaccination coverage rates for targeted population groups by method
of monitoring, EU/EEA Member States, from influenza seasons 2007–08 to 2014–15 C
ou
ntr
y
Bel
gium
Cro
atia
Cyp
rusa
Cze
ch R
epub
licb
Den
mar
k
Est
onia
Fin
land
Fra
nce
Ger
man
y
Gre
ece
Hun
gary
Icel
and
Irel
and
Italy
Latv
ia
Lith
uani
a
Luxe
mbo
urg
Mal
ta
Net
herla
nds
Nor
way
Pol
and
Por
tuga
l
Rom
ania
Slo
vaki
a
Slo
veni
a
Spa
in
Sw
eden
UK
-Eng
land
UK
-Nor
ther
n Ire
land
UK
-Sco
tland
UK
-Wal
esc
Med
ian
Met
hod/
in
fluen
za
seas
on†
Sd A A A A A A A S A S Ae Af A A A S A A A A A A A Ab S A A S A A A A A S A A A A
Clinical risk groups (n=9)§ 2007-08 - - - - - - - 52.0 - - 49.0 - - - - - - - - - - - - 71.7 50.0 - - - - - - - - - 45.3 - - - 50.0
2008-09 45.0 - - - - - - 39.4 - - 43.3 - - - - - - - - - - - - 71.5 47.0 - - - 35.5 - - - - - - 47.1 74.0 47.8 40.8 46.0
2009-10 - - - - - - - 47.2 - - 39.8 - - - - - 28.9 - - - - - - 70.4 51.0 33.0 - - 32.4 - - - - - - 51.6 80.0 51.1 49.1 49.1
2010-11 - - - - - - - 37.2 - - 46.2 - - - - - - - - - - - - 68.9 47.0 38.0 - - 29.4 - - - - - - 50.4 78.7 56.1 48.5 47.8
2011-12 - - - - - - - 39.5 - - 42.9 - - - - - - - - - - - - 68.6 42.0 37.0 - - 31.0 - - - - - - 51.6 81.7 59.7 50.0 46.5
2012-13 - - - - - - - 39.1 - - 41.5 - - - - - 28.4 - - - - - - 65.8 44.5 37.1 - - 28.0 - - - - - - 51.3 80.2 59.2 49.7 44.5
2013-14 43.7 - - - - - - 38.3 - - 40.4 - - - - - - - - - - - - 61.9 - - - - - - - - - - - 52.3 76.4 57.5 51.1 51.7
2014-15 - - - 24.9 - - - 37.5 - - - - - - - - - - - - - - - 53.0 - - - - - - - - - - - 50.3 71.8 54.0 49.3 50.3
Median 44.4 - - 24.9 - - - 39.3 - - 42.9 - - - - - 28.7 - - - - - - 68.8 47.0 37.1 - - 31.0 - - - - - - 50.9 78.7 56.1 49.3 44.4
Pregnant women (n=7)§ 2010-11 - - - - - - - - - - - - - - - - - - - - - - - - - - - - - 3.7 - 2.4 - - - 38.0 - 65.6 39.6 38.0
2011-12 - - - - - - - - - - - - - - - - - - - 0.2 - - - - - - - - - 4.2 - 1.3 - - - 27.4 58.4 41.1 31.7 27.4
2012-13 - - - - - - - - - - 23.2 - - 3.3 - - 22.0 - - 0.3 - - - - - - - - - 4.2 - 1.4 - - - 40.3 64.6 54.0 43.6 22.6
2013-14 - - - - - - - - - - - - - 2.5 - - - - - 0.2 - - - - - - - - - 2.6 - 0.7 - - - 39.8 58.0 49.5 43.7 21.2
2014-15 - - - - - - - - - - - - - 1.5 - - - - - 0.3 - - - - - - - - - 3.1 - 0.7 - - - 44.1 56.1 50.9 45.5 23.6
Median - - - - - - - - - - 23.2 - - 2.5 - - 22.0 - - 0.3 - - - - - - - - - 3.7 - 1.3 - - - 39.8 58.2 50.9 43.6 22.6
HCWs (n=17)§ 2007-08 - - - - - - - - - - 23.0 - - - - - - - - - - - - - - - - 26.0 - 89.4 - - 28.1 - - 13.4 - - - 26.0
2008-09 35.4 - - - - - - - 24.9 - 30.5 - - 44.0 - - - - - 25.5 - - - - - - - 32.0 - 97.8 - - 32.4 - - - - - - 32.2
2009-10 - - - - - - - - 33.9 - 27.3 - - 53.6 - - 26.5 - - 23.5 - - - - - 12.0 - 43.5 - - - - 34.8 - - 26.4 18.0 - 11.6 26.5
2010-11 - - - - - - - - 27.6 - 25.8 - - 41.2 - - - - - 24.0 - - - - - 14.0 - 34.1 - 63.9 - 16.6 21.1 - - 34.7 - 30.4 18.5 26.7
2011-12h - - - - - - - - - - - - - 34.3 - 18.0 - - - 24.9 - - - 65.1 - 12.0 6.4 32.0 - 54.4 - 15.7 24.7 - - 44.6 20.8 - 30.9 24.9
2012-13 - 19.0 - - - - - - - - - 19.0 11.5 29.2 - - 28.0 - - 25.9 - - - 75.0 - 9.5 28.0 - 42.0 - 12.7 22.9 - - 45.6 20.4 33.7 35.5 27.0
2013-14g - 16.4 - - - - - - - - - - 4.1 38.7 - 24.1 - - - 26.6 - - - - - 12.7 5.0 29.0 - 37.6 - 11.0 27.6 - - 54.8 20.0 34.7 40.6 26.6
2014-15g - 15.5 15.0 - - - - - - - - - 10.7 30.7 - 23.8 - - - 27.4 - - - - - 8.9 5.0 28.0 - 29.4 - 9.7 27.5 - - 54.9 24.0 36.2 44.3 25.7
Median 35.4 16.4 15.0 - - - - - 27.6 - 26.6 19.0 10.7 38.7 - 23.8 27.3 - - 25.5 - - - 70.1 - 12.0 5.7 30.5 - 54.4 - 12.7 27.6 - - 44.6 20.4 34.2 33.2 26.9
Staff of long-term care facilities (n=3)§ 2008-09 - - - - - - - - - - - - - - - - - - - - - - - - - - - - - - - - - - - - - - - -
2009-10 - - - - - - - - - - - - - - - - - - - - - - - - - - - 36.0 - - - - - - - - - - - 36.0
2010-11 - - - - - - - - - - - - - - - - - - - - - - - - - - - 27.3 - - - - - - - - - - - 27.3
2011-12 - - - - - - - - - - - - - - - 13.5 - - - - - - - - - - - 28.0 - - - - - - - 45.2 - - - 28.0
2012-13 - - - - - - - - - - - - - - - 15.0 - - - - - - - - - - - 27.0 - - - - - - - - - - - 21.0
2013-14 - - - - - - - - - - - - - - - 23.3 - - - - - - - - - - - 24.0 - - - - - - - - - - - 23.7
2014-15 - - - - - - - - - - - - - - - 25.7 - - - - - - - - - - - 22.0 - - - - - - - - - - - 23.9
Median - - - - - - - - - - - - - - - 19.2 - - - - - - - - - - - 27.2 - - - - - - - 45.2 - - - 27.2
Residents of long-term care facilities (n=4)§ 2008-09 68.7 - - - - - - - - - - - - - - - - - - - - - - - - - - 80i - - 82.6 - - - - - - - - 75.7
2009-10 - - - - - - - - - - - - - - - - - - - - - - - - - - - 87.0 - - 82.9 - - - - - - - - 85.0
2010-11 - - - - - - - - - - - - - - - - - - - - - - - - - - - 85.4 - - 82.9 - - - - - - - - 84.2
2011-12 - - - - - - - - - - - - - - - 88.0 - - - - - - - - - - - 91.0 - - 78.9 - - - - - - - - 88.0
2012-13 - - - - - - - - - - - - - - - 73.0 - - - - - - - - - - - 89.0 - - 71.1 - - - - - - - - 73.0
2013-14 - - - - - - - - - - - - - - - 84.3 - - - - - - - - - - - 70.0 - - 68.9 - - - - - - - - 70.0
2014-15 - - - - - - - - - - - - - - - 96.6 - - - - - - - - - - - 77.0 - - 72.2 - - - - - - - - 77.0
Median 68.7 - - - - - - - - - - - - - - 84.3 - - - - - - - - - - - 86.2 - - 78.9 - - - - - - - - 81.6
Older population groups (n=26)§
Age
R
ecom
-
men
ded
≥65 ≥65 ≥65 ≥65 ≥65 ≥65 ≥65 ≥65 ≥60 ≥60 ≥60 ≥60 ≥65 ≥65 ≥65 ≥65 ≥65 ≥55 ≥60 ≥65 ≥65 ≥55 ≥60 ≥65 ≥59 ≥65 ≥65 ≥65 ≥65 ≥65 ≥65 ≥65 ≥65 ≥65 ≥65 ≥65 ≥65 ≥65 ≥65
2007-08 - - - - 54.0 1.1 48.0 64.0 69.0 - 61.0 - - - 32.0 61.7 - 64.9 - 12.5 - 42.0 - 82.6 50.0 - 9.1 51.0 50.0 52.6 33.4 25.6 62.9 - 73.5 - - - 51.0
2008-09 65.1 - - - 53.7 1.0 51.0 64.8 62.7 - 52.8 - - 38.4 21.2 70.1 - 66.2 2.4 23.6 53.3 51.0 76.9 82.5 47.0 - 11.4 50.0 53.0 49.4 35.5 26.0 65.2 65.8 - 74.1 76.8 76.3 59.5 53.2
2009-10 - - - - 52.0 1.0 45.0 63.9 62.6 - 47.5 - - 31.8 42.0 53.8 63.5 65.6 2.1 21.7 52.4 - 76.3 81.1 51.0 - 9.3 - 52.2 28.5 30.5 22.1 65.7 43.9 - 72.4 77.0 75.0 63.5 52.1
2010-11 - - - - 50.0 1.1 40.0 56.2 61.0 - 54.3 - - 29.7 - 63.8 - 62.4 1.5 17.3 45.1 56.0 75.4 80.6 47.0 42.0 9.3 - 48.3 19.1 23.8 18.0 56.9 55.2 - 72.8 74.9 76.2 65.7 52.2
2011-12 - - - - 51.0 - 39.0 55.2 64.0 - 52.6 - - 31.1 - 56.3 - 62.7 1.7 18.5 45.1 - 71.3 77.2 42.0 36.0 14.2 - 43.4 20.9 21.9 16.2 57.7 46.1 - 74.0 77.0 76.6 67.7 48.6
2012-13 - 30.0 - - 46.0 1.0 33.0 53.1 - - 50.0 - - 30.9 44.7 56.9 59.9 54.2 1.8 19.4 43.3 52.0 67.8 74.3 44.5 36.2 7.4 55.0 45.0 14.9 15.4 15.2 57.0 44.3 - 73.4 75.0 77.4 67.7 45.0
2013-14j 60.2 21.0 - - 44.7 1.0 41.6 51.9 - 38.1 49.4 - - 29.0 44.0 59.4 - 55.4 2.9 19.8 - 43.9 65.7 72.2 - 30.9 12.5 57.0 - 9.0 15.6 12.8 56.4 46.9 45.8 73.2 75.4 76.9 68.3 45.3
2014-15j - 21.0 - 24.9 - 1.1 39.6 48.5 - 36.7 - - - 22.6 41.0 60.2 - 48.6 2.9 22.1 - 42.5 60.1 66.9 - 26.9 13.4 55.0 - 7.4 14.1 11.0 56.2 48.9 49.7 72.7 73.4 76.3 68.0 41.8
Median 62.7 21.0 - 24.9 51.0 1.0 40.8 55.7 62.7 37.4 52.6 - - 30.9 41.5 59.8 61.7 62.6 2.1 19.6 45.1 47.5 71.3 78.9 47.0 36.0 10.4 55.0 49.2 20.0 22.9 17.1 57.4 46.9 47.8 73.3 75.4 76.3 67.7 47.6
Source: National seasonal influenza vaccination surveys, July 2009–December 2015
A – Administrative method: reported routine immunisation data, i.e. registry system of doses administered. S – Survey method: population surveys, i.e. household, mail, face-to-face, telephone surveys.
§ Numbers in parentheses are the mean number of EU countries that provided vaccination coverage for a particular population group. The UK calculated as one Member State. † The data in 2009–10 refer to the seasonal influenza during the A(H1N1pdm09) pandemic. a Coverage data for of healthcare workers were only available from public sector hospitals.b Vaccination coverage rates calculated for those >65 years of age and clinical risk groups together.c Pregnant women: Collecting data by using read codes (the standard clinical terminology system used in general practice) is considered to be problematic; data collected through surveys (conducted at the point of giving birth) offers a better estimate.d Data on vaccination coverage are provided through the national Health Interview Survey (HIS), which is organised every four to five years. The last HIS was held in 2013. e Outpatient healthcare settings.f Inpatient healthcare settings.g In Ireland, vaccination uptake among HCWs (including long-term care and hospital HCWs) was 24.1% (2013–2014) and 23.8% (2014–2015); data based on reports from occupational health management, hospitals, or long-term care facilities; data reflect vaccinations for eligible staff and the number of vaccinated staff members for each season. Not all hospitals or long-term care

Seasonal influenza vaccination in Europe TECHNICAL REPORT
32
facilities reported data for these seasons; hospital participation was high (80.7% in 2013–2014 and 79.7% in 2014–2015), but data may not represent all vaccinated individuals, particularly if HCWs were vaccinated outside the facility. h In the Netherlands, no systematically collected data are available on the percentage of influenza-vaccinated people. A small opportunistic survey among 52 of 7893 (0.7%) GP practices found that in 2012–13, only 7.7% of practices reported that every single employee was vaccinated; in 67.3% of these practices, only a portion of the employees had received an influenza vaccination. A recently published study among hospital HCWs found a median vaccination rate of 13% (spread 2–33%) in 2012–13 [6] iData were not reported from one region in 2008–09. j In Sweden, the 2014–15 data on the older population (collected through the administrative method) were taken from regional vaccine registers in 11 of 21 counties, covering circa 65% of the Swedish population.

TECHNICAL REPORT Seasonal influenza vaccination in Europe
33
Annex 4. Number of doses of seasonal influenza vaccine
Table A-5. Number of doses of seasonal influenza vaccine, EU/EEA Member States, influenza seasons 2007–08 to 2014–15
Influenza season
2007–08 2008–09 2009–10 2010–11 2011–12 2012–13 2013–14 2014–15
Pur
chas
ed
Pur
chas
ed
Dis
trib
uted
Pur
chas
ed
Dis
trib
uted
Pur
chas
ed
Dis
trib
uted
Use
d
Pur
chas
ed
Dis
trib
uted
Use
d
Pur
chas
ed
Dis
trib
uted
Use
d
Pur
chas
ed
Dis
trib
uted
Use
d
Pur
chas
ed
Dis
trib
uted
Use
d
Belgium 2276000 - - - - 3150000 2650000 2550000 - 2800000 - - - - - - - - - -
Bulgaria - 360632 - 478551 - 256395 - - 214600 214600 - 194398 - - 137161 137161 137161 254586 254586 254586
Croatia - - - - - - - - - - - 450000 445000 288440 295000 292350 255375 260000 258520 232951
Cyprus 108926 108254 94614 130499 129309 100800 95440 95440 101992 94762 94762 91640 76708 76708 - - - - - -
Denmark 720718 - - - - - - - - - - 575000 575000 783340 777500 - 777000 731340 -
Estonia - - - - - - - - - - 40800 26929 16496 47200 32390 15943
Finland 840000 - - - - - - - - 1009971 1200000 900000 900000 1200000 1100000 700000-1000000
1200000 1100000 700000-1000000
France - - 11601793 - 10492999 - - - - - - - - - - - - - - -
Germany 19000000 - 16526700 - - - - - - - - 13322945 - - - - - - - -
Hungary 1100000 1300000 - 1300000 - 1305000 1275000 - 1305000 1270000 - 1500000 1300000 1000000 1550000 1300000 898086 1530000 1300000 775230
Iceland 50900 60000 51852 60000 56350 60000 47590 - 60000 45384 - - - - 62240 62240 - 60000 58593 -
Ireland 591299 797180 605210 708660 649520 769640 759930 712700 850630 702450 - 749992 702027 659596 849999 742359 692788 790000 769380 728393
Italy 12137127 12640362 12609193 11040568 - - - - - - - 8825063 - - 9304534 - - 8273559
Malta 110000 85000 65000 110000 73000 85000 85000 78000 80000 76000 75200 75200 75200 75200 75200 75200 75200 80000 75600 75500
Latvia - - - - - - - - - - - 30500 23640 9201 - - - - - -
Lithuania - 110000 110000 138035 138035 105508 105508 90747 - - 114725 97177 97177 95136 100000 100000 97114 105000 105000 102268
Luxem-bourg
- 88450 80457 90936 89182 - - - - - - - - - - - - - - -
Norway 579888 - 579888 - 599111 - 583480 - - 517000 466000 645894 541771 526134 700000 520476 486302 580000 479437 435661
Nether-lands
- 3935860 3800860 3994760 3987940 4266110 4025990 3789949 4200000 3956010 3637545 3950000 3735000 3490000 3709640 3606120 3435599 3628570 3541640 3344906
Poland 1158878 - - - - - - - - - - 1500000 1500000 910000 - - - - - -
Portugal 1500000 - 1600000 - 1800000 2200000 2200000 1600000 1900000 1900000 1350000 1900000 1900000 - 1600000 1600000 - 2100000 2100000 -
Romania 3700000 3147500 3147500 1132800 1132800 1300000 1300000 1205917 1015115 1015115 650589 1000000 1000000 904251 600000 600000 578057 500000 500000 492176
Slovakia 682117 926643 692217 752615 669531 596370 - 496943 596900 407417 407417 262996 249684 249684 259220 259192 259192 305122 247887 247887
Slovenia 150261 199820 190529 221850 198272 - - - 161600 137233 100390 140755 121491 88000 115600 105138 80000 115600 96060 68087
UK 7976165 - - - - 14859000 14517000 - - - - - 17566957 11914798 - - - - - -
England - - - - - 12412000 - 9497000 - - - - - - - - - - - -
UK-Northern Ireland
- - - - - - - - - - 408 000 - - - - - - - - -
UK-Scotland
- - - - - - - - - - - 1156463 - - - - - - - -
Source: National seasonal influenza vaccination surveys, July 2009–December 2015 – (dash): no data provided ‘Purchased doses’: number of purchased doses through public procurement ‘Distributed doses’: number of doses distributed for vaccination in the country during a given influenza season ‘Used doses’: number of doses used for vaccination in the country during a given influenza season

ECDC is committed to ensuring the transparency and independence of its work
In accordance with the Staff Regulations for Officials and Conditions of Employment of Other Servants of the European Union and the ECDC Independence Policy, ECDC staff members shall not, in the performance of their duties, deal with a matter in which, directly or indirectly, they have any personal interest such as to impair their independence. Declarations of interest must be received from any prospective contractor(s) before any contract can be awarded.www.ecdc.europa.eu/en/aboutus/transparency
HOW TO OBTAIN EU PUBLICATIONSFree publications:• onecopy: viaEUBookshop(http://bookshop.europa.eu);
• morethanonecopyorposters/maps: fromtheEuropeanUnion’srepresentations(http://ec.europa.eu/represent_en.htm);fromthedelegationsinnon-EUcountries(http://eeas.europa.eu/delegations/index_en.htm);bycontactingtheEuropeDirectservice(http://europa.eu/europedirect/index_en.htm)or calling 00 800 6 7 8 9 10 11 (freephone number from anywhere in the EU) (*).
(*)Theinformationgivenisfree,asaremostcalls(thoughsomeoperators,phoneboxesorhotelsmaychargeyou).
Priced publications:• viaEUBookshop(http://bookshop.europa.eu).
European Centre for Disease Prevention and Control (ECDC)
Postaladdress: Granits väg 8, SE-171 65 Solna, Sweden
Visitingaddress: Tomtebodavägen 11a, SE-171 65 Solna, Sweden
Tel. +46 858601000Fax+46858601001www.ecdc.europa.eu
An agency of the European Unionwww.europa.eu
Subscribe to our monthly email www.ecdc.europa.eu/en/publications
Contact us [email protected]
Follow us on Twitter @ECDC_EU
Like our Facebook page www.facebook.com/ECDC.EU