Seasonal Changing Effect on Airflow and Pollutant ...
18
atmosphere Article Seasonal Changing Effect on Airflow and Pollutant Dispersion Characteristics in Urban Street Canyons Jingliang Dong 1,2 , Zijing Tan 1,3 , Yimin Xiao 1, * and Jiyuan Tu 2 1 College of Urban Construction and Environmental Engineering, Chongqing University, Chongqing 400030, China; [email protected] (J.D.); [email protected] (Z.T.) 2 School of Engineering, RMIT University, Bundoora, VIC 3083, Australia; [email protected] 3 School of Civil Engineering, Chang’an University, Chang’an 710064, China * Correspondence: [email protected]; Tel.: +86-23-6512-0756 Academic Editors: Riccardo Buccolieri and Jian Hang Received: 8 January 2017; Accepted: 17 February 2017; Published: 23 February 2017 Abstract: In this study, the effect of seasonal variation on air flow and pollutant dispersion characteristics was numerically investigated. A three-dimensional urban canopy model with unit aspect ratio (H/D = 1) was used to calculate surface temperature distribution in the street canyon. Four representative time events (1000 LST, 1300 LST, 1600 LST and 2000 LST) during typical clear summer and winter days were selected to examine the air flow diurnal variation. The results revealed the seasonal variation significantly altered the street canyon microclimate. Compared with the street canyon surface temperature distribution in summer, the winter case showed a more evenly distributed surface temperature. In addition, the summer case showed greater daily temperature fluctuation than that of the winter case. Consequently, distinct pollutant dispersion patterns were observed between summer and winter scenarios, especially for the afternoon (1600 LST) and night (2000 LST) events. Among all studied time events, the pollutant removal performance of the morning (1000 LST) and the night (2000 LST) events were more sensitive to the seasonal variation. Lastly, limited natural ventilation performance was found during the summer morning and the winter night, which induced relatively high pollutant concentration along the pedestrian height level. Keywords: street canyon; seasonal variation; air flow; pollutant dispersion; pollutant removal; natural ventilation 1. Introduction According to the latest statistics from the World Health Organization (WHO), the world’s urban population now stands at 3.7 billion, implying more than half of the global population resides in cities. This rapid urbanization poses challenges for sustainable development and public health. In urban environments, especially in those areas where population and traffic density are relatively high, human exposure to hazardous substances is significantly increased due to continuous traffic emissions and poor natural ventilation in street canyons. The ventilation and pollutant dispersion process in street canyons have been extensively investigated [1–3]. Canyon geometry, ambient wind condition and thermal stratification are found to be the main determinants of air flow regimes in urban street canyons [4,5]. Influential factors such as building morphology, canyon aspect ratio, ambient wind speed and direction were intensively studied. Hang et al. [6–8] investigated the effect of geometry morphology on street canyon ventilation by varying aspect ratio, length and building packing density. They found that lowering aspect ratios or increasing street lengths may enhance the pollutant removal. As driven by ambient wind, street canyon flow is significantly influenced by external wind direction [9]. Soulhac et al. [10] built a theoretical two-region street canyon model and revealed that the mean longitudinal velocity is proportional to Atmosphere 2017, 8, 43; doi:10.3390/atmos8030043 www.mdpi.com/journal/atmosphere
Transcript of Seasonal Changing Effect on Airflow and Pollutant ...

atmosphere
Article
Seasonal Changing Effect on Airflow and PollutantDispersion Characteristics in Urban Street Canyons
Jingliang Dong 1,2, Zijing Tan 1,3, Yimin Xiao 1,* and Jiyuan Tu 2
1 College of Urban Construction and Environmental Engineering, Chongqing University, Chongqing 400030,China; [email protected] (J.D.); [email protected] (Z.T.)
2 School of Engineering, RMIT University, Bundoora, VIC 3083, Australia; [email protected] School of Civil Engineering, Chang’an University, Chang’an 710064, China* Correspondence: [email protected]; Tel.: +86-23-6512-0756
Academic Editors: Riccardo Buccolieri and Jian HangReceived: 8 January 2017; Accepted: 17 February 2017; Published: 23 February 2017
Abstract: In this study, the effect of seasonal variation on air flow and pollutant dispersioncharacteristics was numerically investigated. A three-dimensional urban canopy model with unitaspect ratio (H/D = 1) was used to calculate surface temperature distribution in the street canyon.Four representative time events (1000 LST, 1300 LST, 1600 LST and 2000 LST) during typical clearsummer and winter days were selected to examine the air flow diurnal variation. The results revealedthe seasonal variation significantly altered the street canyon microclimate. Compared with thestreet canyon surface temperature distribution in summer, the winter case showed a more evenlydistributed surface temperature. In addition, the summer case showed greater daily temperaturefluctuation than that of the winter case. Consequently, distinct pollutant dispersion patterns wereobserved between summer and winter scenarios, especially for the afternoon (1600 LST) and night(2000 LST) events. Among all studied time events, the pollutant removal performance of the morning(1000 LST) and the night (2000 LST) events were more sensitive to the seasonal variation. Lastly,limited natural ventilation performance was found during the summer morning and the winter night,which induced relatively high pollutant concentration along the pedestrian height level.
Keywords: street canyon; seasonal variation; air flow; pollutant dispersion; pollutant removal;natural ventilation
1. Introduction
According to the latest statistics from the World Health Organization (WHO), the world’s urbanpopulation now stands at 3.7 billion, implying more than half of the global population resides in cities.This rapid urbanization poses challenges for sustainable development and public health. In urbanenvironments, especially in those areas where population and traffic density are relatively high, humanexposure to hazardous substances is significantly increased due to continuous traffic emissions andpoor natural ventilation in street canyons.
The ventilation and pollutant dispersion process in street canyons have been extensivelyinvestigated [1–3]. Canyon geometry, ambient wind condition and thermal stratification are found tobe the main determinants of air flow regimes in urban street canyons [4,5]. Influential factors suchas building morphology, canyon aspect ratio, ambient wind speed and direction were intensivelystudied. Hang et al. [6–8] investigated the effect of geometry morphology on street canyon ventilationby varying aspect ratio, length and building packing density. They found that lowering aspect ratios orincreasing street lengths may enhance the pollutant removal. As driven by ambient wind, street canyonflow is significantly influenced by external wind direction [9]. Soulhac et al. [10] built a theoreticaltwo-region street canyon model and revealed that the mean longitudinal velocity is proportional to
Atmosphere 2017, 8, 43; doi:10.3390/atmos8030043 www.mdpi.com/journal/atmosphere

Atmosphere 2017, 8, 43 2 of 18
the cosine of the angle of incident for any wind direction. Ryu et al. [11] presented four regressionequations of canyon-averaged wind speed as the function of canyon aspect ratio for different ambientwind directions. Wind tunnel experimental results reported by Gromke and Ruck [12] indicated thatthe trends of pollutant concentration at side walls with increasing crown porosity or tree-stand densitymay be altered by ambient wind direction.
Numerous research studies were also conducted on air flow and pollutant dispersion changesdue to the street canyon surface heating effect [13–15]. Measurement results demonstrated that thesurface temperature varies with the solar radiation and the surface albedo [16–18], and the temperaturedifference between sunlit and shadow walls in summer may exceed 10 ◦C [19,20]. Heating effect maycause unstable stratification, and significantly influent flow and pollutant transport in urban streetcanyons [21,22]. Studies conducted by Cheng et al. [23], Cheng and Liu [24] revealed the pollutantremoval performance was improved when the stability decreases with ground heating. Cai [25] foundthe differential wall heating significantly affected street canyon ventilation, and the venting velocityand exchange velocity linearly increased with wall heating. Bottillo et al. [26,27] investigated theimpact of solar radiation on the wind flow field and heat transfer within a street canyon. They foundapparent vortex structure and heat transfer coefficient changes occurred along the length of the canyonfor all studied wind conditions.
Recently, studies focused on the differential surface heating due to atmospheric instability andsolar tilt becomes an emerging research topic [28]. Kwak and Baik et al. [29] demonstrated non-uniformwall heating played crucial roles in the pollutant removal process, and its exchange amount can becomparable with that by turbulent flow during afternoon. Nazarian and Kleissl [30] performedunsteady simulations of a street-scale urban environment based on idealized geometries, in which,non-uniform surface heating caused by solar insolation and building shadowing were dynamicallycoupled with the airflow field. In their following study [31], they found the highest convective heattransfer coefficient occurred at the windward wall throughout the day. Our previous studies [32,33]have identified obvious variation of air flow and pollutant dispersion due to surface heating diurnalvariation under clear and haze-fog weather conditions.
Despite the numerous studies previously conducted, researches focusing on the seasonaldifference considering the solar radiation and the anthropogenic heating from the building interiorsremain limited, and their effects on air flow and pollutant transport are not clear [34]. To reveal theseasonal differences of flow patterns and pollutant dispersion in street canyons between summer andwinter, numerical simulations considering exterior solar radiation and interior anthropogenic heatingwere performed in this paper.
2. Methodology
2.1. Numerical Model
In this study, a three-dimensional hypothetical street canyon model with an aspect ratio of unitywas used (Figure 1). The street axis was aligned with the x-direction (north-south). Both the buildingheight (H) and street canyon width (W) were set as 20 m. The fluid domain is 5H (x-direction) × 3H(y-direction) × 4H (z-direction).

Atmosphere 2017, 8, 43 3 of 18
Atmosphere 2017, 8, 43 3 of 19
Figure 1. Schematic diagram of the computational domain (H = 20 m; W = 20 m; D = 2 m; L = 100 m;
Ua: ambient wind velocity; Ta: ambient air temperature).
Symmetry boundary condition was imposed at two side planes, while all other solid facets were
set as no slip boundaries. A prescribed logarithmic profile [35] was adopted as the prevalent wind
condition at the upstream inlet.
*
0
0
( ) ln( )ABLz zu
U zz
(1)
* 2
ABLuk
C
(2)
* 3
0( )
ABLu
z z
(3)
* 1 010
0
10ln ( )ABL
zu U
z
(4)
where *
ABLu is the atmospheric boundary layer (ABL) friction velocity, z is the height above the
street, 0z is the aerodynamic roughness length, set as 0.03 m, is von Karman’s constant, set as
0.41, 10U is the reference horizontal velocity at 10 m high, set as 1 m/s [36].
Figure 2 illustrates the sunlight angle variation through four representative time events, where
the leeward wall receives direct solar radiation during the morning event (Figure 2a), the ground
receives direct solar radiation during the noon event (Figure 2b), the windward wall receives direct
solar radiation during the afternoon event (Figure 2c), and no solar radiation exists during the night
(Figure 2d).
Figure 1. Schematic diagram of the computational domain (H = 20 m; W = 20 m; D = 2 m; L = 100 m;Ua: ambient wind velocity; Ta: ambient air temperature).
Symmetry boundary condition was imposed at two side planes, while all other solid facets wereset as no slip boundaries. A prescribed logarithmic profile [35] was adopted as the prevalent windcondition at the upstream inlet.
U(z) =u∗ABL
κln(
z + z0
z0) (1)
k =u∗ABL
2√Cµ
(2)
ε =u∗ABL
3
κ(z + z0)(3)
u∗ABL = κU10 ln−1(10 + z0
z0) (4)
where u∗ABL is the atmospheric boundary layer (ABL) friction velocity, z is the height above the street,z0 is the aerodynamic roughness length, set as 0.03 m, κ is von Karman’s constant, set as 0.41, U10 isthe reference horizontal velocity at 10 m high, set as 1 m/s [36].
Figure 2 illustrates the sunlight angle variation through four representative time events, wherethe leeward wall receives direct solar radiation during the morning event (Figure 2a), the groundreceives direct solar radiation during the noon event (Figure 2b), the windward wall receives directsolar radiation during the afternoon event (Figure 2c), and no solar radiation exists during the night(Figure 2d).
Atmosphere 2017, 8, 43 4 of 18
Atmosphere 2017, 8, 43 4 of 19
Figure 2. Diurnal variation of sunlight angles for four typical time events: (a) Morning (1000 LST);
(b) Noon (1300 LST); (c) Afternoon (1600 LST); (d) Night (2000 LST).
The Typical Meteorology Year weather data file of Designer’s Simulation Toolkit (DeST)
software was used as the meteorological database [37,38]. Two sets of meteorological data selected
from clear days in summer (18 July) and winter (17 January) of Beijing (39.92° N, 116.46° E), China
were chosen and plotted in Figure 3.
Figure 3. Meteorological conditions: (a) solar radiation; and (b) air temperature, dew point and sky
effective temperature.
The ambient air temperature was imposed at the inlet and the outlet of the computational
domain, while the thermal stratification was set as neutral. Both indoor and underground surfaces
were specified as constant temperature conditions. The internal building temperature was set as 299
K [26] for summer and 293 K [39] for winter, respectively. The daily-averaged air temperature (296
K for summer, and 275 K for winter) was assumed to be the soil temperature at the depth of 2 m. In
reality, the soil temperature fluctuates annually and daily due to variations in air temperature and
Figure 2. Diurnal variation of sunlight angles for four typical time events: (a) Morning (1000 LST);(b) Noon (1300 LST); (c) Afternoon (1600 LST); (d) Night (2000 LST).
The Typical Meteorology Year weather data file of Designer’s Simulation Toolkit (DeST) softwarewas used as the meteorological database [37,38]. Two sets of meteorological data selected from cleardays in summer (18 July) and winter (17 January) of Beijing (39.92◦ N, 116.46◦ E), China were chosenand plotted in Figure 3.
Atmosphere 2017, 8, 43 4 of 19
Figure 2. Diurnal variation of sunlight angles for four typical time events: (a) Morning (1000 LST);
(b) Noon (1300 LST); (c) Afternoon (1600 LST); (d) Night (2000 LST).
The Typical Meteorology Year weather data file of Designer’s Simulation Toolkit (DeST)
software was used as the meteorological database [37,38]. Two sets of meteorological data selected
from clear days in summer (18 July) and winter (17 January) of Beijing (39.92° N, 116.46° E), China
were chosen and plotted in Figure 3.
Figure 3. Meteorological conditions: (a) solar radiation; and (b) air temperature, dew point and sky
effective temperature.
The ambient air temperature was imposed at the inlet and the outlet of the computational
domain, while the thermal stratification was set as neutral. Both indoor and underground surfaces
were specified as constant temperature conditions. The internal building temperature was set as 299
K [26] for summer and 293 K [39] for winter, respectively. The daily-averaged air temperature (296
K for summer, and 275 K for winter) was assumed to be the soil temperature at the depth of 2 m. In
reality, the soil temperature fluctuates annually and daily due to variations in air temperature and
Figure 3. Meteorological conditions: (a) solar radiation; and (b) air temperature, dew point and skyeffective temperature.
The ambient air temperature was imposed at the inlet and the outlet of the computational domain,while the thermal stratification was set as neutral. Both indoor and underground surfaces werespecified as constant temperature conditions. The internal building temperature was set as 299 K [26]

Atmosphere 2017, 8, 43 5 of 18
for summer and 293 K [39] for winter, respectively. The daily-averaged air temperature (296 K forsummer, and 275 K for winter) was assumed to be the soil temperature at the depth of 2 m. In reality,the soil temperature fluctuates annually and daily due to variations in air temperature and solarradiation, and it varies at different depths due to the soil texture, soil water content changes. In thisstudy, these influential factors were not considered.
The solar ray tracing algorithm and the discrete ordinates (DO) model were chosen to includethe diurnal solar radiation effect and radiation transfer between street canyon facets [30]. Thetransmissivity of the inlet, outlet and the top boundary was set as 1.0, and the effective sky temperaturewas used as external radiation condition [40]. The physical properties of all facets were referred fromIdczak’s study [41], and model details are listed in Table 1.
Table 1. Physical properties of street canyon materials.
Location α ε Cp (J·kg−1·K−1) ρ (kg·m−3)
street 0.2 0.95 880 2600walls 0.6 0.95 800 2000soil - - 1500 1440
α, ε, Cp and ρ represent absorption coefficient, emission coefficient, specific heat capacity and density of the solidmaterials, respectively.
Tracing particles representing vehicular emissions were released from a line source located alongthe center-line of the street for the street canyon ventilation assessment purpose [42,43]. Inert ashparticles with the diameter of 2 × 10⁻⁶ m and density of 1 kg/m3 were used to represent airbornePM2.5 pollutant. The total mass of the tracing particles was set as 1 × 10⁻² kg [32]. Discrete PhaseModel (DPM) was used to predict the particle dispersion characteristic, and all street canyon facetswere set as reflect boundary for the particles. The governing equation is given below [44]:
dup
dt= FD(u− up) +
gx(ρp − ρ)
ρp+ Fx (5)
where Fx is an additional acceleration (force/unit particle mass) term, FD(u− up) is the drag force perunit particle mass and
FD =18µ
ρpd2p
CDRe24
(6)
Here, u is the fluid phase velocity, up is the particle velocity, µ is the molecular viscosity of thefluid, ρ is the fluid density, ρp is the density of the particle, and ρp is the particle diameter. Re is therelative Reynolds number, which is defined as
Re ≡ρdp
∣∣up − u∣∣
µ(7)
The Discrete Random Walk (DRW) model used in ANSYS Fluent was used to simulate dispersedparticles due to turbulent dispersion.
A mesh independency study was conducted over six grid scales. To address the buoyancy forcein near wall regions, six different first layer grid thicknesses varied from 0.05 m to 0.4 m were chosen,while the inflation layer expansion ratio was kept as 1.1 in the whole domain. The mesh elementsnumber is 2,070,145 and 560,583 for the finest and coarsest grids, respectively. As listed in Table 2,the air flow velocity became stable once the mesh elements number exceeded 780,318. Taking thecomputational efficiency into consideration, the case having 1,026,221 mesh elements (the first layerthickness is 0.15 m, 0.75% of the street’s width) was chosen for numerical analysis in this study. Thescalable wall function was adopted to solve the near-wall convection in this model. y+ values of streetcanyon surfaces were around 100, which is within the desirable range of the scalable wall function.

Atmosphere 2017, 8, 43 6 of 18
Table 2. Mesh independence study.
Elements Number First LayerThickness (m)
Grid ExpansionRatio
Maximum ElementSize (m) U (m/s) *
560,583 0.4 1.1 0.6 0.104645,480 0.3 1.1 0.5 0.09780,318 0.3 1.1 0.4 0.083
1,026,221 0.15 1.1 0.3 0.0831,237,698 0.1 1.1 0.2 0.0832,070,145 0.05 1.1 0.2 0.083
* Velocity at the reference location (x = 50 m, y = 0 m, z = 5 m) at 1600 LST.
The CFD model of this study is based on fluid flow and transport principles for incompressibleturbulence flow in terms of mass, momentum and energy conservation equations. Reynolds numberin all cases of this study is around 1 × 10⁶. Since many previous [45,46] and recent studies [47–49]indicate that the RNG k-epsilon model has good performance on both street canyon flow pattern andpollutant dispersion predictions, equations for turbulent kinetic energy and turbulent dissipation ratewere solved with RNG k-eplison closure scheme. Boussinesq approximation was employed to addresstemperature induced density variation [45,47]. All governing equations were solved by the commercialCFD code ANSYS Fluent (ANSYS, Canonsburg, PA, USA) with finite volume method. The SIMPLEscheme was used for the pressure and velocity coupling. For all transport equations, the second-orderscheme was used to provide better numerical accuracy, and the residual criterion for convergence wasset as 1 × 10⁻⁴. The energy conservation solved in Fluent is based on the equation given below [50]:
∆∆t
(ρE) +∇·(→v (ρE + p)) = ∇·(
ke f f∇T −∑J
hj→J j +
(τe f ·
→v))
+ Sh (8)
where ke f f is the effective conductivity, and→J j is the diffusion flux of species j.
2.2. Model Validation
Despite many field measurements and wind tunnel experiments have been conducted, almostnone of them combined surface heating and air flow measurement together. In the current study, thenumerical model was validated against a field measurement [41] for surface heating comparison and awind tunnel experiment [51] for air flow velocity comparison, separately.
Figure 4 compares the numerical prediction of surface temperature with a field measurementconducted by Idczak et al. [41]. It should be noted that this field measurement records thermalenvironment data including solar radiation, surface and air temperature based on a street canyon withthe aspect ratio of 2.48, and the street direction was kept E–W, which is different from the benchmarkmodel used in this study. Thus, an extra street canyon model was built for numerical validationpurpose, which applied identical meteorology and geometry conditions with Idczak et al.’s [41]measurement. RNG k- epsilon turbulence model with scalable wall function was adopted to solvethe governing equations. 235,985 structured cells were built in the domain with the minimum size of0.018 m (0.75% of the street’s width) near the surfaces, and an expansion factor equals to 1.1 was used.The results showed y+ values of street canyon surfaces were around 100. The surface temperaturedistributions of northern and southern walls were compared. Despite minor over predictions can befound around noon for the southern wall, the simulated surface temperature well agreed with therecorded data. This minor discrepancy can be attributed to the underestimated wall thermal storage,and similar discrepancy can be founded in other relevant numerical studies [30,41].

Atmosphere 2017, 8, 43 7 of 18
Atmosphere 2017, 8, 43 7 of 19
Figure 4. Surface temperature comparison between numerical simulations with field measurements:
(a) Northern wall; (b) Southern wall [41].
Figure 5 compares the normalized horizontal velocity along the centerline of the street canyon
with wind tunnel data referred from Uehara et al.’s work [51]. In the wind tunnel experiment,
isolated cubic building blocks with the aspect ratio of 1 were used, and constant vertical temperature
difference was kept by heating the bottom surface. Numerical simulations using the current street
canyon model (shown in Figure 1) were compared with the wind tunnel data under the same bulk
Richardson number (Rb = −0.21); the Rb calculation method is shown as below:
2
2
( )
( 273)
in g
a H
gH T TRb
T U
(9)
where, H is the building height, aT is the average air temperature inside the street canyon, and
2HU is the horizontal velocity at Z = 2H, inT is the inlet air temperature (equals to the ambient air
temperature), and gT is the ground temperature.
Figure 5. Comparison of normalized horizontal velocity along the centerline of the street canyon
between numerical simulation and wind tunnel data (Uehara et al., 2000).
The data comparison showed a good agreement. However, the current numerical model was
slightly under predicted the near ground wind. This under prediction could be attributed to the
geometric difference: the street canyon model used in the wind tunnel experiment has a shorter
street length than that of the current numerical model, which allows additional airflow enters the
street canyon from building sidewalls.
Figure 4. Surface temperature comparison between numerical simulations with field measurements:(a) Northern wall; (b) Southern wall [41].
Figure 5 compares the normalized horizontal velocity along the centerline of the street canyonwith wind tunnel data referred from Uehara et al.’s work [51]. In the wind tunnel experiment, isolatedcubic building blocks with the aspect ratio of 1 were used, and constant vertical temperature differencewas kept by heating the bottom surface. Numerical simulations using the current street canyon model(shown in Figure 1) were compared with the wind tunnel data under the same bulk Richardson number(Rb = −0.21); the Rb calculation method is shown as below:
Rb =gH(Tin − Tg)
(Ta + 273) ·U22H
(9)
where, H is the building height, Ta is the average air temperature inside the street canyon, and U2H isthe horizontal velocity at Z = 2H, Tin is the inlet air temperature (equals to the ambient air temperature),and Tg is the ground temperature.
Atmosphere 2017, 8, 43 7 of 19
Figure 4. Surface temperature comparison between numerical simulations with field measurements:
(a) Northern wall; (b) Southern wall [41].
Figure 5 compares the normalized horizontal velocity along the centerline of the street canyon
with wind tunnel data referred from Uehara et al.’s work [51]. In the wind tunnel experiment,
isolated cubic building blocks with the aspect ratio of 1 were used, and constant vertical temperature
difference was kept by heating the bottom surface. Numerical simulations using the current street
canyon model (shown in Figure 1) were compared with the wind tunnel data under the same bulk
Richardson number (Rb = −0.21); the Rb calculation method is shown as below:
2
2
( )
( 273)
in g
a H
gH T TRb
T U
(9)
where, H is the building height, aT is the average air temperature inside the street canyon, and
2HU is the horizontal velocity at Z = 2H, inT is the inlet air temperature (equals to the ambient air
temperature), and gT is the ground temperature.
Figure 5. Comparison of normalized horizontal velocity along the centerline of the street canyon
between numerical simulation and wind tunnel data (Uehara et al., 2000).
The data comparison showed a good agreement. However, the current numerical model was
slightly under predicted the near ground wind. This under prediction could be attributed to the
geometric difference: the street canyon model used in the wind tunnel experiment has a shorter
street length than that of the current numerical model, which allows additional airflow enters the
street canyon from building sidewalls.
Figure 5. Comparison of normalized horizontal velocity along the centerline of the street canyonbetween numerical simulation and wind tunnel data (Uehara et al., 2000).
The data comparison showed a good agreement. However, the current numerical model wasslightly under predicted the near ground wind. This under prediction could be attributed to thegeometric difference: the street canyon model used in the wind tunnel experiment has a shorter streetlength than that of the current numerical model, which allows additional airflow enters the streetcanyon from building sidewalls.
Atmosphere 2017, 8, 43 8 of 18
Based on the good agreements demonstrated through above two case studies, the predictionaccuracy of the current numerical model is validated, which confirms the proposed numerical modellingapproach is capable to provide wind and thermal environment prediction analysis for street canyons.
3. Results and Discussion
In this section, four typical time events, morning (1000 LST), noon (1300 LST), afternoon (1600 LST)and night (2000 LST) were used for results analysis. The diurnal variation of surface temperature,air flow patterns and pollutant dispersion were analyzed and compared between summer andwinter seasons.
3.1. Surface Temperature
Figure 6 illustrates diurnal surface temperatures of leeward wall, ground and windward wallunder summer and winter conditions. For the ground temperature, the same diurnal variation trendwas observed both in winter and summer cases, which peaks at 1300 LST for both cases. In contrast,considerable seasonal differences were found for the windward and leeward walls. For the summercondition, the maximum temperature of leeward and windward wall occurred at 1000 LST (319 K) and1600 LST (313.2 K). For the winter condition, almost identical diurnal varying trend was found betweenthe windward and leeward walls, which peaks at 1300 LST with the value of 288.5 K. This is mainlybecause the different anthropogenic heating condition inside buildings. During the summer season,indoor temperature keeps lower than ambient air temperature during daytime due to the coolingeffect of air conditioning systems. The solar radiation effect dominates building surface temperaturevariation. However, for the winter season, combining heating effects from the solar radiation andindoor heating systems contributes to the building facets temperature changing. Compared withthe anthropologic heating, the heat energy sourced from the solar radiation is minor. Therefore,almost identical temperature distributions were observed between windward and leeward walls.Consequently, the leeward wall and windward wall temperature fluctuates more wildly in summerwith a maximum daily temperature difference of 24 K and 18.2 K, respectively. For the winter condition,the maximum daily temperature difference remains 11 K for both leeward and windward walls, whichaccounts half of that in summer. Additionally, the ground temperature exceeds other building walls at1300 LST in summer, but remains the lowest for the whole day in winter.
Atmosphere 2017, 8, 43 8 of 19
Based on the good agreements demonstrated through above two case studies, the prediction
accuracy of the current numerical model is validated, which confirms the proposed numerical
modelling approach is capable to provide wind and thermal environment prediction analysis for
street canyons.
3. Results and Discussion
In this section, four typical time events, morning (1000 LST), noon (1300 LST), afternoon
(1600 LST) and night (2000 LST) were used for results analysis. The diurnal variation of surface
temperature, air flow patterns and pollutant dispersion were analyzed and compared between
summer and winter seasons.
3.1. Surface Temperature
Figure 6 illustrates diurnal surface temperatures of leeward wall, ground and windward wall
under summer and winter conditions. For the ground temperature, the same diurnal variation trend
was observed both in winter and summer cases, which peaks at 1300 LST for both cases. In contrast,
considerable seasonal differences were found for the windward and leeward walls. For the summer
condition, the maximum temperature of leeward and windward wall occurred at 1000 LST (319 K)
and 1600 LST (313.2 K). For the winter condition, almost identical diurnal varying trend was found
between the windward and leeward walls, which peaks at 1300 LST with the value of 288.5 K. This is
mainly because the different anthropogenic heating condition inside buildings. During the summer
season, indoor temperature keeps lower than ambient air temperature during daytime due to the
cooling effect of air conditioning systems. The solar radiation effect dominates building surface
temperature variation. However, for the winter season, combining heating effects from the solar
radiation and indoor heating systems contributes to the building facets temperature changing.
Compared with the anthropologic heating, the heat energy sourced from the solar radiation is
minor. Therefore, almost identical temperature distributions were observed between windward and
leeward walls. Consequently, the leeward wall and windward wall temperature fluctuates more
wildly in summer with a maximum daily temperature difference of 24 K and 18.2 K, respectively.
For the winter condition, the maximum daily temperature difference remains 11 K for both leeward
and windward walls, which accounts half of that in summer. Additionally, the ground temperature
exceeds other building walls at 1300 LST in summer, but remains the lowest for the whole day in winter.
Figure 6. Diurnal variation of canyon facets temperatures between summer and winter conditions.
Figure 7 compares absolute temperature differences among all facets, namely leeward wall and
ground (Figure 7a), leeward wall and windward wall (Figure 7b), the most heated facet and ambient
air (Figure 7c) under summer and winter. In general, greater temperature difference occurred in
Figure 6. Diurnal variation of canyon facets temperatures between summer and winter conditions.
Figure 7 compares absolute temperature differences among all facets, namely leeward wall andground (Figure 7a), leeward wall and windward wall (Figure 7b), the most heated facet and ambient air(Figure 7c) under summer and winter. In general, greater temperature difference occurred in summer
Atmosphere 2017, 8, 43 9 of 18
during most of the day than that of winter. For the morning case (1000 LST), all three temperaturedifferences under summer condition were found greater than those in winter. As the only one sunlightsurface during the morning, the leeward wall was found to be the most heated surface for both seasons.The largest temperature difference between the leeward wall and ambient was 19.3 K in summer and11.6 K in winter (Figure 7c). Despite notable surface temperature was established on the leeward wall forboth seasons in the morning, the surface heating patterns were very different among all canyon facets.For the noon case (1300 LST), the temperature differences among all facets (namely leeward wall andground, leeward wall and windward wall) were fairly small (<1 K) in winter, which indicates all threestreet canyon facets were evenly heated. For the noon case in summer, similar surface temperatureswere established between the leeward wall and the windward wall. Only the ground received directsolar radiation, and its surface temperature exceeded the rest two side walls about 11.5 K.
Atmosphere 2017, 8, 43 9 of 19
summer during most of the day than that of winter. For the morning case (1000 LST), all three
temperature differences under summer condition were found greater than those in winter. As the
only one sunlight surface during the morning, the leeward wall was found to be the most heated
surface for both seasons. The largest temperature difference between the leeward wall and ambient
was 19.3 K in summer and 11.6 K in winter (Figure 7c). Despite notable surface temperature was
established on the leeward wall for both seasons in the morning, the surface heating patterns were
very different among all canyon facets. For the noon case (1300 LST), the temperature differences
among all facets (namely leeward wall and ground, leeward wall and windward wall) were fairly
small (<1 K) in winter, which indicates all three street canyon facets were evenly heated. For the
noon case in summer, similar surface temperatures were established between the leeward wall and
the windward wall. Only the ground received direct solar radiation, and its surface temperature
exceeded the rest two side walls about 11.5 K.
Figure 7. Temperature comparison for all time events: (a) leeward wall and ground; (b) leeward
wall and windward wall; (c) the most heated wall and the ambient air. Tlee represents leeward wall
temperature; Tg represents ground temperature; Twind represents windward wall temperature; Tmax
represents maximum temperature among all canyon facets; Tair: ambient air temperature.
Figure 7. Temperature comparison for all time events: (a) leeward wall and ground; (b) leewardwall and windward wall; (c) the most heated wall and the ambient air. Tlee represents leeward walltemperature; Tg represents ground temperature; Twind represents windward wall temperature; Tmax
represents maximum temperature among all canyon facets; Tair: ambient air temperature.

Atmosphere 2017, 8, 43 10 of 18
For the afternoon event (1600 LST), the most heated facet was the windward wall as the solarradiation directly acted on the windward wall. The temperature difference between the leewardwall and ground was only 1.4 K in summer, but nearly 8 K in winter. The temperature differencebetween the two side walls was 9.3 K in summer and 0.1 K in winter. This can be attributed to thesignificant indoor heating effect during the winter season. Due to the combined effect of solar radiationand anthropologic heating, the temperature difference between the windward wall and ambientapproached to 15.1 K in summer and 6.3 K in winter, respectively.
For the night event (2000 LST) in summer, temperature differences among all facets wassignificantly dropped (less than 2.5 K). However, for the winter condition, a 9.9 K temperaturedifference between the leeward wall and ground was established. Both leeward and windward wallsshowed similar temperature, which exceeds the ambient temperature about 4.9 K.
Therefore, significant seasonal and diurnal variations were found for the canyon facets heating.Especially for the winter condition, more evenly distributed facets temperature with weak diurnalfluctuation is expected due to the combined effect of solar radiation and anthropologic heating.
3.2. Air Flow Pattern
In this section, the along-canyon averaged streamline fields [52] were calculated. Figure 8 detailsthe wind-buoyancy-driven flow behavior within the street canyon under different seasonal conditions.Streamlines emanating from the core of the vortex is observed in Figure 8b,f, which can be attributed tothe presence of axial flow. Since the streamlines were averaged along street canyon from x/L = 0.25 tox/L = 0.75, slight axial flow caused by the canyon end effect might be captured in the calculated results.For the morning event (1000 LST) as shown in Figure 8a,b, a clockwise rotating vortex centering closeto the windward wall was observed under both seasons. However, a small secondary vortex wasestablished at the bottom corner of the windward wall under winter condition (Figure 8b). Sincethe winter case does not show significant temperature variation between the windward wall and theleeward wall (Figure 7), and both of them hold higher temperature value than that of either groundor ambient air, a secondary vortex imposing an opposite force on the main wind-driven flow wasobserved due to the buoyancy effect close to the windward wall.
Similar flow patterns with two counter-rotating vortices were found for the noon event (1300 LST)for both seasons (Figure 8c,d). For the summer case, the main airflow vortex was compressed towardsits vortex core, and the secondary vortex size is slightly larger than that under the winter condition.In contrast, the air flow was intensified along near wall regions in the winter case, and the size andintensity of the secondary vortex were greatly reduced. This is mainly attributed to different surfaceheating between summer and winter. In general, the ground was the most heated surface (Figure 7),and no significant temperature difference can be found between the leeward and windward walls.In summer, the ground temperature exceeded approximately 12 K compared with the other twoside walls, and 17 K compared with the ambient temperature. This temperature difference inducedstrong buoyancy, which pushes the main vortex 0.05H upwards and compresses the wind-driven flow(Figure 8c). In contrast, all canyon facets were evenly heated in winter, but higher than the ambientabout 14 K. Thus, the airflow in the near wall region was intensified due to the buoyancy effect.
For the afternoon case (1600 LST), completely different airflow patterns were found. For thesummer condition, the direct solar radiation on the windward wall during afternoon induced a15 K temperature increase when compared with the ambient. This heated windward wall generatedsignificant upward buoyancy against the main wind-driven airflow, which breaks the previous singlemain vortex structure into multiple disturbed patterns. Thus, a complex air flow structure withmulti-vortex was observed in summer (Figure 8e). While for winter, a single vortex with intensifiedairflow along canyon facets was established (Figure 8f). Based on the surface heating showed in Figure 7,the two side walls hold almost identical surface temperatures in winter, but only exceeded around 6 Kwhen compared with the ambient. Thus, the circumferential velocity of the main vortex was reduced.Comparable flow patterns are also reported by Xie et al. [53] under similar stratification condition.

Atmosphere 2017, 8, 43 11 of 18
Atmosphere 2017, 8, 43 11 of 19
Figure 8. Along-canyon averaged streamlines for all time events: (a,b) represents 1000 LST; (c,d)
represents 1300 LST; (e,f) represents 1600 LST; (g,h) represents 2000 LST. The averaging calculation
was taken from x/L = 0.25 to x/L = 0.75.
For the night event (2000 LST), a clockwise rotating vortex with slight disturbance of the
ambient wind was observed under both seasons. Similar with the morning event, the primary vortex
occupies the whole street canyon in summer, and a small secondary vortex was observed at the
windward corner in winter. As disclosed by Figure 7, for the summer condition, the temperature
Figure 8. Along-canyon averaged streamlines for all time events: (a,b) represents 1000 LST;(c,d) represents 1300 LST; (e,f) represents 1600 LST; (g,h) represents 2000 LST. The averaging calculationwas taken from x/L = 0.25 to x/L = 0.75.
For the night event (2000 LST), a clockwise rotating vortex with slight disturbance of the ambientwind was observed under both seasons. Similar with the morning event, the primary vortex occupiesthe whole street canyon in summer, and a small secondary vortex was observed at the windward cornerin winter. As disclosed by Figure 7, for the summer condition, the temperature differences betweencanyon facets and ambient air were small during the night. Thus, the ambient wind dominated thevortex formation in summer. For the winter condition, the primary vortex center was moved upwards
Atmosphere 2017, 8, 43 12 of 18
towards the windward wall, and a secondary vortex was established at the windward wall bottomcorner. This is mainly due to the considerable temperature differences between the side walls and theground (10 K), the side walls and the ambient air (5 K).
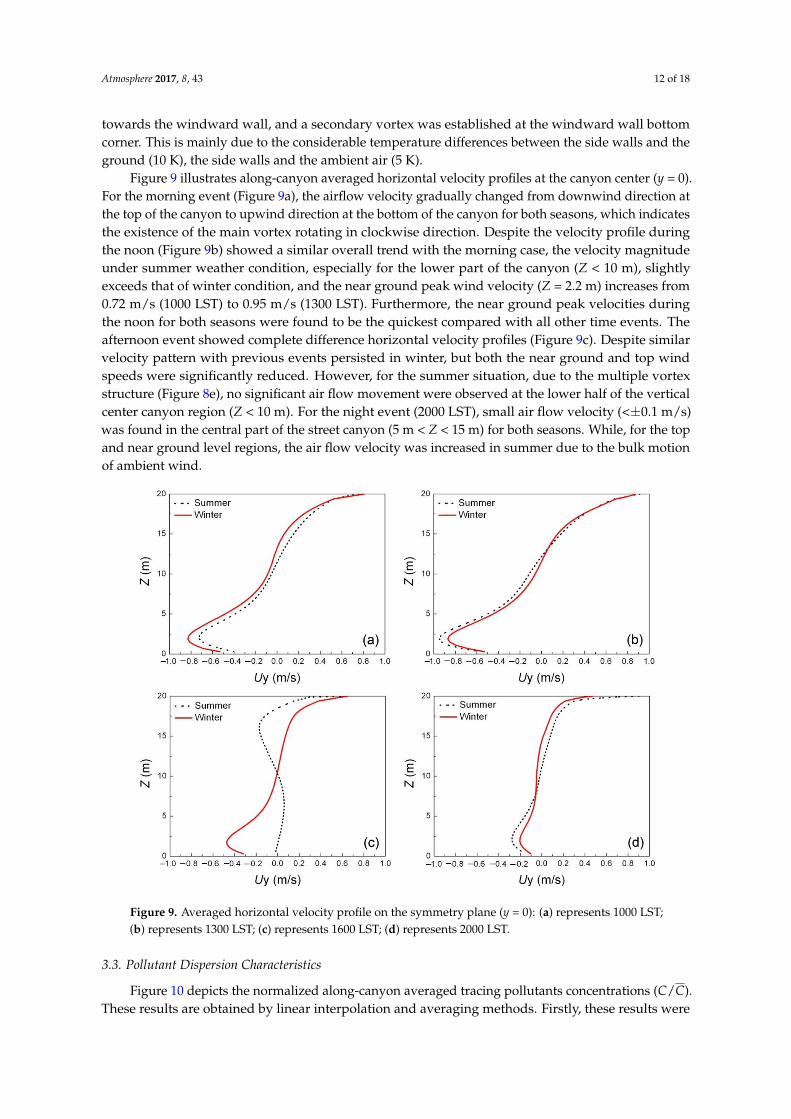
Figure 9 illustrates along-canyon averaged horizontal velocity profiles at the canyon center (y = 0).For the morning event (Figure 9a), the airflow velocity gradually changed from downwind direction atthe top of the canyon to upwind direction at the bottom of the canyon for both seasons, which indicatesthe existence of the main vortex rotating in clockwise direction. Despite the velocity profile duringthe noon (Figure 9b) showed a similar overall trend with the morning case, the velocity magnitudeunder summer weather condition, especially for the lower part of the canyon (Z < 10 m), slightlyexceeds that of winter condition, and the near ground peak wind velocity (Z = 2.2 m) increases from0.72 m/s (1000 LST) to 0.95 m/s (1300 LST). Furthermore, the near ground peak velocities duringthe noon for both seasons were found to be the quickest compared with all other time events. Theafternoon event showed complete difference horizontal velocity profiles (Figure 9c). Despite similarvelocity pattern with previous events persisted in winter, but both the near ground and top windspeeds were significantly reduced. However, for the summer situation, due to the multiple vortexstructure (Figure 8e), no significant air flow movement were observed at the lower half of the verticalcenter canyon region (Z < 10 m). For the night event (2000 LST), small air flow velocity (<±0.1 m/s)was found in the central part of the street canyon (5 m < Z < 15 m) for both seasons. While, for the topand near ground level regions, the air flow velocity was increased in summer due to the bulk motionof ambient wind.
Atmosphere 2017, 8, 43 12 of 19
differences between canyon facets and ambient air were small during the night. Thus, the ambient
wind dominated the vortex formation in summer. For the winter condition, the primary vortex
center was moved upwards towards the windward wall, and a secondary vortex was established at
the windward wall bottom corner. This is mainly due to the considerable temperature differences
between the side walls and the ground (10 K), the side walls and the ambient air (5 K).
Figure 9 illustrates along-canyon averaged horizontal velocity profiles at the canyon center
(y = 0). For the morning event (Figure 9a), the airflow velocity gradually changed from downwind
direction at the top of the canyon to upwind direction at the bottom of the canyon for both seasons,
which indicates the existence of the main vortex rotating in clockwise direction. Despite the velocity
profile during the noon (Figure 9b) showed a similar overall trend with the morning case, the
velocity magnitude under summer weather condition, especially for the lower part of the canyon (Z
< 10 m), slightly exceeds that of winter condition, and the near ground peak wind velocity (Z = 2.2 m)
increases from 0.72 m/s (1000 LST) to 0.95 m/s (1300 LST). Furthermore, the near ground peak
velocities during the noon for both seasons were found to be the quickest compared with all other
time events. The afternoon event showed complete difference horizontal velocity profiles (Figure
9c). Despite similar velocity pattern with previous events persisted in winter, but both the near
ground and top wind speeds were significantly reduced. However, for the summer situation, due to
the multiple vortex structure (Figure 8e), no significant air flow movement were observed at the
lower half of the vertical center canyon region (Z < 10 m). For the night event (2000 LST), small air
flow velocity (<±0.1 m/s) was found in the central part of the street canyon (5 m < Z < 15 m) for both
seasons. While, for the top and near ground level regions, the air flow velocity was increased in
summer due to the bulk motion of ambient wind.
Figure 9. Averaged horizontal velocity profile on the symmetry plane (y = 0): (a) represents 1000
LST; (b) represents 1300 LST; (c) represents 1600 LST; (d) represents 2000 LST.
3.3. Pollutant Dispersion Characteristics
Figure 10 depicts the normalized along-canyon averaged tracing pollutants concentrations
(𝐶 �̅�⁄ ). These results are obtained by linear interpolation and averaging methods. Firstly, these
results were extracted from x/L = 0.25 to x/L = 0.75, with an interval of x/L = 0.05; Then, all field data
Figure 9. Averaged horizontal velocity profile on the symmetry plane (y = 0): (a) represents 1000 LST;(b) represents 1300 LST; (c) represents 1600 LST; (d) represents 2000 LST.
3.3. Pollutant Dispersion Characteristics
Figure 10 depicts the normalized along-canyon averaged tracing pollutants concentrations (C/C).These results are obtained by linear interpolation and averaging methods. Firstly, these results were
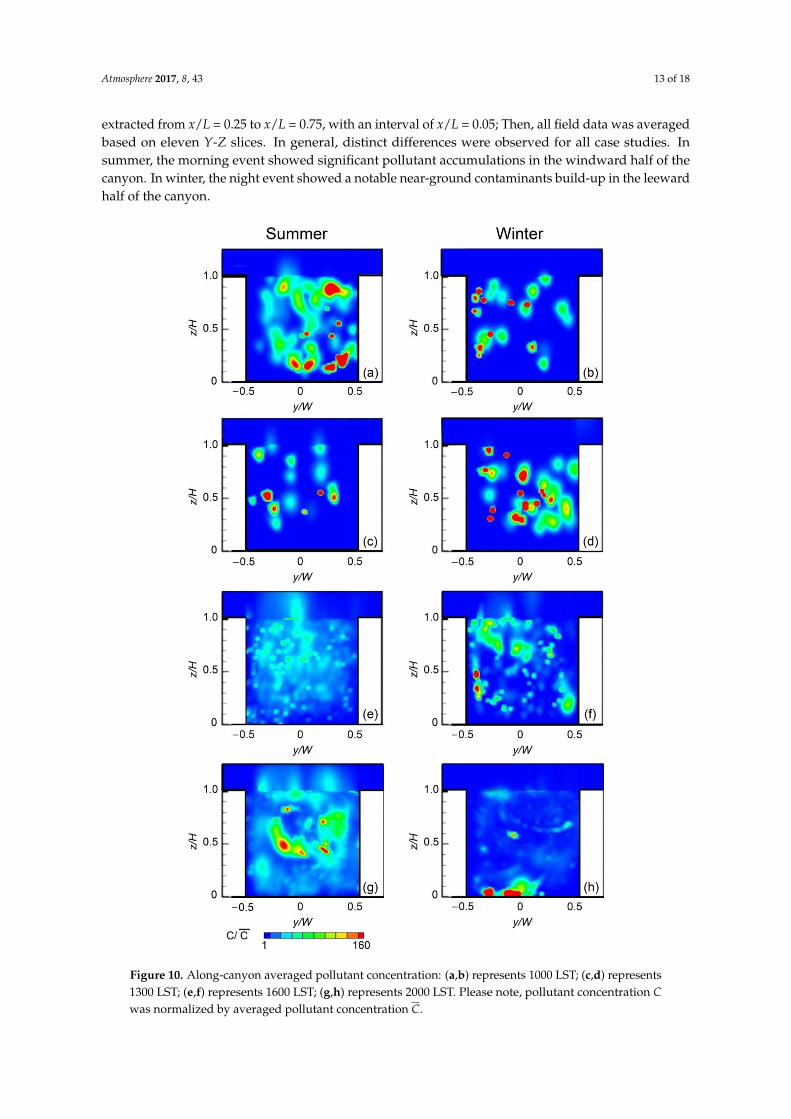
Atmosphere 2017, 8, 43 13 of 18
extracted from x/L = 0.25 to x/L = 0.75, with an interval of x/L = 0.05; Then, all field data was averagedbased on eleven Y-Z slices. In general, distinct differences were observed for all case studies. Insummer, the morning event showed significant pollutant accumulations in the windward half of thecanyon. In winter, the night event showed a notable near-ground contaminants build-up in the leewardhalf of the canyon.
Atmosphere 2017, 8, 43 14 of 19
Figure 10. Along-canyon averaged pollutant concentration: (a,b) represents 1000 LST; (c,d)
represents 1300 LST; (e,f) represents 1600 LST; (g,h) represents 2000 LST. Please note, pollutant
concentration C was normalized by averaged pollutant concentration C .
Figure 10. Along-canyon averaged pollutant concentration: (a,b) represents 1000 LST; (c,d) represents1300 LST; (e,f) represents 1600 LST; (g,h) represents 2000 LST. Please note, pollutant concentration Cwas normalized by averaged pollutant concentration C.
Atmosphere 2017, 8, 43 14 of 18
For the morning event (Figure 10a), a lower pollutant concentration was observed in the leewardhalf of the canyon in summer. In contrast, the winter case showed a reversed pattern with relativelymore pollutant accumulating within the leeward half of the canyon (Figure 10b). For the noon event(Figure 10c,d), both cases showed a good air quality in the near-ground-zone (z ≤ 0.3H) due to thestrong lifting force imposed by the buoyancy. For the afternoon event, the summer case showed anevenly distributed pollutants concentration pattern in most of the canyon space (Figure 10e), whilethe winter case showed two elevated accumulation spots along the middle region of the leeward wall(Figure 10f). For the night event, despite the fact that notable pollutant accumulation can be foundin summer (Figure 10g), the majority of the pollutants were centered in the upper half of the canyonspace. Although majority of the pollutants have been removed out of the canyon, the night event forthe winter case was the worst time slot with serious pollutant build-up along the pedestrian’s heightlevel (Figure 10h).
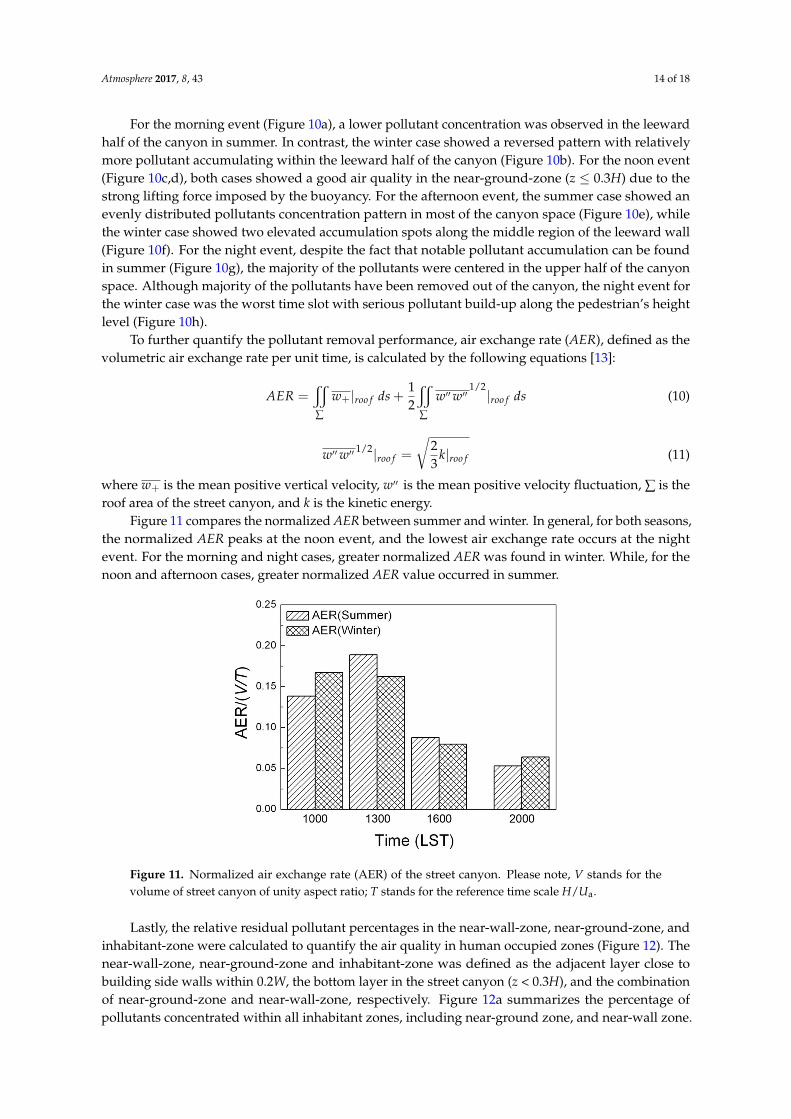
To further quantify the pollutant removal performance, air exchange rate (AER), defined as thevolumetric air exchange rate per unit time, is calculated by the following equations [13]:
AER =x
∑
w+|roo f ds +12
x
∑
w′′w′′1/2|roo f ds (10)
w′′w′′ 1/2|roo f =
√23
k|roo f (11)
where w+ is the mean positive vertical velocity, w′′ is the mean positive velocity fluctuation, ∑ is theroof area of the street canyon, and k is the kinetic energy.
Figure 11 compares the normalized AER between summer and winter. In general, for both seasons,the normalized AER peaks at the noon event, and the lowest air exchange rate occurs at the nightevent. For the morning and night cases, greater normalized AER was found in winter. While, for thenoon and afternoon cases, greater normalized AER value occurred in summer.
Atmosphere 2017, 8, 43 15 of 19
Figure 11. Normalized air exchange rate (AER) of the street canyon. Please note, V stands for the
volume of street canyon of unity aspect ratio; T stands for the reference time scale H/Ua.
Lastly, the relative residual pollutant percentages in the near-wall-zone, near-ground-zone, and
inhabitant-zone were calculated to quantify the air quality in human occupied zones (Figure 12). The
near-wall-zone, near-ground-zone and inhabitant-zone was defined as the adjacent layer close to
building side walls within 0.2W, the bottom layer in the street canyon (z < 0.3H), and the
combination of near-ground-zone and near-wall-zone, respectively. Figure 12a summarizes the
percentage of pollutants concentrated within all inhabitant zones, including near-ground zone, and
near-wall zone. The results showed a great increase for the morning event in summer with almost
90% of residual pollutant concentrating in these regions. In contrast, the winter condition showed a
worst air quality with 75% of residual pollutant persisting in all inhabitant zones during the night
event. These peaks indicate the natural ventilation during summer morning and the winter night are
poor, and they are worst time slots for residents.
Through comparing the localized pollutant concentration (Figure 12b,c) with the combined
results (Figure 12a), it is found majority of the residual pollutant in winter night (65%) were
accumulated in the near-ground-zone due to weak ground ventilation. However, no apparent
pollutant concentration differences were observed in near-wall-zones for the summer condition.
Figure 11. Normalized air exchange rate (AER) of the street canyon. Please note, V stands for thevolume of street canyon of unity aspect ratio; T stands for the reference time scale H/Ua.
Lastly, the relative residual pollutant percentages in the near-wall-zone, near-ground-zone, andinhabitant-zone were calculated to quantify the air quality in human occupied zones (Figure 12). Thenear-wall-zone, near-ground-zone and inhabitant-zone was defined as the adjacent layer close tobuilding side walls within 0.2W, the bottom layer in the street canyon (z < 0.3H), and the combinationof near-ground-zone and near-wall-zone, respectively. Figure 12a summarizes the percentage ofpollutants concentrated within all inhabitant zones, including near-ground zone, and near-wall zone.

Atmosphere 2017, 8, 43 15 of 18
The results showed a great increase for the morning event in summer with almost 90% of residualpollutant concentrating in these regions. In contrast, the winter condition showed a worst air qualitywith 75% of residual pollutant persisting in all inhabitant zones during the night event. These peaksindicate the natural ventilation during summer morning and the winter night are poor, and they areworst time slots for residents.Atmosphere 2017, 8, 43 16 of 19
Figure 12. Residual pollutant percentage within inhabitant zones: (a) represents the combined
results, (b) and (c) represent the localized concentration. (Qwall: residual pollutant mass in the
near-wall-zone; Qground: residual pollutant mass in the near-ground-zone; Qi: residual pollutant mass
in the inhabitant-zone, Qr: total residual pollutant mass).
4. Conclusions
In this study, the impact of seasonal changes, including solar radiation and anthropogenic
heating effects, on urban canyon ventilation as well as pollutant dispersion characteristics was
investigated. The numerical model was first validated against experimental data [41,51], then the
Figure 12. Residual pollutant percentage within inhabitant zones: (a) represents the combinedresults, (b) and (c) represent the localized concentration. (Qwall: residual pollutant mass in thenear-wall-zone; Qground: residual pollutant mass in the near-ground-zone; Qi: residual pollutantmass in the inhabitant-zone, Qr: total residual pollutant mass).
Atmosphere 2017, 8, 43 16 of 18
Through comparing the localized pollutant concentration (Figure 12b,c) with the combined results(Figure 12a), it is found majority of the residual pollutant in winter night (65%) were accumulated inthe near-ground-zone due to weak ground ventilation. However, no apparent pollutant concentrationdifferences were observed in near-wall-zones for the summer condition.
4. Conclusions
In this study, the impact of seasonal changes, including solar radiation and anthropogenic heatingeffects, on urban canyon ventilation as well as pollutant dispersion characteristics was investigated.The numerical model was first validated against experimental data [41,51], then the seasonal changingeffects were investigated in detail. Our results showed a more evenly distributed surface temperaturewith relatively weak diurnal fluctuation was found in winter. The summer afternoon case showeda very different flow pattern with multi-vortex flow structure due to strong buoyance disturbancegenerated by heated adjacent building walls. The near-ground velocity during the summer afternoonwas significantly reduced (almost zero), which may even slower than the night event. Consequently,poor pollutant removal performance was observed for the summer afternoon with a scattered pollutantconcentration. Lastly, the regional residual pollutant percentage analysis showed the summer morningand the winter night are two worst time slots with 87% and 77% of the residual pollutant being trappedin the inhabitant-zone, respectively.
Due to the steady state assumption, heat storage effects of building walls and ground soil werenot considered in the present study, which may contribute over-predictions of surface temperature.Besides, real street canyon geometries are much more complicated. Despite some limitations ofthis study, such as the unit aspect ratio and constant ambient wind assumptions, research findingspresented by the current paper can contribute to fully understandings of street canyon environmentunder different seasonal conditions. The proposed research method offers an effective solution forurban ventilation and wind path designs.
Acknowledgments: The financial supports of the Fundamental Research Funds for the Central Universities(Project ID: 106112016CDJCR211221), National Natural Science Foundation of China (Grant No.21277080 andNo.51678088), Open-end Research Funds of Chongqing Meteorological Administration (Project ID: Kfjj-201202)are gratefully acknowledged.
Author Contributions: J.D., Z.T., Y.X. and J.T. conceived and designed the experiments; J.D. and Z.T. performedthe experiments; J.D. and Z.T. analyzed the data; J.D. and Z.T. wrote the paper.
Conflicts of Interest: The authors declare no conflict of interest.
References
1. Krayenhoff, E.S.; Voogt, J.A. A microscale three-dimensional urban energy balance model for studyingsurface temperatures. Bound.-Layer Meteorol. 2007, 123, 433–461. [CrossRef]
2. Solazzo, E.; Britter, R. Transfer processes in a simulated urban street canyon. Bound.-Layer Meteorol. 2007,124, 43–60. [CrossRef]
3. Lee, S.-H.; Park, S.-U. A vegetated urban canopy model for meteorological and environmental modelling.Bound.-Layer Meteorol. 2008, 126, 73–102. [CrossRef]
4. Vardoulakis, S.; Fisherb, B.E.A.; Pericleousa, K.; Gonzalez-Flescac, N. Modelling air quality in street canyons:A review. Atmos. Environ. 2003, 37, 155–182. [CrossRef]
5. Georgakis, C.; Santamouris, M. On the air flow in urban canyons for ventilation purposes. Int. J. Vent. 2004,3, 53–65. [CrossRef]
6. Hang, J.; Li, Y. Wind conditions in idealized building clusters: Macroscopic simulations using a porousturbulence model. Bound.-Layer Meteorol. 2010, 136, 129–159. [CrossRef]
7. Hang, J.; Li, Y.; Sandberg, M. Experimental and numerical studies of flows through and within high-risebuilding arrays and their link to ventilation strategy. J. Wind Eng. Ind. Aerodyn. 2011, 99, 1036–1055.[CrossRef]

Atmosphere 2017, 8, 43 17 of 18
8. Hang, J.; Li, Y.; Sandberg, M.; Buccolieri, R.; di Sabatino, S. The influence of building height variability onpollutant dispersion and pedestrian ventilation in idealized high-rise urban areas. Build. Environ. 2012, 56,346–360. [CrossRef]
9. Santamouris, M.; Georgakis, C.; Niachou, A. On the estimation of wind speed in urban canyons for ventilationpurposes—Part 2: Using of data driven techniques to calculate the more probable wind speed in urbancanyons for low ambient wind speeds. Build. Environ. 2008, 43, 1411–1418. [CrossRef]
10. Soulhac, L.; Perkins, R.J.; Salizzoni, P. Flow in a street canyon for any external wind direction.Bound.-Layer Meteorol. 2008, 126, 365–388. [CrossRef]
11. Ryu, Y.-H.; Baik, J.-J.; Lee, S.-H. A new single-layer urban canopy model for use in mesoscale atmosphericmodels. J. Appl. Meteorol. Climatol. 2011, 50, 1773–1794. [CrossRef]
12. Gromke, C.; Ruck, B. Pollutant concentrations in street canyons of different aspect ratio with avenues oftrees for various wind directions. Bound.-Layer Meteorol. 2012, 144, 41–64. [CrossRef]
13. Xie, X.; Liu, C.H.; Leung, D.Y.C.; Leung, M.K.H. Characteristics of air exchange in a street canyon withground heating. Atmos. Environ. 2006, 40, 6396–6409. [CrossRef]
14. Xie, X.; Liu, C.H.; Leung, D.Y.C. Impact of building facades and ground heating on wind flow and pollutanttransport in street canyons. Atmos. Environ. 2007, 41, 9030–9049. [CrossRef]
15. Allegrini, J.; Dorer, V.; Carmeliet, J. Buoyant flows in street canyons: Validation of CFD simulations withwind tunnel measurements. Build. Environ. 2014, 72, 63–74. [CrossRef]
16. Yang, L.; Li, Y. City ventilation of Hong Kong at no-wind conditions. Atmos. Environ. 2009, 43, 3111–3121.[CrossRef]
17. Kantzioura, A.; Kosmopoulos, P.; Zoras, S. Urban surface temperature and microclimate measurements inThessaloniki. Energy Build. 2012, 44, 63–72. [CrossRef]
18. Ahmed, A.Q.; Ossen, D.R.; Jamei, E.; Ahmad, M.H. Urban surface temperature behaviour and heat islandeffect in a tropical planned city. Theoret. Appl. Climatol. 2014, 119, 493–514. [CrossRef]
19. Huang, H.; Ooka, R.; Kato, S. Urban thermal environment measurements and numerical simulation for anactual complex urban area covering a large district heating and cooling system in summer. Atmos. Environ.2005, 39, 6362–6375. [CrossRef]
20. Offerle, B.; Eliasson, I.; Grimmond, C.S.B.; Holmer, B. Surface heating in relation to air temperature, windand turbulence in an urban street canyon. Bound.-Layer Meteorol. 2007, 122, 273–292. [CrossRef]
21. Li, X.-X.; Britter, R.E.; Koh, T.-Y.; Norford, L.K.; Liu, C.H.; Entekhabi, D.; Leung, D.Y.C. Large-eddy simulationof flow and pollutant transport in urban street canyons with ground heating. Bound.-Layer Meteorol. 2010,137, 187–204. [CrossRef]
22. Li, X.-X.; Britter, R.E.; Norford, L.K.; Koh, T.-Y.; Entekhabi, D. Flow and pollutant transport in urban streetcanyons of different aspect ratios with ground heating: Large-eddy simulation. Bound.-Layer Meteorol. 2012,142, 289–304. [CrossRef]
23. Cheng, W.; Liu, C.-H.; Leung, D.Y. On the correlation of air and pollutant exchange for street canyons incombined wind-buoyancy-driven flow. Atmos. Environ. 2009, 43, 3682–3690. [CrossRef]
24. Cheng, W.; Liu, C.-H. Large-eddy simulation of turbulent transports in urban street canyons in differentthermal stabilities. J. Wind Eng. Ind. Aerodyn. 2011, 99, 434–442. [CrossRef]
25. Cai, X. Effects of differential wall heating in street canyons on dispersion and ventilation characteristics of apassive scalar. Atmos. Environ. 2012, 51, 268–277. [CrossRef]
26. Bottillo, S.; De Lieto Vollaro, A.; Galli, G.; Vallati, A. CFD modeling of the impact of solar radiation in atridimensional urban canyon at different wind conditions. Sol. Energy 2014, 102, 212–222. [CrossRef]
27. Bottillo, S.; De Lieto Vollaro, A.; Galli, G.; Vallati, A. Fluid dynamic and heat transfer parameters in an urbancanyon. Sol. Energy 2014, 99, 1–10. [CrossRef]
28. Yazid, A.W.M.; Sidik, N.A.C.; Salim, S.M.; Saqr, K.M. A review on the flow structure and pollutant dispersionin urban street canyons for urban planning strategies. Simulation 2014, 90, 892–916. [CrossRef]
29. Kwak, K.-H.; Baik, J.-J. Diurnal variation of NO x and ozone exchange between a street canyon and theoverlying air. Atmos. Environ. 2014, 86, 120–128. [CrossRef]
30. Nazarian, N.; Kleissl, J. CFD simulation of an idealized urban environment: Thermal effects of geometricalcharacteristics and surface materials. Urban Clim. 2015, 12, 141–159. [CrossRef]
31. Nazarian, N.; Kleissl, J. Realistic Solar Heating in Urban Areas: Air Exchange and Street-Canyon Ventilation.Build. Environ. 2015, 95, 79–93. [CrossRef]
Atmosphere 2017, 8, 43 18 of 18
32. Tan, Z.; Dong, J.; Xiao, Y.; Tu, J. Numerical simulation of diurnally varying thermal environment in a streetcanyon under haze-fog conditions. Atmos. Environ. 2015, 119, 95–106. [CrossRef]
33. Tan, Z.; Dong, J.; Xiao, Y.; Tu, J. A numerical study of diurnally varying surface temperature on flow patternsand pollutant dispersion in street canyons. Atmos. Environ. 2015, 104, 217–227. [CrossRef]
34. Yaghoobian, N.; Kleissl, J. An Improved Three-Dimensional Simulation of the Diurnally VaryingStreet-Canyon Flow. Bound.-Layer Meteorol. 2014, 153, 251–276. [CrossRef]
35. Richards, P.; Hoxey, R. Appropriate boundary conditions for computational wind engineering models usingthe k-ε turbulence model. J. Wind Eng. Ind. Aerodyn. 1993, 46, 145–153. [CrossRef]
36. Qu, Y.; Milliez, M.; Musson-Genon, L.; Carissimo, B. Numerical study of the thermal effects of buildings onlow-speed airflow taking into account 3D atmospheric radiation in urban canopy. J. Wind Eng. Ind. Aerodyn.2012, 104, 474–483. [CrossRef]
37. Yan, D.; Xia, J.; Tang, W.; Song, F.; Zhang, X.; Jiang, Y. DeST-An Integrated Building Simulation Toolkit Part I:Fundamentals. Build. Simul. 2008, 1, 95–110. [CrossRef]
38. Zhang, X.L.; Xia, J.; Jiang, Z.; Huang, J.; Qin, R.; Zhang, Y.; Liu, Y.; Jiang, Y. DeST-An Integrated BuildingSimulation Toolkit Part: Applications. Build. Simul. 2008, 1, 193–209. [CrossRef]
39. Stazi, F.; Mastrucci, A.; di Perna, C. The behaviour of solar walls in residential buildings with differentinsulation levels: An experimental and numerical study. Energy Build. 2012, 47, 217–229. [CrossRef]
40. Jones, A.; Underwood, C. A thermal model for photovoltaic systems. Sol. Energy 2001, 70, 349–359. [CrossRef]41. Idczak, M.; Groleau, D.; Mestayer, P.; Rosant, J.-M.; Sini, J.-F. An application of the thermo-radiative model
SOLENE for the evaluation of street canyon energy balance. Build. Environ. 2010, 45, 1262–1275. [CrossRef]42. Michioka, T.; Takimoto, H.; Sato, A. Large-Eddy Simulation of Pollutant Removal from a Three-Dimensional
Street Canyon. Bound.-Layer Meteorol. 2014, 150, 259–275. [CrossRef]43. Salizzoni, P.; Soulhac, L.; Mejean, P. Street canyon ventilation and atmospheric turbulence. Atmos. Environ.
2009, 43, 5056–5067. [CrossRef]44. Fluent, A. ANSYS Fluent 14.0 User’s Guide; ANSYS Inc.: Canonsburg, PA, USA, 2011.45. Kang, Y.S.; Baik, J.J.; Kim, J.J. Further studies of flow and reactive pollutant dispersion in a street canyon
with bottom heating. Atmos. Environ. 2008, 42, 4964–4975. [CrossRef]46. Kim, J.J.; Baik, J.J. Urban street-canyon flows with bottom heating. Atmos. Environ. 2001, 35, 3395–3404.
[CrossRef]47. Memon, R.A.; Leung, D.Y.C.; Liu, C.H. Effects of building aspect ratio and wind speed on air temperatures
in urban-like street canyons. Build. Environ. 2010, 45, 176–188. [CrossRef]48. Hang, J.; Luo, Z.; Wang, X.; He, L.; Wang, B.; Zhu, W. The influence of street layouts and viaduct settings on
daily carbon monoxide exposure and intake fraction in idealized urban canyons. Environ. Pollut. 2016, 220,72–86. [CrossRef] [PubMed]
49. Blocken, B. Computational Fluid Dynamics for urban physics: Importance, scales, possibilities, limitationsand ten tips and tricks towards accurate and reliable simulations. Build. Environ. 2015, 91, 219–245. [CrossRef]
50. Fluent, I. ANSYS FLUENT 14: Theory Guide; Fluent Inc.: Canonsburg, PA, USA, 2012.51. Uehara, K.; Murakami, S.; Oikawa, S.; Wakamatsu, S. Wind tunnel experiments on how thermal stratification
affects flow in and above urban street canyons. Atmos. Environ. 2000, 34, 1553–1562. [CrossRef]52. Kwak, K.H.; Baik, J.J.; Lee, S.H.; Ryu, Y.H. Computational Fluid Dynamics Modelling of the Diurnal Variation
of Flow in a Street Canyon. Bound.-Layer Meteorol. 2011, 141, 77–92. [CrossRef]53. Xie, X.; Huang, Z.; Wang, J.; Xie, Z. The impact of solar radiation and street layout on pollutant dispersion in
street canyon. Build. Environ. 2005, 40, 201–212. [CrossRef]
© 2017 by the authors. Licensee MDPI, Basel, Switzerland. This article is an open accessarticle distributed under the terms and conditions of the Creative Commons Attribution(CC BY) license (http://creativecommons.org/licenses/by/4.0/).