Seasonal changes in plankton biomass, production and...
18
Seasonal changes in plankton biomass, production and community structure in southern Japan* TORU KOBARI Faculty of Fisheries, Kagoshima University * Partly supported by grants from the Japan Society for the Promotion of Science and the Fisheries Agency of Japan CCCC REX Workshop on PICES 13 th Annual Meeting October 14 th , 2004 Hawaii Convention Center
Transcript of Seasonal changes in plankton biomass, production and...

Seasonal changes in plankton biomass, production and community structure
in southern Japan*
TORU KOBARIFaculty of Fisheries, Kagoshima University
* Partly supported by grants fromthe Japan Society for the Promotion of Science and the Fisheries Agency of Japan
CCCC REX Workshop on PICES 13th Annual MeetingOctober 14th, 2004
Hawaii Convention Center

Contents
1. Background
2. Sampling and experimental methods
3. Results
4. Summary
Seasonal patternsVertical distributionBiomassProductionCommunity structureGrowth rateMortality rate
Carbon budget

MammalsFishes
Copepod, Euphausiid
Ciliate
Bacteria, Cyanobacteria
GrazingGrazingFood WebFood Web
MicrobialMicrobialFood WebFood Web
Heterotrophic Nano-Flagellate
Diatom
0.2-2µ
2-20µ
20-200µ
>200µ
Epipelagic Marine EcosystemEpipelagic Marine Ecosystem
Pico
Nano
Micro
Meso

Early studiesEarly studies
Zooplankton grazing activity
Standing stock of phyto- and zooplankton
Seasonal variation
Satellite image of sea surface chlorophyll a
ALOHA
Station PaPa
EQPAC
Site H
Little knowledge of plankton food webin the oligotrophic waters
NOPACCS

ObjectiveObjective
Seasonal changes in biomass, production and community structure
of phyto- and zooplankton in the Kuroshio
Carbon budget within phyto- and zooplankton
Structure of plankton food web

SamplingSampling
Sampling station
Oceanographic observations
Kuroshio
200m
1000m
Sampling period
30˚N, 131˚E (Kuroshio)
June 2002 - October 2003(Monthly to Bimonthly)
Temperature, Salinity (CTD)Pico- to Micro-plankton (Niskin bottles)
0,10,20,30,50,75,100 mMeso-plankton (Plankton net)
0-100 m
Station A

Microscopic AnalysisMicroscopic AnalysisPico-plankton (<2µm)
BacteriaCyanobacteriaOther pico-phytoplankton
Autotrophic Nano-Flagellate (ANF)Heterotrophic Nano-Flagellate (HNF)
Nano-plankton (2-20µm)
Centric or Pannae DiatomAutotrophic Micro-flagellate (AMF)Heterotrophic Micro-flagellate (HMF)Naked CiliateTintinnid CiliateNauplii
Micro-plankton (20-200µm)
Meso-plankton (>200µm)CopepodGelatinous zooplanktonOther zooplankton

Conversion FactorsConversion Factors
Picoplankton: cell numbers were directly converted to carbonBacteriaCyanobacteriaOther picophytoplankton
12.8 fgC/cell250 fgC/cell220 fgC/cell
Autotrophic Nano-Flagellate (ANF)Heterotrophic Nano-Flagellate (HNF)Centric or Pannae DiatomAutotrophyic Micro-Flagellate (AMF)Heterotrophic Micro-Flagellate (HMF)Naked CiliateTintinnid CiliateNaupliiGelatinous mesoplanktonOther mesoplankton
Log10C=0.863Log10V×-0.3630.12 pgC/um3
Log10C=0.758Log10V×-0.422C=0.216V0.939
C=0.216V0.939
0.19 pgC/um3
C=444.5+0.053LV0.05 pgC/um3
0.003 pgC/um3
0.06 pgC/um3
Nano- to Meso-plankton: carbon contents were estimated from biovolume
C: Carbon (µgC), V: Volume (µm3), LV: Lorica volume (µm3)

Dilution ExperimentsDilution Experiments
Following by Following by LandryLandry & & HassettHassett (1982), (1982), Landry Landry et al. (1995)et al. (1995)
Incubating sea watersIncubating sea waters
Diluted seriesDiluted series
Enriched nutrientsEnriched nutrients
Enriched bottles: 30, 50, 75, 100%Enriched bottles: 30, 50, 75, 100%UnenrichedUnenriched bottles: 100%bottles: 100%
(to examine nutrient(to examine nutrient--limited growth)limited growth)
NONO3 3 : NH: NH44: PO: PO44 : Fe = 7.5: Fe = 7.5µµM : 0.5M : 0.5µµM : 0.5M : 0.5µµM : 1nMM : 1nM
MesoplanktonMesoplankton--FreeFree SW SW ++ ParticleParticle--Free SWFree SW
ExperimentsExperimentsFebruary to October 2003 (monthly) February to October 2003 (monthly)

Vertical Distribution of Vertical Distribution of PhytoPhyto-- and Zooplankton Biomassand Zooplankton Biomass
* No data
0 20 40
0
10
20
30
50
75
100 Jun. Aug. Oct. Nov. Feb. Mar. Apr. May Jul. Aug. Sep. Oct.
0 20 40Biomass (mgC m-3)
0
10
20
30
50
75
100
MicroNanoPico
*
*
*
*
*
*
**
*
*
*
*

Phytoplankton Biomass and Community StructurePhytoplankton Biomass and Community Structure
*sea surface only
Bio
mas
s (m
gC m
-2)
Mic
ro-c
ompo
sitio
n (%
)P
ico-
com
posi
tion
(%)
0
500
1000
1500
Micro
Nano (ANF)
Pico
0
25
50
75
100
OtherPico
Cyano
0
25
50
75
100
J J A S O N D J F M A M J J A S OMonth
Pannae
Centric
Thecate MF
Naked MF
*

Zooplankton Biomass and Community StructureZooplankton Biomass and Community Structure
Bio
mas
s (m
gC m
-2)
Mic
ro-c
ompo
sitio
n (%
)M
eso-
com
posi
tion
(%)
*sea surface only
0
500
1000
1500
2000
Meso
Micro
Nano (HNF)
Pico
0
25
50
75
100
Nauplii
Tintinnid
Naked Ciliate
Thecate MF
Naked MF
0
25
50
75
100
J J A S O N D J F M A M J J A S OMonth
Others
Copepoda
Gelatinous
*
2106.7
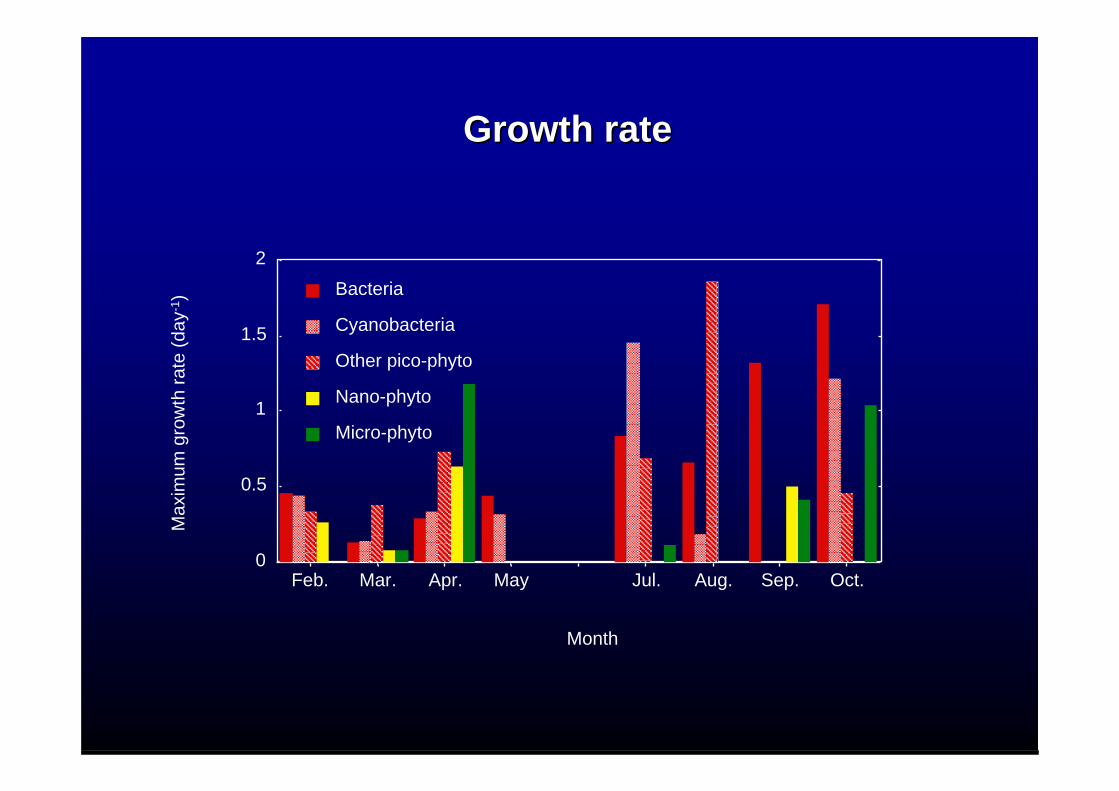
Growth rateGrowth rate
0
0.5
1
1.5
2
Feb. Mar. Apr. May Jul. Aug. Sep. Oct.
Month
Micro-phyto
Nano-phyto
Other pico-phyto
Cyanobacteria
Bacteria
Max
imum
gro
wth
rate
(day
-1)

Nutrient effects on growth rateNutrient effects on growth rateU
nenr
iche
d gr
owth
rate
(day
-1)
Micro-phytoNano-phyto
Nano & MicroPico
-3 -2 -1 0 1 2
Enriched growth rate (day-1)
-3
-2
-1
0
1
2
-3 -2 -1 0 1 2
Enriched growth rate (day-1)
Other PicoBacteria
Cyano

Vertical Profiles of Temperature and SalinityVertical Profiles of Temperature and Salinity
Dep
th (m
)D
epth
(m)
100
80
60
40
20
0
100
80
60
40
20
0
Month
Temperature (ÞC)
Salinity (PSU)
20
2224
26
28
18
20
22
24
26
28
34.834.6
34.4
34.2
34.6
34.4
34.2
34.8
<34.0 <34.0
>29
J J A S O N D J F M A J JM A S O
sampling date

Relationship between Growth and MortalityRelationship between Growth and Mortality
0
1
2
3
0 1 2 3
Maximum growth rate (day -1)
Other picoCyano
Bacteria
0 1 2 3
Maximum growth rate (day -1)
Micro-phytoNano-phyto
Mor
talit
y ra
te (d
ay-1
)Nano & MicroPico

Carbon Budget in Plankton Food WebCarbon Budget in Plankton Food Web
PicoPico--phytophyto125.6125.6
BacBac172.6172.6
ANFANF212.6212.6
HNFHNF299.9299.9
MicroMicro--phytophyto140.5140.5
MicroMicro--zoozoo38.838.8
MesoMeso--zoozoo46.746.7
Mixing period (February-May)
749.8749.8
110.8110.8
321.8321.8
PicoPico--phytophyto470.0470.0
BacBac1483.91483.9
ANFANF0.00.0
HNFHNF1091.51091.5
MicroMicro--phytophyto27.427.4
MicroMicro--zoozoo74.074.0
MesoMeso--zoozoo93.993.9
2728.72728.7
211.3211.3
167.2167.2
Stratified period (July-October)
Production: mgC m-2
Respiratory requirement : mgC m-2

SummerySummerySeasonal pattern of phytoplanktonSeasonal pattern of phytoplankton
•• Autotrophic nanoAutotrophic nano--flagellatesflagellates and and cyanobacteriacyanobacteria contributed contributed to phytoplankton biomass.to phytoplankton biomass.
•• No seasonal patternNo seasonal pattern was observed for phytoplankton was observed for phytoplankton biomass.biomass.
•• Seasonal phytoplankton dynamics might be affected by Seasonal phytoplankton dynamics might be affected by nutrients from the neighboring watersnutrients from the neighboring waters..
Seasonal pattern of zooplanktonSeasonal pattern of zooplankton•• BacteriaBacteria and and copepods copepods dominated zooplankton biomass. dominated zooplankton biomass. •• Zooplankton biomass Zooplankton biomass increased during the stratified periodincreased during the stratified period..•• Seasonal patterns of biomass might be resulted from Seasonal patterns of biomass might be resulted from
temperaturetemperature--dependent growthdependent growth..Plankton food webPlankton food web
•• Grazing food web was functional Grazing food web was functional along microbial food web along microbial food web during the mixing period.during the mixing period.
•• During the stratified period, During the stratified period, microbial food webmicrobial food web was was predominated predominated and and carbon flow seems to be complicatedcarbon flow seems to be complicated..