Searching for Irving Fisher
34
Searching for Irving Fisher Kris James Mitchener Department of Economics Santa Clara University and NBER Marc D. Weidenmier Department of Economics Claremont McKenna College and NBER January 2009 There is a long-standing debate about whether there was a Fisher effect during the classical gold standard period. We break new ground on this question by examining the interest-rate differential between Austrian paper and gold perpetuity bonds to impute a market-based measure of general inflation expectations during the gold standard. Our empirical investigation of inflation expectations during the gold standard period suggests several conclusions: (1) inflation expectations exhibited significant persistence at the weekly, monthly, and annual frequencies; (2) market participants forecasted a significant portion of both the gold deflation and inflation episodes during the classical gold standard period; and (3) inflation expectations are highly correlated with nominal interest rates. Using our measures of inflation expectations, we find evidence in favor of the operation of the Fisher effect during the classical gold standard period. Keywords: Fisher Effect, Inflation Expectations, Gold Standard JEL Classification Numbers: E4, G1, N2 Mitchener: Department of Economics, Santa Clara University, 500 El Camino Real Santa Clara, CA 95050; [email protected] . Weidenmier: Department of Economics, Claremont McKenna College, Claremont, CA 91711; [email protected] . Preliminary draft: Please do not cite or quote without authors’ permission.
Transcript of Searching for Irving Fisher

Searching for Irving Fisher
Kris James Mitchener Department of Economics
Santa Clara University and NBER
Marc D. Weidenmier Department of Economics
Claremont McKenna College and NBER
January 2009 There is a long-standing debate about whether there was a Fisher effect during the classical gold standard period. We break new ground on this question by examining the interest-rate differential between Austrian paper and gold perpetuity bonds to impute a market-based measure of general inflation expectations during the gold standard. Our empirical investigation of inflation expectations during the gold standard period suggests several conclusions: (1) inflation expectations exhibited significant persistence at the weekly, monthly, and annual frequencies; (2) market participants forecasted a significant portion of both the gold deflation and inflation episodes during the classical gold standard period; and (3) inflation expectations are highly correlated with nominal interest rates. Using our measures of inflation expectations, we find evidence in favor of the operation of the Fisher effect during the classical gold standard period. Keywords: Fisher Effect, Inflation Expectations, Gold Standard JEL Classification Numbers: E4, G1, N2 Mitchener: Department of Economics, Santa Clara University, 500 El Camino Real Santa Clara, CA 95050; [email protected]. Weidenmier: Department of Economics, Claremont McKenna College, Claremont, CA 91711; [email protected]. Preliminary draft: Please do not cite or quote without authors’ permission.

1
Searching for Irving Fisher
Several studies have found that ex post inflation rates are not correlated with the
level of nominal interest rates during the classical gold standard period even though the
Fisher equation is an empirical relationship based on inflation expectations.1 One possible
explanation for the failure of the Fisher equation in this earlier period is that inflation
expectations were nearly zero given the low level of persistence in annual measures of ex
post inflation rates (Barsky, 1987; Bordo and Kydland, 1995; Fisher, 1930; Friedman and
Schwartz, 1982).2 Other possible explanations for the lack of correlation between
nominal interest rates and inflation rates include the hypotheses that financial markets
had money illusion or that investors did not understand the quantity theory of money
(Summers, 1983; Cagan, 1984; Choudry, 1996; Barsky and Delong, 1991).
Several scholars have attempted to estimate price and inflation expectations
during the gold standard period to test for the presence of a Fisher effect using time series
econometric models (Capie, Mills, and Wood, 1991). An obvious limitation to this
approach is that we do not have a very good idea of the economic model that market
participants used to form inflation expectations (Barsky and DeLong, 1988).
Alternatively, some more recent studies have used data on agricultural futures to derive a
measure of inflation expectations (Siegler and Perez, 2003). However, as noted by the
authors, trading in futures markets was quite thin during the gold standard and estimation
1 Many studies have found that nominal interest rates during the gold standard are correlated with the price level rather than the rate of inflation. Barsky and Summers (1983) argue that that the positive correlation of nominal interest rates with the price level is a direct result of the fact that the price level in the inverse of the price of gold. Benjamin and Kochin (1984) argue that Gibson’s Paradox was spurious. 2 For a discussion of inflation expectations during the gold standard period, see Barsky and DeLong (1983). For an analysis of the persistence of inflation during the gold standard period and later, see Burdekin and Siklos (1996). Harley (1977) analyzes prices and interest rates in the UK during the gold standard period to test Gibson’s Paradox.

2
sometimes requires interpolation techniques to construct a continuous times series. In
addition, agricultural futures only cover individual commodities, and hence are based on
the assumption that agricultural prices track the overall inflation rate. This approach
suffers from a failure to distinguish between changes in relative prices versus changes in
the overall price level (Bordo and Schwartz, 1981). Summarizing the literature,
McCallum (1984) points out that studies of pre-World War I changes in the price level
have simply shown that past inflation cannot forecast future inflation and therefore say
very little about inflation expectations or the failure of the Fisher effect during the gold
standard period.
To improve upon the existing literature, we have collected high-frequency asset
price data that allow us to compute a market-based measure of inflation expectations for
the 19th century. In particular, we use data on Austrian paper, gold, and silver government
bonds to compute measures of inflation expectations at high and low frequencies during
the classical gold standard period to test for the presence of a short and long-run Fisher
effect. Austria was the only major European country during the classical gold standard
period that issued gold, paper, and silver perpetuity bonds that actively traded on the
leading financial exchanges of Europe including London, Paris, Berlin, Amsterdam and
Vienna for most of the gold standard period (1880-1913).
We use the interest-rate differential between Austrian paper and gold bonds to
derive an ex ante market-based measure of inflation expectations. We suggest that gold
bonds were essentially inflation-indexed securities, much like modern-day TIPS
(Treasury Inflation Protected Securities), whereas paper bonds required an inflation
premium to make the debt obligations attractive to investors in international capital

3
markets. Our empirical analysis suggests that inflation expectations were not a white
noise process during the gold standard period. We find economically meaningful
persistence in inflation expectations at the weekly, monthly, and annual frequencies that
can be used to forecast realized inflation. As predicted by the Fisher equation, we also
find that expected inflation was positively related to the level of nominal interest rates.
Inflation expectations for Austria also Granger-cause changes in the gold-silver price
ratio. Using our unique measures of inflation expectations, we find evidence in favor of
the operation of the Fisher effect during the classical gold standard period.
We begin with a discussion of our data on Austrian bonds during the classical
gold standard period. We then analyze the time series properties of inflation expectations
during our sample period in Austria. We then test the short and long-run Fisher effect
using interest rate data from Austria and other countries during the gold standard. The
last section discusses our findings and their implications for the literature on the Fisher
effect.
II. Austria and the Gold Standard
Some scholars have characterized nineteenth-century Austria as a financially
underdeveloped, agriculturally-oriented economy, suggesting that it belonged to the
periphery rather than to the core of European gold standard countries like the United
Kingdom, France, or Germany. Although its GDP per capita was lower than the UK,
Austria’s standard of living compares favorably with France and Germany prior to the
outbreak of World War I (see Figure 1). Austria was also one of the leading European

4
military powers of the late nineteenth century and its financial markets appear to have
been well developed and integrated (Good, 1977). After 1816, it had a central bank,
modeled after the Bank of France, which had the sole right to issue notes. A well-
developed network of joint stock banks with extensive branching networks (including the
important Viennese banks) that lent to businesses throughout the Austrian empire also
existed in Austria in the 19th century. The country had also borrowed from the German
model of universal banking in forming institutions such as the Creditanstalt fur Handel
und Gewerbe (1855).
As for exchange rate policy, Austria was a member of the silver standard for
much of the nineteenth century. The Compromise of 1867 between Austria and Hungary
gave constitutional foundations for a monetary union with the silver florin as the
monetary standard and a central bank with no authority to print new currency issues.
Despite this agreement, Austria and Hungary disagreed over the management of
monetary policy. In addition to a monetary union, Hungary wanted overdraft facilities
and a central bank office in Budapest. In July 1878, Austria and Hungary renewed the
“Compromise of 1867” for ten years, but changed the name of the central bank from the
Austrian National Bank to the Austro-Hungarian Bank. This new agreement created
central bank offices in Budapest and Vienna with both German and Hungarian as the
official languages of the monetary institution.
But after 1879, the florin was no longer convertible into silver. The exchange-rate
system then began to resemble a float more than a peg. Silver florin traded for as much as
seven percent from the mint par ratio and, as shown in Figure 2, weekly exchange rates
exhibited significant fluctuations in the 1880s. Austria then joined the gold standard in

5
August 1892, after renewing the “Compromise” with Hungary for a second time. At this
point, it also established the kronen (crown) as its new currency. The kronen’s value was
fixed in terms of gold and complete control of the money supply was given to the central
bank. The credibility of this new monetary regime was further buttressed in 1899 when
Hungary was granted full parity with Austria in the management of the central bank.
Investors reacted favorably to this new power-sharing arrangement: large capital inflows
from the leading European financial centers including London, Paris, and Berlin occurred
in response (Tullion and Wolters, 2007).
Flandreau and Komlos (2001) argue that even though Austria never formally
established gold convertibility prior to World War I, the country was a de facto member
of the gold standard by 1896 because of the stability of its exchange rate. For example,
Tullio and Wolters (2007) show that the Austrian exchange rate vis-à-vis other major
gold standard countries (England, France, and Germany) fluctuated within a range of
about 15 percent between 1876 and 1891 and just eight percent between 1892 and 1895.
The ratio of metallic-backed notes to paper notes issued by the central bank increased
from an average of 53 percent over the period 1876-1895 to an average of nearly 75
percent over the period 1896-1914 (Tullio and Wolters, 2007). After 1896, the exchange
rate for the Austrian crown relative to other gold standard countries fluctuated only two
percent and +/- 0.4 percent from mint par (Flandreau and Komlos, 2001; Tullio and
Wolters, 2007). Figure 2 confirms that Austrian exchange rates were remarkably stable
after the country joined the gold standard. Based on the behavior of the exchange rate,
Flandreau and Komlos (2001) conclude that Austria was a country that was neither a core
nor peripheral member of the gold standard, but rather somewhere in between.

6
Additional historical evidence from bond markets suggests that Austria may have
more closely resembled a core gold standard country. In contrast to periphery countries, it
successfully floated large amounts of government debt throughout Europe in its own
currency. Issued in the late 1860s, the paper bonds were perpetuity obligations and
subject to a 16 percent income tax. The coupon payments on the paper bonds were
payable half-yearly on February or August 1st or on May 1st and November 1st (Stock
Exchange Official Intelligence, various issues). The market value of unredeemed paper
bonds exceeded more than 886 million Kroner in 1910. Morys (2008) finds that
approximately 20 percent of the paper bonds were held by foreign investors.
Only the UK, France, Germany, Netherlands, and the United States were also able
to sell large bond issues in their home currency on several European markets during the
classical gold standard period. Austria suffered “original sin” only to the extent that its
debt was denominated in gold, silver, and paper florin (Eichengreen and Hausmann,
1999; Bordo, Meissner, and Redish, 2005). A depreciation in the paper florin, for
example, would require Austrian authorities to collect more tax revenues (in paper florin)
to service its debt denominated in gold florin.3
Austria tapped international capital markets on a significant scale following the
passage of the Law of March 16, 1876. The legislation authorized a 16 million florin
bond issue that was exempt from Austrian taxes and paid interest half-year in gold in
Vienna and other European exchanges including Amsterdam, Berlin, Brussels, Frankfurt,
and Paris. Morys (2008) estimated that foreigners held approximately 80 percent of the
debt issue. In 1910, the Official Stock Exchange Intelligence reported that there were
3 This was true even after Austria joined the gold standard. As shown in the Amsterdamsch Effectenblad, after Austria joined the gold standard, the coupons for paper bonds often traded at a discount to the coupons for gold bonds.
7
more than 490 million Austrian Kroner gold bonds unredeemed that traded on markets
throughout Europe.
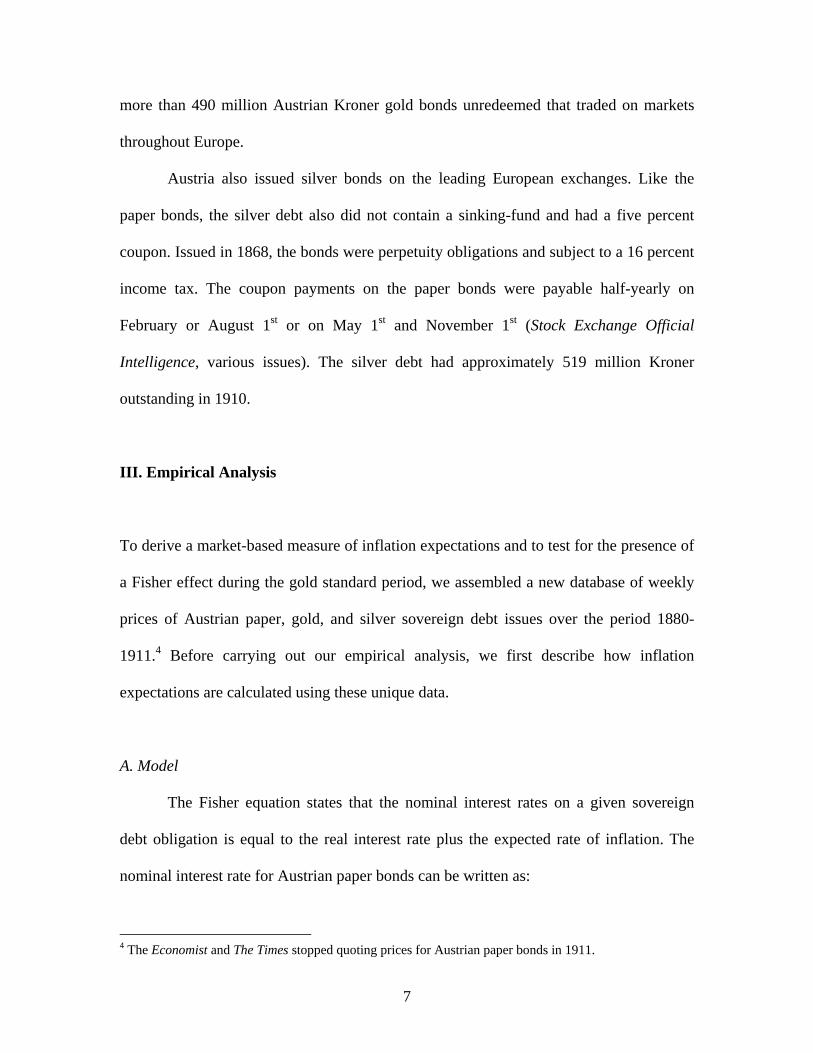
Austria also issued silver bonds on the leading European exchanges. Like the
paper bonds, the silver debt also did not contain a sinking-fund and had a five percent
coupon. Issued in 1868, the bonds were perpetuity obligations and subject to a 16 percent
income tax. The coupon payments on the paper bonds were payable half-yearly on
February or August 1st or on May 1st and November 1st (Stock Exchange Official
Intelligence, various issues). The silver debt had approximately 519 million Kroner
outstanding in 1910.
III. Empirical Analysis
To derive a market-based measure of inflation expectations and to test for the presence of
a Fisher effect during the gold standard period, we assembled a new database of weekly
prices of Austrian paper, gold, and silver sovereign debt issues over the period 1880-
1911.4 Before carrying out our empirical analysis, we first describe how inflation
expectations are calculated using these unique data.
A. Model
The Fisher equation states that the nominal interest rates on a given sovereign
debt obligation is equal to the real interest rate plus the expected rate of inflation. The
nominal interest rate for Austrian paper bonds can be written as:
4 The Economist and The Times stopped quoting prices for Austrian paper bonds in 1911.

8
(1) ,,Pett
Pt ri π+=
where tr is the real interest rate and Pet
,π is the expected rate of inflation. The Fisher
equation for Austrian gold bonds can be written as
(2) .,Gett
Gt ri π+=
However, unlike the paper bond, since this debt obligation is payable in gold, inflation
expectations, denoted by Get
,π , are assumed to be zero (Barsky, 1987). The paper-gold
interest-rate differential can be obtained by subtracting equation (2) from equation (1),
which yields:
(3) et
Gt
Pt ii π=− .
Equation (3) states that the paper-gold interest rate spread is equal to the expected rate of
inflation.
To carry out our empirical analysis, we make three assumptions about the bonds
and investor behavior: (1) investors are risk-neutral; (2) the real interest rate is the same
for both bonds given that the Austrian government issued the two debt obligations; and
(3) paper and gold bonds have identical default risk. The third assumption of identical
default risk appears reasonable since Austria faithfully repaid its sovereign debt during
the entire gold standard period from 1880-1913. Given that the paper and gold bonds
were widely held by foreign investors, Austria could not differentially default on the
paper bonds without damaging its reputation in international capital markets. Even if
there were some differential default risk between paper and gold bonds, the premium is
not likely large enough to have a qualitative impact on our analysis. Furthermore, the
presence of a differential default premium is likely to be significantly correlated with

9
inflation expectations, especially since the Austrian government used the printing press to
help monetize a portion of its debt obligations following war with Italy in 1866.
Figure 3 plots current yields on a weekly basis for the Austrian gold, silver, and
paper bonds from January 1880 to April 1911. The three series tend to move together,
with the gold bond having the lowest interest rate over the course of the sample period.
As shown in Table 1, the average interest rate for Austrian gold bonds during the gold
standard period is about 430 basis points with a standard deviation of 39 basis points. The
interest rate on silver debt averaged approximately 555 basis points with a standard
deviation of 61 basis points. Paper bonds, on the other hand, offered investors the highest
yield, more than 560 basis points with a standard deviation of 64 basis points. Bond
yields were highest during the silver standard for all three debt issues. Following the
adoption of the gold standard, the average yield for the gold bonds fell by approximately
60 basis points and more than 100 basis points for the paper and silver bonds.
Figure 4 plots our imputed weekly measure of inflation expectations, πet,
alongside weekly current yields for Austrian paper-bonds for the period January 1880 to
April 1911. The simple correlation coefficient between this nominal interest rate and
inflation expectations is more than 90 percent. Inflation expectations over the entire
sample period averaged 1.30 percent (130) basis points and accounted for approximately
20 percent of the nominal interest rate (inflation expectations/nominal interest rate). Since
inflation expectations were relatively stable (the standard deviation is less than three
percent), the empirical evidence also indicates, as suggested by Siegel and Shiller (1977),
that movements in real interest rates were probably more important than inflation
expectations in driving fluctuations in Austrian nominal interest rates.

10
B. Persistence in Inflation Expectations
To examine the time-series properties of inflation expectations during the
classical gold standard period, we first test for a unit root using the Augmented Dickey-
Fuller test. The null hypothesis of a unit root could not be rejected at the five- or ten-
percent level of significance.5 Figure 4, however, suggests that the adoption of the gold
standard may have led to a structural break in the formation of inflation expectations as
the country implemented monetary and fiscal reforms in the late 1880s, which in turn
reduced the level of nominal interest rates.
To test formally for a structural break, we employ the methodology developed by
Zivot-Andrews (1992). This test allows us to examine whether adopting the gold standard
lowered the level, trend, or level and trend of inflation expectations. The Zivot-Andrews
procedure does not specify a breakpoint, a priori, given that the pre-selection of a change
point biases the results towards finding a structural break (Christiano, 1992). The null
hypothesis of the structural break model, H0, is that inflation expectations are a
nonstationary process:
(4) tet
et e++= πμπ ,
whereμ is the mean of a given time series and te is a white noise disturbance term.
Three different alternative hypotheses can be written as follows:
5 The test statistic for the ADF test was -0.80.

11
t
k
jjtjtttt
t
k
jjtjttt
t
k
jjtjttt
eycyDTDUty
eycyDTty
eycyDUty
+Δ+++++=Δ
+Δ++++=Δ
+Δ++++=Δ
∑
∑
∑
=−−
=−−
=−−
11
11
11
)7(
)6(
)5(
αγθβμ
αγβμ
αθβμ
Equation (5) is a “crash” model that allows for a one-time change in the level of
inflation expectations at a break date denoted by TB. This specification captures the large
drop in inflation expectations in the late 1880s early 1890s. Equation (6) is used to test
for stationarity around a broken trend at TB. This specification allows for a gradual
decline in inflation expectations if the “good housekeeping” effect of the gold standard is
incorporated into interest rates over a long period of time. Equation (7) is the most
general specification that allows for a change in the intercept and trend of inflation
expectations at TB.
DUt is a dummy variable that captures the shift in the intercept and takes a value
of 1 if t>TB. DTt is another indicator variable that represents the shift in the deterministic
trend at time TB. DTt is equal to (t-TB) if (t>TB) and zero otherwise. To control for
serial correlation, we also included lagged differences of the dependent variable as
covariates in the three models. The number of lagged differences employed in the break
tests is selected on the basis of the Akaike Information Criteria (AIC). In each of the
three alternative hypotheses, etπ is assumed to be a stationary process with one structural
break. The null hypothesis is rejected if the tα coefficient is significantly different from

12
zero. The empirical results for the structural break test are presented in Table 2. The
analysis suggests that the adoption of the gold standard led to a structural change in both
the trend and level of inflation expectations at the one-percent level of significance for
Austria on June 23, 1888; however, we do not find structural break for the crash and
trend break models.
Based on the results of the structural break analysis, we then estimate ARIMA
models for the periods when Austria was a member of the silver and gold standards to
measure the persistence of inflation expectations. In order to avoid contaminating the
empirical results with the large drop in inflation expectations that accompanied the
economic reforms, we estimate ARIMA models for the silver standard over the sample
period January 1880 to June 1888 – the period before the structural break. In the late
1880s and early 1890s, Austria, reduced its budget deficit, acquired gold, and retired
outstanding government paper notes as it prepared to adopt the gold standard (Flandreau
and Komlos, 2001). As shown in Table 3, inflation expectations in Austria are best
characterized by an AR(3) process when it was a member of the silver standard. The sum
of the autoregressive coefficients, which has a value greater than 0.95, indicates a very
high level of persistence in inflation expectations. The coefficient on the constant term in
the equation suggests that financial market participants expected inflation to average
approximately 1.79 percent per year.
For the gold standard period, we estimate ARIMA models from August 1892 to
April 1911, and find that the best model for inflation expectations is an AR(1) model.
Table 3 shows that the level of inflation persistence drops to about 94 percent. Although
we observe a similar level of persistence in inflation expectations after Austria joined the

13
gold standard, there is a marked reduction in the average level of inflation expectations
from 1.79 percent to 1.10 percent. These findings suggest that there was significant
persistence in inflation expectations and that joining gold reduced the average level of
inflation expectations by roughly 40 percent.
One potential problem with our analysis is that the persistence in inflation
expectations simply results from using high frequency data imputed from weekly interest
rates. To deal with this possibility, we re-estimated the baseline empirical results using
end-of-month data. The ARIMA models of monthly inflation expectations are presented
in Table 4. The results are similar to those employing the weekly data. Inflation
expectations followed an AR(3) process when the country adhered to the silver standard
and inflation persistence is greater than 90 percent and significant at the one-percent
level. For the gold standard period, inflation expectations are still best modeled as an
AR(1) process. Although inflation expectations are once again not a white noise process,
the coefficient on the autoregressive term falls by about 30 percent, from 94 to almost 79
percent.
Using annual data, we find similar results for the persistence of inflation when
Austria was on the gold standard even though this analysis is based on only 18
observations.6 Table 5 shows that inflation expectations averaged more than one percent
over the period 1893 to 1911. Again, we find that there is significant persistence in
inflation expectations: the autoregressive term is greater than 0.75. Hence, using weekly,
monthly, or annual data, we find substantial persistence in inflation expectations during
the gold standard period.
6 The null hypothesis of a unit root can be rejected for the time series of inflation persistence at the one- percent level of significance.

14
One possible critique of our analysis is that Austria’s commitment to gold might
have been perceived as less credible than other western European countries, and hence
the analysis of inflation expectations we derive for it may not be very representative of
gold club members. That is, inflation expectations for non-credible members of the gold
standard may be much larger than for countries that strictly adhered to the monetary rule.
While Austria was a newer member of the gold standard in comparison to France,
Germany, and the UK, it does not appear that market participants viewed its commitment
to gold as substantially less credible than these countries. Mitchener and Weidenmier
(2008) provide evidence that Austria was one of the most credible gold standard
monetary regimes during the period 1870-1913: market participants expected the
Austrian kroner to depreciate approximately three percent after the country joined the
gold standard based on the premium of paper over gold bonds. The level of expected
depreciation is considerably smaller than several other gold standard countries including
the United States, Argentina, Brazil, Chile, India, Mexico, and Russia. We therefore
interpret our results as providing a lower bound on the size and persistence of inflation
expectations for the average country during the classical gold standard period.
C. Forecasting Inflation
The presence of significant persistence in inflation expectations suggests that the
interest-rate differential between paper and gold bonds might be able to predict future
inflation rates during the gold standard. One problem with testing this hypothesis during
the gold standard is that price indices from this period do not always provide useful
15
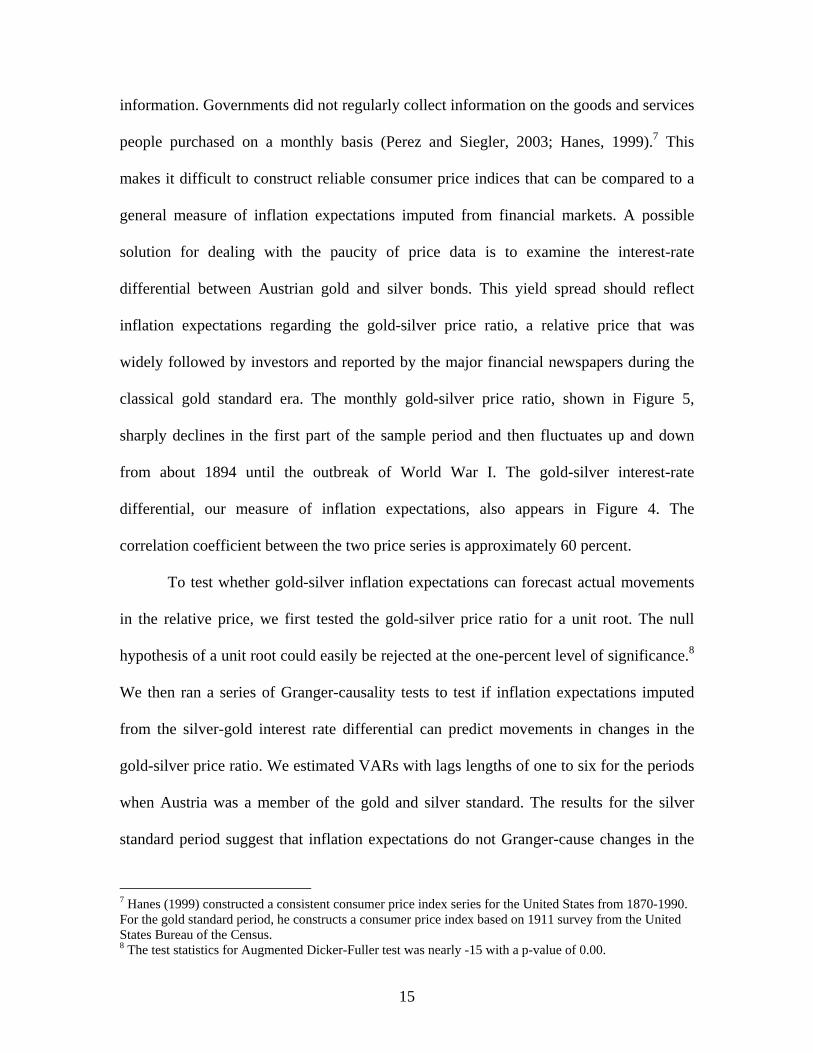
information. Governments did not regularly collect information on the goods and services
people purchased on a monthly basis (Perez and Siegler, 2003; Hanes, 1999).7 This
makes it difficult to construct reliable consumer price indices that can be compared to a
general measure of inflation expectations imputed from financial markets. A possible
solution for dealing with the paucity of price data is to examine the interest-rate
differential between Austrian gold and silver bonds. This yield spread should reflect
inflation expectations regarding the gold-silver price ratio, a relative price that was
widely followed by investors and reported by the major financial newspapers during the
classical gold standard era. The monthly gold-silver price ratio, shown in Figure 5,
sharply declines in the first part of the sample period and then fluctuates up and down
from about 1894 until the outbreak of World War I. The gold-silver interest-rate
differential, our measure of inflation expectations, also appears in Figure 4. The
correlation coefficient between the two price series is approximately 60 percent.
To test whether gold-silver inflation expectations can forecast actual movements
in the relative price, we first tested the gold-silver price ratio for a unit root. The null
hypothesis of a unit root could easily be rejected at the one-percent level of significance.8
We then ran a series of Granger-causality tests to test if inflation expectations imputed
from the silver-gold interest rate differential can predict movements in changes in the
gold-silver price ratio. We estimated VARs with lags lengths of one to six for the periods
when Austria was a member of the gold and silver standard. The results for the silver
standard period suggest that inflation expectations do not Granger-cause changes in the
7 Hanes (1999) constructed a consistent consumer price index series for the United States from 1870-1990. For the gold standard period, he constructs a consumer price index based on 1911 survey from the United States Bureau of the Census. 8 The test statistics for Augmented Dicker-Fuller test was nearly -15 with a p-value of 0.00.

16
gold-silver price ratio (Table 6). However, we do find some evidence that changes in the
gold-silver price ratio Granger-causes inflation expectations. For the gold standard
period, we find that the interest-rate differential between Austrian silver and gold bonds
Granger-causes changes in the gold-silver price ratio for lag lengths of one to three. In all
six VARs, the coefficient on the first lag of the interest-rate spread in the gold-silver price
equation is statistically significant at the one-percent level. This suggests that financial
market participants used inflation expectations to help forecast movements in the gold-
silver price ratio. At present, our evidence on the link between silver-inflation
expectations and changes in the gold-silver price ratio is suggestive, given that we have
converted weekly data on inflation expectations into monthly data for these Granger
causality tests. We are currently working on collecting weekly data on the gold-silver
price ratio so that we can more precisely match the movements of this ratio to our weekly
series on inflation expectations.
D. Fisher Effect
1. Short-Run Tests
To test for the presence of a short-run Fisher Effect, we analyze the relationship
between the Vienna Open market interest rate and our measure of inflation expectations.9
The Vienna open market rate is the most important short-term money market rate used to
conduct trade with other countries. The Austrian short-term rate along with the paper-
gold interest rate spread is shown in Figure 6. Unlike inflation expectations, there is no
visual evidence of a structural break in the short-term interest rate series. The lack of a 9 For studies examining the Fisher effect using modern data, see Mishkin (1981, 1992) and Fama (1975).

17
structural break may be explained by the fact that the Vienna open market security was
denominated in gold. Hence, joining the gold standard would have little impact on the
money market interest rate.
To analyze the relationship between short-term interest rates and inflation
expectations in more detail, we estimate a series of Granger-causality tests. We first test
the short-term interest rate series for a unit root using the Augmented Dickey-Fuller test.
We can easily reject the null hypothesis of no unit root at the one-percent level of
significance.10 As shown in Figure 6, the short-term open market appears to be mean
reverting for Austria. Given that we identified a structural break in the time series of
inflation expectations, we estimate Granger-causality tests for the sample periods when
Austria was a member of the silver standard (January 1880-July 1888) and gold standard
(August 1892-April 1903). We estimate Granger-Causality tests with lag lengths of one
to six for the two monetary regimes. The results appear in Tables 7. With the exception of
the 2-lag VAR model for the gold standard period, we are unable to reject the null
hypothesis that inflation expectations Granger-cause short-term interest rates at the five-
or ten-percent level of significance.
One possible explanation for the lack of Granger causality is that the Austrian
sovereign debt and money markets are very efficient and clear quite quickly. If this were
true, we should not expect lagged values of inflation expectations to predict short-term
interest rates. To consider this possibility, we calculate the forecast error variance of
short-term interest rates and inflation expectations using a standard Choleski
decomposition. This will help us determine the extent to which fluctuations in inflation
10 The fact that the null hypothesis of a unit root can easily be rejected for the short-term interest rate series shows that there is not a structural break in the time series.

18
expectations drove short-term interest rates for Austria. We give inflation expectations
the first ordering in the system so that shocks to inflation expectations have a
contemporaneous effect on short-term interest rates, but short-term interest rates do not
have a contemporaneous impact on inflation expectations. We estimate a VAR using six
lags to construct the variance decomposition. We find that inflation expectations can
account for less than four percent of the movements in short-term interest rates for each
week up to a 36-week forecast horizon.
These results suggests that there is a weak link between inflation expectations and
short-term interest rates for Austria, likely reflecting the fact that short-term interest rates
during the gold standard were often denominated in hard currency. As a result, market
participants considered short-term interest rates to operate like inflation-indexed
securities.
2. Long-Run Fisher Effect
Using the Austrian silver bonds, we next test for the presence of a long-run Fisher
effect. The current yield on the silver bond should provide some insight into whether
there was a relationship between nominal interest rates and expected inflation. Since
silver became largely demonetized in the early 1890s, the precious metal functioned more
as commodity as opposed to a metal used as a currency.11 Figure 7 shows inflation
expectations along with the silver currency bonds for the period when Austria was on the
11 A few countries and colonies continued to use silver throughout the gold standard period including China and Hong Kong.

19
gold standard. The two series move together over the entire sample period, suggesting a
strong positive link between nominal interest rates and expected inflation.
We examine the relationship between Austrian inflation expectations and the
interest rate on silver bonds using Granger-causality tests. We first test the time series of
silver interest rates for a unit root using the Augmented Dickey-Fuller test. The null
hypothesis of a unit root cannot be rejected using either a constant or constant and trend
in the model. As discussed earlier, inflation expectations calculated using the paper-gold
interest rate differential are stationary. Although the two time series have different orders
of integration based on unit root tests, a long-run equilibrium relationship may
nevertheless still exist. To test for one, we look for cointegration using the Engle-Granger
test. With a test statistic of -6.2, we can reject the null hypothesis of no cointegration at
the one-percent level. We interpret the results as strong evidence of the presence of a
Fisher effect – a long-run relationship between inflation expectations and nominal
interest rates.
V. Conclusions
Macroeconomists and economic historians have long searched for the operation of
Irving Fisher’s eponymous effect during the classical gold standard period. We show that
Fisher and his effect may be lurking in the inflation expectations of Austrian sovereign
debt issues of the 19th century. We compute one of the first, high-frequency market-based
measures of general inflation expectations for the classical gold standard period so that
we can test for the presence of the Fisher effect. Previous studies have used gold bonds
20
and econometric models to examine the relationship between nominal interest rates and
inflation. We believe that our measure, the interest rate differential between gold and
paper bonds, provides a more direct approach for studying the behavior of inflation
expectations during the gold standard period and its relation to actual inflation.
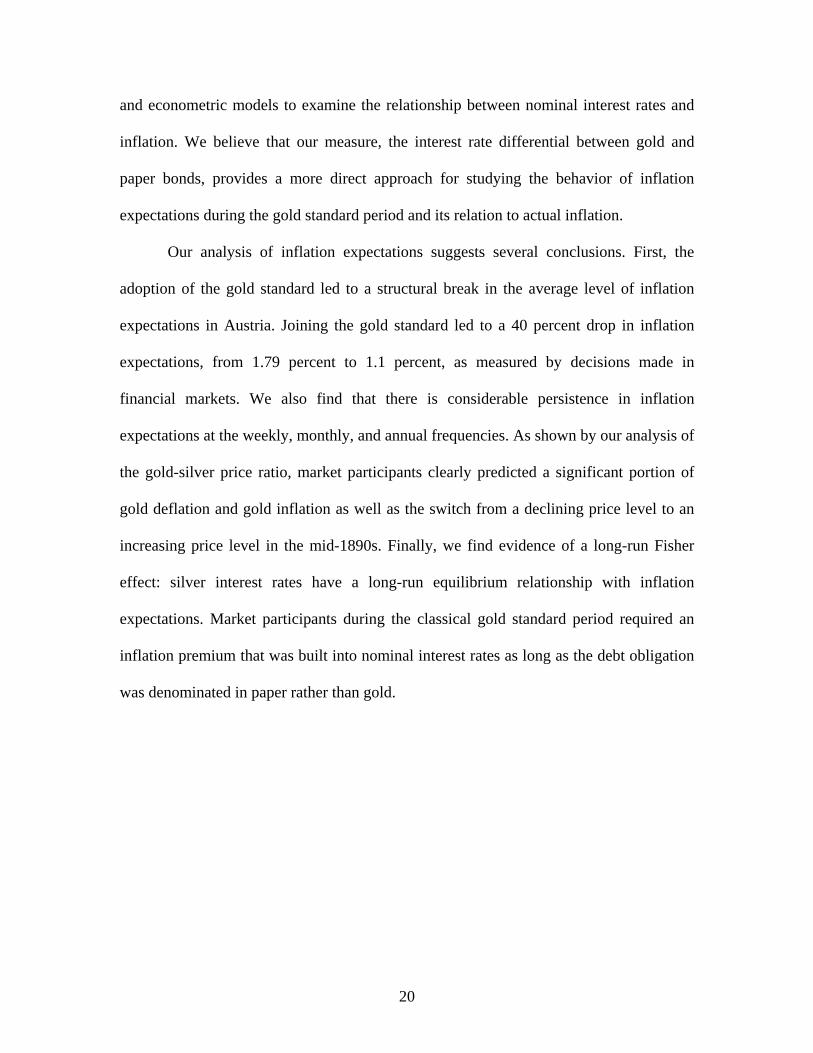
Our analysis of inflation expectations suggests several conclusions. First, the
adoption of the gold standard led to a structural break in the average level of inflation
expectations in Austria. Joining the gold standard led to a 40 percent drop in inflation
expectations, from 1.79 percent to 1.1 percent, as measured by decisions made in
financial markets. We also find that there is considerable persistence in inflation
expectations at the weekly, monthly, and annual frequencies. As shown by our analysis of
the gold-silver price ratio, market participants clearly predicted a significant portion of
gold deflation and gold inflation as well as the switch from a declining price level to an
increasing price level in the mid-1890s. Finally, we find evidence of a long-run Fisher
effect: silver interest rates have a long-run equilibrium relationship with inflation
expectations. Market participants during the classical gold standard period required an
inflation premium that was built into nominal interest rates as long as the debt obligation
was denominated in paper rather than gold.

21
References Barsky, Robert. (1987). “The Fisher Hypothesis and the Forecastibility and Persistence of Inflation.” Journal of Monetary Economics 19, 3-24. Barsky, Robert and J. Bradford Delong. (1991). “Forecasting Pre-World War I Inflation: The Fisher Effect and the Gold Standard.” Quarterly Journal of Economics 106, 815-36. Benjamin, Daniel and Levis Kochin. (1984). “War, Prices, and Interest Rates: A Martial Solution to Gibson’s Paradox.” in, A Restrospective on the Classical Gold Standard, 1821-1931 (Michael Bordo and Anna Schwartz, eds.), 587-604. Bordo, Michael and Finn Kydland. (1995). “The Gold Standard as a Rule: An Essay in Exploration.” Explorations in Economic History 32(4): 423-64. Bordo, Michael, Christopher Meissner, and Angela Redish. (2005). “How ‘Original Sin’ was Overcome: The Evolution of External Debt Denominated in Domestic Currencies in the United States and the British Dominions 1800-2000.” In Other People’s Money: Debt Denomination and Financial Instability in Emerging Market Economies, Barry Eichengreen and Ricardo Hausmann (eds.), Chicago: University of Chicago Press, pp. 122-153. Bordo, Michael and Anna Schwartz. (1981). Money and Prices in the Nineteenth Century: Was Thomas Tooke Right?” Explorations in Economic History 18:97-127. Burdekin, Richard C.K. and Pierre Siklos. (1996). “Exchange Rate Regimes and Shifts in Inflation Persistence: Does Nothing Else Matter?” Journal of Money, Credit, and Banking 31(2): 235-47. Cagan, Philip. (1984). “Mr. Gibson’s Paradox: Was It There?” A Restrospective on the Classical Gold Standard, 1821-1931 (Michael Bordo and Anna Schwartz, eds.), 604-610. Capie, Forrest H., Terrence C. Mills, and Geoffrey E. Wood. (1991). “Money, interest rates, and the Great Depression: Britain from 1870 to 1913,” in New Persepectives on the late Victorian Economy (James Foreman-Peck, ed.), 251-284. Choudry, Tafiq. (1996). “The Fisher Effect and the Gold Standard: Evidence from the USA.” Applied Economic Letters 3, 553-555. Dwyer, Gerald. (1984). “The Gibson Paradox: A Cross Country Analysis.” Economica. 51: 109-27. Economist, various issues. Eichengreen, Barry and Ricardo Hausmann. (1999). “Exchange Rates and Financial Fragility.” NBER Working Paper 7418.

22
Fama, Eugene F. (1975). “Short-term Interest Rates as Predictors of Inflation. “ American Economic Review 65, 269-282. Fisher, Irving (1930). The Theory of Interest. New York, NY:Macmillan. Flandreau, Marc and John Komlos (2001). “Core or Periphery? The Credibility of the Austro-Hungarian Currency.” CEPR Working Paper. Flandreau, Marc and Frederic Zumer (2004). The Making of Global Finance. Paris: OECD. Friedman, Milton and Anna J. Schwartz. (1982). Monetary Trends in the United States and the United Kingdom, Their Relation to Income, Prices, and Interest Rates, 1867-1975. Chicago, IL: University of Chicago Press. Good, David F. (1977). “Financial Integration in Late Nineteenth Century Austria.” Journal of Economic History. 37(4), 890-1910. Hanes, Christopher. (1999). “Degrees of Processing and Changes in the Cyclical Behavior of Prices in the United States.” Journal of Money, Credit, and Banking. 31, 35-53. Harley, C. Knick. (1977). “The Interest Rate and Prices in Britain, 1873-1913: A Study of the Gibson Paradox.” Explorations in Economic History 14: 69-89. McCallum, Bennett (1984). “On Low-Frequency Estimates of Long-Run Relationships in Macroeconomics.” Journal of Monetary Economics 14(1):3-14. Mishkin, Frederic S. (1981). “The Real Interest Rate: An Empirical Investigation.” Carnegie-Rochester Conference Series on Public Policy 15, 151-200. Mishkin, Frederic S. (1992). “Is the Fisher Effect for Real? A Reexamination of the Relationship between Inflation and Interest Rates.” Journal of Monetary Economics 30, 195-215. Mitchener, K. and Marc D. Weidenmier (2008). “Are Hard Pegs Ever Credible in Emerging Markets? Santa Clara University Working Paper. Morys, Matthias. (2008). “The Classical Gold Standard in the European Periphery: A Case Study of Austria-Hungary and Italy, 1870-1913.” Unpublished Doctoral Dissertation, London School of Economics and Political Science. Perez and Siegler. (2003). “Inflationary Expectations and the Fisher Effect prior Pre World War I.” Journal of Money, Credit, and Banking 35(6): 947-65.

23
Shiller, Robert and Jeremy Siegel. (1977). “The Gibson Paradox and Historical Movements in Real Interest Rates.” Journal of Political Economy 85: 891-907. Stock Exchange Official Intelligence, Various Issues. Summers, Lawrence H. (1983). “The Nonadjustment of Nominal Interest Rates.” In Macroeconomics, Prices, and Quantities, edited by James Tobin, pp. 201-241. Washington, DC: Brookings Institute. Tullio, Giusseppe and Jurgen Wolters. (2007). “Monetary Policy in Austria-Hungary, 1876-1913: An Econometric Analysis of the Determinants of the Central Bank’s Discount Rate and the Liquidity Ratio.” Open Economies Review 18:521-37. Zivot, Eric and Donald Andrews. (1992). “Further Evidence on the Great Crash, Oil Price Shock, and the Unit Root Hypothesis.” Journal of Business and Economic Statistics 10: 251-70.

24
Table 1. Mean Austrian Interest Rates, 1880-April 1911 (Basis Points)
Table 2. Zivot-Andrews Structural Break Tests, 1880-April 1911 Break Test Minimum T-Test Break Date
Intercept -4.783 1889/10/5 Trend -3.187 1902/9/19
Intercept and Trend -6.705*** 1888/6/23 Observations 1,635
* significant at 10%; ** significant at 5%; *** significant at 1%
Table 3. ARIMA Models of Inflation Expectations(Weekly Data) Silver Standard Gold Standard
Constant 179.00*** (14.356)
109.584*** (1.900)
AR(1) 0.744*** (0.048)
0.938*** (0.011)
AR(2) 0.121*** (0.059)
AR(3) 0.109** (0.048)
Observations 440 976 * significant at 10%; ** significant at 5%; *** significant at 1%
Whole Period (Std. Deviation)
Gold Standard (Std. Deviation)
Silver Standard (Std. Deviation)
Gold 430.134 (38.572)
405.53 (10.064)
466.767 (36.168)
Silver 555.108 (61.265)
511.581 (13.015)
619.903 (45.470)
Paper 559.887 (63.685)
515.010 (13.224)
626.691 (48.681)

25
Table 4. ARIMA Models of Inflation Expectations
(Monthly Data) Silver Standard Gold Standard
Constant 223.882* (119.510)
109.454*** (2.073)
AR(1) 0.352*** (0.100)
0.789*** (0.04`)
AR(2) 0.380*** (0.100)
AR(3) 0.243*** (0.101)
Observations 100 224 * significant at 10%; ** significant at 5%; *** significant at 1%
Table 5. ARIMA Models of Inflation Expectations (Annual Data)
Gold Standard Constant 105.134***
(7.639) AR(1) 0.758***
(0.162) Observations 18
* significant at 10%; ** significant at 5%; *** significant at 1%
Table 6 Forecasting the Gold-Silver Price Ratio
Granger-Causality Tests (F-tests) Lags Silver Standard Gold Standard
1 1.164 4.809*** 2 0.714 3.235** 3 1.294 2.276* 4 1.002 1.752 5 1.479 1.563 6 1.156 1.244
* significant at 10%; ** significant at 5%; *** significant at 1%

26
Table 7
Short-Term Fisher Effect Granger-Causality Tests (F-tests)
Lags Silver Standard Gold Standard 1 1.737 0.185 2 1.310 2.350* 3 1.427 1.607 4 1.047 1.376 5 0.968 1.367 6 1.461 1.631 *significant at 10%; ** significant at 5%; *** significant at 1%

Figure 1 GDP Per Capita, 1870-1913
0
1,000
2,000
3,000
4,000
5,000
6,000
1870
1872
1874
1876
1878
1880
1882
1884
1886
1888
1890
1892
1894
1896
1898
1900
1902
1904
1906
1908
1910
1912
Yearly Intervals
GD
P Pe
r C
apita Austria
FranceGermany UK
Source: Maddison

Figure 2Franco-Austrian Exchange Rate 1880-1913
1.85
1.90
1.95
2.00
2.05
2.10
2.15
2.20
1880
1881
1882
1883
1884
1885
1886
1887
1888
1889
1890
1891
1892
1893
1894
1895
1896
1897
1898
1899
1900
1901
1902
1903
1904
1905
1906
1907
1908
1909
1910
1911
1912
1913
Annual IntervalsSource: Flandreau and Zumer (2004)

Figure 3 Austrian Gold, Silver, and Paper Bonds, 1880-April 1911
(Basis Points)
0
100
200
300
400
500
600
700
800
3-Ja
n-80
3-Ja
n-81
3-Ja
n-82
3-Ja
n-83
3-Ja
n-84
3-Ja
n-85
3-Ja
n-86
3-Ja
n-87
3-Ja
n-88
3-Ja
n-89
3-Ja
n-90
3-Ja
n-91
3-Ja
n-92
3-Ja
n-93
3-Ja
n-94
3-Ja
n-95
3-Ja
n-96
3-Ja
n-97
3-Ja
n-98
3-Ja
n-99
3-Ja
n-00
3-Ja
n-01
3-Ja
n-02
3-Ja
n-03
3-Ja
n-04
3-Ja
n-05
3-Ja
n-06
3-Ja
n-07
3-Ja
n-08
3-Ja
n-09
3-Ja
n-10
3-Ja
n-11
Weekly Intervals
goldsilverpaper

Figure 4 Austrian Inflation Expectations and Nominal (Paper) Interest Rates, 1880-April 1911
(Basis Points)
0
100
200
300
400
500
600
700
800
3-Ja
n-80
3-Ja
n-82
3-Ja
n-84
3-Ja
n-86
3-Ja
n-88
3-Ja
n-90
3-Ja
n-92
3-Ja
n-94
3-Ja
n-96
3-Ja
n-98
3-Ja
n-00
3-Ja
n-02
3-Ja
n-04
3-Ja
n-06
3-Ja
n-08
3-Ja
n-10
Weekly Intervals
Inflation ExpectationsPaper Interest Rates

Figure 5 Silver Inflation Expectations and Gold-Silver Price Inflation, 1880-April 1903
0
50
100
150
200
250
Jan-
80
Jan-
81
Jan-
82
Jan-
83
Jan-
84
Jan-
85
Jan-
86
Jan-
87
Jan-
88
Jan-
89
Jan-
90
Jan-
91
Jan-
92
Jan-
93
Jan-
94
Jan-
95
Jan-
96
Jan-
97
Jan-
98
Jan-
99
Jan-
00
Jan-
01
Jan-
02
Jan-
03
Weekly Intervals
Infla
tion
Exp
ecta
tions
(Bas
is P
oint
s)
-3
-2
-1
0
1
2
3
4
Infla
tion
(Per
cent
)
Inflation ExpectationsGold-Silver Inflation

Figure 6 Short-Term Interest Rates and Inflation Expectations, 1880-April 1911
(Basis Points)
0
50
100
150
200
250
3-Ja
n-80
3-Ja
n-82
3-Ja
n-84
3-Ja
n-86
3-Ja
n-88
3-Ja
n-90
3-Ja
n-92
3-Ja
n-94
3-Ja
n-96
3-Ja
n-98
3-Ja
n-00
3-Ja
n-02
3-Ja
n-04
3-Ja
n-06
3-Ja
n-08
3-Ja
n-10
Weekly Intervals
Infla
tion
Exp
ecta
tions
0
100
200
300
400
500
600
700
Shor
t-T
erm
Inte
rest
Rat
es
Inflation ExpectationsShort-Term Interest Rate

Figure 7 Inflation Expectations and Silver Interest Rates, 1880-April 1911
(Basis Points)
0
100
200
300
400
500
600
700
800
3-Ja
n-80
3-Ja
n-82
3-Ja
n-84
3-Ja
n-86
3-Ja
n-88
3-Ja
n-90
3-Ja
n-92
3-Ja
n-94
3-Ja
n-96
3-Ja
n-98
3-Ja
n-00
3-Ja
n-02
3-Ja
n-04
3-Ja
n-06
3-Ja
n-08
3-Ja
n-10
Weekly Intervals
Inflation ExpectationsSilver Interest Rates